Haemagglutinin HA Neuraminidase NA Influenza Virus Viral RNA: Redrawn from Collier and Oxford (1993)...
25
Beyond the A ge-Period-CohortM odel: the im pactofinfluenza on Lexism ortality surfaces. Jim O eppen jeo1@ cam.ac.uk Cam bridge G roup forthe H istory ofPopulation M ax Planck Institute forD em ographic Research W orkshop on Lee-CarterM ethods,Edinburgh, Septem ber2004.
-
Upload
justyn-deas -
Category
Documents
-
view
218 -
download
0
Transcript of Haemagglutinin HA Neuraminidase NA Influenza Virus Viral RNA: Redrawn from Collier and Oxford (1993)...

Beyond the Age-Period-Cohort Model: the impact of influenza onLexis mortality surfaces.
Jim Oeppen
Cambridge Group for the History of Population
Max Planck Institute for Demographic Research
Workshop on Lee-Carter Methods, Edinburgh, September 2004.

Haemagglutinin
HA
Neuraminidase
NA
Influenza Virus
Viral RNA:
Redrawn from Collier and Oxford (1993)
N1H1
8 genes
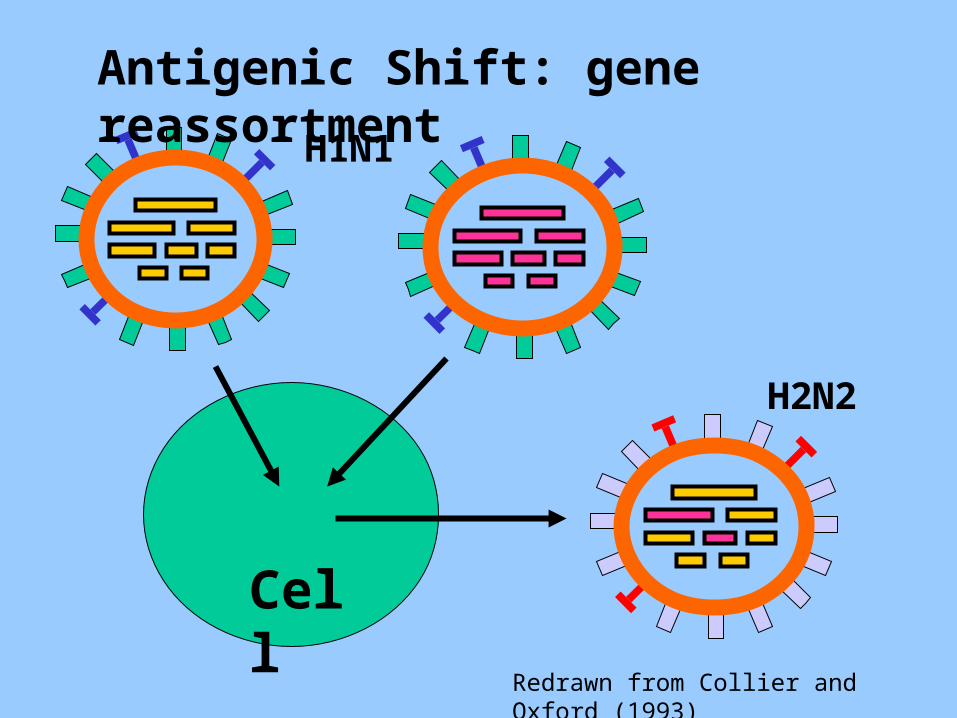
Antigenic Shift: gene reassortment
Cell
Redrawn from Collier and Oxford (1993)
H1N1
H2N2
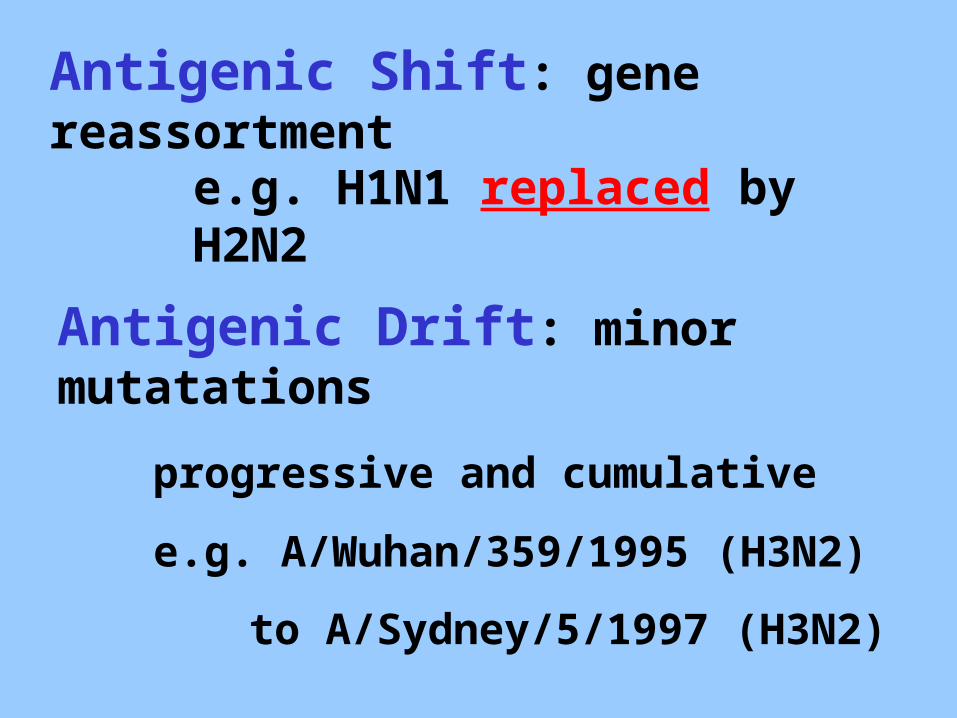
Antigenic Shift: gene reassortment
Antigenic Drift: minor mutatations
progressive and cumulative
e.g. A/Wuhan/359/1995 (H3N2)
to A/Sydney/5/1997 (H3N2)
e.g. H1N1 replaced by H2N2
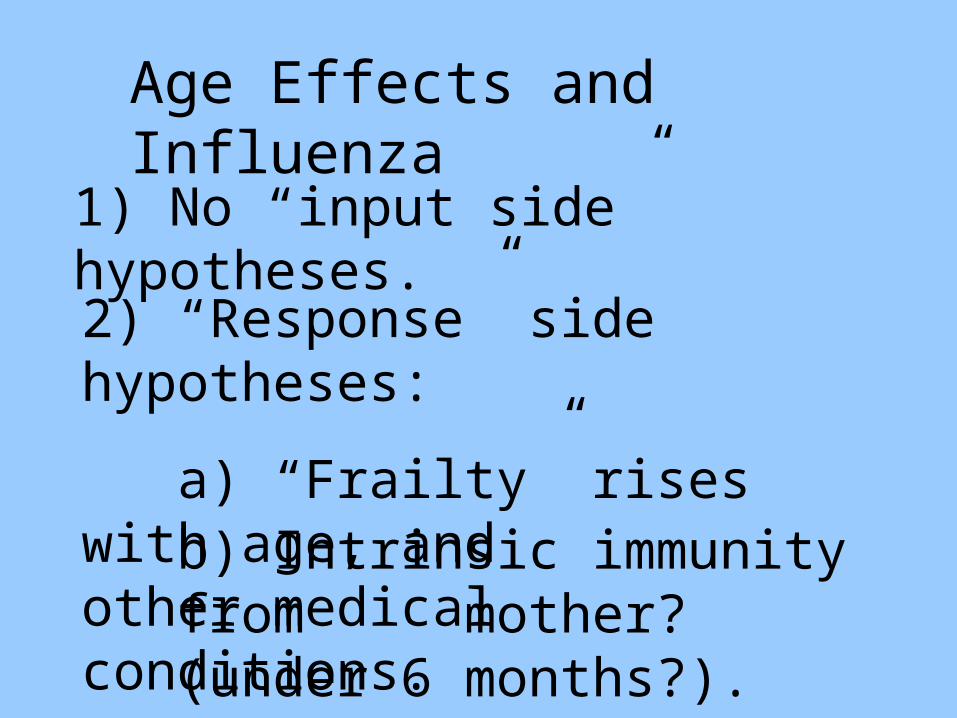
Age Effects and Influenza
2) “Response” side hypotheses:
a) “Frailty” rises with age, and other medical conditions.
b) Intrinsic immunity from mother? (under 6 months?).
1) No “input side” hypotheses.
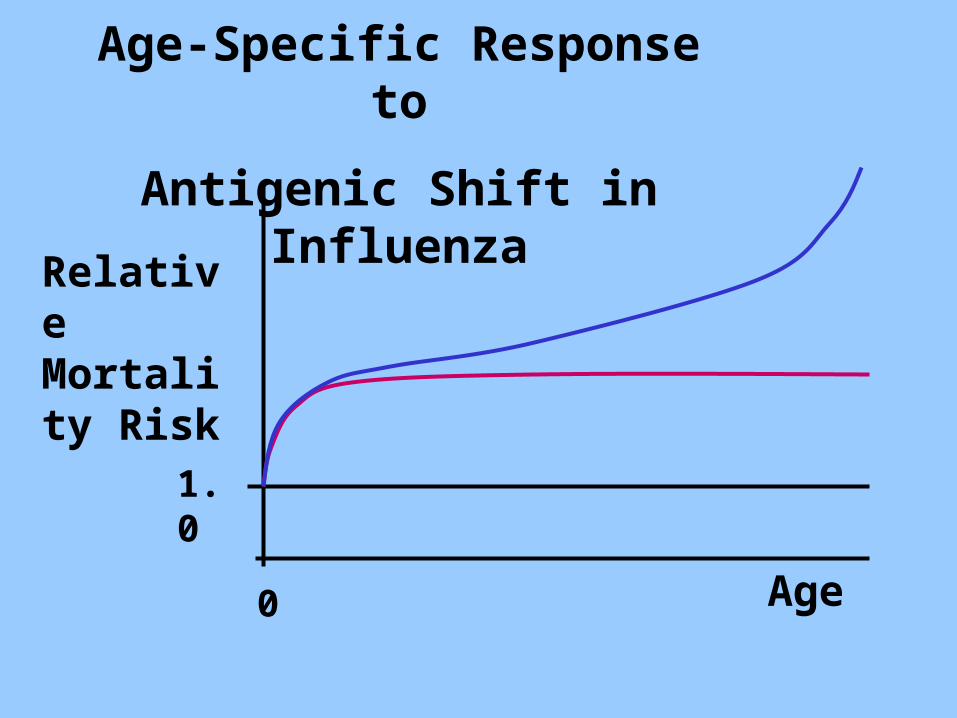
Age
1.0
Relative Mortality Risk
0
Age-Specific Response to
Antigenic Shift in Influenza

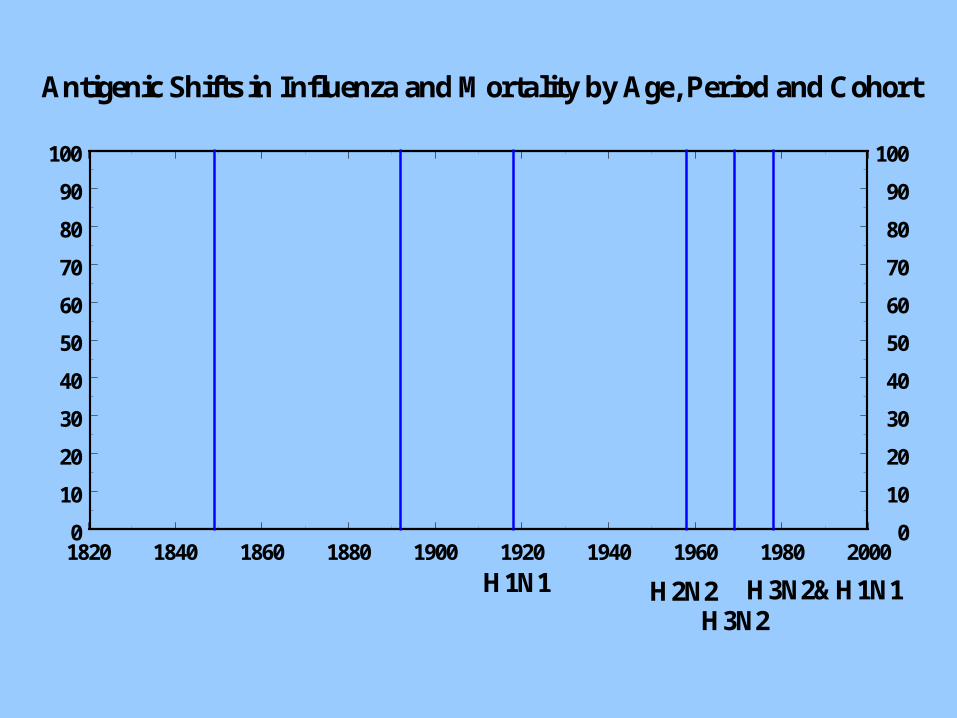
Period Effects and Influenza
4) Immunity is Specific to an Influenza Sub-Type.
3) The new Sub-Type eliminates the old one.
1) Antigenic-Drift produces new variants
2) Antigenic-Shift produces new Sub-Types
5) Virus re-cycling.

Table of shifts.
Identify laboratory versus sero-archaeology
1820 1840 1860 1880 1900 1920 1940 1960 1980 20000
10
20
30
40
50
60
70
80
90
100
0
10
20
30
40
50
60
70
80
90
100
Antigenic Shifts in Influenza and Mortality by Age, Period and Cohort
H1N1 H3N2&H1N1H2N2H3N2
Cohort Effects and Influenza
1) “Original Antigenic Sin”
2) Debility and Selection
Complications: Pregnancy
Cardiovascular
Respiratory
Neurological

1917 1918 1919 1920
Birth Cohort
0
20
40
60
80
100
120
Bir
ths
60
80
100
120
140
160
180
200
220
240
260
280
300
Tot
al D
eath
s (x
1000
)
Northern USASouthern USAInfluenza Deaths
Birth Cohorts of Deaf Children and Influenza Deaths
1820 1840 1860 1880 1900 1920 1940 1960 1980 20000
10
20
30
40
50
60
70
80
90
100
0
10
20
30
40
50
60
70
80
90
100
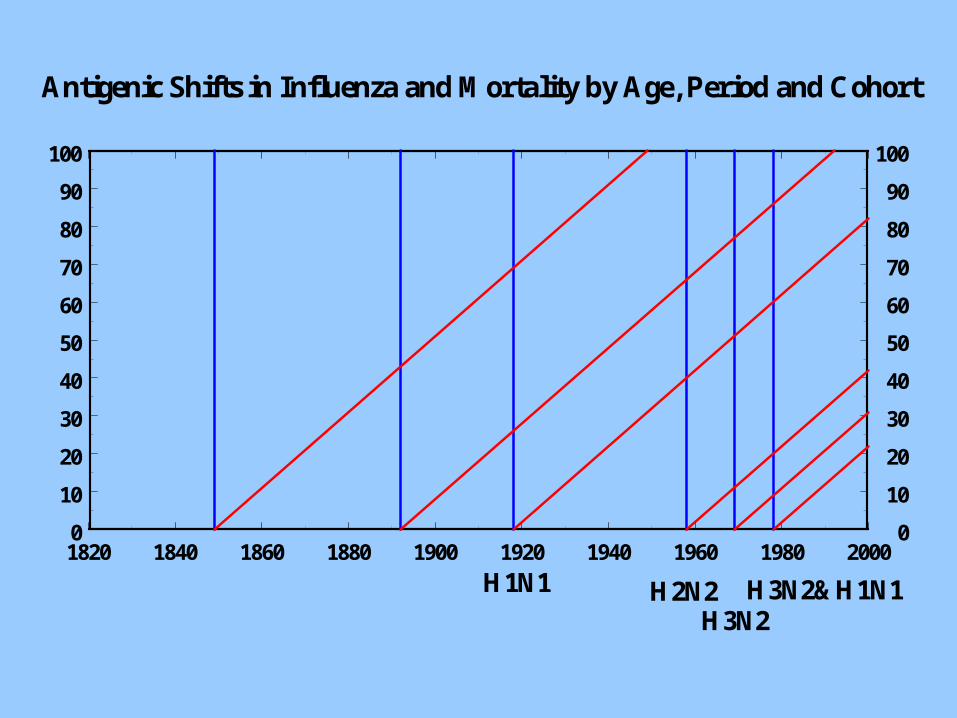
Antigenic Shifts in Influenza and Mortality by Age, Period and Cohort
H1N1 H3N2&H1N1H2N2H3N2
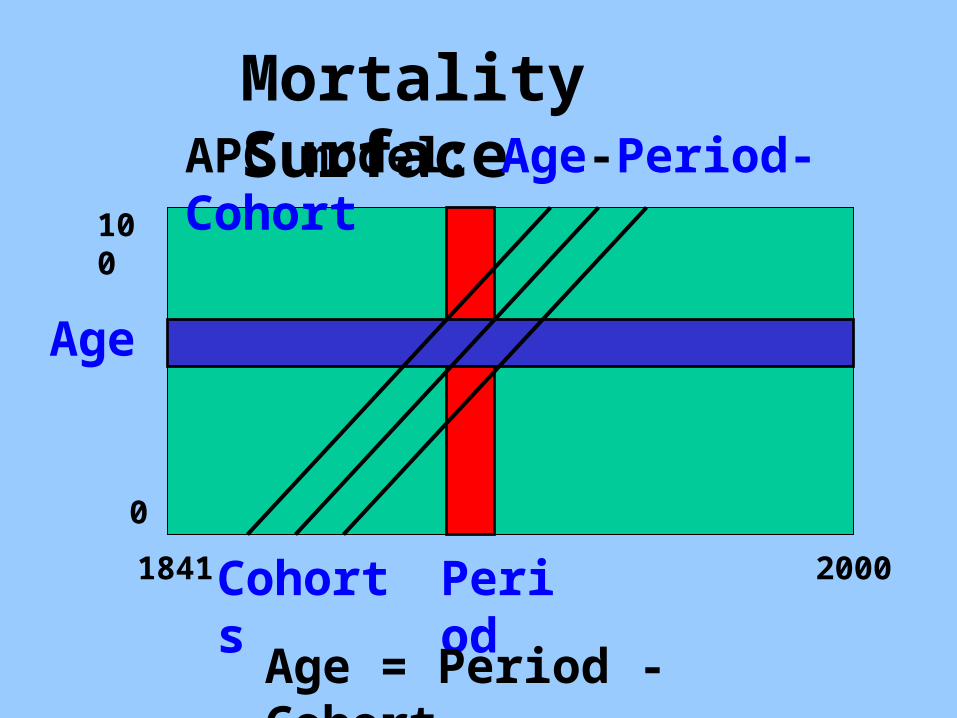
Period
Age
100
1841
0
2000
Mortality SurfaceAPC model: Age-Period-Cohort
Cohorts
Age = Period - Cohort

Epidemic:
Period Effect
“Normal Years”
Age
100
1841
0
2000
2.6
Excess Mortality Ratio
2.6
1880
Birth Cohort
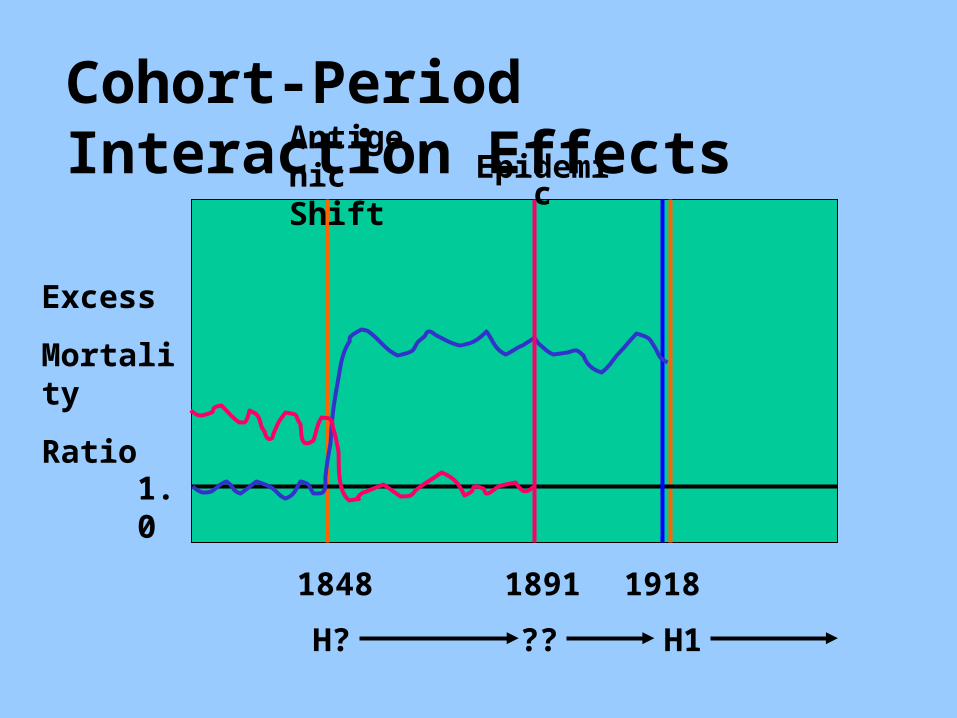
Cohort-Period Interaction Effects
?? H1H?
Excess
Mortality
Ratio
1.0
Antigenic Shift
19181848
Epidemic
1891
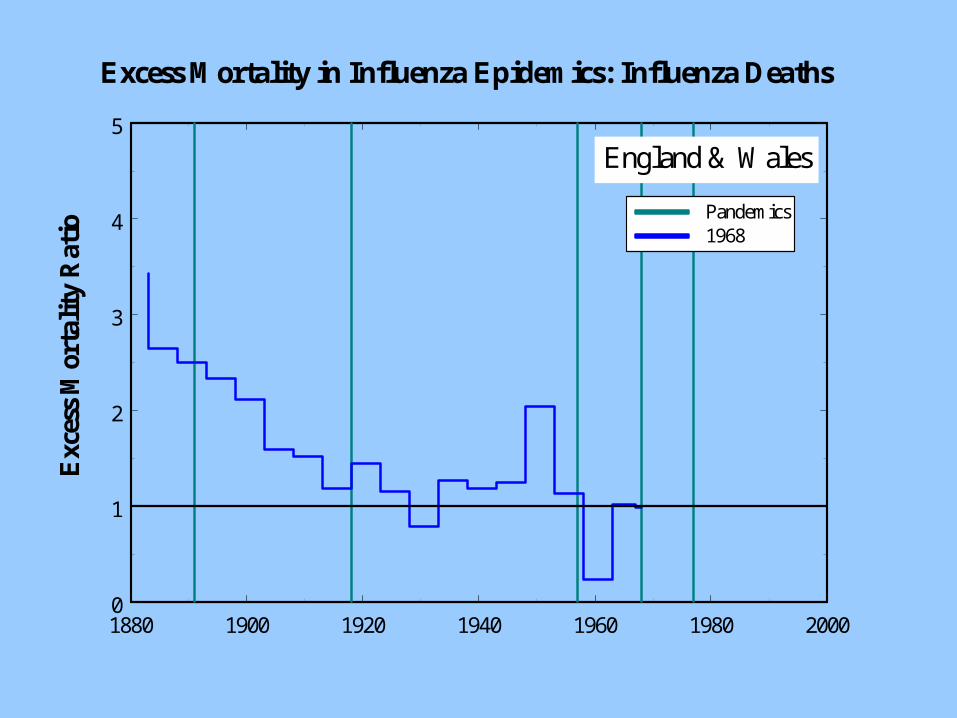
1880 1900 1920 1940 1960 1980 20000
1
2
3
4
5
Exc
ess
Mor
tali
ty R
atio
Excess Mortality in Influenza Epidemics: Influenza Deaths
Pandemics1968
England & Wales
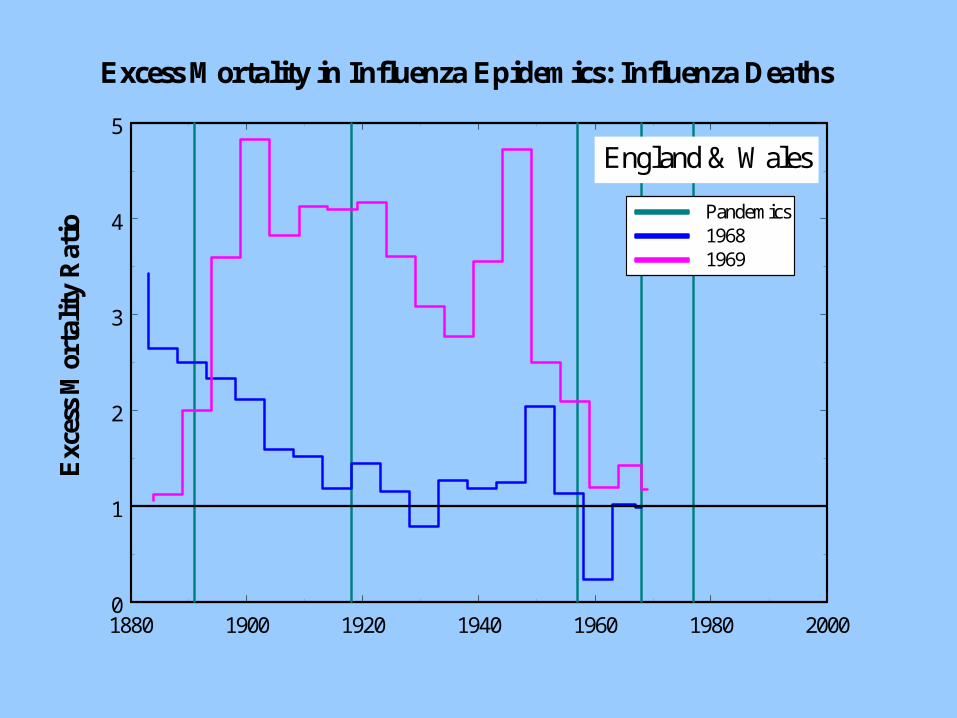
1880 1900 1920 1940 1960 1980 20000
1
2
3
4
5
Exc
ess
Mor
tali
ty R
atio
Excess Mortality in Influenza Epidemics: Influenza Deaths
Pandemics19681969
England & Wales
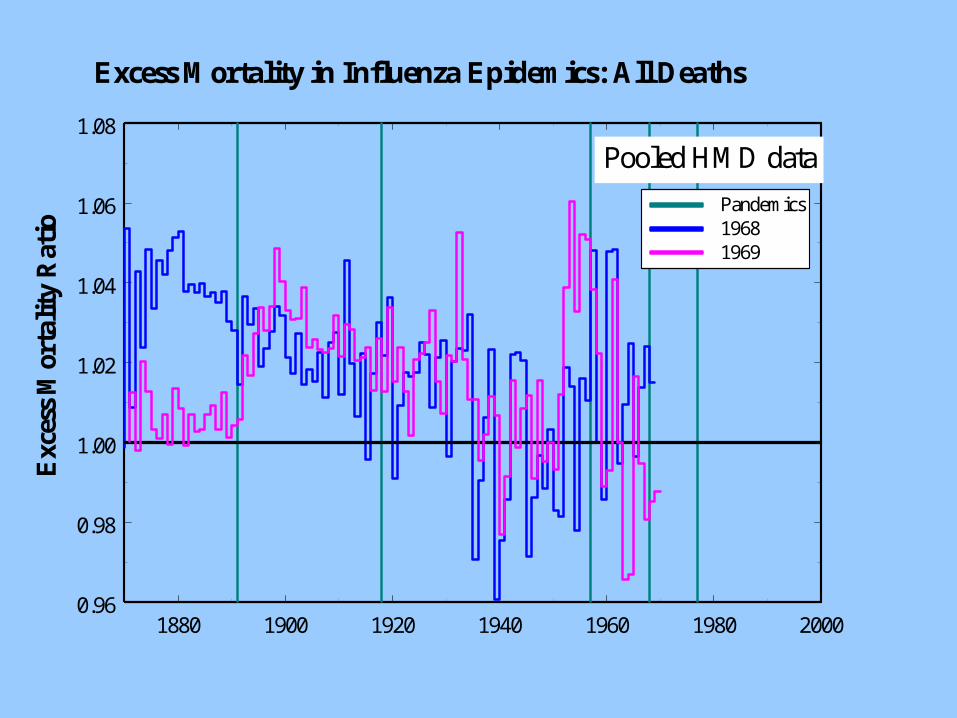
1880 1900 1920 1940 1960 1980 20000.96
0.98
1.00
1.02
1.04
1.06
1.08
Exc
ess
Mor
tali
ty R
atio
Excess Mortality in Influenza Epidemics: All Deaths
Pandemics19681969
Pooled HMD data
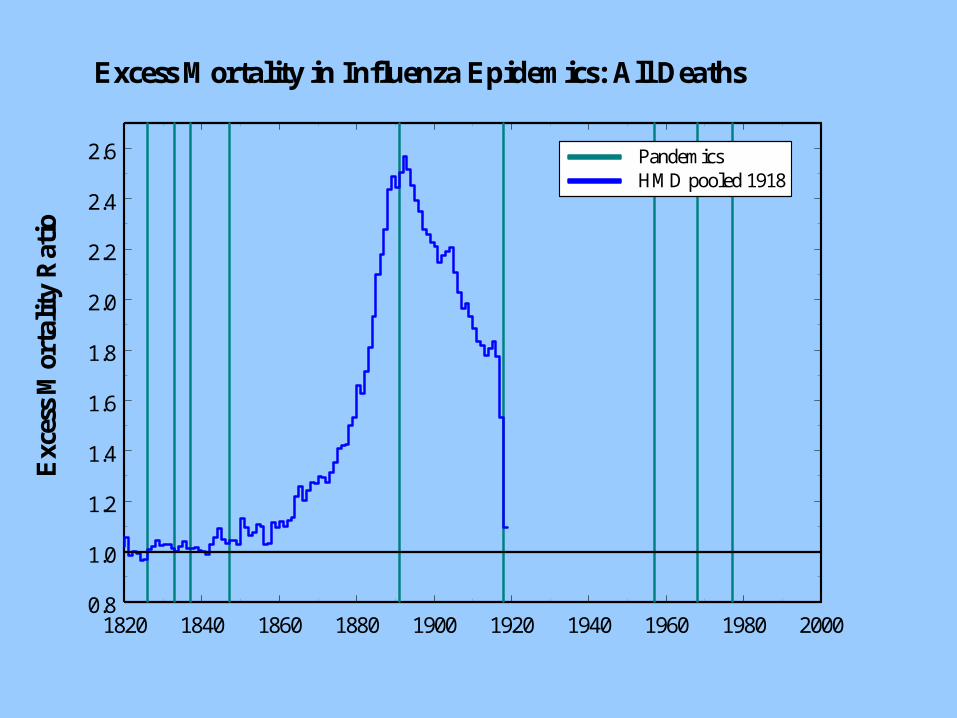
1820 1840 1860 1880 1900 1920 1940 1960 1980 20000.8
1.0
1.2
1.4
1.6
1.8
2.0
2.2
2.4
2.6
Exc
ess
Mor
tali
ty R
atio
Excess Mortality in Influenza Epidemics: All Deaths
PandemicsHMD pooled 1918
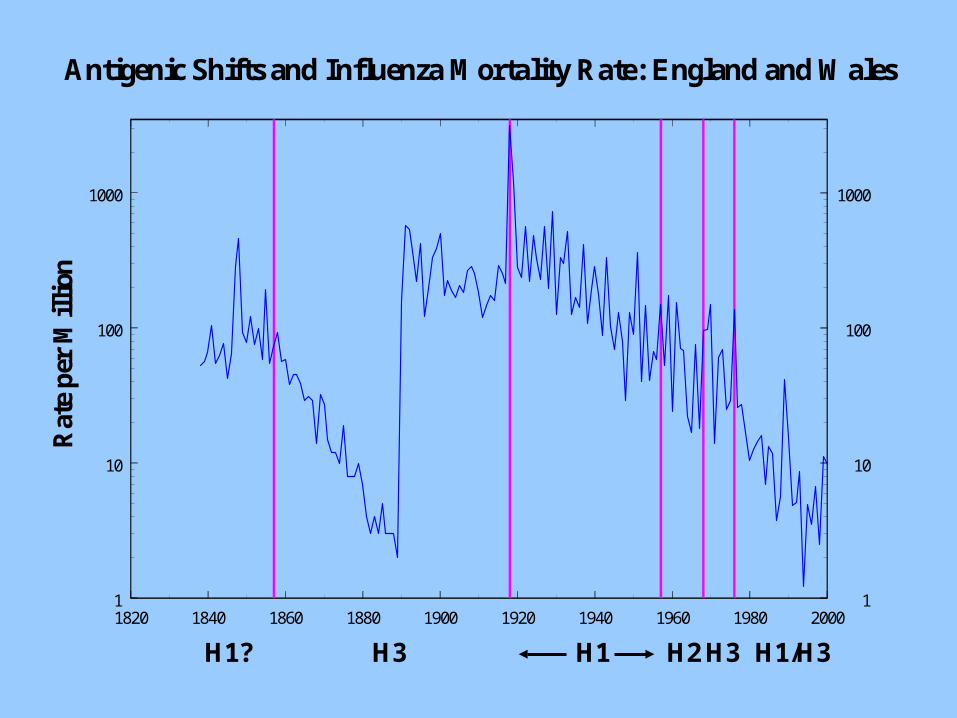
1820 1840 1860 1880 1900 1920 1940 1960 1980 20001
10
100
1000
1
10
100
1000
Rat
e p
er M
illi
onAntigenic Shifts and Influenza Mortality Rate: England and Wales
H3H1? H1 H2H3 H1/H3
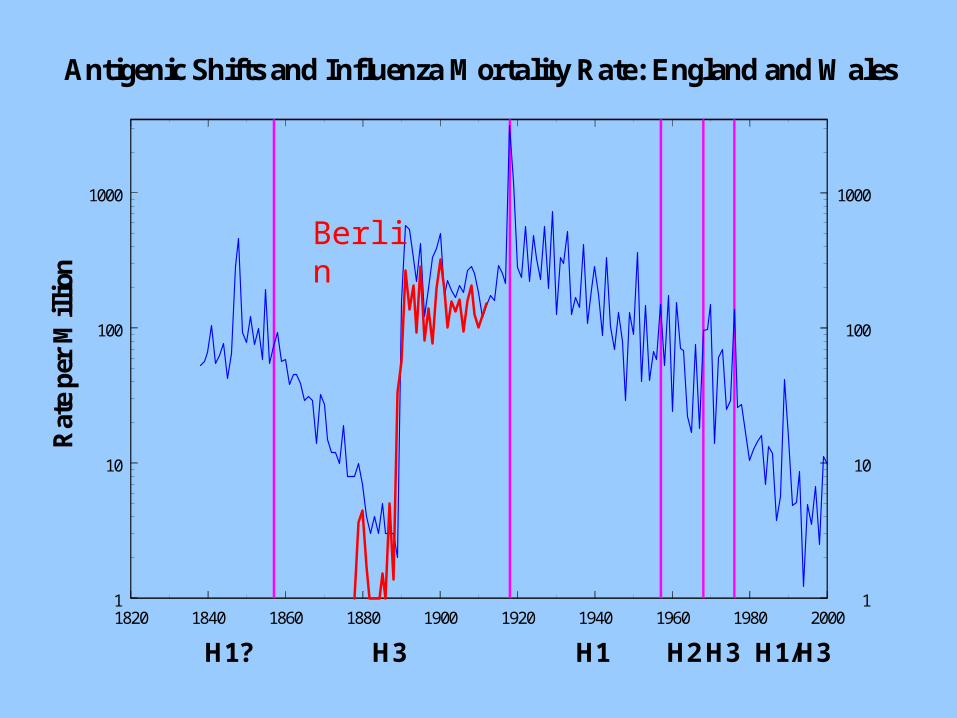
1820 1840 1860 1880 1900 1920 1940 1960 1980 20001
10
100
1000
1
10
100
1000
Rat
e p
er M
illi
onAntigenic Shifts and Influenza Mortality Rate: England and Wales
H3H1? H1 H2H3 H1/H3
Berlin
1840 1850 1860 1870 1880 1890 1900 1910
Birth Cohort
100
101
102
103
2
3
456
8
2
3
4567
2
3
4567
Mor
tali
ty R
ate
0
10
20
30
40
50
60
70
80
90
100
Per
cen
tage
wit
h A
nti
bod
ies
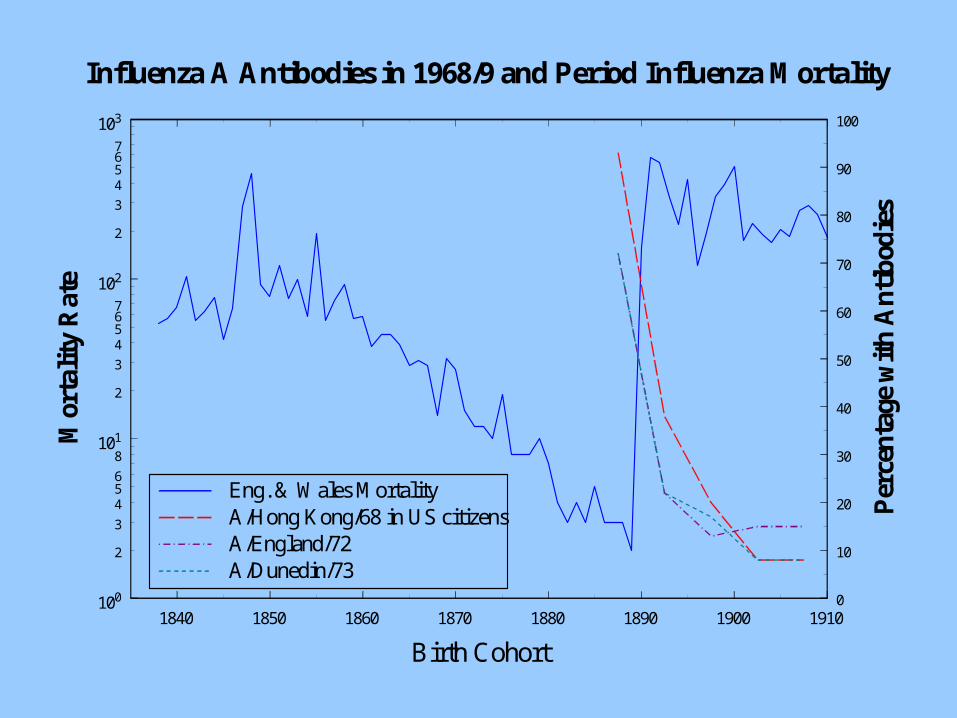
Influenza A Antibodies in 1968/9 and Period Influenza Mortality
Eng. & Wales MortalityA/Hong Kong/68 in US citizensA/England/72A/Dunedin/73
1840 1860 1880 1900 1920 1940 1960 1980 20000
10
20
30
40
50
60
70
80
90
100
0
10
20
30
40
50
60
70
80
90
100
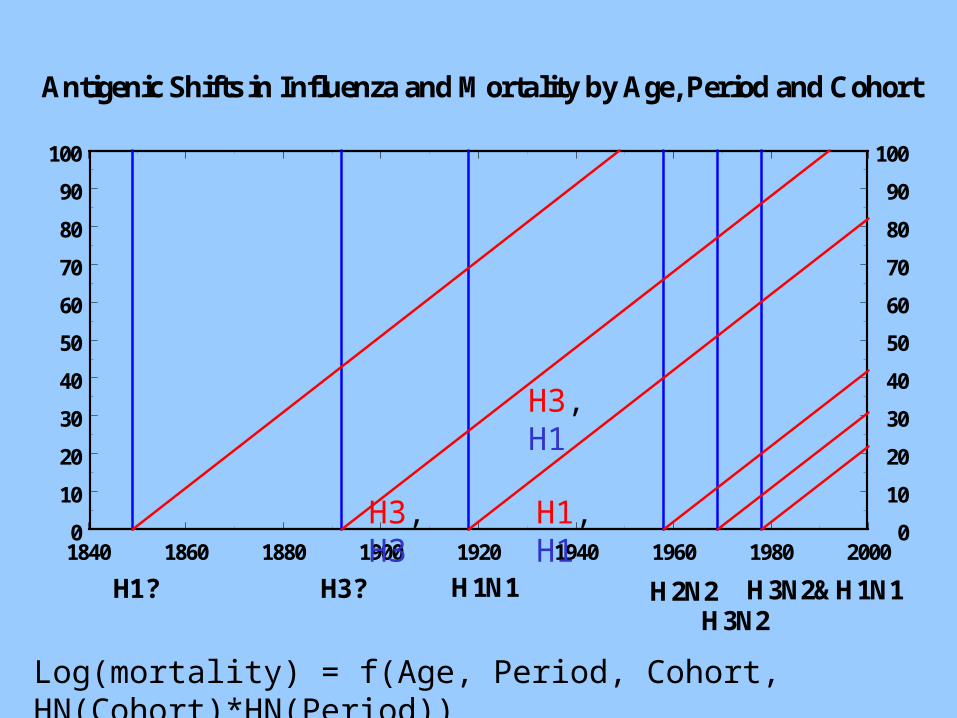
Antigenic Shifts in Influenza and Mortality by Age, Period and Cohort
H1N1 H3N2&H1N1H2N2H3N2
H3, H3
H3, H1
H1, H1
Log(mortality) = f(Age, Period, Cohort, HN(Cohort)*HN(Period))
H3?H1?
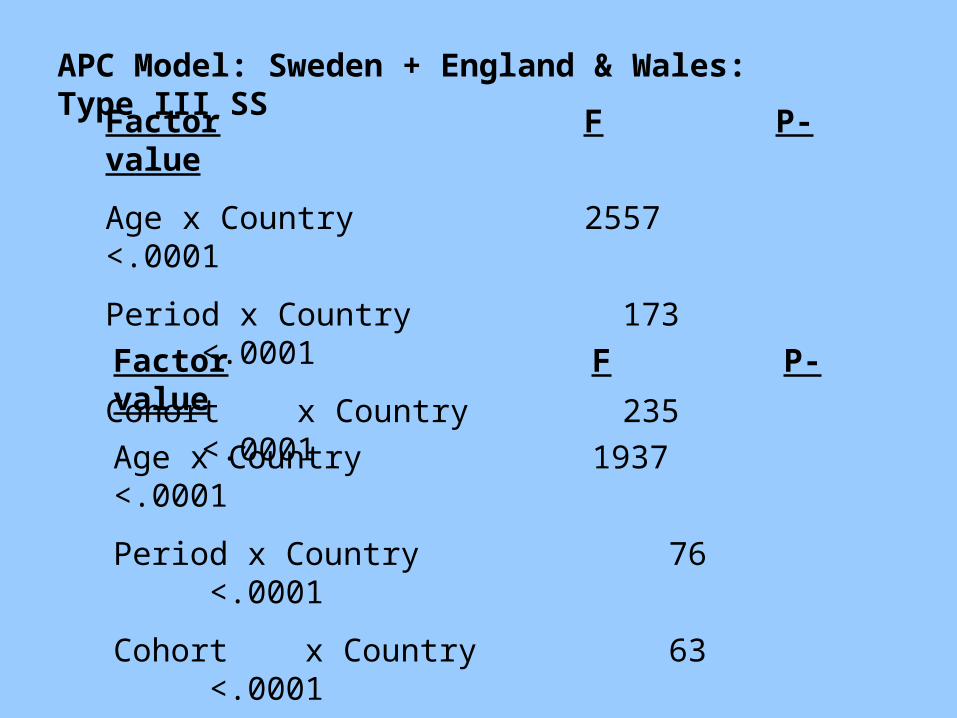
Factor F P-value
Age x Country 2557 <.0001
Period x Country 173 <.0001
Cohort x Country 235 <.0001
APC Model: Sweden + England & Wales: Type III SS
Factor F P-value
Age x Country 1937 <.0001
Period x Country 76 <.0001
Cohort x Country 63 <.0001
HN(cohort) x HN(period) 220 <.0001
1830 1840 1850 1860 1870 1880 1890 1900 1910 1920
Birth Cohort
0
100
200
300
400
500
600
700
800
900
1000
Rat
e pe
r 10
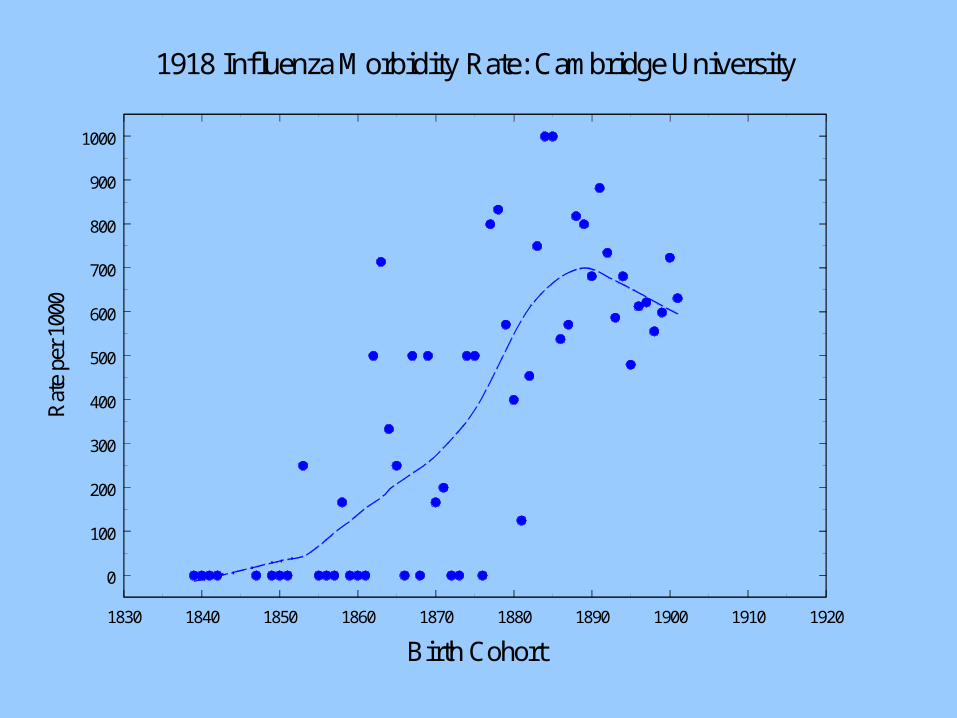
001918 Influenza Morbidity Rate: Cambridge University


![The Pythogorean Proposition Diagrams Redrawn [Clean]](https://static.fdocuments.net/doc/165x107/55cf990f550346d0339b51f6/the-pythogorean-proposition-diagrams-redrawn-clean.jpg)