H1'18 Earnings Presentation · filed with the Spanish Securities Market Commission (the...
26
Spain H1'18 Earnings Presentation 25 July 2018
Transcript of H1'18 Earnings Presentation · filed with the Spanish Securities Market Commission (the...

Spain
H1'18 Earnings Presentation
25 July 2018
2
Banco Santander, S.A. ("Santander") cautions that this presentation contains statements that constitute “forward-looking statements” within the meaning of the U.S. Private Securities Litigation Reform Act of
1995. Forward-looking statements may be identified by words such as “expect”, “project”, “anticipate”, “should”, “intend”, “probability”, “risk”, “VaR”, “RORAC”, “RoRWA”, “TNAV”, “target”, “goal”, “objective”,
“estimate”, “future” and similar expressions. These forward-looking statements are found in various places throughout this presentation and include, without limitation, statements concerning our future business
development and economic performance and our shareholder remuneration policy. While these forward-looking statements represent our judgment and future expectations concerning the development of our
business, a number of risks, uncertainties and other important factors could cause actual developments and results to differ materially from our expectations. These factors include, but are not limited to: (1)
general market, macro-economic, industry, governmental and regulatory trends; (2) movements in local and international securities markets, currency exchange rates and interest rates; (3) competitive
pressures; (4) technological developments; and (5) changes in the financial position or credit worthiness of our customers, obligors and counterparties. Numerous factors, including those reflected in the Annual
Report on Form 20-F filed with the Securities and Exchange Commission of the United States of America (the “SEC”) –under “Key Information-Risk Factors”- and in the Documento de Registro de Acciones
filed with the Spanish Securities Market Commission (the “CNMV”) –under “Factores de Riesgo”- could affect the future results of Santander and could result in other results deviating materially from those
anticipated in the forward-looking statements. Other unknown or unpredictable factors could cause actual results to differ materially from those in the forward-looking statements.
Forward-looking statements speak only as of the date of this presentation and are based on the knowledge, information available and views taken on such date; such knowledge, information and views may
change at any time. Santander does not undertake any obligation to update or revise any forward-looking statement, whether as a result of new information, future events or otherwise.
The information contained in this presentation is subject to, and must be read in conjunction with, all other publicly available information, including, where relevant any fuller disclosure document published by
Santander. Any person at any time acquiring securities must do so only on the basis of such person's own judgment as to the merits or the suitability of the securities for its purpose and only on such information
as is contained in such public information having taken all such professional or other advice as it considers necessary or appropriate in the circumstances and not in reliance on the information contained in the
presentation. No investment activity should be undertaken on the basis of the information contained in this presentation. In making this presentation available, Santander gives no advice and makes no
recommendation to buy, sell or otherwise deal in shares in Santander or in any other securities or investments whatsoever.
Neither this presentation nor any of the information contained therein constitutes an offer to sell or the solicitation of an offer to buy any securities. No offering of securities shall be made in the United States
except pursuant to registration under the U.S. Securities Act of 1933, as amended, or an exemption therefrom. Nothing contained in this presentation is intended to constitute an invitation or inducement to
engage in investment activity for the purposes of the prohibition on financial promotion in the U.K. Financial Services and Markets Act 2000.
Note: Statements as to historical performance or financial accretion are not intended to mean that future performance, share price or future earnings (including earnings per share) for any period will necessarily
match or exceed those of any prior year. Nothing in this presentation should be construed as a profit forecast.
The businesses included in each of our geographic segments and the accounting principles under which their results are presented here may differ from the included businesses and local applicable accounting
principles of our public subsidiaries in such geographies. Accordingly, the results of operations and trends shown for our geographic segments may differ materially from those of such subsidiaries.
In addition to the financial information prepared under International Financial Reporting Standards (“IFRS”), this presentation includes certain alternative performance measures as defined in the Guidelines on
Alternative Performance Measures issued by the European Securities and Markets Authority on 5 October 2015 (ESMA/2015/1415es) as well as Non-IFRS measures. The APMs and Non-IFRS Measures are
performance measures that have been calculated using the financial information from the Santander Group but that are not defined or detailed in the applicable financial information framework and therefore
have neither been audited nor are capable of being completely audited. These APMs and Non-IFRS Measures are been used to allow for a better understanding of the financial performance of the Santander
Group but should be considered only as additional information and in no case as a replacement of the financial information prepared under IFRS. Moreover, the way the Santander Group defines and calculates
these APMs and Non-IFRS Measures may differ to the way these are calculated by other companies that use similar measures, and therefore they may not be comparable. Please refer to the quarterly financial
Report for further details of the APMs and Non-IFRS Measures used, including its definition or a reconciliation between any applicable management indicators and the financial data presented in the
consolidated financial statements prepared under IFR, see Section 26 of the Documento de Registro de Acciones for Banco Santander filed with the CNMV on July 4, 2017 (available on the Web page of the
CNMV -www.cnmv.es- and at Banco Santander -www.santander.com) and Item 3A of the Annual Report on Form 20-F for the year ended December 31, 2016, filed with the U.S. Securities and Exchange
Commission on March 31, 2017 (the “Form 20-F”). For a discussion of the accounting principles used in translation of foreign currency-denominated assets and liabilities to euros, see note 2(a) to our
consolidated financial statements on Form 20-F and to our consolidated financial statements available on the CNMV’s website (www.cnmv.es) and on Banco Santander’s website (www.santander.com).
Disclaimer

3
1. Macroeconomic environment and financial system
2. Strategy and business
3. Results
4. Appendix
Index
Macroeconomic environment
and financial system
01
5
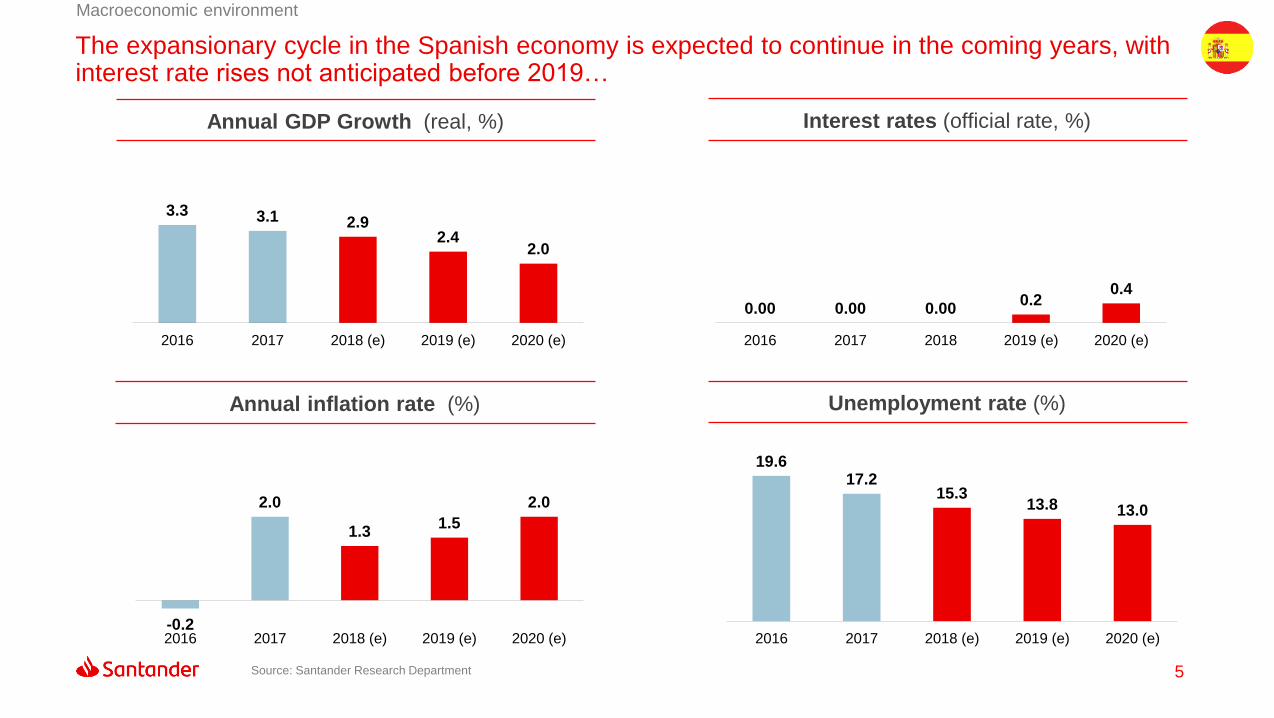
The expansionary cycle in the Spanish economy is expected to continue in the coming years, with interest rate rises not anticipated before 2019…
Source: Santander Research Department
Macroeconomic environment
3.3 3.1 2.92.4
2.0
2016 2017 2018 (e) 2019 (e) 2020 (e)
0.00 0.00 0.000.2
0.4
2016 2017 2018 2019 (e) 2020 (e)
19.617.2
15.313.8 13.0
2016 2017 2018 (e) 2019 (e) 2020 (e)-0.2
2.0
1.31.5
2.0
2016 2017 2018 (e) 2019 (e) 2020 (e)
Annual GDP Growth (real, %) Interest rates (official rate, %)
Annual inflation rate (%) Unemployment rate (%)
6
30
40
50
60
70
80
90
100
250
300
350
400
450
500
550
2010 2011 2012 2013 2014 2015 2016 2017
New building permits
Sales
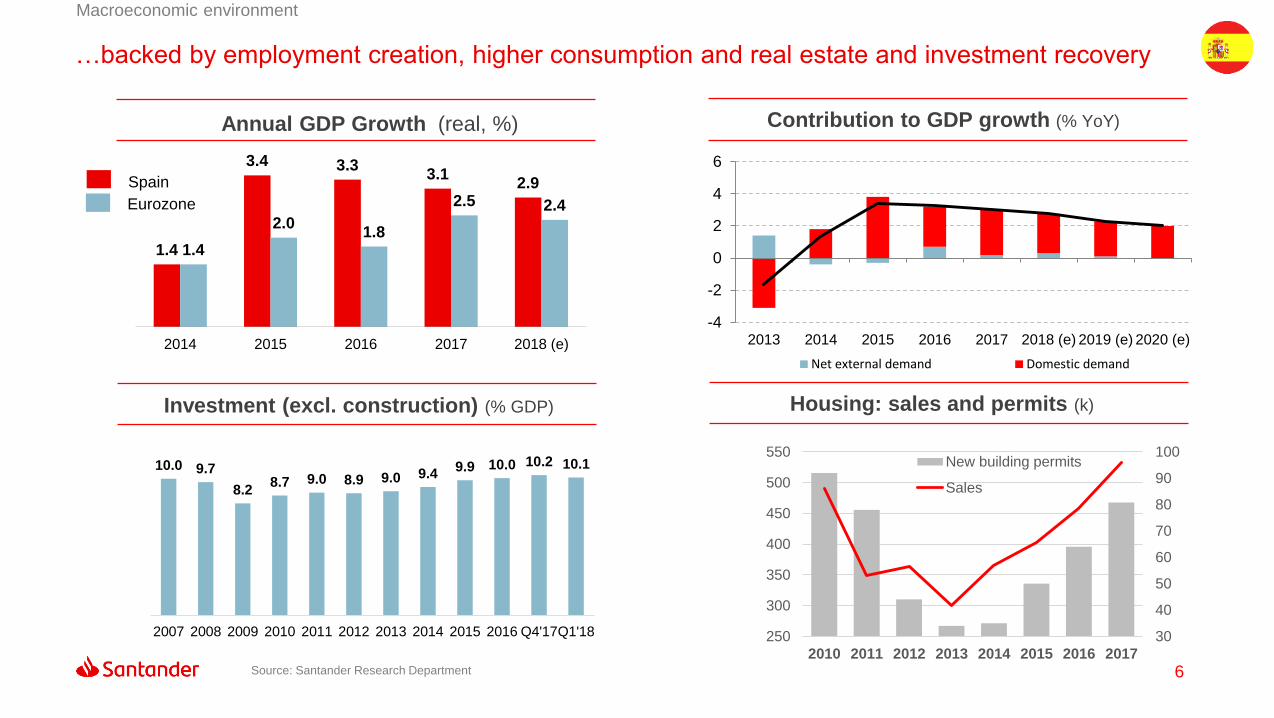
…backed by employment creation, higher consumption and real estate and investment recovery
Macroeconomic environment
Contribution to GDP growth (% YoY)
Investment (excl. construction) (% GDP) Housing: sales and permits (k)
Annual GDP Growth (real, %)
1.4
3.4 3.33.1
2.9
1.4
2.01.8
2.5 2.4
2014 2015 2016 2017 2018 (e)
Spain
Eurozone
-4
-2
0
2
4
6
2013 2014 2015 2016 2017 2018 (e) 2019 (e) 2020 (e)
Net external demand Domestic demand
10.0 9.7
8.28.7 9.0 8.9 9.0 9.4
9.9 10.0 10.2 10.1
2007 2008 2009 2010 2011 2012 2013 2014 2015 2016 Q4'17Q1'18
Source: Santander Research Department
7
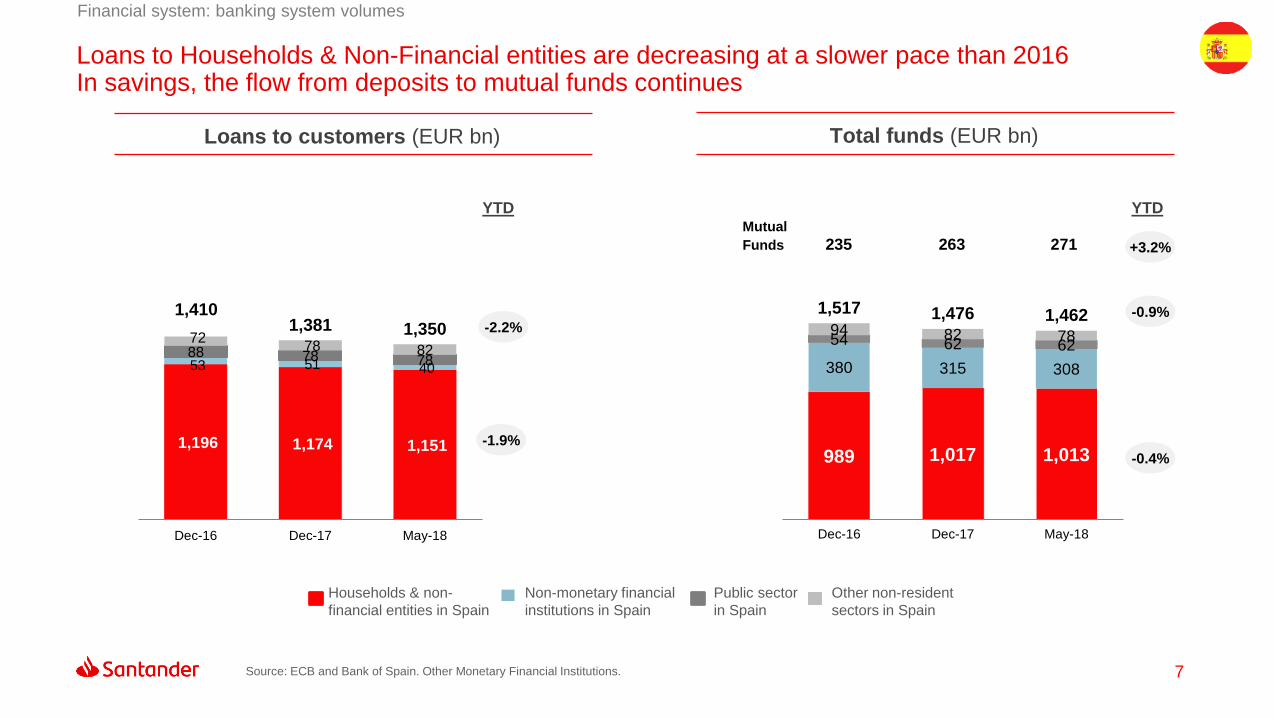
Loans to Households & Non-Financial entities are decreasing at a slower pace than 2016 In savings, the flow from deposits to mutual funds continues
Financial system: banking system volumes
989 1,017 1,013
380 315 308
54 62 6294 82 78
1,517 1,476 1,462
Dec-16 Dec-17 May-18
Mutual
Funds 235 263 271
Public sector
in Spain
Non-monetary financial
institutions in Spain
Other non-resident
sectors in Spain
Households & non-
financial entities in Spain
YTD
-2.2%
-1.9%
YTD
+3.2%
-0.9%
-0.4%1,196 1,174 1,151
53 51 40 88 78 78
72 78 82
1,4101,381 1,350
Dec-16 Dec-17 May-18
Source: ECB and Bank of Spain. Other Monetary Financial Institutions.
Loans to customers (EUR bn) Total funds (EUR bn)

Strategy and
business
02
9
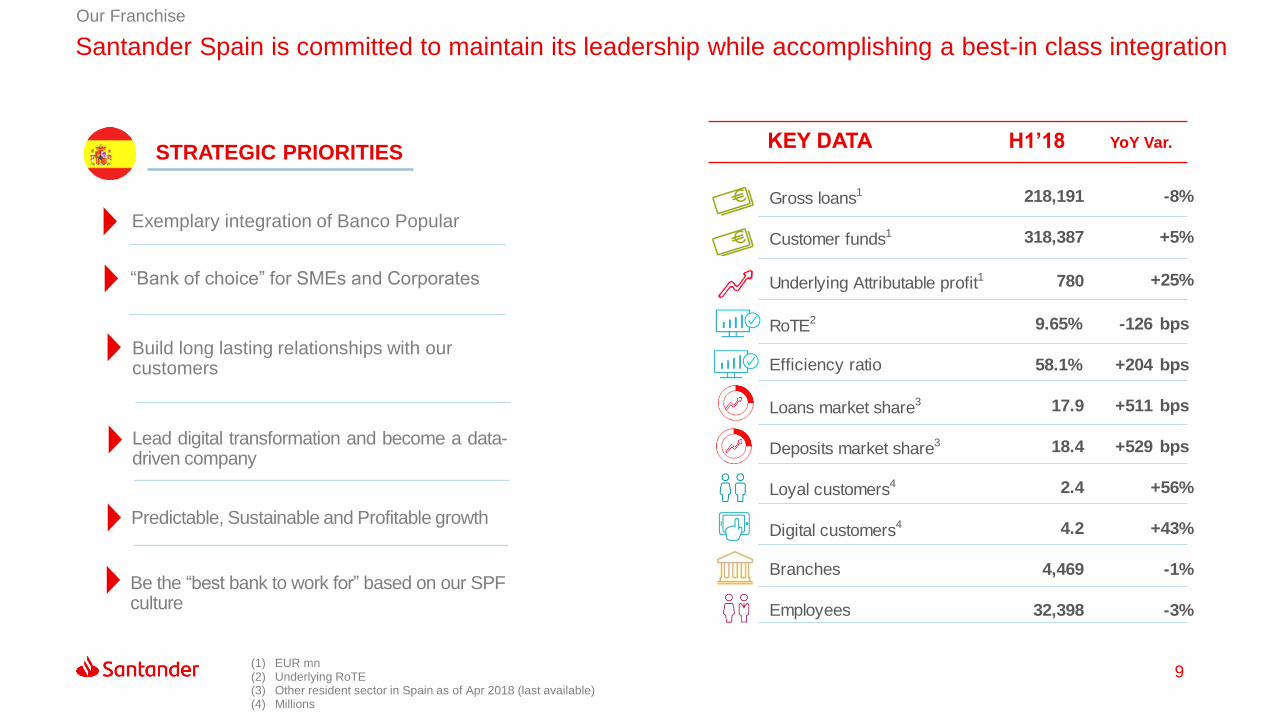
Santander Spain is committed to maintain its leadership while accomplishing a best-in class integration
Our Franchise
(1) EUR mn(2) Underlying RoTE(3) Other resident sector in Spain as of Apr 2018 (last available)(4) Millions
STRATEGIC PRIORITIES
Exemplary integration of Banco Popular
KEY DATA H1’18 YoY Var.
“Bank of choice” for SMEs and Corporates
Build long lasting relationships with our customers
Lead digital transformation and become a data-driven company
Gross loans1 218,191
Customer funds1 318,387
Underlying Attributable profit1 780
RoTE2 9.65% -126 bps
Efficiency ratio 58.1% +204 bps
Loans market share3 17.9 +511 bps
Deposits market share3 18.4 +529 bps
Loyal customers4 2.4
Digital customers4 4.2
Branches 4,469
Employees 32,398
+56%
+43%
-1%
-3%
-8%
+5%
+25%
Predictable, Sustainable and Profitable growth
Be the “best bank to work for” based on our SPFculture
10
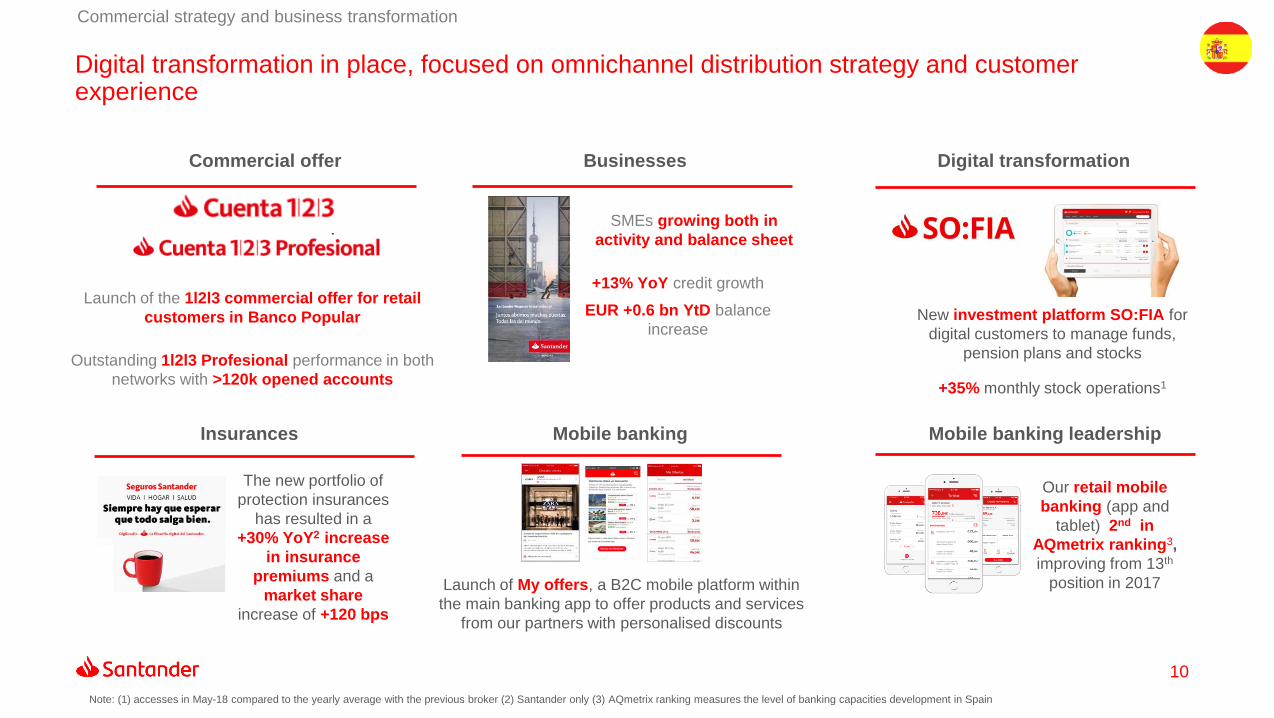
Digital transformation in place, focused on omnichannel distribution strategy and customer experience
Commercial strategy and business transformation
Mobile banking leadershipInsurances
Commercial offer Businesses
Mobile banking
Digital transformation
Launch of the 1l2l3 commercial offer for retail
customers in Banco Popular
Outstanding 1l2l3 Profesional performance in both
networks with >120k opened accounts
New investment platform SO:FIA for
digital customers to manage funds,
pension plans and stocks
+35% monthly stock operations1
Launch of My offers, a B2C mobile platform within
the main banking app to offer products and services
from our partners with personalised discounts
The new portfolio of
protection insurances
has resulted in a
+30% YoY2 increase
in insurance
premiums and a
market share
increase of +120 bps
Note: (1) accesses in May-18 compared to the yearly average with the previous broker (2) Santander only (3) AQmetrix ranking measures the level of banking capacities development in Spain
+13% YoY credit growth
EUR +0.6 bn YtD balance
increase
SMEs growing both in
activity and balance sheet
Our retail mobile
banking (app and
tablet) 2nd in
AQmetrix ranking3,
improving from 13th
position in 2017
11
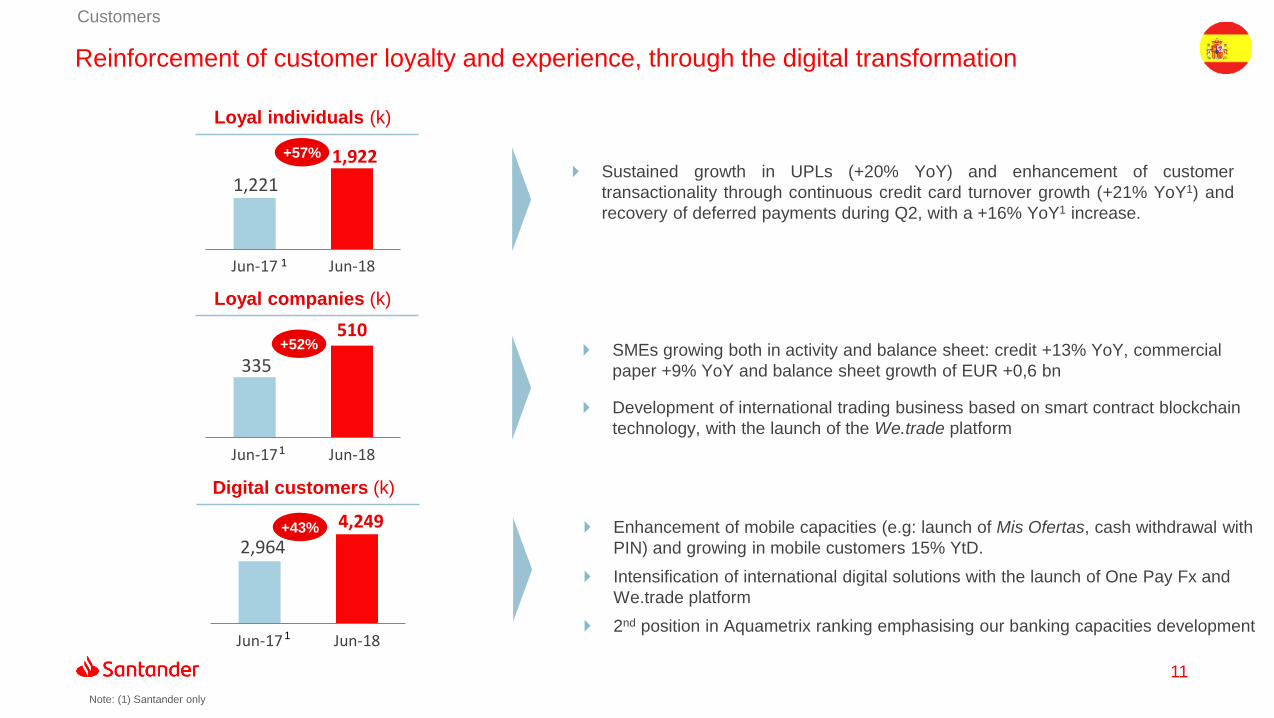
Customers
Reinforcement of customer loyalty and experience, through the digital transformation
Sustained growth in UPLs (+20% YoY) and enhancement of customer
transactionality through continuous credit card turnover growth (+21% YoY1) and
recovery of deferred payments during Q2, with a +16% YoY1 increase.
1,221
1,922
Jun-17 Jun-18
+57%
Loyal individuals (k)
SMEs growing both in activity and balance sheet: credit +13% YoY, commercial
paper +9% YoY and balance sheet growth of EUR +0,6 bn
Development of international trading business based on smart contract blockchain
technology, with the launch of the We.trade platform
335
510
Jun-17 Jun-18
+52%
Loyal companies (k)
Enhancement of mobile capacities (e.g: launch of Mis Ofertas, cash withdrawal with
PIN) and growing in mobile customers 15% YtD.
Intensification of international digital solutions with the launch of One Pay Fx and
We.trade platform
2nd position in Aquametrix ranking emphasising our banking capacities development
2,964
4,249
Jun-17 Jun-18
+43%
Digital customers (k)
Note: (1) Santander only
1
1
1
12
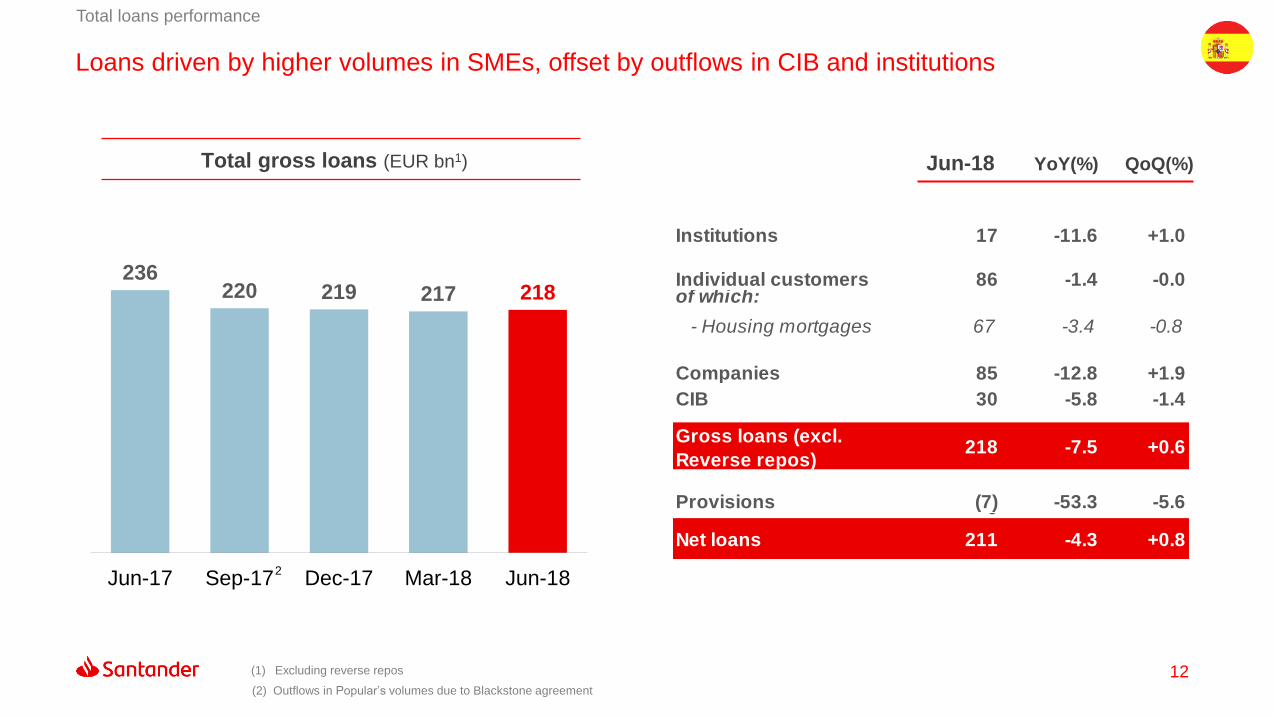
Loans driven by higher volumes in SMEs, offset by outflows in CIB and institutions
Total loans performance
236220 219 217 218
Jun-17 Sep-17 Dec-17 Mar-18 Jun-18
Total gross loans (EUR bn1) Jun-18 YoY(%) QoQ(%)
(1) Excluding reverse repos
Institutions 17 -11.6 +1.0
Individual customers 86 -1.4 -0.0of which:
- Housing mortgages 67 -3.4 -0.8
Companies 85 -12.8 +1.9
CIB 30 -5.8 -1.4
Gross loans (excl.
Reverse repos)218 -7.5 +0.6
0
Provisions (7) -53.3 -5.60
Net loans 211 -4.3 +0.8
(2) Outflows in Popular’s volumes due to Blackstone agreement
2
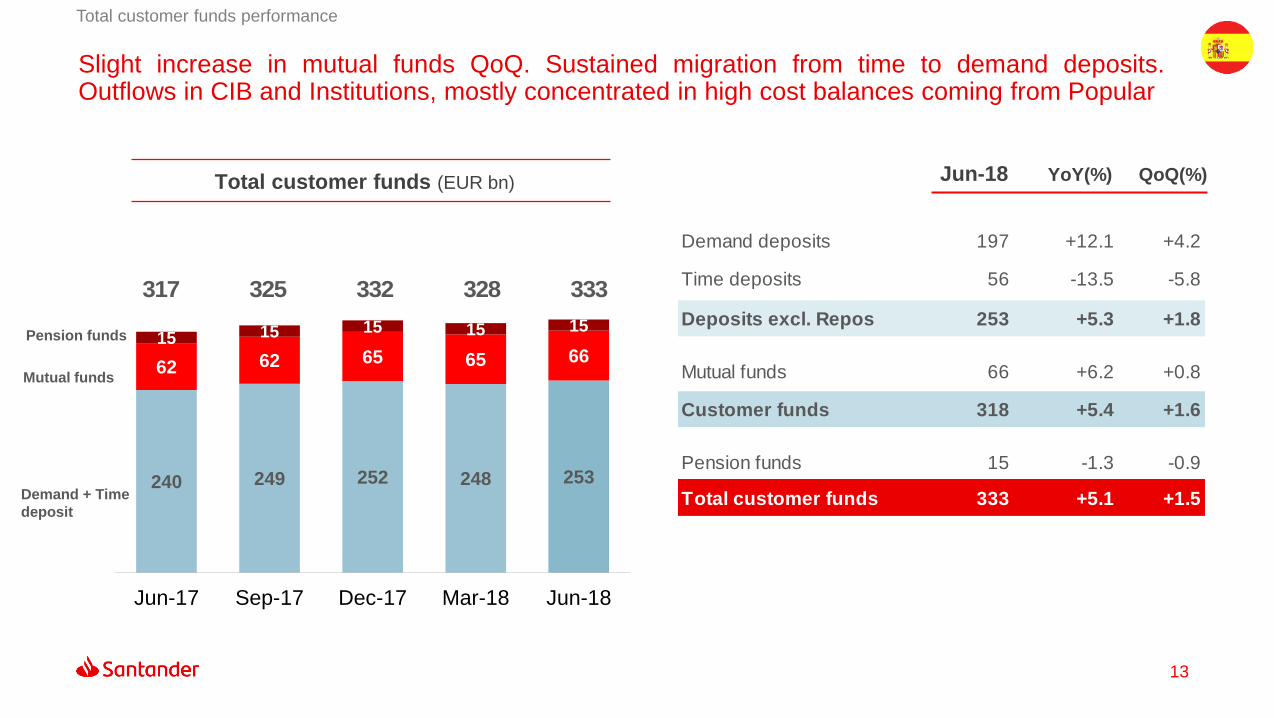
13
Demand deposits 197 +12.1 +4.2
Time deposits 56 -13.5 -5.8
Deposits excl. Repos 253 +5.3 +1.8
Mutual funds 66 +6.2 +0.8
Customer funds 318 +5.4 +1.6
Pension funds 15 -1.3 -0.9
Total customer funds 333 +5.1 +1.5
Slight increase in mutual funds QoQ. Sustained migration from time to demand deposits.Outflows in CIB and Institutions, mostly concentrated in high cost balances coming from Popular
Total customer funds performance
240 249 252 248 253
62 62 65 65 6615 15 15 15 15
Jun-17 Sep-17 Dec-17 Mar-18 Jun-18
Total customer funds (EUR bn) Jun-18 YoY(%) QoQ(%)
Pension funds
Mutual funds
Demand + Time
deposit
317 325 332 328 333
Results
03
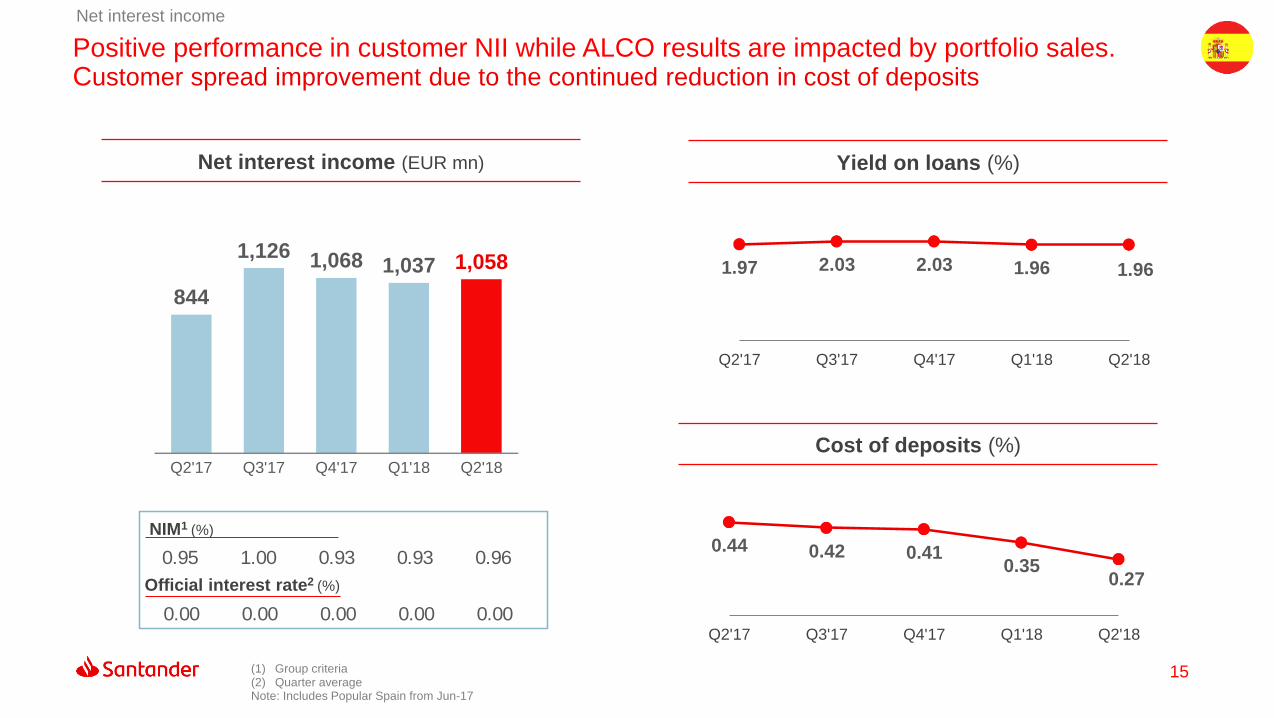
15
Positive performance in customer NII while ALCO results are impacted by portfolio sales. Customer spread improvement due to the continued reduction in cost of deposits
Net interest income
(1) Group criteria(2) Quarter averageNote: Includes Popular Spain from Jun-17
NIM1 (%)
Official interest rate2 (%)
Q2'17 Q3'17 Q4'17 Q1'18 Q2'18
844
1,126 1,068 1,037 1,058 1.97 2.03 2.03 1.96 1.96
Q2'17 Q3'17 Q4'17 Q1'18 Q2'18
Net interest income (EUR mn) Yield on loans (%)
0.44 0.42 0.410.35
0.27
Q2'17 Q3'17 Q4'17 Q1'18 Q2'18
Cost of deposits (%)
0.95 1.00 0.93 0.93 0.96
0.00 0.00 0.00 0.00 0.00
16
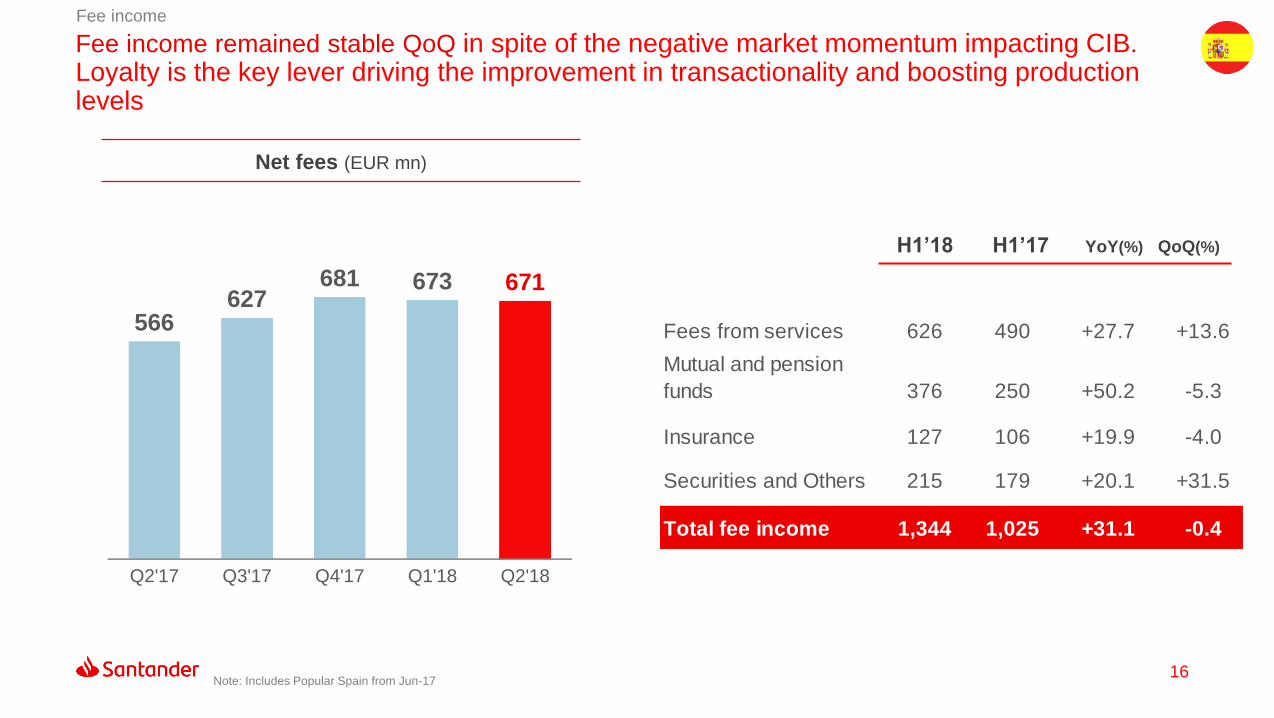
Fee income remained stable QoQ in spite of the negative market momentum impacting CIB. Loyalty is the key lever driving the improvement in transactionality and boosting production levels
Fee income
Q2'17 Q3'17 Q4'17 Q1'18 Q2'18
566627
681 673 671
Net fees (EUR mn)
H1’18 H1’17 YoY(%) QoQ(%)
Fees from services 626 490 +27.7 +13.6
Mutual and pension
funds 376 250 +50.2 -5.3
Insurance 127 106 +19.9 -4.0
Securities and Others 215 179 +20.1 +31.5
Total fee income 1,344 1,025 +31.1 -0.4
Note: Includes Popular Spain from Jun-17
17
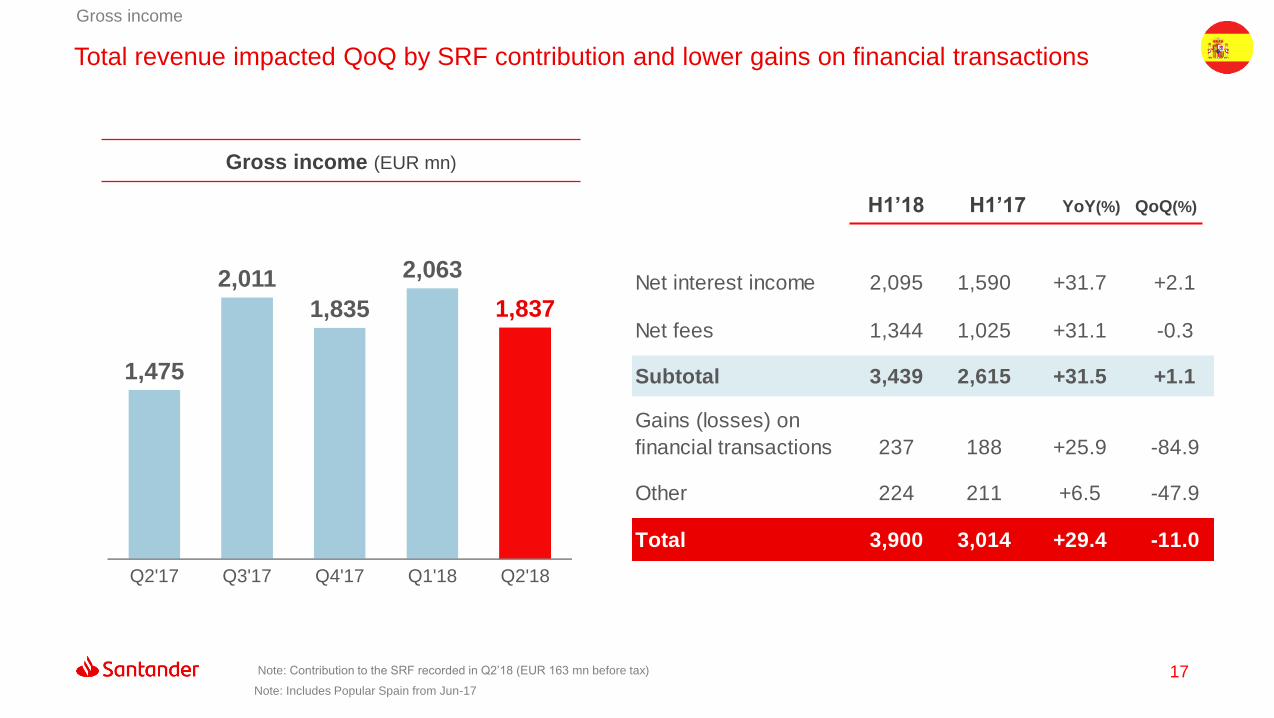
Net interest income 2,095 1,590 +31.7 +2.1
Net fees 1,344 1,025 +31.1 -0.3
Subtotal 3,439 2,615 +31.5 +1.1
Gains (losses) on
financial transactions 237 188 +25.9 -84.9
Other 224 211 +6.5 -47.9
Total 3,900 3,014 +29.4 -11.0
Total revenue impacted QoQ by SRF contribution and lower gains on financial transactions
Gross income
Q2'17 Q3'17 Q4'17 Q1'18 Q2'18
1,475
2,011
1,835
2,063
1,837
Gross income (EUR mn)
H1’18 H1’17 YoY(%) QoQ(%)
Note: Contribution to the SRF recorded in Q2’18 (EUR 163 mn before tax)
Note: Includes Popular Spain from Jun-17
18
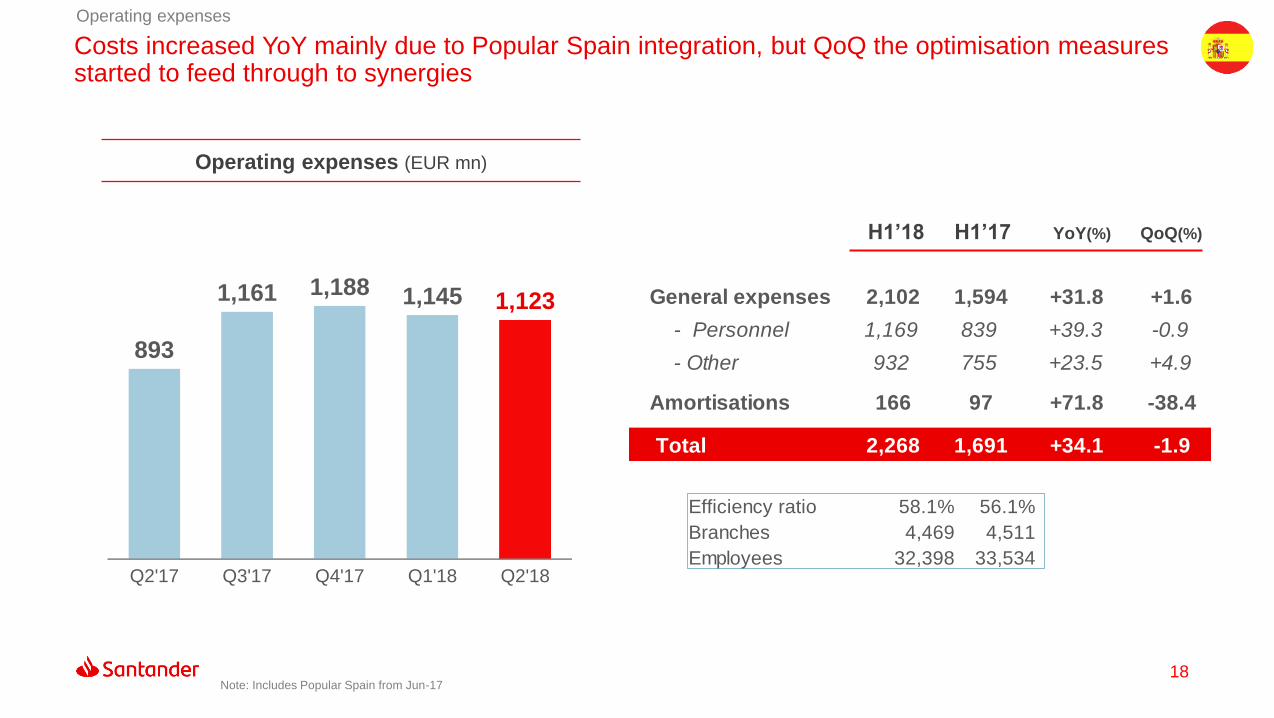
Costs increased YoY mainly due to Popular Spain integration, but QoQ the optimisation measures started to feed through to synergies
Operating expenses
Q2'17 Q3'17 Q4'17 Q1'18 Q2'18
893
1,161 1,188 1,145 1,123
Operating expenses (EUR mn)
H1’18 H1’17 YoY(%) QoQ(%)
General expenses 2,102 1,594 +31.8 +1.6
- Personnel 1,169 839 +39.3 -0.9
- Other 932 755 +23.5 +4.9
Amortisations 166 97 +71.8 -38.4
Total 2,268 1,691 +34.1 -1.9
Efficiency ratio 58.1% 56.1%
Branches 4,469 4,511
Employees 32,398 33,534
Note: Includes Popular Spain from Jun-17

19
Lower LLPs QoQ driven by seasonal factors in activity. NPL and Coverage ratio improved YoY
Net operating income after loan-loss provisions (LLPs)
Q2'17 Q3'17 Q4'17 Q1'18 Q2'18
144
120
175
207 196
LLPs and cost of credit (EUR mn, %)
0.32 0.28 0.30 0.29 0.31
Cost of credit
Net LLPs
H1’18 H1’17 YoY(%) QoQ(%)
Net operating
income 1,633 1,323 +23.4 -22.2
Loan-loss provisions (402) (308) +30.8 -5.4
Net operat. income
after provisions 1,230 1,016 +21.1 -27.1
Coverage ratio 49.0% 56.6%
NPL ratio 6.24% 10.52%
Note: Includes Popular Spain from Jun-17

20
PBT 1,040 888 +17.2 -28.9
Tax on profit (260) (253) +2.7 -30.4
Consolidated
profit780 634 +23.0 -28.4
Underlying att. profit 780 624 +24.9 -28.5
Net capital gains and
provisions(280) 0 - -
Attributable profit 500 624 -19.9 -90.0
Attributable profit decreased YoY due to Popular restructuring costs. On a underlying basis, lower profit QoQ, mainly due to SRF contribution, partially offset by cost savings and lower LLPs.
Attributable profit
Underlying attributable profit (EUR mn)
H1’18 H1’17 YoY(%) QoQ(%)
Effective tax rate
Q2'17 Q3'17 Q4'17 Q1'18 Q2'18
262
484
330
455
325
25.0% 28.6%
Attributable profit (EUR mn)
262 184 330 455 45
Note: Contribution to the SRF recorded in Q2’18 (EUR 163 mn before tax)
Note: Includes Popular Spain from Jun-17
21
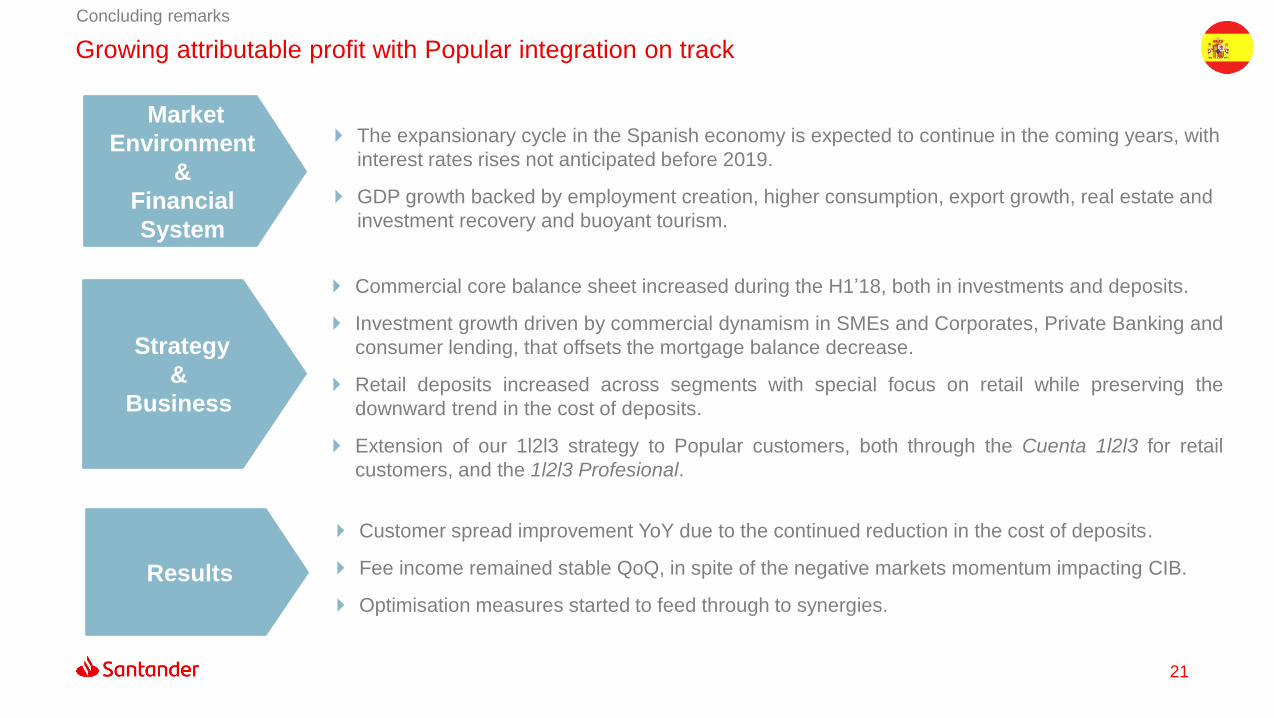
Concluding remarks
The expansionary cycle in the Spanish economy is expected to continue in the coming years, with
interest rates rises not anticipated before 2019.
GDP growth backed by employment creation, higher consumption, export growth, real estate and
investment recovery and buoyant tourism.
Market
Environment
&
Financial
System
Commercial core balance sheet increased during the H1’18, both in investments and deposits.
Investment growth driven by commercial dynamism in SMEs and Corporates, Private Banking and
consumer lending, that offsets the mortgage balance decrease.
Retail deposits increased across segments with special focus on retail while preserving the
downward trend in the cost of deposits.
Extension of our 1l2l3 strategy to Popular customers, both through the Cuenta 1l2l3 for retail
customers, and the 1l2l3 Profesional.
Strategy
&
Business
Customer spread improvement YoY due to the continued reduction in the cost of deposits.
Fee income remained stable QoQ, in spite of the negative markets momentum impacting CIB.
Optimisation measures started to feed through to synergies.
Results
Growing attributable profit with Popular integration on track

Appendix
04
23
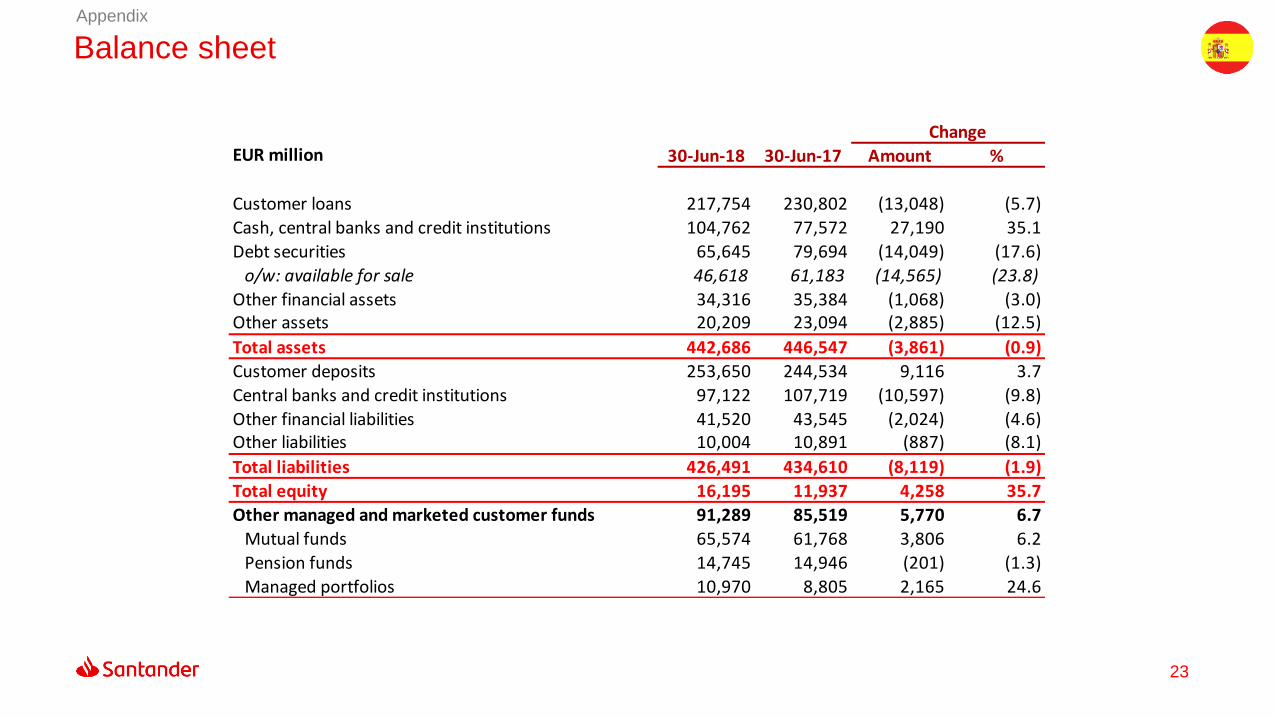
Balance sheetAppendix
ChangeEUR million 30-Jun-18 30-Jun-17 Amount %
Customer loans 217,754 230,802 (13,048) (5.7)
Cash, central banks and credit institutions 104,762 77,572 27,190 35.1
Debt securities 65,645 79,694 (14,049) (17.6)
o/w: available for sale 46,618 61,183 (14,565) (23.8)
Other financial assets 34,316 35,384 (1,068) (3.0)Other assets 20,209 23,094 (2,885) (12.5)
Total assets 442,686 446,547 (3,861) (0.9)
Customer deposits 253,650 244,534 9,116 3.7
Central banks and credit institutions 97,122 107,719 (10,597) (9.8)
Other financial liabilities 41,520 43,545 (2,024) (4.6)Other liabilities 10,004 10,891 (887) (8.1)
Total liabilities 426,491 434,610 (8,119) (1.9)
Total equity 16,195 11,937 4,258 35.7
Other managed and marketed customer funds 91,289 85,519 5,770 6.7
Mutual funds 65,574 61,768 3,806 6.2
Pension funds 14,745 14,946 (201) (1.3)
Managed portfolios 10,970 8,805 2,165 24.6
24
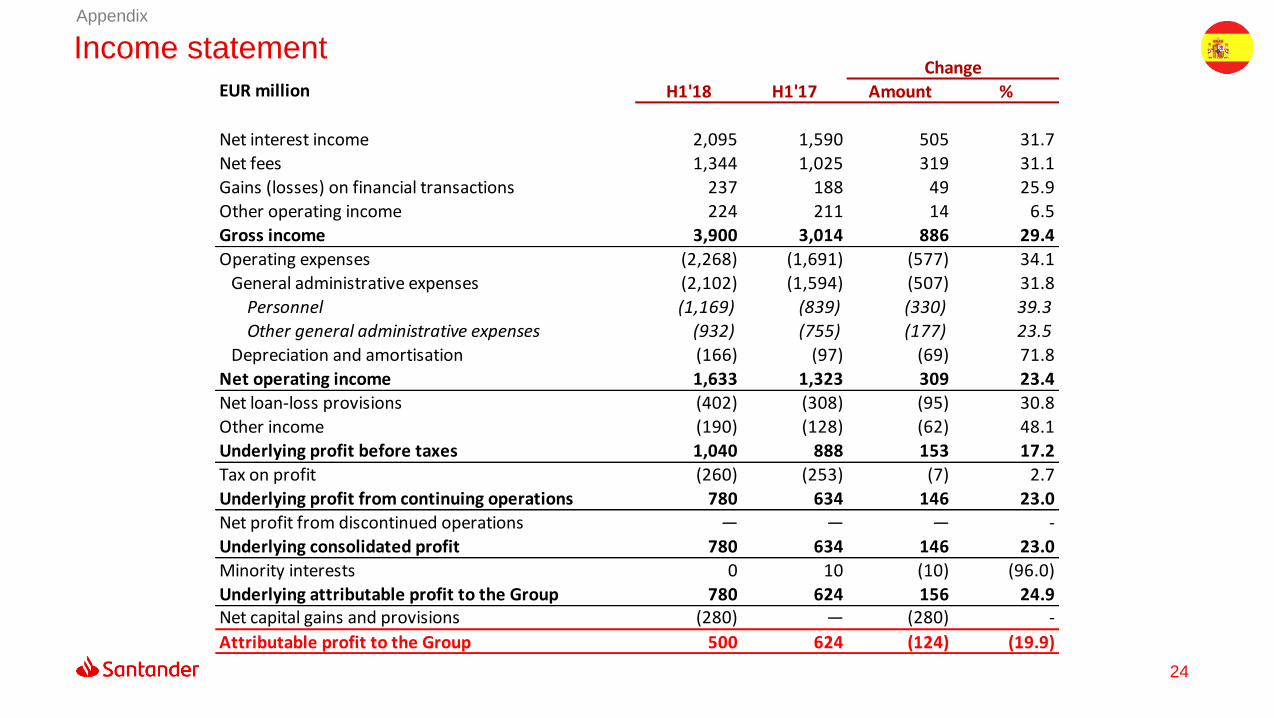
ChangeEUR million H1'18 H1'17 Amount %
Net interest income 2,095 1,590 505 31.7
Net fees 1,344 1,025 319 31.1
Gains (losses) on financial transactions 237 188 49 25.9
Other operating income 224 211 14 6.5
Gross income 3,900 3,014 886 29.4
Operating expenses (2,268) (1,691) (577) 34.1
General administrative expenses (2,102) (1,594) (507) 31.8
Personnel (1,169) (839) (330) 39.3
Other general administrative expenses (932) (755) (177) 23.5
Depreciation and amortisation (166) (97) (69) 71.8
Net operating income 1,633 1,323 309 23.4
Net loan-loss provisions (402) (308) (95) 30.8
Other income (190) (128) (62) 48.1
Underlying profit before taxes 1,040 888 153 17.2
Tax on profit (260) (253) (7) 2.7
Underlying profit from continuing operations 780 634 146 23.0
Net profit from discontinued operations — — — -
Underlying consolidated profit 780 634 146 23.0
Minority interests 0 10 (10) (96.0)
Underlying attributable profit to the Group 780 624 156 24.9Net capital gains and provisions (280) — (280) -
Attributable profit to the Group 500 624 (124) (19.9)
Income statementAppendix
25
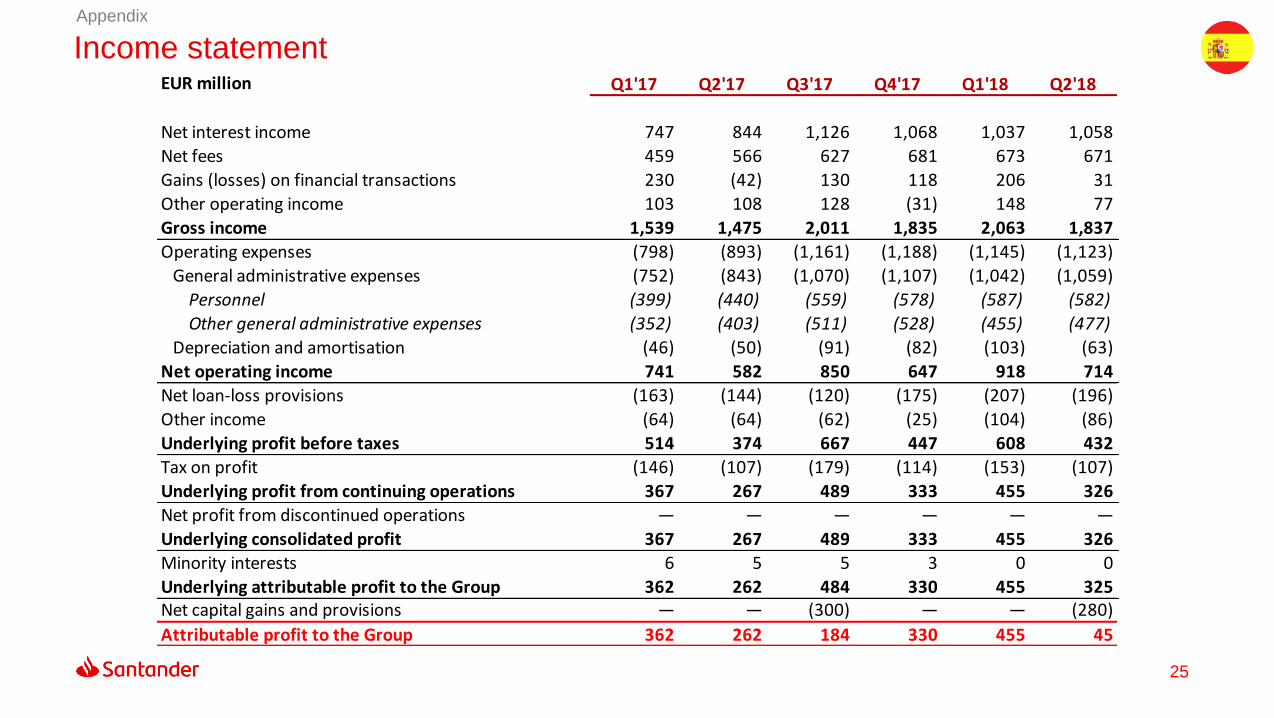
Income statementAppendix
EUR million Q1'17 Q2'17 Q3'17 Q4'17 Q1'18 Q2'18
Net interest income 747 844 1,126 1,068 1,037 1,058
Net fees 459 566 627 681 673 671
Gains (losses) on financial transactions 230 (42) 130 118 206 31
Other operating income 103 108 128 (31) 148 77
Gross income 1,539 1,475 2,011 1,835 2,063 1,837
Operating expenses (798) (893) (1,161) (1,188) (1,145) (1,123)
General administrative expenses (752) (843) (1,070) (1,107) (1,042) (1,059)
Personnel (399) (440) (559) (578) (587) (582)
Other general administrative expenses (352) (403) (511) (528) (455) (477)
Depreciation and amortisation (46) (50) (91) (82) (103) (63)
Net operating income 741 582 850 647 918 714
Net loan-loss provisions (163) (144) (120) (175) (207) (196)
Other income (64) (64) (62) (25) (104) (86)
Underlying profit before taxes 514 374 667 447 608 432
Tax on profit (146) (107) (179) (114) (153) (107)
Underlying profit from continuing operations 367 267 489 333 455 326
Net profit from discontinued operations — — — — — —
Underlying consolidated profit 367 267 489 333 455 326
Minority interests 6 5 5 3 0 0
Underlying attributable profit to the Group 362 262 484 330 455 325Net capital gains and provisions — — (300) — — (280)
Attributable profit to the Group 362 262 184 330 455 45

Thank you.
Our purpose is to help people
and business prosper.
Our culture is based on believing
that everything we do should be: