GWSA IAC Meeting August 30, 2018 - mass.gov · Industrial Electricity Remains constant from 2015...
40
August 30, 2018 GWSA IAC Meeting
Transcript of GWSA IAC Meeting August 30, 2018 - mass.gov · Industrial Electricity Remains constant from 2015...
August 30, 2018
GWSA IAC Meeting

MA Greenhouse Gas Emissions
Sharon Weber, MassDEP
2
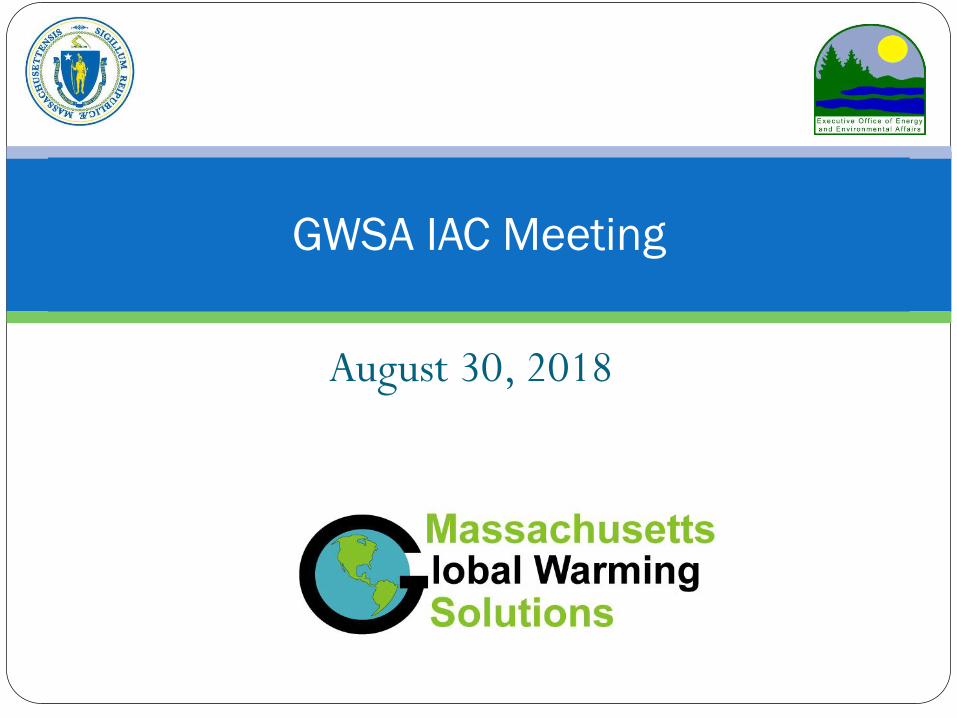
Primer: GHGs, GWPs, MMTCO2e
The individual gases that contribute to total greenhouse gas
(GHG) emissions in the MA GHG Inventory include:
o carbon dioxide (CO2),
o methane (CH4),
o nitrous oxide (N2O),
o sulfur hexafluoride (SF6),
o hydrofluorocarbons (HFCs), and
o perfluorocarbons (PFCs).

Primer: GHGs, GWPs, MMTCO2e
Not all GHGs have the same heat-trapping capacity. For
example, one ton of methane (CH4) is equivalent to greater
than 20 tons of CO2 with respect to their heat trapping
potentials. A standard, known as the global warming
potential (GWP), relates the heat trapping potential of
each GHG to an equivalent quantity of CO2 over a given
time horizon. Emissions are in units of million metric
tons of carbon dioxide equivalents (MMTCO2e).

Primer: GHGs, GWPs, MMTCO2e Current 100-year GWPs from IPCC AR4
Therefore:
o 1 million metric tons of CO2 = 1 MMTCO2e
o 1 million metric tons of CH4 = 25 MMTCO2e
GHG GWP
carbon dioxide (CO2) 1
methane (CH4) 25
nitrous oxide (N2O) 298
sulfur hexafluoride (SF6) 22,800
hydrofluorocarbons (HFCs) and
perfluorocarbons (PFCs)
124 to 17,700

MA GHG Inventory
(complete through 2015)
92.7
70.8
60
65
70
75
80
85
90
95
100
105
1990 1995 2000 2005 2010 2015 2020
Mill
ion
Met
ric
Ton
s o
f CO
2eq
uiv
alen
t
Massachusetts GHG Emissions
Actual EmissionsProjected Emissions
2020 Limit
76.3

MA GHG Inventory divided by Sectors
11/10/2015
0
5
10
15
20
25
30
35
40
1990 1995 2000 2005 2010 2015 2020
Mil
lio
n M
etric
To
ns o
f C
O2
eq
uiv
ale
nt
Massachusetts GHG Emissions from Fuel Combustion(by Sector)
Transportation
Electricity Consumption
Residential
Commercial
Industrial (Fuel)
0
1
2
3
4
5
6
1990 1995 2000 2005 2010 2015 2020
Mil
lio
n M
etric
To
ns o
f C
O2
eq
uiv
ale
nt
Massachusetts GHG Non-Fuel Combustion Emissions (by Sector)
Agriculture & Land Use
Waste (Landfill & Wastewater)
Natural Gas Systems
Industrial (Process)
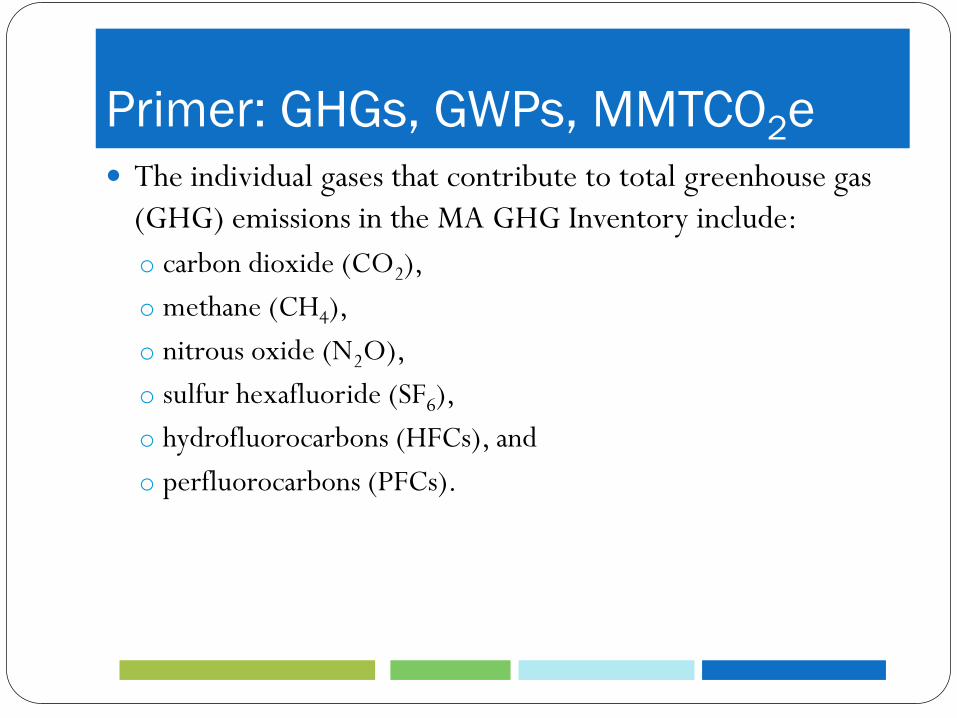
MA GHG Inventory
87.4%
2.4%
0.8%5.2% 4.1%
2015 MA GHG EmissionsCO2
CH4
N2O
SF6 & OtherGHG Gases
ImportedElectric Power(CO2, CH4 &N2O combined)
0
10
20
30
40
50
60
70
80
90
1990
1992
1994
1996
1998
2000
2002
2004
2006
2008
2010
2012
2014
All GHGs(MMTCO2e)
CO2
CH4
N2O
SF6 &Other GHGGases

1990 and 2015 GHG Emissions by
sector
16.2%
8.9%
6.1%
29.9%
32.3%
2.6%0.8%
0.4% 2.9%
% of 1990 94.4 MMTCO2e GHG Emissions by Sector
Residential
Commercial
Industrial
ElectricityConsumptionMobile Combustion
Natural Gas Systems
Industrial Processes
Agriculture & Land Use
Waste
18.0%
10.0%
4.8%
20.5%
38.9%
1.0%
5.5%
0.3% 1.1%
% of 2015 76.3 MMTCO2e GHG Emissions by Sector
Residential
Commercial
Industrial
ElectricityConsumptionMobile Combustion
Natural Gas Systems
Industrial Processes
Agriculture & Land Use
Waste

MA GHG Inventory Trends: Carbon Dioxide (CO2)
0
10
20
30
40
50
60
70
80
9019
90
1992
1994
1996
1998
2000
2002
2004
2006
2008
2010
2012
2014
CO2 (MMTCO2e)
Agriculture & Land Use
Solid Waste (MunicipalWaste Combustion)
Industrial Processes
Electric Power
Transportation
Industrial
Commercial
Residential
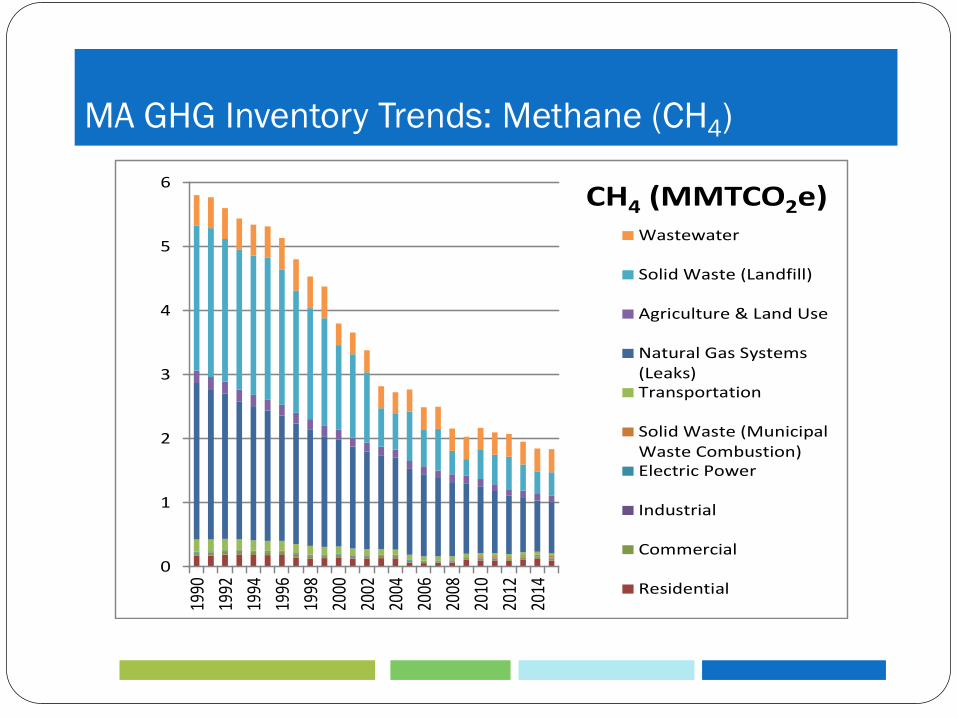
MA GHG Inventory Trends: Methane (CH4)
0
1
2
3
4
5
619
90
1992
1994
1996
1998
2000
2002
2004
2006
2008
2010
2012
2014
CH4 (MMTCO2e)Wastewater
Solid Waste (Landfill)
Agriculture & Land Use
Natural Gas Systems(Leaks)Transportation
Solid Waste (MunicipalWaste Combustion)Electric Power
Industrial
Commercial
Residential
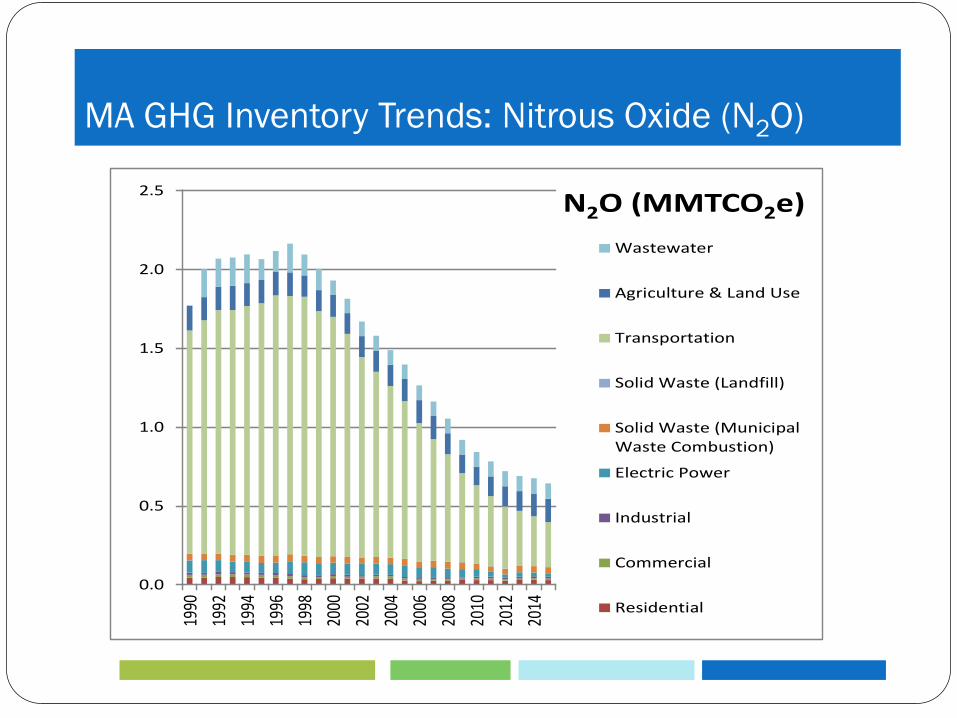
MA GHG Inventory Trends: Nitrous Oxide (N2O)
0.0
0.5
1.0
1.5
2.0
2.519
90
1992
1994
1996
1998
2000
2002
2004
2006
2008
2010
2012
2014
N2O (MMTCO2e)
Wastewater
Agriculture & Land Use
Transportation
Solid Waste (Landfill)
Solid Waste (MunicipalWaste Combustion)
Electric Power
Industrial
Commercial
Residential

MA GHG Inventory Trends: Sulfur hexaflouride (SF6),
hydroflourocarbons (HFCs) and perflourocarbons (PFCs)
0.0
0.5
1.0
1.5
2.0
2.5
3.0
3.5
4.0
1990
1992
1994
1996
1998
2000
2002
2004
2006
2008
2010
2012
2014
SF6 & Other GHGs(MMTCO2e)
Electric PowerTransmission andDistribution Systems
SemiconductorManufacturing
ODS Substitutes

DATA SOURCES
US Energy Information Administration (EIA)
State Energy Data System (SEDS) annual data
Annual Survey Form EIA-923 (utility) and (older, non-utility)
EIA-867 combustion data
US Environmental Protection Agency (EPA)
State Greenhouse Gas Inventory Tool (SGIT) modules
GHG Facility Reporting Program (beginning 2010)
MassDEP
GHG Facility Reporting Program (2010-2015)

Website links
MA GHG Inventory
MA CECP for 2020

Electricity Projections:
Reference Case
Benjamin Miller, EEA
16

Reference Case
17
Reference Case is a scenario consisting of only existing policies
Aims to answer: Without new policies, what will GHG emissions in MA be like in 2050?
Includes some global assumptions about ongoing non-policy trends, some examples:
Decrease in annual HDDs as the climate warms.
Gradual changes in housing stock as population grows and new housing units are built.
Ongoing macro-level trends in energy demand and consumption But no direct policy-driven changes, except what is already established.

LEAP: A quick primer
18
Not a model – an energy accounting tool
Variables, data, assumptions, and computations
are kept in open-source transparent manner.
Sums up demand across a tree-like structure
Can get very complicated very fast.
Lots of places for inputs and interactions.
“Transformation” spins up energy supply
module to meet demand.
Time-slicing available to model energy demand on an
hourly basis, but, for now, annual consumption is fine.

Major Demand Drivers (Reference)
19
Sector Category Reference Assumptions
Residential
Overall demand Driven by population & housing growth; some baseline energy intensity assumptions
for housing stocks.
Space heating, direct
electric All forecasted growth converted to heat pump.
Space heating, heat pumps Linear forecast (25% penetration by 2050)
Secondary space heating Insignificant use of cooling-sized heat pumps for partial space heating load.
Lighting 100% energy efficient bulbs by 2030.
Refrigeration 100% EnergyStar certified by 2030.
Air conditioning Expansion of both central air and heat pumps.
Water heating Increases modestly.
Commercial
Electric space heating Increases modestly.
Electric water heating,
cooking, and miscellaneous Increases modestly.
Electric appliances Exponential forecast computed historical trend of demand growth
Refrigeration Linear forecast (increases).
Industrial Electricity Remains constant from 2015 levels
Transportation EV adoption Follows LEV regulations through 2025, reaching 160,000 by 2025 before growth slows,
only reaching about 1 million vehicles by 2050.

Sample Reference Outputs
20
0
10
20
30
40
50
60
1990 2000 2010 2020 2030 2040 2050
Ele
ctr
icity D
em
an
d (
TW
h)
Commercial Electricity Demand
Refrigeration
Electric Appliances
Miscellaneous
Cooking
Water Heating
Space Cooling
Space Heating
Illustrative to show the IAC how
the bottom up model produces
electricity demand outputs

Sample Reference Outputs
21
0
10
20
30
40
50
60
70
80
90
1990 2000 2010 2020 2030 2040 2050
Ele
ctr
icity D
em
an
d (
TW
h)
Massachusetts Electricity Demand
Industrial
Commercial
Transportation
Residential
Illustrative to show the IAC how
the bottom up model produces
electricity demand outputs

LEAP: Electricity Sector Dispatch
22
Electricity sources programmed in with nameplate capacities, average availabilities (annual), efficiency factors, etc.
Electricity dispatched to according to a merit order.
Imports set with an arbitrarily large capacity and fill in any residual needs.
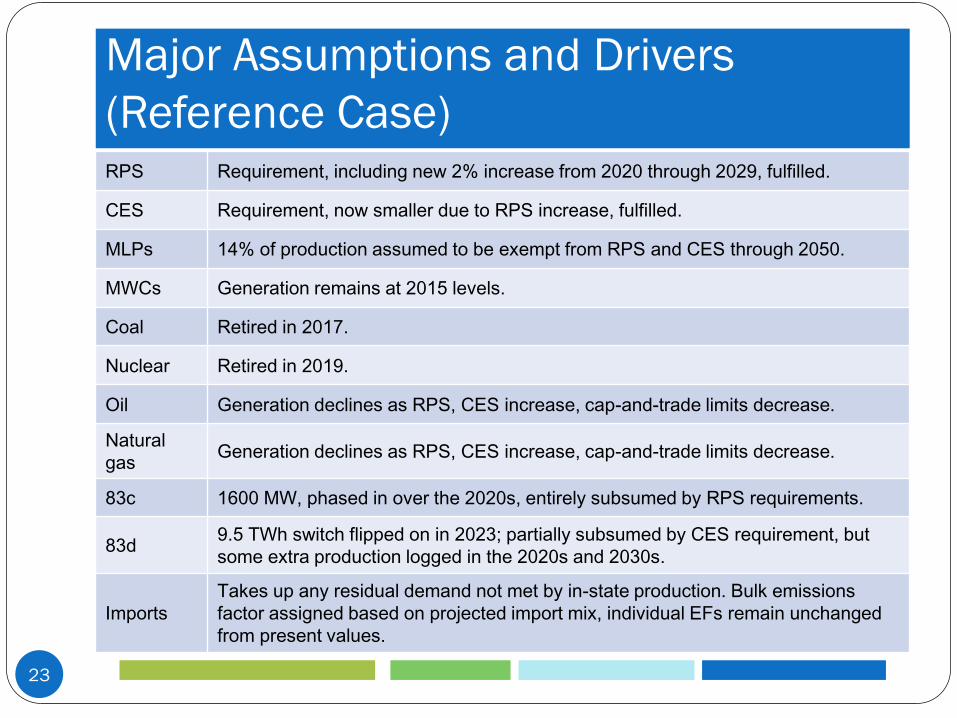
Major Assumptions and Drivers
(Reference Case)
23
RPS Requirement, including new 2% increase from 2020 through 2029, fulfilled.
CES Requirement, now smaller due to RPS increase, fulfilled.
MLPs 14% of production assumed to be exempt from RPS and CES through 2050.
MWCs Generation remains at 2015 levels.
Coal Retired in 2017.
Nuclear Retired in 2019.
Oil Generation declines as RPS, CES increase, cap-and-trade limits decrease.
Natural
gas Generation declines as RPS, CES increase, cap-and-trade limits decrease.
83c 1600 MW, phased in over the 2020s, entirely subsumed by RPS requirements.
83d 9.5 TWh switch flipped on in 2023; partially subsumed by CES requirement, but
some extra production logged in the 2020s and 2030s.
Imports
Takes up any residual demand not met by in-state production. Bulk emissions
factor assigned based on projected import mix, individual EFs remain unchanged
from present values.

Projected Generation (Reference)
24
0
10
20
30
40
50
60
70
80
90
100
1990 2000 2010 2020 2030 2040 2050
Ele
ctr
icity G
en
era
tion
(T
Wh
)
MSW in MA
Coal in MA
Oil in MA
Natural Gas in MA
Nuclear in MA
Non-RPS Renewables
Imports
Extra 83d
CES
RPS

Historical & Projected Imports
25
0
5
10
15
20
25
30
2000 2010 2020 2030 2040 2050
Imp
ort
ed E
lectr
icity (
TW
h) Maine
New Hampshire
Vermont
Connecticut
Rhode Island
New York
New Brunswick
Quebec
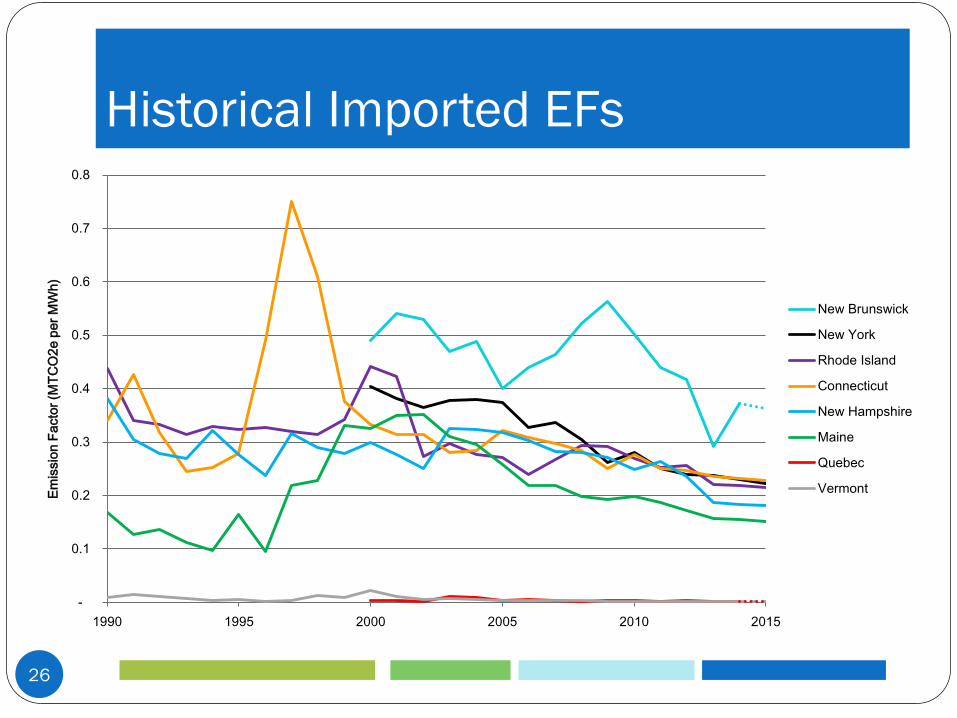
Historical Imported EFs
26
-
0.1
0.2
0.3
0.4
0.5
0.6
0.7
0.8
1990 1995 2000 2005 2010 2015
Em
issio
n F
acto
r (M
TC
O2
e p
er
MW
h)
New Brunswick
New York
Rhode Island
Connecticut
New Hampshire
Maine
Quebec
Vermont

Projected Electricity Sector Emissions
(Reference)
27
0
5
10
15
20
25
30
35
1990 2000 2010 2020 2030 2040 2050
GH
G E
mis
sio
ns (
MM
TC
O2
e)
MSW in MA
Coal in MA
Oil in MA
Natural Gas in MA
Imports
Renewables

Deliberative Policy Document
Creating a Clean, Affordable and Resilient Energy Future for the Commonwealth
Comprehensive Energy Plan
Updates to IAC
August 30, 2018

Deliberative Policy Document
Overview of Stakeholder Process • Three Meetings
– Boston on July 17, – Westborough on July 18, and – Westfield on July 19
• Introduction to the goals and process of the CEP
– “Commonwealth’s energy demands for electricity, transportation, and thermal conditioning”
– “strategies for meeting these demands in a regional context”
• Feedback from stakeholders on – Assumptions about supply and demand drivers included in the CEP
modeling – Challenges and possible policy pathways
• DOER received 76 written comments, reviewed for report
• Leading into the 2030 CECP and 80 x 50 Study
29

Deliberative Policy Document
Overview of Scenarios
• Modeling Assumptions
– Project different possibilities for Massachusetts’ energy future through modeling
– Analyzing multiple scenarios to understand how different policies drive differences in costs, reliability, and emissions
• Key Levers
– Efficiency – Renewables – Electrification (electric vehicles, heat pumps)
• Key Differences from LEAP Analysis
– 2030 vs. 2050 – True electric sector modeling – Market costs – Updates from new legislation
30

Deliberative Policy Document
Modeling
• Electric Sector
– Synapse and the Encompass Model
• Production-cost and capacity-expansion model
• Includes costs, scheduling, environmental compliance, etc.
• Unit-specific and regional
– Renewable Energy Market Outlook model and Sustainable Energy Advantage
• Scenario-specific renewable energy build-outs
• Renewable energy certificate (REC) and clean energy certificate (CEC) price forecasts
31
Deliberative Policy Document
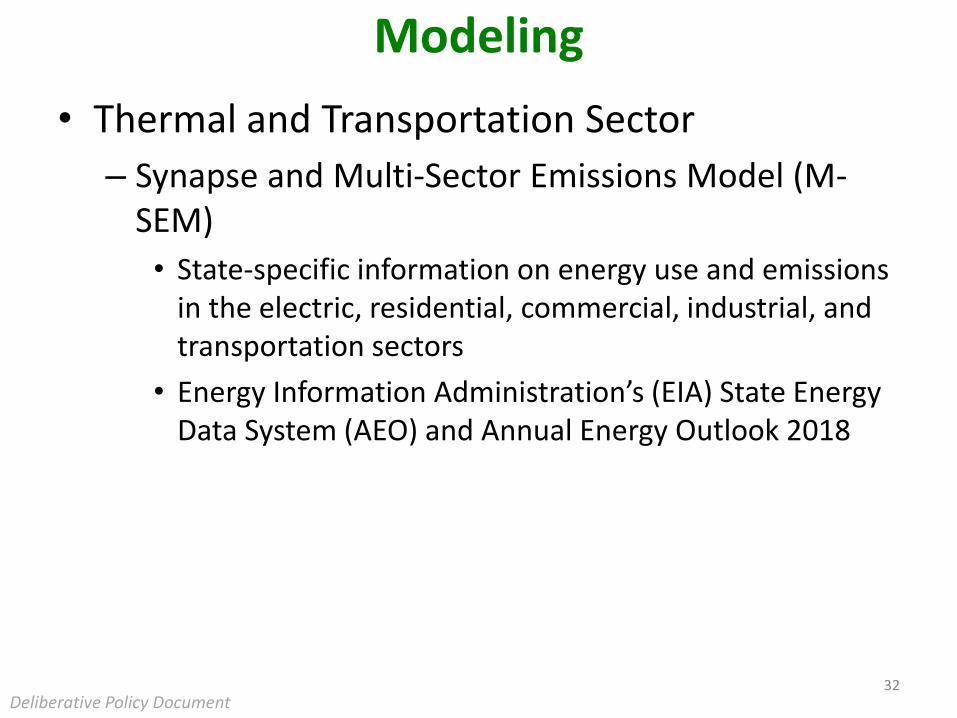
Modeling
• Thermal and Transportation Sector
– Synapse and Multi-Sector Emissions Model (M-SEM)
• State-specific information on energy use and emissions in the electric, residential, commercial, industrial, and transportation sectors
• Energy Information Administration’s (EIA) State Energy Data System (AEO) and Annual Energy Outlook 2018
32

Deliberative Policy Document
Building the Sustained Policies Scenario Electric Sector
• Demand – Drivers
• Population and GDP
• Energy efficiency programs and new codes and standards for lighting and appliances
• Electrification
– Assumptions • ISO-NE 2018 CELT Report: projections of annual
electricity sales from 2018 to 2027
• Annual projection of the impacts of energy efficiency
• Current deployment of heat pumps
• 160,000 electric vehicles in MA specifically by 2025
33

Deliberative Policy Document
Building the Sustained Policies Scenario Electric Sector
• Supply
– Pre-2018 Legislation RPS and CES – 1% and 2% increases
– 83D (hydroelectric) and 83C (offshore wind) as filed
– Additional offshore wind in CT and RI
– Additional demand met by the results of the EnCompass modeling
34

Deliberative Policy Document 35
Sustained Policies – New England

80x50 Study
Hong-Hanh Chu, EEA
36

Overview
37
Long-range comprehensive study outlining strategies to achieve 80 percent reductions by 2050.
Tentative scope: 1) 2-6 cross-sectoral scenarios that outline plausible futures for the
Electric, Buildings, Transportation, Land use, and Non-energy sectors in 2050.
2) GWSA compliant emissions reduction pathway for each plausible scenario.
3) Viable suite of recommended policies (including market-based mechanisms and with a specific focus on policy solutions for the Transportation sector) and when to implement them in each plausible scenario.
4) Stakeholder process to gather feedback on potential policies including those impacting freight, land use and zoning, and the low-income and rural communities.

Overview
38
Key Analyses: Energy demand in each sector and across-sectors
Energy supply and cost
Key actors and decision points, strategic transitions
Drivers of price and non-price behavioral change
Indirect benefits and social-economic equity concerns of potential
policies
Main Variables: Technology growth and deployment
Land use development (where people live and work, commercial centers)
Fuel price
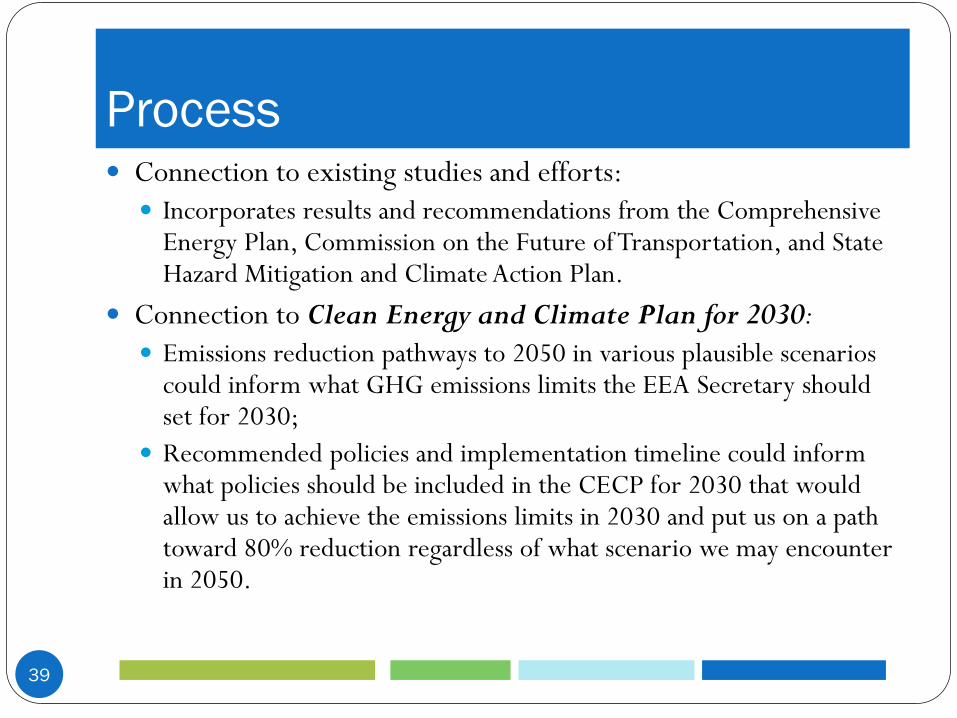
Process
39
Connection to existing studies and efforts:
Incorporates results and recommendations from the Comprehensive Energy Plan, Commission on the Future of Transportation, and State Hazard Mitigation and Climate Action Plan.
Connection to Clean Energy and Climate Plan for 2030:
Emissions reduction pathways to 2050 in various plausible scenarios could inform what GHG emissions limits the EEA Secretary should set for 2030;
Recommended policies and implementation timeline could inform what policies should be included in the CECP for 2030 that would allow us to achieve the emissions limits in 2030 and put us on a path toward 80% reduction regardless of what scenario we may encounter in 2050.

Process
40
Timeline:
Stakeholder feedback on study scope, today and Fall 2018
RFR or RFQ posted, Winter 2018/2019
Consultants contracted, Winter/Spring 2019
Stakeholder engagement throughout
Study concludes, Summer 2020
IAC involvement:
Feedback on scope of study
Additional feedback as the study progresses
Recommendation of strategies and policies for consideration in the study and CECP for 2030


![MA Leading by Example Council Meeting Council Mee… · Why: The Global Warming Solutions Act (GWSA) […and science] 14 GWSA, signed into law in 2008, sets statutory emissions limits](https://static.fdocuments.net/doc/165x107/5f2abd83bd06285a0e4a045b/ma-leading-by-example-council-meeting-council-mee-why-the-global-warming-solutions.jpg)