Clarkson Potter, Potter Craft, Watson-Guptill and Broadway Books Spring 2010 Catalogue
Upload
rick-welshCategory
view
36download
1
Factors Associated with Direct Marketing in the Northeastern U.S.
Amy Guptill, SUNY BrockportDavid Larsen, Syracuse UniversityErin Kelly, Syracuse University
Rick Welsh, Syracuse University
Presented at the Annual Meeting of the Rural Sociological Society, August 2, 2014 in
New Orleans, LAThanks to Amelia Cain and Amanda Koenck for their invaluable assistance
Direct Sales from Farms to Consumers Increasing Nationally
• Direct market sales increased to over $1.3 billion in 2012, up from $404 million in 1992 (Census of Ag).
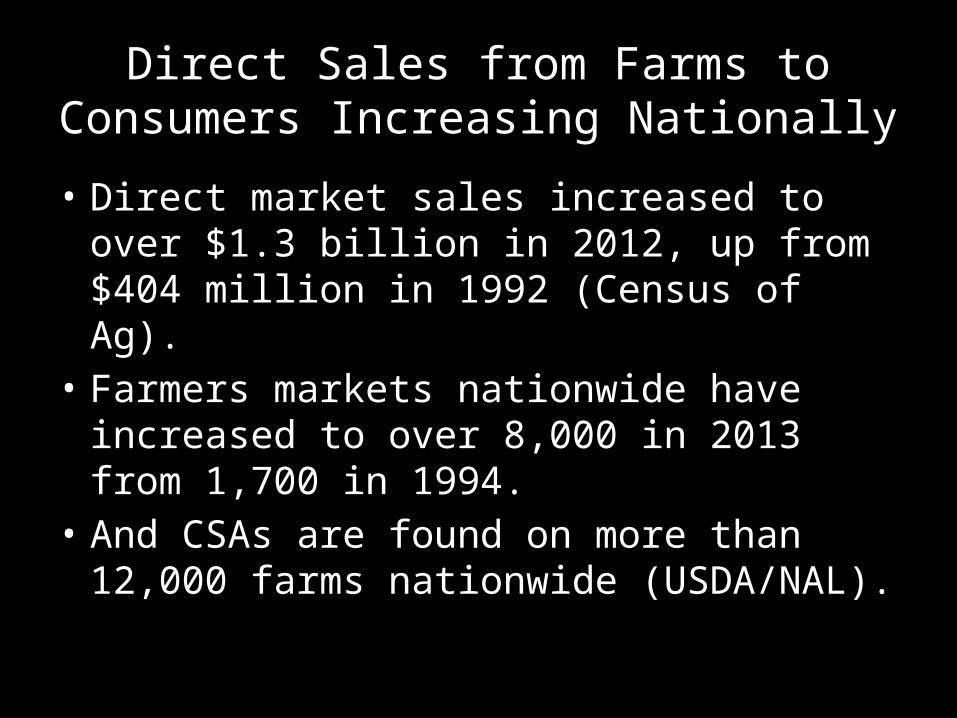
• Farmers markets nationwide have increased to over 8,000 in 2013 from 1,700 in 1994.
• And CSAs are found on more than 12,000 farms nationwide (USDA/NAL).
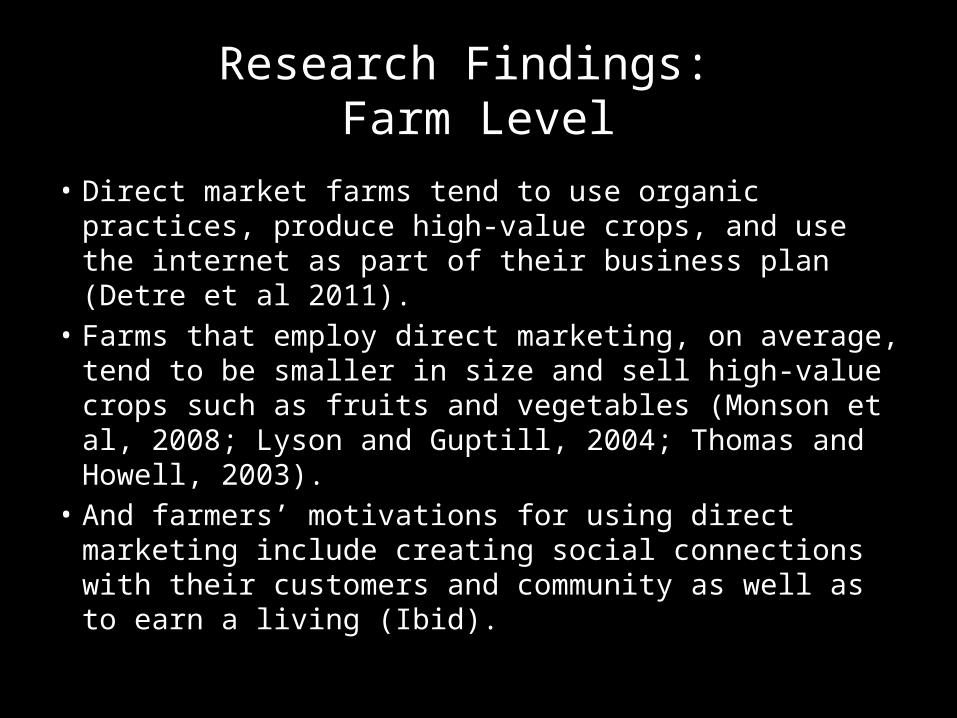
Research Findings: Farm Level
• Direct market farms tend to use organic practices, produce high-value crops, and use the internet as part of their business plan (Detre et al 2011).
• Farms that employ direct marketing, on average, tend to be smaller in size and sell high-value crops such as fruits and vegetables (Monson et al, 2008; Lyson and Guptill, 2004; Thomas and Howell, 2003).
• And farmers’ motivations for using direct marketing include creating social connections with their customers and community as well as to earn a living (Ibid).
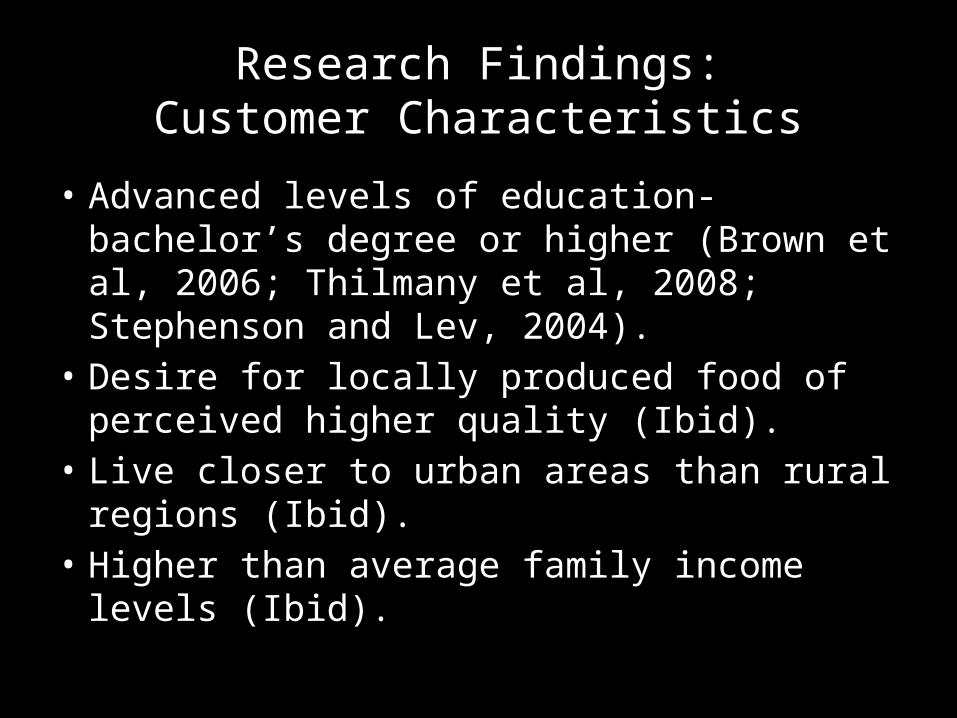
Research Findings:Customer Characteristics
• Advanced levels of education- bachelor’s degree or higher (Brown et al, 2006; Thilmany et al, 2008; Stephenson and Lev, 2004).
• Desire for locally produced food of perceived higher quality (Ibid).
• Live closer to urban areas than rural regions (Ibid).
• Higher than average family income levels (Ibid).
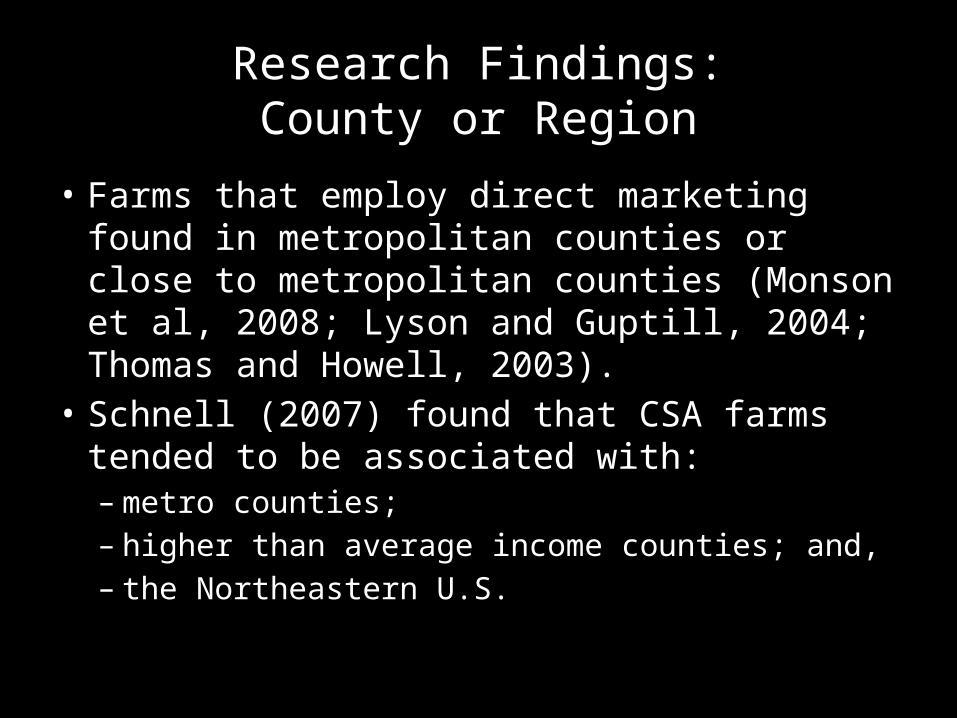
Research Findings:County or Region
• Farms that employ direct marketing found in metropolitan counties or close to metropolitan counties (Monson et al, 2008; Lyson and Guptill, 2004; Thomas and Howell, 2003).
• Schnell (2007) found that CSA farms tended to be associated with:– metro counties;– higher than average income counties; and,– the Northeastern U.S.

Our Research:Unpack Northeastern U.S. & Direct Sales
• NE has largest number of direct market farms.• NE has the greatest dollar value of direct market
sales.• NE states often lumped together when considering
direct marketing.• How to operationalize direct marketing or sales?• Shed light on county-level characteristics associated
with higher levels of direct marketing: is direct marketing driven primarily or exclusively by income?
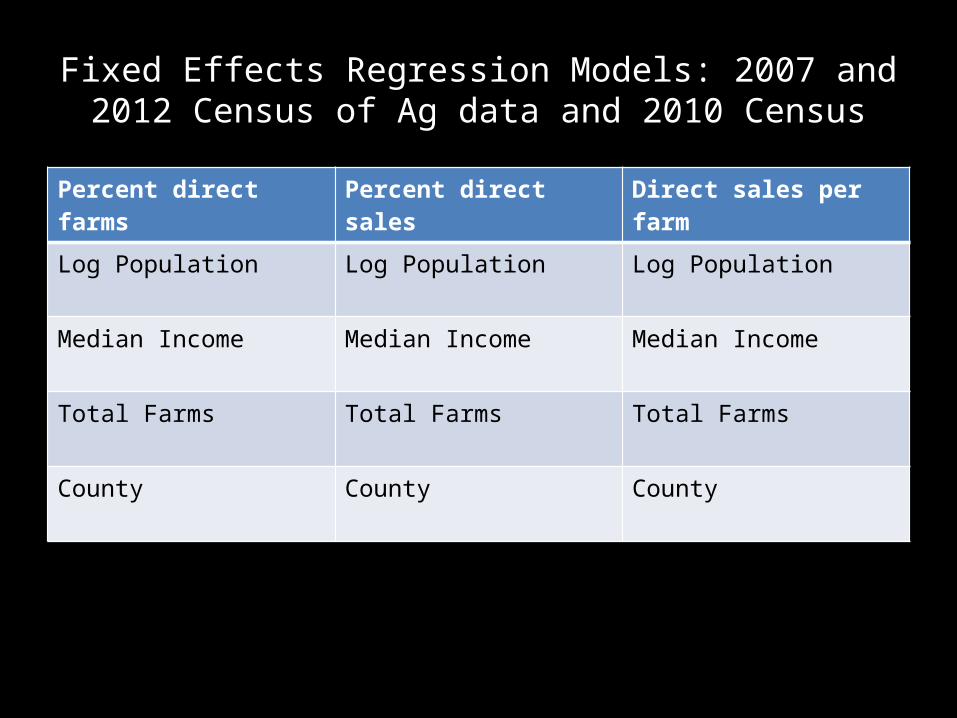
Fixed Effects Regression Models: 2007 and 2012 Census of Ag data and 2010 Census
Percent direct farms Percent direct sales Direct sales per farm
Log Population Log Population Log Population
Median Income Median Income Median Income
Total Farms Total Farms Total Farms
County County County
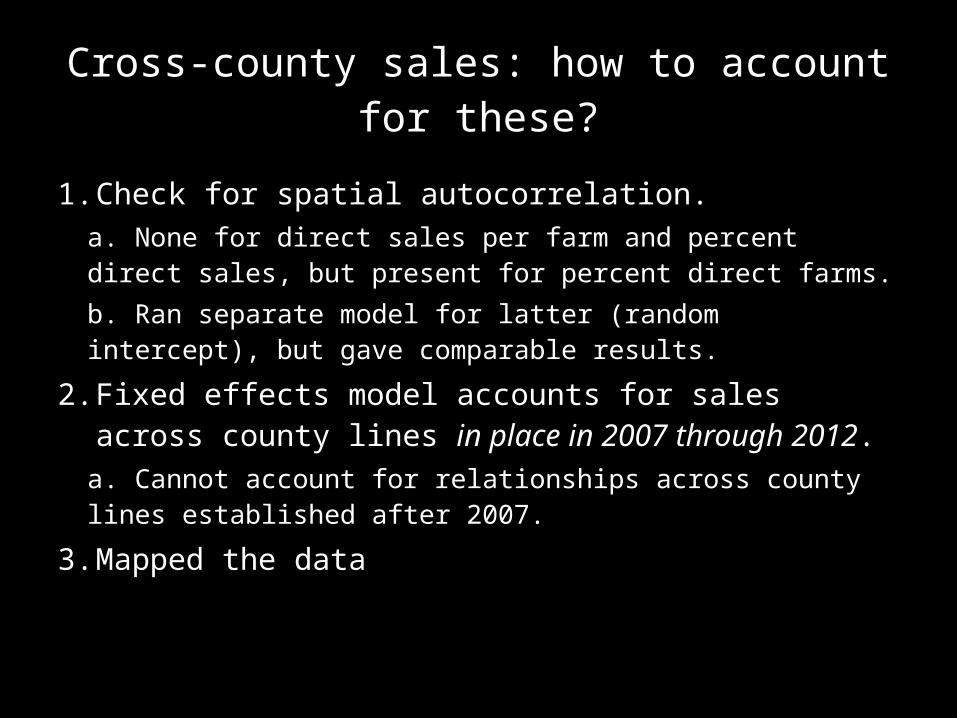
Cross-county sales: how to account for these?
1. Check for spatial autocorrelation.a. None for direct sales per farm and percent direct sales, but present for percent direct farms.b. Ran separate model for latter (random intercept), but gave comparable results.
2. Fixed effects model accounts for sales across county lines in place in 2007 through 2012.
a. Cannot account for relationships across county lines established after 2007.
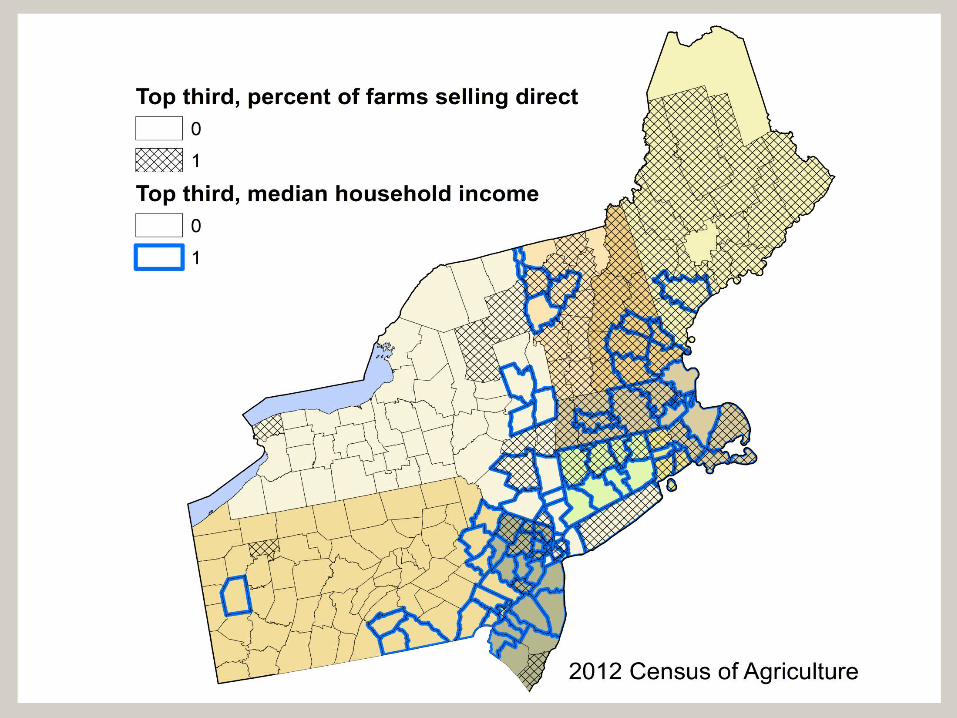
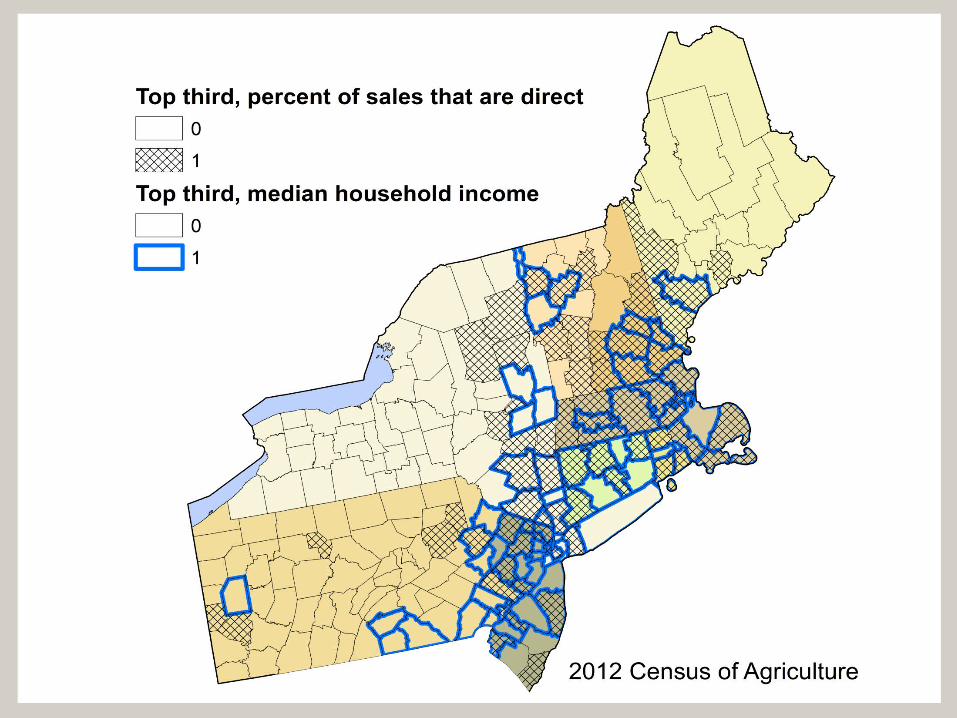
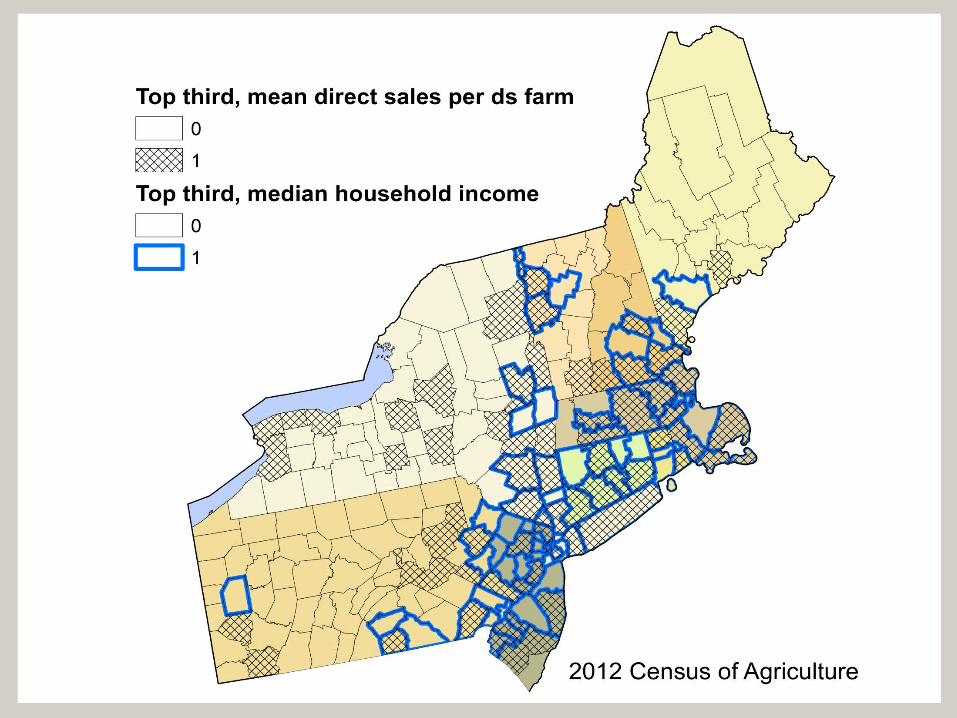
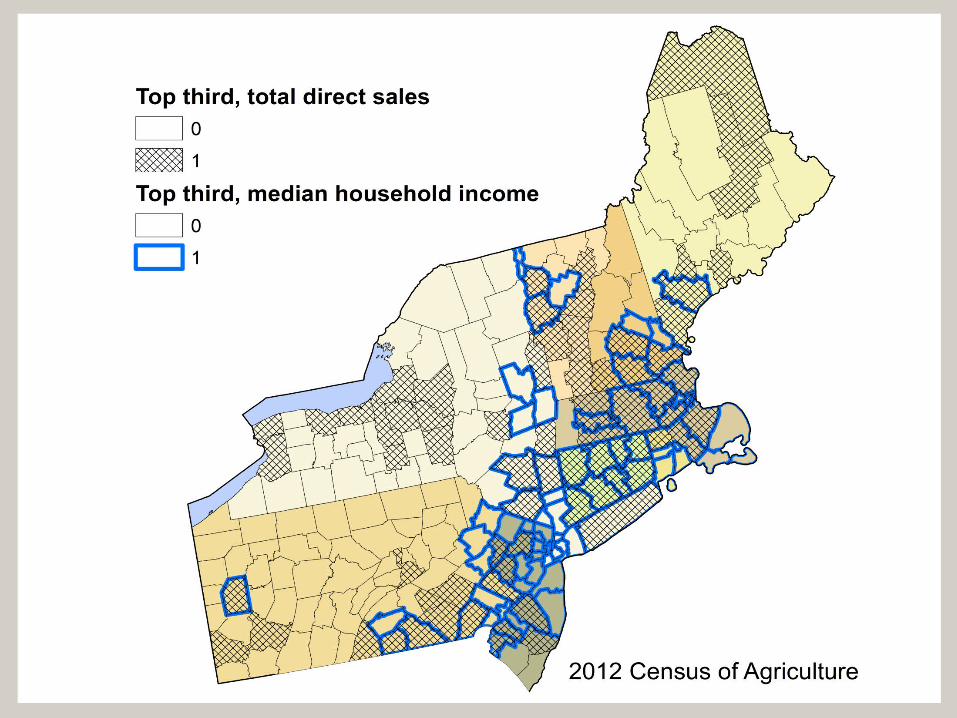
3. Mapped the data
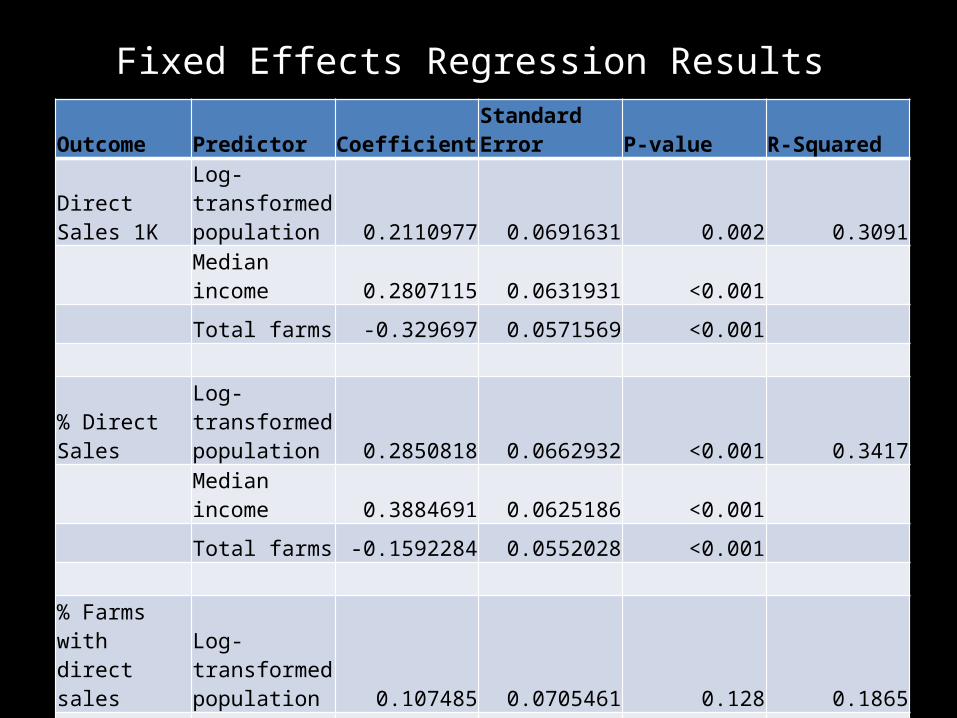
Fixed Effects Regression ResultsOutcome Predictor Coefficient Standard Error P-value R-Squared
Direct Sales 1K
Log-transformed population 0.2110977 0.0691631 0.002 0.3091
Median income 0.2807115 0.0631931 <0.001
Total farms -0.329697 0.0571569 <0.001
% Direct Sales
Log-transformed population 0.2850818 0.0662932 <0.001 0.3417
Median income 0.3884691 0.0625186 <0.001
Total farms -0.1592284 0.0552028 <0.001
% Farms with direct sales
Log-transformed population 0.107485 0.0705461 0.128 0.1865
Median income 0.2577298 0.0678261 <0.001
Total farms -0.3458478 0.0594415 <0.001
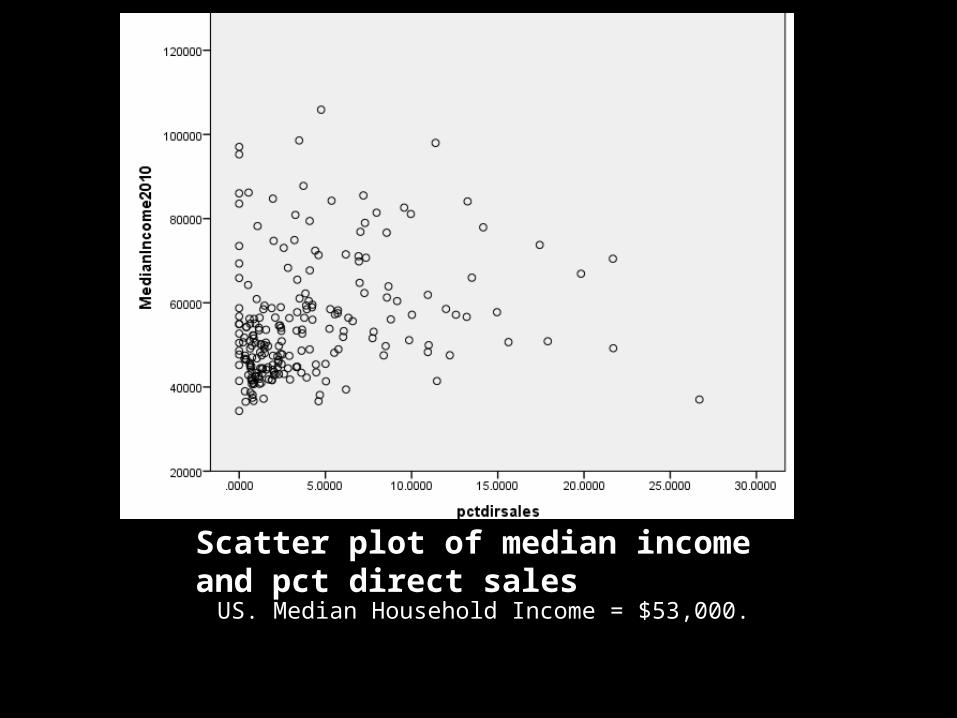
Scatter plot of median income and pct direct sales
US. Median Household Income = $53,000.
Conclusions
• In general, higher income areas associated with higher direct sales (per farm, pct sales, pct farms).
• But, to some degree, the relative impact of income versus population as drivers of direct sales depend on definition of direct sales or local foods.
• Also, more direct sales farms in lower income areas than for other direct sales indicators.
• Seems clear that direct sales more than marketing to higher income elites, though income the primary driver.
• For example, prior to popularity of farmers’ markets and CSAs, rural residents sold meat, dairy (e.g., raw milk) and plant products to each other. Still occurs with regularity.
Future Research
• Closer inspection of county characteristics in regards to findings.
• Compare motivations for engaging in direct marketing for farmers and consumers in higher income and lower income areas.
• Measure effect of direct marketing in higher income and lower income areas on farm income or farm cash sales.