Gumus Bulent Diss
196
AXIOMATIC PRODUCT DEVELOPMENT LIFECYCLE By BULENT GUMUS, M.S. A DISSERTATION IN MECHANICAL ENGINEERING Submitted to the Graduate Faculty of Texas Tech University in Partial Fulfillment of the Requirements for the Degree of DOCTOR OF PHILOSOPHY Approved Atila Ertas Chairperson of the Committee Stephen Ekwaro-Osire Timothy Maxwell Jahan Rasty Hong-Chao Zhang Accepted John Borrelli Dean of the Graduate School December, 2005
Transcript of Gumus Bulent Diss
AXIOMATIC PRODUCT DEVELOPMENT LIFECYCLE
By
BULENT GUMUS, M.S.
A DISSERTATION
IN
MECHANICAL ENGINEERING
Submitted to the Graduate Faculty of Texas Tech University in
Partial Fulfillment of the Requirements for
the Degree of
DOCTOR OF PHILOSOPHY
Approved
Atila Ertas Chairperson of the Committee
Stephen Ekwaro-Osire
Timothy Maxwell
Jahan Rasty
Hong-Chao Zhang
Accepted
John Borrelli Dean of the Graduate School
December, 2005

Copyright, 2005, Bulent Gumus
ii
ACKNOWLEDGEMENT
The successful completion of this work is a testament to the many hours that
others have contributed or sacrificed. I am grateful for these contributions and consider
myself fortunate for having the opportunity to work and share the life with those
individuals listed here.
I would like to express my sincere appreciation to my advisor Professor Atila
Ertas. I have been very honored and privileged to know him and have worked under his
supervision since 1996 and I have benefited greatly from his valuable guidance and from
being exposed to his excellent professionalism. His support and encouragement helped
me accomplish my masters and Ph.D. here at Texas Tech University.
I would like to thank to my PhD committee members: Dr. Stephen Ekwaro-Osire,
Dr. Tim Maxwell, Dr. Jahan Rasty, and Dr. Hong-Chao Zhang for their support,
guidance, and suggestions.
Dr. Derrick Tate has introduced the Axiomatic Design method to me in one of the
design classes I took at Texas Tech. I’d like to thank him for that and also for his
invaluable suggestions and criticism. Deserving special mention is Dr. Ismail Cicek for
his contribution in developing the case study and also for sharing his experience and
wisdom with me.
I am also thankful to OnBoard Software, Inc., and its previous owner, Dave
Spencer, for providing a supportive work place for both professional and personal growth
and also for providing tuition assistance.
Last but not least, I would like to give special thanks to my family. My wife,
Sevinc, and my sons, Batuhan and Orhun, have given me unconditional support and
constant encouragement. They have been also very patient while I have been juggling a
full-time career, a PhD, and my family for the last four years. My parents, brothers and
sisters have helped and supported me, the youngest kid in the house, greatly throughout
the years in all aspects of life.
iii
TABLE OF CONTENTS
ACKNOWLEDGEMENT .................................................................................................. ii
ABSTRACT...................................................................................................................... vii
LIST OF TABLES........................................................................................................... viii
LIST OF FIGURES ........................................................................................................... xi
CHAPTER
I INTRODUCTION .......................................................................................................1
1.1 Needs....................................................................................................................3
1.2 Objectives ............................................................................................................5
1.3 Research Method .................................................................................................6
1.4 Scope and Contribution of the Thesis..................................................................7
1.5 Dissertation Overview .........................................................................................8
II PRODUCT DEVELOPMENT LIFECYCLE AND DESIGN METHODOLOGIES 9
2.1 Product Development Lifecycle ........................................................................14
2.1.1 Requirement Management .........................................................................19
2.1.1.1 Customer Need Assessment...................................................................23
2.1.1.2 Requirement Analysis............................................................................26
2.1.1.3 Current Problems with Requirement Management................................27
2.1.2 Design ........................................................................................................29
2.1.3 Implementation/Manufacturing .................................................................30
2.1.4 Test and Evaluation....................................................................................31
2.1.5 Change Management .................................................................................32
2.1.6 Project Management ..................................................................................32
2.2 Axiomatic Design (AD).....................................................................................33
2.2.1 General AD Concepts ................................................................................35
2.2.1.1 AD: Domains .........................................................................................35
2.2.1.2 AD: Hierarchies .....................................................................................41
2.2.1.3 AD: Zigzagging .....................................................................................42
iv
2.2.1.4 AD: Design Axioms...............................................................................43
2.2.2 AD System Architecture ............................................................................50
2.2.2.1 Tree Diagram .........................................................................................51
2.2.2.2 Module-Junction Diagram .....................................................................52
2.2.2.3 AD Flow Diagram..................................................................................52
2.2.3 AD Benefits ...............................................................................................54
2.2.3.1 Benefits to Designers .............................................................................54
2.2.3.2 Benefits to Managers .............................................................................55
2.2.3.3 Benefits to Firms....................................................................................55
2.3 AD with Other Methodologies...........................................................................56
2.3.1 AD and TRIZ .............................................................................................59
2.3.2 AD and QFD..............................................................................................62
2.3.3 AD and Robust Design ..............................................................................69
2.3.4 AD and Concurrent Engineering ...............................................................72
2.3.5 AD and Design for X .................................................................................75
2.3.6 AD and Failure Modes and Effect Analysis (FMEA) ...............................76
2.4 AD and Product Development Lifecycle...........................................................77
2.4.1 AD and Requirement Management ...........................................................78
2.4.2 AD and Change Management....................................................................79
2.4.3 AD and Testing ..........................................................................................81
2.4.4 AD and Project Management.....................................................................81
2.5 Design and Creativity ........................................................................................82
2.6 Design, Product Development Lifecycle Models and Computers.....................83
III AXIOMATIC PRODUCT DEVELOPMENT LIFECYCLE (APDL).....................86
3.1 APDL: New Domains and Characteristic Vectors.............................................87
3.2 APDL Framework..............................................................................................89
3.2.1 APDL Process Overview ...........................................................................92
3.2.2 Customer Needs .........................................................................................96
3.2.3 Functional Requirements ...........................................................................98
v
3.2.4 Input Constraints......................................................................................103
3.2.5 Requirement Matrix, R, and Constraint Matrix, C ..................................104
3.2.6 System FR/DP/SC....................................................................................106
3.2.7 Design Parameters ...................................................................................107
3.2.8 Design Matrix, D .....................................................................................108
3.2.9 Input Constraint Allocation Matrix, CA ..................................................112
3.2.10 System Components.................................................................................114
3.2.11 Process Variables .....................................................................................116
3.2.12 System Structure Matrix, SS, and Process Matrix, P...............................117
3.2.13 Functional Test Cases and Functional Test Matrix, FT...........................119
3.2.14 Component Test Cases and Component Test Matrix, CT .......................120
3.3 APDL System Architecture .............................................................................122
3.4 APDL and Requirement Management.............................................................123
3.5 APDL and Other Design Methodologies.........................................................125
3.5.1 Reliability Engineering ............................................................................126
3.5.2 Design Structure Matrix...........................................................................126
3.6 APDL and Change Management .....................................................................127
3.7 APDL and Project Planning/Scheduling..........................................................128
3.8 Discussion........................................................................................................129
3.8.1 Management of Input Constraints............................................................130
3.8.2 Introduction of System Components .......................................................131
3.8.3 Introduction of Test Domain....................................................................133
IV CASE STUDY: DEVELOPMENT PROCESS FOR AN AVIONICS SYSTEM..135
4.1 Background......................................................................................................135
4.2 Applying the APDL Approach ........................................................................138
1.1.1 Customer Needs .......................................................................................138
4.2.1 Initial FRs, ICs, and DPs..........................................................................139
4.2.2 Decomposition and Zigzagging ...............................................................141
4.2.2.1 Decomposition and Zigzagging: 1st and 2nd Level...............................141
vi
4.2.2.2 Decomposition and Zigzagging: 3rd Level...........................................149
4.2.2.3 Decomposition and Zigzagging: 4th Level...........................................154
4.2.2.4 Decomposition and Zigzagging: 5th Level...........................................157
4.2.2.5 Finishing Detail Design .......................................................................166
4.2.3 Bottom-Up Completion ...........................................................................166
4.3 System Architecture.........................................................................................167
4.4 Discussions and Conclusion ............................................................................167
V CONCLUSIONS AND SUGGESTIONS FOR FUTURE WORK........................169
5.1 Conclusions......................................................................................................169
5.2 Suggestions for Future Research .....................................................................173
REFERENCES ................................................................................................................175
APPENDIX A NEW THEOREMS .................................................................................182
APPENDIX B CASE STUDY – SYSTEM ARCHITECTURE .....................................183
APPENDIX C CASE STUDY – SC HIERARCHY .......................................................184
vii
ABSTRACT
In this research, different design methodologies and system/product development
lifecycle models are studied. A new product development lifecycle model, the Axiomatic
Product Development Lifecycle (APDL) model, with a robust structure to develop and
capture the development lifecycle knowledge, is proposed and its use is discussed. The
proposed approach is based on the AD method developed by Suh (1991); hence it inherits
the benefits of applying the Axiomatic Design to product development. The Axiomatic
Design method, in this research, is extended to cover the whole product development
lifecycle including the test domain and new domain characteristic vectors are introduced
such as the input constraint and system component vectors. The APDL model also
provides more guidance than the AD method during the customer need mapping and
during the design decomposition process.
The APDL model helps develop, capture and present both the big-picture and
detail view of the product development knowledge, including design and requirement
traceability knowledge. The objectives of APDL are to guide the designers, developers,
and other members of a transdisciplinary product development team throughout the
development effort as well as to help capture, maintain, and manage the product
development knowledge.
The APDL model aims to improve the quality of the design, requirements
management, change management, project management, and communication between
stakeholders as well as to shorten the development time and reduce the cost. This
research also provides suggestions and recommendations for utilizing different analysis
and synthesis methodologies along with the proposed lifecycle model to improve the
product quality and customer satisfaction.
viii
LIST OF TABLES
2.1 – Some of the existing design process models [Evbuomwan, et al., 1996]................ 18
2.2 – Axiomatic Design Domain Contents ....................................................................... 36
2.3 – Axiomatic Design Definitions [Suh, 2001] ............................................................. 37
2.4 – Characteristics of design domains for various designs [Suh, 2001] ........................ 39
2.5 – Sample Master Design Matrix ................................................................................. 47
2.6 – Junction Types ......................................................................................................... 52
2.7 – Advantages and Disadvantages of QFD .................................................................. 68
2.8 – DfX Methods and Corresponding FRs .................................................................... 75
2.9 – Software tools for design and development lifecycle .............................................. 85
3.1 – APDL Domain Contents .......................................................................................... 90
3.2 – CN Attributes ........................................................................................................... 98
3.3 – FR Attributes.......................................................................................................... 102
3.4 – Quality Factors for Baselined FR Set .................................................................... 103
3.5 – Template for mapping CNs to FRis and ICs.......................................................... 105
3.6 – Template for CN to FRi and IC Mapping Explanation.......................................... 106
3.7 – DP Types................................................................................................................ 108
3.8 – Template for FR-DP Decomposition..................................................................... 109
3.9 – Sample Design Matrix (D): (a) Tabular format, (b) Equation format ................... 110
3.10 – Template for Design Matrix Element Explanation.............................................. 111
3.11 – Template for DP-IC Allocation ........................................................................... 113
3.12 – Template for DP-IC Allocation Description........................................................ 113
3.13 – System Physical Element Descriptions................................................................ 114
3.14 – SC-PV Mapping Rules......................................................................................... 117
3.15 – Template for DP-SC-PV Mapping....................................................................... 118
3.16 – Template for DP-SC Mapping ............................................................................. 118
3.17 – FTC Mapping Table Template............................................................................. 119
3.18 – FTC and CTC Template....................................................................................... 120
ix
3.19 – CTS Mapping Table Template............................................................................. 121
3.20 – Comparison of Constraint Management and Allocation Approaches ................. 131
4.1 – Customer Needs (CNs) .......................................................................................... 139
4.2 – FRis and ICs mapped from the CNs ...................................................................... 140
4.3 – CN to FRi and IC Mapping Explanation ............................................................... 141
4.4 - FR1 Description...................................................................................................... 142
4.5 – FR-DP Decomposition: Level 1 and 2................................................................... 143
4.6 – Design Matrix Element Explanations .................................................................... 144
4.7 – DP-IC Allocations for 2nd Level DPs..................................................................... 147
4.8 – DP-IC Allocation Descriptions .............................................................................. 147
4.9 – DP-SC-PV Mapping: Level 1 and 2 ...................................................................... 148
4.10 – DP-SC Mapping................................................................................................... 149
4.11 – FR-DP Decomposition for FR-DP 1.5................................................................. 150
4.12 – Level 3 Master Design Matrix Element Explanations......................................... 152
4.13 – DP-IC Allocation for 2nd Level DPs .................................................................... 152
4.14 – DP-IC Allocation Descriptions ............................................................................ 152
4.15 – DP-SC-PV Mapping: Level 1 and 2 .................................................................... 153
4.16 – DP-SC Mapping for DP 1.5 and SC 1.4 .............................................................. 153
4.17 – FR-DP Decomposition for FR-DP 1.5.1.............................................................. 154
4.18 – Level 4 Master Design Matrix Element Explanations......................................... 156
4.19 – DP-IC Allocation for 2nd Level DPs .................................................................... 156
4.20 – DP-IC Allocation Descriptions ............................................................................ 156
4.21 – DP-SC-PV Mapping for FR-DP 1.5.1 ................................................................. 157
4.22 – DP-SC Mapping for DP 1.5 and SC 1.4 .............................................................. 157
4.23 – FR-DP-PV Decomposition for FR 1.5.1.1........................................................... 158
4.24 – Level 4 Master Design Matrix Element Explanations......................................... 159
4.25 – DP-IC Allocation for 2nd Level DPs .................................................................... 160
4.26 – DP-IC Allocation Descriptions ............................................................................ 160
4.27 – DP-SC-PV Mapping for FR-DP 1.5.1.2 .............................................................. 163

x
4.28 – DP-SC Mapping for DP 1.5.1.2 and SC 1.4.1.2 (1)............................................. 164
4.29 – DP-SC Mapping for DP 1.5.1.2 and SC 1.4.1.2 (2)............................................. 165
4.30 – CTS Mapping Table – Level 5............................................................................. 165
4.31 – CTC 1.4.1.2.1.2.................................................................................................... 166
xi
LIST OF FIGURES
2.1 – Design process model by Ertas and Jones (1996).................................................... 16
2.2 – Axiomatic Design Domains..................................................................................... 36
2.3 – The decomposition template from Hintersteiner (1999).......................................... 48
2.4 – A sample tree diagram for the FR and DP hierarchies ............................................ 51
2.5 – A sample module-junction diagram [Lee, 1999] ..................................................... 52
2.6 – Flow diagram representation of Equations i and ii .................................................. 53
2.7 – AD with Other Quality Tools [Mohsen and Cekecek, 2000] .................................. 58
2.8 – Other Design Tools within AD Framework [ADSI]................................................ 59
2.9 – S-field....................................................................................................................... 61
2.10 – House of Quality Matrix ........................................................................................ 66
2.11 – Cascading QFD Matrixes or the Four-Phase QFD Model..................................... 67
2.12 – P-Diagram format .................................................................................................. 70
2.13 – Tracing problem source in AD SA [Nordlund, 1996] ........................................... 79
3.1 – APDL Domains and Characteristic Vectors ............................................................ 89
3.2 – APDL Process.......................................................................................................... 93
3.3 – System Physical Architecture Template ................................................................ 114
3.4 – A sample DSM [Browning, 2001] ......................................................................... 127
4.1 – Screen Locking Mechanism: Alternative 1............................................................ 161
4.2 – Screen Locking Mechanism: Alternative 2............................................................ 162
1
CHAPTER I
I INTRODUCTION
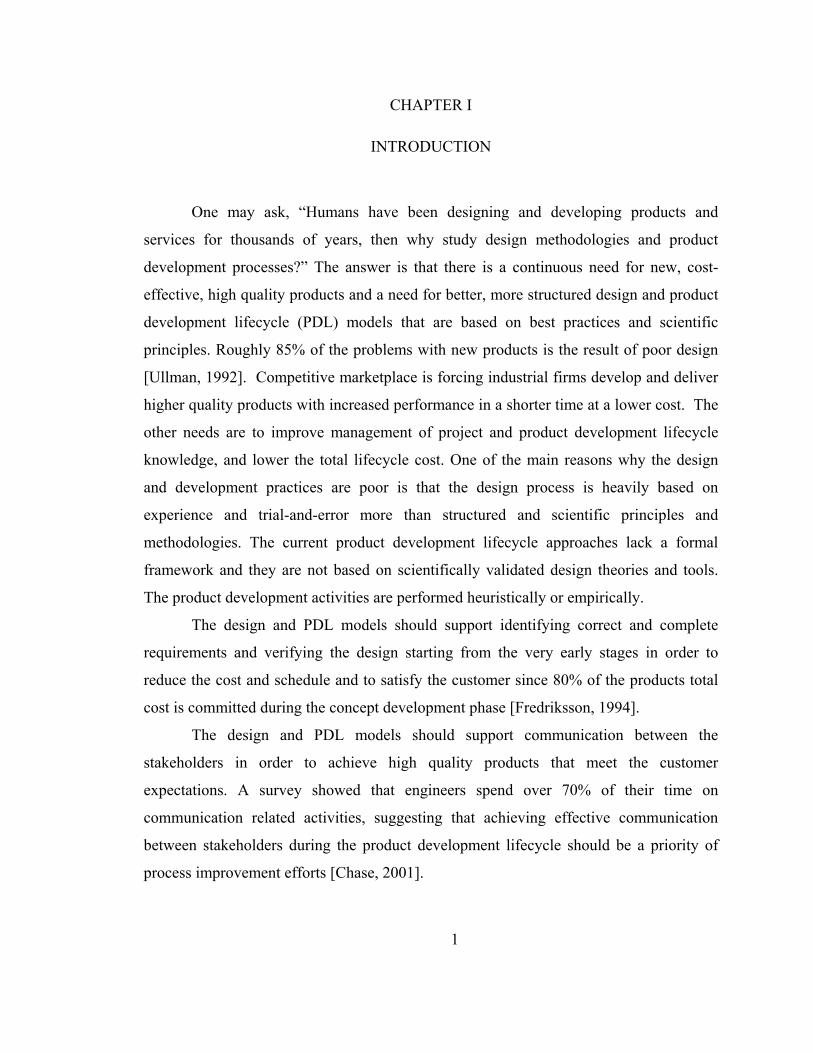
One may ask, “Humans have been designing and developing products and
services for thousands of years, then why study design methodologies and product
development processes?” The answer is that there is a continuous need for new, cost-
effective, high quality products and a need for better, more structured design and product
development lifecycle (PDL) models that are based on best practices and scientific
principles. Roughly 85% of the problems with new products is the result of poor design
[Ullman, 1992]. Competitive marketplace is forcing industrial firms develop and deliver
higher quality products with increased performance in a shorter time at a lower cost. The
other needs are to improve management of project and product development lifecycle
knowledge, and lower the total lifecycle cost. One of the main reasons why the design
and development practices are poor is that the design process is heavily based on
experience and trial-and-error more than structured and scientific principles and
methodologies. The current product development lifecycle approaches lack a formal
framework and they are not based on scientifically validated design theories and tools.
The product development activities are performed heuristically or empirically.
The design and PDL models should support identifying correct and complete
requirements and verifying the design starting from the very early stages in order to
reduce the cost and schedule and to satisfy the customer since 80% of the products total
cost is committed during the concept development phase [Fredriksson, 1994].
The design and PDL models should support communication between the
stakeholders in order to achieve high quality products that meet the customer
expectations. A survey showed that engineers spend over 70% of their time on
communication related activities, suggesting that achieving effective communication
between stakeholders during the product development lifecycle should be a priority of
process improvement efforts [Chase, 2001].
INTRODUCTION
2
This research seeks to improve the effectiveness of product development lifecycle
by proposing a structured PDL model. The proposed model aims to improve
requirements and change management, quality of design, project management, and
communication between stakeholders as well as to improve the quality of the product.
This research also provides suggestions and recommendations for utilizing different
analysis and synthesis methodologies along with the proposed lifecycle approach to
improve the product quality and customer satisfaction.
The proposed PDL model, called the Axiomatic Product Development Lifecycle
(APDL), is based on the Axiomatic Design (AD) method developed by Suh (1991);
hence it inherits all the benefits of applying AD to product design. The underlying
hypothesis of AD is that there exist fundamental principles that govern good design
practices [Suh, 2000]. The AD begins with two axioms, the independence and the
information axioms. The axioms provide guidelines for design engineers. Dr. Suh
provides a number of theorems and corollaries that are developed from the axioms to
facilitate their use.
The AD method provides a robust structure and systematic thinking to support
design activities, however, it does not support the whole product development lifecycle.
The same logic and scientific thinking can be used and extended to capture, analyze, and
manage the product development lifecycle knowledge.
The structural differences between the APDL model and the AD are the addition
of the test domain to include the test activities and knowledge as well as the addition of
two characteristic vectors to better manage input constraints and system components. The
system architecture concept of the AD method is also extended to include the system
physical architecture. The APDL model also provides more guidance during the customer
need mapping and during the design decomposition process.
The objectives of APDL are to guide the designers, developers, and other
members of a transdisciplinary product development team throughout the development
effort as well as to help managers capture and manage the knowledge produced by the
development effort.
3
The APDL, like the AD method, forces careful consideration of functional
interactions, rather than relying on developer’s intuition and unstructured design
documentation. This is particularly beneficial to large or complex systems, where the
number of functional requirements makes it essentially impossible for single engineer,
even for a development team to manage and communicate the necessary amount of
functional, design, and process information.
Traditional design documentation is typically created at the end of the design
project, and often represents the final product and omits discussion of the reasoning
behind design decisions. The documentation created as a result of applying the APDL
model will overcome this problem and facilitate the communication between the
stakeholders including design teams.
The terms “product” and “system” are used interchangeable in this research. The
proposed model can be applied to design and development of systems, subsystems,
processes, software, services, or organizations.
In the remaining of this section, first I will list the needs of the product and
service industries or benefits that they are seeking as far as design methodologies and
development lifecycle approaches are concerned. Next, I will list the objectives of this
research. Then, I will explain the research method used. Finally, I will describe the scope
and the contribution of this research and I will give an overview of this dissertation.
1.1 Needs
The main motivation of this research comes from the finding that the current
product development lifecycle practices are both ineffective and inefficient, consequently
failing to deliver an optimal result in many aspects. Also, there is a need to reduce lead-
time, cut cost, increase quality of design, increase product performance, and improve
product development lifecycle management.
The reasons for the above finding are explained by listing some of the design and
development lifecycle related needs and problems expressed by the design engineers, the
test engineers, the managers, and the other members of product development teams from

4
the author’s own experience and from the literature. The list contains only the needs and
problems that will be addressed by this dissertation.
1) The design phase, especially the early design phase (conceptual design) of a
development lifecycle has a profound affect on the product quality and
productivity. However, the current PDL models do not provide systematic
procedures to help the designers develop good designs or find innovative design
solutions in shorter time without much try-and-error cycles. Resources and time
are committed for poorly developed designs due to lack of specific principles and
rules for design generation and identifying the quality of the design.
2) The current PDL methodologies and approaches do not really provide a structured
way to connect and analyze different activities and tasks in different phases of the
lifecycle. Therefore, managing and tracking development activities are very
difficult, and the managers have to depend on experience or only verbal guidance
of the different management techniques and lifecycle methodologies.
3) Sometimes, we see ourselves using the same design solution for a different
project; however, it is very cumbersome to dig out the old documents to find what
the details were for the design solution. Even if we find the old document, the
description may not be complete or the format of the solution description could be
different.
Even with advanced design tools, the design process typically produces a
description of the desired artifact, but leaves little or no indication of the design
rationale. We end up knowing what was designed, but often have no idea why it is
the way it is, what motivated the particular design, what alternatives were
considered and rejected, etc.
4) From time to time, we want to look at what and how we did in a previous project
in order to use the old experience in the new project. However, lifecycle
information, such as the information about requirements, design, components,
test, etc. is not captured properly and not stored in a medium which can provide
easy and structured access to the historical knowledge.
5
5) In industry, design information is normally captured in the form of specifications,
design meeting protocols and models. The models are either physical models
(prototypes, etc.), or abstract models, e.g., drawings or computer models. Such
models (both physical and abstract) only capture information from the physical
domain in the proposed framework. Accordingly, when presented with pure CAD
models, individuals other than the original designer have difficulty determining
the exact functions of each component and problems establishing the functional
relationships between the components.
6) Each design and analysis tool and method requires different types of inputs from
the product development knowledgebase. Each time a design or an analysis tool is
used, the input data has to be collected from product documentation and models
since the data is not structured or not readily available.
1.2 Objectives
The objectives of APDL are to guide the designers, developers, and other
members of a multi-discipline product development team throughout the development
effort as well as to help managers capture and manage the knowledge produced by the
development effort.
1) The proposed model shall use the AD method to improve the quality of the
preliminary design with the use of axioms in order to reduce the random searches
for solutions, to minimize design iterations, and to easily integrate other design
tools and methodologies with AD.
2) The proposed model shall extend the AD method to cover the whole PDL so that
all of the domain entities are developed systematically and the relationships
between the domain entities are identified and documented as well as any
decisions made or assumptions used in developing the domain entities and their
relationships.
3) The proposed model shall provide templates and guidance for documenting the
PDL knowledge to encourage and support sharing and reuse of design and other
domain entities such as test cases so that it is possible to easily search and access
6
the PDL knowledge for analysis, communication, re-engineering, maintenance,
and change impact analysis purposes.
1.3 Research Method
The information gathering for this research was conducted through literature
surveys and over eight years of personal industry experience in product development as a
Mechanical Engineer, Software Engineer, Technical Leader, and Project Manager. The
information gathered was used to analyze the existing design and product development
methodologies and practices and to develop a new product development lifecycle model.
The effectiveness and validity of the proposed approach can be tested and
validated through three ways: 1) conducting analysis from the historical perspective, 2)
performing case studies to provide both supporting and counter examples, and 3)
conducting design experiments.
The first approach is to make observations of previous designs, and compare the
results of the work with the expected output predicted from the claims of the proposed
approach. This approach requires extensive studies for large numbers of examples, some
of which have been done based on the proposed approach and others of which have been
done differently. The second approach can be done in two ways: 1) analyze the system
designed without using the proposed approach and prove it could have been done better
with the proposed approach, and 2) design a new system using the proposed approach
and show better/worse performance over competing approaches. The third approach is to
assign the same task to two different design groups, only one of which is familiar with
the proposed approach and compare the results.
In this research, the second method is used to validate the proposed approach. The
first method is not appropriate since a new approach is being proposed and there is no
example of its implementation. The third method is not feasible since it is very difficult to
setup a design experiment that can isolate and only investigate the development lifecycle
approach used. There are many other factors that can affect the performance of the design
groups.
7
The first approach of the second method is the most appropriate for this research
and it would be good enough to prove that the proposed approach does better than the
current approaches in the areas mentioned in the needs section.
1.4 Scope and Contribution of the Thesis
While so many product development lifecycle and design methodologies have
been developed for many decades and so much work has been done examining and
improving the existing methodologies, this thesis is unique in the following aspects:
• Extending the Axiomatic Design method to cover the whole product
development lifecycle by adding the test domain with the component test
and functional test cases characteristic vectors.
• Adding input constraint arrays into functional domain to manage, track,
and allocate the input constraints through the decomposition and
zigzagging process. Adding a new mapping matrix to map the customer
needs to the functional requirements and input constraints and another
matrix for capturing the decomposition and allocation of the ICs.
• Adding system components array into the physical domain to capture the
physical architecture and the relationships between the system components
and the other domain entities. The process variables are tied to the system
components instead of design parameters.
• The system architecture concept of AD is extended to include the system
component hierarchy.
• Providing full requirement traceability in both directions between the
product development domains.
• Capturing and documenting the details of the product development
knowledge in a systematic manner.
• Guiding the developer to first perform a top-down analysis to develop the
functional requirements, design solutions, and system components, and
then a bottom-up analysis to complete process variables and test cases.
8
1.5 Dissertation Overview
The following summarizes the content of each chapter in this dissertation.
Section 2 presents current practices and the results of literature survey on design
methodologies and development lifecycle. This section provides the necessary
background to understand the current problems and opportunities for improvement.
Section 3 explains the Axiomatic Product Development Lifecycle (APDL) model
in detail. This section also presents the benefits of APDL.
Section 4 presents the case study where the APDL model is applied to further
explain the usage of the model and to show the benefits of it.
Finally, Section 5 concludes the dissertation and discusses some future research
ideas.
9
CHAPTER II
II PRODUCT DEVELOPMENT LIFECYCLE
AND DESIGN METHODOLOGIES
This chapter is devoted to explain current practices and literature survey for
product development lifecycle models and design methodologies. The scope of the
literature survey was to learn the theoretical research about design and development
lifecycle as well as to learn what is currently practiced in the industry. The objective is to
find the needs that have not been addressed at all or not to the satisfaction of the industry.
Another objective was to find best practices in both theoretical research and current
practices to include in the new product development lifecycle model.
One simple definition of design is that a design process converts a need –
expressed as an abstract concept in terms of functionality – into a product (system,
device, service, or process) satisfying that need. This process is a complex one that
requires the designer to exercise initiative and creativeness as well as deploy a wide range
of skills, methodologies, and expertise in attaining a solution.
Different terms are being used in the literature and in the industry to describe the
process of product design and development such as “design process”, “product
development lifecycle”, “product development process”, and “engineering design
process.”
Product life begins when the product need is conceived and ends when the
product is no longer available for use, and may consist of phases such as need
assessment, requirement analysis, design (preliminary and detail design), production,
testing, deployment, operation and service and product end-of-life disposition (e.g.,
recycle and disposal).
The concerns and requirements for each phase and each aspect of the product life
should be considered during the requirement analysis and design phases so that the
design satisfies the significant these concerns and requirements. The Life-cycle
engineering (LCE) approach is developed as a decision-making method that considers
PRODUCT DEVELOPMENT LIFECYCLE
AND DESIGN METHODOLOGIES
10
performance, environmental and cost requirements for the duration of a product
[Wanyama, Ertas, Zhang, and Ekwaro-Osire, 2003].
Product development lifecycle (PDL) is a sub-set of the product life; starts with
need assessment and ends when the product or the product prototype is accepted by the
user or the product sponsor. The term “product development lifecycle” is used in this
research instead of “design process” because the design activity is just a part of the
product development lifecycle. The other activities that are part of the product
development lifecycle are quality control, configuration management, project
management, etc.
The terms “product development” or “design” can be defined in a variety of
different ways depending on the specific context and /or discipline of interest. They can
mean design and development of products, systems, processes, organizations, or software
architecture. However, any development process, whether the output is a product, service,
process, organization schema, business plan, or software, consists of the following six
steps:
1) Understanding the customers' needs
2) Defining the problem(s) that must be solved to satisfy these needs
3) Creating and selecting a solution(s)
4) Analyzing and optimizing the proposed solution as well as verifying the
solution against the customers' needs
5) Implementing the proposed solution (either a prototype or the final product)
6) Checking the resulting product against the customers’ needs
Some design methodologies, such as Axiomatic Design and Concurrent Design,
deals with most of the product development lifecycle activities whereas the other
methodologies, such as Robust Design and TRIZ, deal with the process of creating and
selecting a solution(s) to a stated need or analyzing and optimizing the proposed solution.
A product development lifecycle model depicts the significant phases or activities
of a product development from conception until delivery as well as the order in which
they are applied. The main objective of any product development lifecycle approach is to
11
provide designers and other development team members with notations and structures for
development activities such as analysis, synthesis, evaluation, and construction.
Engineers change the world and in turn they are affected by the very changes that
they created [Voland, 2004]. In the last 300 years since the start of the Industrial
Revolution, science and technology have reached an amazing level at an ever-
accelerating rate. The second revolution in the industrial environment started in the last
decades with the introduction of the automation and information technologies. These
technologies have been used to overcome the pressure caused by the increasing demand
on product customization (i.e. automobile, computers, etc.), on shorter and dependable
order delivery, on lowering manufacturing cost, on improving the quality and reliability
of the products, and on reduced product life cycle (i.e. mobile phones, computers).
Another factor that causes pressure is the increased product and process complexity
because more and more systems and products depend on multi-discipline knowledge and
technologies with development teams located in different locations around the country or
the world.
Engineers increasingly focus on the whole life of the product – from conception
of the product idea through its manufacture and use to its disposal – and in order to
satisfy the customers’ and environmental requirements successfully [Voland, 2004]. One
of the successes of this trend is that 76 percent of the average automobile is recycled,
according to the American Automobile Manufacturers Association. Product life factors
that may need to be addressed during product design include:
1. Testability/Inspectability
2. Reliability/Availability
3. Maintainability/Serviceability
4. Environment Friendliness
5. Upgradeability
6. Installability
7. Safety and Product Liability
8. Human Factors
12
Since the eighties, the performance of design projects has dramatically improved
due to the Concurrent Engineering approach [Ettlie, 1995]. Traditional functional barriers
have been broken down and project members have started focusing on concurrent
execution of all design tasks. The approach emphasizes that decisions made by marketing
will affect design, purchasing, or production decisions, and such decisions should not be
made in isolation from each other. Accordingly, engineering researchers have designed
and applied tools such as Design for Assembly (or DFX), Failure Mode and Effect
Analysis (FMEA), and Quality Function Deployment (QFD) in order to guide project
members to integrate the decisions made by various disciplines [Ulrich and Eppinger
2000]. Similarly, management researchers have highlighted the role of multi-disciplinary
teams in easing the exchange of a great amount and variety of information between
project members [Oosterman, 2001].
However, despite the advancements in science and technology, we are surrounded
by many technological and societal problems that have been created through poor design
practices or development lifecycle management [Suh, 2000]. Effective PDL models that
are based on scientific design theories and tools are becoming more and more important
in the industry for improving quality of products as well as reducing lead-times and costs
[Tate and Nordlund, 1996]
Brenda Reichelderfer of ITT Industries reported on their benchmarking survey of
many leading companies, "design directly influences more than 70% of the product life
cycle cost; companies with high product development effectiveness have earnings three
times the average earnings; and companies with high product development effectiveness
have revenue growth two times the average revenue growth."
There are major and minor design problems. All design problems cost money,
limit the usefulness of products, or delay the introduction of new products. The warranty
cost of some products is a significant percent of the selling price. Poorly designed
products and services requires maintenance and wastes valuable time and resources,
while some failures result in loss of property and even lives. In addition, development
13
projects may suffer from major delays, cost overrun, and in some cases total failures due
to poor designs [Suh, 2000].
Typical new product development projects undergo many cycles of the "design-
build-test-redesign-build-test" cycle. With this approach, requirements are analyzed and
decomposed while staying in the functional domain and the design decisions are made
quickly based on experience and empirical data of designers and engineers to reach the
80% completion level relatively quickly. However, later the development team faces the
consequences of poor requirements and design and considerable amount of time has to be
spent on rework instead of doing it right the first time. This is a result of the philosophy
that commits a lot of resources and time to a design that is not thoroughly developed and
communicated by the development team. Because of these conditions, companies spend
an order of magnitude more money and time in product development than necessary
[ADSI].
Many engineers have been designing their products (or process, systems, etc.)
iteratively, empirically, and intuitively, based on years of experience, cleverness, or
creativity, and involving much trial and error. This approach is very haphazard (i.e.,
lacking a definite plan, purpose, or pattern) and overly time consuming. Since it is
haphazard, experienced gained from such practices cannot be easily reapplied to other
similar development efforts. Although experience is important since it generates
knowledge and information about practical design, experiential knowledge alone is not
enough, as it is not always reliable, especially when the context of the application
changes. Experience must be supported by systematic knowledge of design [Suh, 2001].
The design documentation, even with advanced design tools, describes the final
design, but leaves little or no indication of the design rationale. We end up knowing what
was designed, but often have no idea why it is the way it is, what motivated the particular
design, what alternatives were considered and rejected, etc.
Documentation is a lot of work, and the value in doing it typically accrues to
someone else: the designer knows how the artifact works and why, so writing it all down
typically provides little personal benefit. It's those who come after who get the benefit,
14
hence the feeling among designers that rationales are more trouble than they are worth.
According to Söderman (1998), in most cases good design representations for large
systems either do not exist or they are not used to their full potential.
It is extremely important to have a design method that can produce a very good
system design description as a by-product of following the method in order to trace the
impact of design decisions on both local (component or subsystem) and system-wide
levels, since the real goal of the design effort is to optimize the performance of the
system and this may not necessarily mean optimizing the performance of each
component.
I will explain, in detail, the product development lifecycle and activities involved
in Section 2.1. Since the AD method is used as the base for this research, a detailed
description of Axiomatic Design is provided in Section 2.2. In Sections 2.3 and 2.4, some
other design methods are presented and they are compared and contrasted with the AD
method. Finally, I will touch on the relationship of design with creativity and with
computers.
2.1 Product Development Lifecycle
Since the early 1960s, many versions of product development lifecycle (PDL)
models (or system development lifecycle models, or design process models) have been
developed by authors. Some models are very brief with only three separate stages
(analysis-synthesis-evaluation) whereas others are decomposed into various
subtasks/phases/activities that are to be performed by the development team. Sometimes,
the discipline involved and the choice of the terms used determines the differences
between models.
A product development lifecycle model depicts the significant phases or activities
of a product development from conception until delivery as well as the order in which
they are applied. The main objective of any product development lifecycle approach is to
provide designers and other development team members with notations and structures for
development activities such as analysis, synthesis, evaluation, and construction in order
to produce high quality products that satisfy the customer needs.
15
Suh (1990) sees design as an interplay between what we want to achieve and how
we want to achieve it and defines the “design process” in terms of the four design
domains – customer, functional, physical, and process – and mapping between these
domains.
Ullman (1992) describes the “product lifecycle” (not product development
lifecycle) consisting of six phases; 1) specification development/planning, 2) conceptual
design, 3) product design, 4) production, 5) service, and 6) product retirement. The first
three phases constitute the “design process.” Ullman (1992) also recommends that the
last three phases of the product lifecycle should be considered during the “design
process”.
Ertas and Jones (1996) uses the term “design process” and defines this term as
“…begins with an identified need and concludes with satisfactory qualification and
acceptance testing of the prototype” and presented in Figure 2.1.
Ulrich and Eppinger (2000) use the name “product development process” and
define this process as “…the sequence of steps or activities which an enterprise employs
to conceive, design, and commercialize a product.”
The US Department of Defense (DOD) Instruction 5000.2 in Final Coordination
Draft, April 2000, describes the “project development lifecycle” as a series of acquisition
milestones and phases – 1) concept and technology development, 2) system development
and demonstration, 3) production and deployment, and 4) support.
Voland (2004) uses the name “the engineering design process” and decomposes
this process into five stages; 1) need assessment, 2) problem formulation, 3) abstraction
and synthesis, 4) analysis, and 5) implementation.
In the software discipline, many PDL approaches have been developed and have
been in use for decades. Some of the well-known PDLs are 1) Waterfall, 2) Spiral, 3)
Incremental and Iterative, and 4) Rapid prototyping [A Survey of System Development
Process Models, 1998].
16
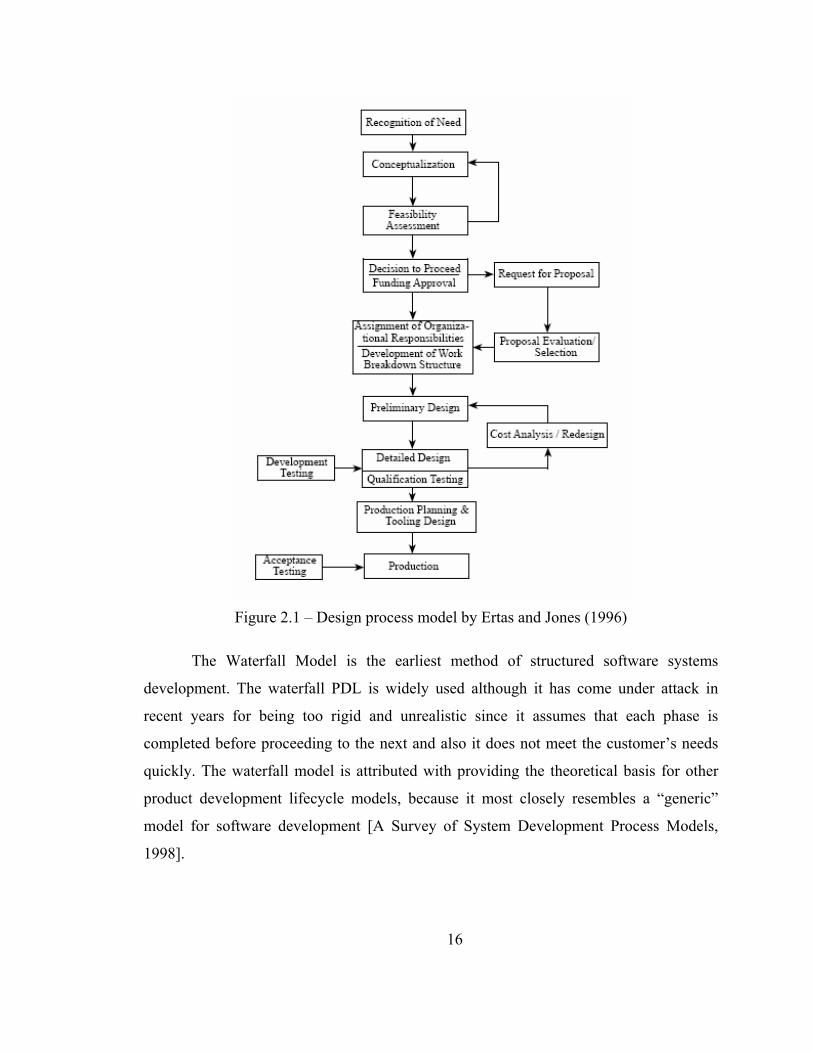
Figure 2.1 – Design process model by Ertas and Jones (1996)
The Waterfall Model is the earliest method of structured software systems
development. The waterfall PDL is widely used although it has come under attack in
recent years for being too rigid and unrealistic since it assumes that each phase is
completed before proceeding to the next and also it does not meet the customer’s needs
quickly. The waterfall model is attributed with providing the theoretical basis for other
product development lifecycle models, because it most closely resembles a “generic”
model for software development [A Survey of System Development Process Models,
1998].
17
The “production” phase mentioned in some PDLs may not be necessary if
products are created in limited quantities.
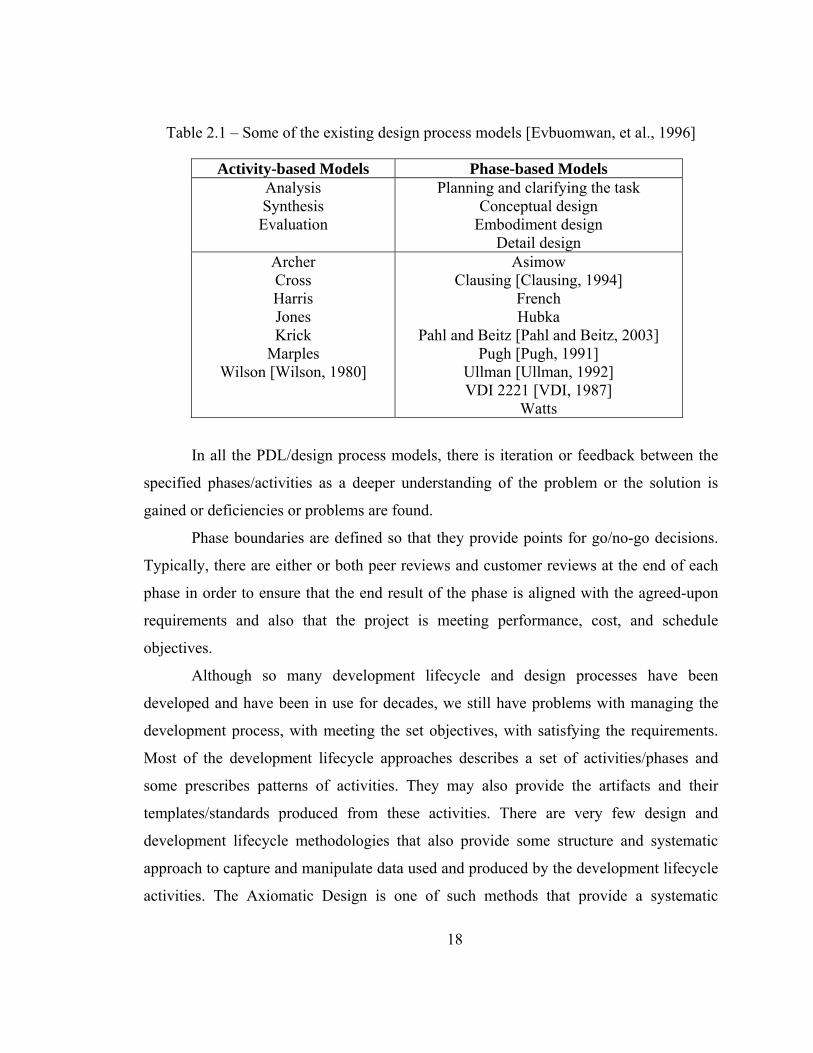
The PDL models can be divided into two categories: activity-based and phase-
based [Evbuomwan, Sivaloganathan, and Jebb, 1996] as presented in Table 2.1.
The activity-based models present the PDL as repeated iterations of three
activities: analysis, synthesis, and evaluation. These activities are defined as [Jones,
1962]:
• Analysis: Deals with understanding the problem and generating the
requirement specifications.
• Synthesis: Deals with generating design solutions and choosing the an
ideal design solution.
• Evaluation: Deals with verifying the design solution against the
requirement specifications and constraints.
The phase-based models present the PDL in terms of sequential phases and tend
to emphasize the progression of the design implementation – physical embodiment [Tate,
1999]. In the model of Pahl and Beitz, the phases of the PDL are described as [Pahl and
Beitz, 2003]:
• Planning and clarifying the task: Suitable product ideas created and
selected based on the market, the company, and the economy. Then, the
requirement specifications and constraints are developed.
• Conceptual design: The principle design is developed in this phase by
identifying the essential problems, establishing the function structure,
searching for working principles and working structures and finally
evaluating the design against the technical and economic criteria.
• Embodiment design: The preliminary layout is developed and preliminary
parts list and production and assembly documents are created in this
phase.
• Detail design: The production and operation documents are created by
elaborating the detail drawings and part lists.
18
Table 2.1 – Some of the existing design process models [Evbuomwan, et al., 1996]
Activity-based Models Phase-based Models Analysis Synthesis Evaluation
Planning and clarifying the task Conceptual design
Embodiment design Detail design
Archer Cross Harris Jones Krick
Marples Wilson [Wilson, 1980]
Asimow Clausing [Clausing, 1994]
French Hubka
Pahl and Beitz [Pahl and Beitz, 2003] Pugh [Pugh, 1991]
Ullman [Ullman, 1992] VDI 2221 [VDI, 1987]
Watts
In all the PDL/design process models, there is iteration or feedback between the
specified phases/activities as a deeper understanding of the problem or the solution is
gained or deficiencies or problems are found.
Phase boundaries are defined so that they provide points for go/no-go decisions.
Typically, there are either or both peer reviews and customer reviews at the end of each
phase in order to ensure that the end result of the phase is aligned with the agreed-upon
requirements and also that the project is meeting performance, cost, and schedule
objectives.
Although so many development lifecycle and design processes have been
developed and have been in use for decades, we still have problems with managing the
development process, with meeting the set objectives, with satisfying the requirements.
Most of the development lifecycle approaches describes a set of activities/phases and
some prescribes patterns of activities. They may also provide the artifacts and their
templates/standards produced from these activities. There are very few design and
development lifecycle methodologies that also provide some structure and systematic
approach to capture and manipulate data used and produced by the development lifecycle
activities. The Axiomatic Design is one of such methods that provide a systematic
19
approach to design by introducing some axioms and theorems, and also concepts such as
domains, zigzagging, and design matrices.
The main phases of a product development lifecycle are (i) customer need
assessment, (ii) requirement analysis, (iii) design, (iv) implementation, and (v) test and
evaluation. There are some activities that are performed throughout the development
lifecycle such as requirement management, change management, quality assurance, and
project management (or product development lifecycle management). Requirement
management covers the customer need assessment and requirement analysis phases. The
phases and the aforementioned activities are explained in detail in the following sections.
2.1.1 Requirement Management
Requirements management can be defined as the process of eliciting,
documenting, organizing, and tracking changing requirements and communicating this
information across the stakeholders [Davis and Leffingwell, 1999]. Requirement
Management covers the phases of customer need assessment and requirement analysis as
well as requirements management activities that are carried out throughout the product
development lifecycle.
Requirements are features, functions, capabilities, or properties that a system must
possess. Requirements state the customer/end-user needs and solution constraints. The
traditional way of distinguishing requirements from design is that the requirements
represents what the system is supposed to have/do (what’s) whereas the design is how the
system will accomplish the what’s (how’s).
The IEEE Standard Glossary of Software Engineering Terminology (IEEE Std.
610.12-1990) defines five types of requirements in addition to functional requirements:
performance requirements, interface requirements, design requirements, implementation
requirements, and physical requirements.
One of the most important aspects of the product development lifecycle is to
develop an understanding of the true needs of the customer that must be satisfied by the
product [Hintersteiner, 2000]. The requirements are the foundation of a system and form
the basis for the rest of the product lifecycle activities such as design, manufacture, test,
20
and operation. Consequently, each requirement has a cost impact on the system. The
requirements are very useful for contractual purposes because they provide a checklist of
what the implementer must deliver.
It is vitally important for product development team to understand the impact of
changing customer needs on the requirements and rest of the product development
lifecycle activities and to manage them systematically since requirements often change
during the product development cycle [Hintersteiner, 2000; Do, 2004].
There are three main objectives of requirements management; one is to capture
the requirements right, the second one is to manage changing requirements, and the third
one is to align the system development lifecycle activities with the requirements to make
sure that the requirements are met and gold plating does not happen [Gumus and Ertas,
2004a; 2004b]. Achieving the first objective depends on the structure and effectiveness of
the requirements gathering and validation methodology whereas achieving the second
and third objectives depends on the ability to establish and maintain the relationships
among the elicited customer needs, the requirements and constraints derived from these
needs, and the subsequent artifacts in which these requirements are realized.
Successful Requirement Management requires use of requirement attributes that
are defined by the development and the management teams according to the project’s and
organizational needs. These attributes are used to plan, communicate and track the system
development activities throughout the lifecycle [Davis and Leffingwell, 1999]. Some
sample attributes are: customer benefit (ranking of the relative importance of the
requirements to the customer), effort (effort estimation for each requirement), priority
(determines which requirement is incorporated into the system first), verification method
(how to verify if the requirement is met), and status (approved, designed, tested, etc).
The functional requirements of the design may change dynamically as the
customer needs often change during the product development lifecycle. When there is a
change in the customer needs, it is very important for the product development team to
assess the impact of the change on the functional requirements and in turn on the design
and other activities in the development lifecycle such as manufacturing and testing.
21
Changes in requirements later in the development cycle can have a significant cost
impact on the system, even resulting in project cancellation. While some requirement
changes may be simple to incorporate and not significantly impact other parts of the
system, other changes may affect several parts of the design, often in unpredictable ways
[Hintersteiner, 2000].
Requirements traceability (RT), according to a widely accepted definition, is " the
ability to follow the life of a requirement, in both forwards and backwards direction, i.e.,
from its origins, through its development and specification, to its subsequent deployment
and use, and through periods of ongoing refinement and iteration in any of these phases”
[Gotel and Finkelstein, 1994].
RT is generally practiced in software development lifecycles and in manufacture
of high-reliability products and systems such as medical and aerospace. This important
practice is not widely known and implemented in other design disciplines. However, it
should be a vital part of any system development lifecycle to make sure product
development activities are aligned with the customer needs, in turn functional
requirements and constraints and the final product/service fully satisfies those needs.
Some of the benefits of requirement traceability are providing stakeholders with the
means to show compliance with requirements, maintain system design rationale, and
establish change control and maintenance mechanisms [Ramesh, Powers, Stubbs, and
Edwards, 1995]. In other words, RT is used to ensure continued alignment between
stakeholder requirements and various outputs of the system development process
[Ramesh and Jarke, 2001].
The RT can be divided into two parts [Gotel and Finkelstein, 1994]:
1) Pre-requirements traceability (pre-RT) refers to the ability to describe and
follow those aspects of a requirement's life prior to its inclusion in the
requirement specification document (i.e., System Subsystem Specifications,
Software Requirement Specifications) in both forwards and backwards
directions (i.e., requirements elicitation and refinement).
22
2) Post-requirements traceability (post-RT) refers to the ability to describe and
follow those aspects of a requirement's life that result from its inclusion in the
requirement specification document in both forwards and backwards
directions (i.e., requirements deployment and use).
During requirement allocation, all system components (hardware, software,
human-ware, manuals, policies, and procedures) created at various stages of the
development lifecycle are linked to requirements. Therefore, tracing requirements allows
developers to easily ascertain the impact of any changes.
There are many different views of traceability depending on the stakeholder’s
view of the system. To the customer, traceability could mean being able to ascertain that
the system requirements are satisfied. The developer's concern with traceability may be
how a change in a requirement will affect the system, what modules are directly affected,
and what other modules will experience residual effects. To a test engineer, traceability
means making sure that each requirement is being tested. Full requirements test coverage
is very hard without RT [Davis and Leffingwell, 1999].
Many organizations consider RT as a mandate, a contractual requirement to be
satisfied. Some organizations, on the other hand, view traceability as an important
component of implementing a quality system development and a must for survival
[Ramesh et al., 1995].
RT implementation has many benefits to the development lifecycle, including
providing stakeholder with a clearer picture of the system, and providing a tool to find
out any effect of a requirement change. RT also helps verifies that the user needs are
implemented and tested.
RT ensures customer satisfaction by providing a documented means by which to
prove to the customer that all of the stated requirements are met, not a single requirement
is missed out and that the job is completed. Especially, in the process of developing large,
complex systems with hundreds, or even thousands of requirements, RT is the only tool
to make sure that each and every requirement is achieved.
23
RT also helps in change management and is a fundamental component of quality
assurance and sound requirements management [Davis and Leffingwell, 1999]. Since
requirement changes during development and maintenance phases cannot be avoided, RT
is a must for successful system development and maintenance lifecycle. RT is the only
sure way of finding how the requirement change will affect the system.
Another case where RT data would be very useful is re-engineering or re-design
efforts. RT data, in these cases, allows the developers to understand the system without
the need to re-hire the engineers worked for the initial project or digging through
unstructured documents to find out the requirements, design solution, and the
relationships between those.
The high investment cost and additional time to implement RT could be deterrent
factors. However, RT will reduce the total product lifecycle cost due to development of
higher quality product, and reduction in the maintenance lifecycle cost, and cost of any
re-engineer efforts in the future. RT is also a great tool for managing large, complex
systems and increasing user demands.
2.1.1.1 Customer Need Assessment
Customer need assessment, also called requirement elicitation, is a collaborative
activity involving many stakeholders such as users, developers, and customers as well as
environmental and regulatory bodies. The need assessment approach depends not only on
the diversity and experience levels of these cross-disciplinary sources of requirements,
but also on the diversity of the problem being formulated, which ranges from a fully
understood system to a new, novel one [Christel and Kang, 1992].
The success of the product development lifecycle very much depends on
capturing the true needs of the customer that must be satisfied by the design and proved
by the verification and validation activities. It is therefore essential that a complete, but
minimum set of requirements be established and documented in a requirements
specification (RS) document early in development and the requirements should be
communicated and agreed upon by all stakeholders [Davis and Leffingwell, 1999].
24
In order to achieve highly quality requirements and to assure all no requirements
are missed, first, all the stakeholders should be identified, all the external interfaces
should be defined, and operational concepts or use cases should be developed as well as
systematic models and approaches should be used for both capturing and managing the
system requirements.
Some of the techniques used for identifying customer needs are:
· Structured workshops
· Brainstorming or problem-solving sessions
· Interviews, surveys/questionnaires
· Observation of work patterns
· Observation of the system’s organizational and political environment
· Technical documentation review
· Market analysis
· Competitive system assessment
· Reverse engineering
· Simulations and prototyping
There are several methodologies to gather customer needs, such as Quality
Function Deployment (QFD) [Akao, 1990] and House of Quality [Hauser and Clausing,
1988].
Rzepka (1989) decomposes the customer need assessment process as follows:
i) Identify the relevant parties that are sources of requirements. The party
might be an end user, an interfacing system, or environmental factors.
ii) Gather the “wish list” for each relevant party. This wish list is likely to
originally contain ambiguities, inconsistencies, infeasible requirements,
and untestable requirements, as well as probably being incomplete.
iii) Document and refine the “wish list” for each relevant party. The wish list
includes all important activities and data, and during this stage it is
repeatedly analyzed until it is self-consistent. The list is typically high
25
level, specific to the relevant problem domain, and stated in user-specific
terms.
iv) Integrate the wish lists across the various relevant parties thereby
resolving the conflicts between the viewpoints. Consistency checking is an
important part of this process. The wish lists, or goals, are also checked for
feasibility.
v) Determine the nonfunctional requirements, such as performance and
reliability issues, and state these in the requirements document.
Sometimes, customers express design solutions instead of expressing their needs
or they may not have the skills or background to express themselves in appropriate terms.
In addition, the customers may not be knowledgeable enough to understand what is or is
not feasible from a technological and financial point of view. Therefore, the underlying
needs should be identified whenever customers express a design solution in order not to
limit the creativity in design and limit the design alternatives unnecessarily. Also, a great
deal of effort needs to be spent to understand what the customers actual need, rather than
what they say they need.
Extra attention should be given to identify the "unstated" or "unspoken" needs.
Use cases, observation of work patterns, function tree, or prototyping can be used to
identify the “assumed” or “unspoken” needs.
Research by Leveson (1995) has concluded that the overwhelming majority of
incidents and accidents in large-scale systems tend to result from poorly specified
requirements. Among other observations, Leveson has noted that the requirements
frequently overlooked includes minimizing boredom in cases where repetitive tasks are
necessary, considering involuntary reactions during crisis situations, and understanding
potential ways that the system can be misused. These are just few of the
unstated/unspoken requirements. They were either assumed/implied requirements and not
explicitly documented or treated as low-priority requirements.
Once customer needs are elicited, they then have to be clarified and organized to
start the requirement analysis phase.
26
2.1.1.2 Requirement Analysis
Customer needs should be translated into functional requirements that the design
must satisfy and constraints that bound the design since customers do not necessarily
articulate all of the requirements and they even do not make the distinction between
requirements, constraints, and design solutions [Friedman, Hintersteiner, Tate, and
Zimmerman, 2000].
The requirement analysis phase produces the agreed-upon and baselined
functional requirements, input constraints, and verification requirements from the
customer needs. According to Ertas and Jones (1993):
“If the requirements are too stringent, the project cost will escalate and (possibly)
no supplier will be found that is willing to bid on the contract to provide the item
in question. If the requirements are too lax, the overall system requirements may
not be met, which could lead to dire consequences for the overall project. An
additional problem with loose requirements is that they end up being tightened
with greatly increased cost, difficulty, and ill will between the supplier and the
customer. The importance of establishing valid design requirements is thus
apparent… A good specification will minimize problems of interpretation that
could surface later and result in disagreement with the supplier, possibly with
negative impact on the entire project.” (pp. 14-15)
The system requirements should be documented in a requirement specifications
document and the requirements should be communicated and agreed upon by all
stakeholders [Davis and Leffingwell, 1999]. The design activities and decisions as well as
test activities are based on this requirement specifications document since it tells what the
system is supposed to do. Industrial firms often use Marketing Requirements
Specifications (MRS), software firms use System (or Software) Requirements
Specifications (SRS) and some other forms of requirements specifications documents are
used in other industries to document the requirements for the product (or software,
process, organization, etc.).
27
The requirements should not be defined in terms of existing designs and products;
otherwise, different variations of the product will be developed since the opportunity to
come up with alternative ways of satisfying the underlying need is lost. Therefore, the
focus should be on the functionalities that are desired in a solution and the requirements
should be expressed in terms of these functionalities [Voland, 2004].
A good requirement specification document should provide the following benefits
to the customer, supplier (or contractor) and the members of the development team [IEEE
Std 830, 1998]:
• Establishes the basis for agreement between the customers and the suppliers
on what the system/product should do,
• Reduce the development efforts by reducing rework due to requirement
changes,
• Provides a bases for estimating costs and schedules,
• Provides a baseline for validation and verification, and
• Provides a structured mean for communication.
There are several methodologies to analyze customer needs, such as Quality
Function Deployment (QFD) [Akao, 1990] and House of Quality [Hauser and Clausing,
1988].
2.1.1.3 Current Problems with Requirement Management
There are many problems related to requirements management, including
problems in defining the system scope, in establishing understanding among the
stakeholders, and in dealing with the changing requirements. These problems may lead to
poor requirements and longer lead time, or the cancellation of system development, or
else the development of a system that is later judged unsatisfactory or unacceptable, has
high maintenance costs, or undergoes frequent changes [Christel and Kang, 1992].
Another difficulty is with assuring that the needs are satisfied by the design since
there is usually not a one-to-one relationship between the customer needs and the
functional requirements that the design must satisfy. Therefore, a great deal of effort must
28
be spent by product designers to translate the customer needs into appropriate functional
requirements and input constraints for the design.
The lack of a systematic framework to trace the impact of changing requirements
and design decisions can then lead to poor design with incompatible or even conflicting
functions.
Research by Leveson (1995) has concluded that the overwhelming majority of
incidents and accidents in large-scale systems tend to result from poorly specified
requirements such as missing out specifications of the system behavior during abnormal
operation conditions, untestable specifications, or requirements that are assumed to be
intuitive but never explicitly documented.
The DoD Software Technology Plan [DoD 91] states that “early defect fixes are
typically two orders of magnitude cheaper than late defect fixes, and the early
requirements and design defects typically leave more serious operational consequences.”
Often, the requirement specification documents are thick, not well organized and
mainly a random mixture of customer needs, functional requirements, constraints, design
parameters, process variables, and other requirements such as project or contractual
requirements. One of the main problems with this type of documentation is that
incorporating the design parameters and process variables or any type of design solution
can unnecessarily complicate and constraint the design solution and can kill creativity
and opportunities for innovative solutions.
All these problems with the requirement management ultimately causes the
project to miss the cost-schedule-performance targets because not capturing all the
requirements in a structured manner results in these specific problems:
• Increase cost and schedule: Effort is spent during design and implementation
trying to figure out what the requirements are.
• Decrease product quality: Poor requirements cause the wrong product to be
delivered or the scope is reduced to meet schedule or cost constraints.
29
• Increase maintenance effort: Lack of traceability increases the effort to
identify where changes are required, especially as knowledgeable personnel
leave.
• Create disputes with the customer/client: Ambiguity causes differences in
expectations and contractual issues.
2.1.2 Design
The design phase is the phase during which the detail design of the system,
subsystem, components, and interfaces are created, documented, and verified to satisfy
the established requirements.
If the product to be design is a complex one, there could be two sub-phases of
design (i) preliminary design, and (ii) detail design. In the preliminary design sub-phase
design alternatives are created and one of them would be selected for further analysis,
optimization, and verification in the detail design sub-phase.
Some of the activities included in the preliminary design are the search for
commercial-off-the-shelf (COTS) components, inclusion of company standards,
determination of make/buy decisions, acceptance and test strategy, and use of trade
studies. These activities, combined with the requirements from the previous phase, form
the basis for several outputs, such as the subsystem specifications, system interfaces, test
plans, system concepts (prototypes), and implementation concepts. The outputs of the
preliminary design sub-phase are discussed at the preliminary design review (PDR) in
order to make a go/no-go decision to continue on to the detailed design phase [LAI,
1998].
The detail design sub-phase includes completion of system or product design,
production/manufacturing planning, prototype development, and final design testing and
evaluation. The output from this phase is a set of implementation-ready design
documentations and plans. The detail design is reviewed and discussed at the critical
design review (CDR) with the customer to make a go/no-go decision to continue on
30
implementing the design. At this point, the design is baselined. According to Ertas and
Jones (1993):
“In most design processes of any significant magnitude, a design freeze is
implemented at some point prior to completion. This is the point at which the
design process is formalized and design changes are placed under strict and
formal control, often by some sort of configuration control board, [which]
normally include[s] membership representing all of the design disciplines, project
management, the customer, safety, quality control, and other staff functions, as
appropriate. The point in the overall design process at which the design is frozen
is determined by customer requirements, by the need to control costs and
configuration, by the need to inject greater discipline into the process, and by the
need to forceably [sic] implement increased coordination among all the
participants in the program.” (pp. 19)
2.1.3 Implementation/Manufacturing
In the implementation phase, the design is implemented/manufactured to produce
the product to satisfy the established requirements. During this phase,
manufacturing/production/implementation knowledge is applied to the design and
development of the product including analyses of design producibility and production
operations; application of manufacturing methods, tooling and equipment; control of the
introduction of engineering changes; and employment of manufacturing cost control
techniques.
Implementation consists of:
i) Producing and testing the components,
ii) Assembly of the components to form sub-systems and testing the sub-
systems,
iii) Integration of the all the components to form the product.
31
2.1.4 Test and Evaluation
Testing and evaluation (validation and verification) activities are performed
during and at the end of a product development to continuously verify and validate the
product or the product components. Each component and subsystem of the system should
be tested before they are integrated into another subsystem or to the system. The system
should also be tested to make sure that the overall system satisfies all the system level
functional requirements as well as all the constraints.
The objective of the test and evaluation activities is to verify that all the artifacts
satisfy the allocated requirements and constraints and to eliminate technical and
manufacturing risks prior to high-rate production or delivery.
Test and evaluation involves evaluation of components, subsystems, as well as
multiple pre-production versions, or prototypes, of the product. Typically, there are two
classes of prototypes. Early (alpha) prototypes are designed using the intended materials,
but flexible manufacturing processes, and later (beta) prototypes are created using the
correct materials and processes, but with a different assembly scheme than the final
product. The beta prototypes are generally used to answer questions regarding
performance and reliability [Ulrich and Eppinger, 2000].
This phase can account for "two thirds of the development cost." For example, to
qualify for extended twin-engine operations, the Boeing 777 flight-test program was "the
most extensive in Boeing history, a total of 7,400 hours" [Condit, 1996]. Similarly, the
software code for a military aircraft that had 2,140 requirements in the test plan spent
nearly four years in testing [Chase, 2001]. However, the biggest reason why this phase
may take considerable amount of time lies in the earlier phases of the product
development lifecycle. Some of the possible reasons for a longer test phase are:
i) Requirements are not identified and/or documented properly and the
resulting design does not fully satisfy the requirements or some of the
requirements are missing.
ii) Design constraints are not identified, documented and allocated properly.
32
iii) Design is not documented properly and the design intend is not
communication properly between design and development teams.
iv) Test and verification concerns are not considered in the requirement and/or
design phase.
v) Proper unit and integration tests are not performed for the components and
subsystems.
vi) The problems detected in this phase may require changes in the requirement
specifications or design, and any rework at this point cost considerable
amount of time and money.
2.1.5 Change Management
Change Management is the processes that define how changes are managed
throughout the development life cycle. Change Management includes management of
change requests, validation and evaluation of change requests, adjudicating and
approving change requests, and implementation of the change request. Changes could be
in requirements, design, implementation, or testing,
When the customer requirements change during the design effort, it is generally
not feasible to restart the design process from scratch, so new and modified functional
requirements and constraints must be incorporated into the existing design as the changes
occur. The lack of a systematic framework to trace the impact of changing requirements
and design decisions can lead to inaccurate impact analysis, estimates and a breakdown
of proper communication between the stakeholders. One design team may not be aware
of changes to another group’s requirements, even though they are significantly impacted
[Hintersteiner, 2000].
2.1.6 Project Management
Project management is the process of directing and coordinating human and
material resources throughout the project life cycle using management techniques to
achieve established objectives of scope, quality, time, cost and stakeholder satisfaction.
33
The Project Management Institute [PMI] defines project management as “The
application of knowledge, skills, tools and techniques to project activities to meet the
project requirements.” Project management knowledge and practices are best described in
terms of their component processes that can be placed into five process groups (initiating,
planning, executing, controlling and closing) and nine knowledge areas (project
integration management, project scope management, project time management, project
cost management, project quality management, project human resource management,
project communications management, project risk management and project procurement
management) [ASQ].
In its simplest form the project life cycle consists of four major periods:
1. Concept: where the project concept as a need solution is selected and
defined, overlaps with customer need assessment and requirements analysis
phases of product development lifecycle.
2. Development or Definition: where the concept is verified and developed
into a workable plan for implementation, overlaps with requirement analysis
and design phases of the product development lifecycle.
3. Implementation: where the implementation plan is carried out, overlaps with
the implementation phase of the product development lifecycle.
4. Closeout: where the project process is completed and documented, and the
finished product is transferred to the owner/user, overlaps with system
testing.
2.2 Axiomatic Design (AD)
The AD method is explained in detail in Suh (1990) and Suh (2001). Many case
studies where AD is applied to solve a problem in industry are presented in Suh (2001),
Do and Suh (2000), Hintersteiner (2000), Melvin (2003), and Nordlund (1996). In this
section, a brief overview of AD, mainly1 from Suh (2001) and other resources, is
provided and some benefits of applying AD in product design are discussed in order to
1 If not noted otherwise, the information presented in this section is from (Suh, 2001).
34
familiarize the reader with AD method. Understanding AD is very important to
understand the impact and contribution of this dissertation.
The ultimate purpose of the AD is explained in Suh (2001) as “... to establish a
scientific base for design and to improve design activities by providing the designer with
a theoretical foundation based on logic and rational thought processes and tools.”
The AD provides a systematic and logical method for deriving, documenting and
optimizing designs and helps avoid traditional design-build-test-redesign cycles for
design solution search and for determining the best design among those proposed [Suh,
2001]. Design architectures resulting from AD analysis provide frameworks for
implementation planning, risk assessment, risk mitigation and robust design analysis
[ADSI].
The AD provides a framework for describing design objects at all levels of detail.
Therefore, it allows the engineers and other stakeholders to quickly understand the
relationships between the intended functions of an object and the means by which they
are achieved [Hintersteiner, 2000].
Following the AD approach means that the designer will proceed with a design
through repeating a series of activities [Lee, 1999]:
i. Identify functional requirements in a solution-neutral environment
ii. Develop design solutions
iii. Determine design matrices and make sure that the design axioms are satisfied
iv. Check design consistency with respect to higher-level design decisions
v. Repeat steps 1-4 at the next level until the leaf-level DPs are developed.
The AD helps creativity by demanding clear formulation of design objectives
through the establishment of functional requirements (FRs) and constraints (Cs). It also
provides criteria for good and bad design to eliminate the bad designs as early as
possible, and thus enabling the designers to concentrate on promising ideas. The AD also
provides a systematic flow from creation of concepts to detailed design by formalizing
the decomposition process of requirements and design solutions.
35
Axiomatic design provides traceability of design logic when changes are
introduced during the development phase and throughout the lifecycle of the product
[ADSI].
The Axiomatic Design method implements a process where engineers, designers
and managers think functionally first, followed by the innovative creation of physical
embodiment. The Axiomatic Design also provides a systematic way of satisfying many
functional requirements (FRs) at the same time without introducing coupling of functions
and creating integrated physical systems. The AD provides means of decomposing
higher-level FRs and physical embodiments (called design parameters, DPs) until the
creation of leaf-level FRs and DPs that can be implemented to construct the system
according to the resulting design decision architecture [ADSI].
2.2.1 General AD Concepts
The AD method originates from the understanding that design is an interplay
between what we want to achieve and how we want to achieve it. Designers can use all of
their existing design tools and software with AD and efficiently arrive at a successful new
design, or diagnose and correct an existing design.
The AD process is centered on the satisfaction of functional requirements (FRs),
which are defined as the minimum set of independent requirements that characterize the
design goals. The design must satisfy the FRs, and this is done by creating a system that
uses design parameters (DPs) to affect the behavior such that the FRs are satisfied.
There are four main concepts in AD: (i) domains, (ii) hierarchies, (iii) zigzagging,
and (iv) design axioms. These concepts are explained in the following sections.
2.2.1.1 AD: Domains
The fundamental concept of AD is that of domains, one for each kind of design
activity: customer domain, functional domain, physical domain, and process domain.
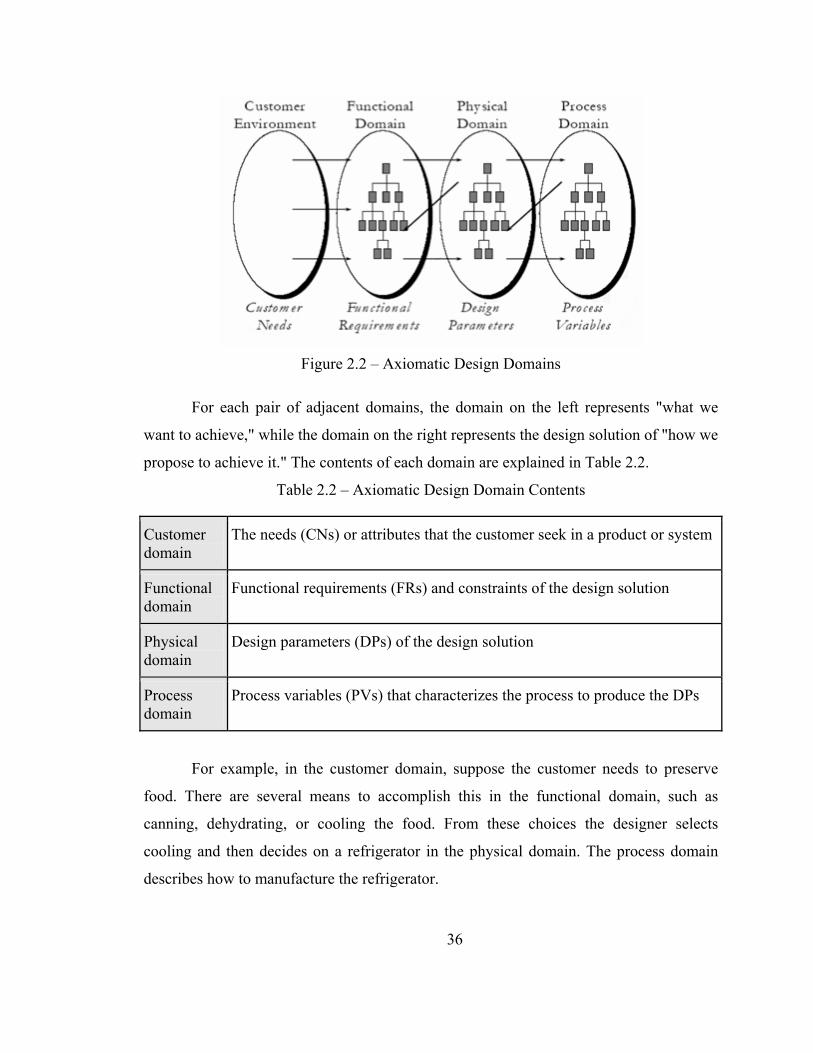
36
Figure 2.2 – Axiomatic Design Domains
For each pair of adjacent domains, the domain on the left represents "what we
want to achieve," while the domain on the right represents the design solution of "how we
propose to achieve it." The contents of each domain are explained in Table 2.2.
Table 2.2 – Axiomatic Design Domain Contents
Customer domain
The needs (CNs) or attributes that the customer seek in a product or system
Functional domain
Functional requirements (FRs) and constraints of the design solution
Physical domain
Design parameters (DPs) of the design solution
Process domain
Process variables (PVs) that characterizes the process to produce the DPs
For example, in the customer domain, suppose the customer needs to preserve
food. There are several means to accomplish this in the functional domain, such as
canning, dehydrating, or cooling the food. From these choices the designer selects
cooling and then decides on a refrigerator in the physical domain. The process domain
describes how to manufacture the refrigerator.
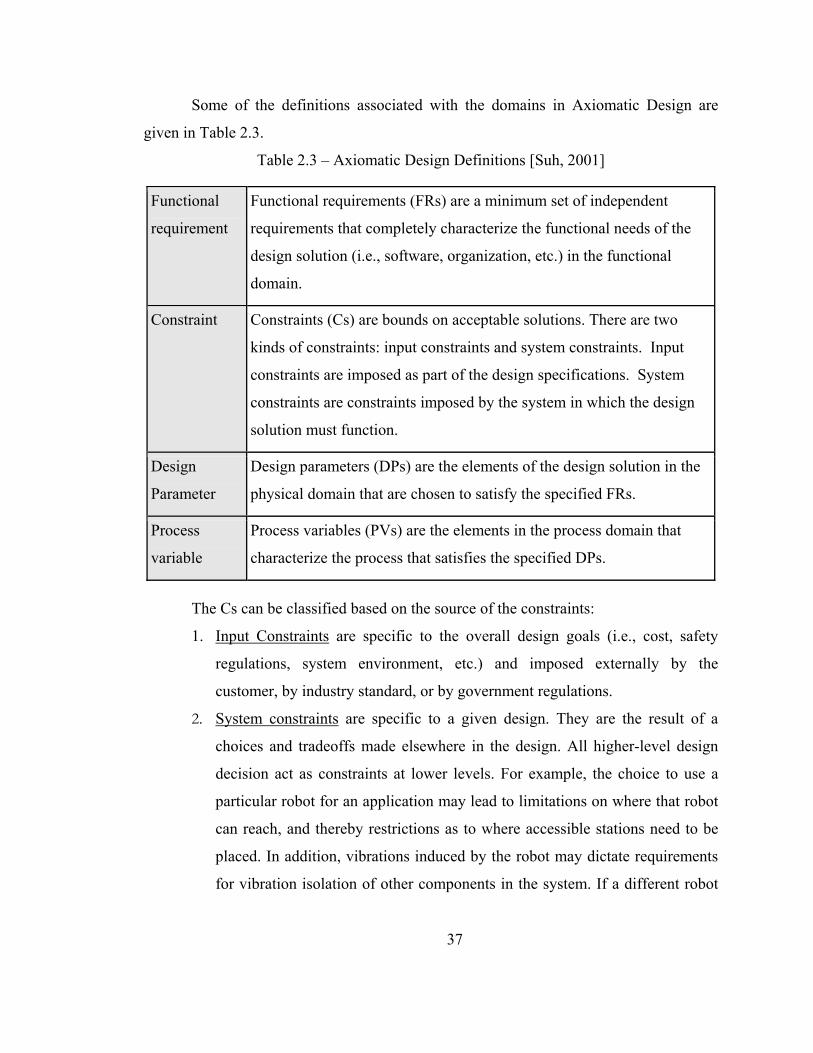
37
Some of the definitions associated with the domains in Axiomatic Design are
given in Table 2.3.
Table 2.3 – Axiomatic Design Definitions [Suh, 2001]
Functional
requirement
Functional requirements (FRs) are a minimum set of independent
requirements that completely characterize the functional needs of the
design solution (i.e., software, organization, etc.) in the functional
domain.
Constraint Constraints (Cs) are bounds on acceptable solutions. There are two
kinds of constraints: input constraints and system constraints. Input
constraints are imposed as part of the design specifications. System
constraints are constraints imposed by the system in which the design
solution must function.
Design
Parameter
Design parameters (DPs) are the elements of the design solution in the
physical domain that are chosen to satisfy the specified FRs.
Process
variable
Process variables (PVs) are the elements in the process domain that
characterize the process that satisfies the specified DPs.
The Cs can be classified based on the source of the constraints:
1. Input Constraints are specific to the overall design goals (i.e., cost, safety
regulations, system environment, etc.) and imposed externally by the
customer, by industry standard, or by government regulations.
2. System constraints are specific to a given design. They are the result of a
choices and tradeoffs made elsewhere in the design. All higher-level design
decision act as constraints at lower levels. For example, the choice to use a
particular robot for an application may lead to limitations on where that robot
can reach, and thereby restrictions as to where accessible stations need to be
placed. In addition, vibrations induced by the robot may dictate requirements
for vibration isolation of other components in the system. If a different robot
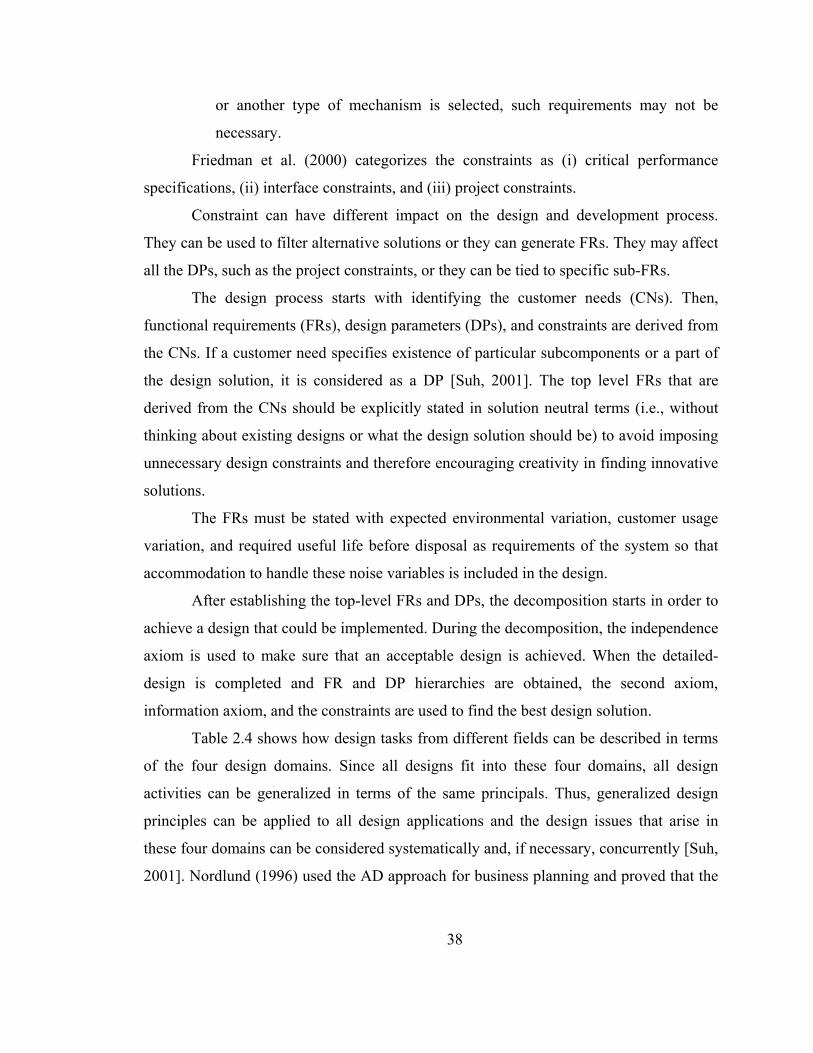
38
or another type of mechanism is selected, such requirements may not be
necessary.
Friedman et al. (2000) categorizes the constraints as (i) critical performance
specifications, (ii) interface constraints, and (iii) project constraints.
Constraint can have different impact on the design and development process.
They can be used to filter alternative solutions or they can generate FRs. They may affect
all the DPs, such as the project constraints, or they can be tied to specific sub-FRs.
The design process starts with identifying the customer needs (CNs). Then,
functional requirements (FRs), design parameters (DPs), and constraints are derived from
the CNs. If a customer need specifies existence of particular subcomponents or a part of
the design solution, it is considered as a DP [Suh, 2001]. The top level FRs that are
derived from the CNs should be explicitly stated in solution neutral terms (i.e., without
thinking about existing designs or what the design solution should be) to avoid imposing
unnecessary design constraints and therefore encouraging creativity in finding innovative
solutions.
The FRs must be stated with expected environmental variation, customer usage
variation, and required useful life before disposal as requirements of the system so that
accommodation to handle these noise variables is included in the design.
After establishing the top-level FRs and DPs, the decomposition starts in order to
achieve a design that could be implemented. During the decomposition, the independence
axiom is used to make sure that an acceptable design is achieved. When the detailed-
design is completed and FR and DP hierarchies are obtained, the second axiom,
information axiom, and the constraints are used to find the best design solution.
Table 2.4 shows how design tasks from different fields can be described in terms
of the four design domains. Since all designs fit into these four domains, all design
activities can be generalized in terms of the same principals. Thus, generalized design
principles can be applied to all design applications and the design issues that arise in
these four domains can be considered systematically and, if necessary, concurrently [Suh,
2001]. Nordlund (1996) used the AD approach for business planning and proved that the
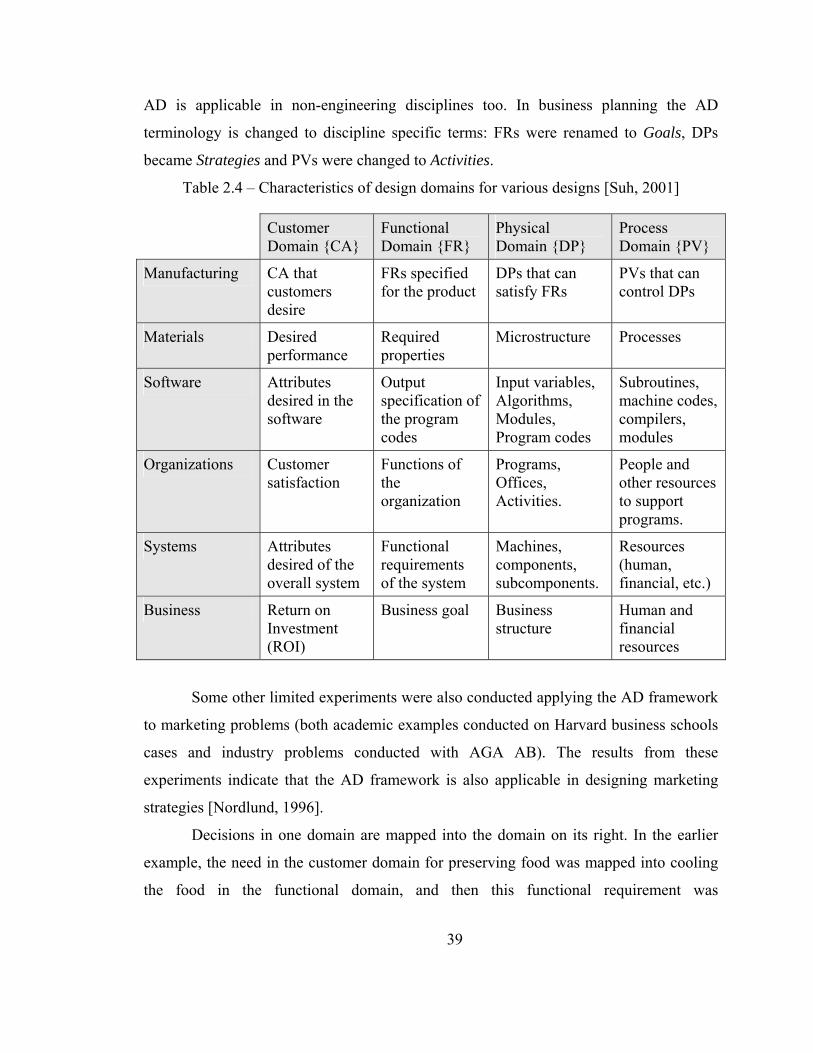
39
AD is applicable in non-engineering disciplines too. In business planning the AD
terminology is changed to discipline specific terms: FRs were renamed to Goals, DPs
became Strategies and PVs were changed to Activities.
Table 2.4 – Characteristics of design domains for various designs [Suh, 2001]
Customer Domain {CA}
Functional Domain {FR}
Physical Domain {DP}
Process Domain {PV}
Manufacturing CA that customers desire
FRs specified for the product
DPs that can satisfy FRs
PVs that can control DPs
Materials Desired performance
Required properties
Microstructure Processes
Software Attributes desired in the software
Output specification of the program codes
Input variables, Algorithms, Modules, Program codes
Subroutines, machine codes, compilers, modules
Organizations Customer satisfaction
Functions of the organization
Programs, Offices, Activities.
People and other resources to support programs.
Systems Attributes desired of the overall system
Functional requirements of the system
Machines, components, subcomponents.
Resources (human, financial, etc.)
Business Return on Investment (ROI)
Business goal Business structure
Human and financial resources
Some other limited experiments were also conducted applying the AD framework
to marketing problems (both academic examples conducted on Harvard business schools
cases and industry problems conducted with AGA AB). The results from these
experiments indicate that the AD framework is also applicable in designing marketing
strategies [Nordlund, 1996].
Decisions in one domain are mapped into the domain on its right. In the earlier
example, the need in the customer domain for preserving food was mapped into cooling
the food in the functional domain, and then this functional requirement was
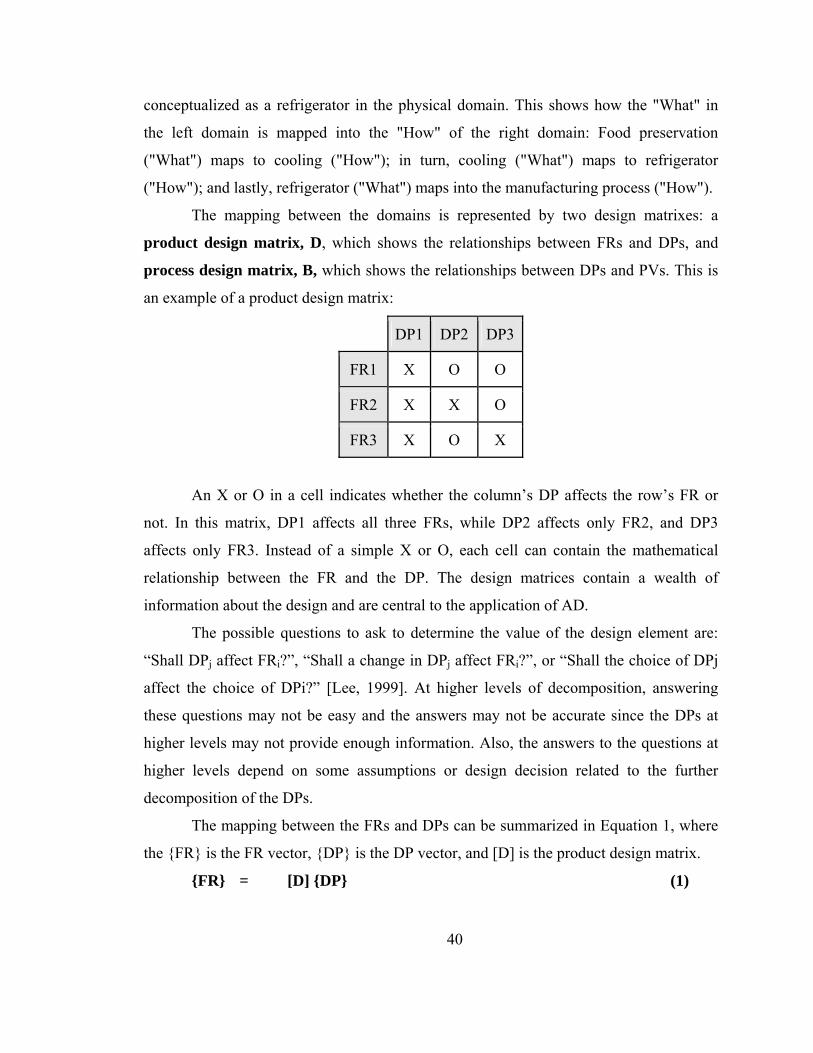
40
conceptualized as a refrigerator in the physical domain. This shows how the "What" in
the left domain is mapped into the "How" of the right domain: Food preservation
("What") maps to cooling ("How"); in turn, cooling ("What") maps to refrigerator
("How"); and lastly, refrigerator ("What") maps into the manufacturing process ("How").
The mapping between the domains is represented by two design matrixes: a
product design matrix, D, which shows the relationships between FRs and DPs, and
process design matrix, B, which shows the relationships between DPs and PVs. This is
an example of a product design matrix:
DP1 DP2 DP3
FR1 X O O
FR2 X X O
FR3 X O X
An X or O in a cell indicates whether the column’s DP affects the row’s FR or
not. In this matrix, DP1 affects all three FRs, while DP2 affects only FR2, and DP3
affects only FR3. Instead of a simple X or O, each cell can contain the mathematical
relationship between the FR and the DP. The design matrices contain a wealth of
information about the design and are central to the application of AD.
The possible questions to ask to determine the value of the design element are:
“Shall DPj affect FRi?”, “Shall a change in DPj affect FRi?”, or “Shall the choice of DPj
affect the choice of DPi?” [Lee, 1999]. At higher levels of decomposition, answering
these questions may not be easy and the answers may not be accurate since the DPs at
higher levels may not provide enough information. Also, the answers to the questions at
higher levels depend on some assumptions or design decision related to the further
decomposition of the DPs.
The mapping between the FRs and DPs can be summarized in Equation 1, where
the {FR} is the FR vector, {DP} is the DP vector, and [D] is the product design matrix.
{FR} = [D] {DP} (1)
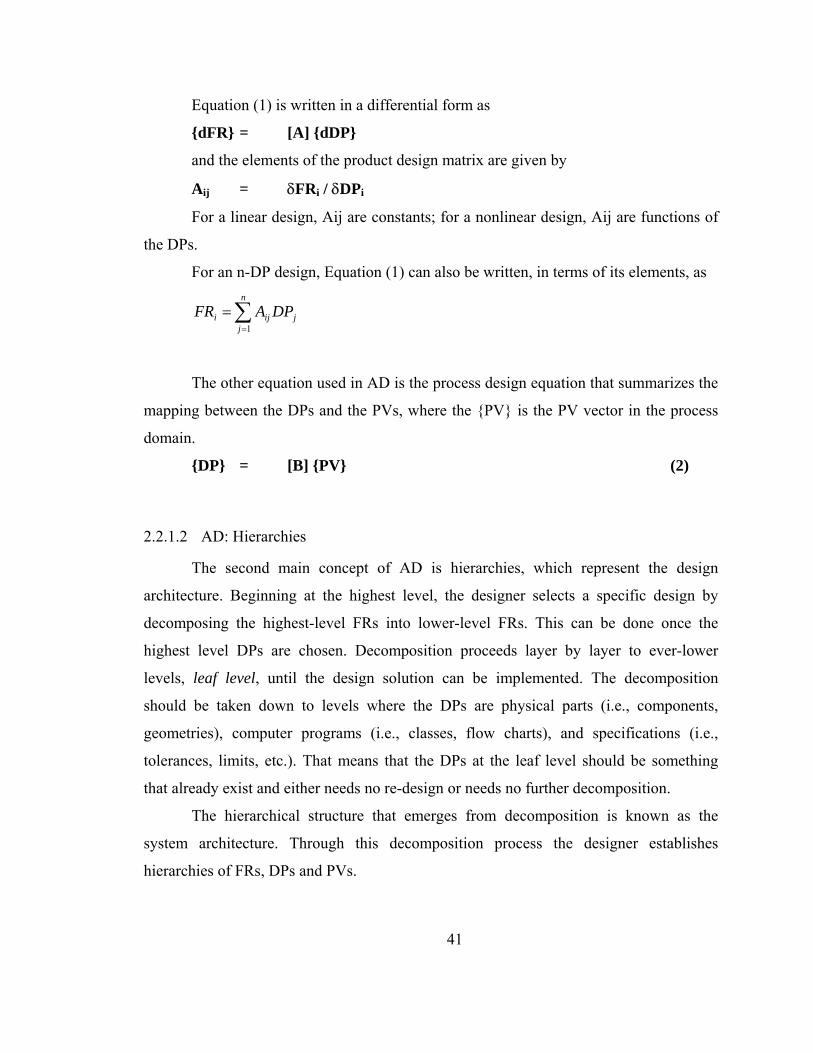
41
Equation (1) is written in a differential form as
{dFR} = [A] {dDP}
and the elements of the product design matrix are given by
Aij = δFRi / δDPi
For a linear design, Aij are constants; for a nonlinear design, Aij are functions of
the DPs.
For an n-DP design, Equation (1) can also be written, in terms of its elements, as
∑=
=n
jjiji DPAFR
1
The other equation used in AD is the process design equation that summarizes the
mapping between the DPs and the PVs, where the {PV} is the PV vector in the process
domain.
{DP} = [B] {PV} (2)
2.2.1.2 AD: Hierarchies
The second main concept of AD is hierarchies, which represent the design
architecture. Beginning at the highest level, the designer selects a specific design by
decomposing the highest-level FRs into lower-level FRs. This can be done once the
highest level DPs are chosen. Decomposition proceeds layer by layer to ever-lower
levels, leaf level, until the design solution can be implemented. The decomposition
should be taken down to levels where the DPs are physical parts (i.e., components,
geometries), computer programs (i.e., classes, flow charts), and specifications (i.e.,
tolerances, limits, etc.). That means that the DPs at the leaf level should be something
that already exist and either needs no re-design or needs no further decomposition.
The hierarchical structure that emerges from decomposition is known as the
system architecture. Through this decomposition process the designer establishes
hierarchies of FRs, DPs and PVs.
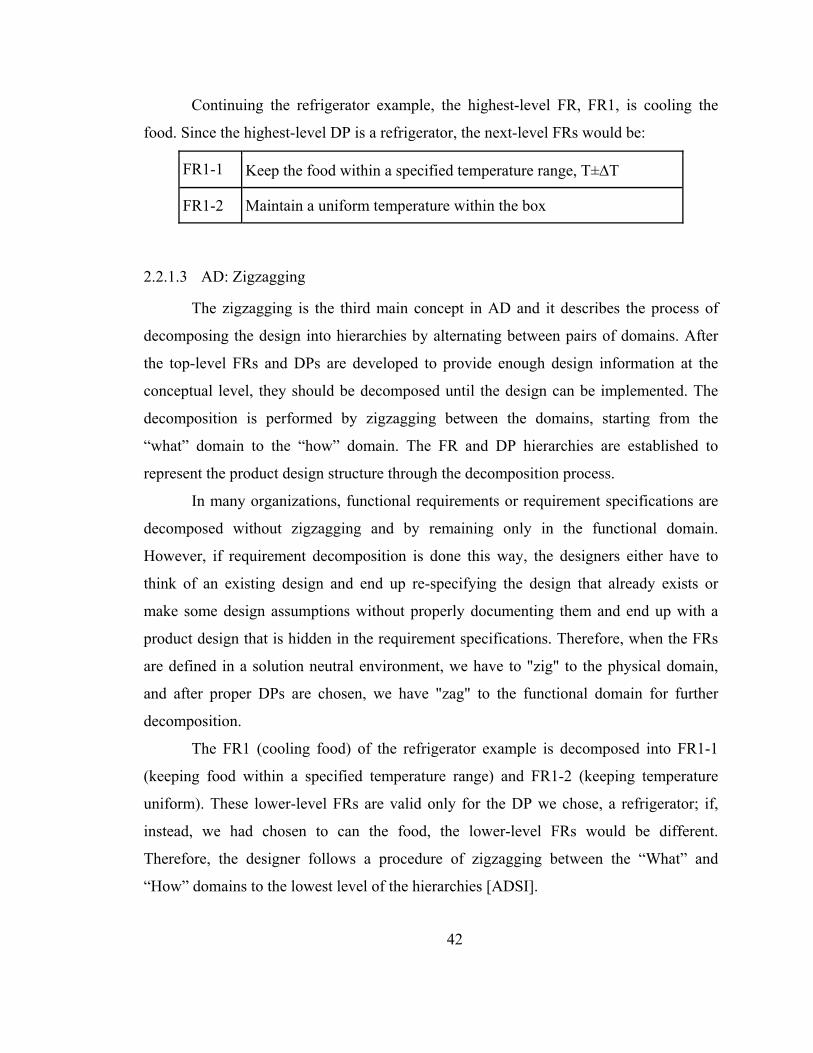
42
Continuing the refrigerator example, the highest-level FR, FR1, is cooling the
food. Since the highest-level DP is a refrigerator, the next-level FRs would be:
FR1-1 Keep the food within a specified temperature range, T±∆T
FR1-2 Maintain a uniform temperature within the box
2.2.1.3 AD: Zigzagging
The zigzagging is the third main concept in AD and it describes the process of
decomposing the design into hierarchies by alternating between pairs of domains. After
the top-level FRs and DPs are developed to provide enough design information at the
conceptual level, they should be decomposed until the design can be implemented. The
decomposition is performed by zigzagging between the domains, starting from the
“what” domain to the “how” domain. The FR and DP hierarchies are established to
represent the product design structure through the decomposition process.
In many organizations, functional requirements or requirement specifications are
decomposed without zigzagging and by remaining only in the functional domain.
However, if requirement decomposition is done this way, the designers either have to
think of an existing design and end up re-specifying the design that already exists or
make some design assumptions without properly documenting them and end up with a
product design that is hidden in the requirement specifications. Therefore, when the FRs
are defined in a solution neutral environment, we have to "zig" to the physical domain,
and after proper DPs are chosen, we have "zag" to the functional domain for further
decomposition.
The FR1 (cooling food) of the refrigerator example is decomposed into FR1-1
(keeping food within a specified temperature range) and FR1-2 (keeping temperature
uniform). These lower-level FRs are valid only for the DP we chose, a refrigerator; if,
instead, we had chosen to can the food, the lower-level FRs would be different.
Therefore, the designer follows a procedure of zigzagging between the “What” and
“How” domains to the lowest level of the hierarchies [ADSI].
43
During the decomposition, the independent design axiom should be applied to the
product design matrix to make sure that for each level of design, an uncoupled or a
decoupled design matrix is obtained.
At the end of zigzagging when a set of FRs has been formulated and possible sets
of DPs have been synthesized, the two design axioms are applied to evaluate the
proposed designs. The product design matrix, D, is used in this evaluation. The
Independence Axiom is also applied to the process design matrix to make sure that an
uncoupled or a decoupled process design matrix is obtained.
In many cases, the CNs cannot and need not be decomposed since they are often
stated in terms of highest level needs. However, in the future when product customization
is important to satisfy customers, zigzagging can be performed so that the customer can
select their desired functions among the available FRs.
The system design can be said to be completed once the requirements and
constraints for the lowest-level (leaf-level) DPs are specified well enough to either
implement (produce/manufacture/code/etc.) or to procure the DPs.
2.2.1.4 AD: Design Axioms
The fourth main concept of AD is the two design axioms. Axioms are truths that
cannot be derived but for which there are no counterexamples or exceptions. The design
axioms are:
Axiom 1 – The Independence Axiom: Maintain the independence of FRs: In an
acceptable design, the DPs and the FRs are related in such a way that a specific DP can
be adjusted to satisfy its corresponding FR without affecting other FRs.
Axiom 2 – The Information Axiom: Minimize the information content: Among
alternative designs which satisfy Axiom 1, the best design has the minimum information
content which means the maximum probability of success. The Information Axiom
provides a quantitative measure of the merits of a proposed design as well as the
theoretical bases for design optimization and robust design.
The information content of a design of an entire system is defined as:
Isys = - log2 P{m} (3)
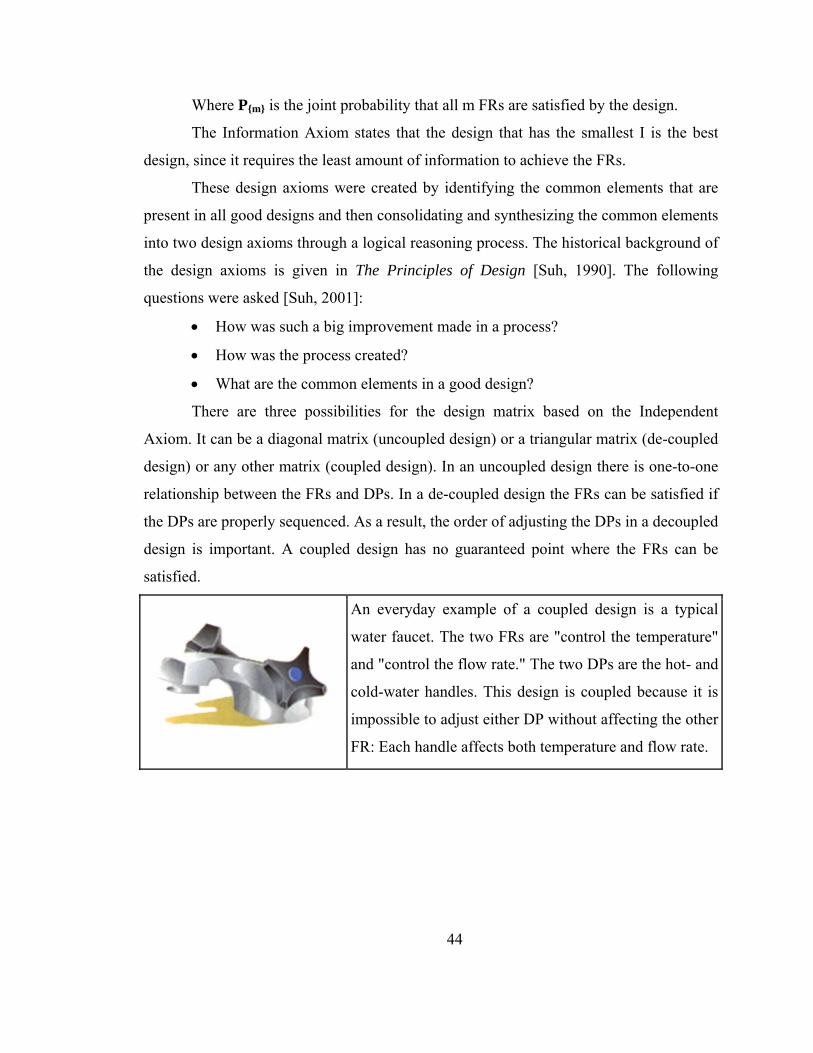
44
Where P{m} is the joint probability that all m FRs are satisfied by the design.
The Information Axiom states that the design that has the smallest I is the best
design, since it requires the least amount of information to achieve the FRs.
These design axioms were created by identifying the common elements that are
present in all good designs and then consolidating and synthesizing the common elements
into two design axioms through a logical reasoning process. The historical background of
the design axioms is given in The Principles of Design [Suh, 1990]. The following
questions were asked [Suh, 2001]:
• How was such a big improvement made in a process?
• How was the process created?
• What are the common elements in a good design?
There are three possibilities for the design matrix based on the Independent
Axiom. It can be a diagonal matrix (uncoupled design) or a triangular matrix (de-coupled
design) or any other matrix (coupled design). In an uncoupled design there is one-to-one
relationship between the FRs and DPs. In a de-coupled design the FRs can be satisfied if
the DPs are properly sequenced. As a result, the order of adjusting the DPs in a decoupled
design is important. A coupled design has no guaranteed point where the FRs can be
satisfied.
An everyday example of a coupled design is a typical
water faucet. The two FRs are "control the temperature"
and "control the flow rate." The two DPs are the hot- and
cold-water handles. This design is coupled because it is
impossible to adjust either DP without affecting the other
FR: Each handle affects both temperature and flow rate.
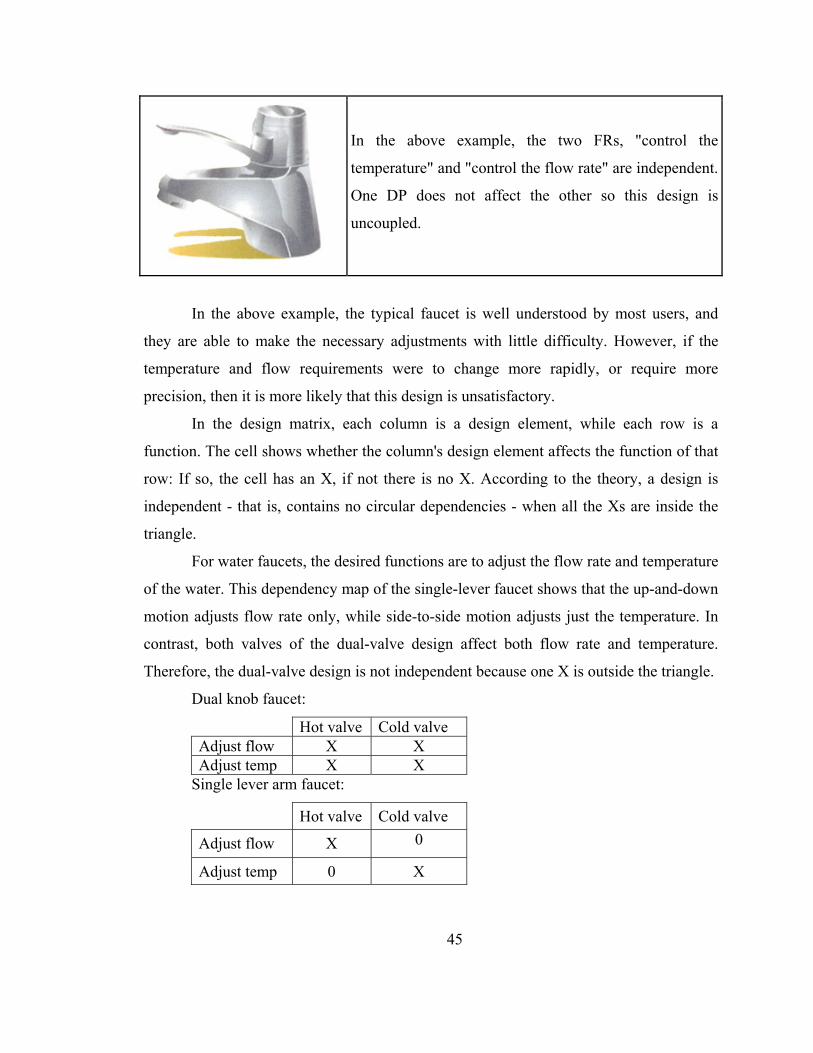
45
In the above example, the two FRs, "control the
temperature" and "control the flow rate" are independent.
One DP does not affect the other so this design is
uncoupled.
In the above example, the typical faucet is well understood by most users, and
they are able to make the necessary adjustments with little difficulty. However, if the
temperature and flow requirements were to change more rapidly, or require more
precision, then it is more likely that this design is unsatisfactory.
In the design matrix, each column is a design element, while each row is a
function. The cell shows whether the column's design element affects the function of that
row: If so, the cell has an X, if not there is no X. According to the theory, a design is
independent - that is, contains no circular dependencies - when all the Xs are inside the
triangle.
For water faucets, the desired functions are to adjust the flow rate and temperature
of the water. This dependency map of the single-lever faucet shows that the up-and-down
motion adjusts flow rate only, while side-to-side motion adjusts just the temperature. In
contrast, both valves of the dual-valve design affect both flow rate and temperature.
Therefore, the dual-valve design is not independent because one X is outside the triangle.
Dual knob faucet:
Hot valve Cold valve Adjust flow X X Adjust temp X X
Single lever arm faucet:
Hot valve Cold valve
Adjust flow X 0
Adjust temp 0 X
46
The design matrix is a second order tensor like stress, strain, and moment of
inertia. However, there is one big difference between the design matrix and these other
second order tensors. These other tensors can be changed through coordinate
transformation to convert any matrix into a diagonal matrix. The diagonal elements of the
diagonal matrix are invariant such as principal stresses in the case of stress tensor.
However, the coordinate transformation technique cannot be applied to design equations
to find the invariant (i.e., the diagonal matrix), since the design matrix typically involves
physical things that are not amenable to coordinate transformation. In other words,
mathematically the design matrix can always be transformed into a diagonal matrix, but
the diagonal elements may not have any physical significance [Suh, 1990].
Functional independence required by the Independence Axiom is often
misunderstood as physical independence. However, Axiom 1 requires that the functions
of the system be independent from each other, that is, each function can be achieved
without affecting other functions. The second axiom suggests physical integration as a
way of decreasing the information content of the design as long as the functional
independence is maintained.
The case studies in Suh (2001) show that the performance, robustness, reliability,
and functionality of products, processes, software, systems, and organizations were
significantly improved when these two design axioms are satisfied.
It is very important to know that the design matrix may satisfy the first axiom at
conceptual design levels, however, the design decisions at lower levels ultimately
determine if the system design satisfies the first axiom. Therefore, full design matrix that
represents all FRs and DPs should be formed at each level of decomposition and make
sure that the functional independents is still maintained.
At each level of decomposition, master or multi-level design matrix is formed to
evaluate the consistency of the design as well as to ensure that the higher level design
decisions and assumptions are still valid [Lee, 1999]. A sample master design matrix is
shown in Table 2.5.
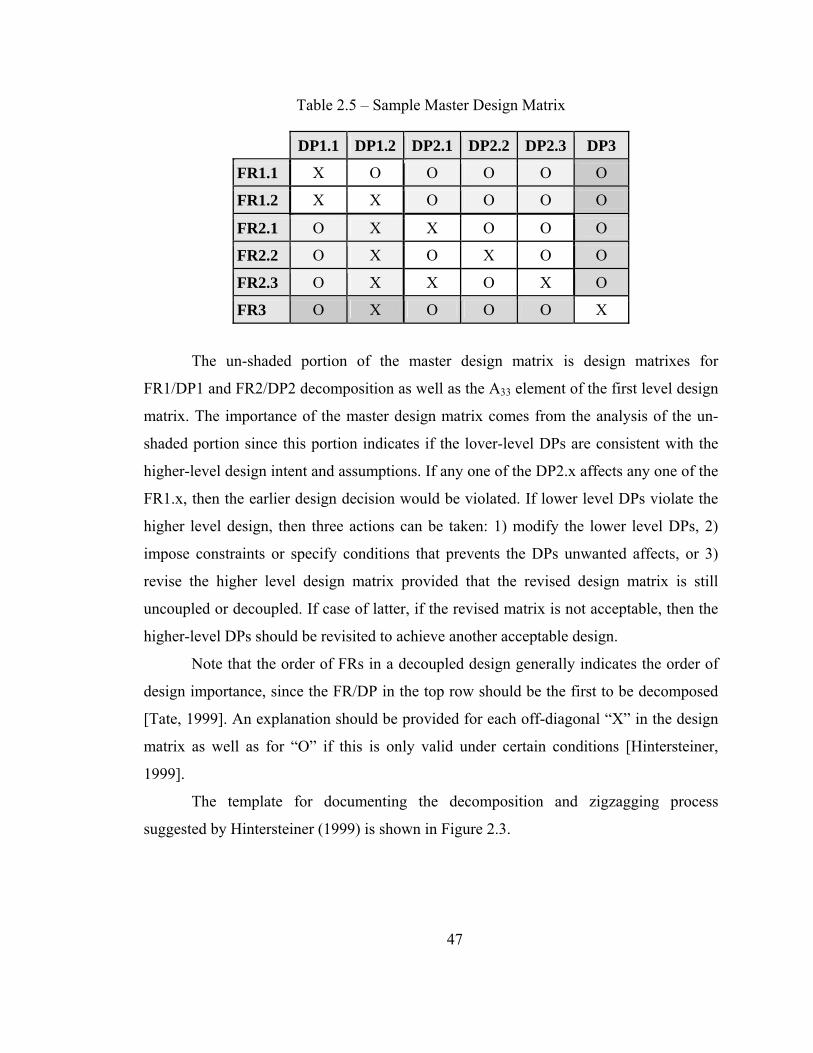
47
Table 2.5 – Sample Master Design Matrix
DP1.1 DP1.2 DP2.1 DP2.2 DP2.3 DP3
FR1.1 X O O O O O
FR1.2 X X O O O O
FR2.1 O X X O O O
FR2.2 O X O X O O
FR2.3 O X X O X O
FR3 O X O O O X
The un-shaded portion of the master design matrix is design matrixes for
FR1/DP1 and FR2/DP2 decomposition as well as the A33 element of the first level design
matrix. The importance of the master design matrix comes from the analysis of the un-
shaded portion since this portion indicates if the lover-level DPs are consistent with the
higher-level design intent and assumptions. If any one of the DP2.x affects any one of the
FR1.x, then the earlier design decision would be violated. If lower level DPs violate the
higher level design, then three actions can be taken: 1) modify the lower level DPs, 2)
impose constraints or specify conditions that prevents the DPs unwanted affects, or 3)
revise the higher level design matrix provided that the revised design matrix is still
uncoupled or decoupled. If case of latter, if the revised matrix is not acceptable, then the
higher-level DPs should be revisited to achieve another acceptable design.
Note that the order of FRs in a decoupled design generally indicates the order of
design importance, since the FR/DP in the top row should be the first to be decomposed
[Tate, 1999]. An explanation should be provided for each off-diagonal “X” in the design
matrix as well as for “O” if this is only valid under certain conditions [Hintersteiner,
1999].
The template for documenting the decomposition and zigzagging process
suggested by Hintersteiner (1999) is shown in Figure 2.3.
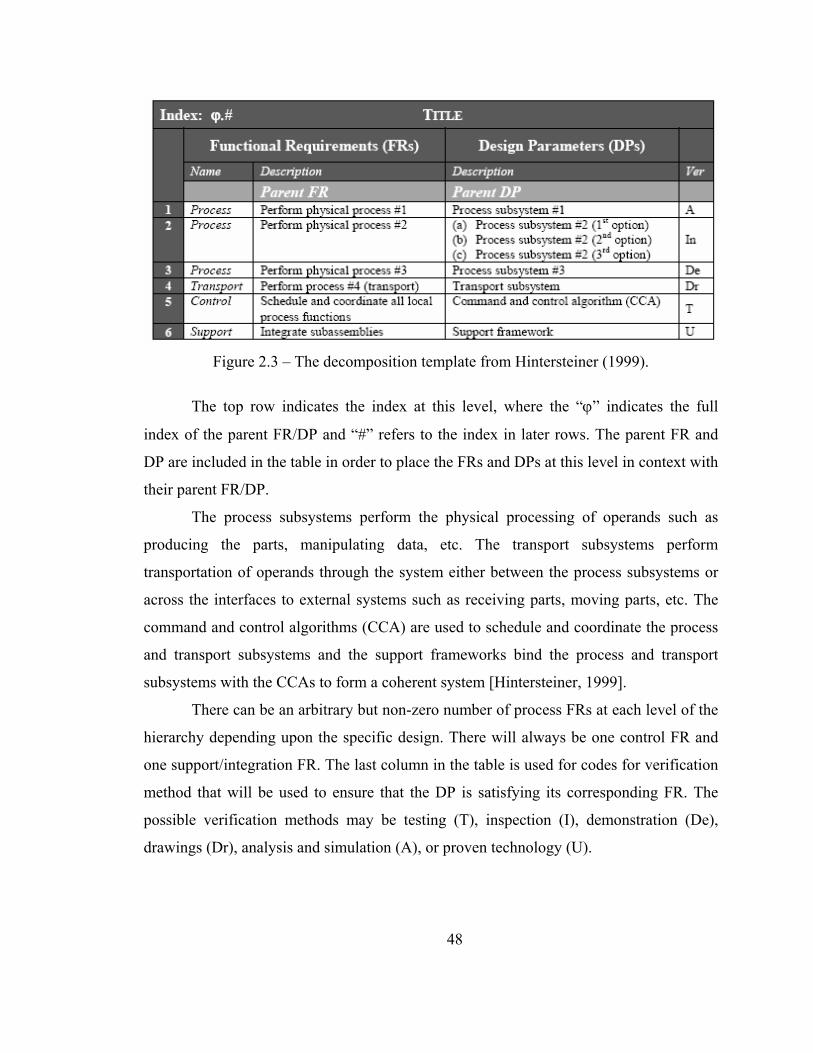
48
Figure 2.3 – The decomposition template from Hintersteiner (1999).
The top row indicates the index at this level, where the “ϕ” indicates the full
index of the parent FR/DP and “#” refers to the index in later rows. The parent FR and
DP are included in the table in order to place the FRs and DPs at this level in context with
their parent FR/DP.
The process subsystems perform the physical processing of operands such as
producing the parts, manipulating data, etc. The transport subsystems perform
transportation of operands through the system either between the process subsystems or
across the interfaces to external systems such as receiving parts, moving parts, etc. The
command and control algorithms (CCA) are used to schedule and coordinate the process
and transport subsystems and the support frameworks bind the process and transport
subsystems with the CCAs to form a coherent system [Hintersteiner, 1999].
There can be an arbitrary but non-zero number of process FRs at each level of the
hierarchy depending upon the specific design. There will always be one control FR and
one support/integration FR. The last column in the table is used for codes for verification
method that will be used to ensure that the DP is satisfying its corresponding FR. The
possible verification methods may be testing (T), inspection (I), demonstration (De),
drawings (Dr), analysis and simulation (A), or proven technology (U).
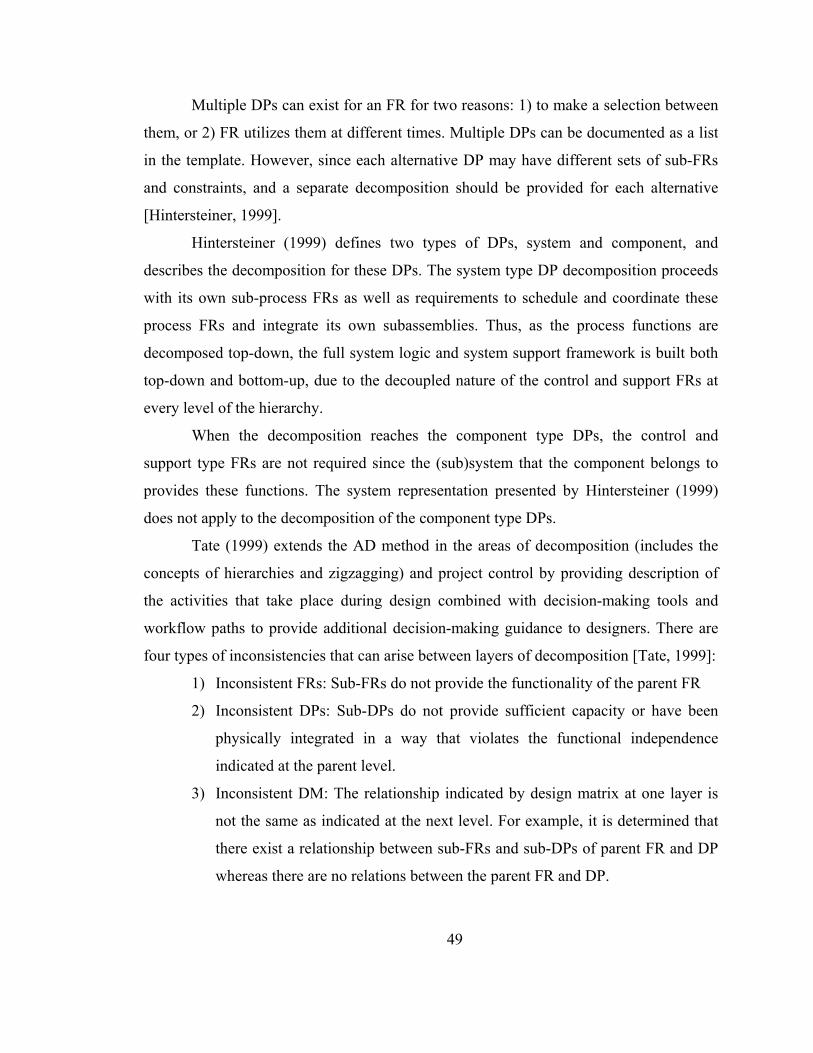
49
Multiple DPs can exist for an FR for two reasons: 1) to make a selection between
them, or 2) FR utilizes them at different times. Multiple DPs can be documented as a list
in the template. However, since each alternative DP may have different sets of sub-FRs
and constraints, and a separate decomposition should be provided for each alternative
[Hintersteiner, 1999].
Hintersteiner (1999) defines two types of DPs, system and component, and
describes the decomposition for these DPs. The system type DP decomposition proceeds
with its own sub-process FRs as well as requirements to schedule and coordinate these
process FRs and integrate its own subassemblies. Thus, as the process functions are
decomposed top-down, the full system logic and system support framework is built both
top-down and bottom-up, due to the decoupled nature of the control and support FRs at
every level of the hierarchy.
When the decomposition reaches the component type DPs, the control and
support type FRs are not required since the (sub)system that the component belongs to
provides these functions. The system representation presented by Hintersteiner (1999)
does not apply to the decomposition of the component type DPs.
Tate (1999) extends the AD method in the areas of decomposition (includes the
concepts of hierarchies and zigzagging) and project control by providing description of
the activities that take place during design combined with decision-making tools and
workflow paths to provide additional decision-making guidance to designers. There are
four types of inconsistencies that can arise between layers of decomposition [Tate, 1999]:
1) Inconsistent FRs: Sub-FRs do not provide the functionality of the parent FR
2) Inconsistent DPs: Sub-DPs do not provide sufficient capacity or have been
physically integrated in a way that violates the functional independence
indicated at the parent level.
3) Inconsistent DM: The relationship indicated by design matrix at one layer is
not the same as indicated at the next level. For example, it is determined that
there exist a relationship between sub-FRs and sub-DPs of parent FR and DP
whereas there are no relations between the parent FR and DP.
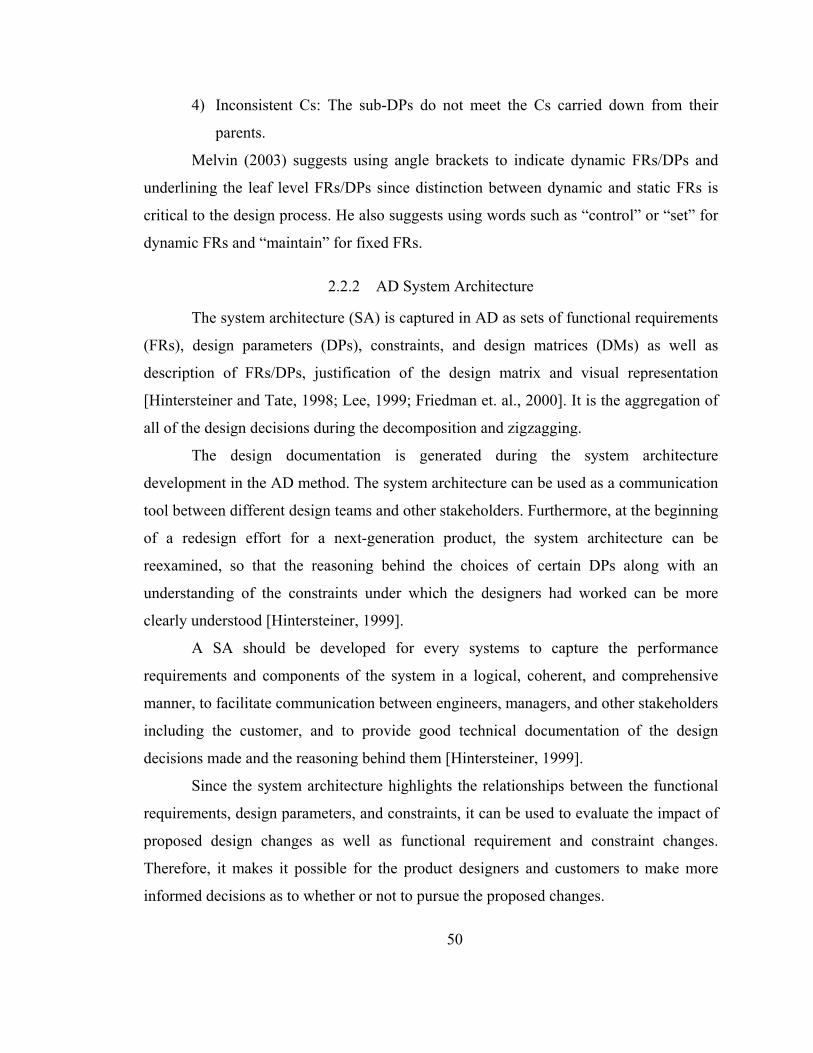
50
4) Inconsistent Cs: The sub-DPs do not meet the Cs carried down from their
parents.
Melvin (2003) suggests using angle brackets to indicate dynamic FRs/DPs and
underlining the leaf level FRs/DPs since distinction between dynamic and static FRs is
critical to the design process. He also suggests using words such as “control” or “set” for
dynamic FRs and “maintain” for fixed FRs.
2.2.2 AD System Architecture
The system architecture (SA) is captured in AD as sets of functional requirements
(FRs), design parameters (DPs), constraints, and design matrices (DMs) as well as
description of FRs/DPs, justification of the design matrix and visual representation
[Hintersteiner and Tate, 1998; Lee, 1999; Friedman et. al., 2000]. It is the aggregation of
all of the design decisions during the decomposition and zigzagging.
The design documentation is generated during the system architecture
development in the AD method. The system architecture can be used as a communication
tool between different design teams and other stakeholders. Furthermore, at the beginning
of a redesign effort for a next-generation product, the system architecture can be
reexamined, so that the reasoning behind the choices of certain DPs along with an
understanding of the constraints under which the designers had worked can be more
clearly understood [Hintersteiner, 1999].
A SA should be developed for every systems to capture the performance
requirements and components of the system in a logical, coherent, and comprehensive
manner, to facilitate communication between engineers, managers, and other stakeholders
including the customer, and to provide good technical documentation of the design
decisions made and the reasoning behind them [Hintersteiner, 1999].
Since the system architecture highlights the relationships between the functional
requirements, design parameters, and constraints, it can be used to evaluate the impact of
proposed design changes as well as functional requirement and constraint changes.
Therefore, it makes it possible for the product designers and customers to make more
informed decisions as to whether or not to pursue the proposed changes.
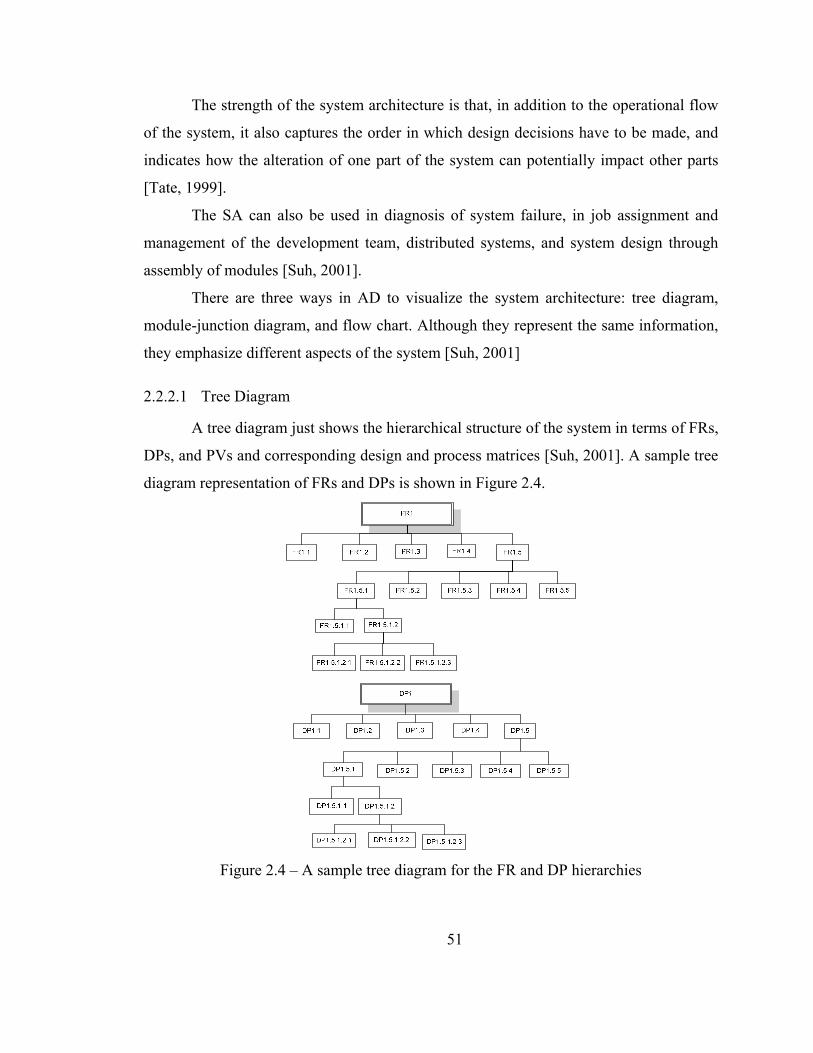
51
The strength of the system architecture is that, in addition to the operational flow
of the system, it also captures the order in which design decisions have to be made, and
indicates how the alteration of one part of the system can potentially impact other parts
[Tate, 1999].
The SA can also be used in diagnosis of system failure, in job assignment and
management of the development team, distributed systems, and system design through
assembly of modules [Suh, 2001].
There are three ways in AD to visualize the system architecture: tree diagram,
module-junction diagram, and flow chart. Although they represent the same information,
they emphasize different aspects of the system [Suh, 2001]
2.2.2.1 Tree Diagram
A tree diagram just shows the hierarchical structure of the system in terms of FRs,
DPs, and PVs and corresponding design and process matrices [Suh, 2001]. A sample tree
diagram representation of FRs and DPs is shown in Figure 2.4.
Figure 2.4 – A sample tree diagram for the FR and DP hierarchies
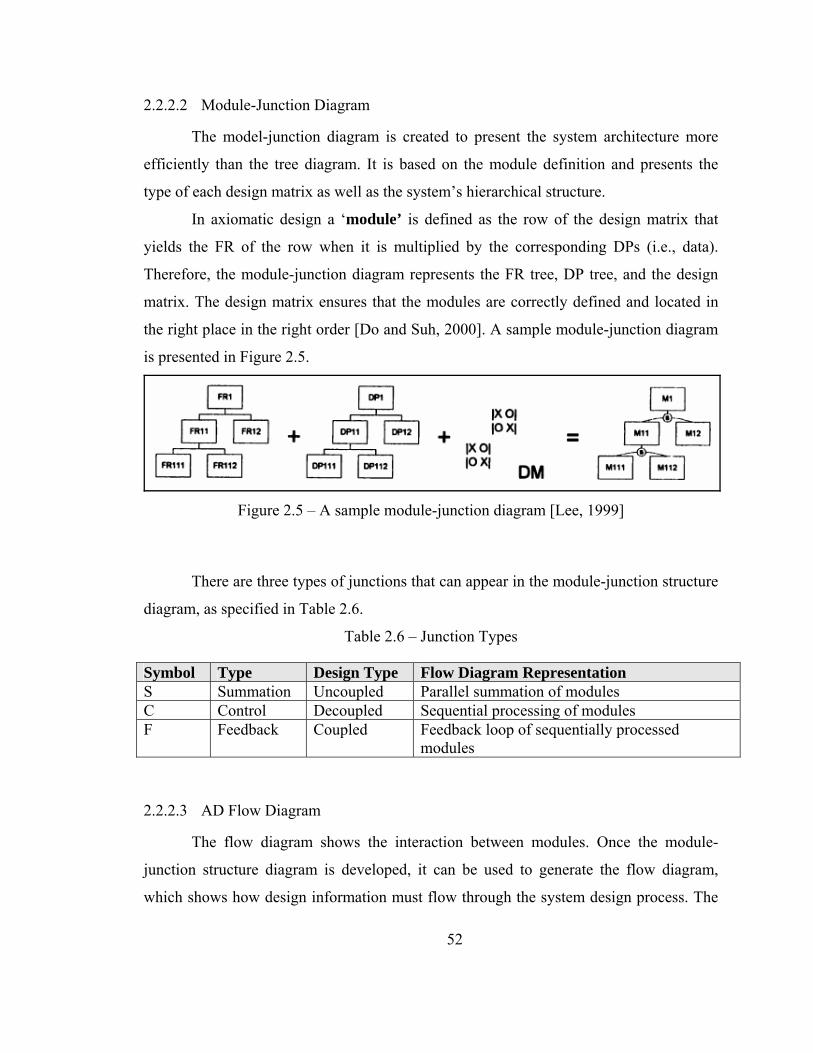
52
2.2.2.2 Module-Junction Diagram
The model-junction diagram is created to present the system architecture more
efficiently than the tree diagram. It is based on the module definition and presents the
type of each design matrix as well as the system’s hierarchical structure.
In axiomatic design a ‘module’ is defined as the row of the design matrix that
yields the FR of the row when it is multiplied by the corresponding DPs (i.e., data).
Therefore, the module-junction diagram represents the FR tree, DP tree, and the design
matrix. The design matrix ensures that the modules are correctly defined and located in
the right place in the right order [Do and Suh, 2000]. A sample module-junction diagram
is presented in Figure 2.5.
Figure 2.5 – A sample module-junction diagram [Lee, 1999]
There are three types of junctions that can appear in the module-junction structure
diagram, as specified in Table 2.6.
Table 2.6 – Junction Types
Symbol Type Design Type Flow Diagram Representation S Summation Uncoupled Parallel summation of modules C Control Decoupled Sequential processing of modules F Feedback Coupled Feedback loop of sequentially processed
modules
2.2.2.3 AD Flow Diagram
The flow diagram shows the interaction between modules. Once the module-
junction structure diagram is developed, it can be used to generate the flow diagram,
which shows how design information must flow through the system design process. The
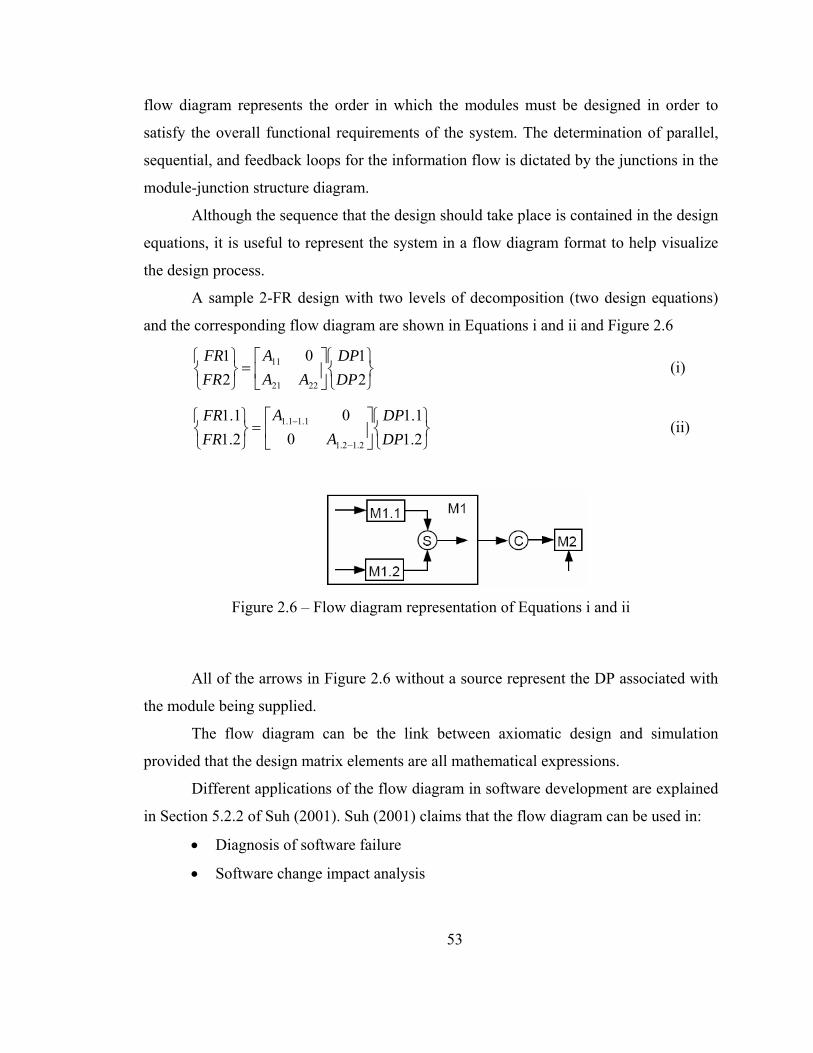
53
flow diagram represents the order in which the modules must be designed in order to
satisfy the overall functional requirements of the system. The determination of parallel,
sequential, and feedback loops for the information flow is dictated by the junctions in the
module-junction structure diagram.
Although the sequence that the design should take place is contained in the design
equations, it is useful to represent the system in a flow diagram format to help visualize
the design process.
A sample 2-FR design with two levels of decomposition (two design equations)
and the corresponding flow diagram are shown in Equations i and ii and Figure 2.6
⎭⎬⎫
⎩⎨⎧⎥⎦
⎤⎢⎣
⎡=
⎭⎬⎫
⎩⎨⎧
210
21
2221
11
DPDP
AAA
FRFR
(i)
⎭⎬⎫
⎩⎨⎧⎥⎦
⎤⎢⎣
⎡=
⎭⎬⎫
⎩⎨⎧
−
−
2.11.1
00
2.11.1
2.12.1
1.11.1
DPDP
AA
FRFR
(ii)
Figure 2.6 – Flow diagram representation of Equations i and ii
All of the arrows in Figure 2.6 without a source represent the DP associated with
the module being supplied.
The flow diagram can be the link between axiomatic design and simulation
provided that the design matrix elements are all mathematical expressions.
Different applications of the flow diagram in software development are explained
in Section 5.2.2 of Suh (2001). Suh (2001) claims that the flow diagram can be used in:
• Diagnosis of software failure
• Software change impact analysis
54
• Job assignment and management of the software development team
• Development of distributed systems
• Development and integration of software-hardware systems
• Defining the human-machine interface
2.2.3 AD Benefits
A detailed list of the benefits of the AD approach is provided in the following
sections since the AD is the base for the PDL proposed in this research, and most, if not
all of the benefits of AD are inherited to the proposed PDL. The ADSI web site has a
similar list, which is used as the source of the list presented here.
2.2.3.1 Benefits to Designers
For a new design effort, the designer designs in a systematic way by following the
AD process, completing prerequisite tasks before continuing to the next stage.
The designer saves time by:
• reducing random searches for solutions,
• minimizing or eliminating design iterations, and
• using current design tools more effectively.
And the designer produces better designs by:
• selecting the best design among good alternatives,
• optimizing the design properly, and
• verifying the design against explicit requirements.
One additional advantage of following AD is to have a documented design as a
by-product of the design for communication between stakeholders, for troubleshooting,
and for reuse.
For diagnosing an existing design, the use of axiomatic design highlights
problems such as coupling and makes clear the relationships between the symptoms of
the problem (one or more FRs not being achieved) and their causes (the specific DPs
affecting those FRs).
55
When an existing design needs an engineering change or an upgrade and if
axiomatic design was used for the design, then the axiomatic design identifies all of the
areas affected by the contemplated changes. As a result, less time is spent on determining
the impact of the change and unintended problems are avoided.
2.2.3.2 Benefits to Managers
The AD provides the following benefits to the managers:
• Helps identify tasks, and task sequence,
• Allows to check the progress against the requirements,
• Allows to select the best option, identify effects throughout the system, and
document changes when managing engineering change requests, and
• Enables better management of communication between the stakeholders by
use of a common language.
2.2.3.3 Benefits to Firms
The firm gains a competitive advantage when its customers’ needs are satisfied.
AD helps make sure that the needs are satisfied. If, for some reason, some of the initial
set of FRs and Cs are not satisfied, the firm can explain the tradeoffs of specific
alternatives to the customer.
Since designers avoid trial and error approach to find the right design, time to
market, another source of competitive advantage, is shortened.
Three types of cost can be lowered: R&D, cost of goods sold (COGS), and
support.
1) The R&D cost is less because designers spend less time designing the product
initially and making engineering changes after the product is released.
2) COGS drops when products are not coupled and therefore are easier to
assemble and test.
3) Support costs are lower because products that are not coupled install and set
up faster, and typically require fewer warranty repairs.
56
Axiomatic design reduces both technical risk and business risk since the
Information Axiom ensures that the chosen design has minimum information content,
which is defined as the most technically probable to succeed. Business risk is also
reduced because:
• products satisfy customers’ needs since FRs are derived from those needs.
• upgrades can be done quickly and effectively.
2.3 AD with Other Methodologies
There are a number of techniques and methods currently used in product design
and development, such as, QFD, TRIZ, and robust design. The use of these and some
other design and analysis techniques is very consistent with the AD. The designer can
follow the AD method and uses the various other techniques when appropriate. In fact,
the structure and hierarchy generated through AD can help the designer apply these
techniques easier and better. For example, the AD helps the designer avoid mistakes such
as unknowingly attempting to optimize a coupled design. The other methods generally
deal with a certain portion of the product development process such as requirement
analysis, identifying a solution to a specified need, optimizing the proposed design, etc.
However, the AD method starts with customer needs assessment and traces requirements
and design decisions throughout the domains defined in the preceding section and the AD
establishes the system architecture.
Chen (1999) states that the AD is the method that illustrates design process and
design method clearly whereas other design methods such as optimization design, robust
design, reliability design, and design for X, may belong to a kind of method for mapping
between a special design requirement and its design solution in the process of AD. He
also says that the AD method guides designers to design the product with all other useful
design methods and AD does not replace them.
Suh (2001) explains the difference between AD and other design methodologies
as:
1) Axiomatic design deals with principles and methodologies rather than simply
algorithms or methodologies. Based on the two design axioms, it derives
57
theorems and corollaries, and also develops methodologies based on
functional analysis and information minimization to achieve robust design.
2) Axiomatic design is applicable to all designs: products, processes, systems,
software, organizations, materials, and business plan.
3) All methodologies, including the Taguchi method, must satisfy the design
axioms for them to be valid. For example, the Taguchi method is valid only
on designs that satisfy the Independence Axiom. So far, there seems to be no
contradiction between Altshuller's methodologies and the design axioms.
4) The Taguchi method does instruct how to make design decisions. It is a
method of checking and improving a finished design.
5) Both axiomatic design and the Taguchi method lead to robust design for
designs that satisfy the Independence Axiom.
6) Although many efforts are being made in industry to improve a bad design
using optimization techniques, the design that violates the Independence
Axiom cannot be improved. Optimization of bad designs leads to optimized
bad designs.
Mohsen and Cekecek (2000) suggest that the AD decomposition can define an
integrated framework to improve quality practices such as Failure Mode and Effect
Analysis (FMEA), Parameter Diagrams (P-Diagram), Testing strategies, and Functional
Requirements Specifications (FRS) as shown in Figure 2.7.
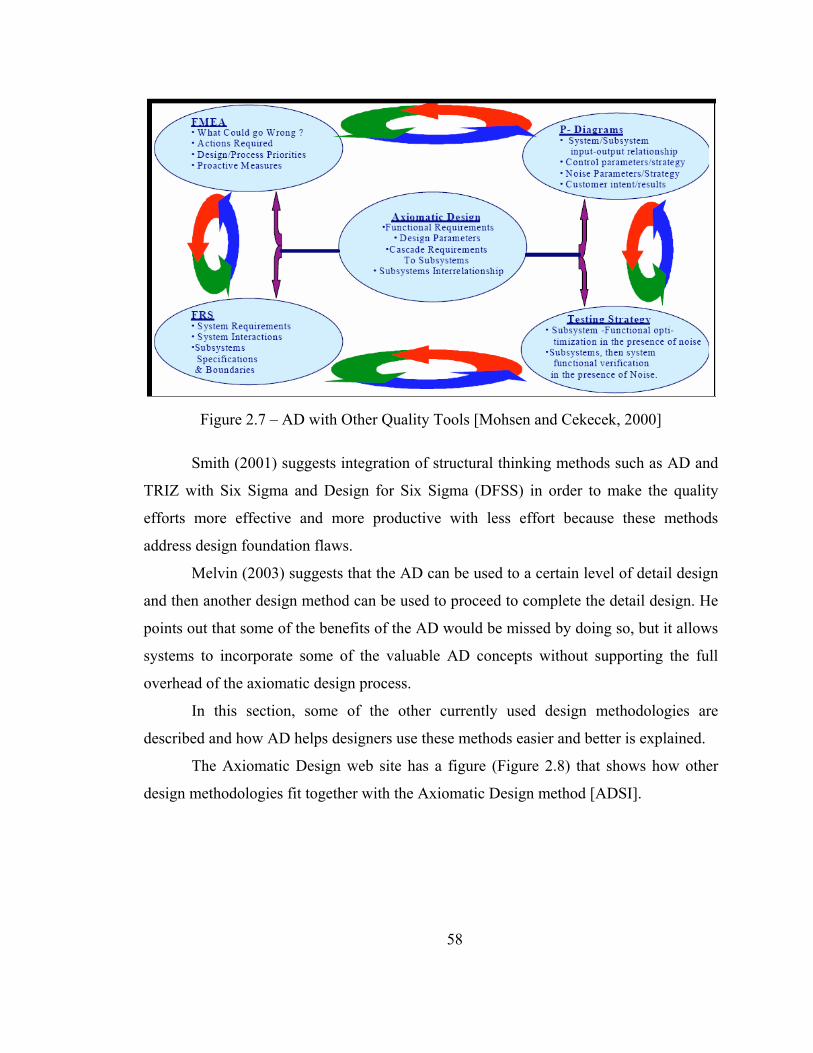
58
Figure 2.7 – AD with Other Quality Tools [Mohsen and Cekecek, 2000]
Smith (2001) suggests integration of structural thinking methods such as AD and
TRIZ with Six Sigma and Design for Six Sigma (DFSS) in order to make the quality
efforts more effective and more productive with less effort because these methods
address design foundation flaws.
Melvin (2003) suggests that the AD can be used to a certain level of detail design
and then another design method can be used to proceed to complete the detail design. He
points out that some of the benefits of the AD would be missed by doing so, but it allows
systems to incorporate some of the valuable AD concepts without supporting the full
overhead of the axiomatic design process.
In this section, some of the other currently used design methodologies are
described and how AD helps designers use these methods easier and better is explained.
The Axiomatic Design web site has a figure (Figure 2.8) that shows how other
design methodologies fit together with the Axiomatic Design method [ADSI].
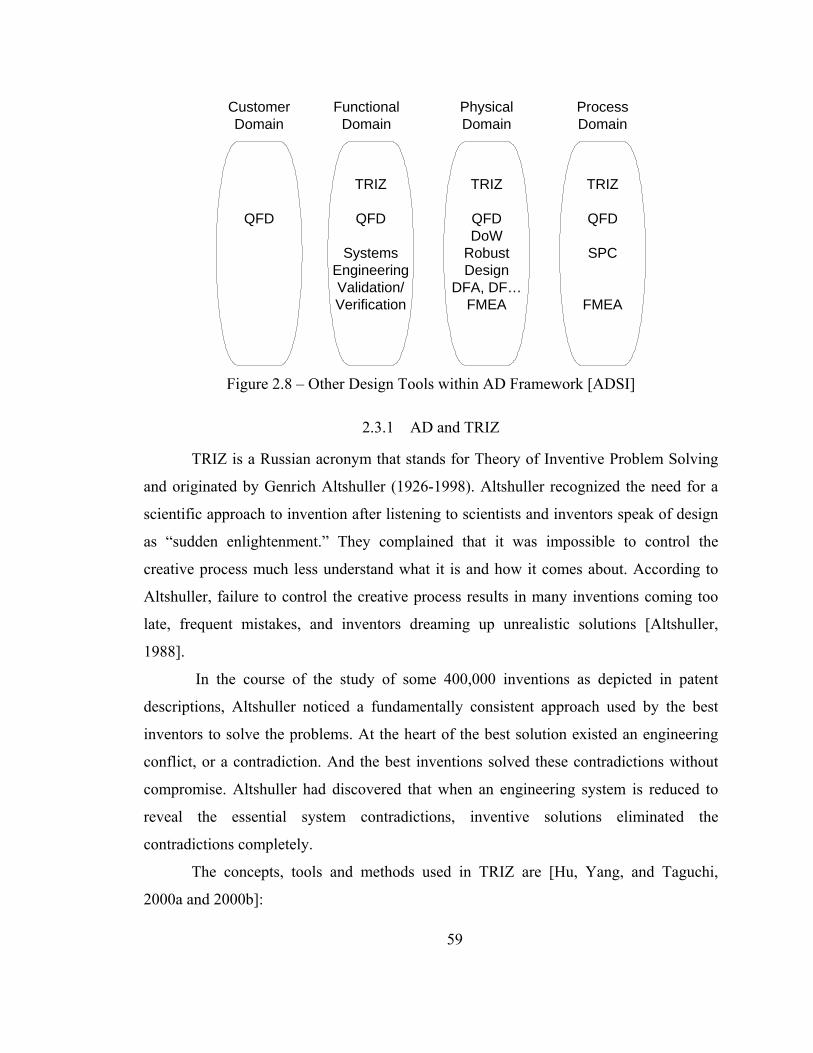
59
QFD
TRIZ
QFD
SPC
FMEA
TRIZ
QFDDoW
RobustDesign
DFA, DF…FMEA
TRIZ
QFD
SystemsEngineeringValidation/Verification
CustomerDomain
FunctionalDomain
PhysicalDomain
ProcessDomain
Figure 2.8 – Other Design Tools within AD Framework [ADSI]
2.3.1 AD and TRIZ
TRIZ is a Russian acronym that stands for Theory of Inventive Problem Solving
and originated by Genrich Altshuller (1926-1998). Altshuller recognized the need for a
scientific approach to invention after listening to scientists and inventors speak of design
as “sudden enlightenment.” They complained that it was impossible to control the
creative process much less understand what it is and how it comes about. According to
Altshuller, failure to control the creative process results in many inventions coming too
late, frequent mistakes, and inventors dreaming up unrealistic solutions [Altshuller,
1988].
In the course of the study of some 400,000 inventions as depicted in patent
descriptions, Altshuller noticed a fundamentally consistent approach used by the best
inventors to solve the problems. At the heart of the best solution existed an engineering
conflict, or a contradiction. And the best inventions solved these contradictions without
compromise. Altshuller had discovered that when an engineering system is reduced to
reveal the essential system contradictions, inventive solutions eliminated the
contradictions completely.
The concepts, tools and methods used in TRIZ are [Hu, Yang, and Taguchi,
2000a and 2000b]:
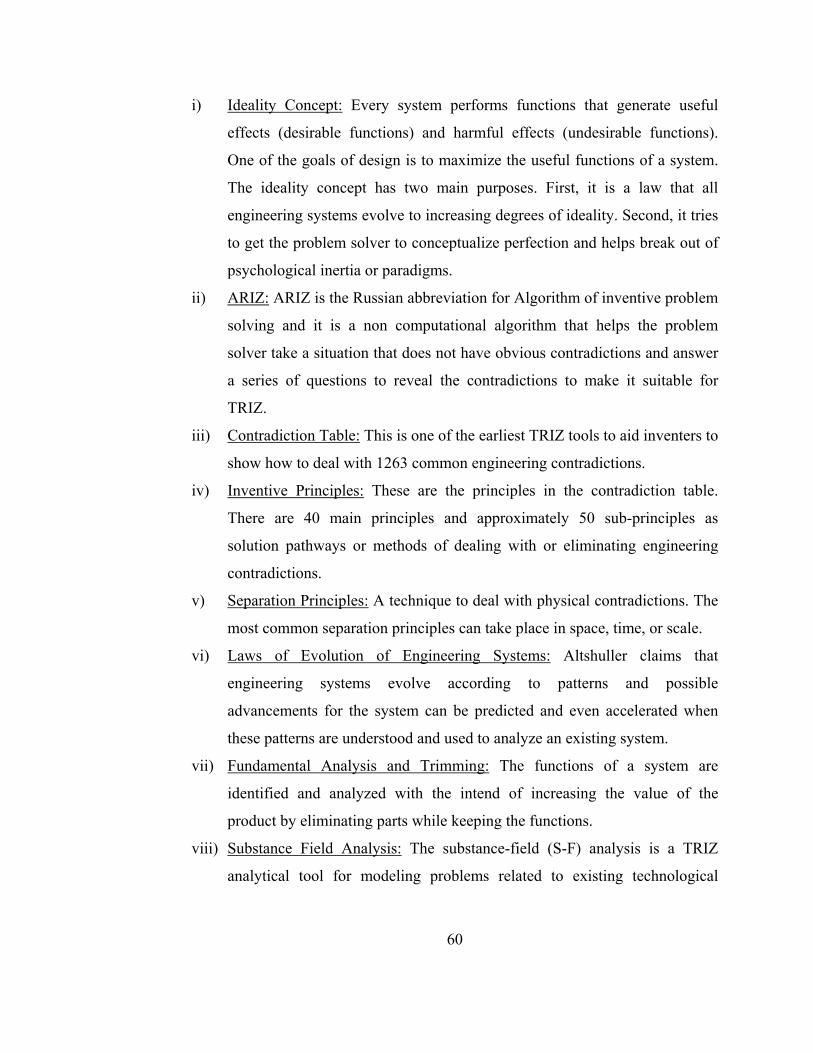
60
i) Ideality Concept: Every system performs functions that generate useful
effects (desirable functions) and harmful effects (undesirable functions).
One of the goals of design is to maximize the useful functions of a system.
The ideality concept has two main purposes. First, it is a law that all
engineering systems evolve to increasing degrees of ideality. Second, it tries
to get the problem solver to conceptualize perfection and helps break out of
psychological inertia or paradigms.
ii) ARIZ: ARIZ is the Russian abbreviation for Algorithm of inventive problem
solving and it is a non computational algorithm that helps the problem
solver take a situation that does not have obvious contradictions and answer
a series of questions to reveal the contradictions to make it suitable for
TRIZ.
iii) Contradiction Table: This is one of the earliest TRIZ tools to aid inventers to
show how to deal with 1263 common engineering contradictions.
iv) Inventive Principles: These are the principles in the contradiction table.
There are 40 main principles and approximately 50 sub-principles as
solution pathways or methods of dealing with or eliminating engineering
contradictions.
v) Separation Principles: A technique to deal with physical contradictions. The
most common separation principles can take place in space, time, or scale.
vi) Laws of Evolution of Engineering Systems: Altshuller claims that
engineering systems evolve according to patterns and possible
advancements for the system can be predicted and even accelerated when
these patterns are understood and used to analyze an existing system.
vii) Fundamental Analysis and Trimming: The functions of a system are
identified and analyzed with the intend of increasing the value of the
product by eliminating parts while keeping the functions.
viii) Substance Field Analysis: The substance-field (S-F) analysis is a TRIZ
analytical tool for modeling problems related to existing technological
61
system. Every system is created to perform some functions. The desired
function is the output from an object or substance (S1) caused by another
object (S2) with the help of some means (types of energy, F). “Substance” is
used in TRIZ literature to refer to some objects of any level of complexity
from a single item to a complex system. The action or means of
accomplishing the action is called a field. S-F analysis looks at the
interaction between substances and fields to describe the situation in a
common language.
Figure 2.9 – S-field
In the figure, S1 and S2 are substances and F is a field. Substance S1 is an article,
material, or object to be controlled or processed. S2 is a tool or an object to control or
process the article S1. F is a kind of energy, which is used for control or interaction. So
the S-field means that an "energy" (F) acting on a "tool" (S2) to modify a "material" (S1).
There are 76 standard substance-field solutions in the TRIZ patent database.
Substance-field analysis and the standard solutions are used to solve problems with
existing systems to identify which of the three elements are missing and how to complete
the system [Hu et al., 2000a].
TRIZ is a very useful method for creative problem solving. However, planning
and designing products involves multiple requirements, multiple functions, multiple
contradictions, while TRIZ problem solving methods are effective for single problems.
Therefore, the use of TRIZ in product design must involve transformation of complex
into simple problems.
Therefore combination of AD and TRIZ will combine the advantages of both
approaches to successfully manage complexity while creating innovate solutions to
62
complex problems. This is because the AD approach has a wider scope as a process
model, covering the whole design process from task clarification to detail design as well
as systems design, while TRIZ focuses on solving the inventive part of a design problem.
Tate and Nordlund (1995) state that one of the complementary properties of AD
and TRIZ is that while AD points out when interdependencies are harmful and can easily
visualize interdependencies between several variables, TRIZ lacks this property.
However, once the conflicting interdependencies are identified, Altshuller provides a set
of tools to resolve it— something Suh’s method lacks.
When a designer has selected an FR and a contradiction and wants to identify
alternative DPs, TRIZ can be helpful in generating alternatives.
Nordlund (1996) suggests this hypothesis about the integration of AD and TRIZ:
Working within the proposed framework, the theory of inventive problem solving
provides a synthesis tool complementary to the analysis rule provided by the
independence axiom within the proposed framework. More specifically, when
dealing with the design of a mechanical system in the proposed framework,
Altshuller’s principles for resolving technical contradictions can sometimes be
applied to resolve a situation where a design parameter (DP) or a process
variable (PV) does not meet a constraint.
Nordlund (1996) proves his hypothesis by giving an example of how AD and
TRIZ can be integrated to find the optimum solution in Section 6.4. Both Tate (1999) and
Suh (2001) also state that AD and TRIZ are complimentary to each other.
Mann (2002) suggests that AD has much to offer TRIZ in terms of better
understanding of both the hierarchical nature of design and the need to pay due attention
to the inter-connections which exist between successive hierarchical layers.
2.3.2 AD and QFD
Yoji Akao (1990) defines QFD as "a method for developing a design quality
aimed at satisfying the consumer and then translating the consumer's demands into
design targets and major quality assurance points to be used throughout the production
phase."
63
The Quality Function Deployment or “House-of-Quality” approach to product
development was originated in 1972 at Mitsubishi’s Kobe shipyard in Japan [Prasad,
1996]. Yoji Akao and Shigeru Mizuno are widely regarded as the father of QFD and his
work led to its first implementation at the Mitsubishi Heavy Industries Kobe Shipyard in
1972. Later, Toyota introduced the House of Quality to identify and prioritize the
customer needs and relate them to engineering characteristics, benchmark them against
competitors’ products, establish important engineering characteristics, and the important
areas for improvement [Suh, 2001]. The achievements made by Toyota through
application of QFD between 1977 and 1984 included a reduction in product development
costs by 61%, a decrease in the development cycle by one third and the virtual
elimination of rust related warranty problems [Sullivan, 1986].
QFD is a systematic, team-based approach that links specific design attributes
with the needs of the customer. The "voice of the customer" is the term to describe these
stated and unstated customer needs or requirements. The voice of the customer is
captured in a variety of ways such as direct discussion, interviews, surveys, focus groups,
customer specifications or the Internet. Understanding of the customer needs is then
summarized in a product planning matrix or "house of quality". These matrices are used
to translate higher level "what's" or needs into lower level "how's" - technical
characteristics to satisfy these needs.
The matrix tool also serves as a means of facilitating objective – rather than
subjective – decision-making, acts as a repository of team knowledge and serves as a
springboard for continuous improvement ideas [Prasad, 1996].
In addition to the "House of Quality" matrix, QFD utilizes "Seven Management
and Planning Tools" which are used in many of its procedures:
1. Affinity diagrams: Used by a team to organize and gain insight into a set of
qualitative information, such as voiced customer requirements. Building an
Affinity Diagram involves the recording of each statement onto separate
cards, which are then sorted into groups with a perceived association. A title
card that summarizes the data within each group is selected from its members
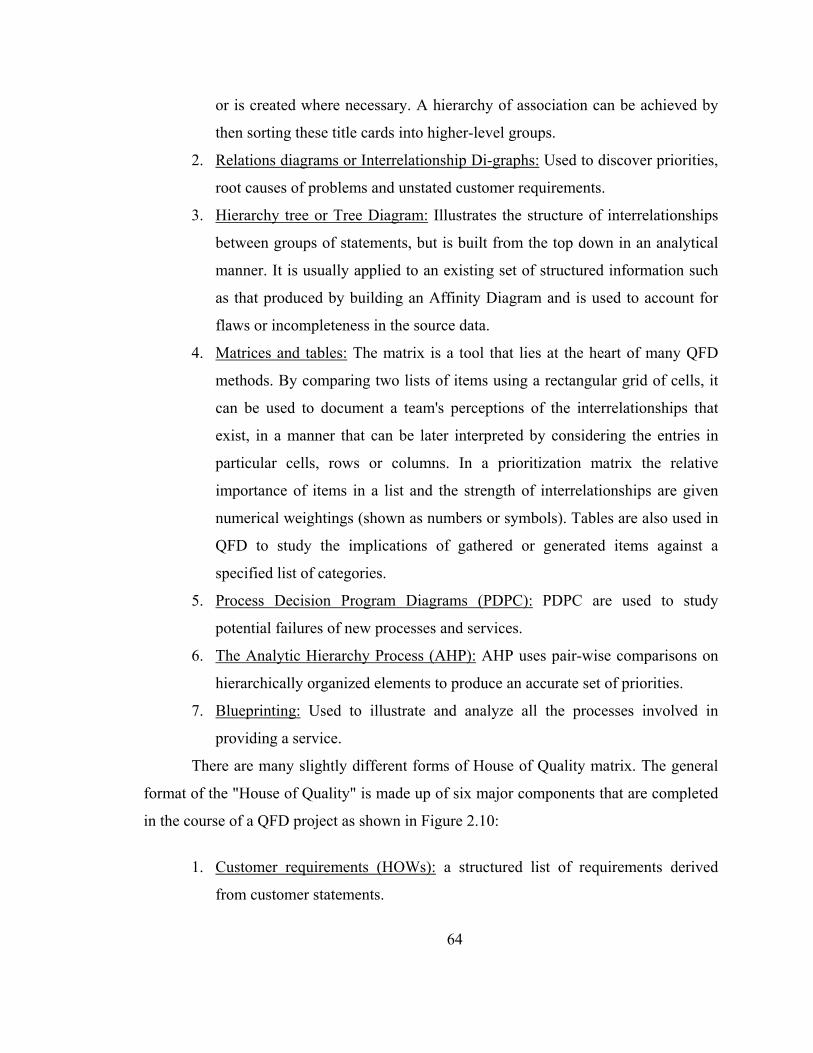
64
or is created where necessary. A hierarchy of association can be achieved by
then sorting these title cards into higher-level groups.
2. Relations diagrams or Interrelationship Di-graphs: Used to discover priorities,
root causes of problems and unstated customer requirements.
3. Hierarchy tree or Tree Diagram: Illustrates the structure of interrelationships
between groups of statements, but is built from the top down in an analytical
manner. It is usually applied to an existing set of structured information such
as that produced by building an Affinity Diagram and is used to account for
flaws or incompleteness in the source data.
4. Matrices and tables: The matrix is a tool that lies at the heart of many QFD
methods. By comparing two lists of items using a rectangular grid of cells, it
can be used to document a team's perceptions of the interrelationships that
exist, in a manner that can be later interpreted by considering the entries in
particular cells, rows or columns. In a prioritization matrix the relative
importance of items in a list and the strength of interrelationships are given
numerical weightings (shown as numbers or symbols). Tables are also used in
QFD to study the implications of gathered or generated items against a
specified list of categories.
5. Process Decision Program Diagrams (PDPC): PDPC are used to study
potential failures of new processes and services.
6. The Analytic Hierarchy Process (AHP): AHP uses pair-wise comparisons on
hierarchically organized elements to produce an accurate set of priorities.
7. Blueprinting: Used to illustrate and analyze all the processes involved in
providing a service.
There are many slightly different forms of House of Quality matrix. The general
format of the "House of Quality" is made up of six major components that are completed
in the course of a QFD project as shown in Figure 2.10:
1. Customer requirements (HOWs): a structured list of requirements derived
from customer statements.
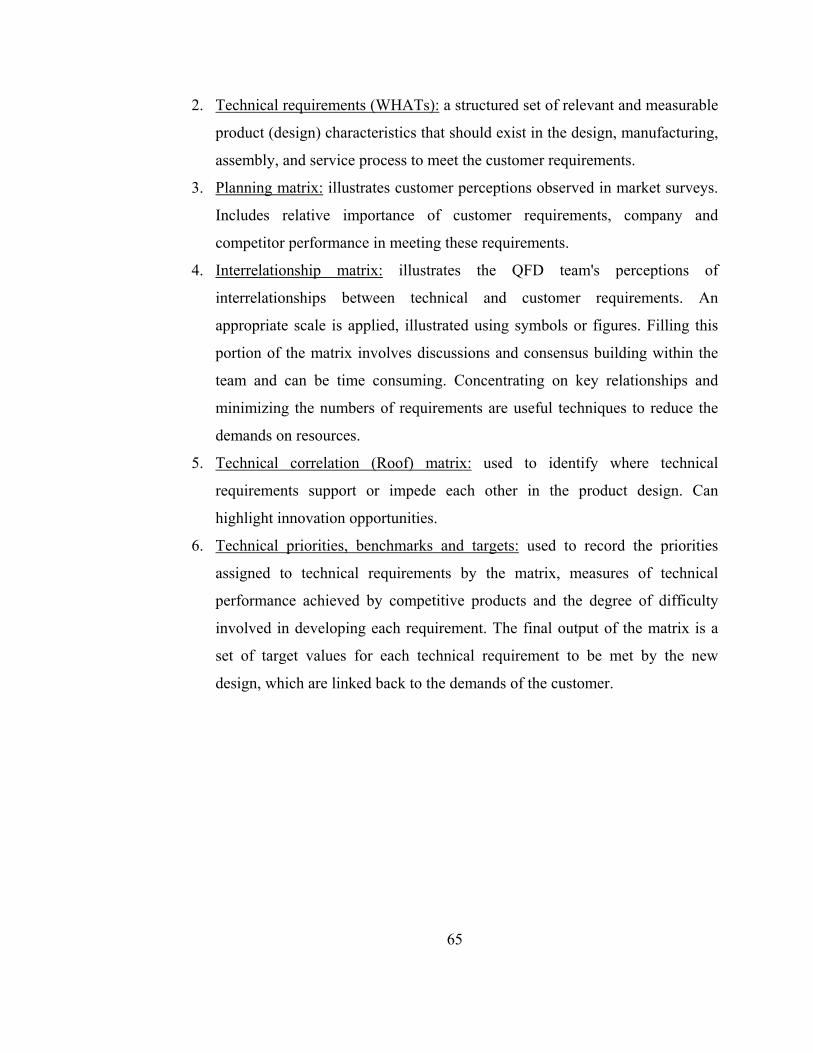
65
2. Technical requirements (WHATs): a structured set of relevant and measurable
product (design) characteristics that should exist in the design, manufacturing,
assembly, and service process to meet the customer requirements.
3. Planning matrix: illustrates customer perceptions observed in market surveys.
Includes relative importance of customer requirements, company and
competitor performance in meeting these requirements.
4. Interrelationship matrix: illustrates the QFD team's perceptions of
interrelationships between technical and customer requirements. An
appropriate scale is applied, illustrated using symbols or figures. Filling this
portion of the matrix involves discussions and consensus building within the
team and can be time consuming. Concentrating on key relationships and
minimizing the numbers of requirements are useful techniques to reduce the
demands on resources.
5. Technical correlation (Roof) matrix: used to identify where technical
requirements support or impede each other in the product design. Can
highlight innovation opportunities.
6. Technical priorities, benchmarks and targets: used to record the priorities
assigned to technical requirements by the matrix, measures of technical
performance achieved by competitive products and the degree of difficulty
involved in developing each requirement. The final output of the matrix is a
set of target values for each technical requirement to be met by the new
design, which are linked back to the demands of the customer.
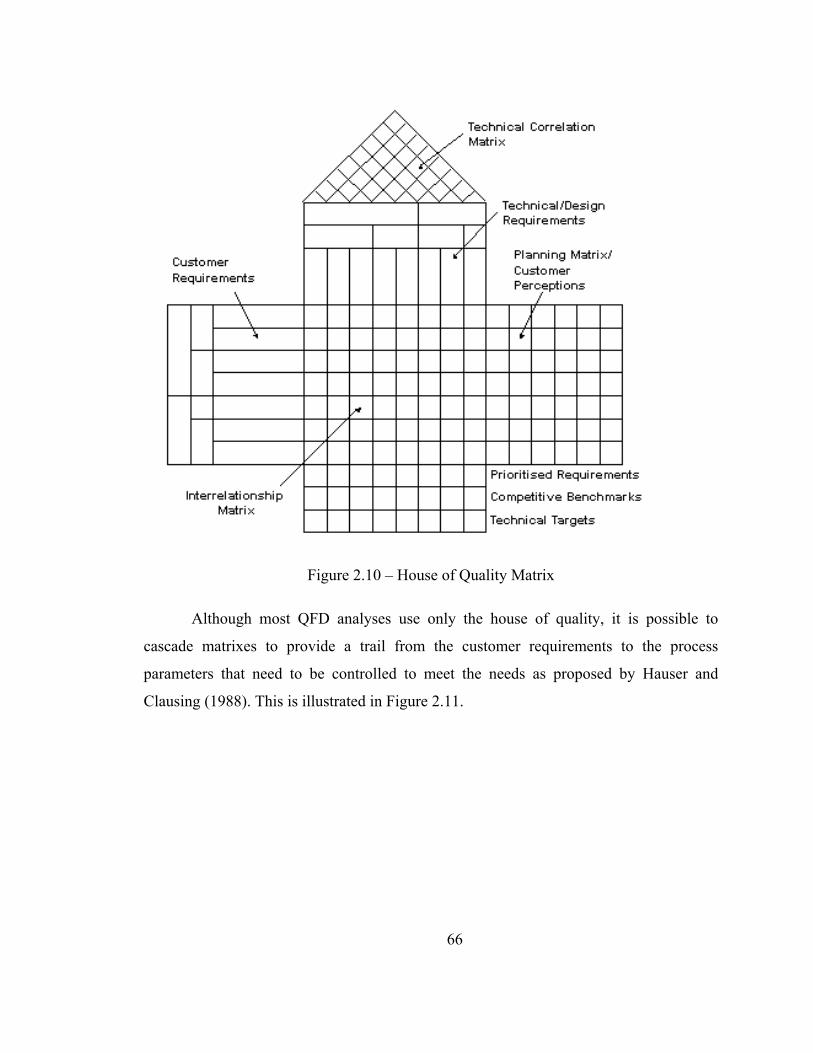
66
Figure 2.10 – House of Quality Matrix
Although most QFD analyses use only the house of quality, it is possible to
cascade matrixes to provide a trail from the customer requirements to the process
parameters that need to be controlled to meet the needs as proposed by Hauser and
Clausing (1988). This is illustrated in Figure 2.11.
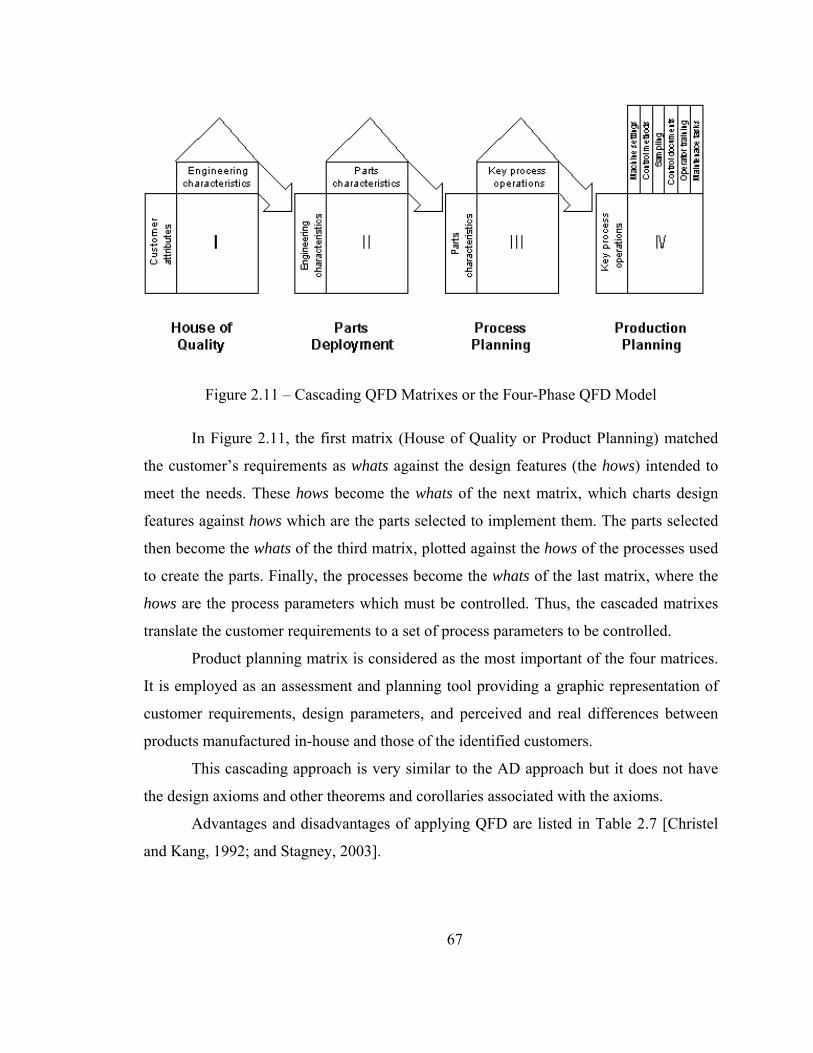
67
Figure 2.11 – Cascading QFD Matrixes or the Four-Phase QFD Model
In Figure 2.11, the first matrix (House of Quality or Product Planning) matched
the customer’s requirements as whats against the design features (the hows) intended to
meet the needs. These hows become the whats of the next matrix, which charts design
features against hows which are the parts selected to implement them. The parts selected
then become the whats of the third matrix, plotted against the hows of the processes used
to create the parts. Finally, the processes become the whats of the last matrix, where the
hows are the process parameters which must be controlled. Thus, the cascaded matrixes
translate the customer requirements to a set of process parameters to be controlled.
Product planning matrix is considered as the most important of the four matrices.
It is employed as an assessment and planning tool providing a graphic representation of
customer requirements, design parameters, and perceived and real differences between
products manufactured in-house and those of the identified customers.
This cascading approach is very similar to the AD approach but it does not have
the design axioms and other theorems and corollaries associated with the axioms.
Advantages and disadvantages of applying QFD are listed in Table 2.7 [Christel
and Kang, 1992; and Stagney, 2003].
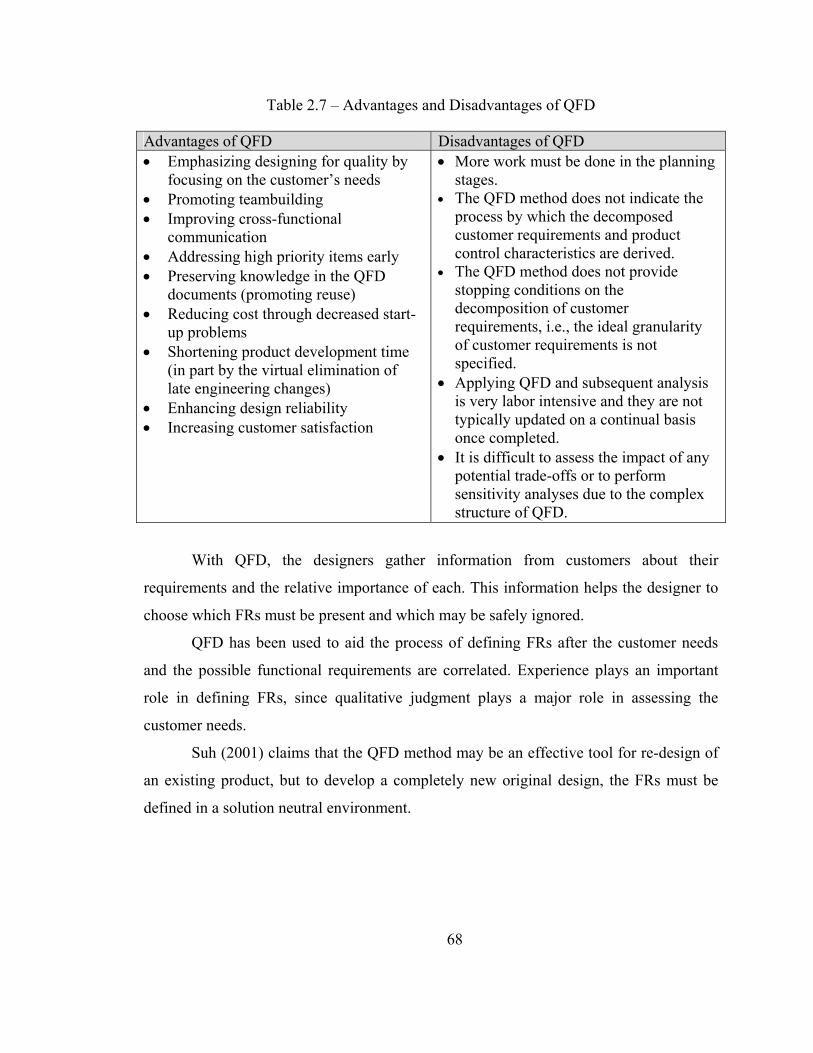
68
Table 2.7 – Advantages and Disadvantages of QFD
Advantages of QFD Disadvantages of QFD • Emphasizing designing for quality by
focusing on the customer’s needs • Promoting teambuilding • Improving cross-functional
communication • Addressing high priority items early • Preserving knowledge in the QFD
documents (promoting reuse) • Reducing cost through decreased start-
up problems • Shortening product development time
(in part by the virtual elimination of late engineering changes)
• Enhancing design reliability • Increasing customer satisfaction
• More work must be done in the planning stages.
• The QFD method does not indicate the process by which the decomposed customer requirements and product control characteristics are derived.
• The QFD method does not provide stopping conditions on the decomposition of customer requirements, i.e., the ideal granularity of customer requirements is not specified.
• Applying QFD and subsequent analysis is very labor intensive and they are not typically updated on a continual basis once completed.
• It is difficult to assess the impact of any potential trade-offs or to perform sensitivity analyses due to the complex structure of QFD.
With QFD, the designers gather information from customers about their
requirements and the relative importance of each. This information helps the designer to
choose which FRs must be present and which may be safely ignored.
QFD has been used to aid the process of defining FRs after the customer needs
and the possible functional requirements are correlated. Experience plays an important
role in defining FRs, since qualitative judgment plays a major role in assessing the
customer needs.
Suh (2001) claims that the QFD method may be an effective tool for re-design of
an existing product, but to develop a completely new original design, the FRs must be
defined in a solution neutral environment.
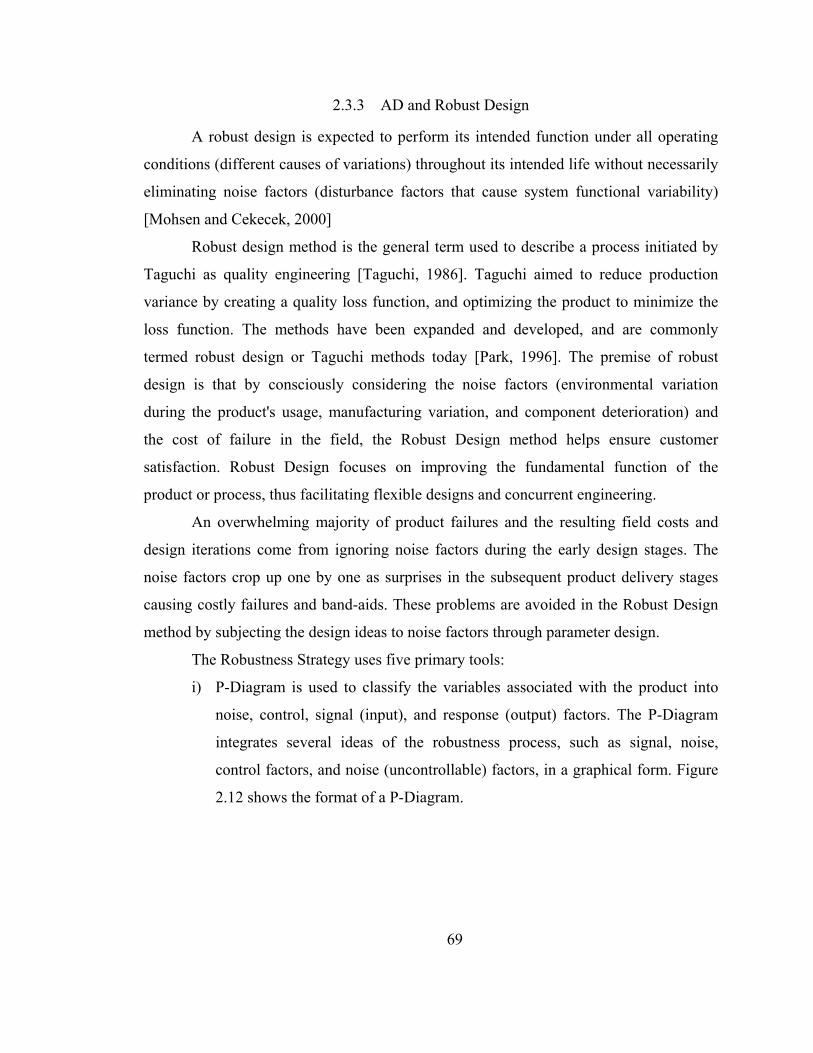
69
2.3.3 AD and Robust Design
A robust design is expected to perform its intended function under all operating
conditions (different causes of variations) throughout its intended life without necessarily
eliminating noise factors (disturbance factors that cause system functional variability)
[Mohsen and Cekecek, 2000]
Robust design method is the general term used to describe a process initiated by
Taguchi as quality engineering [Taguchi, 1986]. Taguchi aimed to reduce production
variance by creating a quality loss function, and optimizing the product to minimize the
loss function. The methods have been expanded and developed, and are commonly
termed robust design or Taguchi methods today [Park, 1996]. The premise of robust
design is that by consciously considering the noise factors (environmental variation
during the product's usage, manufacturing variation, and component deterioration) and
the cost of failure in the field, the Robust Design method helps ensure customer
satisfaction. Robust Design focuses on improving the fundamental function of the
product or process, thus facilitating flexible designs and concurrent engineering.
An overwhelming majority of product failures and the resulting field costs and
design iterations come from ignoring noise factors during the early design stages. The
noise factors crop up one by one as surprises in the subsequent product delivery stages
causing costly failures and band-aids. These problems are avoided in the Robust Design
method by subjecting the design ideas to noise factors through parameter design.
The Robustness Strategy uses five primary tools:
i) P-Diagram is used to classify the variables associated with the product into
noise, control, signal (input), and response (output) factors. The P-Diagram
integrates several ideas of the robustness process, such as signal, noise,
control factors, and noise (uncontrollable) factors, in a graphical form. Figure
2.12 shows the format of a P-Diagram.
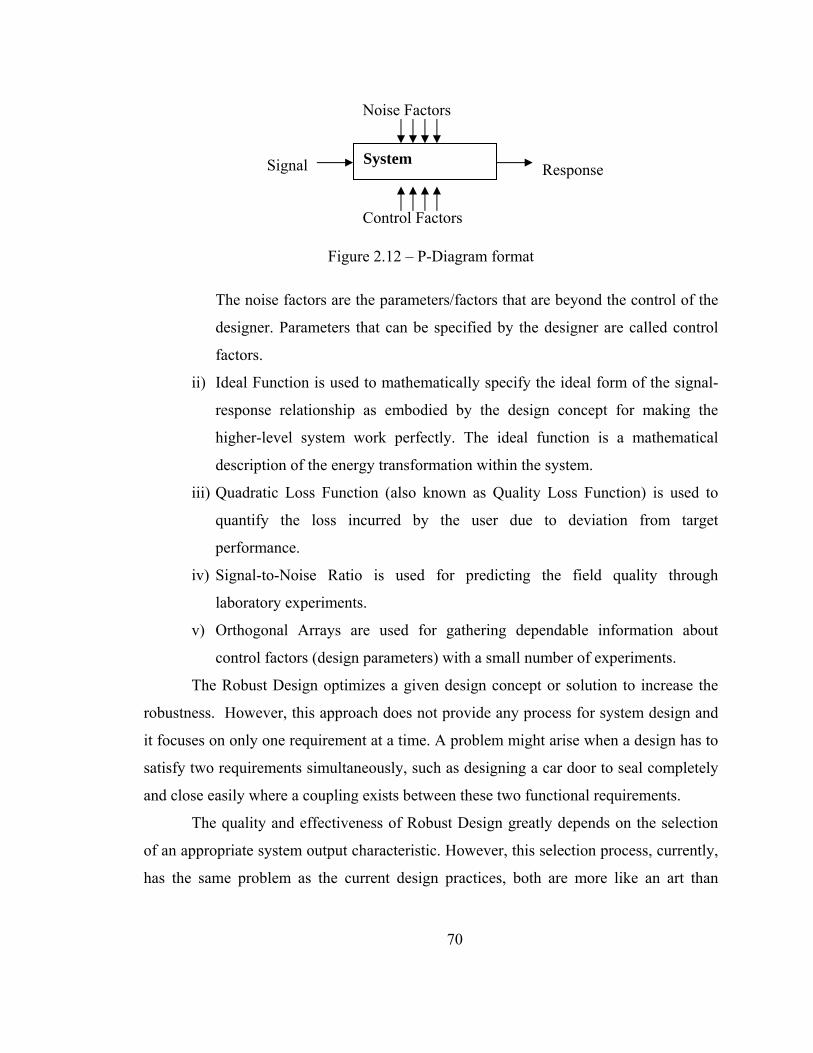
70
Figure 2.12 – P-Diagram format
The noise factors are the parameters/factors that are beyond the control of the
designer. Parameters that can be specified by the designer are called control
factors.
ii) Ideal Function is used to mathematically specify the ideal form of the signal-
response relationship as embodied by the design concept for making the
higher-level system work perfectly. The ideal function is a mathematical
description of the energy transformation within the system.
iii) Quadratic Loss Function (also known as Quality Loss Function) is used to
quantify the loss incurred by the user due to deviation from target
performance.
iv) Signal-to-Noise Ratio is used for predicting the field quality through
laboratory experiments.
v) Orthogonal Arrays are used for gathering dependable information about
control factors (design parameters) with a small number of experiments.
The Robust Design optimizes a given design concept or solution to increase the
robustness. However, this approach does not provide any process for system design and
it focuses on only one requirement at a time. A problem might arise when a design has to
satisfy two requirements simultaneously, such as designing a car door to seal completely
and close easily where a coupling exists between these two functional requirements.
The quality and effectiveness of Robust Design greatly depends on the selection
of an appropriate system output characteristic. However, this selection process, currently,
has the same problem as the current design practices, both are more like an art than
System Signal Response
Noise Factors
Control Factors
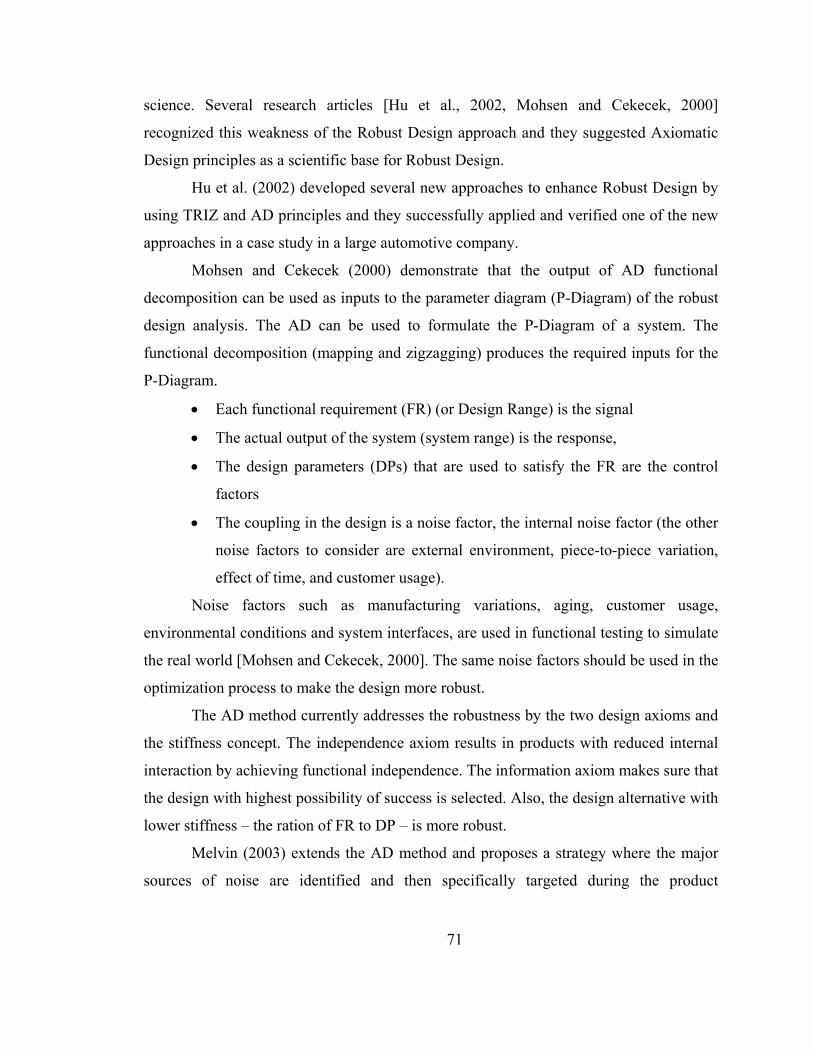
71
science. Several research articles [Hu et al., 2002, Mohsen and Cekecek, 2000]
recognized this weakness of the Robust Design approach and they suggested Axiomatic
Design principles as a scientific base for Robust Design.
Hu et al. (2002) developed several new approaches to enhance Robust Design by
using TRIZ and AD principles and they successfully applied and verified one of the new
approaches in a case study in a large automotive company.
Mohsen and Cekecek (2000) demonstrate that the output of AD functional
decomposition can be used as inputs to the parameter diagram (P-Diagram) of the robust
design analysis. The AD can be used to formulate the P-Diagram of a system. The
functional decomposition (mapping and zigzagging) produces the required inputs for the
P-Diagram.
• Each functional requirement (FR) (or Design Range) is the signal
• The actual output of the system (system range) is the response,
• The design parameters (DPs) that are used to satisfy the FR are the control
factors
• The coupling in the design is a noise factor, the internal noise factor (the other
noise factors to consider are external environment, piece-to-piece variation,
effect of time, and customer usage).
Noise factors such as manufacturing variations, aging, customer usage,
environmental conditions and system interfaces, are used in functional testing to simulate
the real world [Mohsen and Cekecek, 2000]. The same noise factors should be used in the
optimization process to make the design more robust.
The AD method currently addresses the robustness by the two design axioms and
the stiffness concept. The independence axiom results in products with reduced internal
interaction by achieving functional independence. The information axiom makes sure that
the design with highest possibility of success is selected. Also, the design alternative with
lower stiffness – the ration of FR to DP – is more robust.
Melvin (2003) extends the AD method and proposes a strategy where the major
sources of noise are identified and then specifically targeted during the product
72
conceptual design. He lists several strategies to make the design more robust; such as
reducing FR sensitivity to a noise factor, reducing the noise factor, and compensating for
FR variation due to a noise factor.
2.3.4 AD and Concurrent Engineering
Designers cannot make all the decisions about products characteristics, such as
geometry, product components, and performance specification, without taking into
consideration of factors and concerns about manufacturing/construction, assembly,
testing, distribution, maintenance, repair, disassembly, recycling, and disposal. Certain
functions or features may require specific materials, manufacturing and assembly
processes, or they may limit the options for recycle and disposal of the product.
Concurrent engineering (or design) can be defined as simultaneous design of all aspects
of a product – from concept generation to manufacture, assembly, test, maintenance, and
disposal [Voland, 2004].
Prior to 1980s, over-the-wall approach was in use in the industry, there was
minimal feedback from later phases of product development lifecycle to the earlier
phases. The role of the manufacturing was to build what the designers generated and
presented on drawings and other design documentation whereas the role of the assembly
was to put together what manufacturing produced [Ullman, 1992]. This over-the-wall
approach was causing a lot of problems in production and assembly phases as well as
during the use of the product. A General Electric survey indicated that 60% of all
manufactured parts were not made exactly as represented in the drawings due to varied
reasons, such as, (i) the drawings were incomplete, (ii) the parts could not be made as
designed, (iii) the drawings were ambiguous, and (iv) the parts could not be assembled if
manufactured as designed [Ullman, 1992].
The concurrent design approach has overcome most of the problems of the over-
the-wall approach. In concurrent engineering, design teams are composed of members
representing one or more areas of the product development lifecycle (such as design,
marketing, finance, manufacturing, assembly, test, packaging, and recycling). The design
teams work together throughout the design phase (preliminary and detail design, if
73
applicable) to ensure that all concerns and factors from different aspects of the product
are taken into consideration and needs are satisfied by the final product.
Concurrent engineering establishes more effective communication links among
the product’s stakeholders and allows critical issues to be resolved much earlier in the
product development lifecycle, thereby reducing the need for corrective actions to be
taken after substantial amounts of time, effort, and money have been invested. These
characteristics of concurrent engineering have reduced the time required for producing a
new product [Voland, 2004]. It was estimated that concurrent engineering has resulted in
30 to 40 percent decrease in manufacturing costs, and 75 percent decrease in
scrap/rework efforts [Walker and Boothroyd, 1996].
The ability to communicate design decisions and to coordinate the creative
process among diverse disciplines determines the effectiveness of concurrent engineering
as a strategy for achieving shorter time to market, reduced development costs, and
higher-quality products [Albano and Suh, 1994]. Albano and Suh claims that the potential
benefits of concurrent engineering have not been fully realized since there is a lack of a
systematic framework for conducting group design activities, and basic principles for
decision-making. According to Albano and Suh (1994):
Effective communication involves much more than the traditional exchange of
drawings and design specifications. The participants must be able to
communicate design intent (i.e. what are the governing requirements and
constraints? and how does the design satisfy these criteria?) and design rationale
(i.e. why was a particular solution alternative selected for implementation?). In
the absence of good communication, it is difficult to integrate the contributions of
diverse disciplines into a coherent product and to identify solution concepts that
may ultimately fail to satisfy, some or all of the needs of the customer. In addition
to interdisciplinary communication, the flow of information between designers
must also be coordinated and managed with regard to any dependencies that may
arise or shared information that may be required. Proper sequencing of
74
interdependent design activities minimizes expensive and time-consuming design
iterations as more information becomes available. pp. 500.
Axiomatic design approach was introduced as a framework of enhanced
concurrent engineering by Jung (1993) and by Albano and Suh (1994). AD provides a
systematic approach for product design and production planning in order to foster
communication and coordination among design disciplines and help in the decision-
making process [Albano and Suh, 1994].
In AD, process domain includes the process variables (PVs) that are the processes
to manufacture the DPs. During product development based on the AD method, the
developer has to consider the PVs in the product design (developing DPs) and make sure
that the proposed design solutions can be manufactured. The process matrix [B] that
relates the DPs to the PVs, like the product design matrix [A], is also supposed to satisfy
the Independence Axiom to make sure that the manufacturing processes are robust
enough to manufacture the proposed design.
Suh (2001) states that in terms of AD terminology, both the product design matrix
[A] and the process design matrix [B] must satisfy the Independence Axiom by being a
diagonal or triangular matrix so that the product of these matrices [CE]=[A][B] must
be diagonal or triangular and concurrent engineering can be possible. The elements of
the [CE] matrix are:
CEik = ΣjAij Bjk
This concept is stated as Theorem 9 (Design for Manufacturability) in AD [Suh,
2001, pg. 61].
It is not efficient and may not be practical to share the whole detail design with
other design teams. The hierarchical design decomposition and the system architecture
plays the role of filtering the design knowledge so that only the pertinent information is
communicated [Lee, 1999]. The multi-layer or the master design matrix makes sure that
the top-level design intent is still maintained and the FRs are still satisfied.
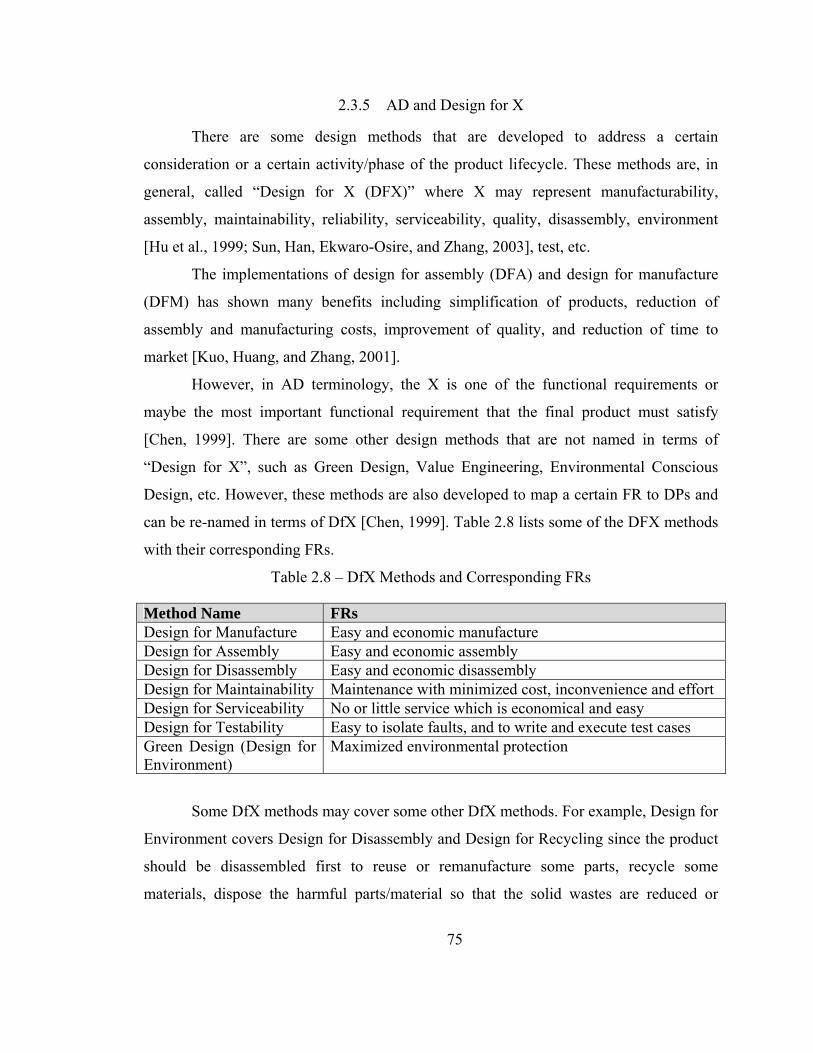
75
2.3.5 AD and Design for X
There are some design methods that are developed to address a certain
consideration or a certain activity/phase of the product lifecycle. These methods are, in
general, called “Design for X (DFX)” where X may represent manufacturability,
assembly, maintainability, reliability, serviceability, quality, disassembly, environment
[Hu et al., 1999; Sun, Han, Ekwaro-Osire, and Zhang, 2003], test, etc.
The implementations of design for assembly (DFA) and design for manufacture
(DFM) has shown many benefits including simplification of products, reduction of
assembly and manufacturing costs, improvement of quality, and reduction of time to
market [Kuo, Huang, and Zhang, 2001].
However, in AD terminology, the X is one of the functional requirements or
maybe the most important functional requirement that the final product must satisfy
[Chen, 1999]. There are some other design methods that are not named in terms of
“Design for X”, such as Green Design, Value Engineering, Environmental Conscious
Design, etc. However, these methods are also developed to map a certain FR to DPs and
can be re-named in terms of DfX [Chen, 1999]. Table 2.8 lists some of the DFX methods
with their corresponding FRs.
Table 2.8 – DfX Methods and Corresponding FRs
Method Name FRs Design for Manufacture Easy and economic manufacture Design for Assembly Easy and economic assembly Design for Disassembly Easy and economic disassembly Design for Maintainability Maintenance with minimized cost, inconvenience and effort Design for Serviceability No or little service which is economical and easy Design for Testability Easy to isolate faults, and to write and execute test cases Green Design (Design for Environment)
Maximized environmental protection
Some DfX methods may cover some other DfX methods. For example, Design for
Environment covers Design for Disassembly and Design for Recycling since the product
should be disassembled first to reuse or remanufacture some parts, recycle some
materials, dispose the harmful parts/material so that the solid wastes are reduced or
76
eliminated to protect the environment [Chen, 1999]. Disassembly and recycle related FRs
can be derived from the environment protection related FR where environment protection
FR can be at any level of the FR hierarchy.
The problem with only using the DfX methods is that the solution will satisfy the
corresponding FR but not all the FRs that are required from the final product. In order to
make sure that all of the FRs that are required and established for the final product are
satisfied, it is obvious that the AD method should be used [Chen, 1999].
Chen (1999) claims that AD can be applied to develop a DfX method when the
corresponding FRs are identified: the first axiom helps develop the design guidelines
(DPs) and the second axiom helps develop the quantitative evaluation score to select the
best design. He used AD to develop a design for assembly method and proved his claim
[Chen, 1999].
2.3.6 AD and Failure Modes and Effect Analysis (FMEA)
FMEA is a series of techniques for identifying potential failure modes, their
effects on a product performance, and their significance [Kletz, 1999]. FMEA is best
used at the design phase in order to test the proposed design and to minimize the risks
associated with the design [Palady, 1995].
In an FMEA, the potential failure modes that describe how the design could fail to
perform its required functions are determined for each function (functional requirement)
and the effects of the failure modes are described in terms of what a customer would feel.
Unlike AD, a conventional FMEA does not describe the functional requirements
and design solutions systematically in a hierarchical manner [Mohsen and Cekecek,
2000]. Thus, all of the possible failure modes may not be identified and robustness
opportunities may be missed.
The FMEA development becomes more systematic and more effective by using
the AD. The AD provides relationships between FRs and DPs and between DPs and PVs
in a hierarchy that can be used in FMEA technique to improve the design/process
robustness and minimize the risks associated with a given design [Mohsen and Cekecek,
77
2000]. The end result of increased robustness and minimized risks is decreased
information content of the proposed design.
Since the DPs provide the physical means that affect the functional requirements,
all potential causes of failures for a particular failure mode for a given FR can easily be
determined. Also, the design hierarchy produced by the AD can be used for an in-depth
analysis of the potential causes of failures [Mohsen and Cekecek, 2000].
Satisfying the first axiom of the AD by an uncoupled design ensures that there
would be no possibilities of failures due to system/subsystem interactions (coupling).
Even in a decoupled design, the system/subsystem interactions can be identified and
taken into consideration [Mohsen and Cekecek, 2000].
2.4 AD and Product Development Lifecycle
AD deals with four domains of PDL: customer, functional, physical, and process
domains. However, the PDL management deals with these domains as well as other
domains and activities, such as test domain and component structure, requirement
management, change management, project management, quality assurance, etc. Although
the AD method does not cover all the PDL domains, it provides a very structured system
architecture that can support all of the PDL activities in varying degrees.
Activities such as requirement management, change management, and testing as
well as project management are performed throughout the product development lifecycle.
These activities benefit from the structured approach of the AD. Although majority of the
testing activities are performed towards the end of the lifecycle, testing considerations
should be kept in mind starting from the early phases of the lifecycle. In addition, the
quality of the testing very much depends on the quality and robustness of the lifecycle
method and requirement management approach used.
In the following subsections, how the AD method supports some of the PDL
activities is explained. The purpose of this discussion is to prove that AD provides a solid
foundation for these activities. This will serve to further explain why the AD method is
extended to cover the whole PDL to develop the Axiomatic Product Development
Lifecycle (APDL).
78
2.4.1 AD and Requirement Management
If AD is applied to a development effort, first CNs are identified and then the FRs
are decomposed to create the FR hierarchy. This step-by-step approach provides a
structured method of requirements gathering and clarification. The customer needs and
functional requirement hierarchy can be used to develop a requirement specifications
document. This helps achieve the first objective of requirements management, that is, to
capture the requirement right.
Tools and methodologies are required to assess the impact of requirement changes
on the rest of the product development lifecycle in order for the customers and the
product development team to make informed decisions as to which requirement changes
are viable and practical. Hintersteiner (2000) suggests that by incorporating Axiomatic
Design principles, the system architecture evaluates the quality of a design and its
robustness to changing requirements, as well as showing how a proposed design change
impacts other aspects of the design. The mapping between the design domains and the
decomposition provides a structure that can be used to trace the requirements to make
sure that all of the requirements are satisfied in the design and process domains. This
helps partially achieve the second and the third objectives of requirements management,
that is, to manage changing requirements, and to align the system development lifecycle
activities with the requirements.
However, AD does not require creating a mapping matrix between the customer
needs and the functional requirements. Furthermore, AD does identify the DPs but does
not identify the physical entities that provide the design solutions stated in the DPs nor
the verification and validation activities. Therefore, AD does not provide full requirement
traceability; from the CNs to the components and test activities. Not being able to trace
requirements throughout the product development lifecycle hinders the effort of change
impact analysis and change management for both requirement changes and design
changes.
Gumus, Ertas, Unuvar, and Doganli (2002) extended the AD approach for better
requirement traceability. Gumus and Ertas (2004a; 2004b) proposed a quantitative
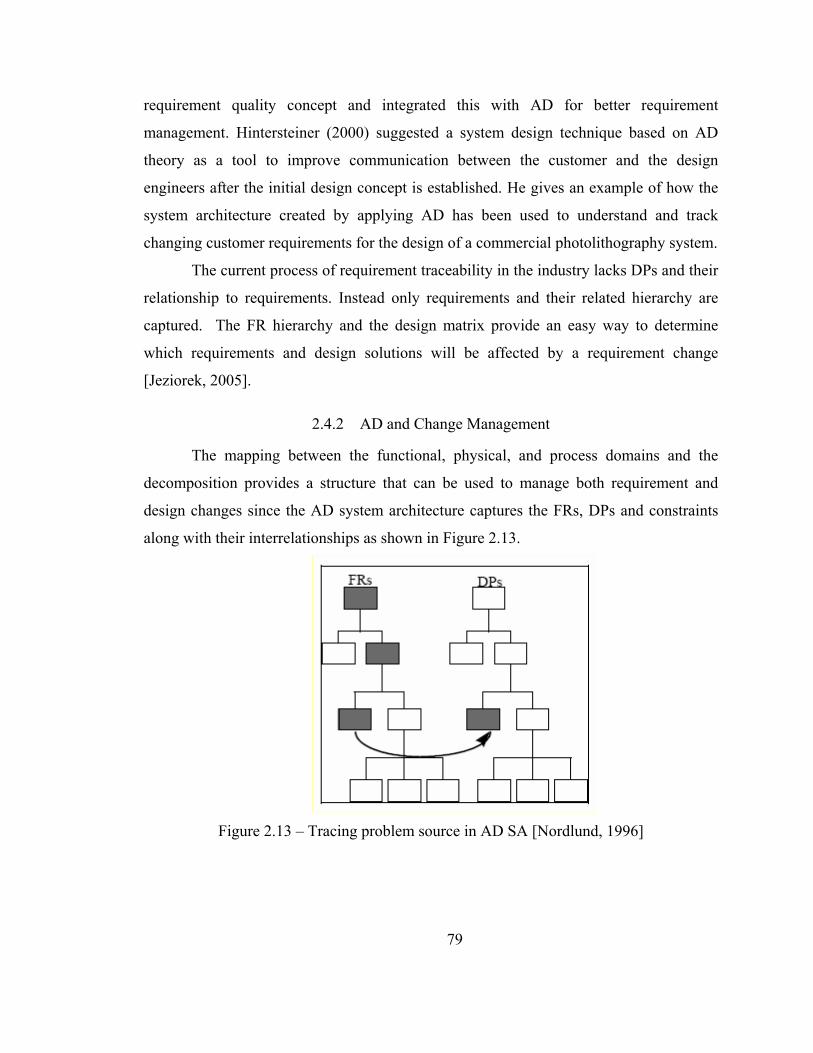
79
requirement quality concept and integrated this with AD for better requirement
management. Hintersteiner (2000) suggested a system design technique based on AD
theory as a tool to improve communication between the customer and the design
engineers after the initial design concept is established. He gives an example of how the
system architecture created by applying AD has been used to understand and track
changing customer requirements for the design of a commercial photolithography system.
The current process of requirement traceability in the industry lacks DPs and their
relationship to requirements. Instead only requirements and their related hierarchy are
captured. The FR hierarchy and the design matrix provide an easy way to determine
which requirements and design solutions will be affected by a requirement change
[Jeziorek, 2005].
2.4.2 AD and Change Management
The mapping between the functional, physical, and process domains and the
decomposition provides a structure that can be used to manage both requirement and
design changes since the AD system architecture captures the FRs, DPs and constraints
along with their interrelationships as shown in Figure 2.13.
Figure 2.13 – Tracing problem source in AD SA [Nordlund, 1996]
80
Change impact analysis can be performed using the AD system architecture. This
includes choosing between alternative concepts, guiding the sequence of the design, and
developing options for decoupling coupled parts of an existing design [Harutunian,
Nordlund, Tate, and Suh, 1996; Nordlund, 1996; Lee, 1999].
Tate (1996) classified DP changes into three groups (i) change of DP itself, (ii)
change of DP details/parameters, and (iii) change of DP values. Type ii and iii changes
do not affect the design matrix since the DP itself did not change. However, the design
matrix and the master design matrix have to be reevaluated for Type (i) changes [Lee,
1999].
Jeziorek (2005) introduced cost units (CUs) (or physical components) for tracking
changes to the CUs in order to calculate the cost of a proposed change. He proposes that
once the decomposition process is completed, all of the physical components, or costing
units (CUs), must be identified.
The design matrix captures the relationship between FRs and the DPs that satisfy
those requirements. The traceability provided by the design matrix aids in defining the
scope of a design change and allows engineers to identify the FRs and DPs that will be
affected by the design change. If this traceability knowledge is not available, a team of
experts must come together to try to identify the requirements and solutions that will be
affected by the change. However, the team of experts can potentially include unaffected
requirements and solutions and exclude others that are affected and this would result in
much higher cost for change impact analysis [Jeziorek, 2005].
Many components interact with each other physically as well as functionally.
However, this information is typically not captured by a design matrix as part of AD.
Instead, a new component-component matrix was created in order to capture physical
interactions between components [Trewn and Yang, 2000; Jeziorek, 2005]. With the
component relationships matrix, change management can be extended to related
components.
Jeziorek (2005) lists five of many different ways of interaction between
components: physical, spatial, thermal, information and electromagnetic.
81
2.4.3 AD and Testing
The AD decomposition allocates the functional requirements and constraints to
individual DPs and this framework helps develop a test plan as well as test procedures
from DPs to subsystem to system level verification [Mohsen and Cekecek, 2000]
However, the AD does not necessarily identify individual components and
subsystems since the DPs do not represent the physical architecture of the system.
Furthermore, AD does not include the test domain.
2.4.4 AD and Project Management
Identifying the tasks (Work Breakdown Structure – WBS), optimally assigning
the tasks to the available resources, and workflow management are some of the most
important activities of project planning and management and can make significant
difference in the delivery time and cost. Identifying the tasks necessary to fulfill a design
and matching the best available human resources to those tasks is project manager’s
responsibility. The project schedule is used for determining what needs to be
accomplished next, to monitor the expected progress over time or ascertain dependencies
between tasks.
Steward and Tate (2000) and Braha (2002) proposed to integrate AD into the
process of project planning and task assignment for software development projects. The
DPs were loaded into a project Gantt chart as tasks along with the dependencies from the
design matrices. By adding time estimates to the individual tasks and making
assumptions about the resources allocation, the Gantt chart takes on a common
appearance of tasks distributed over time with internal dependencies [Steward and Tate,
2000].
The most remarkable benefits of the application of AD to the construction of
project plans were the early delivery of detail in identified tasks and the extent of
interactions captured as links between tasks [Steward and Tate, 2000].
In addition to using the DPs and the design matrix to establish the work
breakdown structure (WBS), AD helps in requirement management and change
82
management as explain in the preceding sections. Successful requirement and change
management are prerequisites for successful project management.
2.5 Design and Creativity
The word “creativity” has been used in different context and with different
meanings. It has been used to describe the human activity that results in ingenious,
unpredictable, or unforeseen results (e.g., new products, processes, and systems) while
solving the needs and problems of society or human aspirations. In this context, creative
solutions are discovered or derived by inspirations and/or perspiration, and often times
the end result is not specifically defined. This creative spark or revelation may occur
because of the capabilities of the human brain such as storing huge amount of data and
synthesizing solutions through the use of associative memory, pattern recognition,
digestion and recombination of diverse facts, and permutations of events.
Sometimes the word creativity has been used in mysterious sense, when the
process or the logic involved in a given intellectual endeavor (e.g., arts and music) is not
fully understood, and yet the result of the effort is intellectually, emotionally, or
aesthetically appealing and acceptable. A subject is always mysterious when it relies on
an implicit thought process that cannot be stated explicitly and explained for others to
understand and that can be learned only through experience, apprenticeship, or trial and
error. Design has been one of these mysteries, but this intellectual and mental barrier has
to be overcome by converting design into science to support and structure the creative
process.
In most professions, competent work requires the disciplined use of established
practices. It is not a matter of creativity versus discipline, but of bringing discipline to the
work so that creativity can happen. The use of methodologies brings order and efficiency
to any job and allows workers to concentrate of producing a superior product. A
disciplined effort removes waste, error, and inefficiency, freeing financial resources for
better uses.
83
The proposed PDL approach along with the AD method will provide the structure
and discipline to reduce or even eliminate unproductive efforts and thus allow the
development team to concentrate on the real issue and better solutions.
2.6 Design, Product Development Lifecycle Models and Computers
Since the 1960s, the idea of externalizing design from human designers and
constructing executable design systems has been explored. Currently computers are used
in the design field primarily for graphic representation, solid modeling, product
modeling, optimization of design solutions, and simulation. Use of computer technology
(Computer-aided design and manufacturing – CAD and CAM – and many software
analysis tools) has significantly reduced the time required for developing new products
and solutions.
Since computers are becoming ever more powerful and cheaper, they should also
be used in design to store codified information and to augment human capabilities. More
recently, the formalization, representation, and manipulation of knowledge in computers
have made it possible to construct knowledge-based design (KBD) systems. Such
systems have the potential to produce both fundamentals changes in design and better
designs [Coyne et al., 1990].
The objective of KBD is to facilitate effective product design and manufacturing
activities through the whole lifecycle of product. To achieve this long term goal, various
types of knowledge on products, their manufacture, use, maintenance, and other life-
cycle activities should be turned into reusable resource, and the resulting life-cycle
knowledge should be deployed during the product development and manufacture,
particularly during the early design stages (conceptual design) [Mäntylä, 1996].
KBD systems require a large-scale design repository in which design knowledge
is intensively and systematically stored so that efficient search and retrieval of deign
knowledge could take place. Design knowledge has two categories; i.e., design object
knowledge (such as geometric and product modeling) and design process knowledge. For
example, a mechanical engineering design process requires various kinds of design object
models, such as geometric model, kinematic model, and finite element model. Design
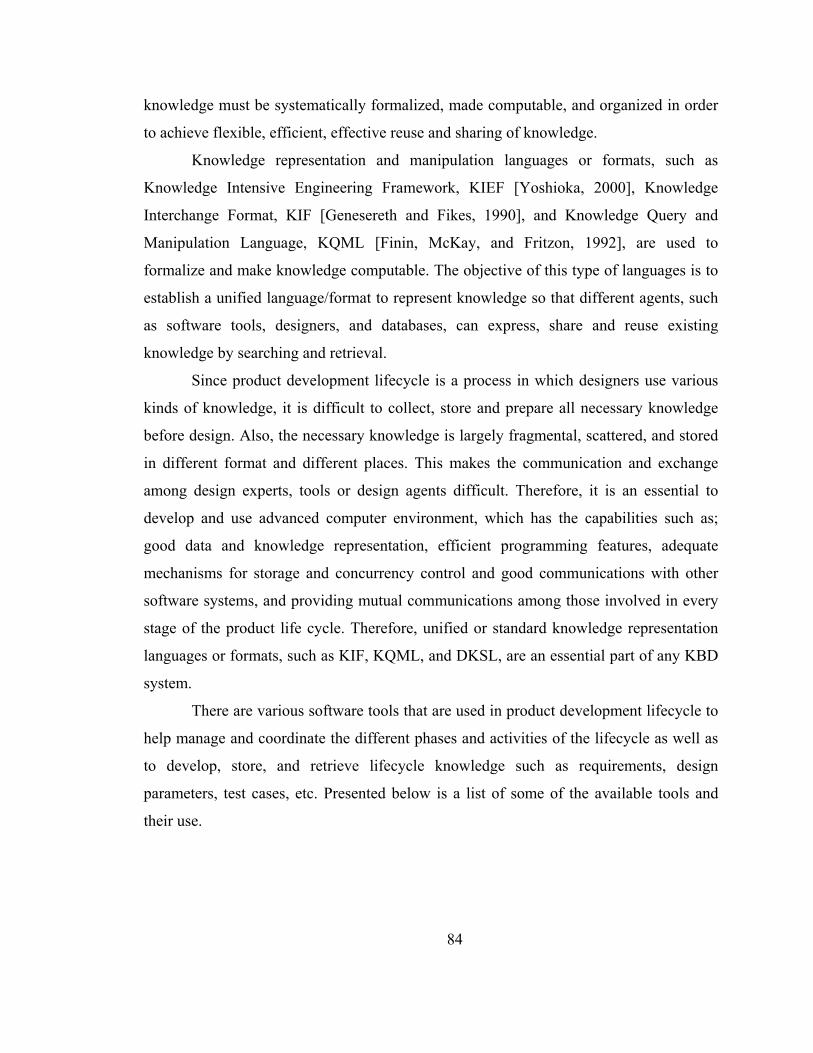
84
knowledge must be systematically formalized, made computable, and organized in order
to achieve flexible, efficient, effective reuse and sharing of knowledge.
Knowledge representation and manipulation languages or formats, such as
Knowledge Intensive Engineering Framework, KIEF [Yoshioka, 2000], Knowledge
Interchange Format, KIF [Genesereth and Fikes, 1990], and Knowledge Query and
Manipulation Language, KQML [Finin, McKay, and Fritzon, 1992], are used to
formalize and make knowledge computable. The objective of this type of languages is to
establish a unified language/format to represent knowledge so that different agents, such
as software tools, designers, and databases, can express, share and reuse existing
knowledge by searching and retrieval.
Since product development lifecycle is a process in which designers use various
kinds of knowledge, it is difficult to collect, store and prepare all necessary knowledge
before design. Also, the necessary knowledge is largely fragmental, scattered, and stored
in different format and different places. This makes the communication and exchange
among design experts, tools or design agents difficult. Therefore, it is an essential to
develop and use advanced computer environment, which has the capabilities such as;
good data and knowledge representation, efficient programming features, adequate
mechanisms for storage and concurrency control and good communications with other
software systems, and providing mutual communications among those involved in every
stage of the product life cycle. Therefore, unified or standard knowledge representation
languages or formats, such as KIF, KQML, and DKSL, are an essential part of any KBD
system.
There are various software tools that are used in product development lifecycle to
help manage and coordinate the different phases and activities of the lifecycle as well as
to develop, store, and retrieve lifecycle knowledge such as requirements, design
parameters, test cases, etc. Presented below is a list of some of the available tools and
their use.
85
Table 2.9 – Software tools for design and development lifecycle
Tools Usage Acclaro DFSS http://www.axiomaticdesign.com/
Acclaro DFSS software implements axiomatic design technology for product and systems development with a complete suite of DFSS tools to reduce development risk, reduce cost and speed time to market.
Teamcenter http://www.ugs.com/ Teamcenter’s PLM digital enterprise backbone allows you to manage all of the diverse processes throughout your extended enterprise, as well as across the planning, development, manufacturing, and support domains of your product lifecycle.
Product Development System (PDS)
http://www.ptc.com/products/product_development_system.htm PTC‘s Product Development System (PDS) delivers precise management of digital product data along with every aspect of the product development process.
MS Project http://www.microsoft.com Project management, scheduling, and resource planning.
Cradle http://threesl.com/ Cradle is a multi-user, multi-project, systems engineering environment that spans the entire systems and software development lifecycle. Cradle provides a suite of tools that integrate all project phases, activities and deliverables within a single, configuration managed, access controlled framework.
Rational® RequisitePro®
http://www-306.ibm.com/software/awdtools/reqpro/ The IBM® Rational® RequisitePro® solution is a requirements and use case management tool for project teams who want to improve the communication of project goals, enhance collaborative development, reduce project risk and increase the quality of applications before deployment.
CORE Systems Engineering Tool
Vitech Corporation ( http://vitechcorp.com ) The CORE product family provides a flexible combination of modeling and simulation tools supporting product and process engineering.
GoldSim Pro GoldSim
Technology Group ( http://www.goldsim.com/software )
GoldSim Pro is a general-purpose simulator suitable for modeling any type of business, scientific, and engineering system that can be expressed mathematically.
86
CHAPTER III
III AXIOMATIC PRODUCT DEVELOPMENT
LIFECYCLE (APDL)
The AD method provides a robust structure and systematic thinking to support
PDL activities; however, it does not support the whole product development lifecycle
[Tate and Nordlund, 1995]. The same logic and scientific thinking can be used and
extended to capture, analyze, and manage the product development lifecycle knowledge.
The Axiomatic Product Development Lifecycle (APDL) model utilizes the systematic
nature of the AD method in order to provide a systematic approach for product
development lifecycle activities and management.
The APDL improves the AD in the area of domain entity description and
management and takes the AD method one step further to support the test domain of the
product development lifecycle.
The AD provides two axioms and many theorems and corollaries to evaluate the
quality of design solutions. The first axiom also influences the selection and formation of
the functional requirements so that they can be achieved independently by the proposed
design solution. However, the AD does not provide guidance on determining the quality
of the requirements. The AD also does not provide any guidance or standardization for
description of the requirements.
Although the constraints are defined to be in the Functional Domain, only the FR
characteristic vector exists in this domain in the AD method, the constraints are not
captured in a characteristic vector. Moreover, the relationships between customer needs
(CNs) and FRs and between CNs and constraints are not captured in matrix form in the
AD method.
The AD does not specifically support testing and verification activities. Testing
and verification activities and concerns are generally not considered to be a factor in
deciding the quality of design. However, keeping testing and verification concerns in
AXIOMATIC PRODUCT DEVELOPMENT
LIFECYCLE (APDL)
87
mind makes sure that the requirements are verifiable and the design activities are
performed to meet these verifiable requirements. Verifiability should be one of the
quality factors for functional requirements.
In the AD, the domain that contains the DPs is called the physical domain;
however, the DP hierarchy does not necessarily represent the physical structure of the
system. A component can provide the design solution expressed in more than one DP or
multiple components can be required to achieve the design solution represented by a DP
[Tate, 1999]. The DP hierarchy can be totally different from the component hierarchy as
in the case of the beverage can example given in Suh, 2001 pg. 17. Thus, the AD does
not capture the true physical architecture of the system.
The APDL model is developed to over-come these short-comings of the AD
method as far as the product development lifecycle is concerned.
3.1 APDL: New Domains and Characteristic Vectors
For the purposes of managing development lifecycle knowledge and supporting
different development lifecycle activities such as requirements and change management
throughout the whole product development lifecycle, one new domain and four new
characteristic vectors are added to the existing AD domains and characteristic vectors.
A characteristic vector for the system components (SCs), that provide the design
solution stated in the DPs, is defined in the Physical Domain. The SC hierarchy
represents the physical architecture of the system. The method for categorizing the
components with respect to system physical architecture varies with each organization. A
general portrayal used by Eppinger (2001) is system, subsystem, and component,
although further categories are available, such as the system, segment, element,
subsystem, assembly, subassembly, and part (NASA, 1995).
The SC vector and the SC hierarchy (system physical architecture) makes it
possible to perform such analysis and activities as Design Structure Matrixes (DSM),
change management, and impact analysis as well as capturing structural information and
requirement traceability.
88
Another difference between the AD and the APDL model is that in the APDL
model the PVs describe the processes to produce the SCs, not the DPs.
Another addition to the AD method is the input constraint (IC) vector that exists
in the functional domain along with the functional requirement (FR) vector. The IC
vector is used to capture the input constraints (IC), which are specific to overall design
goals and imposed externally by the customer, by the industry, or by government
regulations. The ICs are derived from the CNs and then updated based on the other rules
and regulations that the product has to comply with but not mentioned in the Customer
Domain. This new vector helps establish the relationships between ICs and the CNs and
also helps allocate the ICs to the DPs. The mapping between the ICs and DPs may
require the decomposition of the ICs to allocate specific ICs to the lower level DPs. This
mapping is used in evaluating the design solutions to assess if the proposed design
satisfies the allocated ICs.
The component test cases (CTCs), that are used to verify the corresponding
component satisfies the allocated FRs and ICs, are defined in the {CTC} characteristic
vector in the test domain. Component test is defined by IEEE Std. 610.12-1990 as
“Testing of individual hardware or software components or groups of related
components.” Each system component (including subsystems) must be tested before it is
integrated into the system to make sure that the requirements and constraints allocated to
that component are all satisfied.
At the end of the system development, the system must be tested to make sure that
the system satisfies all of the functional requirements defined in the functional
specification document. The functional test cases (FTCs) are stored in the {FTC}
characteristic vector in the test domain. Functional test is a glass (white) box test and its
purpose is to prove that the requirements are achieved by the system. IEEE (1990)
defines functional testing as “(1) Testing that ignores the internal mechanism of a system
or component and focuses solely on the outputs generated in response to selected inputs
and execution conditions. (2) Testing conducted to evaluate the compliance of a system
or component with specified functional requirements.”
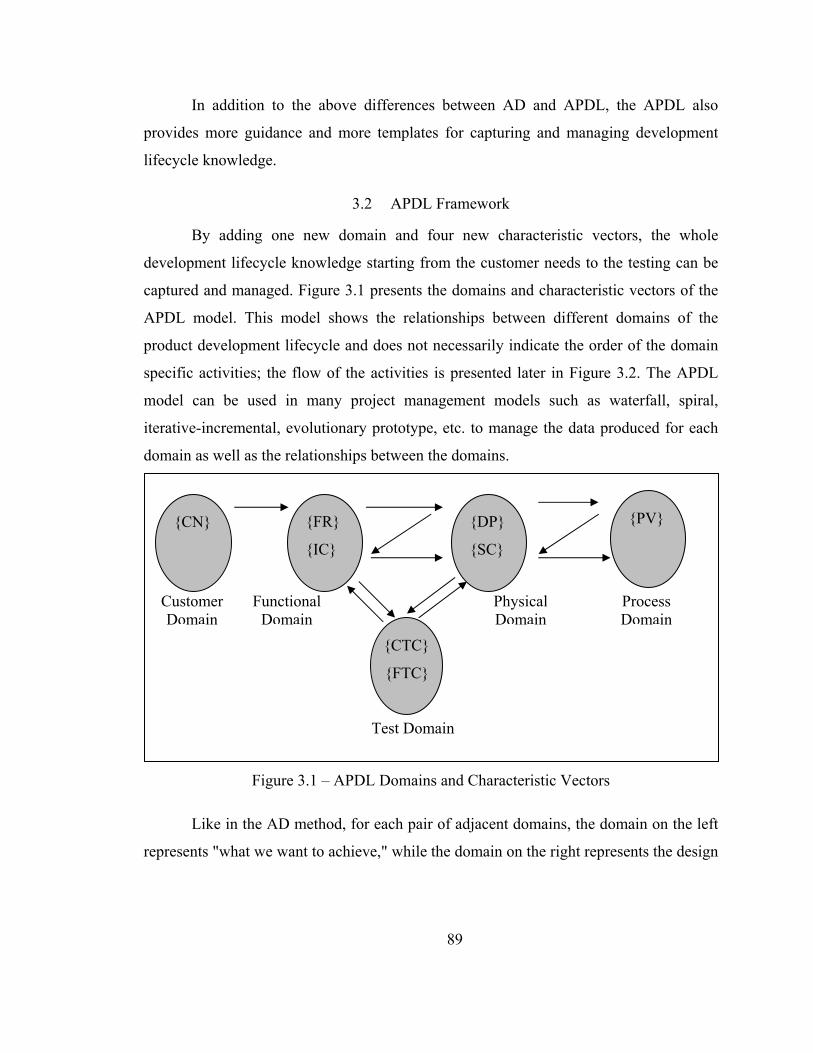
89
In addition to the above differences between AD and APDL, the APDL also
provides more guidance and more templates for capturing and managing development
lifecycle knowledge.
3.2 APDL Framework
By adding one new domain and four new characteristic vectors, the whole
development lifecycle knowledge starting from the customer needs to the testing can be
captured and managed. Figure 3.1 presents the domains and characteristic vectors of the
APDL model. This model shows the relationships between different domains of the
product development lifecycle and does not necessarily indicate the order of the domain
specific activities; the flow of the activities is presented later in Figure 3.2. The APDL
model can be used in many project management models such as waterfall, spiral,
iterative-incremental, evolutionary prototype, etc. to manage the data produced for each
domain as well as the relationships between the domains.
Figure 3.1 – APDL Domains and Characteristic Vectors
Like in the AD method, for each pair of adjacent domains, the domain on the left
represents "what we want to achieve," while the domain on the right represents the design
{CN} {FR}
{IC}
{DP}
{SC}
{PV}
Customer Domain
Functional Domain
Physical Domain
Process Domain
{CTC}
{FTC}
Test Domain
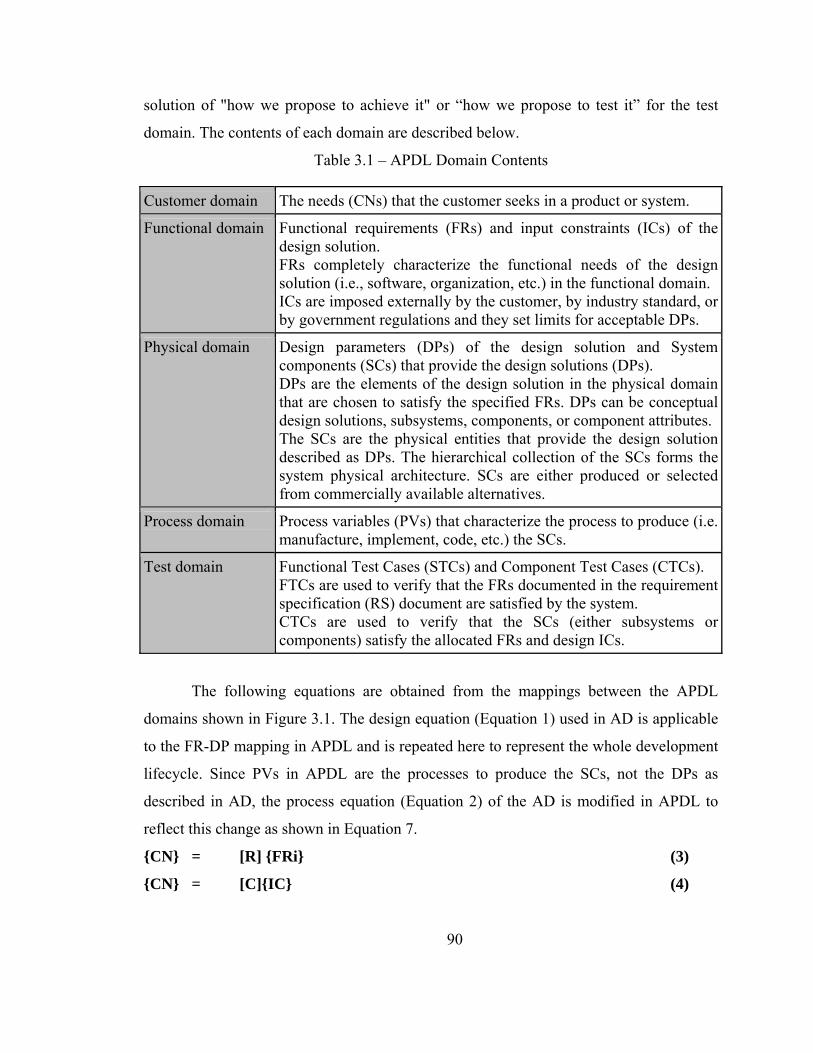
90
solution of "how we propose to achieve it" or “how we propose to test it” for the test
domain. The contents of each domain are described below.
Table 3.1 – APDL Domain Contents
Customer domain The needs (CNs) that the customer seeks in a product or system.
Functional domain Functional requirements (FRs) and input constraints (ICs) of the design solution. FRs completely characterize the functional needs of the design solution (i.e., software, organization, etc.) in the functional domain. ICs are imposed externally by the customer, by industry standard, or by government regulations and they set limits for acceptable DPs.
Physical domain Design parameters (DPs) of the design solution and System components (SCs) that provide the design solutions (DPs). DPs are the elements of the design solution in the physical domain that are chosen to satisfy the specified FRs. DPs can be conceptual design solutions, subsystems, components, or component attributes. The SCs are the physical entities that provide the design solution described as DPs. The hierarchical collection of the SCs forms the system physical architecture. SCs are either produced or selected from commercially available alternatives.
Process domain Process variables (PVs) that characterize the process to produce (i.e. manufacture, implement, code, etc.) the SCs.
Test domain Functional Test Cases (STCs) and Component Test Cases (CTCs). FTCs are used to verify that the FRs documented in the requirement specification (RS) document are satisfied by the system. CTCs are used to verify that the SCs (either subsystems or components) satisfy the allocated FRs and design ICs.
The following equations are obtained from the mappings between the APDL
domains shown in Figure 3.1. The design equation (Equation 1) used in AD is applicable
to the FR-DP mapping in APDL and is repeated here to represent the whole development
lifecycle. Since PVs in APDL are the processes to produce the SCs, not the DPs as
described in AD, the process equation (Equation 2) of the AD is modified in APDL to
reflect this change as shown in Equation 7.
{CN} = [R] {FRi} (3)
{CN} = [C]{IC} (4)
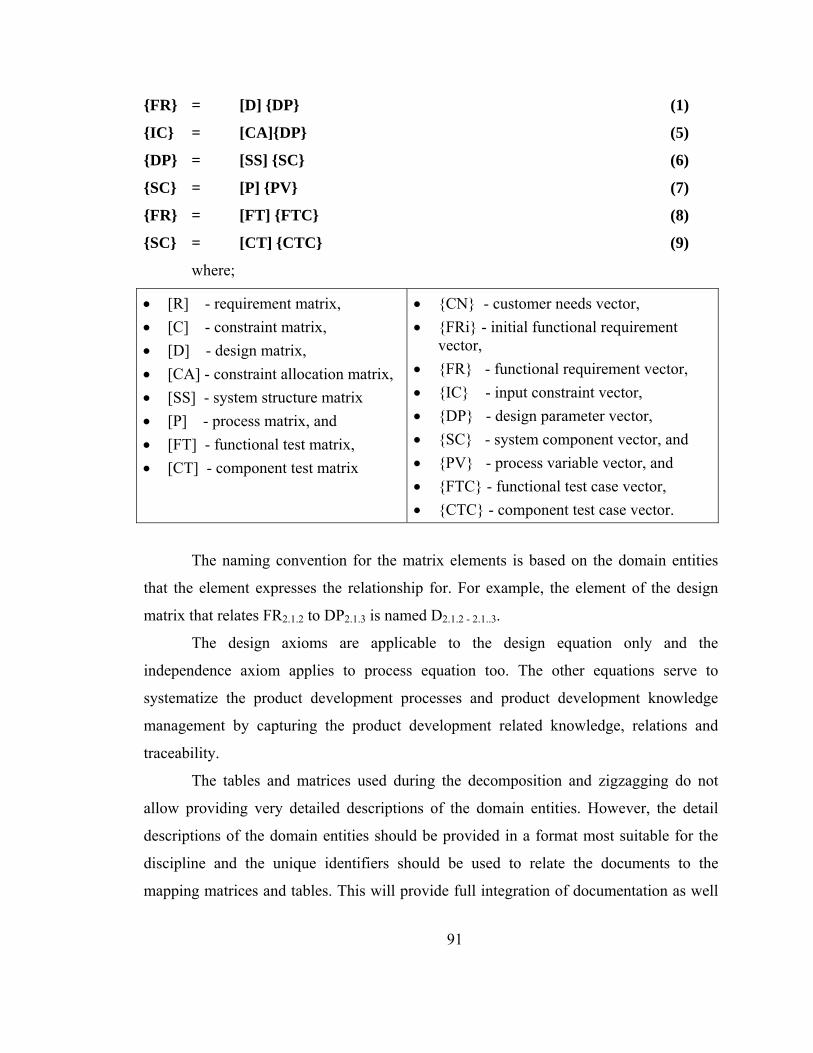
91
{FR} = [D] {DP} (1)
{IC} = [CA]{DP} (5)
{DP} = [SS] {SC} (6)
{SC} = [P] {PV} (7)
{FR} = [FT] {FTC} (8)
{SC} = [CT] {CTC} (9)
where;
• [R] - requirement matrix, • [C] - constraint matrix, • [D] - design matrix, • [CA] - constraint allocation matrix, • [SS] - system structure matrix • [P] - process matrix, and • [FT] - functional test matrix, • [CT] - component test matrix
• {CN} - customer needs vector, • {FRi} - initial functional requirement
vector, • {FR} - functional requirement vector, • {IC} - input constraint vector, • {DP} - design parameter vector, • {SC} - system component vector, and • {PV} - process variable vector, and • {FTC} - functional test case vector, • {CTC} - component test case vector.
The naming convention for the matrix elements is based on the domain entities
that the element expresses the relationship for. For example, the element of the design
matrix that relates FR2.1.2 to DP2.1.3 is named D2.1.2 - 2.1..3.
The design axioms are applicable to the design equation only and the
independence axiom applies to process equation too. The other equations serve to
systematize the product development processes and product development knowledge
management by capturing the product development related knowledge, relations and
traceability.
The tables and matrices used during the decomposition and zigzagging do not
allow providing very detailed descriptions of the domain entities. However, the detail
descriptions of the domain entities should be provided in a format most suitable for the
discipline and the unique identifiers should be used to relate the documents to the
mapping matrices and tables. This will provide full integration of documentation as well
92
as traceability throughout the development lifecycle. The domain entity templates
proposed in the following sections should be used as a starting point to develop the
templates most suitable for the development organization.
The APDL approach, like the AD method, can be used in design and development
of products, systems, services, and organizations in many different disciplines.
3.2.1 APDL Process Overview
The APDL model proposes a V-shaped process to develop the detail design with a
top-down approach and complete the PVs, CTCs, and FTCs and produce and test the
product with a bottom-up approach as shown in Figure 3.2.
The first step of the product development lifecycle is to elicit and clarify the
customer needs. The objective of this step is to gather as much information as possible to
correctly and completely identify all the stakeholders of the product, all the customer
needs and problems relating the product to be developed as well as any constraints
imposed by the customer, operational environment, rules and regulations, existing and
available resources and technology on the development and selection of acceptable
design solutions.
Once the CNs are available, they should be analyzed to derive initial FRs (FRis)
and any product related constraints, called input constraints (ICs). The mapping from
CNs to FRis and ICs is a simple mapping process. This mapping is performed once
before the design decomposition starts and whenever there is a change in the customer
needs.
Once the FRis and the ICs are derived, they should be analyzed to develop the
system FR, DP, and SC triplet that states the system objective, the proposed system
design, and the proposed system. Developing the system FR/DP/SC triplet helps ensure
that a true top-down approach is used to analyze the requirements and develop the design.
This triplet also serves as a mean to establish the scope for the system and the project.
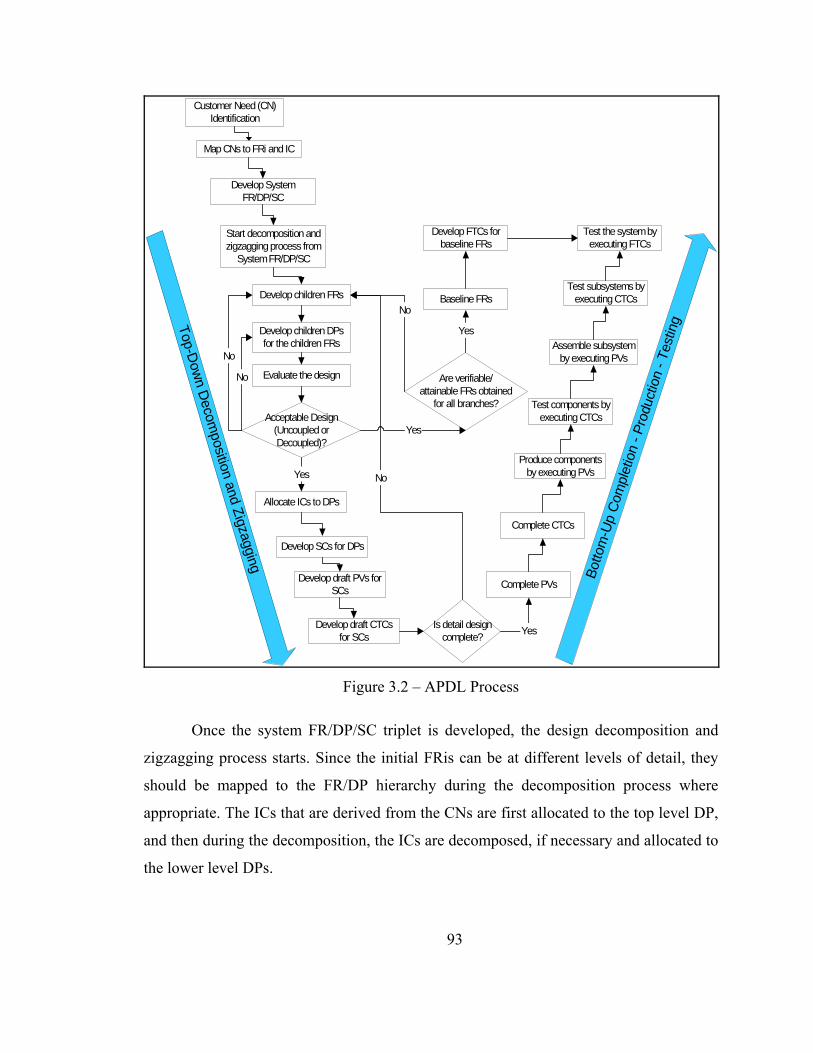
93
Customer Need (CN)Identification
Map CNs to FRi and IC
Develop SystemFR/DP/SC
Start decomposition andzigzagging process from
System FR/DP/SC
Develop children FRs
Develop children DPsfor the children FRs
Evaluate the design
Acceptable Design(Uncoupled orDecoupled)?
Develop SCs for DPs
Develop draft PVs forSCs
Develop draft CTCsfor SCs
Are verifiable/attainable FRs obtained
for all branches?
Baseline FRs
Is detail designcomplete?
Complete PVs
Complete CTCs
Develop FTCs forbaseline FRs
Produce componentsby executing PVs
Assemble subsystemby executing PVs
Test components byexecuting CTCs
Test subsystems byexecuting CTCs
Test the system byexecuting FTCs
Top-Dow
n Decom
position and Zigzagging
Yes
No
No
No
Allocate ICs to DPs
Yes
Yes
Botto
m-U
p C
ompl
etio
n - P
rodu
ctio
n - T
estin
g
No
Yes
Figure 3.2 – APDL Process
Once the system FR/DP/SC triplet is developed, the design decomposition and
zigzagging process starts. Since the initial FRis can be at different levels of detail, they
should be mapped to the FR/DP hierarchy during the decomposition process where
appropriate. The ICs that are derived from the CNs are first allocated to the top level DP,
and then during the decomposition, the ICs are decomposed, if necessary and allocated to
the lower level DPs.
94
During the decomposition, given the parent FR and DP as well as the allocated
ICs to the parent DP, the functions that the DP has to perform in order to achieve the
parent FR and satisfy the allocated ICs are determined and they are listed as the children
FRs. The decomposition and zigzagging continues by finding or developing DPs for the
newly established FRs and checking the design to make sure that an acceptable design
(uncoupled or decoupled design) is obtained that satisfies the allocated FRs and ICs.
When the DPs are developed, the ICs are analyzed again to determine if the proposed
solution satisfy the ICs and also to allocate them to the new DPs.
Once a DP is determined, a corresponding SC that provides the solution stated in
the DP is identified and then a draft PV that defines the process to produce the SC is
developed, and finally, a draft CTC is developed to test the SC.
The top-level FRs should be solution-neutral as much as possible in order not to
set mind-barriers and to encourage creativity. In addition, the FRs should be both
verifiable and attainable. However, at very high levels, the FRs may be very vague, and
therefore, not verifiable. Also, one cannot claim that the FRs are attainable without
proposing a possible solution. Even if a solution (DP) is proposed for a FR, the proposed
DP will most probably be very generic at this level and it would be very difficult to
determine if the DP is doable without further decomposition. Therefore, before
committing a lot of resources, a minimum set of verifiable and attainable FRs that
completely characterizes the functional needs of the design solution should be
established. To achieve this, the design decomposition and zigzagging process should
have two phases: requirement analysis and design phases. The requirement analysis phase
ends when a set of verifiable and attainable FRs is developed and the design phase ends
when the leaf-level DPs are developed.
The FRs and DPs at the end of requirement analysis phase are called the baseline
FRs and DPs. At this point, the FRs are documented in the requirement specification (RS)
document. This RS document should be reviewed by the stakeholders and sponsors’
approval for the requirements should be obtained.
95
Sponsors’ approval of this FR set indicates the end of the “requirement analysis
phase” and the start of the “design phase” of the development project. Up to this point,
only conceptual design is developed to map all the FRis into the FR hierarchy and to
completely define the functional needs. Some detailed design can also be developed, such
as proof of concept prototypes or virtual models, to make sure that the FRs are attainable.
However, the only design related information contained in the RS document should be
the input constraints and the conceptual design that is used to develop the baseline FRs.
When the baseline FRs/DPs are obtained, they are placed under change control
and any changes to them should go through a change management process to analyze the
impact of the change on the design and rest of the development lifecycle and determine if
the proposed change should be accepted.
The decomposition and zigzagging process proceeds to the leaf level where the
DPs are specified well enough to be either implement (produced/manufactured/coded/
etc.) or to be procured whether the DPs are subsystems or components.
Once the leaf level is reached, the design decomposition and zigzagging ends and
a bottom-up process starts to re-evaluate and complete the descriptions of the SCs, PVs,
and CTCs.
The FTCs are developed for the baseline FRs that are documented in the RS
document when the detail design is completed.
The next step in the product development lifecycle is to use the PVs to produce
the components and then integrate them to produce the system. Whenever an SC, be it a
component or subsystem, is produced, the CTC for that SC is used to test it before it is
integrated/assembled further into the system.
When the system is produced, the final acceptance test is conducted by executing
the FTCs to validate the system. The final acceptance test, i.e., the acceptance of the
system, first article, or the prototype, marks the end of the product development lifecycle.
By manipulating the mapping matrices as well as the characteristic vectors
relationships between any entities from different domains as well as entities in the same
domain can be easily identified. Therefore, it is easy to find out if all CNs and FRs are
96
satisfied by the DPs or SCs. It is also possible to find out if each and every FR and SC
are tested at the system, subsystem, and component level.
The detail descriptions of the domain entities should be provided in a format most
suitable for the discipline and the unique identifiers should be used to relate the
documents to the mapping matrices. This will provide full integration of documentation
as well as traceability throughout the development lifecycle.
It is important to define standards and templates for the domain entities, if
possible, so that they are not misused or misunderstood. The description of customer
needs, functional requirements, component test cases and functional test cases do not
depend very much on the discipline of the product being developed whereas the
description of design parameters, system components, and process variables very much
depend on the terms and nature of the discipline of the product being developed.
Templates can and should be developed for CNs, FRs, CTCs, and FTCs in order
to make sure that all required information related to these domain entities are properly
captured and their descriptions are complete. Even if all the required information is not
complete, at least the missing information can be determined and necessary actions can
be taken such as making an assumption, identifying a risk and developing a risk plan, or
allocate enough resources to find the missing information.
In the following sections, the APDL process is further explained; the domain
entities are described in detail, and the templates for documenting the domain entities and
the mapping matrices are presented.
3.2.2 Customer Needs
The customer needs (CNs) are the complete set of the wants, needs and attributes
that the customer seeks in a product or a system. The PDL starts with identifying these
CNs. They are expressed in customer’s own language. A more detailed explanation of
customer need assessment phase is given in Section 2.1.1.1.
The goals of identifying the customer needs are to understand what is known,
what is unknown, what is sought, and the problem situation, to identify the stakeholders,
to understand the stakeholders and their interests, to understand other benefits and vested
97
interests to society or technology, to find out the limitations in the resources likely to be
available, and the technology likely to be involved.
In order to achieve high quality requirements and to assure that no requirements
are missed, all the stakeholders should be identified, all the external interfaces should be
defined, and operational concepts or use cases should be developed as well as systematic
models and approaches should be used for capturing CNs.
Some of the techniques used for identifying customer needs are:
• Structured workshops
• Brainstorming or problem-solving sessions
• Interviews, surveys/questionnaires
• Observation of work patterns
• Observation of the system’s organizational and political environment
• Technical documentation review
• Market analysis
• Competitive system assessment
• Reverse engineering
• Simulations and prototyping
There are several methodologies to gather customer needs, such as Quality
Function Deployment (QFD) [Akao, 1990] and House of Quality [Hauser and Clausing,
1988].
The CNs do not have to be measurable or testable; they are just the needs of the
customer. However, when they are mapped to the functional domain, the FRs derived
from the CNs have to be measurable and testable so that an acceptance test can be
performed objectively to prove that the end product satisfies the stated functional
requirements. At a minimum the following information should be collected for each CN:
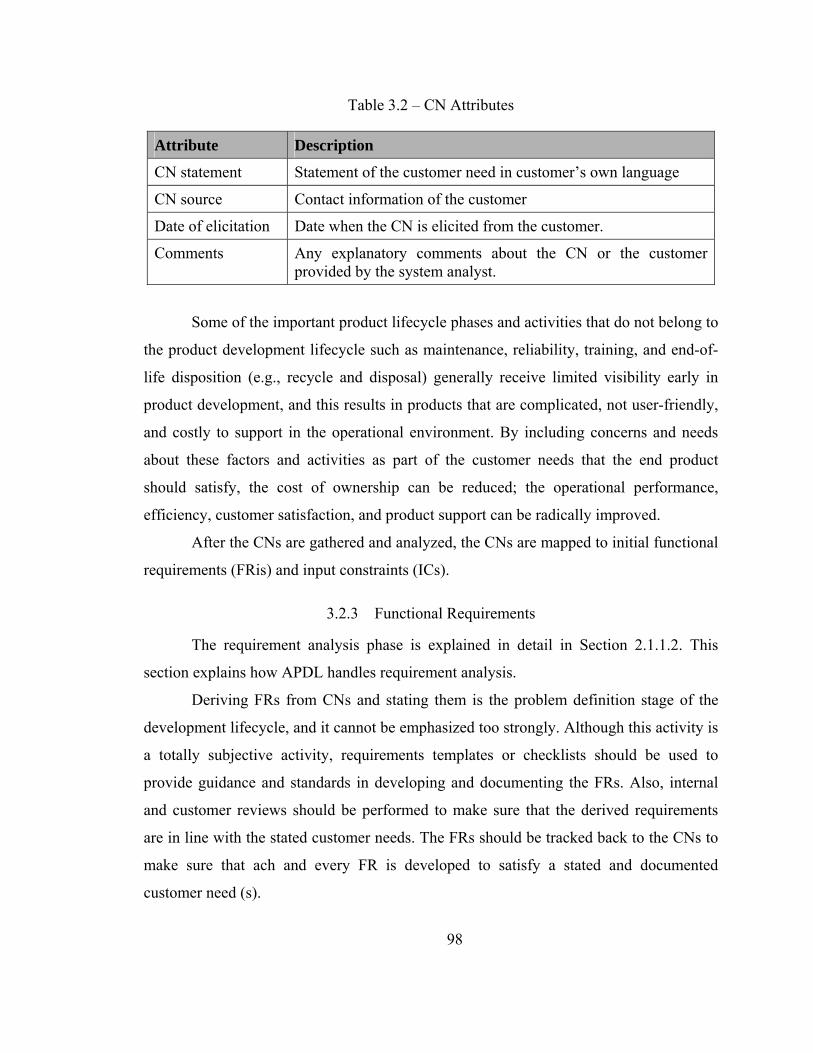
98
Table 3.2 – CN Attributes
Attribute Description
CN statement Statement of the customer need in customer’s own language
CN source Contact information of the customer
Date of elicitation Date when the CN is elicited from the customer.
Comments Any explanatory comments about the CN or the customer provided by the system analyst.
Some of the important product lifecycle phases and activities that do not belong to
the product development lifecycle such as maintenance, reliability, training, and end-of-
life disposition (e.g., recycle and disposal) generally receive limited visibility early in
product development, and this results in products that are complicated, not user-friendly,
and costly to support in the operational environment. By including concerns and needs
about these factors and activities as part of the customer needs that the end product
should satisfy, the cost of ownership can be reduced; the operational performance,
efficiency, customer satisfaction, and product support can be radically improved.
After the CNs are gathered and analyzed, the CNs are mapped to initial functional
requirements (FRis) and input constraints (ICs).
3.2.3 Functional Requirements
The requirement analysis phase is explained in detail in Section 2.1.1.2. This
section explains how APDL handles requirement analysis.
Deriving FRs from CNs and stating them is the problem definition stage of the
development lifecycle, and it cannot be emphasized too strongly. Although this activity is
a totally subjective activity, requirements templates or checklists should be used to
provide guidance and standards in developing and documenting the FRs. Also, internal
and customer reviews should be performed to make sure that the derived requirements
are in line with the stated customer needs. The FRs should be tracked back to the CNs to
make sure that ach and every FR is developed to satisfy a stated and documented
customer need (s).
99
Requirements should be verifiable and attainable by themselves or should be
decomposed into verifiable and attainable requirements. The “baseline” requirements
should be verifiable and attainable since they establish the foundation of the system and
form the basis for the rest of the product development lifecycle activities such as design,
manufacture, test, and operation.
The FRs characterize the functional needs of the design solution (i.e., software,
organization, etc.) in the functional domain. The FRs that are mapped from the CNs may
not be the top level FRs, they could be the children of a higher level requirement that is
derived from another CN or the parent FR may not exist yet. Therefore, the FRs initially
generated from the CNs are suffixed by “i” for “initial” in order to indicate that they do
not represent the FR/DP hierarchy yet.
The CNs are analyzed to create the initial FRs while taking into consideration the
project timing, available resources, target market and other factors that may influence the
project scope.
The initial FRs are used to develop the system FR and to decompose the system
FR/DP into verifiable and attainable FRs. Once this is achieved, the FRs are baselined
(functional baseline), documented in a specification document and approvals of the
stakeholder or the sponsor is obtained. After the functional baseline is established,
changes to the baselined FRs are strictly controlled.
Baselined FRs are a minimum set of independent requirements that are shown to
be verifiable and attainable and completely characterize the functional needs of the
design solution (i.e., software, organization, etc.) in the functional domain. Note that this
definition differs from the FR definition of the AD in that the top level FRs may not be
the baselined FRs.
The higher-level FRs should be explicitly stated in solution neutral terms to avoid
imposing unnecessary design constraints at the lower levels and therefore encouraging
creativity in finding innovative solutions. A neutral functional requirement states what is
required, not how the requirement should be met. Neutrality allows designers to be more
creative and to pursue alternative, competing system designs. Although developing
100
neutral FRs at each level of decomposition is a good practice, it is especially important
for higher level FRs since the top levels of the FR-DP hierarchy constitute the conceptual
phase of the design effort, which is the most important stage for innovation in the design
process.
The FRs must be stated with expected environmental variation, customer usage
variation, and required useful life before disposal so that accommodation to handle these
noise variables is included in the design [Suh, 2001].
The Quality Function Deployment (QFD) can be used to define the FRs. The
QFD may be an effective tool for an existing product that needs improvement, but FRs
must be defined in a solution neutral environment for development of new products [Suh,
2001].
There are many quality factors or good requirement attributes suggested in the
literature. However, there are two main factors that determine the requirement quality:
“verifiability” and “attainability”.
Verifiability is described as the degree to which a requirement is stated in terms
that permit establishment of verification criteria and performance of verification to
determine whether those criteria have been met by one or more of four alternative
verification methods: inspection, analysis, demonstration or test. Stating the functional
requirements in measurable terms and avoiding ambiguous terms such as maximize,
sufficient, robust, easy, user-friendly, support, etc. makes sure that the requirement is
verifiable.
Some functional requirements can be descriptive and are verified by the
summation of the children requirements. However, the leaf level FRs have to be
verifiable by themselves.
If a FR is ambiguous or not concise, that requirement cannot be verifiable.
Concise functional requirement includes only one requirement stating what must be done
and only what must be done, stated simply and clearly. Unambiguous requirement is
complete and does not need further amplification to start design. Unambiguous
101
requirement must have one and only one interpretation and should be easy to read and
understand.
A functional requirement is attainable if it can be achieved by one or more
developed system concepts at a definable cost and schedule. This implies that at least a
high level conceptual design has been completed and cost tradeoff studies have been
conducted.
All requirements have attributes that are defined by the development and
management teams according to the project’s or organization’s needs. These attributes
are a rich source of information about the requirements that can be used for
communication, planning, and tracking purposes [Davis and Leffingwell, 1999]. These
attributes give much more detailed information about the requirements, rationale, and
their relationships with other requirements, source documents, and test activities.
The attributes listed in Table 3.3, at a minimum, should be used to describe the
FRs. The FR set documented in the RS document should be evaluated using the quality
factors defined in Table 3.4.
Table 3.3 describes the proposed FR Template, which is necessarily the list of the
requirement attributes that are generic enough to apply to different disciplines. However,
each project/company may add other attributes that are critical to the success of the
design and development effort.
Three quality factors are proposed in Table 3.4 to evaluate the quality of the
baselined functional requirement set. This evaluation is performed to ensure that the
system is completely characterized by the FRs and the FRs are consistent with each other.
The master design equation can be and should be used to evaluate the FRs based on these
three quality factors.
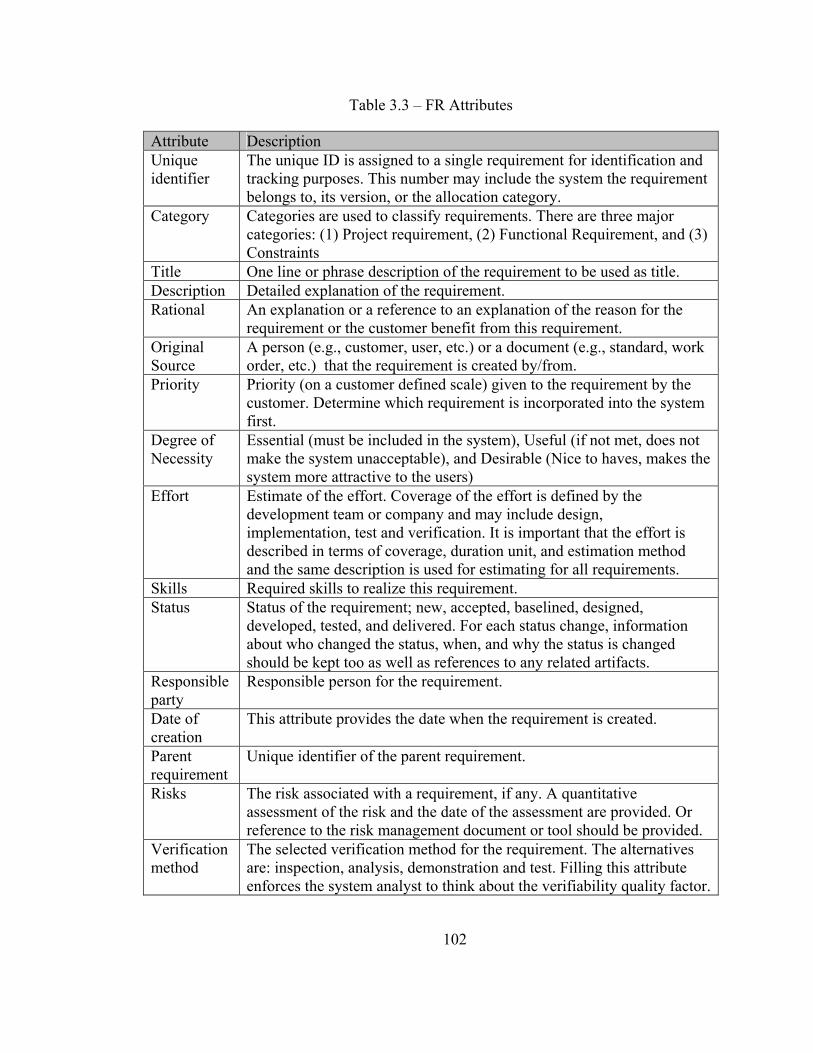
102
Table 3.3 – FR Attributes
Attribute Description Unique identifier
The unique ID is assigned to a single requirement for identification and tracking purposes. This number may include the system the requirement belongs to, its version, or the allocation category.
Category Categories are used to classify requirements. There are three major categories: (1) Project requirement, (2) Functional Requirement, and (3) Constraints
Title One line or phrase description of the requirement to be used as title. Description Detailed explanation of the requirement. Rational An explanation or a reference to an explanation of the reason for the
requirement or the customer benefit from this requirement. Original Source
A person (e.g., customer, user, etc.) or a document (e.g., standard, work order, etc.) that the requirement is created by/from.
Priority Priority (on a customer defined scale) given to the requirement by the customer. Determine which requirement is incorporated into the system first.
Degree of Necessity
Essential (must be included in the system), Useful (if not met, does not make the system unacceptable), and Desirable (Nice to haves, makes the system more attractive to the users)
Effort Estimate of the effort. Coverage of the effort is defined by the development team or company and may include design, implementation, test and verification. It is important that the effort is described in terms of coverage, duration unit, and estimation method and the same description is used for estimating for all requirements.
Skills Required skills to realize this requirement. Status Status of the requirement; new, accepted, baselined, designed,
developed, tested, and delivered. For each status change, information about who changed the status, when, and why the status is changed should be kept too as well as references to any related artifacts.
Responsible party
Responsible person for the requirement.
Date of creation
This attribute provides the date when the requirement is created.
Parent requirement
Unique identifier of the parent requirement.
Risks The risk associated with a requirement, if any. A quantitative assessment of the risk and the date of the assessment are provided. Or reference to the risk management document or tool should be provided.
Verification method
The selected verification method for the requirement. The alternatives are: inspection, analysis, demonstration and test. Filling this attribute enforces the system analyst to think about the verifiability quality factor.
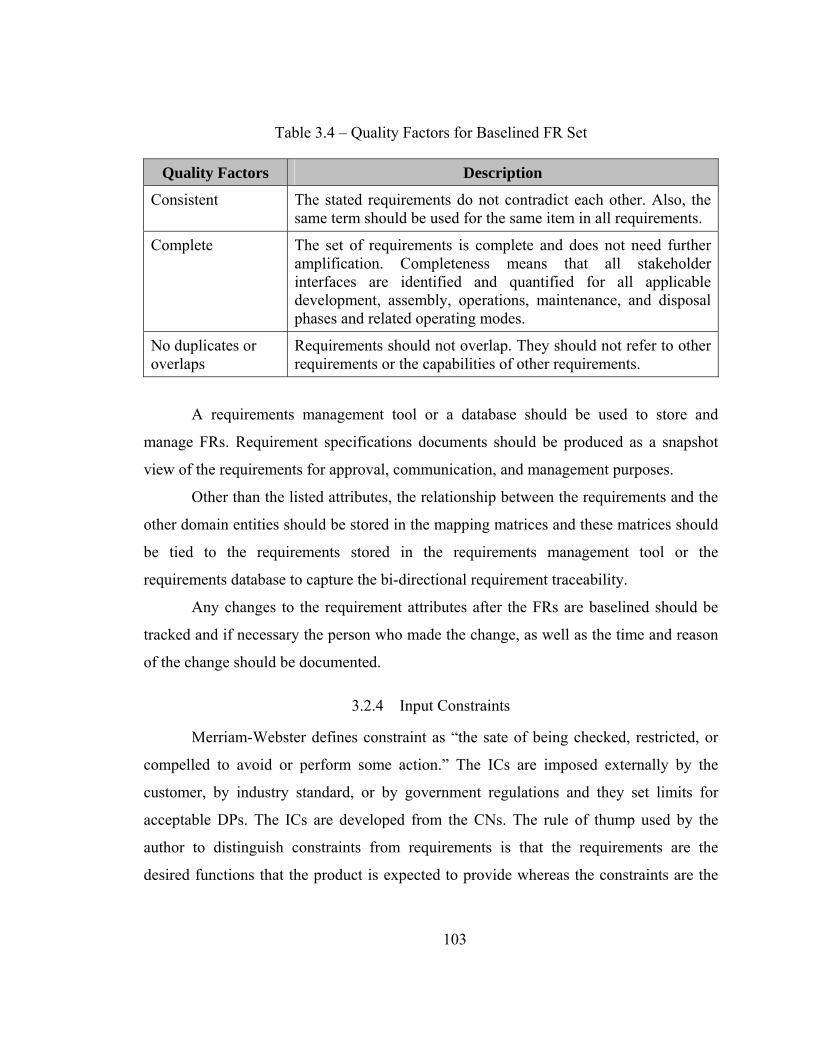
103
Table 3.4 – Quality Factors for Baselined FR Set
Quality Factors Description
Consistent The stated requirements do not contradict each other. Also, the same term should be used for the same item in all requirements.
Complete The set of requirements is complete and does not need further amplification. Completeness means that all stakeholder interfaces are identified and quantified for all applicable development, assembly, operations, maintenance, and disposal phases and related operating modes.
No duplicates or overlaps
Requirements should not overlap. They should not refer to other requirements or the capabilities of other requirements.
A requirements management tool or a database should be used to store and
manage FRs. Requirement specifications documents should be produced as a snapshot
view of the requirements for approval, communication, and management purposes.
Other than the listed attributes, the relationship between the requirements and the
other domain entities should be stored in the mapping matrices and these matrices should
be tied to the requirements stored in the requirements management tool or the
requirements database to capture the bi-directional requirement traceability.
Any changes to the requirement attributes after the FRs are baselined should be
tracked and if necessary the person who made the change, as well as the time and reason
of the change should be documented.
3.2.4 Input Constraints
Merriam-Webster defines constraint as “the sate of being checked, restricted, or
compelled to avoid or perform some action.” The ICs are imposed externally by the
customer, by industry standard, or by government regulations and they set limits for
acceptable DPs. The ICs are developed from the CNs. The rule of thump used by the
author to distinguish constraints from requirements is that the requirements are the
desired functions that the product is expected to provide whereas the constraints are the
104
restrictions that the product must comply while providing the desired functions. For
example, keeping food at a specified temperature range is a requirement for a refrigerator
whereas the power supply (110 Volts, 50Hz.) or the footprint specification is a constraint.
There are two types of ICs:
1. Design Constraint: dictates choice of specific DPs such as materials to be
used, size, etc. For example, take the customer need, “control temperature to
desired value, in a 1000 ft3 volume.” One FR (control temperature to desired
value) and one IC (volume is 1000 ft3) can be derived from this CN.
2. Performance Constraint: dictates performance limits such as throughput,
valid range of frequency, temperature range the system must operate, etc.
For example, one CN states “system should operate between -10 to 50 °C.”
Only one IC (operation temperature is between -10 to 50 °C) can be derived
from this CN.
The design constraints directly determine the design solution or attributes of the
design solution. However, to incorporate the performance constraints, a sub FR should be
created for the DPs that the IC is allocated to.
The ICs that are derived from the CNs are first allocated to the top level DP, and
then during the decomposition, the ICs are decomposed, if necessary and allocated to the
lower level DPs. This is a formal and structured approach to manage and allocate input
constraints.
3.2.5 Requirement Matrix, R, and Constraint Matrix, C
The purpose of Equations 3 and 4 is to capture the mapping between the CNs and
the initial FRs and ICs. This mapping process is performed once before the
decomposition starts and whenever there is a change in the customer needs. The
requirement and the constraint matrices constitute the pre-requirement traceability in
APDL and provide an insight into the sources and the rationales of the FRs and ICs. In
the AD method, although the mapping between CNs and FRs/ICs is mentioned, neither
the requirement matrix, [R], nor the constraint matrix, [C] exists.
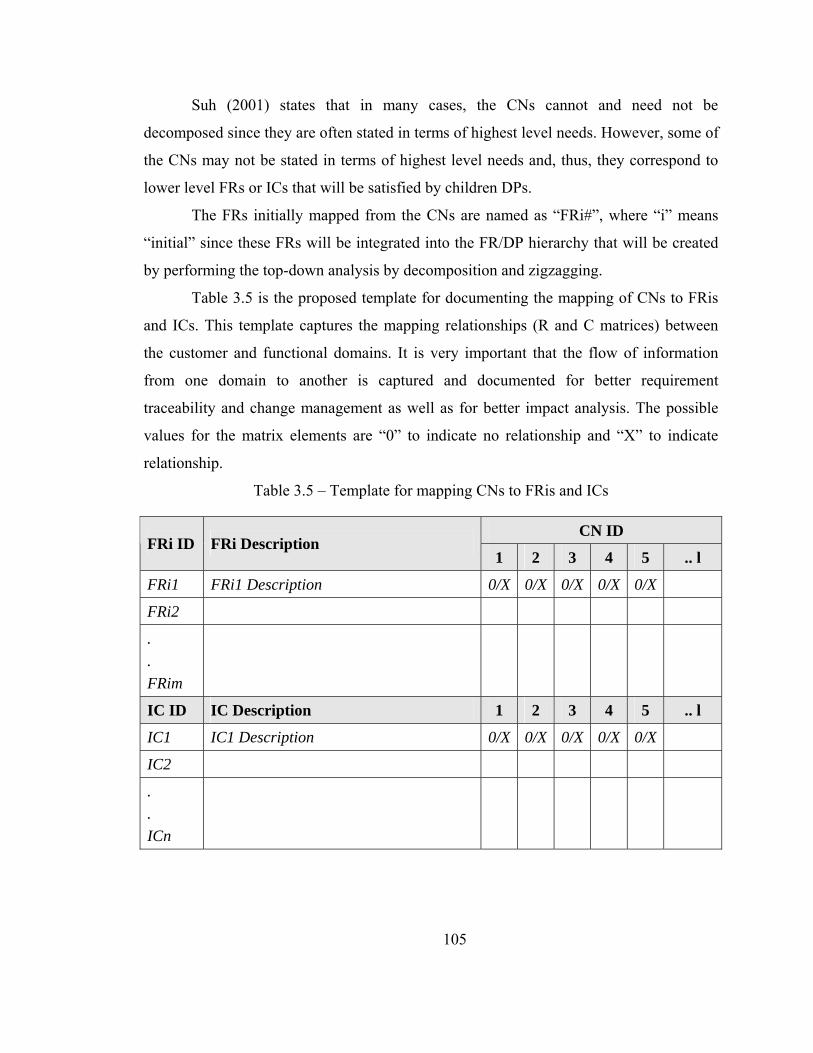
105
Suh (2001) states that in many cases, the CNs cannot and need not be
decomposed since they are often stated in terms of highest level needs. However, some of
the CNs may not be stated in terms of highest level needs and, thus, they correspond to
lower level FRs or ICs that will be satisfied by children DPs.
The FRs initially mapped from the CNs are named as “FRi#”, where “i” means
“initial” since these FRs will be integrated into the FR/DP hierarchy that will be created
by performing the top-down analysis by decomposition and zigzagging.
Table 3.5 is the proposed template for documenting the mapping of CNs to FRis
and ICs. This template captures the mapping relationships (R and C matrices) between
the customer and functional domains. It is very important that the flow of information
from one domain to another is captured and documented for better requirement
traceability and change management as well as for better impact analysis. The possible
values for the matrix elements are “0” to indicate no relationship and “X” to indicate
relationship.
Table 3.5 – Template for mapping CNs to FRis and ICs
CN ID FRi ID FRi Description
1 2 3 4 5 .. l
FRi1 FRi1 Description 0/X 0/X 0/X 0/X 0/X
FRi2
.
. FRim
IC ID IC Description 1 2 3 4 5 .. l
IC1 IC1 Description 0/X 0/X 0/X 0/X 0/X
IC2
.
. ICn
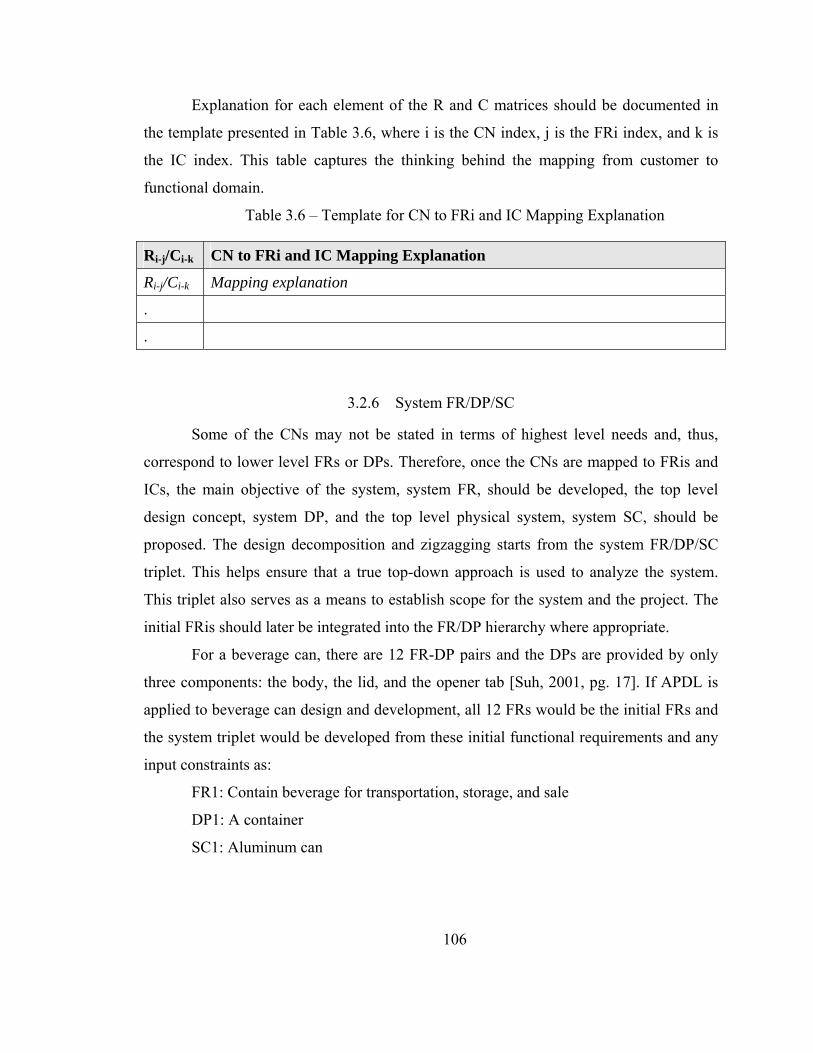
106
Explanation for each element of the R and C matrices should be documented in
the template presented in Table 3.6, where i is the CN index, j is the FRi index, and k is
the IC index. This table captures the thinking behind the mapping from customer to
functional domain.
Table 3.6 – Template for CN to FRi and IC Mapping Explanation
Ri-j/Ci-k CN to FRi and IC Mapping Explanation
Ri-j/Ci-k Mapping explanation
.
.
3.2.6 System FR/DP/SC
Some of the CNs may not be stated in terms of highest level needs and, thus,
correspond to lower level FRs or DPs. Therefore, once the CNs are mapped to FRis and
ICs, the main objective of the system, system FR, should be developed, the top level
design concept, system DP, and the top level physical system, system SC, should be
proposed. The design decomposition and zigzagging starts from the system FR/DP/SC
triplet. This helps ensure that a true top-down approach is used to analyze the system.
This triplet also serves as a means to establish scope for the system and the project. The
initial FRis should later be integrated into the FR/DP hierarchy where appropriate.
For a beverage can, there are 12 FR-DP pairs and the DPs are provided by only
three components: the body, the lid, and the opener tab [Suh, 2001, pg. 17]. If APDL is
applied to beverage can design and development, all 12 FRs would be the initial FRs and
the system triplet would be developed from these initial functional requirements and any
input constraints as:
FR1: Contain beverage for transportation, storage, and sale
DP1: A container
SC1: Aluminum can
107
By starting the decomposition from the system triplets, the FRs and DPs can be
systematically developed and the DPs can be allocated to the three components of the
aluminum can. The children FRs for FR1 could be:
FR1.1: Container shall be strong enough for transportation
FR1.2: Container shall be strong enough for storage
FR1.3: Container shall be attractive
As you can see from these FRs, the decomposition process and structure would
significantly differ from the approach presented in Suh (2001).
3.2.7 Design Parameters
The DPs are the elements of the design solution in the physical domain that are
chosen to satisfy the specified FRs. The DPs can describe conceptual design solutions,
subsystems, components, or component attributes.
Developing DPs requires knowledge, skills and creativity. Although the AD
provides the structure and guidance for decomposition and determining the quality of the
design, it does not help develop DPs. Some other methodologies, such as TRIZ, can be
used to help the designers conceive DPs for a given FR.
There are five (5) types of DPs based on the type of the physical entity that
provides the design solution stated by the DPs as explained in Table 3.7.
The objective of this classification is to help designer map the DPs to SCs. The
type of a DP can be proposed at the time the DP is developed, and then it can be updated
depending on the further design decomposition. It is a very good practice to visualize the
DPs to help verify the proposed design as well as to communicate the design with other
teammates and stakeholders. Only the DPs that are mapped to some SCs can be
visualized. The visualization can be achieved through drawings, prototypes, virtual
prototypes, or numerical models.
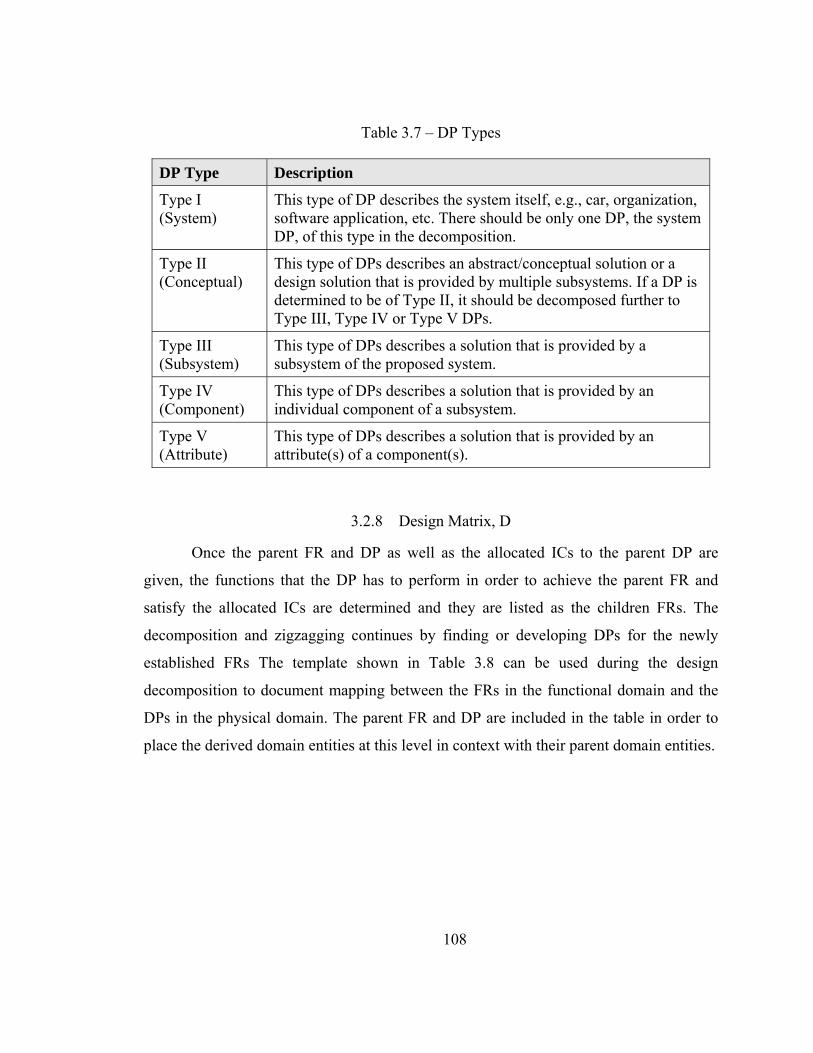
108
Table 3.7 – DP Types
DP Type Description
Type I (System)
This type of DP describes the system itself, e.g., car, organization, software application, etc. There should be only one DP, the system DP, of this type in the decomposition.
Type II (Conceptual)
This type of DPs describes an abstract/conceptual solution or a design solution that is provided by multiple subsystems. If a DP is determined to be of Type II, it should be decomposed further to Type III, Type IV or Type V DPs.
Type III (Subsystem)
This type of DPs describes a solution that is provided by a subsystem of the proposed system.
Type IV (Component)
This type of DPs describes a solution that is provided by an individual component of a subsystem.
Type V (Attribute)
This type of DPs describes a solution that is provided by an attribute(s) of a component(s).
3.2.8 Design Matrix, D
Once the parent FR and DP as well as the allocated ICs to the parent DP are
given, the functions that the DP has to perform in order to achieve the parent FR and
satisfy the allocated ICs are determined and they are listed as the children FRs. The
decomposition and zigzagging continues by finding or developing DPs for the newly
established FRs The template shown in Table 3.8 can be used during the design
decomposition to document mapping between the FRs in the functional domain and the
DPs in the physical domain. The parent FR and DP are included in the table in order to
place the derived domain entities at this level in context with their parent domain entities.
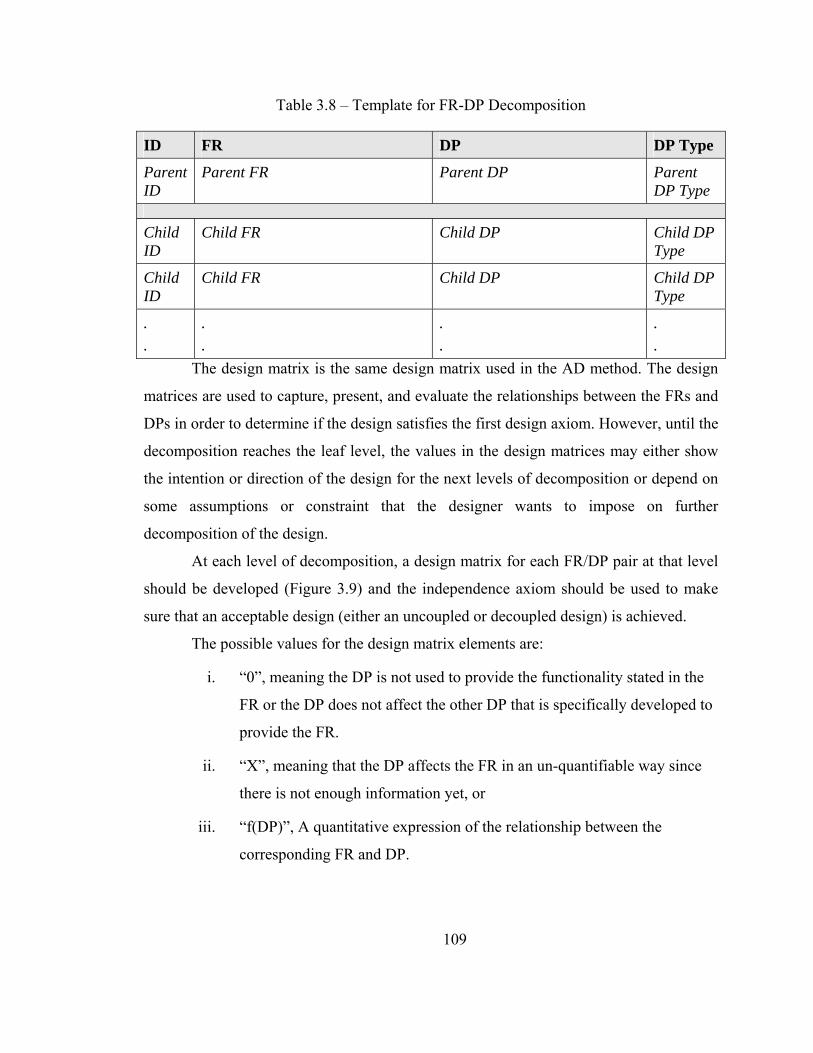
109
Table 3.8 – Template for FR-DP Decomposition
ID FR DP DP Type
Parent ID
Parent FR Parent DP Parent DP Type
Child ID
Child FR Child DP Child DP Type
Child ID
Child FR Child DP Child DP Type
.
. . .
.
. . .
The design matrix is the same design matrix used in the AD method. The design
matrices are used to capture, present, and evaluate the relationships between the FRs and
DPs in order to determine if the design satisfies the first design axiom. However, until the
decomposition reaches the leaf level, the values in the design matrices may either show
the intention or direction of the design for the next levels of decomposition or depend on
some assumptions or constraint that the designer wants to impose on further
decomposition of the design.
At each level of decomposition, a design matrix for each FR/DP pair at that level
should be developed (Figure 3.9) and the independence axiom should be used to make
sure that an acceptable design (either an uncoupled or decoupled design) is achieved.
The possible values for the design matrix elements are:
i. “0”, meaning the DP is not used to provide the functionality stated in the
FR or the DP does not affect the other DP that is specifically developed to
provide the FR.
ii. “X”, meaning that the DP affects the FR in an un-quantifiable way since
there is not enough information yet, or
iii. “f(DP)”, A quantitative expression of the relationship between the
corresponding FR and DP.
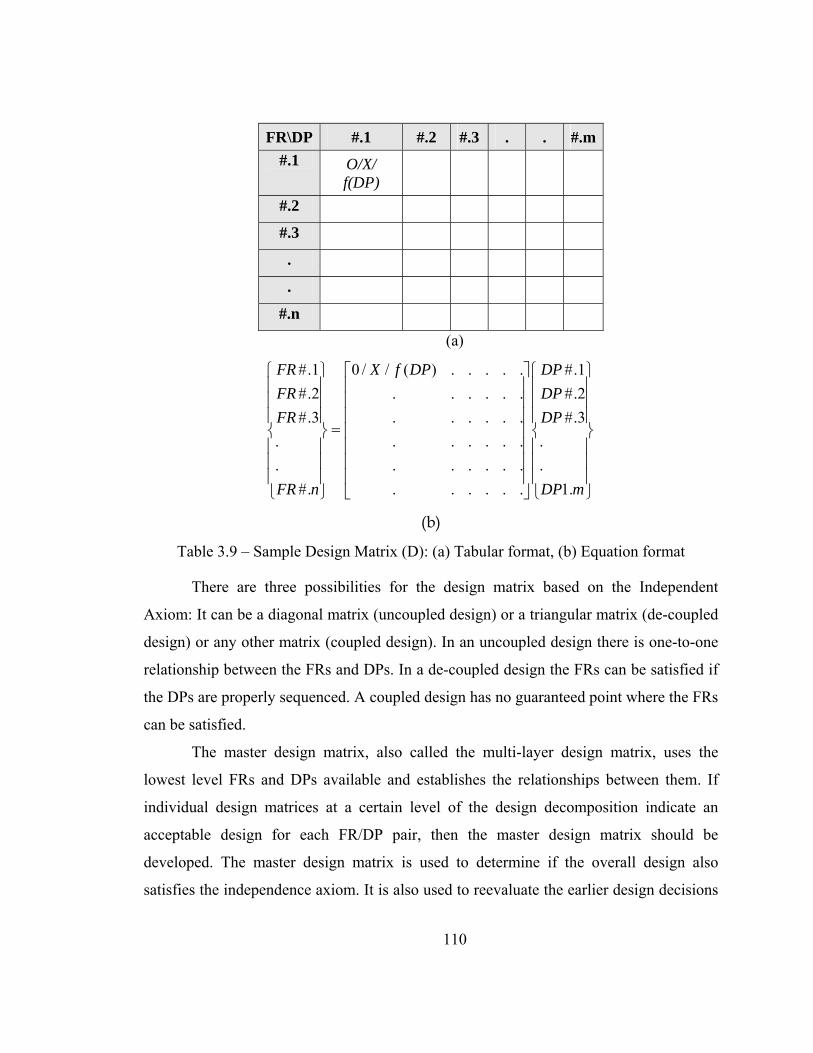
110
FR\DP #.1 #.2 #.3 . . #.m #.1 O/X/
f(DP)
#.2 #.3 . .
#.n (a)
#.1 0 / / ( ) . . . . . #.1#.2 . . . . . . #.2#.3 . . . . . . #.3
. . . . . . . .
. . . . . . . .#. . . . . . . 1.
FR X f DP DPFR DPFR DP
FR n DP m
⎧ ⎫ ⎡ ⎤ ⎧ ⎫⎪ ⎪ ⎢ ⎥ ⎪ ⎪⎪ ⎪ ⎢ ⎥ ⎪ ⎪⎪ ⎪ ⎢ ⎥ ⎪ ⎪
=⎨ ⎬ ⎨ ⎬⎢ ⎥⎪ ⎪ ⎪ ⎪⎢ ⎥⎪ ⎪ ⎪ ⎪⎢ ⎥⎪ ⎪ ⎪ ⎪⎢ ⎥⎩ ⎭ ⎣ ⎦ ⎩ ⎭
(b)
Table 3.9 – Sample Design Matrix (D): (a) Tabular format, (b) Equation format
There are three possibilities for the design matrix based on the Independent
Axiom: It can be a diagonal matrix (uncoupled design) or a triangular matrix (de-coupled
design) or any other matrix (coupled design). In an uncoupled design there is one-to-one
relationship between the FRs and DPs. In a de-coupled design the FRs can be satisfied if
the DPs are properly sequenced. A coupled design has no guaranteed point where the FRs
can be satisfied.
The master design matrix, also called the multi-layer design matrix, uses the
lowest level FRs and DPs available and establishes the relationships between them. If
individual design matrices at a certain level of the design decomposition indicate an
acceptable design for each FR/DP pair, then the master design matrix should be
developed. The master design matrix is used to determine if the overall design also
satisfies the independence axiom. It is also used to reevaluate the earlier design decisions
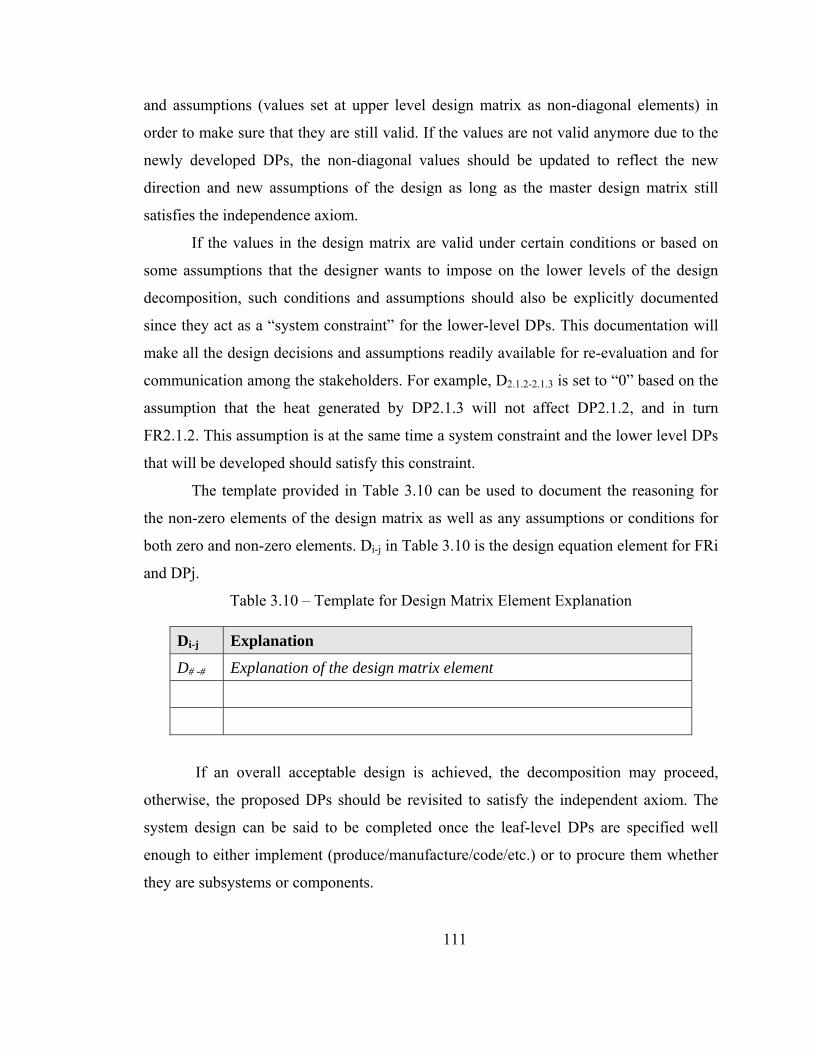
111
and assumptions (values set at upper level design matrix as non-diagonal elements) in
order to make sure that they are still valid. If the values are not valid anymore due to the
newly developed DPs, the non-diagonal values should be updated to reflect the new
direction and new assumptions of the design as long as the master design matrix still
satisfies the independence axiom.
If the values in the design matrix are valid under certain conditions or based on
some assumptions that the designer wants to impose on the lower levels of the design
decomposition, such conditions and assumptions should also be explicitly documented
since they act as a “system constraint” for the lower-level DPs. This documentation will
make all the design decisions and assumptions readily available for re-evaluation and for
communication among the stakeholders. For example, D2.1.2-2.1.3 is set to “0” based on the
assumption that the heat generated by DP2.1.3 will not affect DP2.1.2, and in turn
FR2.1.2. This assumption is at the same time a system constraint and the lower level DPs
that will be developed should satisfy this constraint.
The template provided in Table 3.10 can be used to document the reasoning for
the non-zero elements of the design matrix as well as any assumptions or conditions for
both zero and non-zero elements. Di-j in Table 3.10 is the design equation element for FRi
and DPj.
Table 3.10 – Template for Design Matrix Element Explanation
Di-j Explanation
D# -# Explanation of the design matrix element
If an overall acceptable design is achieved, the decomposition may proceed,
otherwise, the proposed DPs should be revisited to satisfy the independent axiom. The
system design can be said to be completed once the leaf-level DPs are specified well
enough to either implement (produce/manufacture/code/etc.) or to procure them whether
they are subsystems or components.
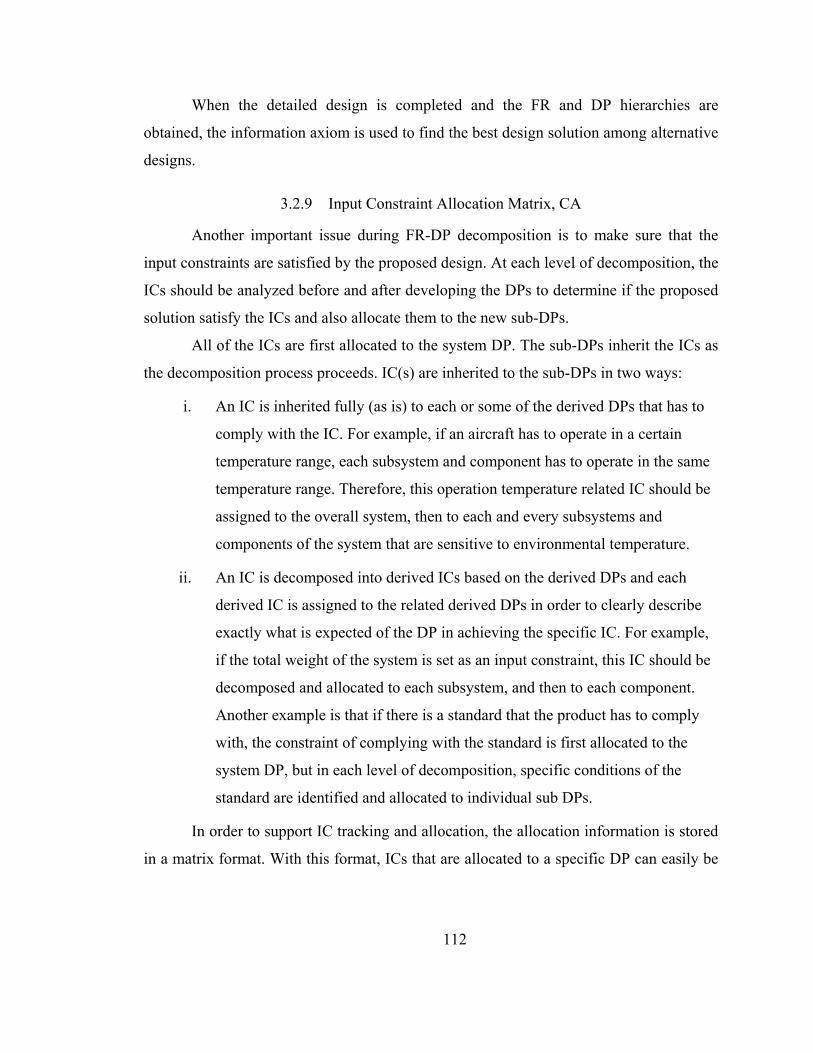
112
When the detailed design is completed and the FR and DP hierarchies are
obtained, the information axiom is used to find the best design solution among alternative
designs.
3.2.9 Input Constraint Allocation Matrix, CA
Another important issue during FR-DP decomposition is to make sure that the
input constraints are satisfied by the proposed design. At each level of decomposition, the
ICs should be analyzed before and after developing the DPs to determine if the proposed
solution satisfy the ICs and also allocate them to the new sub-DPs.
All of the ICs are first allocated to the system DP. The sub-DPs inherit the ICs as
the decomposition process proceeds. IC(s) are inherited to the sub-DPs in two ways:
i. An IC is inherited fully (as is) to each or some of the derived DPs that has to
comply with the IC. For example, if an aircraft has to operate in a certain
temperature range, each subsystem and component has to operate in the same
temperature range. Therefore, this operation temperature related IC should be
assigned to the overall system, then to each and every subsystems and
components of the system that are sensitive to environmental temperature.
ii. An IC is decomposed into derived ICs based on the derived DPs and each
derived IC is assigned to the related derived DPs in order to clearly describe
exactly what is expected of the DP in achieving the specific IC. For example,
if the total weight of the system is set as an input constraint, this IC should be
decomposed and allocated to each subsystem, and then to each component.
Another example is that if there is a standard that the product has to comply
with, the constraint of complying with the standard is first allocated to the
system DP, but in each level of decomposition, specific conditions of the
standard are identified and allocated to individual sub DPs.
In order to support IC tracking and allocation, the allocation information is stored
in a matrix format. With this format, ICs that are allocated to a specific DP can easily be
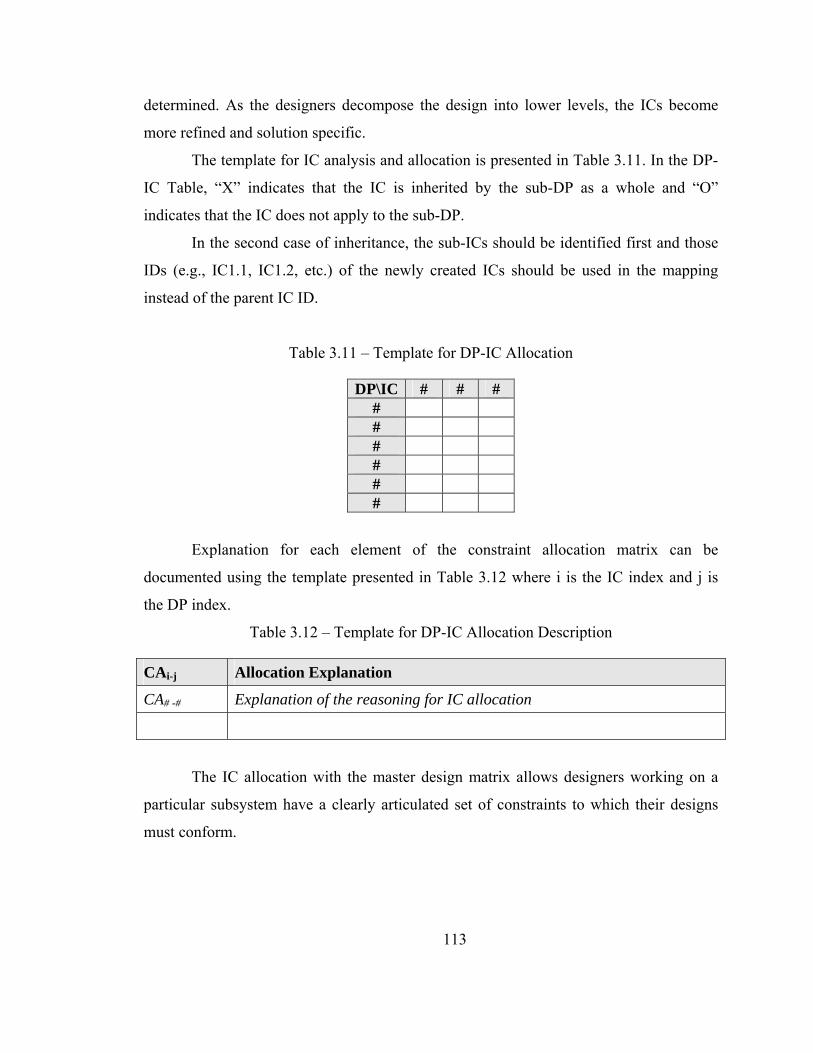
113
determined. As the designers decompose the design into lower levels, the ICs become
more refined and solution specific.
The template for IC analysis and allocation is presented in Table 3.11. In the DP-
IC Table, “X” indicates that the IC is inherited by the sub-DP as a whole and “O”
indicates that the IC does not apply to the sub-DP.
In the second case of inheritance, the sub-ICs should be identified first and those
IDs (e.g., IC1.1, IC1.2, etc.) of the newly created ICs should be used in the mapping
instead of the parent IC ID.
Table 3.11 – Template for DP-IC Allocation
DP\IC # # # # # # # # #
Explanation for each element of the constraint allocation matrix can be
documented using the template presented in Table 3.12 where i is the IC index and j is
the DP index.
Table 3.12 – Template for DP-IC Allocation Description
CAi-j Allocation Explanation
CA# -# Explanation of the reasoning for IC allocation
The IC allocation with the master design matrix allows designers working on a
particular subsystem have a clearly articulated set of constraints to which their designs
must conform.
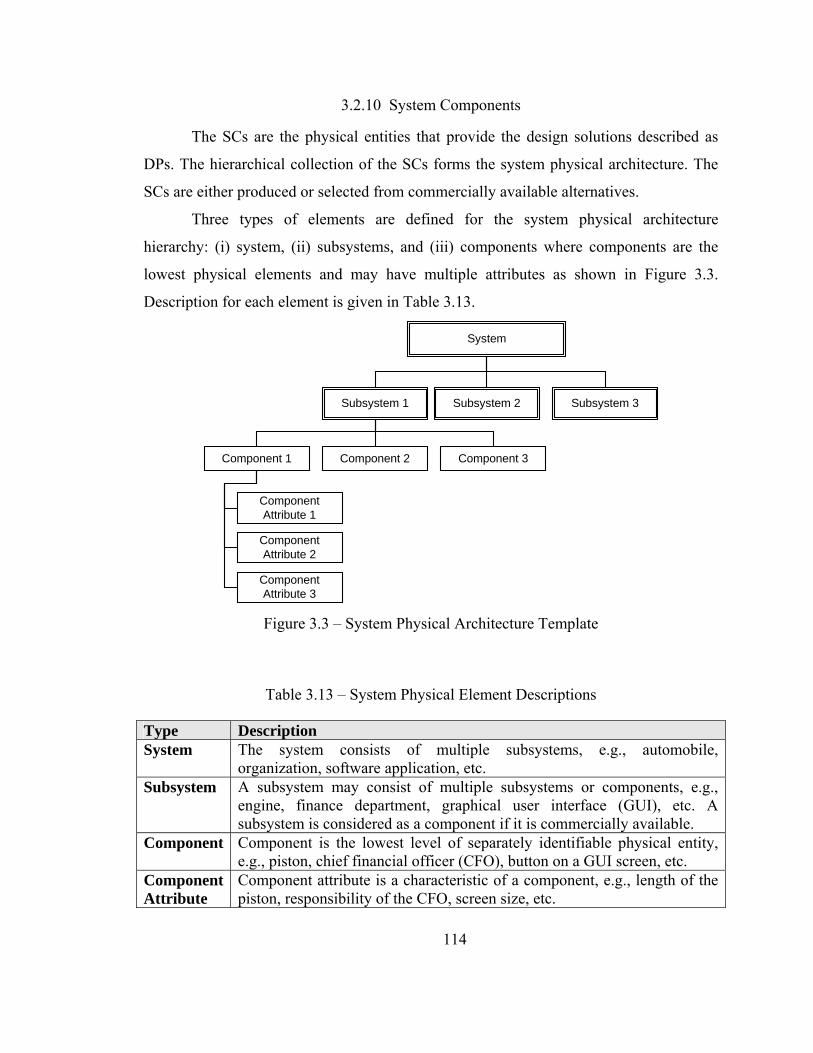
114
3.2.10 System Components
The SCs are the physical entities that provide the design solutions described as
DPs. The hierarchical collection of the SCs forms the system physical architecture. The
SCs are either produced or selected from commercially available alternatives.
Three types of elements are defined for the system physical architecture
hierarchy: (i) system, (ii) subsystems, and (iii) components where components are the
lowest physical elements and may have multiple attributes as shown in Figure 3.3.
Description for each element is given in Table 3.13.
System
Subsystem 2 Subsystem 3Subsystem 1
Component 2 Component 3Component 1
ComponentAttribute 2
ComponentAttribute 3
ComponentAttribute 1
Figure 3.3 – System Physical Architecture Template
Table 3.13 – System Physical Element Descriptions
Type Description System The system consists of multiple subsystems, e.g., automobile,
organization, software application, etc. Subsystem A subsystem may consist of multiple subsystems or components, e.g.,
engine, finance department, graphical user interface (GUI), etc. A subsystem is considered as a component if it is commercially available.
Component Component is the lowest level of separately identifiable physical entity, e.g., piston, chief financial officer (CFO), button on a GUI screen, etc.
Component Attribute
Component attribute is a characteristic of a component, e.g., length of the piston, responsibility of the CFO, screen size, etc.
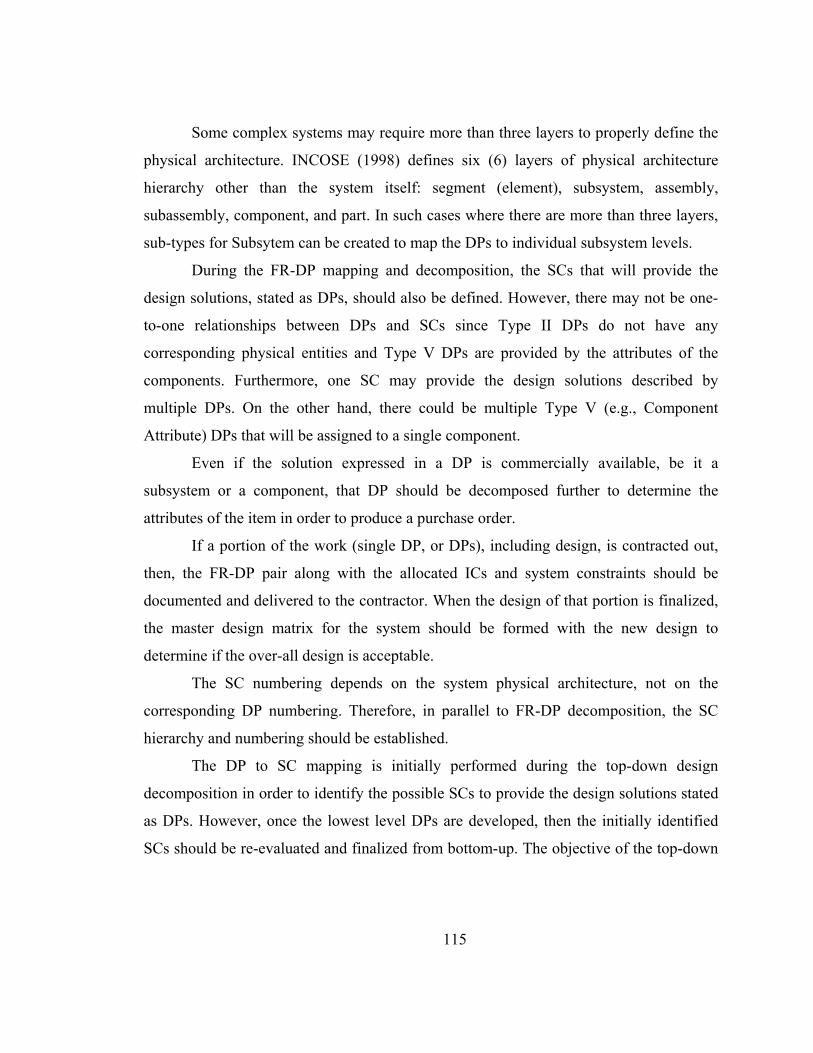
115
Some complex systems may require more than three layers to properly define the
physical architecture. INCOSE (1998) defines six (6) layers of physical architecture
hierarchy other than the system itself: segment (element), subsystem, assembly,
subassembly, component, and part. In such cases where there are more than three layers,
sub-types for Subsytem can be created to map the DPs to individual subsystem levels.
During the FR-DP mapping and decomposition, the SCs that will provide the
design solutions, stated as DPs, should also be defined. However, there may not be one-
to-one relationships between DPs and SCs since Type II DPs do not have any
corresponding physical entities and Type V DPs are provided by the attributes of the
components. Furthermore, one SC may provide the design solutions described by
multiple DPs. On the other hand, there could be multiple Type V (e.g., Component
Attribute) DPs that will be assigned to a single component.
Even if the solution expressed in a DP is commercially available, be it a
subsystem or a component, that DP should be decomposed further to determine the
attributes of the item in order to produce a purchase order.
If a portion of the work (single DP, or DPs), including design, is contracted out,
then, the FR-DP pair along with the allocated ICs and system constraints should be
documented and delivered to the contractor. When the design of that portion is finalized,
the master design matrix for the system should be formed with the new design to
determine if the over-all design is acceptable.
The SC numbering depends on the system physical architecture, not on the
corresponding DP numbering. Therefore, in parallel to FR-DP decomposition, the SC
hierarchy and numbering should be established.
The DP to SC mapping is initially performed during the top-down design
decomposition in order to identify the possible SCs to provide the design solutions stated
as DPs. However, once the lowest level DPs are developed, then the initially identified
SCs should be re-evaluated and finalized from bottom-up. The objective of the top-down
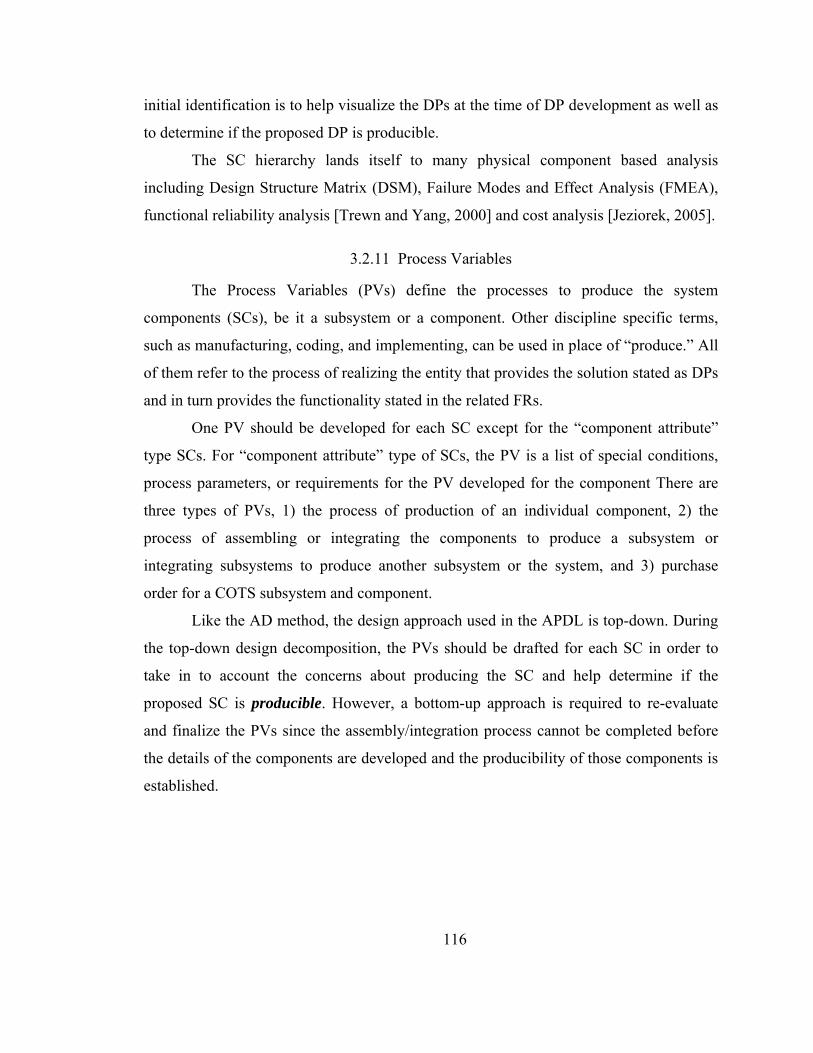
116
initial identification is to help visualize the DPs at the time of DP development as well as
to determine if the proposed DP is producible.
The SC hierarchy lands itself to many physical component based analysis
including Design Structure Matrix (DSM), Failure Modes and Effect Analysis (FMEA),
functional reliability analysis [Trewn and Yang, 2000] and cost analysis [Jeziorek, 2005].
3.2.11 Process Variables
The Process Variables (PVs) define the processes to produce the system
components (SCs), be it a subsystem or a component. Other discipline specific terms,
such as manufacturing, coding, and implementing, can be used in place of “produce.” All
of them refer to the process of realizing the entity that provides the solution stated as DPs
and in turn provides the functionality stated in the related FRs.
One PV should be developed for each SC except for the “component attribute”
type SCs. For “component attribute” type of SCs, the PV is a list of special conditions,
process parameters, or requirements for the PV developed for the component There are
three types of PVs, 1) the process of production of an individual component, 2) the
process of assembling or integrating the components to produce a subsystem or
integrating subsystems to produce another subsystem or the system, and 3) purchase
order for a COTS subsystem and component.
Like the AD method, the design approach used in the APDL is top-down. During
the top-down design decomposition, the PVs should be drafted for each SC in order to
take in to account the concerns about producing the SC and help determine if the
proposed SC is producible. However, a bottom-up approach is required to re-evaluate
and finalize the PVs since the assembly/integration process cannot be completed before
the details of the components are developed and the producibility of those components is
established.
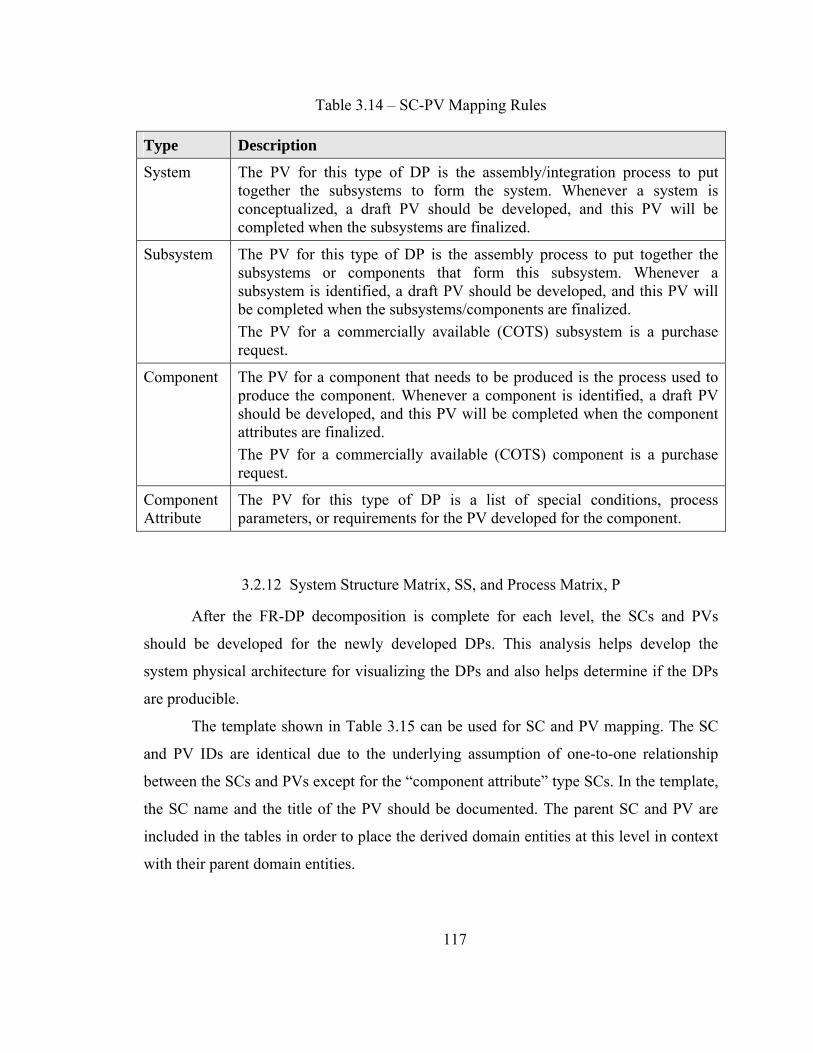
117
Table 3.14 – SC-PV Mapping Rules
Type Description
System The PV for this type of DP is the assembly/integration process to put together the subsystems to form the system. Whenever a system is conceptualized, a draft PV should be developed, and this PV will be completed when the subsystems are finalized.
Subsystem The PV for this type of DP is the assembly process to put together the subsystems or components that form this subsystem. Whenever a subsystem is identified, a draft PV should be developed, and this PV will be completed when the subsystems/components are finalized. The PV for a commercially available (COTS) subsystem is a purchase request.
Component The PV for a component that needs to be produced is the process used to produce the component. Whenever a component is identified, a draft PV should be developed, and this PV will be completed when the component attributes are finalized. The PV for a commercially available (COTS) component is a purchase request.
Component Attribute
The PV for this type of DP is a list of special conditions, process parameters, or requirements for the PV developed for the component.
3.2.12 System Structure Matrix, SS, and Process Matrix, P
After the FR-DP decomposition is complete for each level, the SCs and PVs
should be developed for the newly developed DPs. This analysis helps develop the
system physical architecture for visualizing the DPs and also helps determine if the DPs
are producible.
The template shown in Table 3.15 can be used for SC and PV mapping. The SC
and PV IDs are identical due to the underlying assumption of one-to-one relationship
between the SCs and PVs except for the “component attribute” type SCs. In the template,
the SC name and the title of the PV should be documented. The parent SC and PV are
included in the tables in order to place the derived domain entities at this level in context
with their parent domain entities.
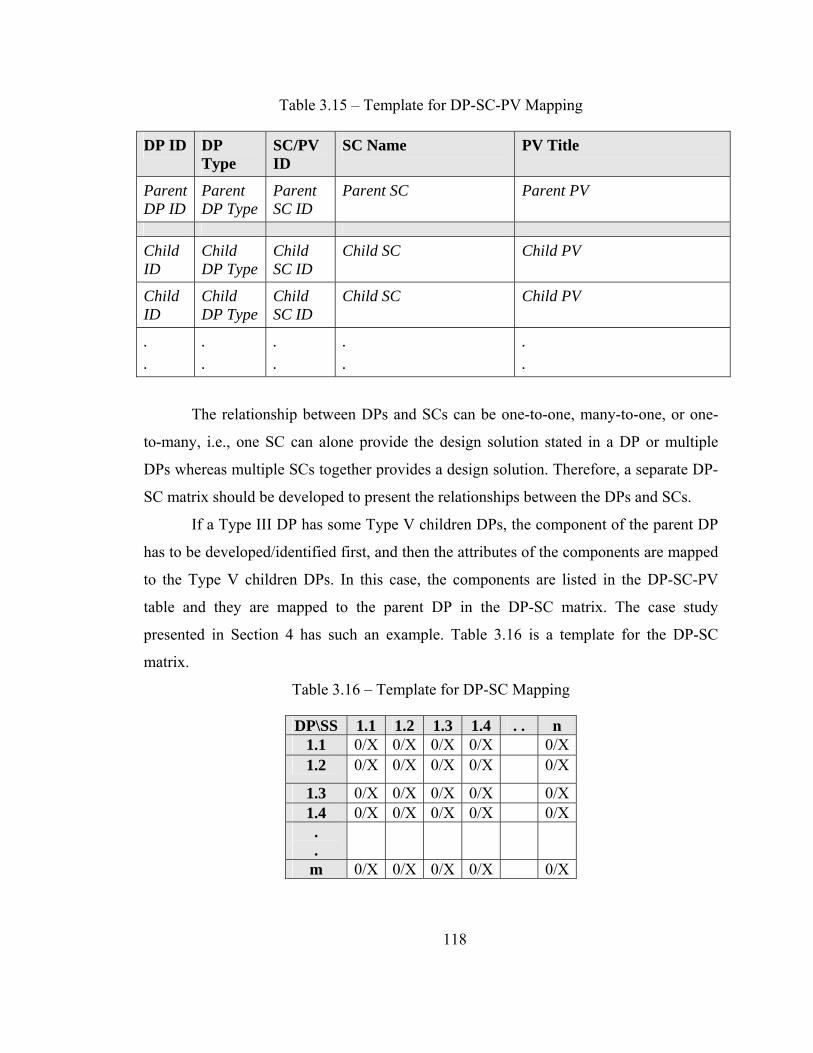
118
Table 3.15 – Template for DP-SC-PV Mapping
DP ID DP Type
SC/PV ID
SC Name PV Title
Parent DP ID
Parent DP Type
Parent SC ID
Parent SC Parent PV
Child ID
Child DP Type
Child SC ID
Child SC Child PV
Child ID
Child DP Type
Child SC ID
Child SC Child PV
.
. . .
.
. . .
.
.
The relationship between DPs and SCs can be one-to-one, many-to-one, or one-
to-many, i.e., one SC can alone provide the design solution stated in a DP or multiple
DPs whereas multiple SCs together provides a design solution. Therefore, a separate DP-
SC matrix should be developed to present the relationships between the DPs and SCs.
If a Type III DP has some Type V children DPs, the component of the parent DP
has to be developed/identified first, and then the attributes of the components are mapped
to the Type V children DPs. In this case, the components are listed in the DP-SC-PV
table and they are mapped to the parent DP in the DP-SC matrix. The case study
presented in Section 4 has such an example. Table 3.16 is a template for the DP-SC
matrix.
Table 3.16 – Template for DP-SC Mapping
DP\SS 1.1 1.2 1.3 1.4 . . n 1.1 0/X 0/X 0/X 0/X 0/X1.2 0/X 0/X 0/X 0/X 0/X
1.3 0/X 0/X 0/X 0/X 0/X1.4 0/X 0/X 0/X 0/X 0/X. .
m 0/X 0/X 0/X 0/X 0/X
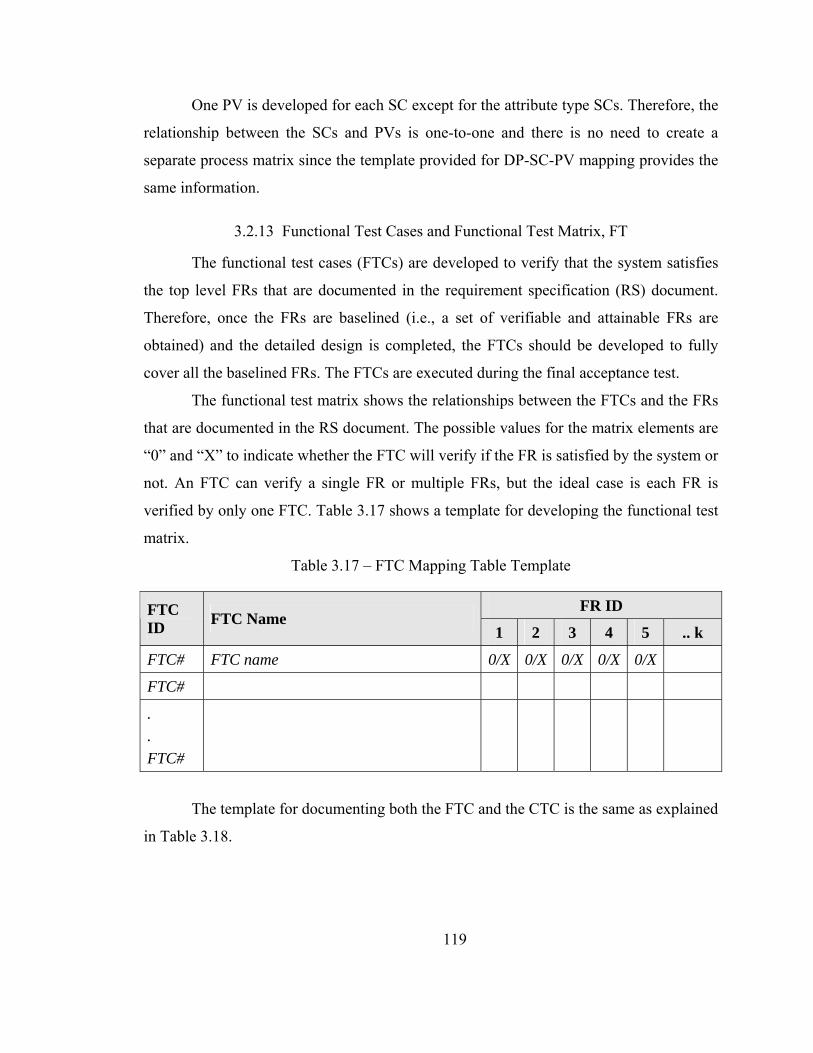
119
One PV is developed for each SC except for the attribute type SCs. Therefore, the
relationship between the SCs and PVs is one-to-one and there is no need to create a
separate process matrix since the template provided for DP-SC-PV mapping provides the
same information.
3.2.13 Functional Test Cases and Functional Test Matrix, FT
The functional test cases (FTCs) are developed to verify that the system satisfies
the top level FRs that are documented in the requirement specification (RS) document.
Therefore, once the FRs are baselined (i.e., a set of verifiable and attainable FRs are
obtained) and the detailed design is completed, the FTCs should be developed to fully
cover all the baselined FRs. The FTCs are executed during the final acceptance test.
The functional test matrix shows the relationships between the FTCs and the FRs
that are documented in the RS document. The possible values for the matrix elements are
“0” and “X” to indicate whether the FTC will verify if the FR is satisfied by the system or
not. An FTC can verify a single FR or multiple FRs, but the ideal case is each FR is
verified by only one FTC. Table 3.17 shows a template for developing the functional test
matrix.
Table 3.17 – FTC Mapping Table Template
FR ID FTC ID FTC Name
1 2 3 4 5 .. k
FTC# FTC name 0/X 0/X 0/X 0/X 0/X
FTC#
.
. FTC#
The template for documenting both the FTC and the CTC is the same as explained
in Table 3.18.
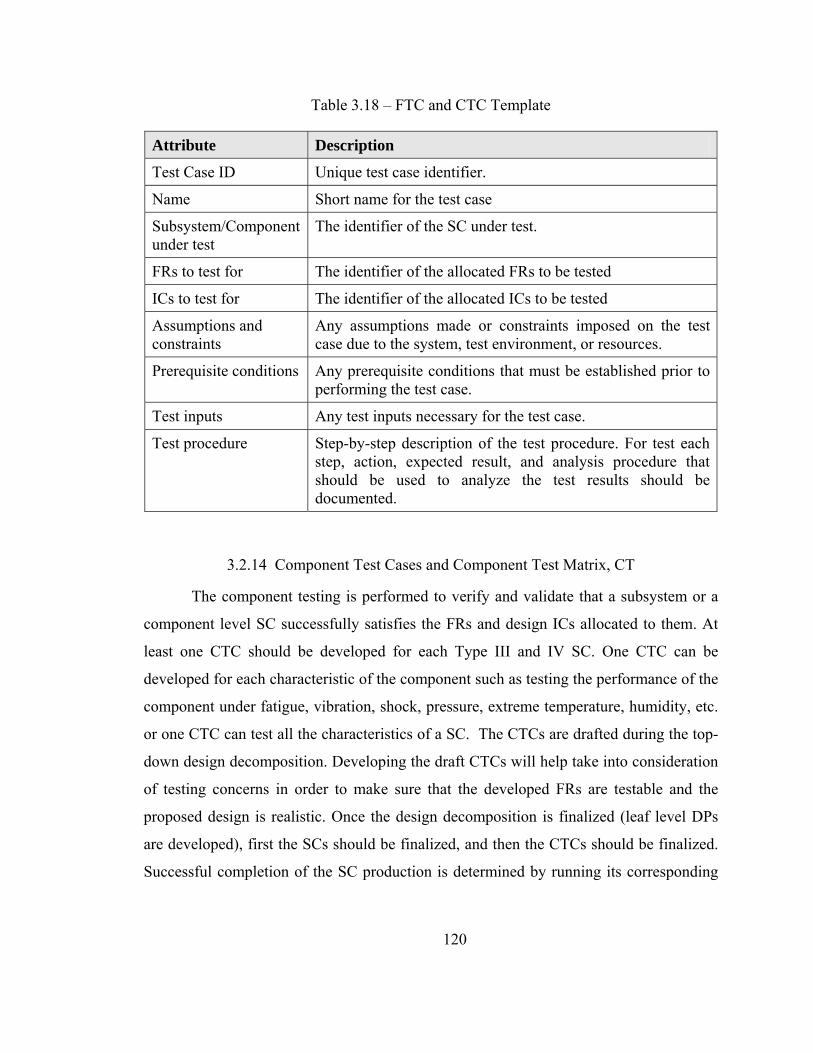
120
Table 3.18 – FTC and CTC Template
Attribute Description
Test Case ID Unique test case identifier.
Name Short name for the test case
Subsystem/Component under test
The identifier of the SC under test.
FRs to test for The identifier of the allocated FRs to be tested
ICs to test for The identifier of the allocated ICs to be tested
Assumptions and constraints
Any assumptions made or constraints imposed on the test case due to the system, test environment, or resources.
Prerequisite conditions Any prerequisite conditions that must be established prior to performing the test case.
Test inputs Any test inputs necessary for the test case.
Test procedure Step-by-step description of the test procedure. For test each step, action, expected result, and analysis procedure that should be used to analyze the test results should be documented.
3.2.14 Component Test Cases and Component Test Matrix, CT
The component testing is performed to verify and validate that a subsystem or a
component level SC successfully satisfies the FRs and design ICs allocated to them. At
least one CTC should be developed for each Type III and IV SC. One CTC can be
developed for each characteristic of the component such as testing the performance of the
component under fatigue, vibration, shock, pressure, extreme temperature, humidity, etc.
or one CTC can test all the characteristics of a SC. The CTCs are drafted during the top-
down design decomposition. Developing the draft CTCs will help take into consideration
of testing concerns in order to make sure that the developed FRs are testable and the
proposed design is realistic. Once the design decomposition is finalized (leaf level DPs
are developed), first the SCs should be finalized, and then the CTCs should be finalized.
Successful completion of the SC production is determined by running its corresponding
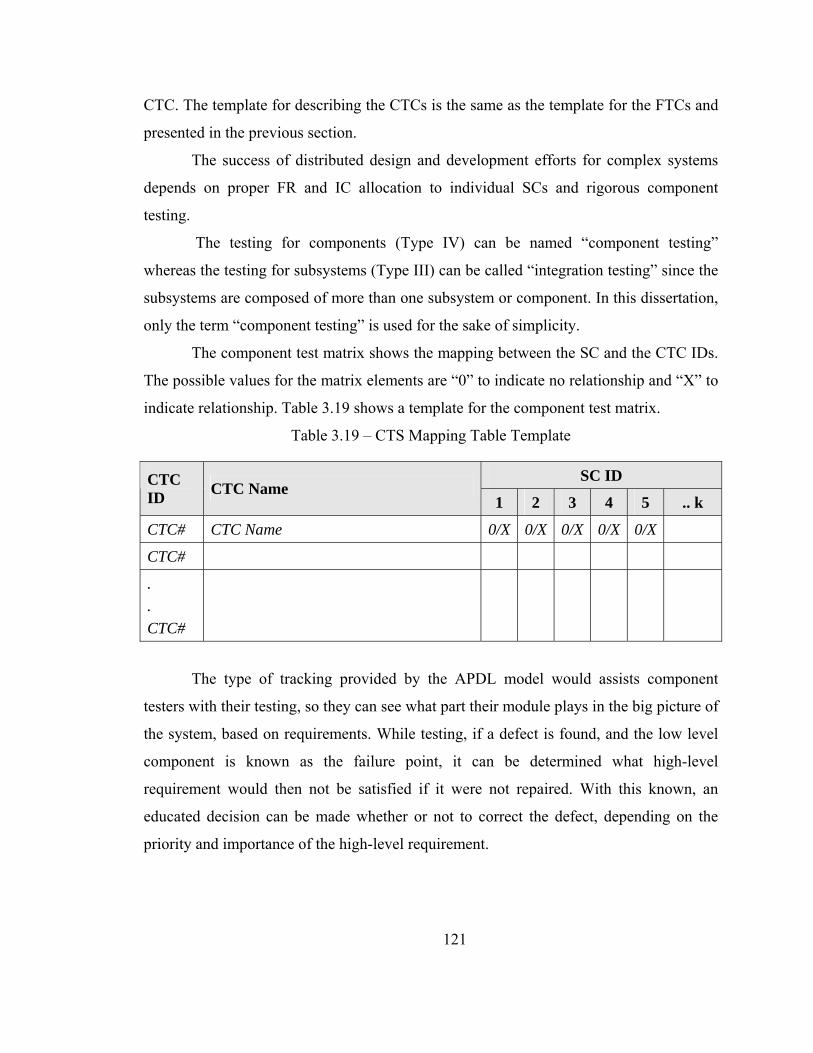
121
CTC. The template for describing the CTCs is the same as the template for the FTCs and
presented in the previous section.
The success of distributed design and development efforts for complex systems
depends on proper FR and IC allocation to individual SCs and rigorous component
testing.
The testing for components (Type IV) can be named “component testing”
whereas the testing for subsystems (Type III) can be called “integration testing” since the
subsystems are composed of more than one subsystem or component. In this dissertation,
only the term “component testing” is used for the sake of simplicity.
The component test matrix shows the mapping between the SC and the CTC IDs.
The possible values for the matrix elements are “0” to indicate no relationship and “X” to
indicate relationship. Table 3.19 shows a template for the component test matrix.
Table 3.19 – CTS Mapping Table Template
SC ID CTC ID CTC Name
1 2 3 4 5 .. k
CTC# CTC Name 0/X 0/X 0/X 0/X 0/X
CTC#
.
. CTC#
The type of tracking provided by the APDL model would assists component
testers with their testing, so they can see what part their module plays in the big picture of
the system, based on requirements. While testing, if a defect is found, and the low level
component is known as the failure point, it can be determined what high-level
requirement would then not be satisfied if it were not repaired. With this known, an
educated decision can be made whether or not to correct the defect, depending on the
priority and importance of the high-level requirement.
122
3.3 APDL System Architecture
The term ‘system architecture’ can be named and defined in many different ways.
Ulrich defines “product architecture” as the scheme by which the function of a product is
allocated to physical components [Ulrich, 2000]. INCOSE defines “system architecture”
as the arrangement of the elements and subsystems and the allocation of the functions to
them to meet the system requirements [INCOSE, 1998]. In the AD, the system
architecture is defined as the hierarchical collection of FRs and DPs, and design matrix
generated during decomposition and zigzagging. It is captured in AD as sets of functional
requirements (FRs), design parameters (DPs), constraints, and design matrices (DMs) in a
hierarchical arrangement. It is the aggregation of all of the design decisions during the
decomposition and zigzagging [Hintersteiner and Tate, 1998; Lee, 1999]. The AD system
architecture is explained in detail in Section 2.3.3.
In this research, the AD SA model is extended to include the SC hierarchy.
Instead of FR/DP pairs, FR/DP/SC triplets are used in the system architecture. Appendix
B presents the system architecture of the case study.
Other than adding the SC hierarchy (system physical architecture), the aspects of
the Axiomatic Design System Architecture concept is kept the same in APDL, that is, the
module-junction and the flow diagram are unchanged.
The objective of developing the system architecture in APDL is to capture the
requirements, design, and components of the system and the inter-relationships among
them in a logical, coherent, and comprehensive manner, in order to facilitate
communication between engineers, managers, and other stakeholders including the
customer, and to provide good technical documentation of the design decisions made and
the reasoning behind them.
Since the system architecture generated by APDL highlights the relationships
between the FRs, DPs, and SCs, it can be used to evaluate the impact of proposed design
changes as well as requirement changes. Therefore, the SA makes it possible for the
product designers and customers to make more informed decisions as to whether or not to
pursue the proposed changes.
123
The strength of the system architecture is that, in addition to the operational flow
of the system, it also captures the order in which design decisions have to be made, and
indicates how the alteration of one part of the system can potentially impact other parts.
[Tate, 1999]
The SA can also be used in diagnosis of system failure, in job assignment and
management of the development team, distributed systems, and system design through
assembly of modules [Suh, 2001].
3.4 APDL and Requirement Management
Requirement management activities greatly benefit from the application of the
AD method in product design as explained in Section 2.5.1. However, as noted in Section
2.5.1, the AD method does not fully support the three requirement management
objectives since the AD does not cover all of the product development lifecycle domains
and the mapping between the DPs and the physical components is not established. The
APDL model, with the test domain, the input constraint vector, the system component
vector, the requirement template, and the proposed requirement and requirement set
quality factors, helps achieve all three objectives of requirement management, that is, to
capture the requirements right, to manage changing requirements, and to align the system
development lifecycle activities with the requirements. The use of the APDL model
should help overcome all the problems listed in Section 2.1.1.3 by supporting all three
objectives of requirement management.
The requirement description template presented in Section 3.2.3 provides
guidance in standardizing the requirements analysis process and also can be used as a
checklist to make sure that enough information is gathered about the requirements. The
FR hierarchy of the APDL model along with the requirement template and the list of the
input constraints can be used to develop the requirement specification document. The end
product and all of the components can be tested against the allocated requirements and
constraints easily since the APDL mapping matrixes can provide the traceability of each
design solution and each component to requirements and input constraints.
124
In the APDL model, the requirement matrix constitutes the pre-RT, and the other
matrices constitute the post-RT. Requirements can be traced back to the customer needs
and forward to DPs, SCs, PVs, CTCs, and FTCs. This makes sure that the system
development activities can be aligned with the established and agreed-upon requirements
and also any change in customer needs or requirements can be traced in both directions to
assess the impact of the requirement change.
It is known that the RT problems are an artifact of informal development methods
[Gotel and Finkelstein, 1994]. Therefore, implementing the APDL approach for product
design and development would solve most of the problems faced by the development
team as far as requirement traceability is concerned. Implementing APDL would also
lessen the investment for RT since APDL provides the foundation and the links required
for the RT activities as a by-product [Gumus and Ertas, 2004; Gumus et al., 2002].
Another important factor affecting the PDL is the communication between all the
stakeholders, especially for large complex development efforts. When a system is
sufficiently large and complex, the PDL activities, including design effort, must be
distributed among several development teams, which may be located in different
locations. Communication of requirements and constraints as well as other design and
development related knowledge among all the development teams and other stakeholders
is crucial for two reasons: 1) to align all the development activities along with the agreed
upon requirements and constraints and 2) to share the big-picture view of the system so
that local efforts to optimize design do not hinder the overall optimization and
performance of the system.
Communication during requirement analysis is as important as communication of
the design knowledge since the functional requirements form the foundation of the PDL.
Effective communication between the stakeholders during requirement analysis prevents
a lot of problems such as vague or misunderstood requirements, schedule conflicts, and
reworks, thus shortens the development time and reducing the development cost. The
requirement specification created from the FR hierarchy, the FR template, and the input
125
constraint list will provide an effective tool for communication of the product
specifications.
3.5 APDL and Other Design Methodologies
The APDL approach provides a very robust structure to incorporate other generic
or discipline specific techniques to improve the robustness and quality of the design as
well as help with project management.
Each design and analysis tool and method requires different types of inputs from
the product development knowledgebase. The APDL system architecture stores and
presents the product development knowledge in an organized manner with relationships
between the domain entities. In addition, the recommended templates of APDL
standardize the knowledge capture and presentation; and make it easy to use, re-use, and
share the knowledge.
Since the APDL has more coverage than the AD as far as the product
development activities are concerned, the APDL model supports more tools and
methodologies than the AD approach does such as physical component related
methodologies (DMA, reliability, etc.) and test related analysis (test coverage, test
completeness, etc.).
In Section 2.3, some design and analysis techniques and methodologies were
briefly defined and comparison between the AD method and them are made. The
comparison between the following three methods and AD applies to the APDL model.
1. The Theory of Inventive Problem Solving (TRIZ):
2. Quality Function Deployment (QFD)
3. Robust Design
The APDL model provides better support for the following three methods than
AD does:
1. Concurrent Engineering (CE): Since APDL covers the test domain and also
has more guidance on documenting the development lifecycle knowledge,
engineers will be able to communicate better and handle test related
concerns better. Also, in APDL, the PVs are tied to the SCs instead of the
126
DPs; therefore, manufacturing concerns can be better addressed by tracking
them to the components instead of design solutions (DPs) that may be
satisfied by multiple components or by just one attribute of a component.
2. Design for X (DfX): The APDL can be used with any DfX methods. Unlike
AD, with the inclusion of the test domain, APDL provides better support for
Design for Test method.
3. Failure Mode and Effect Analysis (FMEA): In APDL, the SCs and their
relationships with the DPs and the PVs are captured; therefore, the failure
modes can be traced to the components instead of design solutions (DPs).
The failure modes can also be traced to the component test and/or
functional test cases to improve testing. With the SCs, Design Structure
Matrix analysis can be applied to the system components to identify inter-
dependencies that can cause potential failures.
The additional methodologies that the APDL model supports are explained in the
following sections.
3.5.1 Reliability Engineering
The APDL model provides the system component hierarchy that can be used to
obtain the relationships between the components for reliability calculation.
The FR to SC relationship is important for functional reliability calculation
[Trewn and Yang, 2000] and making sure that most important functions are provided by
most reliable components. It would help determine where redundancy or high reliable
components needed to make sure that the important functions are always provided.
3.5.2 Design Structure Matrix
Design Structure Matrix (DSM) [Steward, 1981] maps the relationships or
channels of communication between tasks. The DSM method describes the product
development process in an iterative manner. Browning (1998) extended DSM method in
his PhD thesis to model the iteration of program schedule and cost.
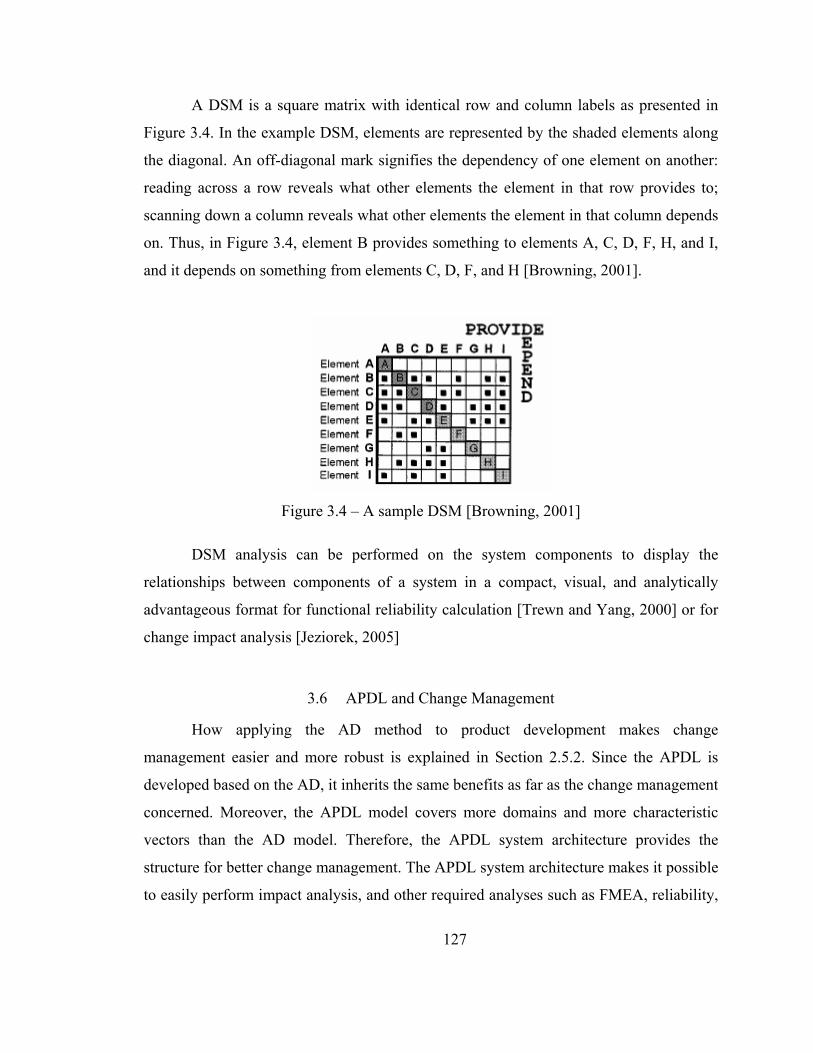
127
A DSM is a square matrix with identical row and column labels as presented in
Figure 3.4. In the example DSM, elements are represented by the shaded elements along
the diagonal. An off-diagonal mark signifies the dependency of one element on another:
reading across a row reveals what other elements the element in that row provides to;
scanning down a column reveals what other elements the element in that column depends
on. Thus, in Figure 3.4, element B provides something to elements A, C, D, F, H, and I,
and it depends on something from elements C, D, F, and H [Browning, 2001].
Figure 3.4 – A sample DSM [Browning, 2001]
DSM analysis can be performed on the system components to display the
relationships between components of a system in a compact, visual, and analytically
advantageous format for functional reliability calculation [Trewn and Yang, 2000] or for
change impact analysis [Jeziorek, 2005]
3.6 APDL and Change Management
How applying the AD method to product development makes change
management easier and more robust is explained in Section 2.5.2. Since the APDL is
developed based on the AD, it inherits the same benefits as far as the change management
concerned. Moreover, the APDL model covers more domains and more characteristic
vectors than the AD model. Therefore, the APDL system architecture provides the
structure for better change management. The APDL system architecture makes it possible
to easily perform impact analysis, and other required analyses such as FMEA, reliability,
128
etc. both during the development lifecycle and after the product is deployed. As a result,
the APDL system architecture can allow stakeholders to understand the proposed changes
and make more informed decisions as to whether or not such changes should be pursued.
3.7 APDL and Project Planning/Scheduling
Steward and Tate (2000) and Braha (2002) proposed to integrate AD into the
process of project planning and task assignment for software development projects. The
DPs were loaded into a project Gantt chart as tasks along with the dependencies from the
design matrices. By adding time estimates to the individual tasks and making
assumptions about the resources allocation, the Gantt chart takes on a common
appearance of tasks distributed over time with internal dependencies [Steward and Tate,
2000].
Although the above-mentioned efforts were for software development, the author
of this research believes that the same concept can be used for developing the WBS,
schedule, and plan for any product development effort. No matter what the product is, a
plan has to be prepared to guide and monitor the development and testing effort.
The APDL model provides the foundation to help develop project schedule and
planning for any product development effort. The APDL model also resolves some of the
concerns and issues identified in Steward and Tate (2000).
Steward and Tate point out “…multiple DPs may be physically integrated into a
single component. … However, it would be erroneous to list a task creating that
component more than once in the project plan. Therefore, the task list in the project plan
must be consolidated to remove redundant listings. … but being careful to preserve all
dependency links in the single remaining task representation.”
This problem can be overcome by developing the project schedule based on the
SCs of Types “component”, “subsystem”, and “system” and on the CTCs and FTCs
instead of the DPs, after all, the developers will produce the SCs that will provide the
design solution expressed in DPs and then test these to make sure that the requirements
and the input constraints are satisfied. The subsystem and system type DPs will be used
129
as “integration” or “assembly” tasks and test cases will be used as test tasks in the testing
phase. Since the schedule is based on the SCs and the test cases, there will not be any
redundant or duplicate tasks and also system integration/assembly and testing tasks are
properly considered in the schedule.
In addition to the process matrix, Design Structure Matrix analysis can be
performed on the SCs to find out the relationships and dependencies among them to help
determine if the tasks can be performed in parallel or in series.
Another advantage of this approach is the ability to keep the relationships
between the tasks and the FRs. This would address the other concern point out by
Steward and Tate: missing the one-to-one mapping of tasks to FRs. It is very important to
be able to see relations between the tasks and the FRs for couple of reasons:
1. Each activity can be traced back to a FR so that every body knows that the
purpose of the tasks
2. Making sure that the important FRs are satisfied first. This would help
determination of interim milestones.
The last concern that the APDL model can address is rolling the lower level DPs
into higher level ones since the lower level DPs are just properties of the higher level
DPs. In APDL, the lowest level SC is of type “component attribute” but these SCs are not
used as tasks in developing the project schedule. As a matter of fact, these SCs do not
have corresponding PVs either, they only determine the parameters of the parent SC’s
PV.
3.8 Discussion
The AD method provides a robust structure and systematic thinking to support
design activities, however, it does not support the whole product development lifecycle.
The same logic and scientific thinking is used and extended to capture, analyze, and
manage the product development lifecycle knowledge.
The APDL approach, like the AD method, can be used in design and development
of products, systems, services, and organizations in many different disciplines.
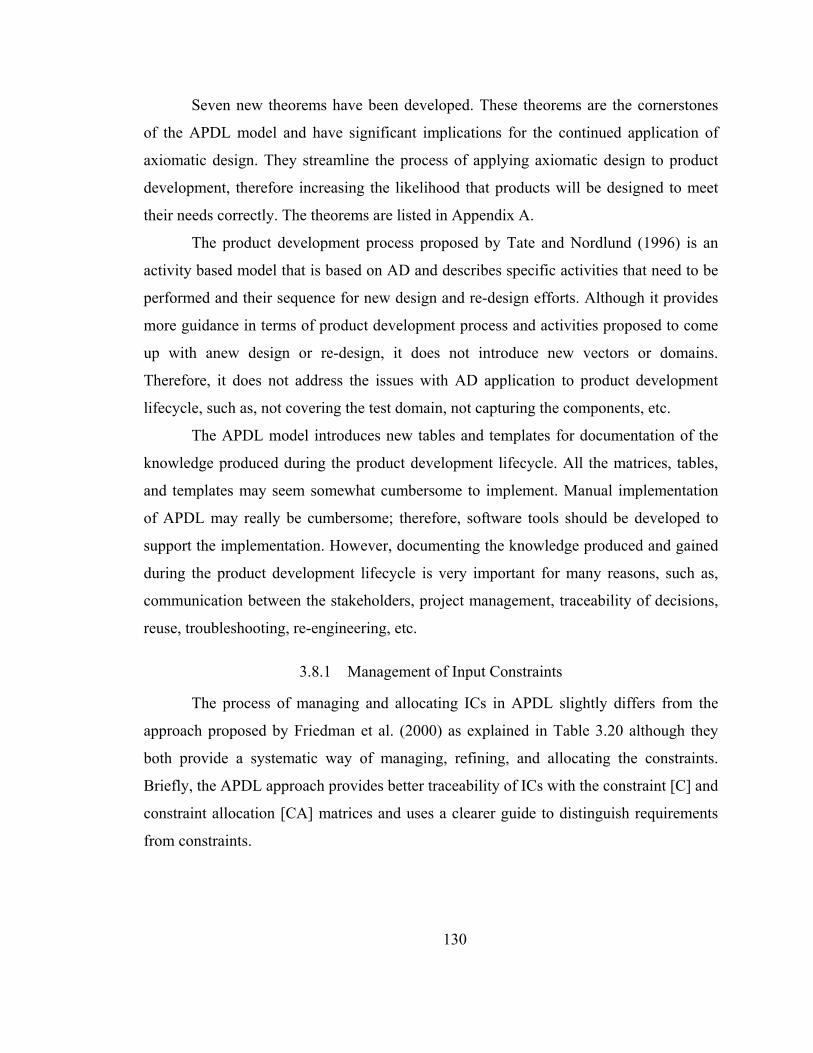
130
Seven new theorems have been developed. These theorems are the cornerstones
of the APDL model and have significant implications for the continued application of
axiomatic design. They streamline the process of applying axiomatic design to product
development, therefore increasing the likelihood that products will be designed to meet
their needs correctly. The theorems are listed in Appendix A.
The product development process proposed by Tate and Nordlund (1996) is an
activity based model that is based on AD and describes specific activities that need to be
performed and their sequence for new design and re-design efforts. Although it provides
more guidance in terms of product development process and activities proposed to come
up with anew design or re-design, it does not introduce new vectors or domains.
Therefore, it does not address the issues with AD application to product development
lifecycle, such as, not covering the test domain, not capturing the components, etc.
The APDL model introduces new tables and templates for documentation of the
knowledge produced during the product development lifecycle. All the matrices, tables,
and templates may seem somewhat cumbersome to implement. Manual implementation
of APDL may really be cumbersome; therefore, software tools should be developed to
support the implementation. However, documenting the knowledge produced and gained
during the product development lifecycle is very important for many reasons, such as,
communication between the stakeholders, project management, traceability of decisions,
reuse, troubleshooting, re-engineering, etc.
3.8.1 Management of Input Constraints
The process of managing and allocating ICs in APDL slightly differs from the
approach proposed by Friedman et al. (2000) as explained in Table 3.20 although they
both provide a systematic way of managing, refining, and allocating the constraints.
Briefly, the APDL approach provides better traceability of ICs with the constraint [C] and
constraint allocation [CA] matrices and uses a clearer guide to distinguish requirements
from constraints.
131
Table 3.20 – Comparison of Constraint Management and Allocation Approaches
Approach by Friedman et al. (2000) APDL Approach Mapping between CNs and constraints is not captured.
Constraint [C] matrix captures the mapping relationships between the CNs and the ICs. This provides better traceability and knowledge management.
Constraints are related to FRs. The ICs are allocated to the DPs and this relationship is captured in the constraint allocation [CA] matrix. Designer, implementer, and tester find out easily what the allocated ICs to the component that they are working on.
Distinguishing FRs and Constraints: • FRs are stated as verb-noun pairs • FRs are formulated so that a single DP
can be selected to satisfy that task. • FRs, by their definition, should be
solution-neutral
Distinguishing FRs and Constraints: The requirements are the desired functions that the product is expected to provide whereas the constraints are the restrictions that the product must comply while providing the desired functions.
Has three types: critical performance specifications, interface constraints, and project constraints.
Has two types: design constraints and performance constraints. Project constraints are not related to the product and should not be incorporated in to the design decomposition.
3.8.2 Introduction of System Components
The DPs are the elements of the design solution in the physical domain that are
chosen to satisfy the specified FRs. The DPs can describe conceptual design solutions,
subsystems, components, or component attributes. The DPs do not correspond to
components as exemplified by the beverage can example in Suh (2001) pg. 17. Therefore,
the DP hierarchy is not a representation of the component hierarchy for a product. In
order to systematically develop/identify components and capture and represent the
physical decomposition of the system for documentation, reuse, and analysis purposes,
the component vector and its decomposition have to be integrated into the AD
framework.
132
Some authors added the “component domain” to the AD framework to identify
the physical components that made up the product for different reasons. Trewn and Yang
(2000) replaced the process domain with the component domain in order to relate the FRs
to the components for functional reliability calculation.
Bulent et al. (2002) and Bulent and Ertas (2004) suggested adding a component
domain to the AD model for better requirement management by capturing the
requirement traceability to the system components. These two papers were results of
early research for this dissertation.
Jeziorek (2005) introduced cost units (CUs) (or physical components) for tracking
changes to the CUs in order to calculate the cost of a proposed change. He proposes that
once the decomposition process is completed, all of the physical components, or costing
units (CUs), must be identified.
Do (2004) suggested adding a product structure domain to the AD framework for
software projects. However, there are no specific guidelines on how the mapping is
performed between the DPs and the components and also the PVs are still for the DPs in
this model.
The APDL model introduces the system component vector in the physical domain
along with the DPs and captures the mapping from DPs to SCs and from SCs to PVs
throughout the decomposition and zigzagging process. Unlike the traditional AD
approach, the APDL model relates the PVs to the SCs not to the DPs since the PVs are
used to produce the SCs that provide the design solutions expressed as DPs. For example,
a DP may state the minimum strength required from an element, but an attribute type SC
defines the material to be used. The PV will use the specified material (attribute type SC)
to produce the component (component type SC) in order to provide the design solution
stated in the DP.
In addition, the mapping from DPs to SCs is not an after-the-fact type of mapping.
The SCs are identified/developed during the deign decomposition process in parallel to
the FR-DP decomposition.
133
The APDL system architecture contains the SC hierarchy in addition to the FR
and DP hierarchies. This helps communicate the component specific knowledge between
the product stakeholders.
Capturing and presenting the components and their relationships with the design
solutions and the process variables help the development team in many ways:
i) Help visualize the design solutions during the design decomposition and
zigzagging process.
ii) Analysis methods and techniques such as DSM, FMEA, and functional
reliability can be easily applied using the system architecture provided by
the application of APDL.
iii) Problems and complaints about a specific component can be traced back to
the proposed design solution and then back to the functional requirement.
iv) Requirement and design changes can be traced to the components to assess
the impact.
3.8.3 Introduction of Test Domain
Although some of the authors explained the benefits of AD for testing activities
and Do (2004) suggested adding a test case domain, the APDL model introduces the “test
domain” with two characteristic vectors: component and functional test cases. The
component test cases (CTCs) are for each and every SCs to verify them to make sure that
they satisfy the allocated requirements and constraints before they are
integrated/assembled into the next higher level SC. There are two main benefits of having
the CTS vector in the model:
1. To encourage designers to make sure that the SC is designed to meet the
allocated FRs and ICs by developing the CTCs
2. Catching defects in the design or implementation as soon as possible,
preferably before integration and causing other SCs to fail so that rework
and required modification can be performed earlier to cut down the rework
cost and reduce the lead-time.

134
The functional test cases (FTCs) are developed for each baselined FR to verify to
the customer that the agreed-upon requirements are satisfied by the product.
135
CHAPTER IV
IV CASE STUDY: DEVELOPMENT PROCESS
FOR AN AVIONICS SYSTEM
An avionics system that was designed using the waterfall product development
lifecycle model with Military Standard for Software Development and Documentation
(MIL-STD-498) and the product development lifecycle process are studied. Then, the
APDL is used to redesign a portion of the system to prove that a better system could have
been developed if the APDL model had been used. Another objective of the case study is
to further explain the APDL model and its application.
If the APDL approach were to be used instead of the ad-hoc design approach
actually used during the design and development of the system, some of the mistakes
could have been avoided. The structure that the APDL provides increases the visibility
into design process and decisions so that all the functional requirements and the input
constraints are properly satisfied by the end product.
4.1 Background
The avionics system used in this research is an onboard system that monitors
various test points throughout the aircraft [Cicek and Ertas, 2004]. The information
gathered from the test points is used to provide trending analysis of performance of the
aircraft and to aid the flight engineer with troubleshooting in-flight problems. The heart
of the system is the central data collector and analyzer. The recorded flight data is later
processed by a ground system where flight reports can be generated and displayed upon
request.
The legacy system consists of a controller as the operator-input interface, a
display unit as the primary output interface between system and the operator, a data
collector, analyzer and recorder, and a printer.
CASE STUDY: DEVELOPMENT PROCESS FOR
AN AVIONICS SYSTEM
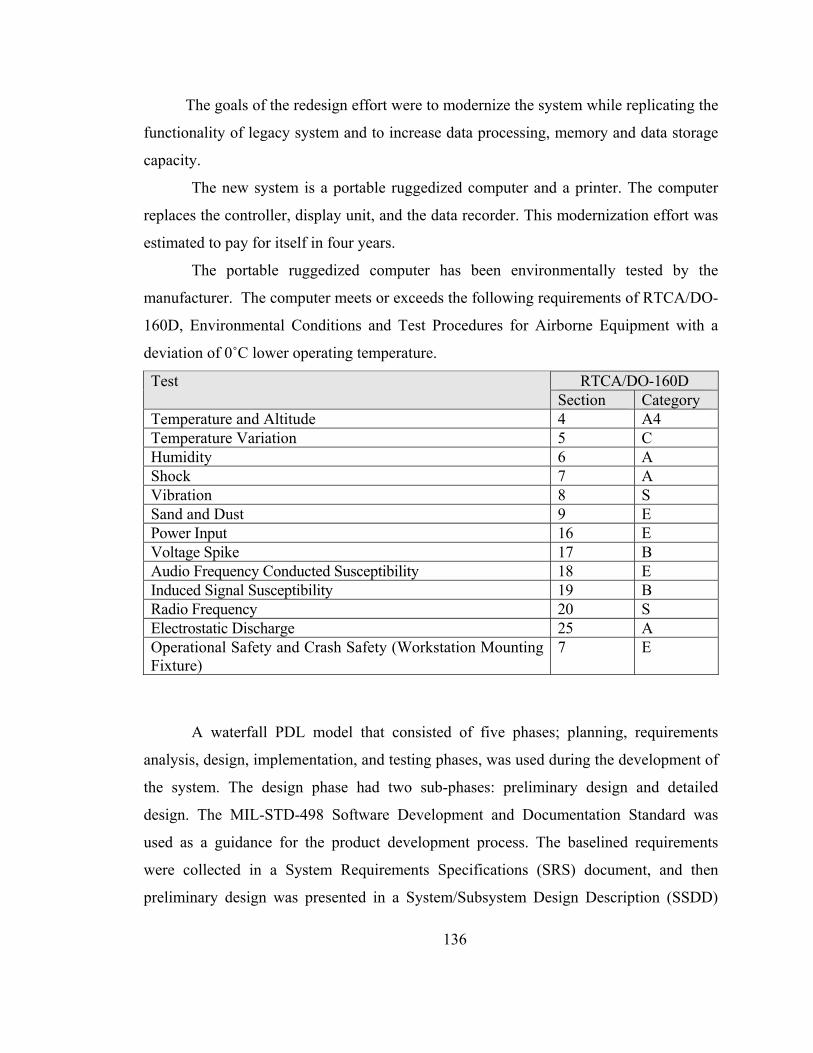
136
The goals of the redesign effort were to modernize the system while replicating the
functionality of legacy system and to increase data processing, memory and data storage
capacity.
The new system is a portable ruggedized computer and a printer. The computer
replaces the controller, display unit, and the data recorder. This modernization effort was
estimated to pay for itself in four years.
The portable ruggedized computer has been environmentally tested by the
manufacturer. The computer meets or exceeds the following requirements of RTCA/DO-
160D, Environmental Conditions and Test Procedures for Airborne Equipment with a
deviation of 0˚C lower operating temperature.
RTCA/DO-160D Test Section Category
Temperature and Altitude 4 A4 Temperature Variation 5 C Humidity 6 A Shock 7 A Vibration 8 S Sand and Dust 9 E Power Input 16 E Voltage Spike 17 B Audio Frequency Conducted Susceptibility 18 E Induced Signal Susceptibility 19 B Radio Frequency 20 S Electrostatic Discharge 25 A Operational Safety and Crash Safety (Workstation Mounting Fixture)
7 E
A waterfall PDL model that consisted of five phases; planning, requirements
analysis, design, implementation, and testing phases, was used during the development of
the system. The design phase had two sub-phases: preliminary design and detailed
design. The MIL-STD-498 Software Development and Documentation Standard was
used as a guidance for the product development process. The baselined requirements
were collected in a System Requirements Specifications (SRS) document, and then
preliminary design was presented in a System/Subsystem Design Description (SSDD)
137
document. The detailed design was explained in a System Design Description (SDD)
document. The test descriptions were documented in a System Test Description (STD)
document.
Although the effort was mostly a successful effort and saved the customer greatly
and the new system was much more affordable, more functional, and more flexible than
the legacy system, some problems were experienced during the project and the system
had some defects [Cicek and Ertas, 2004]. Most of the problems faced can be traced back
to the development model and processes used during the system development lifecycle.
The product development model used lacked the rigor and structure that is needed during
requirements analysis and design.
The requirement analysis was performed while staying in the functional domain
without zigzagging between the functional and the physical domains. Therefore, the
assumptions and decisions that were made about the physical domain during the
requirements analysis phase were not documented at all or were documented as part of
the requirement statements. There was no clear distinction between requirements and
design solutions. Ultimately this resulted in few requirements and design problems.
Some of the requirements were missed, some were misunderstood, and yet some
were not understood correctly. Also, the input constraints were not tracked properly and
at the end, the product did not meet some of the input constraints. Since the requirement
analysis and decomposition were not done properly, the design was not detailed enough.
There was no adequate requirement traceability between the requirements and the design.
The system test did not have full coverage due to the lack of traceability of the
requirements and input constraints throughout the development lifecycle.The initial effort
and cost estimates were not accurate due to defects in requirement analysis and design.
Although the laptop was tested by the manufacturer, no shock or vibration tests
were performed after the laptop was modified to satisfy some functional requirements
such as securing the laptop to the flight engineer’s desk. Also, after the units installed on
the airplanes, there were instances that the monitors did not display the programs
properly during intense vibrations. Some of the problems of the system were:
138
1) LCD screen is exposed to the vibration and shock experienced by the aircraft
due to the mounting fixture used to secure the screen.
2) User cannot access the ports to connect a mouse or USB flash memory cards
for data transfer
3) The vibration test did not comply with the applicable standard; 1 hr of
vibration test was required but the test was for only 5 minutes.
All of the problems faced during the development effort and later when the
system is deployed in the field show that the system development process did not provide
the rigor and structure to systematically analyze the requirements, develop the system
design, implement the design, and properly test the system.
4.2 Applying the APDL Approach
In this section, the APDL approach is used to partially redesign the system
explained in the previous section. Comparison is made between the APDL and the
product development approach used to prove that a higher quality product with fewer
defects could have been produced if the APDL approach had been used.
We will start with identifying the customer needs and then go through the
development process step-by-step for only a portion of the system in order to keep the
example simple but detailed enough to explain the APDL
1.1.1 Customer Needs
The very first step of the product development lifecycle is to gather the customer
needs (CNs). The CNs are obtained from the conversation with the system users and
aircraft maintainers. Later, different stakeholders are contacted to clarify the needs. Due
consideration was given to the unstated or unspoken needs too. The customer needs for
this effort are listed in Table 4.1.
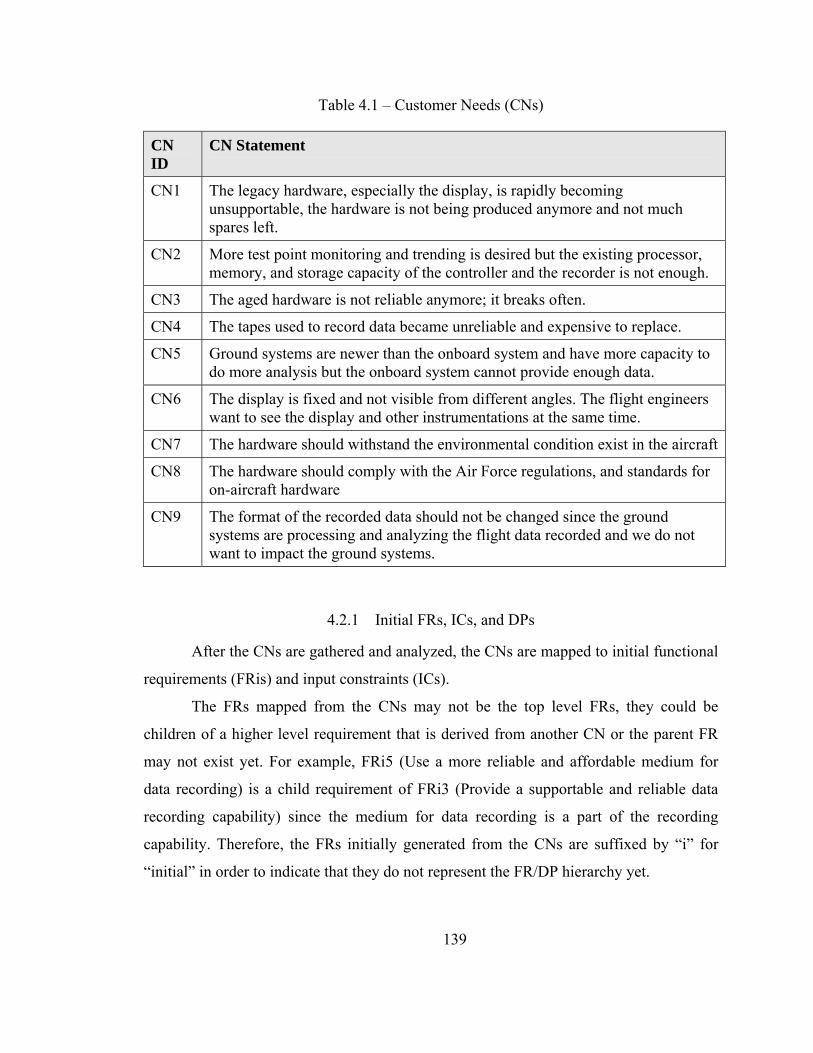
139
Table 4.1 – Customer Needs (CNs)
CN ID
CN Statement
CN1 The legacy hardware, especially the display, is rapidly becoming unsupportable, the hardware is not being produced anymore and not much spares left.
CN2 More test point monitoring and trending is desired but the existing processor, memory, and storage capacity of the controller and the recorder is not enough.
CN3 The aged hardware is not reliable anymore; it breaks often.
CN4 The tapes used to record data became unreliable and expensive to replace.
CN5 Ground systems are newer than the onboard system and have more capacity to do more analysis but the onboard system cannot provide enough data.
CN6 The display is fixed and not visible from different angles. The flight engineers want to see the display and other instrumentations at the same time.
CN7 The hardware should withstand the environmental condition exist in the aircraft
CN8 The hardware should comply with the Air Force regulations, and standards for on-aircraft hardware
CN9 The format of the recorded data should not be changed since the ground systems are processing and analyzing the flight data recorded and we do not want to impact the ground systems.
4.2.1 Initial FRs, ICs, and DPs
After the CNs are gathered and analyzed, the CNs are mapped to initial functional
requirements (FRis) and input constraints (ICs).
The FRs mapped from the CNs may not be the top level FRs, they could be
children of a higher level requirement that is derived from another CN or the parent FR
may not exist yet. For example, FRi5 (Use a more reliable and affordable medium for
data recording) is a child requirement of FRi3 (Provide a supportable and reliable data
recording capability) since the medium for data recording is a part of the recording
capability. Therefore, the FRs initially generated from the CNs are suffixed by “i” for
“initial” in order to indicate that they do not represent the FR/DP hierarchy yet.
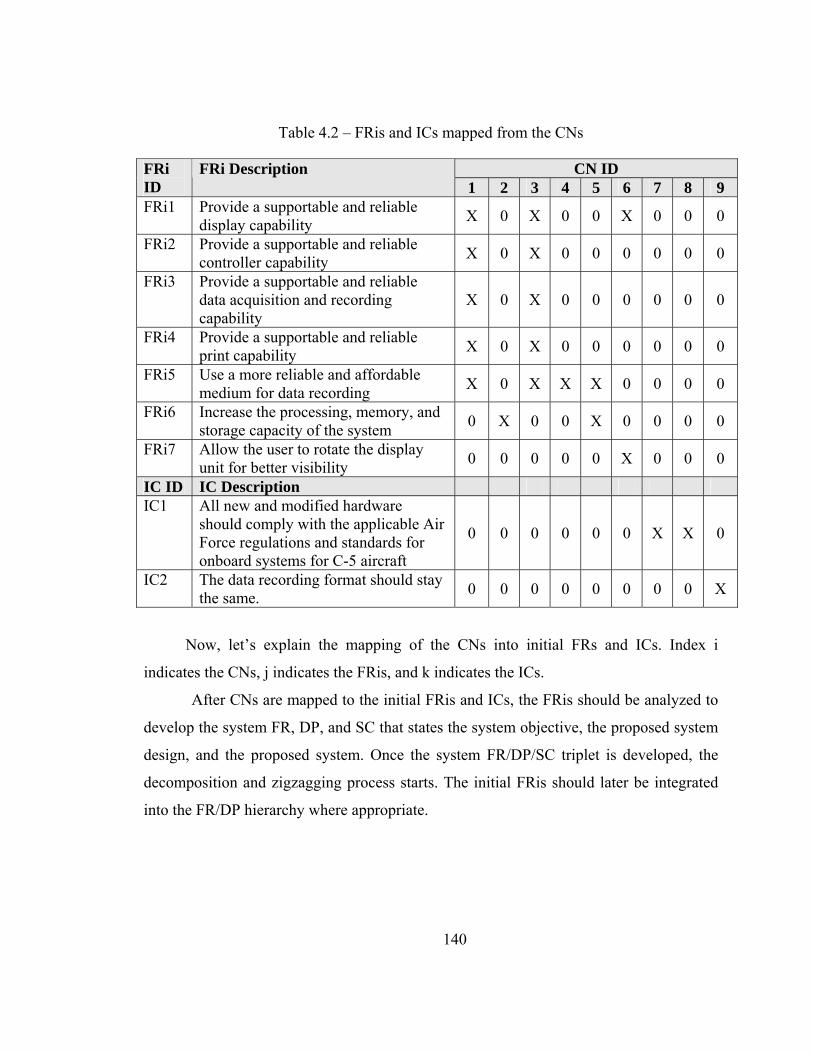
140
Table 4.2 – FRis and ICs mapped from the CNs
CN ID FRi ID
FRi Description 1 2 3 4 5 6 7 8 9
FRi1 Provide a supportable and reliable display capability X 0 X 0 0 X 0 0 0
FRi2 Provide a supportable and reliable controller capability X 0 X 0 0 0 0 0 0
FRi3 Provide a supportable and reliable data acquisition and recording capability
X 0 X 0 0 0 0 0 0
FRi4 Provide a supportable and reliable print capability X 0 X 0 0 0 0 0 0
FRi5 Use a more reliable and affordable medium for data recording X 0 X X X 0 0 0 0
FRi6 Increase the processing, memory, and storage capacity of the system 0 X 0 0 X 0 0 0 0
FRi7 Allow the user to rotate the display unit for better visibility 0 0 0 0 0 X 0 0 0
IC ID IC Description IC1 All new and modified hardware
should comply with the applicable Air Force regulations and standards for onboard systems for C-5 aircraft
0 0 0 0 0 0 X X 0
IC2 The data recording format should stay the same. 0 0 0 0 0 0 0 0 X
Now, let’s explain the mapping of the CNs into initial FRs and ICs. Index i
indicates the CNs, j indicates the FRis, and k indicates the ICs.
After CNs are mapped to the initial FRis and ICs, the FRis should be analyzed to
develop the system FR, DP, and SC that states the system objective, the proposed system
design, and the proposed system. Once the system FR/DP/SC triplet is developed, the
decomposition and zigzagging process starts. The initial FRis should later be integrated
into the FR/DP hierarchy where appropriate.
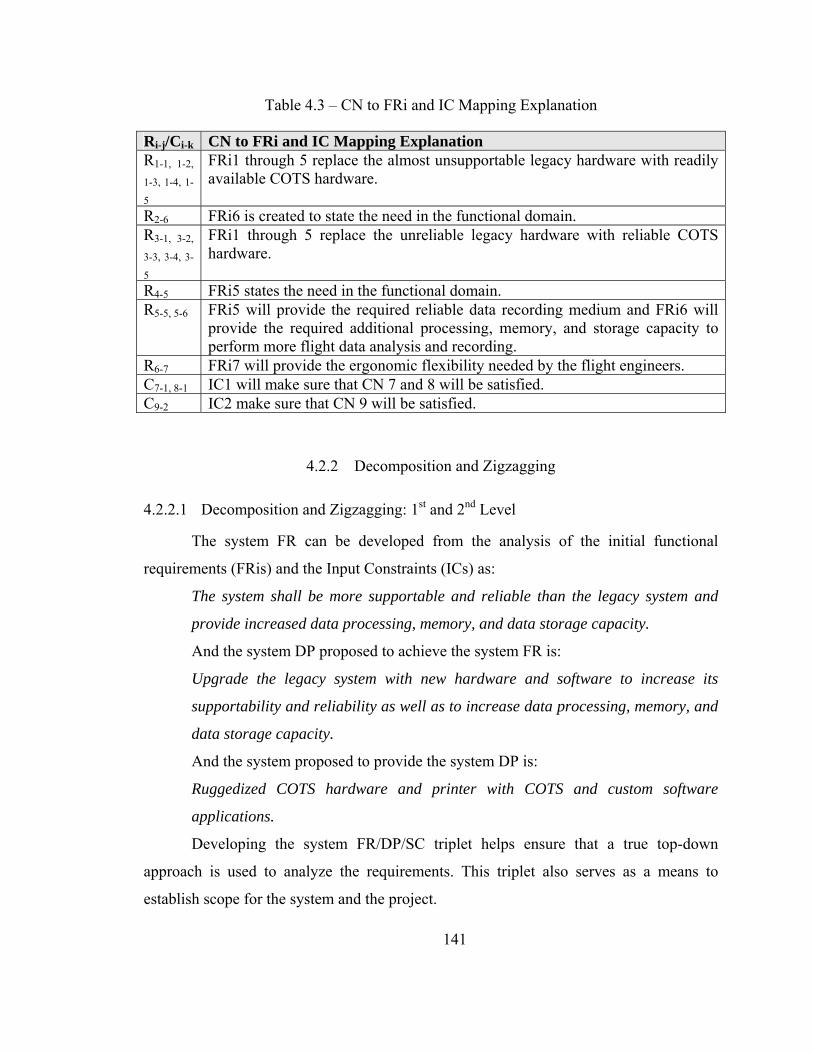
141
Table 4.3 – CN to FRi and IC Mapping Explanation
Ri-j/Ci-k CN to FRi and IC Mapping Explanation R1-1, 1-2,
1-3, 1-4, 1-
5
FRi1 through 5 replace the almost unsupportable legacy hardware with readily available COTS hardware.
R2-6 FRi6 is created to state the need in the functional domain. R3-1, 3-2,
3-3, 3-4, 3-
5
FRi1 through 5 replace the unreliable legacy hardware with reliable COTS hardware.
R4-5 FRi5 states the need in the functional domain. R5-5, 5-6 FRi5 will provide the required reliable data recording medium and FRi6 will
provide the required additional processing, memory, and storage capacity to perform more flight data analysis and recording.
R6-7 FRi7 will provide the ergonomic flexibility needed by the flight engineers. C7-1, 8-1 IC1 will make sure that CN 7 and 8 will be satisfied. C9-2 IC2 make sure that CN 9 will be satisfied.
4.2.2 Decomposition and Zigzagging
4.2.2.1 Decomposition and Zigzagging: 1st and 2nd Level
The system FR can be developed from the analysis of the initial functional
requirements (FRis) and the Input Constraints (ICs) as:
The system shall be more supportable and reliable than the legacy system and
provide increased data processing, memory, and data storage capacity.
And the system DP proposed to achieve the system FR is:
Upgrade the legacy system with new hardware and software to increase its
supportability and reliability as well as to increase data processing, memory, and
data storage capacity.
And the system proposed to provide the system DP is:
Ruggedized COTS hardware and printer with COTS and custom software
applications.
Developing the system FR/DP/SC triplet helps ensure that a true top-down
approach is used to analyze the requirements. This triplet also serves as a means to
establish scope for the system and the project.
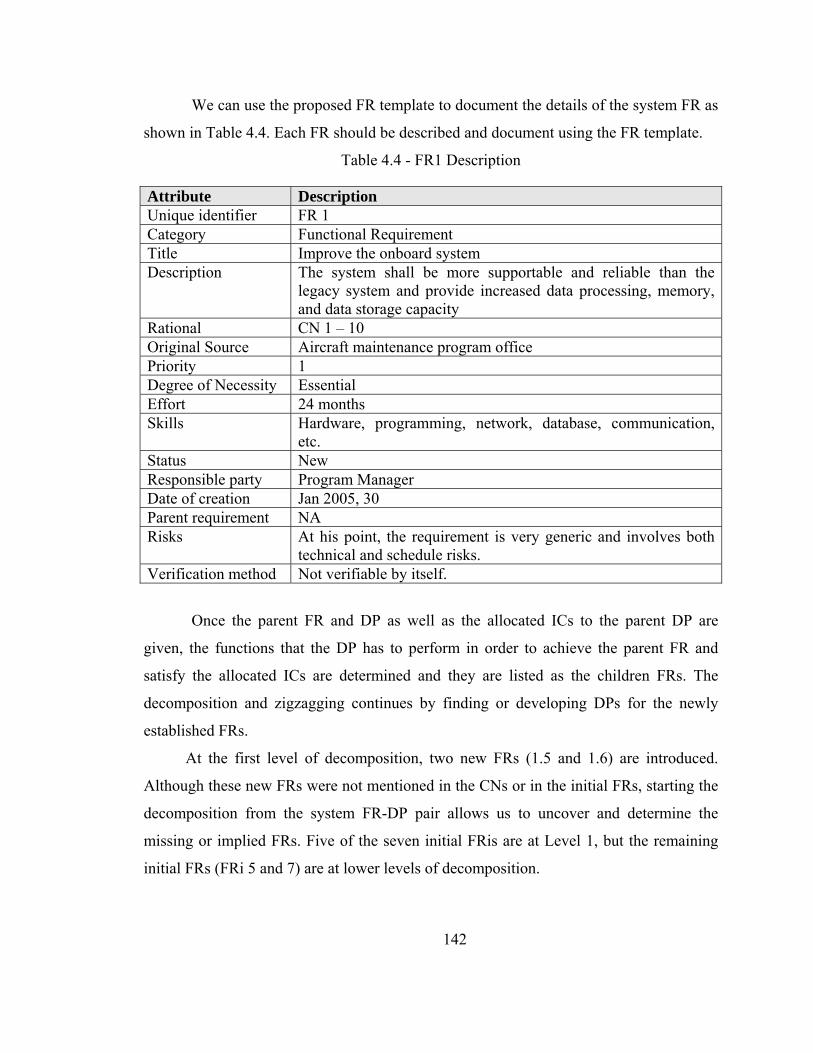
142
We can use the proposed FR template to document the details of the system FR as
shown in Table 4.4. Each FR should be described and document using the FR template.
Table 4.4 - FR1 Description
Attribute Description Unique identifier FR 1 Category Functional Requirement Title Improve the onboard system Description The system shall be more supportable and reliable than the
legacy system and provide increased data processing, memory, and data storage capacity
Rational CN 1 – 10 Original Source Aircraft maintenance program office Priority 1 Degree of Necessity Essential Effort 24 months Skills Hardware, programming, network, database, communication,
etc. Status New Responsible party Program Manager Date of creation Jan 2005, 30 Parent requirement NA Risks At his point, the requirement is very generic and involves both
technical and schedule risks. Verification method Not verifiable by itself.
Once the parent FR and DP as well as the allocated ICs to the parent DP are
given, the functions that the DP has to perform in order to achieve the parent FR and
satisfy the allocated ICs are determined and they are listed as the children FRs. The
decomposition and zigzagging continues by finding or developing DPs for the newly
established FRs.
At the first level of decomposition, two new FRs (1.5 and 1.6) are introduced.
Although these new FRs were not mentioned in the CNs or in the initial FRs, starting the
decomposition from the system FR-DP pair allows us to uncover and determine the
missing or implied FRs. Five of the seven initial FRis are at Level 1, but the remaining
initial FRs (FRi 5 and 7) are at lower levels of decomposition.
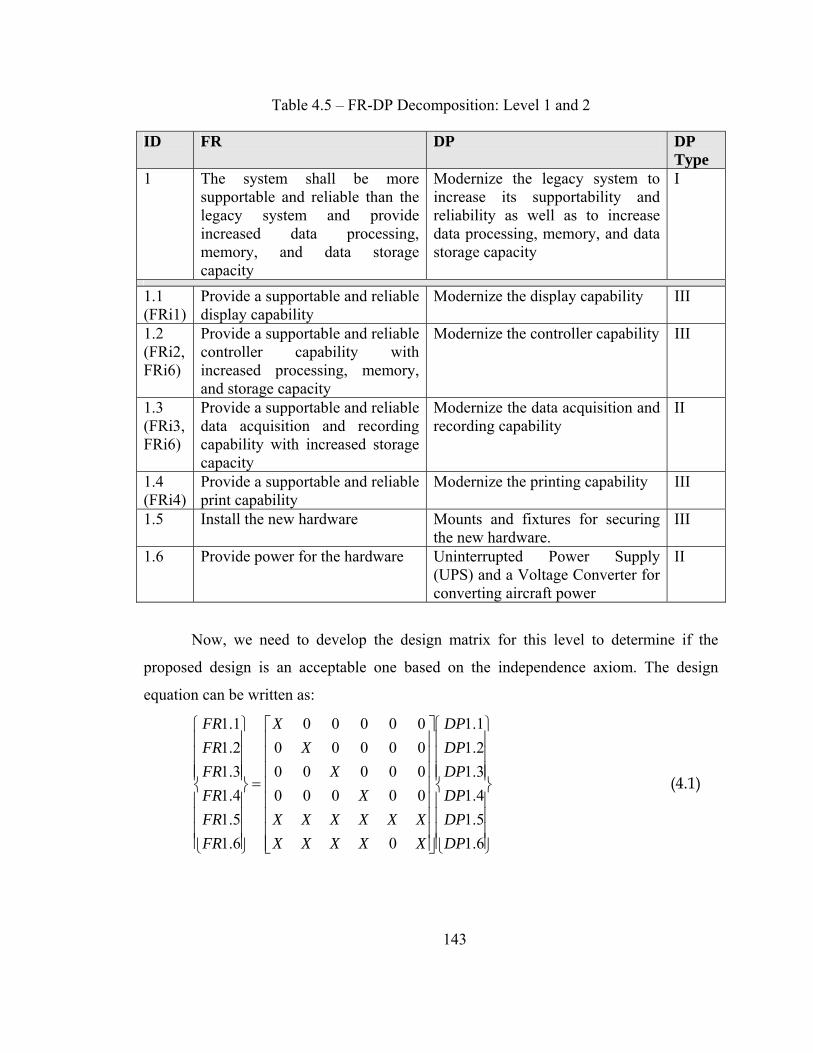
143
Table 4.5 – FR-DP Decomposition: Level 1 and 2
ID FR DP DP Type
1 The system shall be more supportable and reliable than the legacy system and provide increased data processing, memory, and data storage capacity
Modernize the legacy system to increase its supportability and reliability as well as to increase data processing, memory, and data storage capacity
I
1.1 (FRi1)
Provide a supportable and reliable display capability
Modernize the display capability III
1.2 (FRi2, FRi6)
Provide a supportable and reliable controller capability with increased processing, memory, and storage capacity
Modernize the controller capability III
1.3 (FRi3, FRi6)
Provide a supportable and reliable data acquisition and recording capability with increased storage capacity
Modernize the data acquisition and recording capability
II
1.4 (FRi4)
Provide a supportable and reliable print capability
Modernize the printing capability III
1.5 Install the new hardware Mounts and fixtures for securing the new hardware.
III
1.6 Provide power for the hardware Uninterrupted Power Supply (UPS) and a Voltage Converter for converting aircraft power
II
Now, we need to develop the design matrix for this level to determine if the
proposed design is an acceptable one based on the independence axiom. The design
equation can be written as:
⎪⎪⎪⎪
⎭
⎪⎪⎪⎪
⎬
⎫
⎪⎪⎪⎪
⎩
⎪⎪⎪⎪
⎨
⎧
⎥⎥⎥⎥⎥⎥⎥⎥
⎦
⎤
⎢⎢⎢⎢⎢⎢⎢⎢
⎣
⎡
=
⎪⎪⎪⎪
⎭
⎪⎪⎪⎪
⎬
⎫
⎪⎪⎪⎪
⎩
⎪⎪⎪⎪
⎨
⎧
6.15.14.13.12.11.1
0
00000000000000000000
6.15.14.13.12.11.1
DPDPDPDPDPDP
XXXXXXXXXXX
XX
XX
FRFRFRFRFRFR
(4.1)
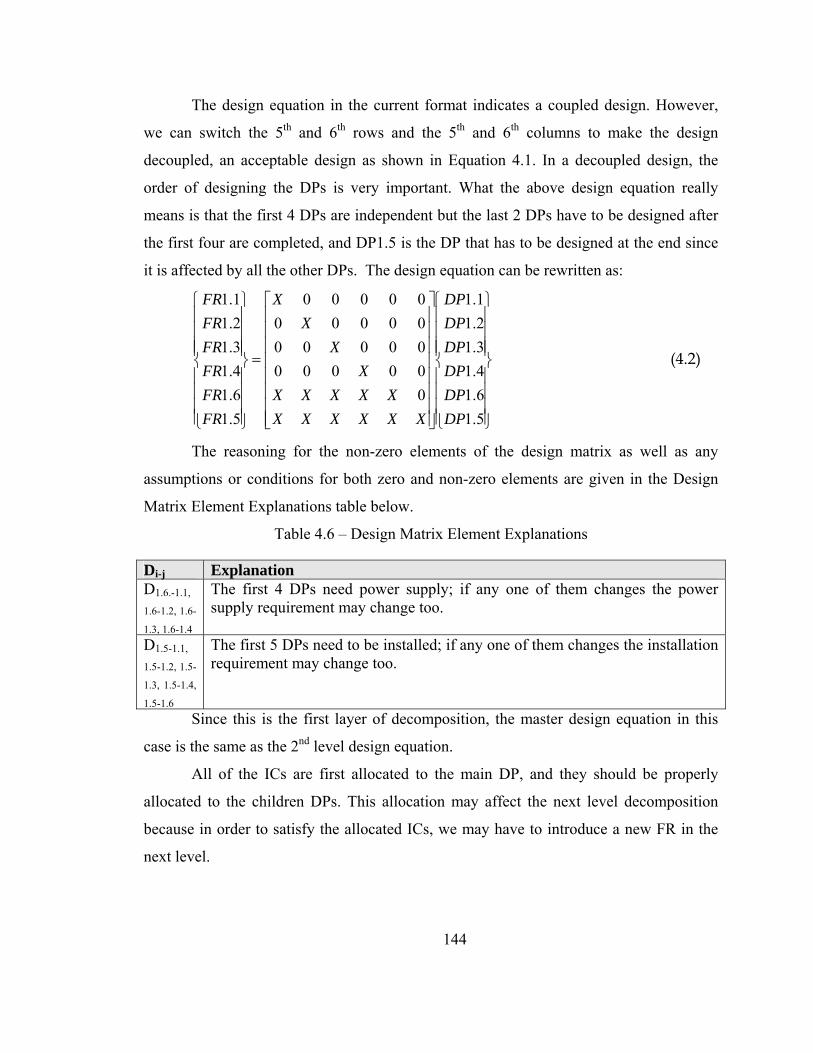
144
The design equation in the current format indicates a coupled design. However,
we can switch the 5th and 6th rows and the 5th and 6th columns to make the design
decoupled, an acceptable design as shown in Equation 4.1. In a decoupled design, the
order of designing the DPs is very important. What the above design equation really
means is that the first 4 DPs are independent but the last 2 DPs have to be designed after
the first four are completed, and DP1.5 is the DP that has to be designed at the end since
it is affected by all the other DPs. The design equation can be rewritten as:
⎪⎪⎪⎪
⎭
⎪⎪⎪⎪
⎬
⎫
⎪⎪⎪⎪
⎩
⎪⎪⎪⎪
⎨
⎧
⎥⎥⎥⎥⎥⎥⎥⎥
⎦
⎤
⎢⎢⎢⎢⎢⎢⎢⎢
⎣
⎡
=
⎪⎪⎪⎪
⎭
⎪⎪⎪⎪
⎬
⎫
⎪⎪⎪⎪
⎩
⎪⎪⎪⎪
⎨
⎧
5.16.14.13.12.11.1
000000000000000000000
5.16.14.13.12.11.1
DPDPDPDPDPDP
XXXXXXXXXXX
XX
XX
FRFRFRFRFRFR
(4.2)
The reasoning for the non-zero elements of the design matrix as well as any
assumptions or conditions for both zero and non-zero elements are given in the Design
Matrix Element Explanations table below.
Table 4.6 – Design Matrix Element Explanations
Di-j Explanation D1.6.-1.1,
1.6-1.2, 1.6-
1.3, 1.6-1.4
The first 4 DPs need power supply; if any one of them changes the power supply requirement may change too.
D1.5-1.1,
1.5-1.2, 1.5-
1.3, 1.5-1.4,
1.5-1.6
The first 5 DPs need to be installed; if any one of them changes the installation requirement may change too.
Since this is the first layer of decomposition, the master design equation in this
case is the same as the 2nd level design equation.
All of the ICs are first allocated to the main DP, and they should be properly
allocated to the children DPs. This allocation may affect the next level decomposition
because in order to satisfy the allocated ICs, we may have to introduce a new FR in the
next level.
145
First of all, IC1 is very vague and we need to understand what it really means to
be able to allocate this IC. The airborne equipments, such as the one that we are re-
designing, should comply with the RTCA/DO-160D standard. The RTCA/DO-160D
standard defines a series of minimum standard environmental test conditions and
applicable test procedures for airborne equipment. The purpose of these tests is to
determine the performance characteristics of airborne equipment in environmental
conditions representative of those which may be encountered in airborne operation of the
equipment.
The RTCA/DO-160D is published by RTCA, Inc., a global organization
comprised of industry and government representatives, develops standards to assure the
safety and reliability of all Airborne Electronics (Avionics). Manufacturers of aircraft
electronic equipment selling their products in the United States, Europe, and around the
globe must meet RTCA requirements, including RTCA/DO-160D.
The conditions applicable to our proposed solution (DP1.1 to DP1.6) are:
• IC1.1: The system shall meet or exceed the temperature and altitude
requirements of RTCA/DO-160D, Section 4, Category A4 equipment for
the operating temperature range 0°C to +50°C, and the non-operating
temperature range -40°C to +70°C.
• IC1.2: The system shall meet or exceed the temperature variation
requirements of RTCA/DO-160D, Section 5, Category C equipment for
the operating temperature range 0°C to +50°C, and the none-operating
temperature range -40°C to +70°C.
• IC1.3: The system shall meet or exceed the humidity requirements of
RTCA/DO-160D, Section 6, for Category A equipment.
• IC1.4: The system shall meet or exceed the operational shock
requirements of RTCA/DO-160D, Section 7, for Category A equipment.
o The operational shock test verifies that the equipment will continue
to function within performance standards after exposure to shocks
experienced during normal aircraft operations. These shocks may
146
occur during taxiing, landing, or when aircraft encounters sudden
gusts in flight. This requirement applies to all equipment installed
on fixed-wing aircraft and helicopters [RTCA, 97].
• IC1.5: The system shall meet or exceed the vibration requirements of
RTCA/DO-160D, Section 8, for Category S equipment.
o The vibration tests demonstrate that the equipment complies with
the applicable equipment performance standards when subject to
vibration levels specified for the appropriate category. This
requirement applies to equipment installed on a fixed-wing,
turbojet, turbofan, and propfan aircraft and helicopters [RTCA,
97].
• IC1.6: All system shall meet or exceed the sand and dust requirements of
RTCA/DO-160D, Section 12, for Category D equipment.
• IC1.7: The system shall meet or exceed the power input requirements of
RTCA/DO-160D, Section 16, for Category E equipment.
• IC1.8: The system shall meet or exceed the voltage spike requirements of
RTCA/DO-160D, Section 17, for Category B equipment.
• IC1.9: The system shall meet or exceed the audio frequency conducted
susceptibility requirements of RTCA/DO-160D, Section 18, for Category
E equipment.
• IC1.10: The system shall meet or exceed the induced signal susceptibility
requirements of RTCA/DO-160D, Section 19, for Category B equipment.
• IC1.11: The system shall meet or exceed the radio frequency requirements
of RTCA/DO-160D, Section 20, for Category S equipment.
• IC1.12: The system shall meet or exceed the Electrostatic Discharge
(ESD) requirements of RTCA/DO-160D, Section 25, for Category A
equipment.
• IC1.13: All hardware shall meet or exceed the crash safety shock
requirements of RTCA/DO-160D, Section 7, Category C equipment using
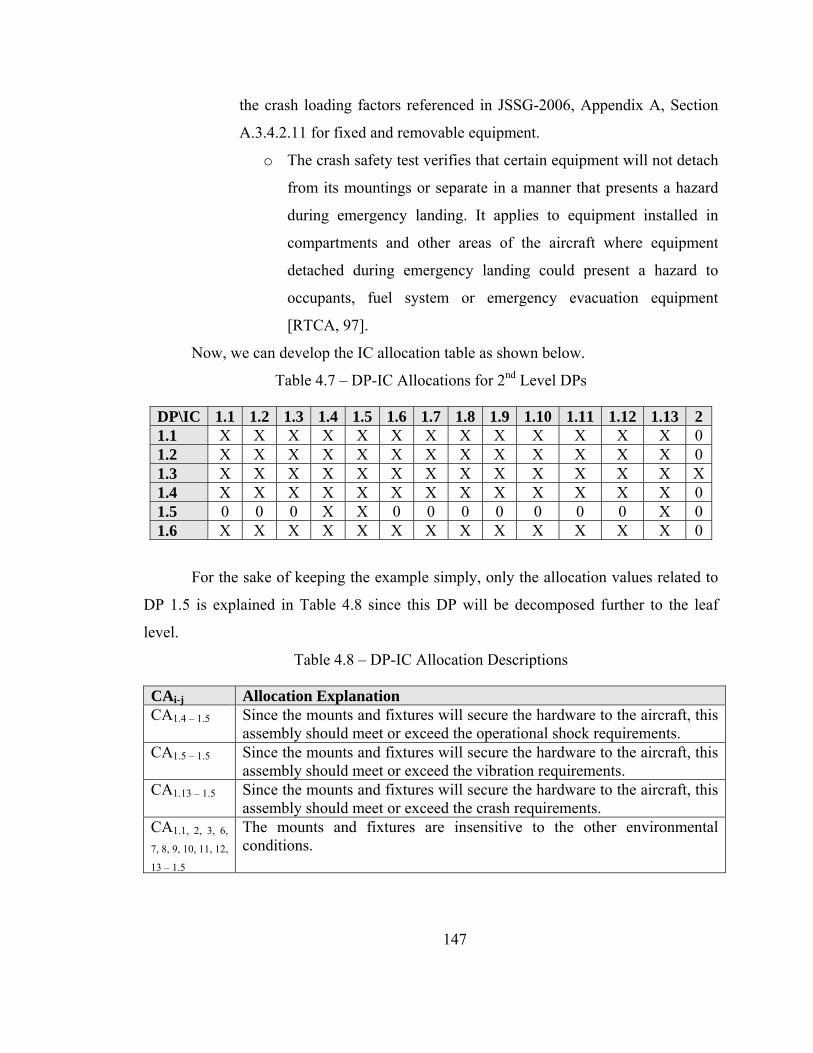
147
the crash loading factors referenced in JSSG-2006, Appendix A, Section
A.3.4.2.11 for fixed and removable equipment.
o The crash safety test verifies that certain equipment will not detach
from its mountings or separate in a manner that presents a hazard
during emergency landing. It applies to equipment installed in
compartments and other areas of the aircraft where equipment
detached during emergency landing could present a hazard to
occupants, fuel system or emergency evacuation equipment
[RTCA, 97].
Now, we can develop the IC allocation table as shown below.
Table 4.7 – DP-IC Allocations for 2nd Level DPs
DP\IC 1.1 1.2 1.3 1.4 1.5 1.6 1.7 1.8 1.9 1.10 1.11 1.12 1.13 2 1.1 X X X X X X X X X X X X X 0 1.2 X X X X X X X X X X X X X 0 1.3 X X X X X X X X X X X X X X1.4 X X X X X X X X X X X X X 0 1.5 0 0 0 X X 0 0 0 0 0 0 0 X 0 1.6 X X X X X X X X X X X X X 0
For the sake of keeping the example simply, only the allocation values related to
DP 1.5 is explained in Table 4.8 since this DP will be decomposed further to the leaf
level.
Table 4.8 – DP-IC Allocation Descriptions
CAi-j Allocation Explanation CA1.4 – 1.5 Since the mounts and fixtures will secure the hardware to the aircraft, this
assembly should meet or exceed the operational shock requirements. CA1.5 – 1.5 Since the mounts and fixtures will secure the hardware to the aircraft, this
assembly should meet or exceed the vibration requirements. CA1.13 – 1.5 Since the mounts and fixtures will secure the hardware to the aircraft, this
assembly should meet or exceed the crash requirements. CA1.1, 2, 3, 6,
7, 8, 9, 10, 11, 12,
13 – 1.5
The mounts and fixtures are insensitive to the other environmental conditions.
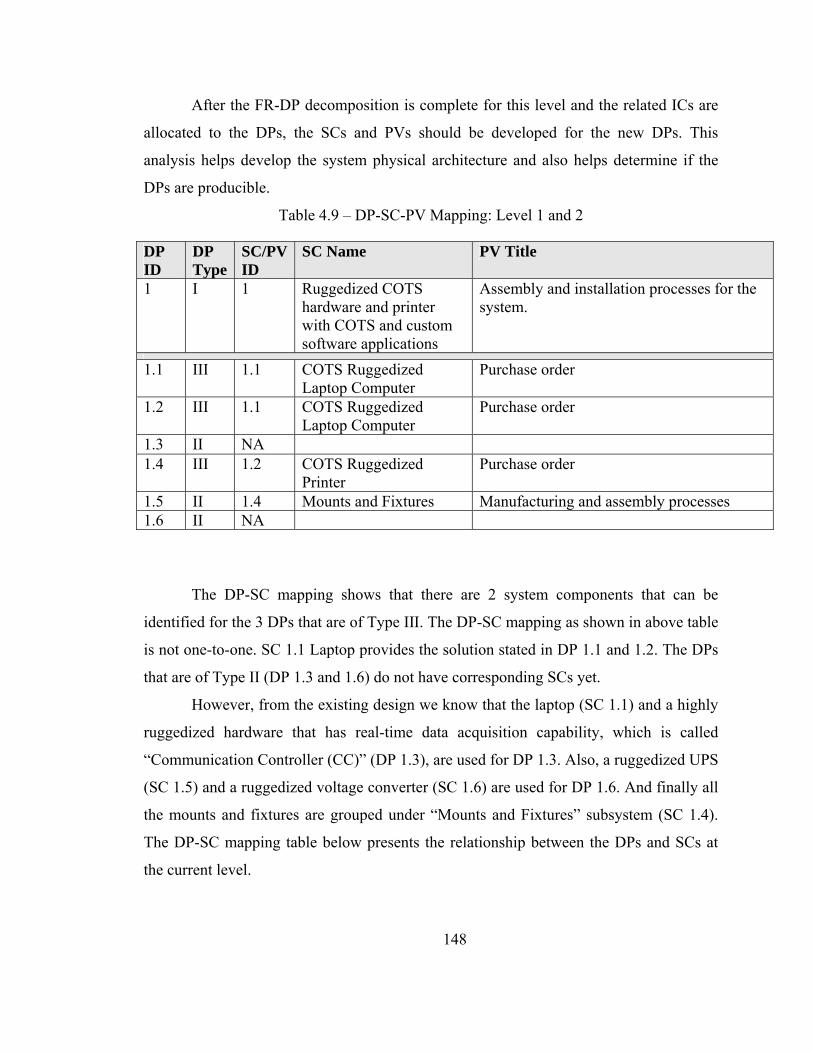
148
After the FR-DP decomposition is complete for this level and the related ICs are
allocated to the DPs, the SCs and PVs should be developed for the new DPs. This
analysis helps develop the system physical architecture and also helps determine if the
DPs are producible.
Table 4.9 – DP-SC-PV Mapping: Level 1 and 2
DP ID
DP Type
SC/PV ID
SC Name PV Title
1 I 1 Ruggedized COTS hardware and printer with COTS and custom software applications
Assembly and installation processes for the system.
1.1 III 1.1 COTS Ruggedized Laptop Computer
Purchase order
1.2 III 1.1 COTS Ruggedized Laptop Computer
Purchase order
1.3 II NA 1.4 III 1.2 COTS Ruggedized
Printer Purchase order
1.5 II 1.4 Mounts and Fixtures Manufacturing and assembly processes 1.6 II NA
The DP-SC mapping shows that there are 2 system components that can be
identified for the 3 DPs that are of Type III. The DP-SC mapping as shown in above table
is not one-to-one. SC 1.1 Laptop provides the solution stated in DP 1.1 and 1.2. The DPs
that are of Type II (DP 1.3 and 1.6) do not have corresponding SCs yet.
However, from the existing design we know that the laptop (SC 1.1) and a highly
ruggedized hardware that has real-time data acquisition capability, which is called
“Communication Controller (CC)” (DP 1.3), are used for DP 1.3. Also, a ruggedized UPS
(SC 1.5) and a ruggedized voltage converter (SC 1.6) are used for DP 1.6. And finally all
the mounts and fixtures are grouped under “Mounts and Fixtures” subsystem (SC 1.4).
The DP-SC mapping table below presents the relationship between the DPs and SCs at
the current level.
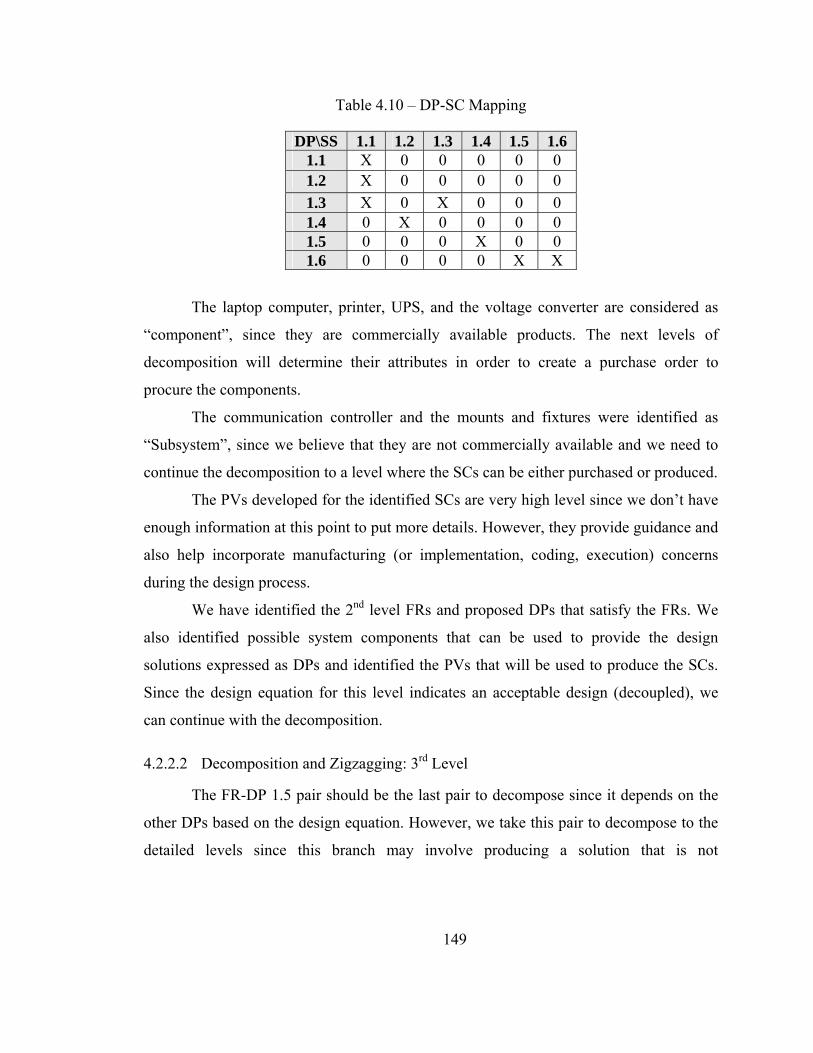
149
Table 4.10 – DP-SC Mapping
DP\SS 1.1 1.2 1.3 1.4 1.5 1.6 1.1 X 0 0 0 0 0 1.2 X 0 0 0 0 0 1.3 X 0 X 0 0 0 1.4 0 X 0 0 0 0 1.5 0 0 0 X 0 0 1.6 0 0 0 0 X X
The laptop computer, printer, UPS, and the voltage converter are considered as
“component”, since they are commercially available products. The next levels of
decomposition will determine their attributes in order to create a purchase order to
procure the components.
The communication controller and the mounts and fixtures were identified as
“Subsystem”, since we believe that they are not commercially available and we need to
continue the decomposition to a level where the SCs can be either purchased or produced.
The PVs developed for the identified SCs are very high level since we don’t have
enough information at this point to put more details. However, they provide guidance and
also help incorporate manufacturing (or implementation, coding, execution) concerns
during the design process.
We have identified the 2nd level FRs and proposed DPs that satisfy the FRs. We
also identified possible system components that can be used to provide the design
solutions expressed as DPs and identified the PVs that will be used to produce the SCs.
Since the design equation for this level indicates an acceptable design (decoupled), we
can continue with the decomposition.
4.2.2.2 Decomposition and Zigzagging: 3rd Level
The FR-DP 1.5 pair should be the last pair to decompose since it depends on the
other DPs based on the design equation. However, we take this pair to decompose to the
detailed levels since this branch may involve producing a solution that is not
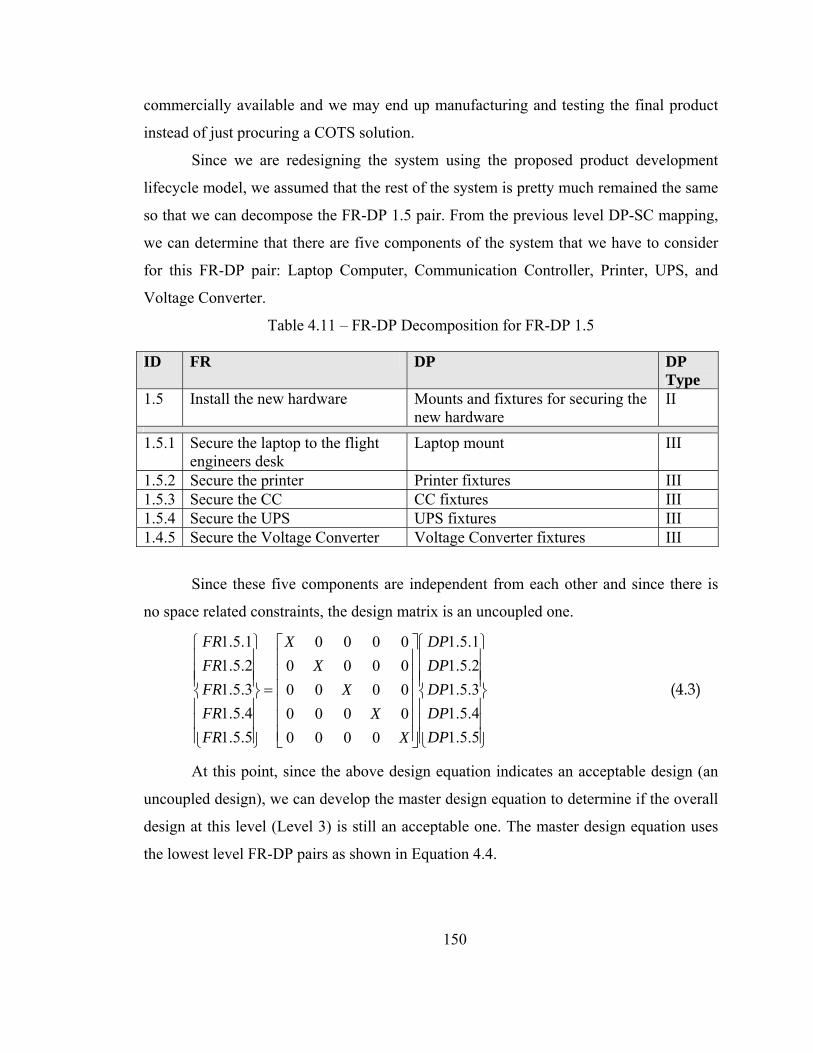
150
commercially available and we may end up manufacturing and testing the final product
instead of just procuring a COTS solution.
Since we are redesigning the system using the proposed product development
lifecycle model, we assumed that the rest of the system is pretty much remained the same
so that we can decompose the FR-DP 1.5 pair. From the previous level DP-SC mapping,
we can determine that there are five components of the system that we have to consider
for this FR-DP pair: Laptop Computer, Communication Controller, Printer, UPS, and
Voltage Converter.
Table 4.11 – FR-DP Decomposition for FR-DP 1.5
ID FR DP DP Type
1.5 Install the new hardware Mounts and fixtures for securing the new hardware
II
1.5.1 Secure the laptop to the flight engineers desk
Laptop mount III
1.5.2 Secure the printer Printer fixtures III 1.5.3 Secure the CC CC fixtures III 1.5.4 Secure the UPS UPS fixtures III 1.4.5 Secure the Voltage Converter Voltage Converter fixtures III
Since these five components are independent from each other and since there is
no space related constraints, the design matrix is an uncoupled one.
⎪⎪⎪
⎭
⎪⎪⎪
⎬
⎫
⎪⎪⎪
⎩
⎪⎪⎪
⎨
⎧
⎥⎥⎥⎥⎥⎥
⎦
⎤
⎢⎢⎢⎢⎢⎢
⎣
⎡
=
⎪⎪⎪
⎭
⎪⎪⎪
⎬
⎫
⎪⎪⎪
⎩
⎪⎪⎪
⎨
⎧
5.5.14.5.13.5.12.5.11.5.1
00000000000000000000
5.5.14.5.13.5.12.5.11.5.1
DPDPDPDPDP
XX
XX
X
FRFRFRFRFR
(4.3)
At this point, since the above design equation indicates an acceptable design (an
uncoupled design), we can develop the master design equation to determine if the overall
design at this level (Level 3) is still an acceptable one. The master design equation uses
the lowest level FR-DP pairs as shown in Equation 4.4.
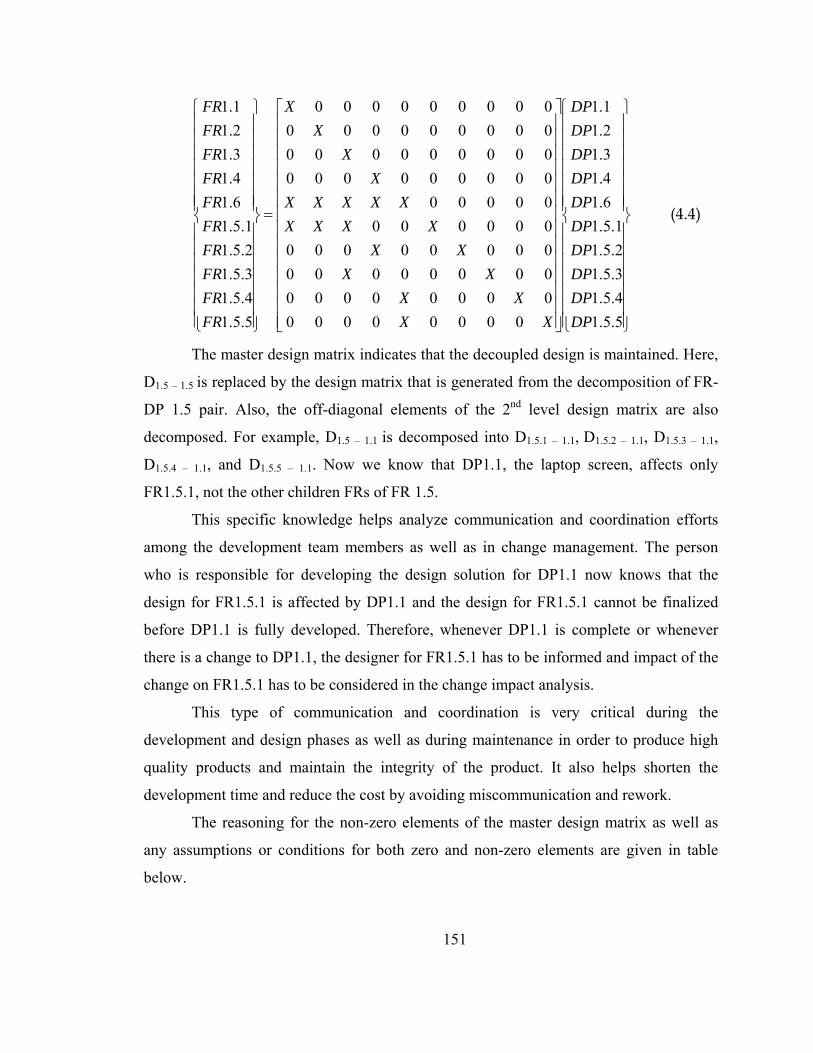
151
⎪⎪⎪⎪⎪⎪⎪
⎭
⎪⎪⎪⎪⎪⎪⎪
⎬
⎫
⎪⎪⎪⎪⎪⎪⎪
⎩
⎪⎪⎪⎪⎪⎪⎪
⎨
⎧
⎥⎥⎥⎥⎥⎥⎥⎥⎥⎥⎥⎥⎥⎥
⎦
⎤
⎢⎢⎢⎢⎢⎢⎢⎢⎢⎢⎢⎢⎢⎢
⎣
⎡
=
⎪⎪⎪⎪⎪⎪⎪
⎭
⎪⎪⎪⎪⎪⎪⎪
⎬
⎫
⎪⎪⎪⎪⎪⎪⎪
⎩
⎪⎪⎪⎪⎪⎪⎪
⎨
⎧
5.5.14.5.13.5.12.5.11.5.1
6.14.13.12.11.1
0000000000000000000000000000000000000000000000000000000000000000000000000000000
5.5.14.5.13.5.12.5.11.5.1
6.14.13.12.11.1
DPDPDPDPDPDPDPDPDPDP
XXXX
XXXX
XXXXXXXXX
XX
XX
FRFRFRFRFRFRFRFRFRFR
(4.4)
The master design matrix indicates that the decoupled design is maintained. Here,
D1.5 – 1.5 is replaced by the design matrix that is generated from the decomposition of FR-
DP 1.5 pair. Also, the off-diagonal elements of the 2nd level design matrix are also
decomposed. For example, D1.5 – 1.1 is decomposed into D1.5.1 – 1.1, D1.5.2 – 1.1, D1.5.3 – 1.1,
D1.5.4 – 1.1, and D1.5.5 – 1.1. Now we know that DP1.1, the laptop screen, affects only
FR1.5.1, not the other children FRs of FR 1.5.
This specific knowledge helps analyze communication and coordination efforts
among the development team members as well as in change management. The person
who is responsible for developing the design solution for DP1.1 now knows that the
design for FR1.5.1 is affected by DP1.1 and the design for FR1.5.1 cannot be finalized
before DP1.1 is fully developed. Therefore, whenever DP1.1 is complete or whenever
there is a change to DP1.1, the designer for FR1.5.1 has to be informed and impact of the
change on FR1.5.1 has to be considered in the change impact analysis.
This type of communication and coordination is very critical during the
development and design phases as well as during maintenance in order to produce high
quality products and maintain the integrity of the product. It also helps shorten the
development time and reduce the cost by avoiding miscommunication and rework.
The reasoning for the non-zero elements of the master design matrix as well as
any assumptions or conditions for both zero and non-zero elements are given in table
below.
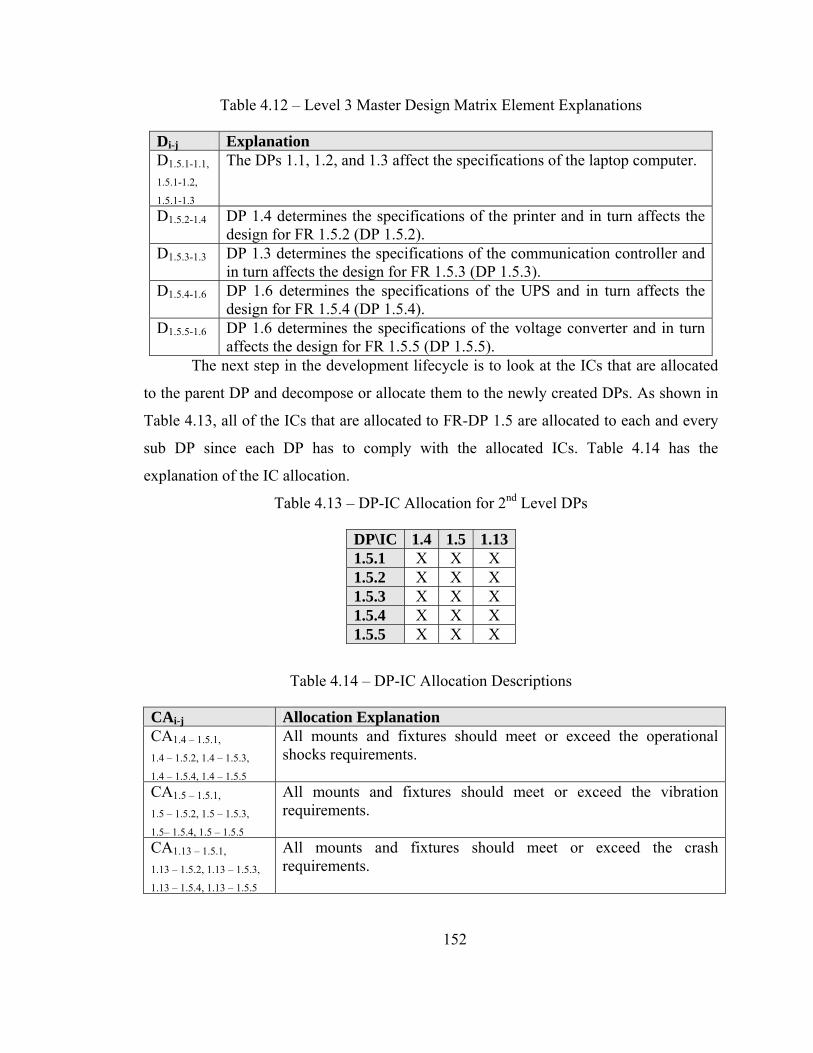
152
Table 4.12 – Level 3 Master Design Matrix Element Explanations
Di-j Explanation D1.5.1-1.1,
1.5.1-1.2,
1.5.1-1.3
The DPs 1.1, 1.2, and 1.3 affect the specifications of the laptop computer.
D1.5.2-1.4 DP 1.4 determines the specifications of the printer and in turn affects the design for FR 1.5.2 (DP 1.5.2).
D1.5.3-1.3 DP 1.3 determines the specifications of the communication controller and in turn affects the design for FR 1.5.3 (DP 1.5.3).
D1.5.4-1.6 DP 1.6 determines the specifications of the UPS and in turn affects the design for FR 1.5.4 (DP 1.5.4).
D1.5.5-1.6 DP 1.6 determines the specifications of the voltage converter and in turn affects the design for FR 1.5.5 (DP 1.5.5).
The next step in the development lifecycle is to look at the ICs that are allocated
to the parent DP and decompose or allocate them to the newly created DPs. As shown in
Table 4.13, all of the ICs that are allocated to FR-DP 1.5 are allocated to each and every
sub DP since each DP has to comply with the allocated ICs. Table 4.14 has the
explanation of the IC allocation.
Table 4.13 – DP-IC Allocation for 2nd Level DPs
DP\IC 1.4 1.5 1.131.5.1 X X X 1.5.2 X X X 1.5.3 X X X 1.5.4 X X X 1.5.5 X X X
Table 4.14 – DP-IC Allocation Descriptions
CAi-j Allocation Explanation CA1.4 – 1.5.1,
1.4 – 1.5.2, 1.4 – 1.5.3,
1.4 – 1.5.4, 1.4 – 1.5.5
All mounts and fixtures should meet or exceed the operational shocks requirements.
CA1.5 – 1.5.1,
1.5 – 1.5.2, 1.5 – 1.5.3,
1.5– 1.5.4, 1.5 – 1.5.5
All mounts and fixtures should meet or exceed the vibration requirements.
CA1.13 – 1.5.1,
1.13 – 1.5.2, 1.13 – 1.5.3,
1.13 – 1.5.4, 1.13 – 1.5.5
All mounts and fixtures should meet or exceed the crash requirements.
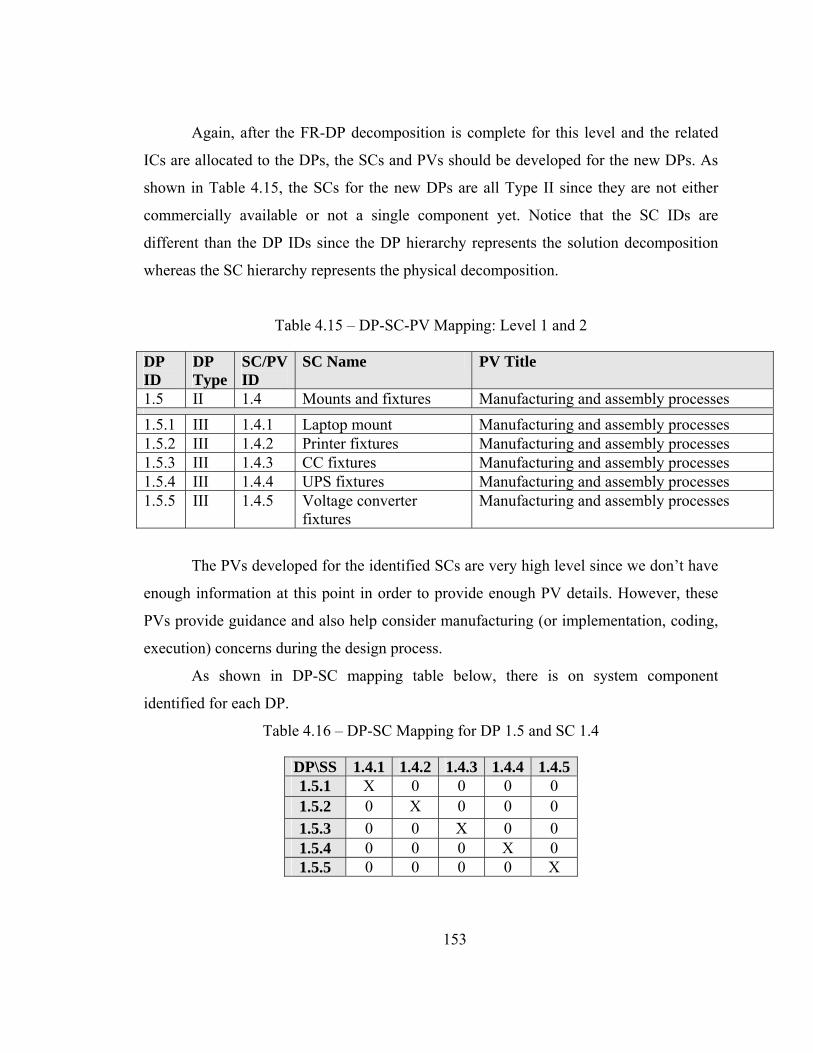
153
Again, after the FR-DP decomposition is complete for this level and the related
ICs are allocated to the DPs, the SCs and PVs should be developed for the new DPs. As
shown in Table 4.15, the SCs for the new DPs are all Type II since they are not either
commercially available or not a single component yet. Notice that the SC IDs are
different than the DP IDs since the DP hierarchy represents the solution decomposition
whereas the SC hierarchy represents the physical decomposition.
Table 4.15 – DP-SC-PV Mapping: Level 1 and 2
DP ID
DP Type
SC/PV ID
SC Name PV Title
1.5 II 1.4 Mounts and fixtures Manufacturing and assembly processes
1.5.1 III 1.4.1 Laptop mount Manufacturing and assembly processes 1.5.2 III 1.4.2 Printer fixtures Manufacturing and assembly processes 1.5.3 III 1.4.3 CC fixtures Manufacturing and assembly processes 1.5.4 III 1.4.4 UPS fixtures Manufacturing and assembly processes 1.5.5 III 1.4.5 Voltage converter
fixtures Manufacturing and assembly processes
The PVs developed for the identified SCs are very high level since we don’t have
enough information at this point in order to provide enough PV details. However, these
PVs provide guidance and also help consider manufacturing (or implementation, coding,
execution) concerns during the design process.
As shown in DP-SC mapping table below, there is on system component
identified for each DP.
Table 4.16 – DP-SC Mapping for DP 1.5 and SC 1.4
DP\SS 1.4.1 1.4.2 1.4.3 1.4.4 1.4.51.5.1 X 0 0 0 0 1.5.2 0 X 0 0 0 1.5.3 0 0 X 0 0 1.5.4 0 0 0 X 0 1.5.5 0 0 0 0 X
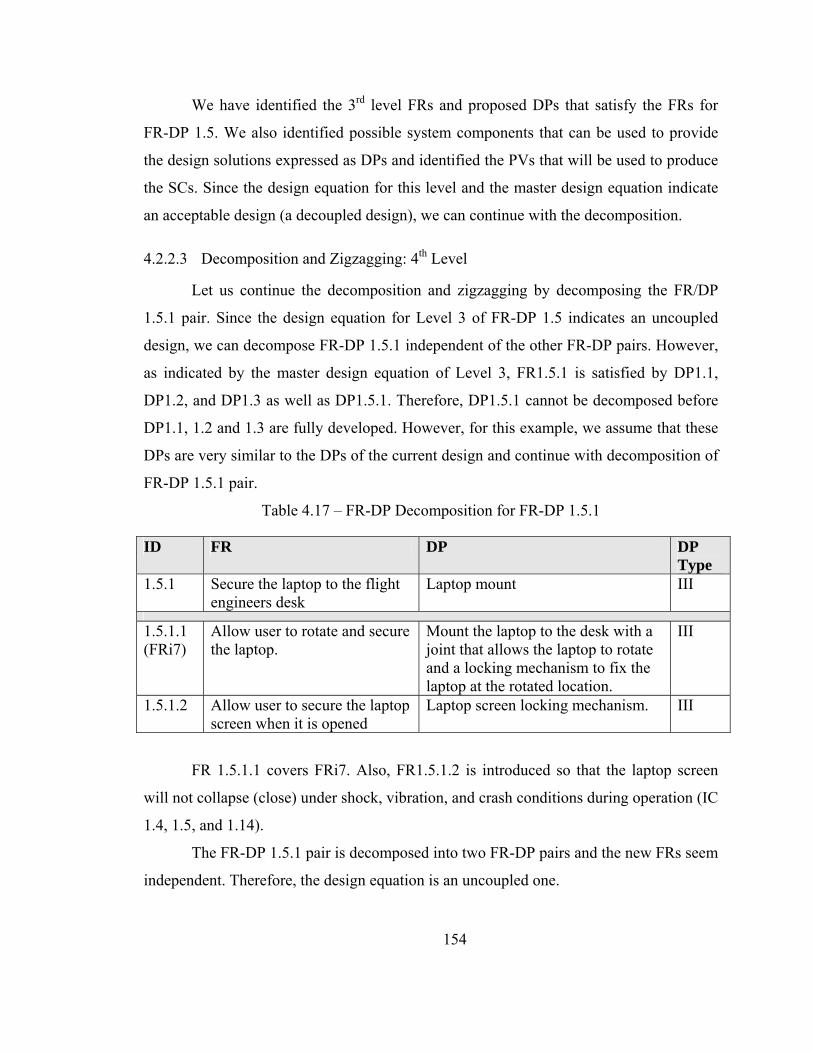
154
We have identified the 3rd level FRs and proposed DPs that satisfy the FRs for
FR-DP 1.5. We also identified possible system components that can be used to provide
the design solutions expressed as DPs and identified the PVs that will be used to produce
the SCs. Since the design equation for this level and the master design equation indicate
an acceptable design (a decoupled design), we can continue with the decomposition.
4.2.2.3 Decomposition and Zigzagging: 4th Level
Let us continue the decomposition and zigzagging by decomposing the FR/DP
1.5.1 pair. Since the design equation for Level 3 of FR-DP 1.5 indicates an uncoupled
design, we can decompose FR-DP 1.5.1 independent of the other FR-DP pairs. However,
as indicated by the master design equation of Level 3, FR1.5.1 is satisfied by DP1.1,
DP1.2, and DP1.3 as well as DP1.5.1. Therefore, DP1.5.1 cannot be decomposed before
DP1.1, 1.2 and 1.3 are fully developed. However, for this example, we assume that these
DPs are very similar to the DPs of the current design and continue with decomposition of
FR-DP 1.5.1 pair.
Table 4.17 – FR-DP Decomposition for FR-DP 1.5.1
ID FR DP DP Type
1.5.1 Secure the laptop to the flight engineers desk
Laptop mount III
1.5.1.1 (FRi7)
Allow user to rotate and secure the laptop.
Mount the laptop to the desk with a joint that allows the laptop to rotate and a locking mechanism to fix the laptop at the rotated location.
III
1.5.1.2 Allow user to secure the laptop screen when it is opened
Laptop screen locking mechanism. III
FR 1.5.1.1 covers FRi7. Also, FR1.5.1.2 is introduced so that the laptop screen
will not collapse (close) under shock, vibration, and crash conditions during operation (IC
1.4, 1.5, and 1.14).
The FR-DP 1.5.1 pair is decomposed into two FR-DP pairs and the new FRs seem
independent. Therefore, the design equation is an uncoupled one.
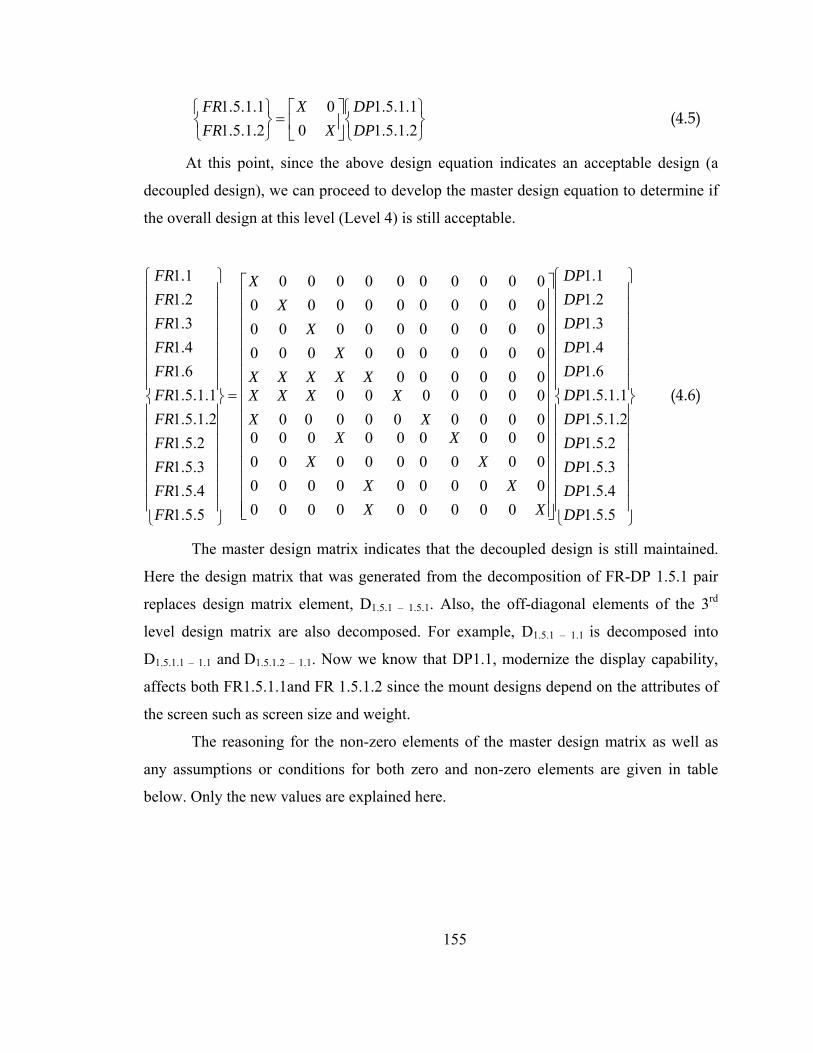
155
⎭⎬⎫
⎩⎨⎧⎥⎦
⎤⎢⎣
⎡=
⎭⎬⎫
⎩⎨⎧
2.1.5.11.1.5.1
00
2.1.5.11.1.5.1
DPDP
XX
FRFR
(4.5)
At this point, since the above design equation indicates an acceptable design (a
decoupled design), we can proceed to develop the master design equation to determine if
the overall design at this level (Level 4) is still acceptable.
⎪⎪⎪⎪⎪⎪⎪
⎭
⎪⎪⎪⎪⎪⎪⎪
⎬
⎫
⎪⎪⎪⎪⎪⎪⎪
⎩
⎪⎪⎪⎪⎪⎪⎪
⎨
⎧
⎥⎥⎥⎥⎥⎥⎥⎥⎥⎥⎥⎥⎥⎥⎥
⎦
⎤
⎢⎢⎢⎢⎢⎢⎢⎢⎢⎢⎢⎢⎢⎢⎢
⎣
⎡
=
⎪⎪⎪⎪⎪⎪⎪
⎭
⎪⎪⎪⎪⎪⎪⎪
⎬
⎫
⎪⎪⎪⎪⎪⎪⎪
⎩
⎪⎪⎪⎪⎪⎪⎪
⎨
⎧
5.5.14.5.13.5.12.5.1
2.1.5.11.1.5.1
6.14.13.12.11.1
00000000000000000000000000000000000000
00
00
00
00
00
00
00
0000000000000000000000000000000000000000000000
5.5.14.5.13.5.12.5.1
2.1.5.11.1.5.1
6.14.13.12.11.1
DPDPDPDPDPDPDPDPDPDPDP
XXXX
XXXX
XXXX
XX
XXXXXX
XX
X
FRFRFRFRFRFRFRFRFRFRFR
(4.6)
The master design matrix indicates that the decoupled design is still maintained.
Here the design matrix that was generated from the decomposition of FR-DP 1.5.1 pair
replaces design matrix element, D1.5.1 – 1.5.1. Also, the off-diagonal elements of the 3rd
level design matrix are also decomposed. For example, D1.5.1 – 1.1 is decomposed into
D1.5.1.1 – 1.1 and D1.5.1.2 – 1.1. Now we know that DP1.1, modernize the display capability,
affects both FR1.5.1.1and FR 1.5.1.2 since the mount designs depend on the attributes of
the screen such as screen size and weight.
The reasoning for the non-zero elements of the master design matrix as well as
any assumptions or conditions for both zero and non-zero elements are given in table
below. Only the new values are explained here.
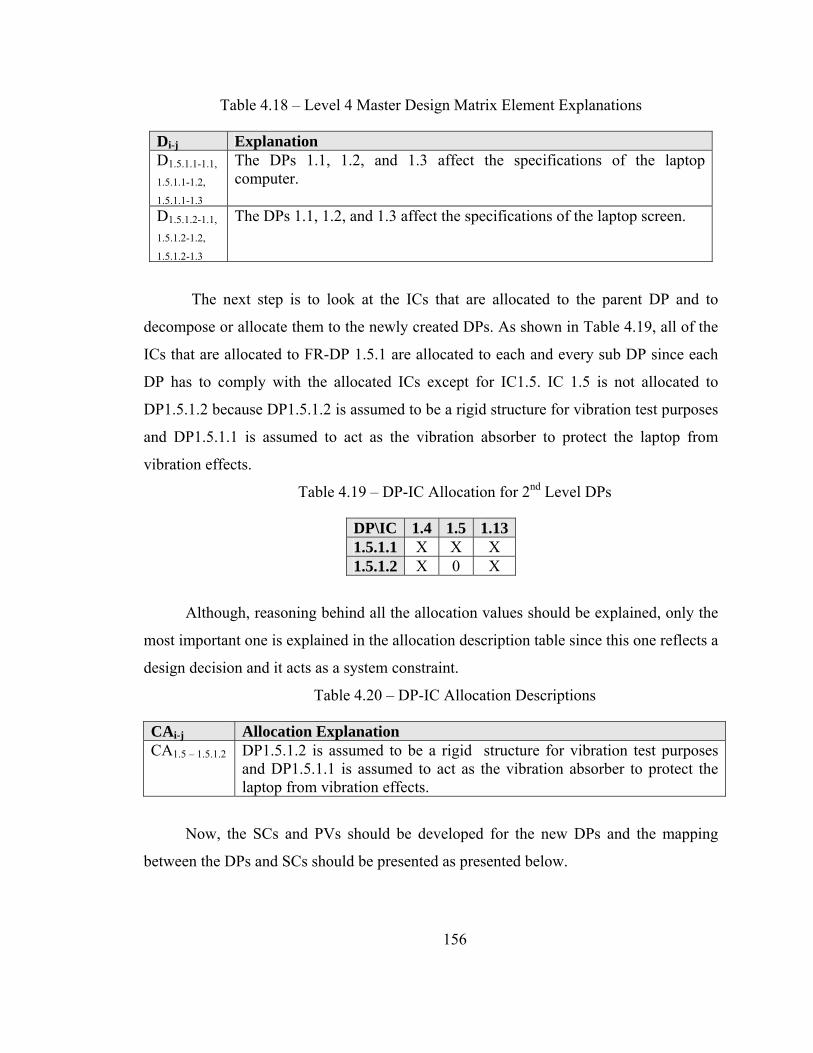
156
Table 4.18 – Level 4 Master Design Matrix Element Explanations
Di-j Explanation D1.5.1.1-1.1,
1.5.1.1-1.2,
1.5.1.1-1.3
The DPs 1.1, 1.2, and 1.3 affect the specifications of the laptop computer.
D1.5.1.2-1.1,
1.5.1.2-1.2,
1.5.1.2-1.3
The DPs 1.1, 1.2, and 1.3 affect the specifications of the laptop screen.
The next step is to look at the ICs that are allocated to the parent DP and to
decompose or allocate them to the newly created DPs. As shown in Table 4.19, all of the
ICs that are allocated to FR-DP 1.5.1 are allocated to each and every sub DP since each
DP has to comply with the allocated ICs except for IC1.5. IC 1.5 is not allocated to
DP1.5.1.2 because DP1.5.1.2 is assumed to be a rigid structure for vibration test purposes
and DP1.5.1.1 is assumed to act as the vibration absorber to protect the laptop from
vibration effects.
Table 4.19 – DP-IC Allocation for 2nd Level DPs
DP\IC 1.4 1.5 1.131.5.1.1 X X X 1.5.1.2 X 0 X
Although, reasoning behind all the allocation values should be explained, only the
most important one is explained in the allocation description table since this one reflects a
design decision and it acts as a system constraint.
Table 4.20 – DP-IC Allocation Descriptions
CAi-j Allocation Explanation CA1.5 – 1.5.1.2 DP1.5.1.2 is assumed to be a rigid structure for vibration test purposes
and DP1.5.1.1 is assumed to act as the vibration absorber to protect the laptop from vibration effects.
Now, the SCs and PVs should be developed for the new DPs and the mapping
between the DPs and SCs should be presented as presented below.
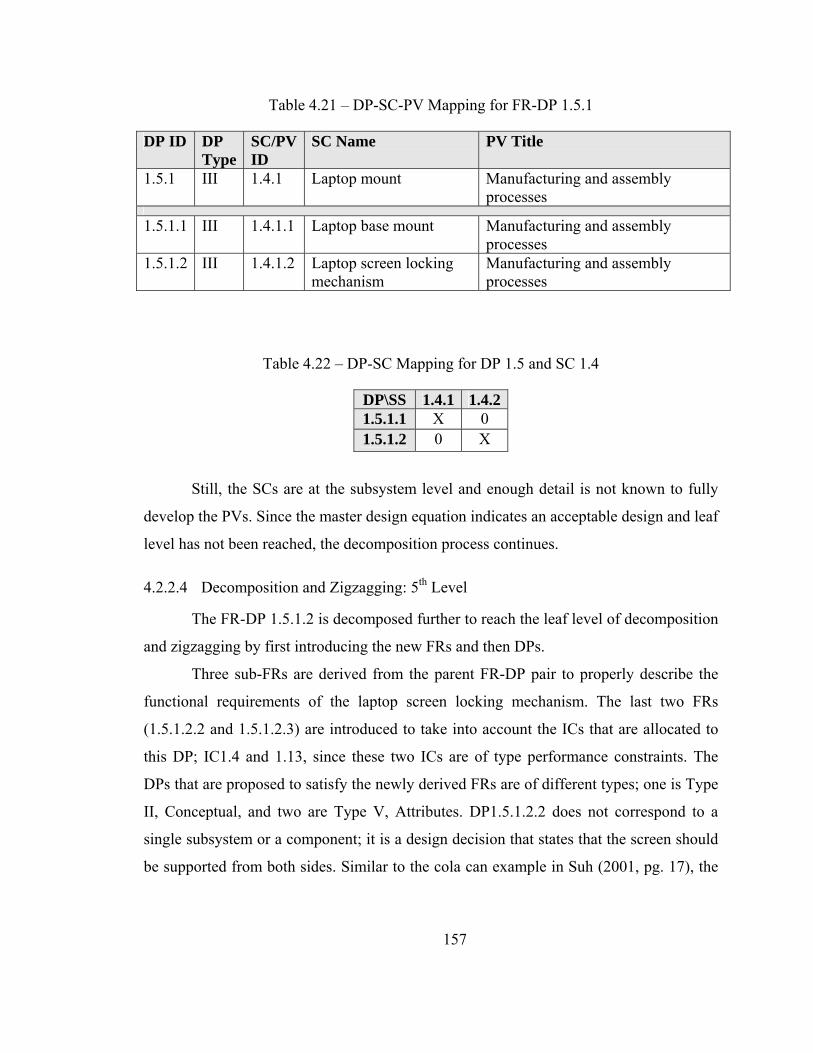
157
Table 4.21 – DP-SC-PV Mapping for FR-DP 1.5.1
DP ID DP Type
SC/PV ID
SC Name PV Title
1.5.1 III 1.4.1 Laptop mount Manufacturing and assembly processes
1.5.1.1 III 1.4.1.1 Laptop base mount Manufacturing and assembly processes
1.5.1.2 III 1.4.1.2 Laptop screen locking mechanism
Manufacturing and assembly processes
Table 4.22 – DP-SC Mapping for DP 1.5 and SC 1.4
DP\SS 1.4.1 1.4.21.5.1.1 X 0 1.5.1.2 0 X
Still, the SCs are at the subsystem level and enough detail is not known to fully
develop the PVs. Since the master design equation indicates an acceptable design and leaf
level has not been reached, the decomposition process continues.
4.2.2.4 Decomposition and Zigzagging: 5th Level
The FR-DP 1.5.1.2 is decomposed further to reach the leaf level of decomposition
and zigzagging by first introducing the new FRs and then DPs.
Three sub-FRs are derived from the parent FR-DP pair to properly describe the
functional requirements of the laptop screen locking mechanism. The last two FRs
(1.5.1.2.2 and 1.5.1.2.3) are introduced to take into account the ICs that are allocated to
this DP; IC1.4 and 1.13, since these two ICs are of type performance constraints. The
DPs that are proposed to satisfy the newly derived FRs are of different types; one is Type
II, Conceptual, and two are Type V, Attributes. DP1.5.1.2.2 does not correspond to a
single subsystem or a component; it is a design decision that states that the screen should
be supported from both sides. Similar to the cola can example in Suh (2001, pg. 17), the
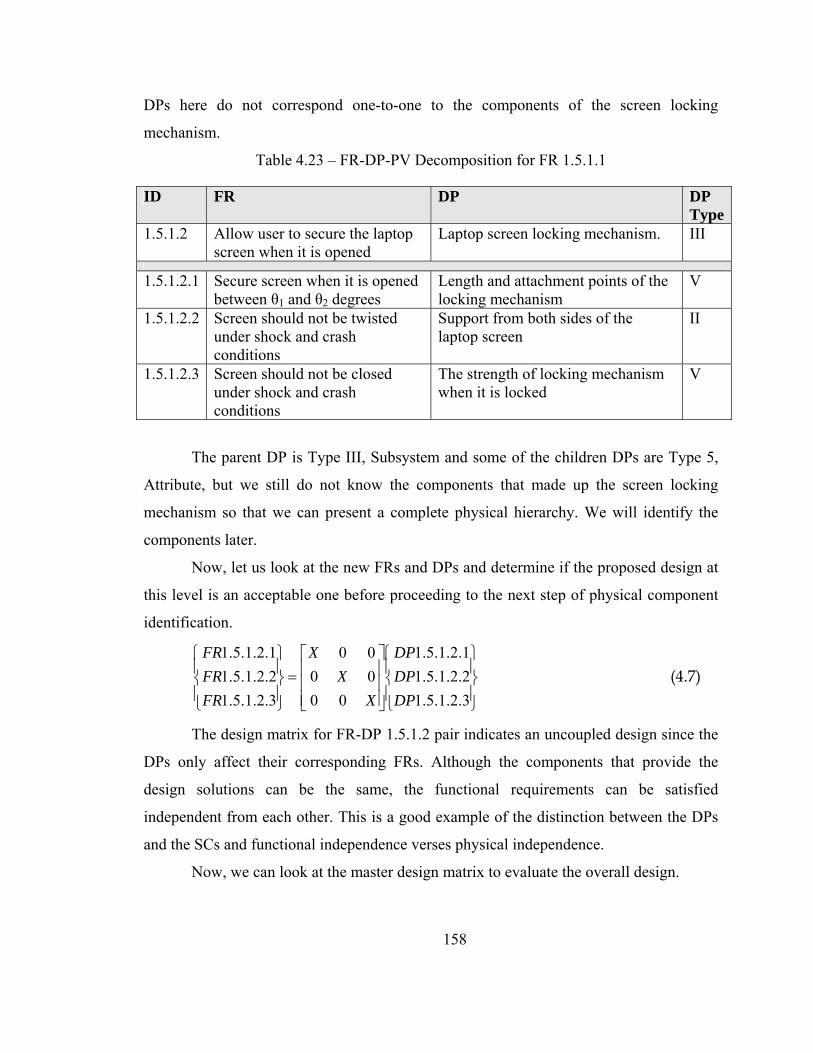
158
DPs here do not correspond one-to-one to the components of the screen locking
mechanism.
Table 4.23 – FR-DP-PV Decomposition for FR 1.5.1.1
ID FR DP DP Type
1.5.1.2 Allow user to secure the laptop screen when it is opened
Laptop screen locking mechanism. III
1.5.1.2.1 Secure screen when it is opened between θ1 and θ2 degrees
Length and attachment points of the locking mechanism
V
1.5.1.2.2 Screen should not be twisted under shock and crash conditions
Support from both sides of the laptop screen
II
1.5.1.2.3 Screen should not be closed under shock and crash conditions
The strength of locking mechanism when it is locked
V
The parent DP is Type III, Subsystem and some of the children DPs are Type 5,
Attribute, but we still do not know the components that made up the screen locking
mechanism so that we can present a complete physical hierarchy. We will identify the
components later.
Now, let us look at the new FRs and DPs and determine if the proposed design at
this level is an acceptable one before proceeding to the next step of physical component
identification.
⎪⎭
⎪⎬
⎫
⎪⎩
⎪⎨
⎧
⎥⎥⎥
⎦
⎤
⎢⎢⎢
⎣
⎡=
⎪⎭
⎪⎬
⎫
⎪⎩
⎪⎨
⎧
3.2.1.5.12.2.1.5.11.2.1.5.1
000000
3.2.1.5.12.2.1.5.11.2.1.5.1
DPDPDP
XX
X
FRFRFR
(4.7)
The design matrix for FR-DP 1.5.1.2 pair indicates an uncoupled design since the
DPs only affect their corresponding FRs. Although the components that provide the
design solutions can be the same, the functional requirements can be satisfied
independent from each other. This is a good example of the distinction between the DPs
and the SCs and functional independence verses physical independence.
Now, we can look at the master design matrix to evaluate the overall design.
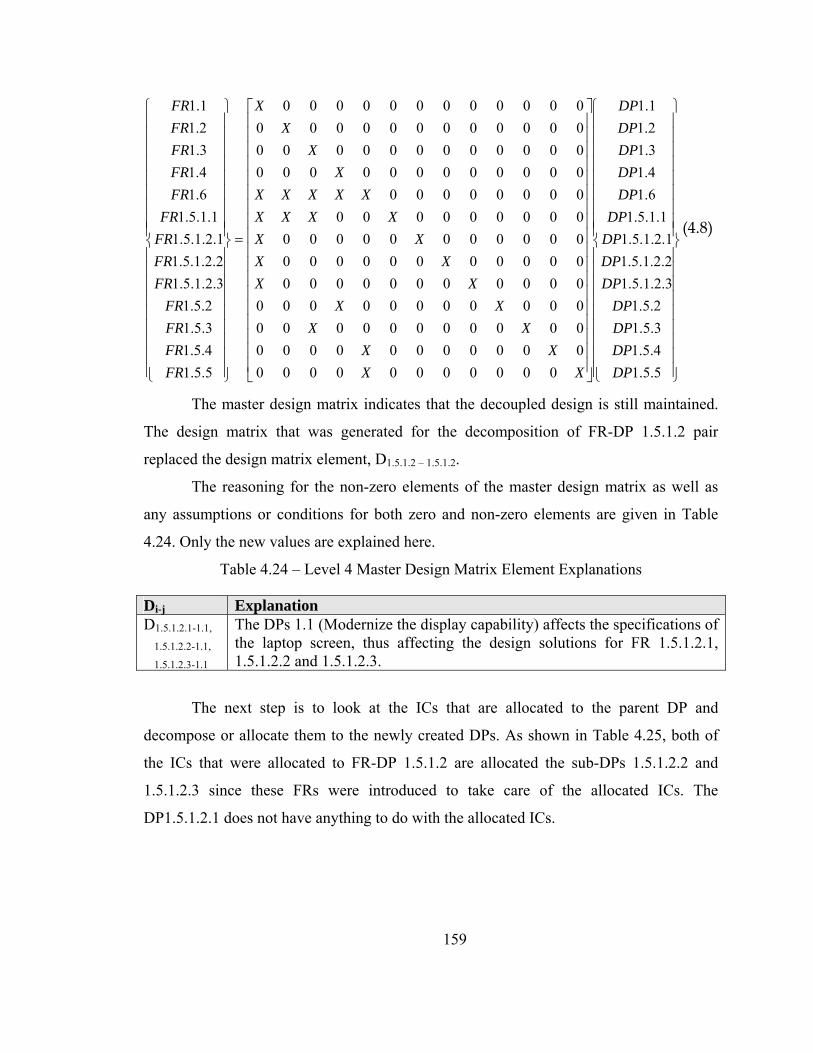
159
⎪⎪⎪⎪⎪⎪⎪⎪⎪
⎭
⎪⎪⎪⎪⎪⎪⎪⎪⎪
⎬
⎫
⎪⎪⎪⎪⎪⎪⎪⎪⎪
⎩
⎪⎪⎪⎪⎪⎪⎪⎪⎪
⎨
⎧
⎥⎥⎥⎥⎥⎥⎥⎥⎥⎥⎥⎥⎥⎥⎥⎥⎥⎥
⎦
⎤
⎢⎢⎢⎢⎢⎢⎢⎢⎢⎢⎢⎢⎢⎢⎢⎢⎢⎢
⎣
⎡
=
⎪⎪⎪⎪⎪⎪⎪⎪⎪
⎭
⎪⎪⎪⎪⎪⎪⎪⎪⎪
⎬
⎫
⎪⎪⎪⎪⎪⎪⎪⎪⎪
⎩
⎪⎪⎪⎪⎪⎪⎪⎪⎪
⎨
⎧
5.5.14.5.13.5.12.5.1
3.2.1.5.12.2.1.5.11.2.1.5.1
1.1.5.16.14.13.12.11.1
0000000000000000000000000000000000000000000000000000000000000000000000000000000000000000000000000000000000000000000000000000000000000000000000
5.5.14.5.13.5.12.5.1
3.2.1.5.12.2.1.5.11.2.1.5.1
1.1.5.16.14.13.12.11.1
DPDPDPDP
DPDPDPDP
DPDPDPDPDP
XXXX
XXXX
XXXX
XXXXXX
XXXXXX
XX
X
FRFRFRFR
FRFRFRFR
FRFRFRFRFR
(4.8)
The master design matrix indicates that the decoupled design is still maintained.
The design matrix that was generated for the decomposition of FR-DP 1.5.1.2 pair
replaced the design matrix element, D1.5.1.2 – 1.5.1.2.
The reasoning for the non-zero elements of the master design matrix as well as
any assumptions or conditions for both zero and non-zero elements are given in Table
4.24. Only the new values are explained here.
Table 4.24 – Level 4 Master Design Matrix Element Explanations
Di-j Explanation D1.5.1.2.1-1.1,
1.5.1.2.2-1.1,
1.5.1.2.3-1.1
The DPs 1.1 (Modernize the display capability) affects the specifications of the laptop screen, thus affecting the design solutions for FR 1.5.1.2.1, 1.5.1.2.2 and 1.5.1.2.3.
The next step is to look at the ICs that are allocated to the parent DP and
decompose or allocate them to the newly created DPs. As shown in Table 4.25, both of
the ICs that were allocated to FR-DP 1.5.1.2 are allocated the sub-DPs 1.5.1.2.2 and
1.5.1.2.3 since these FRs were introduced to take care of the allocated ICs. The
DP1.5.1.2.1 does not have anything to do with the allocated ICs.
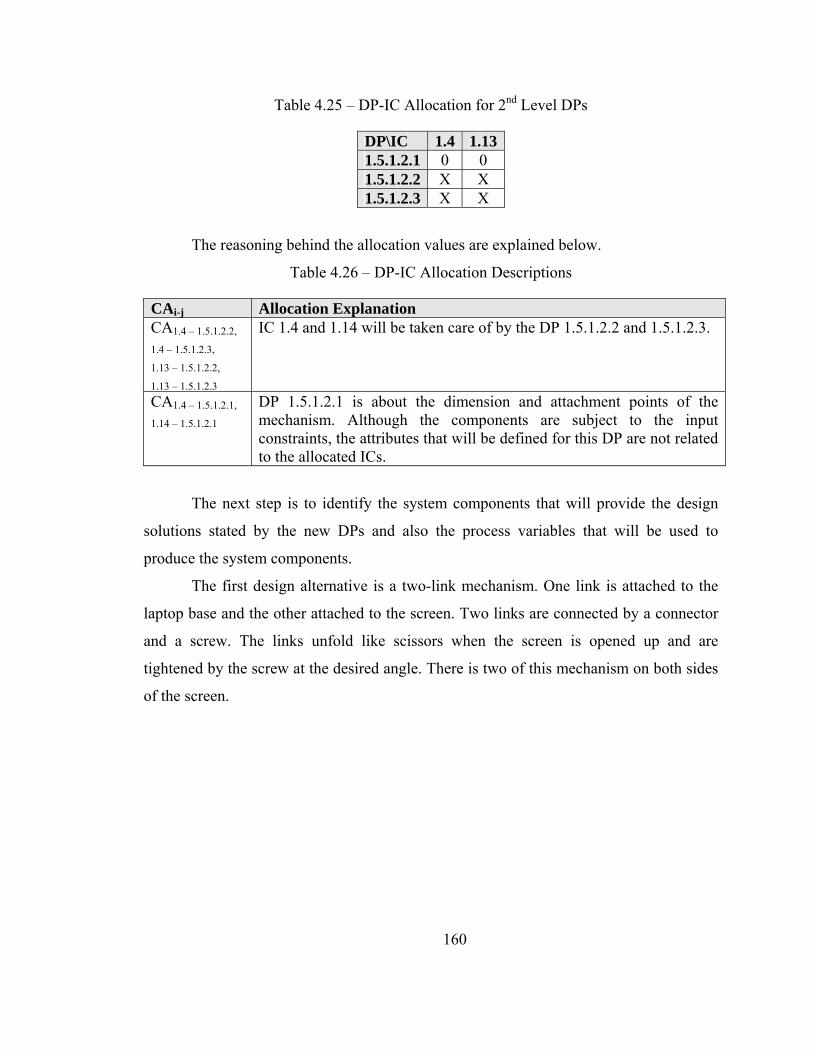
160
Table 4.25 – DP-IC Allocation for 2nd Level DPs
DP\IC 1.4 1.131.5.1.2.1 0 0 1.5.1.2.2 X X 1.5.1.2.3 X X
The reasoning behind the allocation values are explained below.
Table 4.26 – DP-IC Allocation Descriptions
CAi-j Allocation Explanation CA1.4 – 1.5.1.2.2,
1.4 – 1.5.1.2.3,
1.13 – 1.5.1.2.2,
1.13 – 1.5.1.2.3
IC 1.4 and 1.14 will be taken care of by the DP 1.5.1.2.2 and 1.5.1.2.3.
CA1.4 – 1.5.1.2.1,
1.14 – 1.5.1.2.1 DP 1.5.1.2.1 is about the dimension and attachment points of the mechanism. Although the components are subject to the input constraints, the attributes that will be defined for this DP are not related to the allocated ICs.
The next step is to identify the system components that will provide the design
solutions stated by the new DPs and also the process variables that will be used to
produce the system components.
The first design alternative is a two-link mechanism. One link is attached to the
laptop base and the other attached to the screen. Two links are connected by a connector
and a screw. The links unfold like scissors when the screen is opened up and are
tightened by the screw at the desired angle. There is two of this mechanism on both sides
of the screen.
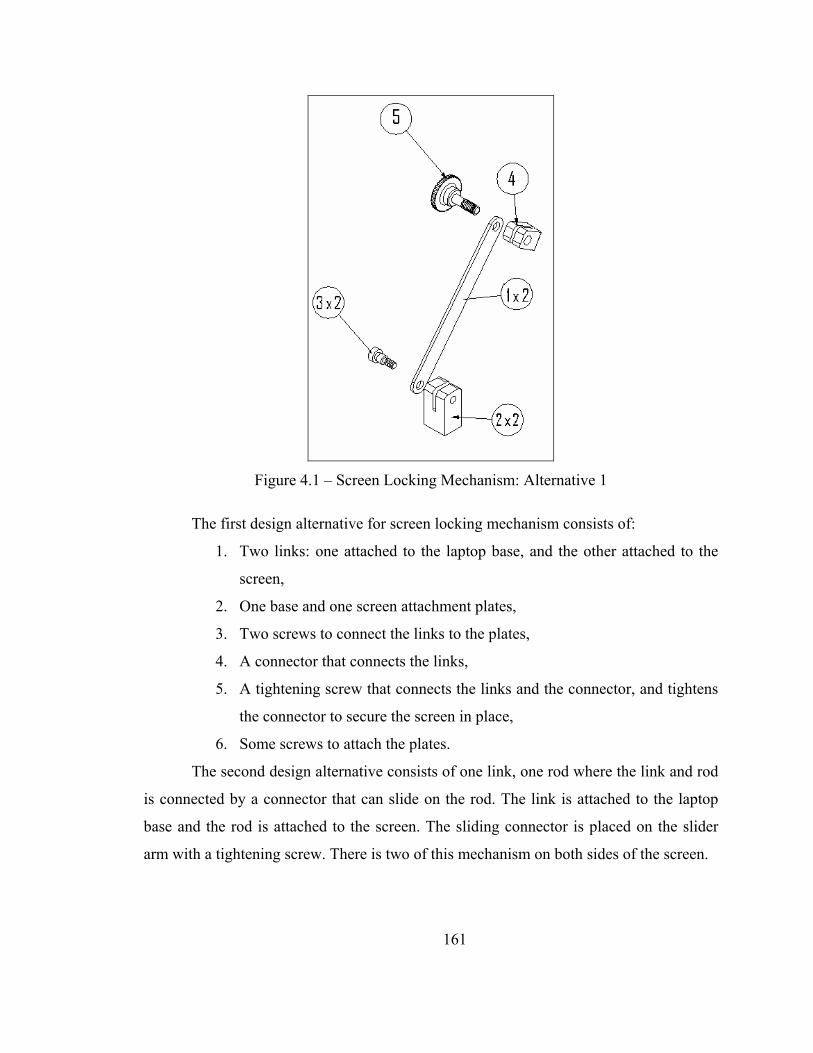
161
Figure 4.1 – Screen Locking Mechanism: Alternative 1
The first design alternative for screen locking mechanism consists of:
1. Two links: one attached to the laptop base, and the other attached to the
screen,
2. One base and one screen attachment plates,
3. Two screws to connect the links to the plates,
4. A connector that connects the links,
5. A tightening screw that connects the links and the connector, and tightens
the connector to secure the screen in place,
6. Some screws to attach the plates.
The second design alternative consists of one link, one rod where the link and rod
is connected by a connector that can slide on the rod. The link is attached to the laptop
base and the rod is attached to the screen. The sliding connector is placed on the slider
arm with a tightening screw. There is two of this mechanism on both sides of the screen.
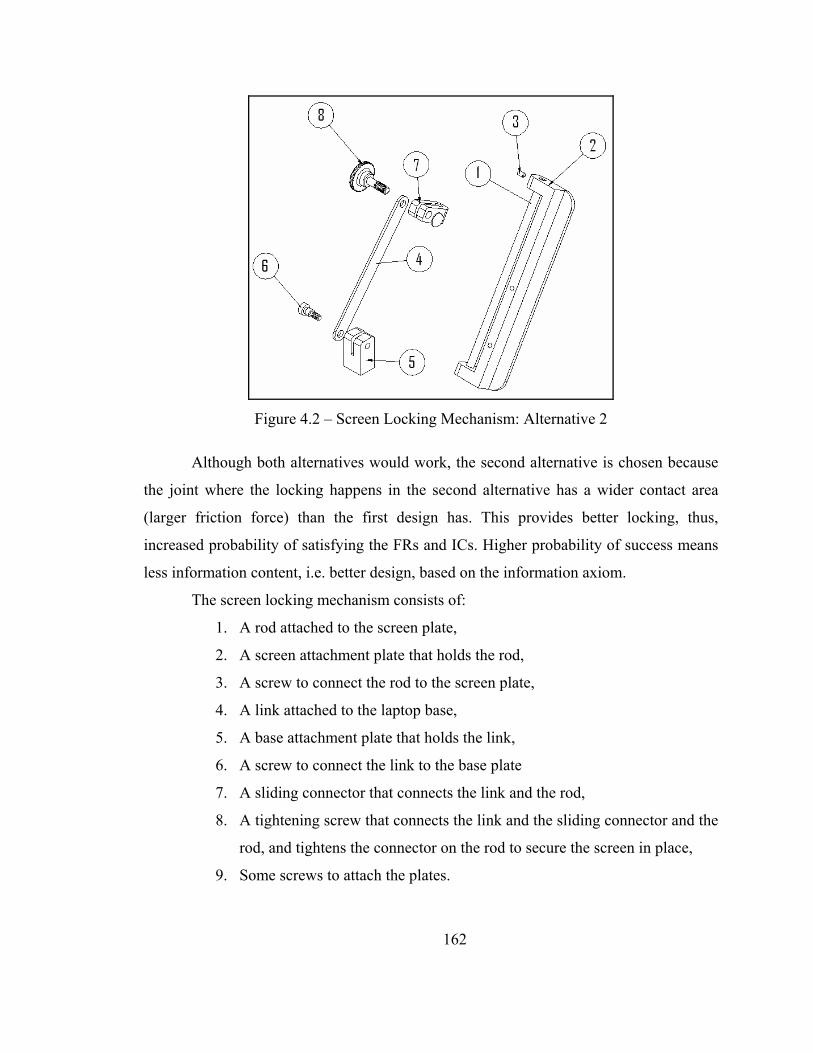
162
Figure 4.2 – Screen Locking Mechanism: Alternative 2
Although both alternatives would work, the second alternative is chosen because
the joint where the locking happens in the second alternative has a wider contact area
(larger friction force) than the first design has. This provides better locking, thus,
increased probability of satisfying the FRs and ICs. Higher probability of success means
less information content, i.e. better design, based on the information axiom.
The screen locking mechanism consists of:
1. A rod attached to the screen plate,
2. A screen attachment plate that holds the rod,
3. A screw to connect the rod to the screen plate,
4. A link attached to the laptop base,
5. A base attachment plate that holds the link,
6. A screw to connect the link to the base plate
7. A sliding connector that connects the link and the rod,
8. A tightening screw that connects the link and the sliding connector and the
rod, and tightens the connector on the rod to secure the screen in place,
9. Some screws to attach the plates.
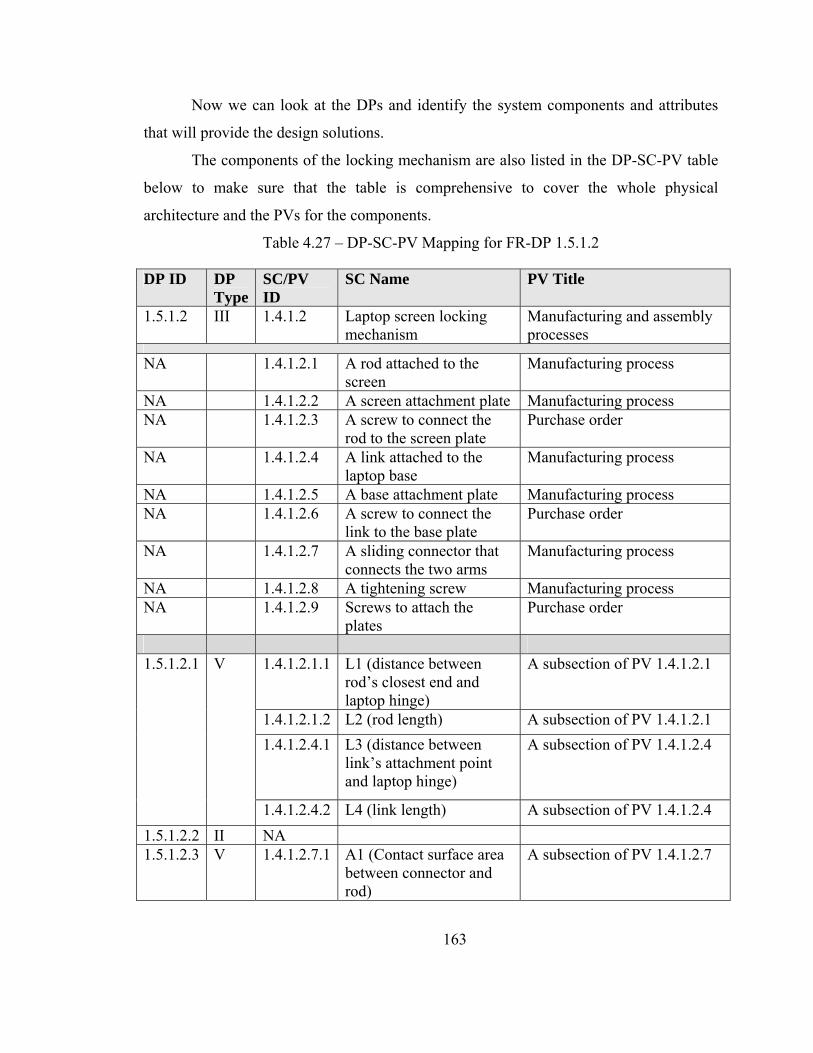
163
Now we can look at the DPs and identify the system components and attributes
that will provide the design solutions.
The components of the locking mechanism are also listed in the DP-SC-PV table
below to make sure that the table is comprehensive to cover the whole physical
architecture and the PVs for the components.
Table 4.27 – DP-SC-PV Mapping for FR-DP 1.5.1.2
DP ID DP Type
SC/PV ID
SC Name PV Title
1.5.1.2 III 1.4.1.2 Laptop screen locking mechanism
Manufacturing and assembly processes
NA 1.4.1.2.1 A rod attached to the screen
Manufacturing process
NA 1.4.1.2.2 A screen attachment plate Manufacturing process NA 1.4.1.2.3 A screw to connect the
rod to the screen plate Purchase order
NA 1.4.1.2.4 A link attached to the laptop base
Manufacturing process
NA 1.4.1.2.5 A base attachment plate Manufacturing process NA 1.4.1.2.6 A screw to connect the
link to the base plate Purchase order
NA 1.4.1.2.7 A sliding connector that connects the two arms
Manufacturing process
NA 1.4.1.2.8 A tightening screw Manufacturing process NA 1.4.1.2.9 Screws to attach the
plates Purchase order
1.4.1.2.1.1 L1 (distance between
rod’s closest end and laptop hinge)
A subsection of PV 1.4.1.2.1
1.4.1.2.1.2 L2 (rod length) A subsection of PV 1.4.1.2.1 1.4.1.2.4.1 L3 (distance between
link’s attachment point and laptop hinge)
A subsection of PV 1.4.1.2.4
1.5.1.2.1 V
1.4.1.2.4.2 L4 (link length) A subsection of PV 1.4.1.2.4 1.5.1.2.2 II NA 1.5.1.2.3 V 1.4.1.2.7.1 A1 (Contact surface area
between connector and rod)
A subsection of PV 1.4.1.2.7
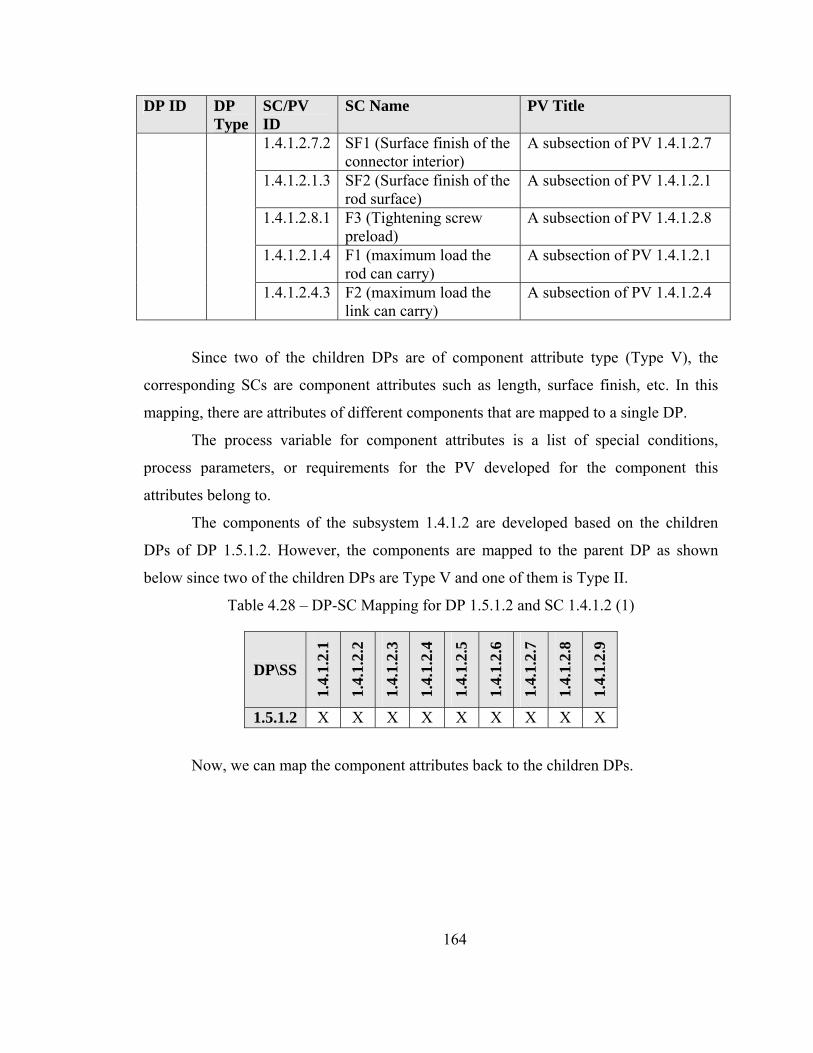
164
DP ID DP Type
SC/PV ID
SC Name PV Title
1.4.1.2.7.2 SF1 (Surface finish of the connector interior)
A subsection of PV 1.4.1.2.7
1.4.1.2.1.3 SF2 (Surface finish of the rod surface)
A subsection of PV 1.4.1.2.1
1.4.1.2.8.1 F3 (Tightening screw preload)
A subsection of PV 1.4.1.2.8
1.4.1.2.1.4 F1 (maximum load the rod can carry)
A subsection of PV 1.4.1.2.1
1.4.1.2.4.3 F2 (maximum load the link can carry)
A subsection of PV 1.4.1.2.4
Since two of the children DPs are of component attribute type (Type V), the
corresponding SCs are component attributes such as length, surface finish, etc. In this
mapping, there are attributes of different components that are mapped to a single DP.
The process variable for component attributes is a list of special conditions,
process parameters, or requirements for the PV developed for the component this
attributes belong to.
The components of the subsystem 1.4.1.2 are developed based on the children
DPs of DP 1.5.1.2. However, the components are mapped to the parent DP as shown
below since two of the children DPs are Type V and one of them is Type II.
Table 4.28 – DP-SC Mapping for DP 1.5.1.2 and SC 1.4.1.2 (1)
DP\SS
1.4.
1.2.
1
1.4.
1.2.
2
1.4.
1.2.
3
1.4.
1.2.
4
1.4.
1.2.
5
1.4.
1.2.
6
1.4.
1.2.
7
1.4.
1.2.
8
1.4.
1.2.
9
1.5.1.2 X X X X X X X X X
Now, we can map the component attributes back to the children DPs.
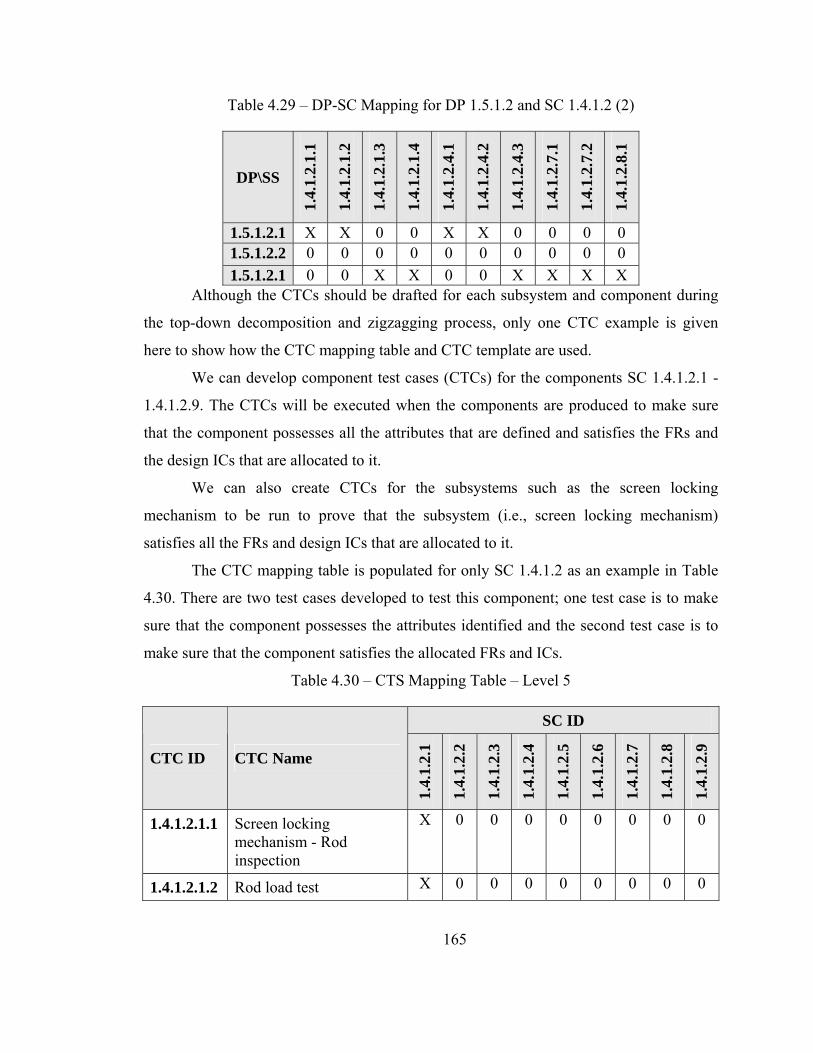
165
Table 4.29 – DP-SC Mapping for DP 1.5.1.2 and SC 1.4.1.2 (2)
DP\SS
1.4.
1.2.
1.1
1.4.
1.2.
1.2
1.4.
1.2.
1.3
1.4.
1.2.
1.4
1.4.
1.2.
4.1
1.4.
1.2.
4.2
1.4.
1.2.
4.3
1.4.
1.2.
7.1
1.4.
1.2.
7.2
1.4.
1.2.
8.1
1.5.1.2.1 X X 0 0 X X 0 0 0 0 1.5.1.2.2 0 0 0 0 0 0 0 0 0 0 1.5.1.2.1 0 0 X X 0 0 X X X X
Although the CTCs should be drafted for each subsystem and component during
the top-down decomposition and zigzagging process, only one CTC example is given
here to show how the CTC mapping table and CTC template are used.
We can develop component test cases (CTCs) for the components SC 1.4.1.2.1 -
1.4.1.2.9. The CTCs will be executed when the components are produced to make sure
that the component possesses all the attributes that are defined and satisfies the FRs and
the design ICs that are allocated to it.
We can also create CTCs for the subsystems such as the screen locking
mechanism to be run to prove that the subsystem (i.e., screen locking mechanism)
satisfies all the FRs and design ICs that are allocated to it.
The CTC mapping table is populated for only SC 1.4.1.2 as an example in Table
4.30. There are two test cases developed to test this component; one test case is to make
sure that the component possesses the attributes identified and the second test case is to
make sure that the component satisfies the allocated FRs and ICs.
Table 4.30 – CTS Mapping Table – Level 5
SC ID
CTC ID CTC Name
1.4.
1.2.
1
1.4.
1.2.
2
1.4.
1.2.
3
1.4.
1.2.
4
1.4.
1.2.
5
1.4.
1.2.
6
1.4.
1.2.
7
1.4.
1.2.
8
1.4.
1.2.
9
1.4.1.2.1.1 Screen locking mechanism - Rod inspection
X 0 0 0 0 0 0 0 0
1.4.1.2.1.2 Rod load test X 0 0 0 0 0 0 0 0
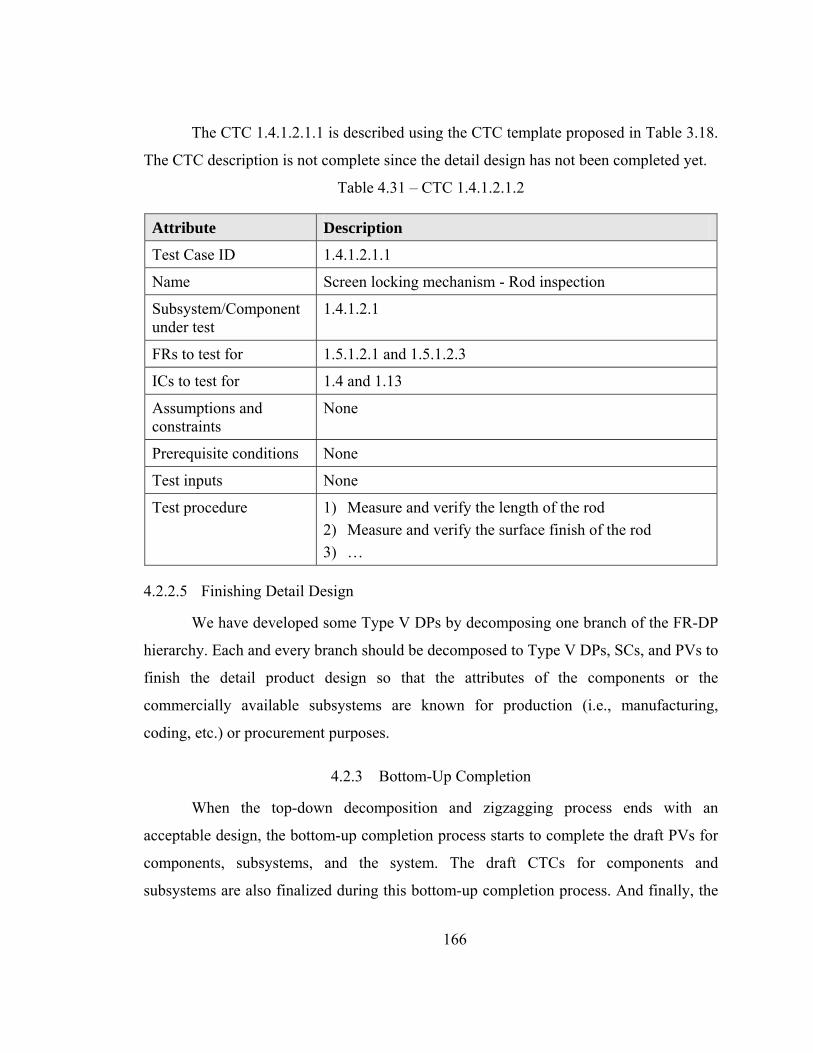
166
The CTC 1.4.1.2.1.1 is described using the CTC template proposed in Table 3.18.
The CTC description is not complete since the detail design has not been completed yet.
Table 4.31 – CTC 1.4.1.2.1.2
Attribute Description
Test Case ID 1.4.1.2.1.1
Name Screen locking mechanism - Rod inspection
Subsystem/Component under test
1.4.1.2.1
FRs to test for 1.5.1.2.1 and 1.5.1.2.3
ICs to test for 1.4 and 1.13
Assumptions and constraints
None
Prerequisite conditions None
Test inputs None
Test procedure 1) Measure and verify the length of the rod 2) Measure and verify the surface finish of the rod 3) …
4.2.2.5 Finishing Detail Design
We have developed some Type V DPs by decomposing one branch of the FR-DP
hierarchy. Each and every branch should be decomposed to Type V DPs, SCs, and PVs to
finish the detail product design so that the attributes of the components or the
commercially available subsystems are known for production (i.e., manufacturing,
coding, etc.) or procurement purposes.
4.2.3 Bottom-Up Completion
When the top-down decomposition and zigzagging process ends with an
acceptable design, the bottom-up completion process starts to complete the draft PVs for
components, subsystems, and the system. The draft CTCs for components and
subsystems are also finalized during this bottom-up completion process. And finally, the
167
FTCs are developed for the baselined FRs. The templates presented in Section 3.2.13
should be used for documenting the FTCs and the relationships between FTCs and the
baselined FRs.
4.3 System Architecture
The tree-diagram that shows the FR, DP, and SC hierarchies for the case study is
presented in Appendix B. The SC hierarchy presented in Appendix C highlights the
branch that was decomposed to Type 5 Attribute level and also shows the SC type levels.
Since APDL uses the same module-junction and the flow diagram format and
logic that are defined in the AD method, these two representations of the system are not
presented here.
4.4 Discussions and Conclusion
Some of the defects that could have been prevented if APDL had been used as the
model for product development:
• The laptop mount could have been designed and tested with the vibration
input constraint in mind. This defect caused several problems with the
laptop and the screen.
• The screen could have been supported from both sides so that the screen
did not twist under shock and crash conditions.
However, there are some difficulties of applying APDL, such as:
• Training is needed to teach the structure of APDL and how to perform the
mapping, decomposition and zigzagging properly.
• Software tools and databases are needed to enter and manipulate data, to
handle the mapping and decomposition matrices as well as to capture the
domain entity descriptions and matrix element explanations.
• Considerably more time would be spent on requirement analysis and
design when APDL is used than the traditional models. However, this
investment pays of during implementation and testing and also during the
rest of the product lifecycle due to easier implementation, full test

168
coverage, less reworks, easy maintenance, and higher customer
satisfaction.
The case study proved that using APDL model could have prevented some of the
defects and problems experienced before, and increased the possibility of producing high
quality products. In addition, the APDL model provides an easy to follow process for
performing product design and development activities.
169
CHAPTER V
V CONCLUSIONS AND
SUGGESTIONS FOR FUTURE WORK
5.1 Conclusions
In this research, different design methodologies and system/product development
lifecycle models are studied and a new product development lifecycle model, the
Axiomatic Product Development Lifecycle (APDL), is proposed and its use is discussed.
The AD method provides a robust structure and systematic thinking to support
design activities, however, it does not support the whole product development lifecycle.
The APDL model is based on the AD method to use the AD logic and scientific thinking
to capture, analyze, and manage the product development lifecycle knowledge. Since
APDL is based on the AD method, it inherits all the benefits of applying AD to product
development. Like the AD method, the APDL model can be used in design and
development of products, systems, services, and organizations in many different
disciplines.
The main differences between the AD method and the APDL model are:
1. APDL has the test domain with FTC and CTC characteristic vectors
2. APDL has the IC characteristic vector in the functional domain
3. APDL has mapping matrix from CNs to FRis and ICs.
4. APDL has IC allocation matrix for allocating ICs to DPs
5. APDL has the SC characteristic vector in the physical domain
6. APDL ties the PVs to the SCs instead of the DPs.
7. APDL has the SC hierarchy in the System Architecture (SA) representation
8. APDL has the tables to explain the mapping matrix elements and some
templates.
CONCLUSION AND
SUGGESTIONS FOR FUTURE WORK
170
9. Guiding the developer to first perform a top-down analysis to develop the
functional requirements, design solutions, and system components, and then a
bottom-up analysis to complete process variables and test cases.
The APDL model is also similar to the four-phase QFD model, where parts that
implement the design features are identified and then the processes that are used to create
the parts are developed.
The goal of using APDL is straightforward – to manage and track interactions
between elements of the customer, functional, deign, process and test domains. By doing
so, the system can be designed in a predictable way to satisfy the needs it is being created
to satisfy, and the system can be tested based on those needs. Every artifact of the product
development activities can be tied to the agreed-upon requirements or to individual
physical components. The structure of the APDL model provides the rigor in managing
design and product development lifecycle information that is required by large systems.
The APDL model provides an easy to follow process for performing product
design and development activities. The APDL model guides the transdisciplinary product
development team throughout the design and development effort; to first perform a top-
down analysis to develop the functional requirements, design solutions, and system
components, and then a bottom-up analysis to complete process variables and test cases.
The APDL model helps capture and present both the big-picture and detail view
of the product development knowledge, including design knowledge and requirement
traceability knowledge as well as relationships between all four PDL domains and all
eight characteristic arrays. This helps in managing the knowledge produced by the
development effort and also helps transdisciplinary teams communicate effectively and
participate efficiently. This also supports change impact analysis as well as re-
engineering and maintenance efforts.
The APDL, like AD method, forces careful consideration of functional
interactions, rather than relying on developer’s intuition and unstructured design
documentation. This is particularly beneficial to large or complex systems, where the
number of functional requirements makes it essentially impossible for single engineer,
171
even for a development team to manage and communicate the necessary amount of
functional, design, and process information.
The APDL model introduces the system component vector in the physical domain
along with the DPs and captures the mapping from DPs to SCs and from SCs to PVs
throughout the decomposition and zigzagging process. Unlike the traditional AD
approach, the APDL model relates the PVs to the SCs not to the DPs since the PVs are
used to produce the SCs that provide the design solutions expressed as DPs. For example,
a DP may state the minimum strength required from an element, but an attribute type SC
defines the material to be used. The PV will use the specified material (attribute type SC)
to produce the component (component type SC) in order to provide the design solution
stated in the DP. The APDL model captures the system component (SC) hierarchy and
traceability to be used as input for many physical component based analysis including
Design Structure Matrix (DSM), Failure Modes and Effect Analysis (FMEA), functional
reliability analysis [Trewn and Yang, 2000] and cost analysis [Jeziorek, 2005] as well as
change impact analysis.
Requirements traceability (RT) is generally practiced in software development
lifecycles and in manufacture of high-reliability products and systems such as medical
and aerospace. This important practice is not widely known and implemented in other
engineering disciplines. However, it should be a vital part of any system development
lifecycle to make sure that the customer needs, in turn functional requirements and
constraints are considered during the development phases and the final product/service
fully satisfies those needs.
The APDL model provides full requirement traceability in both directions in order
to make sure that all the activities in the product development lifecycle are aligned with
the requirements at all times and the final product satisfies the agreed-upon requirements.
This characteristic of APDL reduces the RT implementation problems. In addition to
requirement traceability, the APDL model provides input constraint (IC) traceability to
help allocate ICs to DPs systematically so that it can be made sure that the product
172
satisfies the ICs. It should be kept in mind that the matrices are living artifacts and they
should be kept up-to-date like other RT data throughout the lifecycle.
Seven new theorems have been developed. These theorems are the cornerstones
of the APDL model and have significant implications for the continued application of
axiomatic design. They streamline the process of applying axiomatic design to product
development, therefore increasing the likelihood that products will be designed to meet
their needs correctly. The theorems are listed in Appendix A.
The design axioms are applicable to the design equation only and the
independence axiom applies to process equation too. The other equations serve to
systematize the product development processes and product development knowledge
management by capturing the product development related knowledge, relations and
traceability.
Traditional design documentation is typically created at the end of the design
project, and often represents the final product and omits discussion of the reasoning
behind design decisions. The documentation created as a by-product of the APDL
process will overcome this problem and facilitate the communication and coordination
between the stakeholders including design teams. Better communication and coordination
result in producing high quality products and maintaining the integrity of the product. It
also helps shorten the development time and reduce the cost.
The tables and matrices used during the decomposition and zigzagging process do
not allow providing very detailed descriptions of the domain entities. However, the detail
descriptions of the domain entities should be provided in a format most suitable for the
discipline and the unique identifiers should be used to relate the documents to the
mapping matrices and tables. This will provide full integration of documentation as well
as traceability throughout the development lifecycle. The suggested domain entity
templates should be used as a starting point to develop the templates most suitable for the
development organization.
Commonly, systems are designed by teams of engineers, therefore requiring
communication both within and between teams. The APDL improves communication
173
between all the stakeholders by providing them a systematic way of accessing
development lifecycle knowledge both at the top level and at the detailed levels. Also, the
matrices, tables, and templates proposed in the APDL approach capture the knowledge
related to the domain entities and the relationships between the domain entities and help
plan and manage the interactions of different design and development activities during
the development lifecycle.
Traditionally, when a design or an analysis method to be used, the required input
data is gathered from product documents such as requirement specifications, design
descriptions and so on. Most of the time, these documents are not complete and most
importantly, they do not capture the relationships between domain entities. However, the
APDL model captures the product development knowledge and the relations between
different domain entities in a very structured way that the knowledge is very easy to
access for use by other design and development methodologies, such as TRIZ, robust
design, DSM, FMEA, etc.
The APDL model can be used in many project management models such as
waterfall, spiral, iterative-incremental, evolutionary prototype, etc. to manage the data
produced for each domain as well as the relationships between the domains.
In order to implement APDL, software tools and databases are needed to enter
and manipulate data, to handle the mapping and decomposition matrices as well as to
capture the domain entity descriptions and matrix element explanations.
5.2 Suggestions for Future Research
Software tools should be developed to support and to take full advantage of the
implementation of the APDL model. If the product development knowledge is not
captured in an electronic format, manipulation, sharing and reuse of the knowledge would
not be practical, especially for bigger projects.
Design and product development knowledge bases can be designed and developed
based on the APDL model. These knowledge bases can be used in future development
effort as a knowledge repository to search for existing design solutions, component
descriptions, test cases, etc.
174
Risk management can be integrated into the APDL and risks will also be
decomposed as the FR/DP/SC/PV decomposition is performed. Risks are either mitigated
or allocated to some or all of the derived domain entities as the decomposition proceeds.
A new DP type called “Interface” can be introduced into the model to identify the
subsystems and components used as interfaces to integrate the subsystems or
components. The Design Matrix Analysis can be used to identify the interfaces between
the system components [Jeziorek, 2005].
There are some studies to use the AD structure for project management and
tasking [Steward and Tate, 2000; Braha, 2002]. Since APDL covers the whole product
development lifecycle, the domain entities that are developed by applying the APDL
model can be used for estimation, scheduling, and tasking.
The commonly used product and project management models, such as CMMI
[CMMI 1.1] and RUP, lack the systematic nature of the APDL and the APDL lacks a lot
of details such as templates, checklists, and documentation that are provided by the other
models. In a more comprehensive research, the commonly used models can be modified
to include the APDL model in order to provide a more robust and more systematic
approach to product development lifecycle and product knowledge management.
People are finally accepting the idea that they may be able to benefit from the
experiences of others. Corporations, government departments, and even the military are
actively using lessons learned information to help them achieve their varied goals. There
are few commercial software tools (e.g., AskMe Enterprise) and a lot of homegrown tools
(NASA, WEROX, and Roche) for capture and reuse of lessons learned.
The tools and databases used for capturing and utilizing Lessons Learned and
Best Practices can be integrated with the APDL SA to relate the lessons learned and best
practices to specific domain entities. When a specific domain entity is reused in a future
product development effort, the developer can be informed about the related lessons
learned and best practices. This will help developers avoid previous mistakes and reuse
the best practices. It will also make the lessons learned and best practices system more
effective and efficient.
175
REFERENCES
1) A Survey of System Development Process Models, Center for Technology in Government University at Albany, SUNY, 1998.
2) Akao, Y., Ed. 1990, Quality Function Deployment: Integrating Customer Requirements into Product Design, Translated by Glenn Mazur. Cambridge, MA: Productivity Press.
3) Albano, L.D., and Suh, N.P. "Axiomatic Design and Concurrent Engineering", Computer Aided Design, 1994v26, n7, p499-504.
4) Altshuller G.S., Creativity as an Exact Science, Gordon and Breach, New York, 1988. ISBN 0-677-21230-5
5) American Society for Quality web site, http://www.asq.org/
6) Axiomatic Design Solutions, Inc. (ADSI) web site, http://www.axiomaticdesign.com/
7) Braha, D., Partitioning Tasks to Product Development Teams, Proceedings of ICAD 2002, 2nd International Conference on Axiomatic Design, Cambridge, MA, June 10&11, 2002.
8) Browning, T. R., Modeling and Analyzing Cost, Schedule, and Performance in Complex System Product Development, PhD Thesis, MIT, Cambridge, 1998.
9) Browning, T. R., Applying the Design Structure Matrix to System Decomposition and Integration Problems: A Review and New Directions, IEEE Transaction on Engineering Management, Vol. 48, No. 3, August 2001.
10) Cicek, I. and Ertas, A., Vibration Considerations for the Installation of Portable Computer Equipment on Military Aircraft, Integrated Design and Process Technology, IDPT-2004, June 2004.
11) Chase, James P., Value Creation in the Product Development Process, Thesis in Master of Science in Aeronautics and Astronautics at MIT, December 2001.
12) Chen, Ke-Zhang, Identifying the Relationship among Design Methods: Key to Successful Applications of Developments of Design Methods, Journal of Engineering Design, Vol. 10, No. 2, 1999.
13) Christel, Michael G. and Kang, Kyo C., Issues in Requirements Elicitation, Technical Report, CMU/SEI-92-TR-012, ESC-TR-92-012, SEI, Carnegie Mellon University, September 1992.
14) CMMI 1.1, Capability Maturity Model Integration, Version 1.1 for Systems Engineering, Software Engineering, Integrated Product and Process Development, and Supplier Sourcing, Carnegie Mellon University, Software Engineering Institute, Pittsburgh, PA, March 2002.
176
15) Condit, Philip M., Performance, Process, and Value: Commercial Aircraft Design in the 21st Century, Speech at the World Aviation Congress and Exposition. Los Angeles. October 22, 1996.
16) Coyne, R. D., Rosenman, M. A., Radford, A. D., Balachandran, M., and Gero, J. S., Knowledge-Based Design Systems, Addison-Wesley Publishing Company, 1990.
17) Davis, A.L. and Leffingwell, D.A., Making Requirements Management Work for You, Crosstallk, The Journal of Defense Software Engineering, April 1999, pp 10-13.
18) Dixon J.R., On Research Methodology Towards a Scientific Theory of Engineering Design, Artificial Intelligence for Engineering Design, Analysis, and Manufacturing, Vol. 1, No. 3, p 145-157, 1987.
19) Do, S.-H. and Suh, N. P., Object Oriented Software Design with Axiomatic Design, Proceedings of ICAD2000, Cambridge, MA, June 21-23, 2000, pgs. 278-284.
20) Do, S.-H., Software Product Lifecycle Management Using Axiomatic Design Approach, Proceedings of ICAD2004, Seoul, June 21-24, 2004.
21) DoD, 91, U.S. Department of Defense. Software Technology Plan: Volume II Plan of Action (Technical Report Draft 5, 8/15/91), U.S. Department of Defense, August 1991.
22) Eppinger, Steven D., Three Views of Product Complexity, Presented at the LAI Plenary. Cambridge. April 2001.
23) Ertas, Atila and Jones, Jesse C., The Engineering Design Process, 2nd Edition, John Wiley & Sons, Inc., 1996.
24) Ettlie, J. E., Product-process Development Integration in Manufacturing, Management Science, 41, 7, 1995, 1224-1237.
25) Evbuomwan, N.F.O., Sivaloganathan, S., and Jebb A., A Survey of Design Philosophies, Models, Methods and Systems, Proceedings ImechE Part B: Journal of Engineering Manufacture, Vol. 210, No. B4, pp. 301-320, 1996.
26) Finger S, Dixon J.R., A Review of Research in Mechanical Engineering Design. Part I and Part II, Research in Engineering Design, Vol. 1, pp. 51-67 and pp. 121-137, 1989.
27) Finin, T., McKay, D., and Fritzon, R., An Overview of KQML: A Knowledge Query and Manipulation Language, Technical Report, Computer Science Department, University of Maryland, 1992.
28) Fredriksson B., Holistic Systems Engineering In Product Development, The Saab-Scania Griffin, 1994/95, Saab-Scania AB, Linköping, Sweden, Nov 1994.
29) Friedman, G., Hintersteiner, D., Tate, D., and Zimmerman, R., Representation and Refinement of Constraints in the System Architecture, 5th International Conference on Integrated Design and Process Technology (IDPT), Society for Design and Process Science (SDPS), Dallas, TX, June 4-8, 2000.
177
30) Genesereth, M.R. and Fikes, R., Knowledge interchange format, Version 2.2 reference manual. Computer Science Dept., Stanford Univ., Stanford, CA. Technical Report Logic -90-04
31) Gotel, O., and Finkelstein, A., An Analysis of the Requirements Traceability Problem, Proceedings of the First International Conference on Requirements Engineering, Colorado Springs, Colo., April 1994, pp. 94-101.
32) Gumus, B., Ertas, E., Unuvar, B, and Doganli, M., Requirements Traceability (RT) Throughout the System Development Lifecycle Using Axiomatic Design (AD) Approach, Proceedings of Integrated Design and Process Technology, IDPT, Pasadena, California, June 2002.
33) Gumus, Bulent and Ertas, Atila, (2004a), Requirement Management and Axiomatic Design, Proceedings of Integrated Design and Process Technology Symposium, Izmir, Turkey, June, 2004, Vol. 1, pp. 52-62.
34) Gumus, Bulent and Ertas, Atila, (2004b), Requirement Management and Axiomatic Design, Journal of Integrated Design and Process Science, Vol. 8 Number 4, pp. 19-31, 2004.
35) Harutunian, V., Nordlund, M., Tate, D., and Suh, N. P., Decision Making and Software Tools for Product Development Based on Axiomatic Design Theory, Annals of the CIRP, Vol. 45/1, 1996.
36) Hauser, J.R. and Clausing, D., The House of Quality, Harvard Business Review, May-June, pp 63-73.
37) Hintersteiner, Jason D. and Tate, Derrick, Command and Control in Axiomatic Design Theory: It’s Role and Placement in the System Architecture, Proceedings of the 2nd International Conference on Engineering Design and Automation, Maui, HI. August 9-12, 1998.
38) Hintersteiner, J. D., A Fractal Representation for Systems, Proceedings of the 1999 International CIRP Design Seminar, Enschede, the Netherlands, March 24-26, 1999.
39) Hintersteiner, Jason D., Addressing Changing Customer Needs by Adapting Design Requirements, Proceeding of ICAD2000, First International Conference on Axiomatic Design, Cambridge, MA – June 21-23, 2000.
40) Hu, M., Yang, K., and Taguchi, S. (2000a), Enhancing Robust Design with the Aid of TRIZ and Axiomatic Design, Part I, TRIZ Journal, October 2000.
41) Hu, M., Yang, K., and Taguchi, S. (2000b), Enhancing Robust Design with the Aid of TRIZ and Axiomatic Design, Part II, TRIZ Journal, November 2000.
42) IEEE Std. 830-1998, Institute of Electrical and Electronics Engineers (IEEE) Recommended Practices for Software Requirements Specifications, IEEE Standard 830-1990, Institute of Electrical and Electronics Engineers, New York, 1983.
178
43) IEEE Std. 610.12-1990, Institute of Electrical and Electronics Engineers (IEEE) Standard Glossary of Software Engineering Terminology. IEEE Standard 610.12-1990, Institute of Electrical and Electronics Engineers, New York, 1983.
44) INCOSE, International Council on Systems Engineering (INCOSE), Systems Engineering Handbook, INCOSE, San Francisco, 1998.
45) Jeziorek, Peter N., Cost Estimation of Functional and Physical Changes Made to Complex Systems, MS Thesis, Department of Mechanical Engineering, MIT, Cambridge, 2005.
46) Jones, J. C., A Method of Systematic Design, In Conference on Design Methods, J. C. Jones and D.G. Thornley, (eds.), New York: Macmillan, 1962.
47) Jung, J.Y. and Billatos, S.B., Applicability of Axiomatic Design in Concurrent Engineering, ASME Design Engineering, v52 pp129-135, 1993.
48) Kletz, T. A., Hazop and Hazan: Identifying and Assessing Process Industry Hazards, 4th Edition, Rugby, Warwickshire, UK, Institution of Chemical Engineers, 1999.
49) Kuo, T.-C., Huang, S. H., and Zhang, H.-C., Design for Manufacture and Design for ‘X’: Concepts, Applications, and Perspectives, Computers and Industrial Engineering, Vol. 41, pp. 241-260, 2001
50) Lee, Tae-Sik, The System Architecture Concept in Axiomatic Design Theory: Hypotheses Generation & Case-study Validation, M.S. Thesis, Department of Mechanical Engineering, MIT, Cambridge, 1999.
51) Leveson, N. G., Safeware: System Safety and Computers, Addison-Wesley Publishing Co. Reading, MA. 1995. ISBN #020-111972-2.
52) Lipson, H. and Suh, N. P., Towards a Universal Knowledge Database for Design Automation, Proceeding of ICAD2000, First International Conference on Axiomatic Design, pg., 250258, Cambridge, MA, June 21-23, 2000
53) Mann, D., Axiomatic Design and TRIZ: Compatibilities and Contradictions, Proceedings of ICAD2002, 2nd International Conference on Axiomatic Design, Cambridge, MA, June 10-11, 2002
54) Mäntylä, M., Knowledge Intensive CAD: Introduction and a Research Agenda, in Knowledge Intensive CAD Volume 1, Pages 3-12, Chapman & Hall, London, 1996.
55) McManus, Hugh and Warmkessel, Joyce, Lean Product Development, Presentation to the Lean Aerospace Initiative Executive Board, May 23, 2002.
56) Melvin, Jason W., Axiomatic System Design: Chemical Mechanical Polishing Machine Case Study, PhD Thesis in Mechanical Engineering at MIT, February 2003.
57) MIL-STD-498, Military Standard for Software Development and Documentation, Department of Defense, USA, 5 December 1994
179
58) Mohsen, A. H. and Cekecek, E., Thoughts on the use of Axiomatic Designs within the Product Development Process, Proceeding of ICAD2000, First International Conference on Axiomatic Design, Pg. 188-195, 2000.
59) NASA Systems Engineering Handbook. Pasadena: Jet Propulsion Laboratory, 1995.
60) Nordlund, M., An Information Framework for Engineering Design based on Axiomatic Design, Ph.D. Thesis, Dept. of Manufacturing Systems, Royal Institute of Technology (KTH), Stockholm, Sweden, 1996
61) Oosterman, Bas, Improving Product Development Projects by Matching Product Architecture and Organization, University of Groningen, The Netherlands. 2001.
62) Palady, P., Failure Modes and Effects Analysis, PT Publications, 1995.
63) Park S., Robust Design and Analysis for Quality Engineering. Chapman & Hall, London, 1996.
64) Prasad, B., Concurrent Engineering Fundamentals – Volume 1, Prentice Hall, Upper Saddle River, New Jersey, 1996.
65) Project Management Institute web site http://www.pmi.org/
66) QFD Institute http://www.qfdi.org/
67) Ramesh, B., Powers, T., Stubbs, C., and Edwards, M., Implementing Requirements Traceability: A Case Study, Proceedings of the Second IEEE International Symposium on Requirements Engineering, York, England, March 1995.
68) Ramesh, B. and Jarke, M., Toward Reference Models for Requirements Traceability, IEEE Transactions on Software Engineering, Vol. 37, No 1. January 2001, pp 58-93.
69) RTCA/DO-160D, Environmental Conditions and Test Procedures for Airborne Equipment, July 29, 1997,
70) Rzepka, William E., A Requirements Engineering Testbed: Concept, Status, and First Results. In Bruce D. Shriver (editor), Proceedings of the Twenty-Second Annual Hawaii International Conference on System Sciences, IEEE Computer Society, pp. 339-347, 1989.
71) Smith, L. Six Sigma and the Evolution of Quality in Product Development, SixSigma Forum Magazine, 2001, http://www.qualityprogress.asq.org/pub/sixsigma/past/vol1_issue1/ssfmv1i1smith.pdf
72) Söderman, M., Tools for Creating Understanding and an Integrated Dialogue in the Early Stages of Product Design, Proceedings of the 2nd International Conference on Engineering Design and Automation, Maui, HI. August 9 – 12, 1998.
73) Stagney, David B., The Integrated Concurrent Enterprise, MS Thesis in Aeronautics and Astronautics and in Management, MIT, September 2003
74) Steward, Donald V. The Design Structure System: A Method for Managing the Design of Complex Systems, IEEE Transactions on Engineering Management 28.3: 71-74, 1981.
180
75) Steward, D. and Tate, D., Integration of Axiomatic Design and Project Planning, Proceedings of ICAD2000, First International Conference on Axiomatic Design, MA-June 21-23, 2000.
76) Suh, Nam Pyo, The Principles of Design, Oxford University Press, Inc., 1990.
77) Suh, Nam Pyo, Axiomatic Design: Advances and Applications, Oxford University Press, Inc., 2001.
78) Sullivan, L.P., Quality Function Deployment, Quality Progress, June 1986, pp 39-50.
79) Sun, J., Han, B., Ekwaro-Osire, S., and Zhang, H.-C., Design-for-Environment: Methodologies, Tools, and Implementation, Integrated Design and Process Technology, 2003, Austin, Texas, pp. 375-386.
80) Taguchi, G., Introduction to Quality Engineering. Nordica International Limited, Hong Kong, 1986.
81) Tate, Derrick, 1999, A Roadmap for Decomposition: Activities, Theories, and Tools for System Design, Ph.D. Dissertation, Mechanical Engineering Department, MIT, Cambridge, MA. February, 1999.
82) Tate, D. and Nordlund, M., Synergies between American and European Approaches to Design, Proceeding of the 1st World Conference on Integrated Design and Process Technology (IDPT), Austin, TX, pp. 103-111, Dec. 7-9, 1995.
83) Tate, D. and Nordlund, M., A Design Process Roadmap as a General Tool for Structuring and Supporting Design Activities, Proceeding of the 2nd World Conference on Integrated Design and Process Technology (IDPT-Vol. 3), Society for Design and Process Science, Austin, TX, pp. 97-104, Dec. 1-4, 1996.
84) Trewn, J. and Yang, K., A Treatise on System Reliability and Design Complexity, Proceedings of ICAD2000, First International Conference on Axiomatic Design, Cambridge, MA, 2000, pp. 162-168.
85) Ulrich, Karl T. and Eppinger Steven D., Product Design and Development, Second Edition, 2000, McGraw-Hill, Inc.
86) Ulrich, K., The role of product architecture in the manufacturing firm, Research Policy, Vol. 24, pp. 265-293, 1993
87) Ullman, David G., The Mechanical Design Process, 1992, McGraw-Hill, Inc.
88) VDI, 1987, Design Handbook 2221: Systematic Approach to the Design of Technical Systems and Products (translation of German edition), Verein Deutscher Ingenieure Verlag, Dusseldorf.
89) Voland, Gerard, Engineering by Design, Second Edition, 2004, Pearson Prentice Hall.
90) Walker, J. M. and Boothroyd, G., Product Development, in J. M. Walker (Ed.), Handbook of Manufacturing Engineering, New York, Marcel Decker, 1996.
181
91) Wall, S. D., Smith, D. B., and Koenig, L. J., Team Structures and Processes in the Design of Space Missions, Proceedings of the IEEE Aerospace Conference, 1999. Volume: 2, 6-13 March 1999, Page(s): 35 -42.
92) Wanyama, W., Ertas, A., Zhang, H.-C., and Ekwaro-Osire, S., Life-cycle engineering: issues, tools and research, International Journal of Computer Integrated Manufacturing, Volume 16, Numbers 4-5 / July-September 2003.
93) Yoshioka, Masaharu, Knowledge Intensive Engineering Framework Manual, Tomiyama Lab, National Center for Science Information Systems, The University of Tokyo, January 12, 2000.
182
APPENDIX A
NEW THEOREMS
T1: Create system FR/DP/SC triplet: Some of the CNs may not be stated in terms of
highest level needs and, thus, they correspond to lower level FRs or DPs. Therefore, once
the CNs are mapped to FRis and ICs, the main objective of the system, system FR,
should be developed, the top level design concept, system DP, and the physical system,
system (SC1), should be proposed. The design decomposition and zigzagging should
start from the system FR/DP/SC triplet.
T2: Initial FRs: Since the initial FRis can be at different levels of detail, they should be
mapped to the FR/DP hierarchy during the decomposition process where appropriate.
T3: Verifiable and Attainable FRs: Requirements should be verifiable and attainable
by themselves or should be decomposed into verifiable and attainable requirements.
T4: Multi FR – single SC: If multiple FRs are allocated to a single SC, it has to be
ensured that the FRs are not conflicting in time and space and the FR can satisfy them.
T5: FR-IC distinction: requirements are the desired functions that the product is
expected to provide whereas the constraints are the restrictions that the product must
comply while providing the desired functions
T6: Performance IC: To incorporate the performance constraints, a sub FR should be
created for the DPs that this IC is allocated to.
T7: Allocate ICs to system DP: The ICs that are derived from the CNs are first allocated
to the system DP, and then during the decomposition, the ICs are decomposed, if
necessary, and allocated to the lower level DPs.
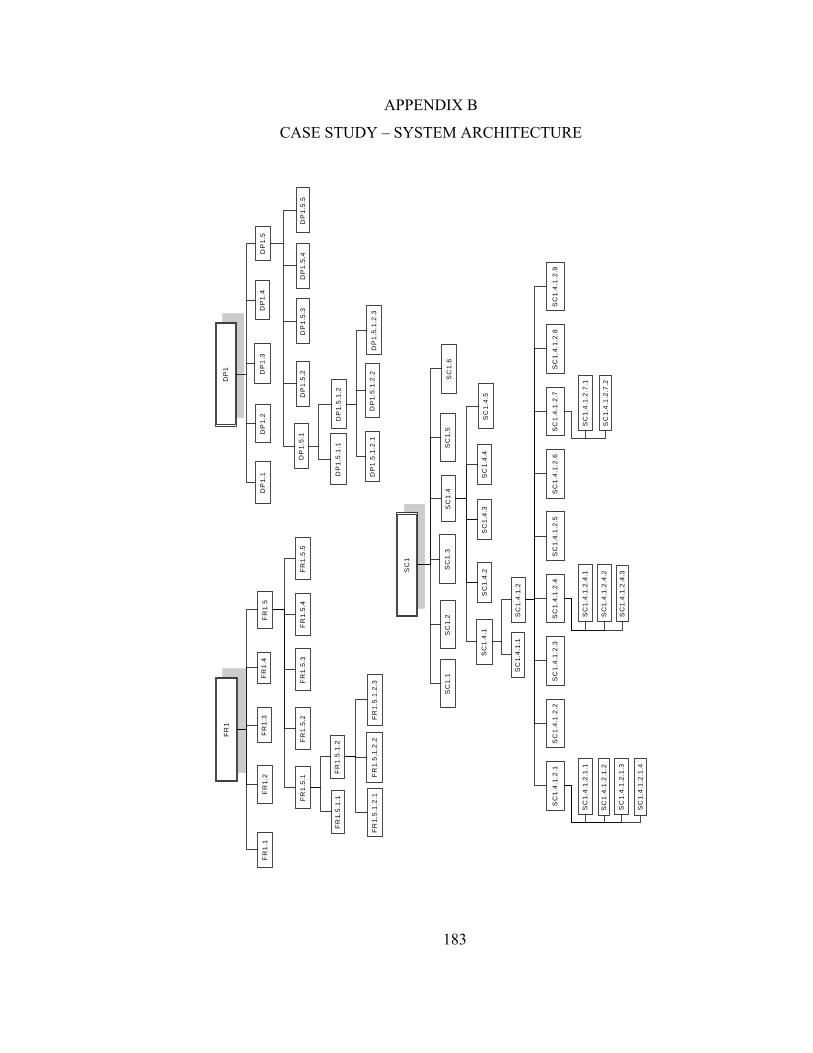
183
APPENDIX B
CASE STUDY – SYSTEM ARCHITECTURE
FR
1
FR
1.1
FR
1.2
FR
1.3
FR
1.4
FR
1.5
FR
1.5.
1F
R1.
5.2
FR
1.5.
3F
R1.
5.4
FR
1.5.
5
FR
1.5.
1.1
FR
1.5.
1.2
FR
1.5.
1.2.
1F
R1.
5.1.
2.2
FR
1.5.
1.2.
3
DP
1
DP
1.1
DP
1.2
DP
1.3
DP
1.4
DP
1.5
DP
1.5.
1D
P1.
5.2
DP
1.5.
3D
P1.
5.4
DP
1.5.
5
DP
1.5.
1.1
DP
1.5.
1.2
DP
1.5.
1.2.
1D
P1.
5.1.
2.2
DP
1.5.
1.2.
3
SC
1
SC
1.1
SC
1.2
SC
1.3
SC
1.4
SC
1.5
SC
1.4.
1S
C1.
4.2
SC
1.4.
3S
C1.
4.4
SC
1.4.
5
SC
1.4.
1.1
SC
1.4.
1.2
SC
1.4.
1.2.
1
SC
1.6
SC
1.4.
1.2.
2S
C1.
4.1.
2.3
SC
1.4.
1.2.
4S
C1.
4.1.
2.5
SC
1.4.
1.2.
6S
C1.
4.1.
2.7
SC
1.4.
1.2.
8S
C1.
4.1.
2.9
SC
1.4.
1.2.
1.1
SC
1.4.
1.2.
1.2
SC
1.4.
1.2.
1.3
SC
1.4.
1.2.
1.4
SC
1.4.
1.2.
4.1
SC
1.4.
1.2.
4.2
SC
1.4.
1.2.
4.3
SC
1.4.
1.2.
7.1
SC
1.4.
1.2.
7.2
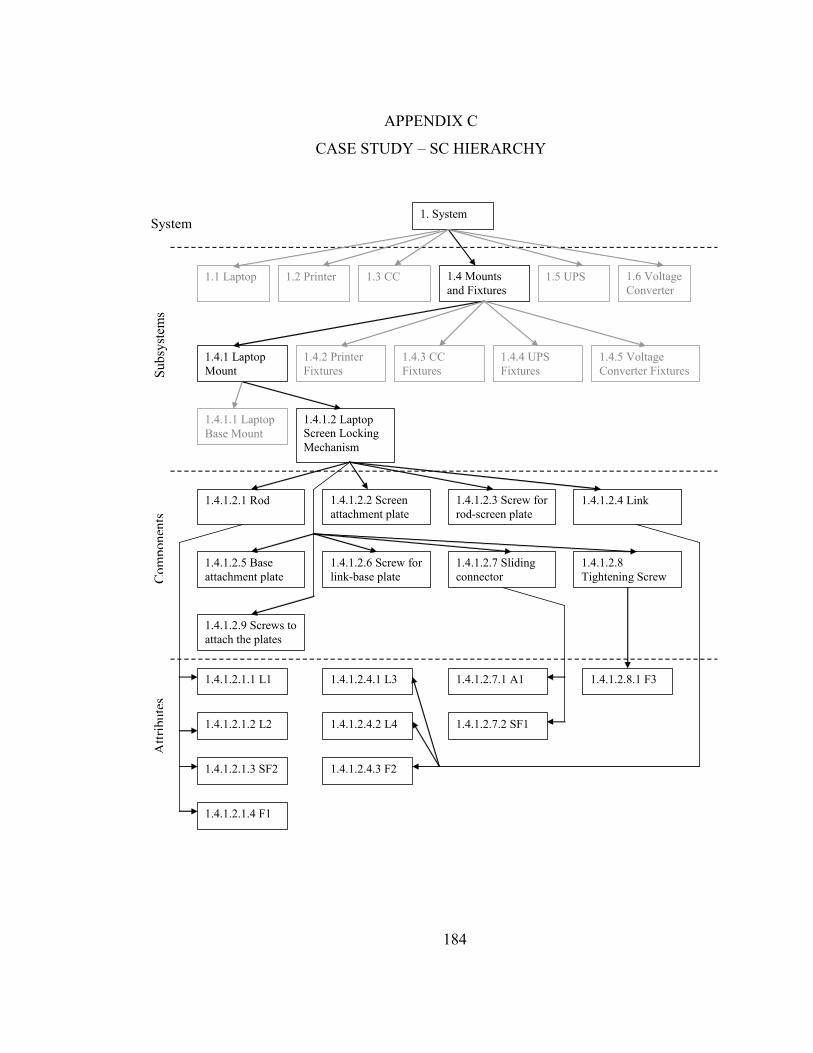
184
APPENDIX C
CASE STUDY – SC HIERARCHY
1.4.1.2.8.1 F3
1. System
1.1 Laptop 1.3 CC 1.2 Printer 1.4 Mounts and Fixtures
1.5 UPS 1.6 Voltage Converter
1.4.1 Laptop Mount
1.4.2 Printer Fixtures
1.4.3 CC Fixtures
1.4.4 UPS Fixtures
1.4.5 Voltage Converter Fixtures
1.4.1.1 Laptop Base Mount
1.4.1.2 Laptop Screen Locking Mechanism
1.4.1.2.1 Rod 1.4.1.2.2 Screen attachment plate
1.4.1.2.3 Screw for rod-screen plate
1.4.1.2.4 Link
1.4.1.2.5 Base attachment plate
1.4.1.2.6 Screw for link-base plate
1.4.1.2.7 Sliding connector
System
Subs
yste
ms
Com
pone
nts
Attr
ibut
es
1.4.1.2.8 Tightening Screw
1.4.1.2.9 Screws to attach the plates
1.4.1.2.1.1 L1
1.4.1.2.1.2 L2
1.4.1.2.1.3 SF2
1.4.1.2.1.4 F1
1.4.1.2.4.1 L3
1.4.1.2.4.2 L4
1.4.1.2.4.3 F2
1.4.1.2.7.1 A1
1.4.1.2.7.2 SF1