GUJARAT ALKALIES AND CHEMICALS LIMITED - · PDF fileMaharashtra, Goa & Andhra Pradesh ......
22
1 GUJARAT ALKALIES AND CHEMICALS LIMITED Regd. Office : P.O.PETROCHEMICLAS : 391346 DIST. VADODARA, GUJARAT. www.gacl.com
Transcript of GUJARAT ALKALIES AND CHEMICALS LIMITED - · PDF fileMaharashtra, Goa & Andhra Pradesh ......
11
GUJARAT ALKALIES AND CHEMICALS LIMITED
Regd. Office : P.O.PETROCHEMICLAS : 391346
DIST. VADODARA, GUJARAT.
www.gacl.com

2
Board of DirectorsBoard of Directors
Dr. J N Singh, IAS, Chairman
Shri P K Taneja, IAS, Director
Shri Anil Mukim, IAS, Director
Shri J N Godbole, Independent Director
Dr. Rajiv I Modi, Independent Director
Mrs. Pallavi Shroff, Independent Director
Shri Rajiv Lochan Jain, Independent Director
Shri P K Gera, IAS, Managing Director

333
Shareholding Pattern as on 31st December, 2016
Sr.
No.Name No. of Shares
% of Total Share Capital
1 Promoters (7 promoters) 3,39,86,310 46.28
2Domestic Institutional
Investors (DIIs)31,99,257 4.36
3Foreign Institutional Investors
(FIIs)22,69,596 3.09
4 Bodies Corporate 2,06,06,795 28.06
5 Others 1,33,74,970 18.21
Total 7,34,36,928 100.00

4
GACL- Basic details
� Two complexes
� Vadodara, started in 1976
� Dahej, started in 1995
� Major products in Vadodara
� Caustic soda, Caustic Potash, Hydrogen Peroxide, Chloromethanes, Sodium Cyanide
� Major products in Dahej
� Caustic soda, Hydrogen Peroxide, Phosphoric Acid, Poly Aluminium Chloride, Anhydrous Aluminium Chloride, Sodium Chlorate
� Other investments
� GIPCL, GCPTCL, Gujarat Guardian Ltd., Bhavnagar Energy Company Ltd. and GACL-NALCO Alkalies & Chemicals Pvt. Ltd (JV Company by GACL 60% & NALCO 40%).
4

5
GACL- Basic details
5
� Toll manufacturing
� Chlorinated Paraffin (CPW)
� Anhydrous Aluminium Chloride (ALC)
� Chlorinated Toluene
� Benzyl Chloride
� Benzyl Alcohol
� Benzyldehyde
� 156.75 MW Wind Farms. Being increased to 171.45 MW by March 2017.
� Started transporting Caustic Soda Lye under multimodal logistics - through
Railway Racks as well as through Sea to Eastern & Central India, since Dec.'2014.
� Stock point already started in Uttar Pradesh and proposed in the states like
Maharashtra, Goa & Andhra Pradesh for making competitive presence in distant
markets.
6
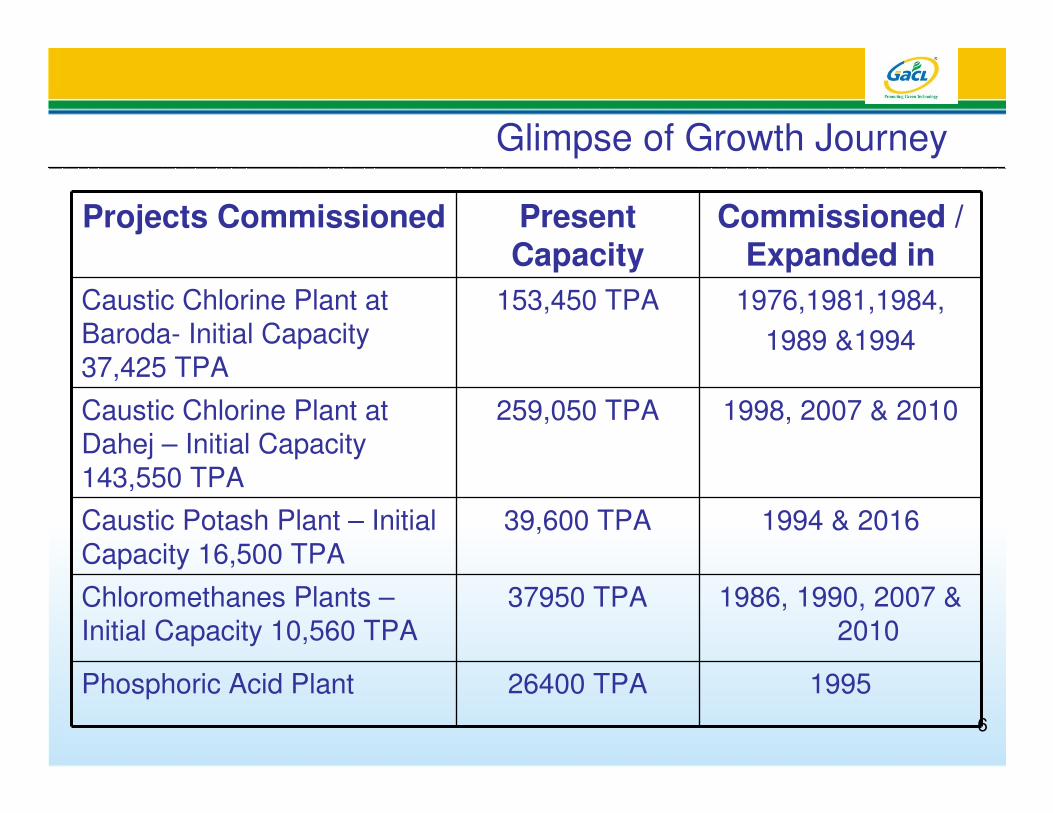
Glimpse of Growth Journey
Projects Commissioned Present Capacity
Commissioned / Expanded in
Caustic Chlorine Plant at
Baroda- Initial Capacity
37,425 TPA
153,450 TPA 1976,1981,1984,
1989 &1994
Caustic Chlorine Plant at
Dahej – Initial Capacity
143,550 TPA
259,050 TPA 1998, 2007 & 2010
Caustic Potash Plant – Initial
Capacity 16,500 TPA
39,600 TPA 1994 & 2016
Chloromethanes Plants –
Initial Capacity 10,560 TPA
37950 TPA 1986, 1990, 2007 &
2010
Phosphoric Acid Plant 26400 TPA 1995

77
Glimpse of Growth Journey
Projects Commissioned Present Capacity Commissioned in
Hydrogen Peroxide Plant –
Initial Capacity 10,890 TPA
39080 TPA 1996, 2002, 2007
2010, 2011, 2012
& 2014
PAC Poly Aluminium Chloride 41250 TPA
(PAC – 18)
2006, 2008
Stable Bleaching Powder 15000 TPA 2011
Wind Mill Projects (Various locations)
156.75 MW 2008-2016
Anhydrous Aluminium Chloride – Initial Capacity 16,500
26325 TPA 2008, 2010 & 2016
Sodium Chlorate Project 20000 TPA 2014

8
Sr.
No. Particulars
2016-17 (upto Q3)
2015-16 2014-15 2013-14 2012-13
1 TOTAL INCOME 1,578.33 2,012.32 1,997.07 1,926.33 1,833.31
2 PROFIT BEFORE TAX (PBT) 289.65 265.09 215.48 246.55 336.83
3 PROFIT AFTER TAX (PAT) 221.00 221.67 227.86 185.03 235.35
4LOANS OUTSTANDING AS AT 31ST
MARCH399.27 295.94 161.57 219.80 268.55
Rs. in Crore
Financial Details Financial Details
Production Volume 2015-16
3.84925
1.3648
3.4122
3.55921
0 1 2 3 4 5
Caustic Soda Lye
Caustic Soda Flakes
/ Prills
Hydorchloric Acid
Chlorine Gas
Lakh MT
99
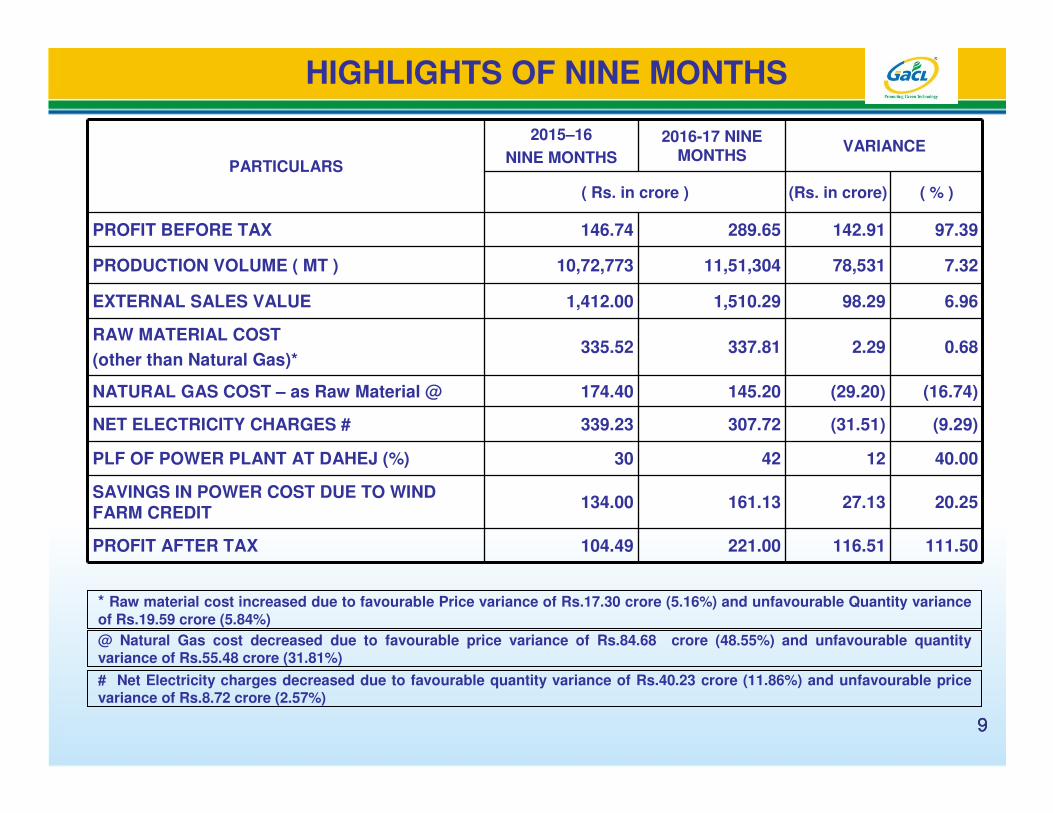
HIGHLIGHTS OF NINE MONTHS
PARTICULARS
2015–16
NINE MONTHS
2016-17 NINE MONTHS
VARIANCE
( Rs. in crore ) (Rs. in crore) ( % )
PROFIT BEFORE TAX 146.74 289.65 142.91 97.39
PRODUCTION VOLUME ( MT ) 10,72,773 11,51,304 78,531 7.32
EXTERNAL SALES VALUE 1,412.00 1,510.29 98.29 6.96
RAW MATERIAL COST
(other than Natural Gas)*335.52 337.81 2.29 0.68
NATURAL GAS COST – as Raw Material @ 174.40 145.20 (29.20) (16.74)
NET ELECTRICITY CHARGES # 339.23 307.72 (31.51) (9.29)
PLF OF POWER PLANT AT DAHEJ (%) 30 42 12 40.00
SAVINGS IN POWER COST DUE TO WIND FARM CREDIT
134.00 161.13 27.13 20.25
PROFIT AFTER TAX 104.49 221.00 116.51 111.50
* Raw material cost increased due to favourable Price variance of Rs.17.30 crore (5.16%) and unfavourable Quantity variance
of Rs.19.59 crore (5.84%)
@ Natural Gas cost decreased due to favourable price variance of Rs.84.68 crore (48.55%) and unfavourable quantity variance of Rs.55.48 crore (31.81%)
# Net Electricity charges decreased due to favourable quantity variance of Rs.40.23 crore (11.86%) and unfavourable price variance of Rs.8.72 crore (2.57%)
1010
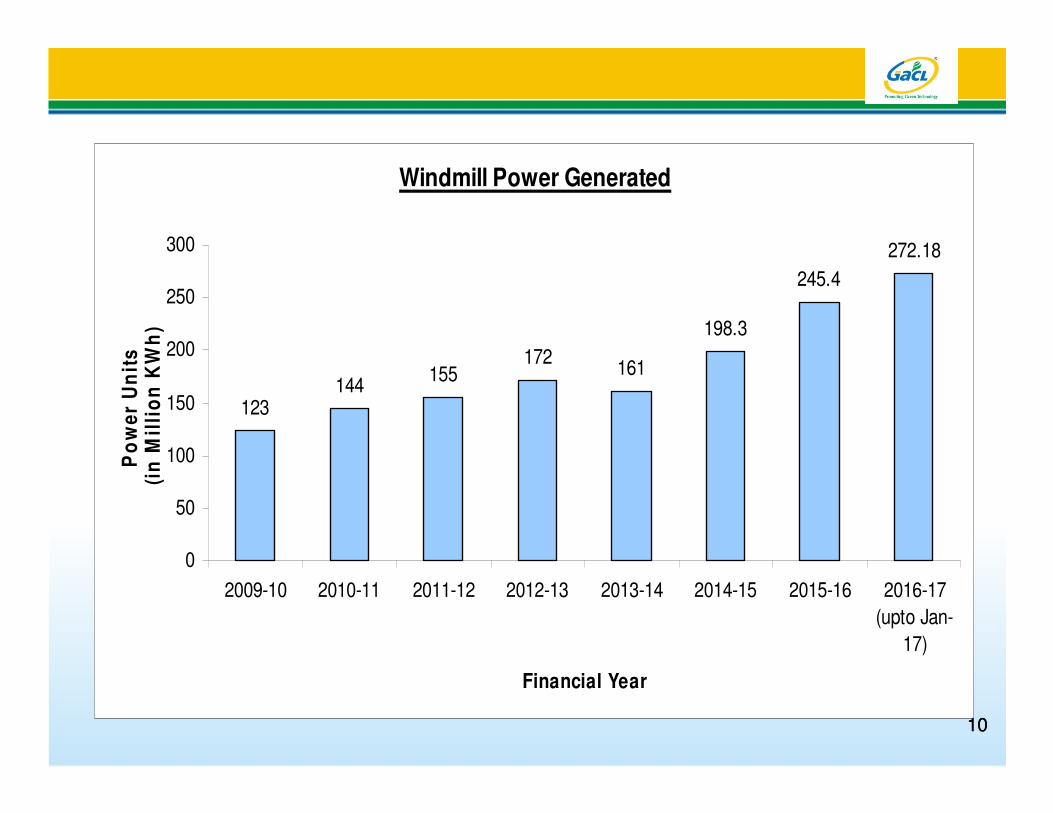
Windmill Power Generated
123144
155172
161
198.3
245.4
272.18
0
50
100
150
200
250
300
2009-10 2010-11 2011-12 2012-13 2013-14 2014-15 2015-16 2016-17
(upto Jan-
17)
Financial Year
Po
we
r U
nit
s (
in M
illi
on
KW
h)

11
Installed Capacity at GACL
PRODUCTS VADODARA DAHEJ TOTAL CAPACITY
Caustic Soda Lye 1,69,950 2,59,050 4,29,000
Caustic Soda Flakes/Prills 53,000 1,65,000 2,18,000
Chloromethanes 37,950 - 37,950
Caustic Potash Lye 18,810 - 18,810
Potassium Carbonate 13,200 - 13,200
Hydrogen Peroxide – 100% 12,540 26,540 39,080
Phosphoric Acid – 85% - 26,400 26,400
Aluminium Chloride (Jobwork/O&M) 10,800 26,300 37,100
Poly Aluminium Chloride - 41,250 41,250
Chlorinated Paraffin (CPW) – (Jobwork) 12,000 - 12,000
Stable Bleaching Powder - 15,000 15,000
Sodium Chlorate - 20,000 20,000
12
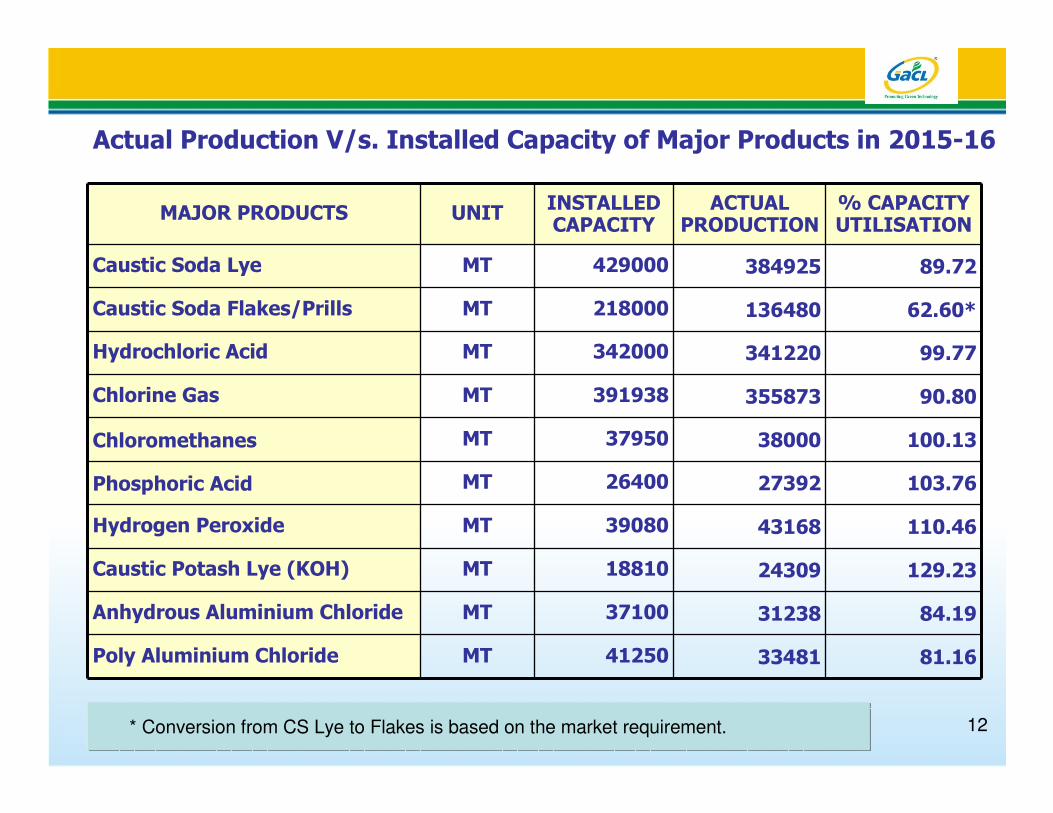
MAJOR PRODUCTS UNITINSTALLED CAPACITY
ACTUAL PRODUCTION
% CAPACITY UTILISATION
Caustic Soda Lye MT 429000 384925 89.72
Caustic Soda Flakes/Prills MT 218000 136480 62.60*
Hydrochloric Acid MT 342000 341220 99.77
Chlorine Gas MT 391938 355873 90.80
Chloromethanes MT 37950 38000 100.13
Phosphoric Acid MT 26400 27392 103.76
Hydrogen Peroxide MT 39080 43168 110.46
Caustic Potash Lye (KOH) MT 18810 24309 129.23
Anhydrous Aluminium Chloride MT 37100 31238 84.19
Poly Aluminium Chloride MT 41250 33481 81.16
Actual Production V/s. Installed Capacity of Major Products in 2015-16
* Conversion from CS Lye to Flakes is based on the market requirement.
13
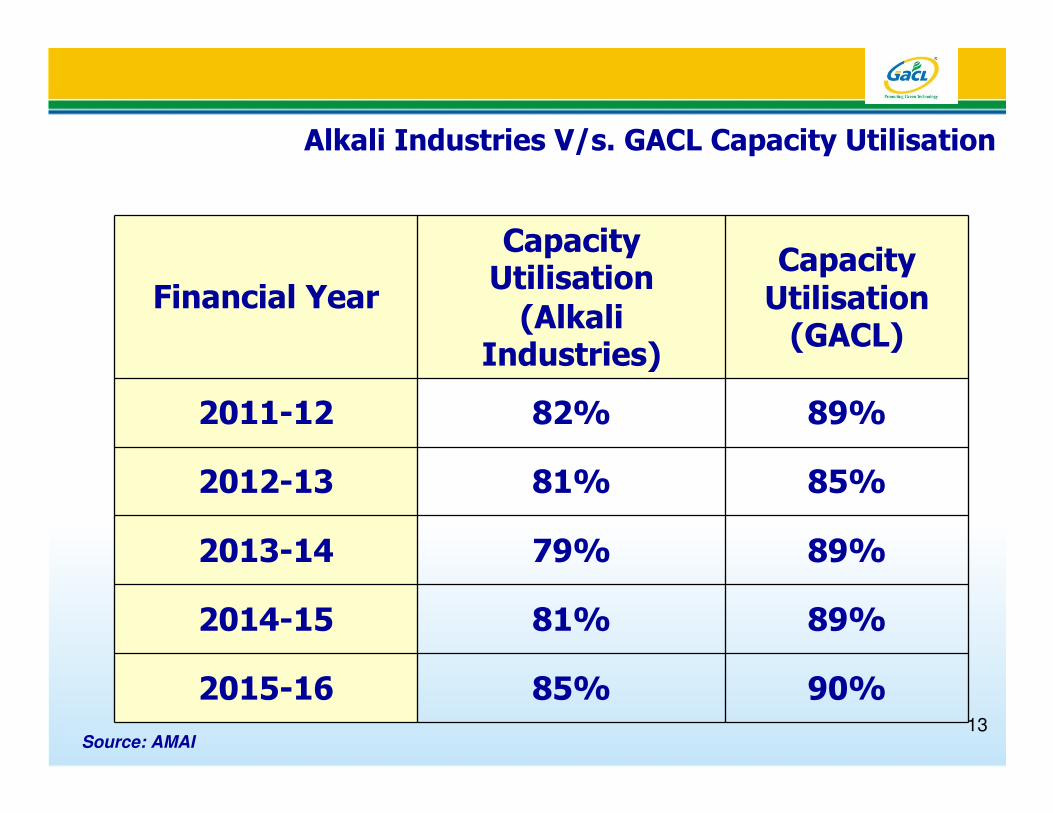
Alkali Industries V/s. GACL Capacity Utilisation
Financial Year
Capacity Utilisation
(Alkali Industries)
Capacity Utilisation
(GACL)
2011-12 82% 89%
2012-13 81% 85%
2013-14 79% 89%
2014-15 81% 89%
2015-16 85% 90%
Source: AMAI

14* Exports include Deemed Export
(Rs. In Lacs)
Export of Major Products
MAJOR PRODUCTS F.Y. 2014-15 F.Y. 2015-16 Till Dec.'2016
Caustic Soda Lye 1,912 2,088 2,339
Caustic Soda Flakes/Prills 7,212 12,090 8,484
Hydrochloric Acid 344 366 281
Liquid Chlorine 78 54 48
Chloromethanes 100 66 20
Phosphoric Acid 90 129 77
Hydrogen Peroxide (50%) 165 341 273
Anhydrous Aluminium Chloride 3,511 3,015 2,786
Poly Aluminium Chloride 493 771 729
Sodium Cyanide 62 75 0
Benzyl Alcohol 1,868 2,116 1,647
Benzyl Chloride 396 253 112
Chlorinate Paraffin (CPW) 310 170 157
TOTAL 16,541 21,534 16,953

15
Presence - India
Base Chemicals -Caustic
Soda/Chlorine
GACL

16
Caustic Soda (Regional distribution)
Regionwise Installed Capacity (MTPA) As On 31.03.2016
South
716,400
21%
North
389,479
12%West
1,899,225
56%
East
364,910
11%
East West North South

17
GACL- Strategic advantages
Land 600 acres for expansion at Dahej
Rail connectivity Across boundary limits at Dahej
Port connectivity GCPTL 4 km from Dahej complex
Dealer network Strong, with best companies
Clean power 171.45 MW wind power (existing & planned)15 MW solar power (planned)
Co-promoted companies GCPTL – Chemical Port
GIPCL – Power Company
BECL – Power Company in Bhavnagar
Product basket Multiple products from basic Chemicals to value added chemicals
Customer proximity Bulk Consumers situated in nearby area17

18
1) Contribution & market share of flagship products
� Ever increasing competition for market share
� Urgent need for expansions
� Highly dependent on a single bulk product i.e. Caustic Soda
� A good product basket but low production capacity of Chlorine
based products
2) Chlorine disposal – major bottleneck
� Additional in-house consumption to improve capacity utilisation
� Future projects must also have an add-on project to consume
chlorine
Major Challenges :

19
- Major Challenges :
19
3) Very high logistics cost
� Bulk commodity products can’t be sustained within 500 kms, if transported by
road,
� Uncompetitive in other distant States,
� Advantages of railway corridor from Dahej and Sea route from GCPTCL are not
used so far, for distribution of various distant places,
� Both plants located in Caustic soda surplus State of Gujarat
4) Optimizing Power cost keeping an eye on the power cost of co-producers
� NG based power plant is costlier than coal based power plants
� Need to look at coal based power plant
� Potential to use the power of BECL, in future
� Focus on Renewable energy to bring down the average price of energy basket

202020
New Expansion Projects
Projects Capacity Cost ( Rs. Crs.) Status
CS New plant with Coal based Power plant
(A JV with NALCO)
800 TPD +
130 MW
2000 Approved by Board.
CLM (New) 300 TPD 683 Approved by Board.
CLM Expansion 60 TPD 120 Under Implementation.
Phosphoric acid (New) 100 TPD 300 Under Implementation
New Hydrogen peroxide Plant
42 TPD 143 Under Implementation
Hydrazine Hydrate 30 TPD 163 Under Implementation
Caustic Potash Expansion 60 TPD 40 Under Implementation
New Wind Farm 14.7 MW 100 Under Implementation
Solar Power Plant 15 MW 100 Under Implementation

21
Chlorine balance at Dahej
Production Dispatch/Consumption
Particulars Capacity (TPD)
Particulars Consumption (TPD)
Existing complex 695 Phosphoric Acid 240
New JV/ Subsidiary 710 Aluminium Chloride 75
Chloromethanes(new)
315
Other Captive use 100
Long Term Supply Contract
345
Net Merchant Sale 330
Total 1405 Grand Total 1405

22
THANK YOUTHANK YOU
•• Disclaimer :Disclaimer :
• The information herein is solely for informational purpose and may not be used or considered as an offer document or solicitation of offer to buy or sell or subscribe for securities or other financial instruments of the Company. The information contained herein is strictly confidential and meant solely for the selected recipient and may not be altered in any way, transmitted to, copied or distributed, in part or in whole, to any other person or to the media or reproduced in any form, without prior written consent of the Company.
• This presentation contains forward-looking statements which may be identified by their use of words contains “plans,” “expects,” “will,” “anticipates,” “believes,” “intends,” “projects,” “estimates”or other words of similar meaning. All statements that address expectations or projections about the future, including, but not limited to, statements about the strategy for growth, product development, market position, expenditures, and financial results, are forward-looking statements.
• Forward-looking statements are based on certain assumptions and expectations of future events. The Company cannot guarantee that these assumptions and expectations are accurate or will be realised. The actual results, performance or achievements, could thus differ materially from those projected in any such forward-looking statements. The Company assume no responsibility to publicly amend, modify or revise any forward looking statements, on the basis of any subsequent developments, information or events, or otherwise.