GUIDELINES ON THE DEFINTION AND MONITORING OF EXTREME ... · 31 Definition of Extreme Weather and...
62
GUIDELINES ON THE DEFINTION AND MONITORING OF EXTREME WEATHER AND CLIMATE EVENTS DRAFT VERSION – FIRST REVIEW BY TT-DEWCE DECEMBER 2015 TT-DEWCE WMO 4/14/2016
Transcript of GUIDELINES ON THE DEFINTION AND MONITORING OF EXTREME ... · 31 Definition of Extreme Weather and...

1
2
3
4
GUIDELINES ON THE DEFINTION AND MONITORING OF EXTREME WEATHER AND CLIMATE EVENTS
DRAFT VERSION – FIRST REVIEW BY TT-DEWCE DECEMBER 2015
TT-DEWCE WMO
4/14/2016

GUIDELINES ON THE DEFINTION AND MONITORING OF EXTREME WEATHER AND CLIMATE EVENTS
1 | P a g e
1. Introduction 5
6
Climate encapsulates the description of how the atmosphere behaves over a long period of time 7
(typically defined as a 30-year period), informing us on the “average of weather”, as well as the 8
description of other aspects of weather patterns and parameters distribution, including 9
anomalous, rare and extreme weather events. Some examples of extreme events include, but are 10
not limited to, heat waves, cold waves, floods, heavy precipitations, drought, tornadoes, and 11
tropical cyclones. Even though extreme events do not occur often, they can be harmful to our 12
heath, can cause great devastation to infrastructures, can affect our economy, and can even cause 13
the loss of life (IPCC 2012). It is therefore necessary for Meteorological communities to improve 14
the understanding and characterization of extreme weather and climate events in time and space 15
with consistent methodologies for their definition and the computation of their thresholds, so that 16
efficient systems for monitoring and forecasting these events can be deployed as part of building 17
resilient societies coping with climate variability and adapting to climate change. 18
19
As climate differs from location to location, the definition of an extreme event (weather or 20
climate) and its threshold also differ from location to location. In other words, what is considered 21
an extreme value of a given climate element in one location can be considered as being within 22
the normal range in a different location. In addition to natural reasons, there are also practical 23
reasons for the varying definitions; for example the need to focus on a particular sector of 24
applications that requires specific thresholds to take actions. This is the case, for example, in 25
defining heat-waves in a heat-health warning system for which a heat wave can be described 26
specifically according to the potential impacts on human health. 27
28
In its attempt to provide guidance on best practices in the domain of weather and climate 29
extremes, the WMO Commission for Climatology (CCl) established a Task Team on the 30
Definition of Extreme Weather and Climate Events (TT-DEWCE) back in 2010. The Task Team 31
based its work on reviewing the existing literatures in the subject. The summary focuses on 32
extreme events that are derived from Temperature and Precipitation, in particular the following 33
type of events: Heat Waves, Cold Waves, Heavy Precipitation, Wet Spells, Drought, and Dry 34
Spells. In addition to the review of the literatures, the Task Team surveyed the National 35
Meteorological and Hydrological Services (NMHSs) to assess the current status of practices in 36
defining and monitoring these types of extreme events. 37
38
In addition, meteorological hazards, which are not listed in the above survey, but which usually 39
occur as part of changing weather conditions, can also induce high impacts, such as hail storms, 40
sand storms, dust storms, wind storms, snow storms, among others are also considered in chapter 41
IV. The goal is to list the existing definitions of hazards and develop their catalogue for easy 42
reference in the process of establishing and operating Multi-Hazards Early Warning Systems as 43
GUIDELINES ON THE DEFINTION AND MONITORING OF EXTREME WEATHER AND CLIMATE EVENTS
2 | P a g e
well as to contribute in the efforts of assessing loss and damages which are hydro-meteorological 44
related. 45
46
This document will inform on the scientific and technical background, as well as provide 47
guidelines to define and characterize extreme weather and climate events and will provide some 48
examples that were provided through the country survey. 49
2. Scientific and Technical Background 50
51
2.1 Review of Existing Literature on Extreme Weather and Climate Events (EWCEs) 52
53
Analysis at a global scale for a given extreme—such as heat waves, cold waves, heavy 54
precipitation—may be particularly problematic because of, in various parts of the globe, lack of 55
high-quality daily observation records covering multiple decades that are part of integrated data 56
sets. Likely as a partial result of this, the Intergovernmental Panel on Climate Change (IPCC 57
2007, 2013) has noted that for many regions of the world it is not yet possible to make firm 58
assessments of how global warming has affected extremes. Existing literaturesconcerning 59
extremes mainly addressed related issues from the following perspectives: 60
a) Basic descriptive variables 61
Early studies for extremes simply consider maximum/minimum temperature and total cumulative 62
precipitation at a given time scale (e.g. daily, monthly, seasonal and annual). (e.g. Karl et al. 63
1993, Karl and Knight 1998, Zhai et al. 2005). Such simple analysis fails to capture the high and 64
low tails (i.e., “extremes”) of the distribution. 65
66
b) Derived variables 67
Derived values of precipitation and temperature have also been used in scientific evaluation. 68
Diurnal Temperature Range (DTR, the difference between maximum and minimum temperature) 69
is one of the illustrating derived variables used in climatic extremes research. Precipitation 70
intensity (precipitation per unit of time, e.g., mm/day) is one of the more common derived 71
variables used in climatic extremes research involving precipitation variability (e.g., Mason et al. 72
1999). Another derived variable involves computing peaks in specific precipitation events over 73
the values of mean precipitation. Acero et al. (2011) used a statistical approach to analyze such 74
data in their study of extreme rainfall over the Iberian Peninsula 75
76
77
c) Threshold categorization 78
A simple method is to establish specific threshold for temperature and extreme precipitation 79
events and evaluate the extremes that occur over (or under) that given threshold. For example, 80
Dash and Mamgain (2011) categorized heat waves and cold spells in India using thresholds with 81
GUIDELINES ON THE DEFINTION AND MONITORING OF EXTREME WEATHER AND CLIMATE EVENTS
3 | P a g e
daily maximum temperatures over 40ºC (heat waves) and wind chill effective minimum 82
temperatures less than or equal to 10ºC, respectively. Another common mean of ascertaining 83
thresholds is based on selecting the tail of distributions for temperature and precipitation. 84
Statistical partitions such as by quartiles or percentiles of the distribution have provided a means 85
for evaluating extremes. Heat waves, for example, have been defined as “temperatures above the 86
90th percentile, persisting for three or more days” for a heat wave study for southern Australia 87
(Pezza et al. 2012). For precipitation, other segregations have used variant distributions other 88
than a standard ‘normal’ distribution to base classification schemes. For example, some 89
researchers have employed a generalized extreme value (GEV) distribution or a Pareto 90
distribution to approximate precipitation distributions. 91
92
d) Human perspective of extremes 93
In terms of heat waves, considering human perception through derived indices that include other 94
variables than simply temperature (e.g. humidity) becomes another means of analysis. For 95
example, Metzger et al. (2010) used a Forecast Heat Index in excess of 95ºF (35ºC) to evaluate 96
summer heat waves for New York City. Willett and Sherwood (2012) employed a wet bulb globe 97
temperature above 35°C as their threshold in their study of heat waves. 98
99
e) Hydrological/agriculture 100
Hydrologists and engineers often employ a probability recurrence interval as a means of 101
classifying extreme precipitation events. Such “return period” analyses have also been employed 102
by climatologists (e.g., Kunkel et al. 1999, Kharin et al. 2007) as a means of establishing trends 103
and variations in extreme precipitation occurrence. 104
f) Derived indices 105
A new set of indices have gained prominence over the last decade in the study of climate 106
extremes. The set of indices used in this analysis are based on the 27 indices of temperature and 107
precipitation from daily data formulated and internationally coordinated by the joint 108
CCl/WCRP/JCOMM Expert Team on Climate Change Detection and Indices (ETCCDI) (WMO-109
TD. No 1500, 2009).Many ETCCDI indices are based on percentiles with thresholds set to assess 110
moderate extremes that typically occur a few times every year rather than high impact, once-in-111
a-decade weather events. 112
113
In particular, in the study of heat waves, two of the most popular indices have been the Warm 114
(Cold) spell duration index (WSDI / CSDI): Annual count of days with at least 6 consecutive 115
days when the maximum (minimum) temperature is in the 90th
(10th
) percentile (5-day window) 116
of a base period. An issue with such definitions is that the criteria can be met in any season such 117
that a “heat (cold) spell” can be defined in the winter (summer). They also have limited global 118
utility, as runs of 6 or more consecutive days above the 90th (or below the 10th) percentile are 119
rare or unknown in many climates (Alexander et al. [2006]). 120

GUIDELINES ON THE DEFINTION AND MONITORING OF EXTREME WEATHER AND CLIMATE EVENTS
4 | P a g e
121
g) Basic hydrologic/climatological indices 122
Indices constructed from a combination of soil moisture and climatic parameters have been used 123
in drought assessment for decades. One of the earliest and widely used indices is the Palmer 124
Drought Severity Index (PDSI) that was developed by Wayne Palmer in the 1960s. It employs 125
temperature and rainfall information in a formula to determine dryness. The Palmer Index is 126
most effective in determining long term (with length of several months) drought. Recently, one 127
of the most used drought rainfall indices has been the Standardized Precipitation Index (SPI). 128
SPI is an index based on the probability of recording a given amount of precipitation, and the 129
probabilities are standardized so that an index of zero indicates the median precipitation amount 130
(half of the historical precipitation amounts are below the median, and half are above the 131
median). Please see section 3.4 for additional information on SPI. 132
133
h) Expert interpretation / classification of drought 134
A fundamental problem of all drought indices is that no single index works under all temporal 135
and geographical circumstances (Heim, 2002). Consequently, many countries have undertaken a 136
blend of mathematical (objective) and perception/observational (expert) assessments of drought. 137
As example, the US and North American Drought Monitors (Svoboda et al. 2001) has been very 138
successful in assessing and communicating the state of drought in the US on a weekly basis. The 139
people assessing drought for these regions use a process that synthesizes multiple indices, 140
outlooks and local impacts, into an assessment that best represents current drought conditions. 141
142
In the special report of the IPCC on managing the risks of extreme events and disasters to 143
advance climate change adaptation (IPCC,2012), extremes are understood from the following 144
three general categories: 145
(1) Extremes of atmospheric weather and climate variables 146
An extreme (weather or climate) event is generally defined as the occurrence of a value of a 147
weather or climate variable above (or below) a threshold value near the upper (or lower) ends 148
(‘tails’) of the range of observed values of the variable. Some climate extremes (e.g., droughts, 149
floods) may be the result of an accumulation of weather or climate events that are, individually, 150
not extreme themselves (though their accumulation is extreme). 151
(2) Large-scale phenomena accounting for extremes (e.g., tropical and extratropical cyclones, 152
ENSO [El Niño/La Niña], and monsoons) 153
A weather system such as a tropical cyclone can have an extreme impact, depending on where 154
and when it approaches landfall, even if the specific cyclone is not extreme relative to other 155
tropical cyclones. Conversely, not all extremes necessarily lead to serious impacts. Many 156
weather and climate extremes are the result of natural climate variability (including phenomena 157

GUIDELINES ON THE DEFINTION AND MONITORING OF EXTREME WEATHER AND CLIMATE EVENTS
5 | P a g e
such as El Niño/Southern Oscillation), and natural decadal or multi-decadal variations in the 158
climate provide the backdrop for anthropogenic climate changes. Even if there were no 159
anthropogenic changes in climate, a wide variety of natural weather and climate extremes would 160
still occur. 161
(3) Collateral effects of extremes on the physical environment 162
Weather or climate events, even if not extreme in a statistical sense, can still lead to extreme 163
conditions or impacts, either by crossing a critical threshold in a social, ecological, or physical 164
system, or by occurring simultaneously with other events. Droughts, floods, extreme sea level, 165
waves, storm surges and coastal impacts are typical cases that exert severe impact on the 166
physical environment. Other physical impacts, including cryosphere-related impacts, landslides, 167
and sand and dust storms, can also be included. These extremes are not caused by variations in a 168
single atmospheric weather and climate variable, but are generally the result of specific 169
conditions in several variables, as well as of some surface properties or states. For instance, both 170
floods and droughts are related to precipitation extremes, but are also impacted by other 171
atmospheric and surface conditions. 172
Nevertheless, among climate science communities, extreme weather and climate events tend to 173
be categorized into the following three types, 174
[1] Extremes of a single variable 175
An extreme can be identified when a single climate variable (e.g. precipitation or wind) exceed 176
its specific thresholds, which can be varying percentile-based values, fixed absolute values and 177
return period. Not all extremes necessarily have extreme impacts. Extreme weather or climate 178
event can vary from place to place in an absolute sense (e.g., a hot day in the tropics will have a 179
different temperature than a hot day in the mid-latitudes) and society tends to adapt to its climate 180
historical ranges of the intensity of extremes. 181
[2] Compound (multivariable) extremes 182
Some climate extremes (e.g., droughts, floods) may be the result of an accumulation of moderate 183
weather or climate events (this accumulation being itself extreme). In climate science, compound 184
events can be (1) two or more extreme events occurring simultaneously or successively, (2) 185
combinations of extreme events with underlying conditions that amplify the impact of the events, 186
or (3) combinations of events that are not themselves extremes but lead to an extreme event or 187
impact when combined. The contributing events can be of similar (clustered multiple events) or 188
different type(s). There are several varieties of clustered multiple events. Examples of compound 189
events resulting from events of different types are varied – for instance, high sea level coinciding 190
with tropical cyclone landfall, or cold and dry conditions (e.g., the Mongolian Dzud), or the 191
impact of hot events and droughts on wildfire, or a combined risk of flooding from sea level 192
surges and precipitation-induced high river discharge (Svensson and Jones, 2002; Van den Brink 193

GUIDELINES ON THE DEFINTION AND MONITORING OF EXTREME WEATHER AND CLIMATE EVENTS
6 | P a g e
et al., 2005). Compound events can even result from ‘contrasting extremes’, for example, the 194
projected occurrence of both droughts and heavy precipitation events in future climate in some 195
regions. 196
[3] Weather phenomenon associated with extremes (e.g. thunderstorms and hail) 197
Some extremes may be linked with weather phenomenon, which themselves may be not extreme. 198
For example, sand storm forms in the arid region when strong winds blow loose sand. 199
2.2 WMO and IPCC Terminology 200
Extreme Event: The occurrence of a value of a weather or climate variable above (or below) a 201
threshold value near the upper (or lower) ends of the range of observed values of the variable. In 202
many cases, a weather or climate event with high impact is also deemed as extreme event. In this 203
guideline, frequently occurring high impact weather and climate extremes such as heat wave, 204
cold wave, extreme precipitation and drought are the main focus. 205
Hazard: The potential occurrence of a natural or human-induced physical event that may cause 206
loss of life, injury, or other health impacts, as well as damage and loss to property, infrastructure, 207
livelihoods, service provision, and environmental resources. 208
Climate indices: Are indices derived from measured meteorological parameters that are used to 209
diagnose and describe the state of a climate system. 210
Regional extreme event: an extreme event covers a large space, or many places at the same 211
time period. 212
Early Warning: The set of capacities needed to generate and disseminate timely and 213
meaningful warning information to enable individuals, communities, and organizations 214
threatened by a hazard to prepare and to act appropriately and in sufficient time to reduce the 215
possibility of harm or loss. 216
Climate Prediction: A climate prediction or climate forecast is the result of an attempt to 217
produce a most likely description or estimate of the actual evolution of the climate in the future 218
(e.g., at seasonal, interannual, or long-term time-scales). 219
Climate Watch: A “Climate Watch” can serve as a mechanism to heighten awareness in the user 220
community that a significant climate anomaly (or climate extreme) exists or might develop and 221
that preparedness measures should be initiated. In general, as part of a Climate Watch system, 222
the NMHS would continuously monitor and assess the state of the climate, evaluate available 223
climate forecasts, and, when conditions warrant, issue formal climate watches to alert end users. 224
End users would then be in a position to undertake actions to mitigate the climate-related 225
impacts. 226

GUIDELINES ON THE DEFINTION AND MONITORING OF EXTREME WEATHER AND CLIMATE EVENTS
7 | P a g e
3. Definition and characterization of Extreme Weather and Climate Events 227
3.1. General aspects 228
In developing this guideline, the TT-DEWCE disseminated a survey for WMO Members 229
requesting the information on the definitions and criteria of extreme weather and climate events 230
that are used operationally in their National Meteorological and Hydrological Services. The 231
survey mainly focused on four types of high impact extreme events, namely heat wave, cold 232
wave, drought and heavy precipitation. By the time of writing of this guideline, 53 countries 233
responded to the survey, with very good geographical representation of the continents, and of the 234
climate characteristics, which include countries with tropical wet and dry climate, arid and semi-235
arid climate, continental and subarctic climate. According to their memberships of the Regional 236
Associations (RA), the number of countries which has responded are11 from RA-I, 9 from RA-237
II, 5 from RA-III, 5 from RA-IV, 5 from RA-V, and 18 from RA-VI. 238
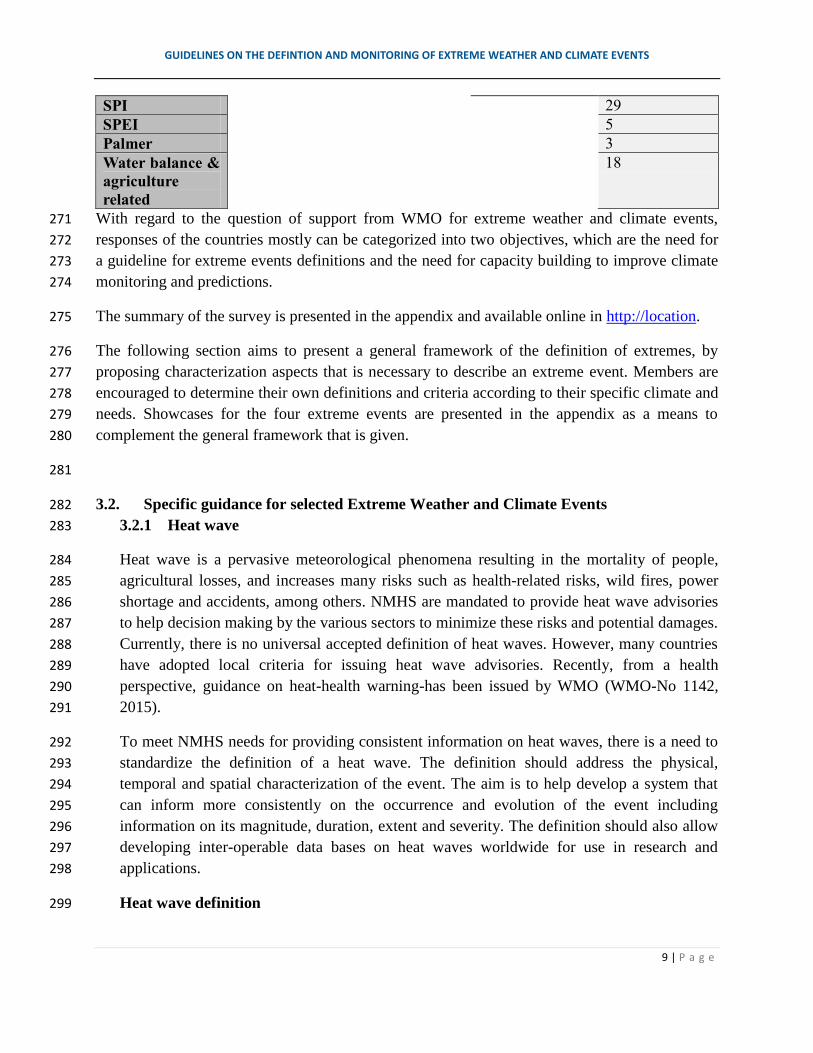
From the 53 countries which responded, 7 of them have no criteria on any of the extreme events. 239
The graph and text below summarizes the number of countries with and without definitions for 240
each extreme event 241
242
For heat wave and cold wave, all countries having tropical climate responded that they have no 243
definition or criteria for those events. the other countries located in the higher latitudes or in the 244
Middle East generally have the following criteria for heat waves: the temperature exceeds a 245
certain threshold (based on absolute value or percentiles) and persist longer than a certain 246
amount of days. In the contrary for cold waves, the criterion is that the temperature is less than a 247
certain threshold and persists longer than a certain amount of days. From the survey, only around 248
65% of the responded countries have criteria on heat wave, and around 50% have criteria on cold 249
spell. Among them, around 60% of countries that responded having criteria for heat wave, used 250
absolute value for the threshold and around 30% uses percentile based thresholds. While for cold 251
0
5
10
15
20
25
30
35
40
45
Heat wave Cold spell Heavyprecipitation
Drought
Countries withoutdefinitions
Countries withdefinitions

GUIDELINES ON THE DEFINTION AND MONITORING OF EXTREME WEATHER AND CLIMATE EVENTS
8 | P a g e
spells, around 60% of countries having criteria for cold wave used absolute value for the 252
threshold and around 25% used percentile based threshold. 253
For drought, around 80% of the countries responded that they have criteria and indices for 254
drought. Among those countries which have indices for drought, the majority (around 70%) 255
follow the recommended drought index from WMO which is the Standardized Precipitation 256
Index (SPI). There are several countries which used (combinations of) various indices, besides 257
the SPI, such as the SPEI, the Palmer drought index(SPDI) and expert assessments, and also 258
using hydrological criterion for drought. 259
For heavy precipitation, around 60% of countries responded that they have criteria and indices 260
for heavy precipitation. Around 70% of those countries used criteria for heavy precipitation with 261
absolute value threshold for a certain amount of time (hourly, 3 hours, 6 hours, or daily). Other 262
criterion which is quite commonly used by Member countries is using percentiles as the 263
threshold, for instance the 95th
or the 99th
percentile, which amounts around 30% of the countries 264
which have responded. A small percentage of countries, around 10%,uses return period criteria 265
or based on rainfall distribution consideration. 266
More details on the types of extreme weather and climate indices used by countries are 267
summarized in the table below: 268
269
Table 3.1 Summary of the survey on extremes for WMO Members 270
Event: Heat wave Cold spell Heavy
precipitation
Drought
#countries with
definitions:
34 27 32 42
Absolute value
threshold
20 16 23 1
Percentile based
threshold
11 7 9 10
Extreme Heat
Index (EHI)
5 1
Heat-health
index
3
Temperature
drop
4
Return period /
distribution
based criteria
3
GUIDELINES ON THE DEFINTION AND MONITORING OF EXTREME WEATHER AND CLIMATE EVENTS
9 | P a g e
SPI 29
SPEI 5
Palmer 3
Water balance &
agriculture
related
18
With regard to the question of support from WMO for extreme weather and climate events, 271
responses of the countries mostly can be categorized into two objectives, which are the need for 272
a guideline for extreme events definitions and the need for capacity building to improve climate 273
monitoring and predictions. 274
The summary of the survey is presented in the appendix and available online in http://location. 275
The following section aims to present a general framework of the definition of extremes, by 276
proposing characterization aspects that is necessary to describe an extreme event. Members are 277
encouraged to determine their own definitions and criteria according to their specific climate and 278
needs. Showcases for the four extreme events are presented in the appendix as a means to 279
complement the general framework that is given. 280
281
3.2. Specific guidance for selected Extreme Weather and Climate Events 282
3.2.1 Heat wave 283
Heat wave is a pervasive meteorological phenomena resulting in the mortality of people, 284
agricultural losses, and increases many risks such as health-related risks, wild fires, power 285
shortage and accidents, among others. NMHS are mandated to provide heat wave advisories 286
to help decision making by the various sectors to minimize these risks and potential damages. 287
Currently, there is no universal accepted definition of heat waves. However, many countries 288
have adopted local criteria for issuing heat wave advisories. Recently, from a health 289
perspective, guidance on heat-health warning-has been issued by WMO (WMO-No 1142, 290
2015). 291
To meet NMHS needs for providing consistent information on heat waves, there is a need to 292
standardize the definition of a heat wave. The definition should address the physical, 293
temporal and spatial characterization of the event. The aim is to help develop a system that 294
can inform more consistently on the occurrence and evolution of the event including 295
information on its magnitude, duration, extent and severity. The definition should also allow 296
developing inter-operable data bases on heat waves worldwide for use in research and 297
applications. 298
Heat wave definition 299

GUIDELINES ON THE DEFINTION AND MONITORING OF EXTREME WEATHER AND CLIMATE EVENTS
10 | P a g e
According to WMO’sMeteoterm vocabulary, a heat wave is an extreme weather event with 300
marked warming of the air, or the invasion of very warm air, over a large area; it usually lasts 301
from a few days to a few weeks. In the IPCC glossary, heat wave is a period of abnormally 302
and uncomfortably hot weather. Even though the WMO and IPCC definition describes 303
broadly the event, the definitions are not sufficient in guiding NMHSs to develop practical 304
methodologies and tools for a heat wave monitoring system that would allow comparisons 305
across borders. The WMO TT-DEWCE recommends using a practical and qualitatively 306
oriented definition of a heat wave.A heat wave is defined as follows: 307
A marked unusual hot weather (Max, Min and daily average) over a region 308
persisting at least two consecutive days during the hot period of the year based on 309
local climatological conditions, with thermal conditions recorded above given 310
thresholds. 311
Heat waves differ from warm spells. Similar to heat waves, warm spells are defined as a 312
persistent period of abnormal warm weather. Warm spell can be defined in terms of top 5th 313
or 10th percentile of Tmax of the time of year. It usually occurs during the cold period of the 314
year, not during the climatologically hot period. 315
Recommendation for standard characterization of a heat wave 316
To quantitatively reflect a heat wave event, the definition of heat wave should be 317
complemented by characterization with the following 4 metrics: 318
1. Magnitude: it should be computed based on an index or a set of indices of thermal 319
condition(s) exceeding certain threshold(s). Such thermal index can be as simple as one 320
meteorological element (i.e., Tmax) or as complicated as a combined index by multiple 321
variables such as temperature, humidity or even including wind speed. Threshold reflects 322
the abnormal condition or extremity of the event. Indices, criteria and thresholds should 323
be defined by NMHS at national and sub-national scale, according to its own climate 324
conditions and applications. They should be maintained in an official data base and 325
communicated to WMO. 326
2. Duration: will lead to the computation of the persistence of a heat wave and should be 327
based on recording the starting time and the ending time of the event. 328
3. Severity: is a measure which integrates two aspects of the event, its magnitude, and its 329
persistence. 330
4. Extent: is computed to inform on the geographical area affected and the widespread 331
aspect of the heat wave. 332

GUIDELINES ON THE DEFINTION AND MONITORING OF EXTREME WEATHER AND CLIMATE EVENTS
11 | P a g e
Both, Severity and Extent, should be monitored and communicated to the users to inform on 333
the incurred risks. To practically monitor a heat wave event, the Task Team recommends 334
computing certain values pertinent to these metrics and reflecting the physical, temporal and 335
spatial characterization of a heat wave (see table3). 336
WMO guide on developing warning systems for heat waves 337
Past occurrences of heat waves had significant impacts on several aspects of society. On 338
health sector, mortality and morbidity have increased. Ecosystem services can be affected, as 339
well as increased pressure on infrastructures that support society, such as water, 340
transportation and energy. Recognizing the vast impact of heat waves, especially on the 341
health aspect, the WMO and the WHO have co-published a documenttitledHeatwaves and 342
Health: Guidance on Warning-System Development (WMO-No. 1142). This document 343
describes several key aspects to develop warning systems for heat waves, starting from 344
assessments of heat waves, definitions and methodologies, communication of warnings, 345
intervention strategies, and longer term planning perspectives for managing heat wave events. 346
In supporting one of the Global Framework of Climate Services goals, which is to develop 347
effective climate services for the health sector, this document is aimed to enable and assist 348
NMHSs to develop this sector specific services together with their health related counterpart. 349
GUIDELINES ON THE DEFINTION AND MONITORING OF EXTREME WEATHER AND CLIMATE EVENTS
12 | P a g e
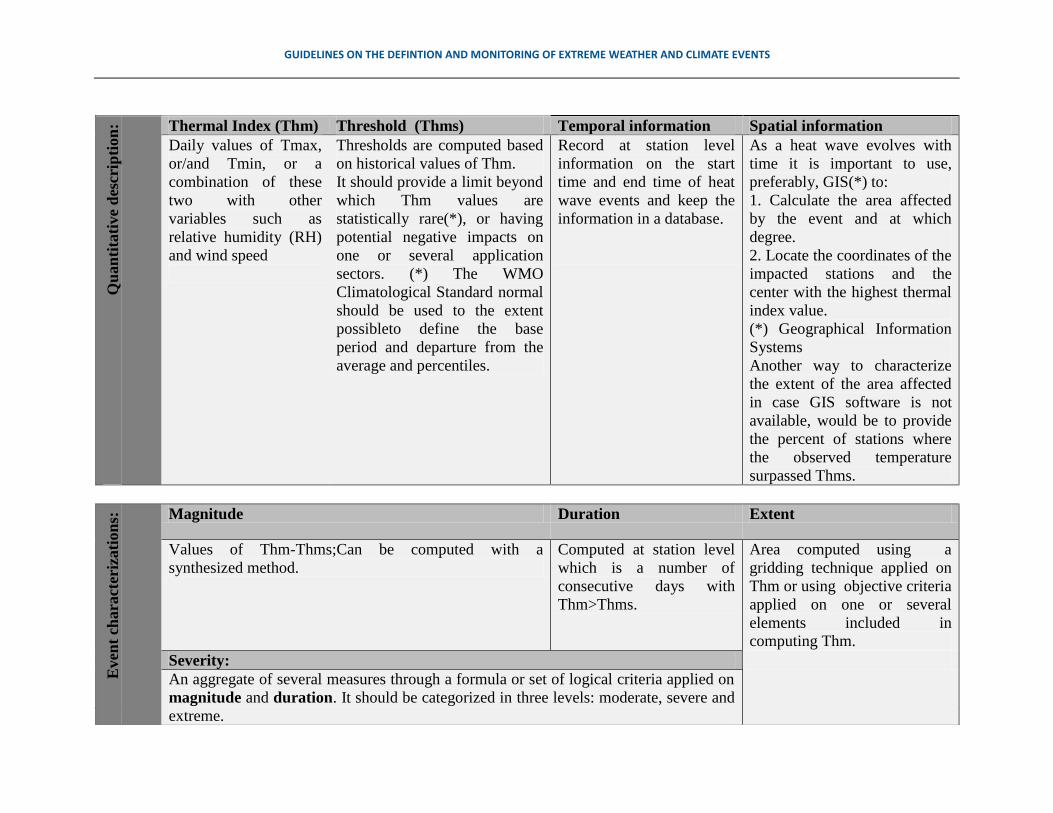
Qu
an
tita
tive
des
crip
tion
: Thermal Index (Thm) Threshold (Thms) Temporal information Spatial information
Daily values of Tmax,
or/and Tmin, or a
combination of these
two with other
variables such as
relative humidity (RH)
and wind speed
Thresholds are computed based
on historical values of Thm.
It should provide a limit beyond
which Thm values are
statistically rare(*), or having
potential negative impacts on
one or several application
sectors. (*) The WMO
Climatological Standard normal
should be used to the extent
possibleto define the base
period and departure from the
average and percentiles.
Record at station level
information on the start
time and end time of heat
wave events and keep the
information in a database.
As a heat wave evolves with
time it is important to use,
preferably, GIS(*) to:
1. Calculate the area affected
by the event and at which
degree.
2. Locate the coordinates of the
impacted stations and the
center with the highest thermal
index value.
(*) Geographical Information
Systems
Another way to characterize
the extent of the area affected
in case GIS software is not
available, would be to provide
the percent of stations where
the observed temperature
surpassed Thms.
Even
t ch
ara
cter
izati
on
s:
Magnitude Duration Extent
Values of Thm-Thms;Can be computed with a
synthesized method.
Computed at station level
which is a number of
consecutive days with
Thm>Thms.
Area computed using a
gridding technique applied on
Thm or using objective criteria
applied on one or several
elements included in
computing Thm.
Severity:
An aggregate of several measures through a formula or set of logical criteria applied on
magnitude and duration. It should be categorized in three levels: moderate, severe and
extreme.

GUIDELINES ON THE DEFINTION AND MONITORING OF EXTREME WEATHER AND CLIMATE EVENTS
13 | P a g e
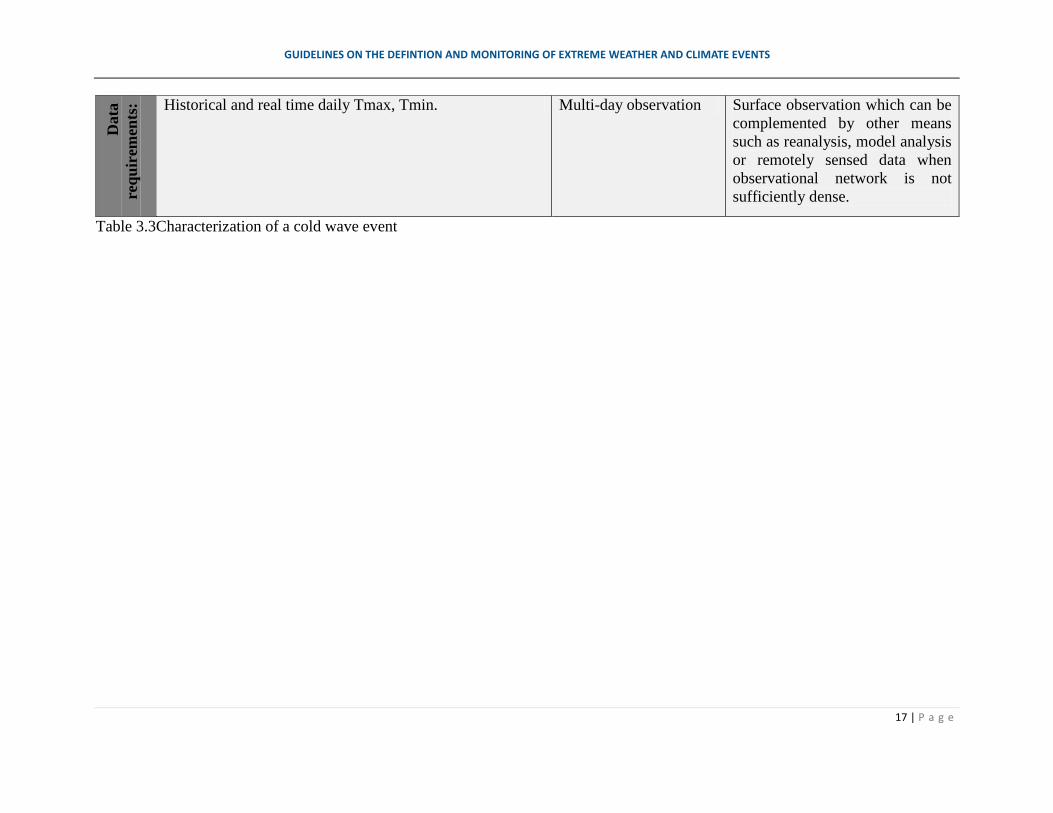
Table 3.2 Characterization of a heat wave event 350
D
ata
req
uir
emen
ts: Historical and real time daily values ofTmax, Tmin, RH,
windspeed and direction
Multi-day observation Multi-station observation
which can be complemented by
other means such as remotely
sensed data when observational
network is not sufficiently
dense.

GUIDELINES ON THE DEFINTION AND MONITORING OF EXTREME WEATHER AND CLIMATE EVENTS
14 | P a g e
3.2.2 Cold wave 351
Cold wave is a meteorological event generally characterized by a sharp drop of air 352
temperature near the surface leading to extremely low values, steep rise of pressure, and 353
strengthening of wind speed, or associated with hazardous weather, like frost and icing. It 354
often causes severe impacts on human health, agriculture and high heating cost, or even 355
resulting in mortality for human beings and livestock. IPCC (2007) noted: cold-waves 356
continue to be a problem in northern latitudes, where very low temperatures can be reached 357
in a few hours and extend over long periods. However,there is still a lack of a clear and 358
consistent definition for cold wave events in the world. Thus, after reviewing the existing 359
definitions in publications and some countries' operational activities, the TT-DEWCE has 360
developed the Guideline for definition and characterization of the cold wave for WMO 361
members. 362
Cold wave definition 363
According to WMO’s Meteoterm vocabulary, a cold wave is "marked cooling of the air, or 364
the invasion of very cold air, over a large area". The U.S. National Weather Service defines a 365
cold wave as a rapid fall in temperature within a 24-hour period, requiring substantially 366
increased protection to agriculture, industry, commerce, and social activities. In China, a cold 367
wave is defined as a dramatic cooling weather process, with large scale cold air from the high 368
latitudes invading the middle and lower latitude regions. Cold waves are also simply defined 369
as persistent extreme low temperature events sustaining specified temperatures below some 370
thresholds over some minimum number of days (Djuro Radinović and Mladjen Ćurić, 2012; 371
Peterson et al, 2013). 372
373
The existing terminology helps provide a broad scope for understanding the subject matter of 374
the phenomena and its underlying physical factors. Therefore the Task Team recommends 375
building on the existing terminology to guide Members on a standard approach for defining 376
cold waves. 377
378
It considers also that it is important for NMHSs to use methods and tools that help 379
objectively characterize a cold wave in space and time with indices that allow recording its 380
start, duration and cessation at the site where it was recorded. In addition it is also important 381
to provide information on the severity and the geographical extent of the event. Both severity 382
and extent are very important information for using in early warnings, risk assessment and 383
climate change research. 384
385
A cold wave is defined in this guideline in general terms as 386
A marked and unusual cold weather characterized by a sharp and significant drop 387
of air temperatures near the surface (Max, Min and daily average) over a large 388

GUIDELINES ON THE DEFINTION AND MONITORING OF EXTREME WEATHER AND CLIMATE EVENTS
15 | P a g e
area and persisting below certain thresholds for at least two consecutive days 389
during the cold season. 390
The thresholds for a cold wave are determined by the rate at which the temperature falls, and 391
the minimum to which it falls. This minimum temperature is dependent on the geographical 392
region and time of year. Typically, a cold wave is associated with invasion of very cold air 393
caused by a polar or high latitude air-mass displacement to lower latitudes, or in some cases 394
associated with or enforced by long radiative cooling during a blocking and clear sky 395
atmospheric circulation. 396
397
Cold waves can also occur during spring and autumn. However, during summer the cooling 398
of the air near the surface that can be caused by atypical seasonal temperature conditions 399
and/or winds can lead to cold spells, which is a period of time during which temperatures 400
drops significantly below the normal conditions. Nevertheless, the Task Team recommends 401
preserving the use of cold wave definition only during the cold season with a certain margin 402
period of time around it. 403
Recommendation for standard characterization of a cold wave 404
To quantitatively reflect a cold wave event, the definition of cold wave should be 405
complemented by characterization with the following 4 metrics: 406
1. Magnitude: it is computed based on an index or a set of indices measuring the 407
temperature drop below certain threshold(s) to measure the intensity of the event. Index 408
and indices are normally used to measure the rate of the temperature dropping or/and the 409
minimum pic values. Thresholds can be an absolute value or percentiles. The magnitude 410
reflects the abnormal cold condition or extremity of the outbreak of the cold event. The 411
detailed indices, criteria and thresholds should be defined by NMHS at national and sub-412
national scale, according to its own climate conditions and applications. They should be 413
maintained in an official data base and communicated to WMO. 414
2. Duration: it will lead to computing the persistence of a cold wave and should be based 415
on recording its starting time and ending time. The starting time of cold wave is marked 416
by the day with sharp drop of temperature below the threshold and extreme cold 417
condition, or only with extreme cold conditions reaching the threshold. When the 418
temperature returns to the degree not satisfying the extreme conditions anymore, the cold 419
wave ends. The time between ending and starting is the duration. 420
3. Severity: is a measure which integrates two aspects of the event: its magnitude and its 421
persistence. 422
4. Extent:is computed to inform on the geographical area affected and the widespread 423
aspect of the cold wave. 424

GUIDELINES ON THE DEFINTION AND MONITORING OF EXTREME WEATHER AND CLIMATE EVENTS
16 | P a g e
Qu
an
tita
tive
des
crip
tion
: Temperature index:
Ti
Threshold
(Ts; or Ts1 and Ts2)
Temporal information Spatial information
Ti1:Computed using
daily values of Tmin,
Tmax and average
temperature.
A separate index Ti2
can be computed using
temperature change in
the last 24 hours.
Computed based on historical
values of the index.
It should provide a limit beyond
which, values are statistically
rare(*), or a certain threshold
value having potential negative
impacts on one or several
application sectors.
(*) The WMO Climatological
Standard normal should be used
to the extent possible to define the
base period and departure from
the average and percentiles.
Persistent at least 2
days.
Record at station level
information on the
starting time, ending
time and duration of
cold wave. Keep the
information in a
database.
As a cold wave evolves with time
it is important to use preferably a
GIS to:
1. Calculate the area affected by
the event and at which degree.
2. Locate the coordinates of the
impact stations and the center
with the peak values of the
indices.
Another way to characterize the
extent of the area affected in case
GIS software is not available,
would be to provide the percent
of stations where the observed
temperature surpassed Ts.
Even
t ch
ara
cter
izati
on
s:
Magnitude Duration Extent
Value of Ti-Ts; or defined by a synthesized method that
could include also the drop rate in the past 24 hours and the
lowest temperature during cold wave process.
Computed at station
level, which is the
number of consecutive
days satisfying the
criteria.
Computed based on multi-station
data with gridding. It is possible
to use model analysis when
observing networks are not dense
(such as with temperature profile
at 1000, 950, 900, 850 mb)
Severity:
An aggregate of several measures through a formula or set of logical criteria applied
on magnitude and duration. It should be categorized in three levels: moderate,
severe and extreme.
GUIDELINES ON THE DEFINTION AND MONITORING OF EXTREME WEATHER AND CLIMATE EVENTS
17 | P a g e
Table 3.3Characterization of a cold wave event
Data
req
uir
emen
ts: Historical and real time daily Tmax, Tmin. Multi-day observation Surface observation which can be
complemented by other means
such as reanalysis, model analysis
or remotely sensed data when
observational network is not
sufficiently dense.

GUIDELINES ON THE DEFINTION AND MONITORING OF EXTREME WEATHER AND CLIMATE EVENTS
18 | P a g e
3.2.3 Extreme precipitation and wet spells 425
The occurrence of heavy precipitation events is a major hazard that has often led to floods, 426
landslides, as well as the loss of human lives and major economic losses. In many regions of 427
the world it is likely that there have been statistically significant increases in the number of 428
heavy precipitation events although it is not uniform in all regions (IPCC 2013). It is also 429
reported that for a range of emission scenarios, the projections until the end of the 21st 430
century indicate that it is likely that events of annual maximum 24-hour precipitation rate 431
having a 1-in-20 year return period(for the baseline period1961-1990) will become a 1-in-5 432
to -15 year event, indicating a trend of more frequent extreme heavy precipitation events 433
(IPCC,2012). 434
There is a strong spatiotemporal inhomogeneity of extreme precipitation since precipitation 435
values as heavy will vary from region to region and will also depend on the season.To 436
provide a consistent general guidance in defining extreme precipitation, some basic 437
parameters, including magnitude (intensity), duration, severity and spatial extent affected, 438
should be included. These parameters should be enabled on multiple time scales of 439
precipitation extremes, such as hourly, daily, and multi-day scales. 440
Extreme precipitation definition 441
Since there are large variations in precipitation patterns throughout the world, it is not 442
possible to define a single definition of heavy precipitation that is suitable for all regions. In 443
the International Meteorological Vocabulary (WMO-182), heavy rain is defined only as “rain 444
with a rate of accumulation exceeding a specific value”. It is recognized generally that when 445
a precipitation event is considered to be extreme, it relates to one of the following two 446
contexts: (1) a precipitation event is considered to be extreme when it exceeds a certain 447
threshold that has a certain associated impact, i.e. a fixed threshold, or (2) a precipitation 448
event is considered to be extreme due to its rarity, i.e. a percentile-based threshold. The rarity 449
of occurrence tends to takes the form of upper 90th
, 95th
, and 99th
percentile of precipitation. 450
Such percentile-based threshold is usually derived from statistical cumulative density 451
function or some conceptual distributions for precipitation extremes (such as Generalized 452
Extreme Value, GEV). Building on the existing definitions, scientific literatures and practices 453
among the WMO Members, this guide aims to guide Members on a standard approach to 454
define heavy precipitation. 455
The outcome of heavy precipitation from the survey of extremes disseminated to the 456
countries, presents several key findings, which are, that the majority of countries defined 457
heavy precipitation with a certain threshold on varying time periods, ranging from 1 hour to 458
48hours, and also taking into account seasonality. In some cases, percentile based threshold 459
is also used by the countries. Having considered these, heavy precipitation is defined in this 460
guideline in general terms as 461
GUIDELINES ON THE DEFINTION AND MONITORING OF EXTREME WEATHER AND CLIMATE EVENTS
19 | P a g e
A marked precipitation event occurring during a period of time of 1h, 3h, 462
6h,12h,24h or 48 hours with a total precipitation exceeding a certain threshold 463
defined for a given location. 464
It is recommended that for reporting heavy precipitation events at regional level (for example 465
to Regional Climate Centres [RCCs]), to use 24hours time-scale as a period for a common 466
criteria for heavy precipitation. 467
Generally, the most commonly used approach in practice by the Members of the WMO when 468
defining thresholds for heavy rainfall, are categorized into above two: (1) by absolute value 469
threshold and (2) by statistical segregation / relative threshold, such as percentiles or return 470
periods. Specific definitions for the two categories used by the WMO Members are presented 471
in the Appendix (XX) of this document or available online in (site location). 472
While value-threshold based characterization of extremes are more closely related to 473
application purposes, percentile based thresholds are more evenly distributed in space and is 474
meaningful and applicable when sufficient observation data exists. The flexibility to define 475
the percentile level for extremes will also allow users to define a very rare event, for instance 476
an event exceeding the 99th percentile, or a record breaking event which exceeds the highest 477
percentile. Of particulate note is that based on such percentile thresholds, even very rare 478
events in some arid and semi-arid regions may have not high disaster-causing potential. 479
Wet spell definition 480
According to WMO’s Meteoterm vocabulary and the International Meteorological 481
Vocabulary (WMO-182), a wet spell is defined as "a period of a number of consecutive days 482
in which precipitation exceeding a specific minimum amount has occurred". Although the 483
number of consecutive days is not specified, in this guideline it is suggested to use five 484
consecutive days as the reference time for a wet spell. The reason for this is because of the 485
existing index from the ETCCDI, which is the monthly maximum consecutive 5-day 486
precipitation (Rx5day), which can be used for long term evaluation of the wet spells for 487
climate monitoring. Building on these and the definition of a wet day, a wet spell is defined 488
in this guideline as 489
A period of at least five consecutive days with daily precipitation exceeding 1 490
millimeter. 491
In addition to ordinary wet spells, long-lasting precipitation extremes, as an extreme case of 492
wet spells, also need to be paid particular attention to, because of their high-impact property. 493
At individual station level, combined thresholds of intensity and duration threshold is 494
utilized to define persistent precipitation extremes. Fixed absolute values depending on 495
locations seem more proper to represent the disaster-causing potential, and at least three 496
days are required to satisfy preliminary duration. For regional scales, transient event 497

GUIDELINES ON THE DEFINTION AND MONITORING OF EXTREME WEATHER AND CLIMATE EVENTS
20 | P a g e
identification approach (Ren et al. 2013) is used to trace multi-day processes moving from 498
location to location; quasi-stationary identification scheme (Chen and Zhai 2013) is used to 499
guarantee stationary front related persistent heavy precipitation, whose major amount pours 500
into a highly concentrated area. The latter one tends to trigger severe floods during a few 501
days. 502
Below a general framework for defining heavy precipitation is proposed. 503
Recommendation for standard characterization of heavy precipitation 504
To quantitatively reflect a heavy precipitation event, the definition of heavy precipitation 505
should be complemented by characterization with the following 4 metrics: 506
1. Magnitude: it is computed based on an index or a set of indices measuring the 507
precipitation total on various time scales to measure the intensity of the event. 508
2. Duration: it is computed by the number of isolated or consecutive time unitthe 509
precipitation satisfying the extreme criteria. 510
3. Severity: is a measure which integrates two aspects of the event. Its magnitude and its 511
persistence. 512
4. Extent: describes the area impacted by the heavy precipitation event. 513
514
515
516

GUIDELINES ON THE DEFINTION AND MONITORING OF EXTREME WEATHER AND CLIMATE EVENTS
21 | P a g e
Table 3.4 Characterization of a heavy precipitation event Q
uan
tita
tive
des
crip
tion
: Precipitation index:
Pi
Threshold
(Ps)
Temporal information Spatial information
Pi: measured or
analyzed for 1hr, 6hr,
12hr, 24h or 48h total
precipitation
Computed based on historical
values of the index.
It should provide a limit beyond
which, values are statistically
rare(*), or a certain threshold
value having potential negative
impacts on one or several
application sectors.
(*) The WMO Climatological
Standard normal should be used
to the extent possible to define the
base periods and departure from
the average and percentiles.
Record at station level
information on the
starting time, ending
time and duration of
heavy precipitation.
Keep the information in
a database.
As heavy precipitation evolves
with time it is important to use
preferably a GIS to:
1. Calculate the area affected by
the event and at which degree.
2. Locate the coordinates of the
impact stations and the center
with the peak values of the
indices.
Another way to characterize the
extent of the area affected in case
GIS software is not available,
would be to provide the percent
of stations where the observed
precipitation surpassed Ps.
Even
t ch
ara
cter
izati
on
s:
Magnitude Duration Extent
Value of Pi-Ps The time period
considered in the index
The geographical area computed
based on multi-station data with
gridding when observing
networks are dense. Another
option is to use remote sensing
and NWP model analysis output
Another way to characterize the
extent is to provide the percent of
stations that were affected.
Severity:
It should be established as function of the magnitudeonly (the duration is fixed). It
should be categorized in three levels:heavy, very heavy and extreme.

GUIDELINES ON THE DEFINTION AND MONITORING OF EXTREME WEATHER AND CLIMATE EVENTS
22 | P a g e
Table 3.5 Characterization of wet spells
D
ata
req
uir
emen
ts: Historical and real time precipitation dataon hourly and
daily timescales
Continuous observation Surface observation which can be
complemented by other means
such as remotely sensed data and
NWP model analysis when
observational network is not
sufficiently dense.
Qu
an
tit
ati
ve
des
crip
ti
on
: Precipitation index:
Pi
Threshold
(Ps)
Temporal information Spatial information
Total precipitation 1mm in 24-hr Record at station level
information on the
As a wet spell evolves with time
it is important to use preferably a

GUIDELINES ON THE DEFINTION AND MONITORING OF EXTREME WEATHER AND CLIMATE EVENTS
23 | P a g e
starting time, ending
time and duration of wet
spell. Keep the
information in a
database.
GIS to:
1. Calculate the area affected by
the wet spell
2. Locate the coordinates of the
impact stations and the center
with the peak values of the index
Even
t ch
ara
cter
izati
on
s:
Magnitude Duration Extent
Percent of total precipitation during the spell compared to
the seasonal average.
Computed at station
level which is a number
of consecutive days
satisfying the threshold.
The geographical area computed
based on multi-station data with
gridding when observing
networks are dense. Another
option is to use remote sensing
and model analysis.
Severity:
Is based on duration. It should be categorized in three levels: minor, long, and very
long. Additional information can be provided in terms of maximum daily total
recorded during the spell.
Data
req
uir
emen
ts: Historical and real time daily precipitation data. Continuous observation Surface observation which can be
complemented by other means
such as remotely sensed data and
NWP model analysis when
observational network is not
sufficiently dense.

GUIDELINES ON THE DEFINTION AND MONITORING OF EXTREME WEATHER AND CLIMATE EVENTS
24 | P a g e
3.2.4 Drought and dry spells 544
Drought, a natural weather phenomenon that occurs in all climates, can differ greatly from 545
other extreme events. Unlike other extreme events, such as floods, tornadoes, and hurricanes, 546
which are weather events that are immediately detectable, drought, on the other hand, 547
develop slowly and steady, making it difficult to determine the onset and end. Albeit its 548
development, drought can end up being extremely devastating and costly, affecting society, 549
the economy, natural habitats, and ecosystems. In order to facilitate communication, 550
management, and response, drought can be categorized into four general types: 1) 551
meteorological, 2) agricultural, 3) hydrological, 4) and socio-economic. Meteorological 552
drought is the atmospheric conditions resulting in the absence or reduction of precipitation 553
over a period of time. Meteorological drought can lead to impacts to agriculture due to 554
precipitation shortages, higher evapotranspiration, and soil moisture deficits, which results in 555
an agricultural drought. Meteorological drought can also lead to hydrological drought, which 556
occurs from depleted surface or subsurface water supplies. Socioeconomic drought is the 557
imbalance in supply and demand or the effect of water shortages on the economy (e.g. crop 558
losses) and society (e.g. health). All of these different types of drought have one thing in 559
common; they all begin with a deficiency of precipitation (meteorological drought). 560
Drought can be numerically defined using indices that integrate temperature, precipitation 561
and other variables that affect evapotranspiration and soil moisture. Several indices in 562
different countries assess precipitation deficits in various ways, such as the Standardized 563
Precipitation Index. Other indices make use of additional weather variables. The most 564
commonly used index is the PDSI (Palmer, 1965) that uses precipitation, temperature and 565
local available water content data to assess soil moisture (IPCC, 2007). 566
Because of drought’s complexity and how it affects many aspects of our lives and a wide 567
variety of sectors, it is difficult to develop a single definition of drought since no single 568
definition works in all circumstances. But in order to take initial steps in defining drought, 569
we are going to focus solely on meteorological drought and its indices for the purpose of this 570
document. 571
Drought definition 572
Drought, as defined by WMO’s Meteoterm, is prolonged absence or marked deficiency of 573
precipitation; a period of abnormally dry weather sufficiently prolonged for the lack of 574
precipitation to cause a serious hydrological imbalance. It is also defined as a deficiency of 575
precipitation relative to what is expected that, when extended over a season or a longer 576
period of time, results in the inability to meet the demands of human activities and the 577
environment (Hayes 2011).Drought is defined in this guideline in general terms as 578

GUIDELINES ON THE DEFINTION AND MONITORING OF EXTREME WEATHER AND CLIMATE EVENTS
25 | P a g e
A marked unusual period of abnormally dry weather characterized by prolonged 579
deficiency below a certain threshold of precipitation over a large area and 580
persisting for timescale longer than a month. 581
Drought shouldn’t be confused with aridity, which is a characteristic of a climate relating to 582
insufficient or inadequate precipitation to maintain vegetation—according to WMO’s 583
Meteoterm. In other words, drought is a temporary climate phenomenon, while aridity is a 584
permanent climate feature in areas that typically experience low precipitation throughout the 585
year. An example of an arid place is the Saharan Desert, where the annual precipitation total 586
is approximately below 25 mm per year. 587
Drought typically begins as a dry spell—a period of abnormally dry weather; however, the 588
conditions are less severe than those of drought. Once dry conditions begin to affect society 589
and the economy by not being able to meet the demands of human activities and the 590
environment, then it’s no longer a dry spell, but drought. 591
Dry spell definition 592
As indicated above, dry spell conditions usually initiates drought, although not all dry spells 593
lead to drought condition. As defined in WMO Meteoterm, a dry spell is a period of 594
abnormally dry weather, where the conditions are less severe than those of a drought. In this 595
guideline, dry spell is defined in general terms as 596
A period of unusually dry conditions(*) of at least five consecutive days with daily 597
precipitation less than 1mm. 598
(*) i.e. to exclude usually dry periods, such as during dry seasons 599
The choice of the five days period in the definition is for consistency with the definition of 600
wet spell given above. 601
WMO recommendation for drought index 602
In December 2009, 44 drought experts from 22 countries met in Lincoln, Nebraska, USA to 603
discuss the development of standards for drought indices and guidelines for drought early 604
warning systems. One of their recommendations was to encourage the use of the Standard 605
Precipitation Index (SPI) to characterize meteorological droughts and provide this 606
information on their web sites, in addition to the indices currently used. Another outcome 607
from this meeting was the creation of a comprehensive user manual for the SPI, which 608
provides a description of the index, the computation methods, examples of where it is 609
currently used, its strengths and limitations, mapping capabilities, and how it can be used. 610
For additional information on the recommendations from the meeting, please see The 611
Lincoln Declaration on Drought Indices: Universal Meteorological Drought Index 612
Recommended. 613

GUIDELINES ON THE DEFINTION AND MONITORING OF EXTREME WEATHER AND CLIMATE EVENTS
26 | P a g e
614
The suggestion to use SPI as a drought index is mainly due to its simplicity—considering 615
only precipitation as a variable—and effectiveness. SPI helps quantify the precipitation 616
deficit since it is based on the probability of precipitation for any time scale. The 617
probabilities are standardized, where zero would represent the median precipitation amount, 618
a negative index would represent dry conditions (less than median precipitation), and a 619
positive index would represent wet conditions (greater than median precipitation). 620
When using SPI, drought is considered to have started when the SPI value is ≤ -1.0 and 621
drought ends when the SPI value becomes positive. Dry spell is considered to have started 622
when the SPI value is between -0.5 and -1.0. 623
For more information on how to compute the SPI, please see WMO’s SPI User Guide. 624
Recommendation for standard characterization of drought 625
When characterizing a drought event, the following four metrics should be considered: 626
1. Magnitude: Identifies the strength of the drought, whether it is abnormally dry, moderate 627
drought, severe drought, extreme drought or exceptional drought. The classification of 628
the magnitude of the drought will be determined on the drought index value. 629
2. Duration: The duration of the drought will be determined based on when it started and 630
ended. When using the SPI index, drought is considered to have started when the SPI 631
index value is ≤ -1.0 and drought ends when the SPI value becomes positive 632
3. Severity: is a measure which integrates two aspects of the event. Its magnitude and its 633
persistence. 634
4. Extent: Will inform on the geographical area affected and the widespread aspect of 635
drought. 636
637

GUIDELINES ON THE DEFINTION AND MONITORING OF EXTREME WEATHER AND CLIMATE EVENTS
27 | P a g e
Qu
an
tita
tive
des
crip
tion
: Drought index:
Di
Threshold
(Ds)
Temporal
information
Spatial information
Di: Computed
using monthly or
longer timescale
precipitation totals,
or in combination
with other
variables such as
evaporation,
temperature and
relative humidity.
Computed based on historical
values of the index.
It should provide a limit beyond
which, values are statistically
rare(*), or a certain threshold value
having potential negative impacts
on one or several application
sectors.
(*) The WMO Climatological
Standard normal should be used to
the extent possible to define the
base periods and departure from the
average and percentiles.
Persistent for
timescales longer than
a season.
Record at station level
information on the
starting time, ending
time and duration of
drought. Keep the
information in a
database.
As a drought evolves with time it is
important to use preferably a GIS
to:
1. Calculate the area affected by the
event and at which magnitude or
severity.
Even
t ch
ara
cter
izati
on
s:
Magnitude Duration Extent
Value of Di-Ds; or defined by a synthesized method. Computed at station
level which is the
number consecutive
months, seasons, or
years satisfying the
criteria.
The geographical area computed
based on multi-station data with
gridding when observing networks
are dense. Another option is to use
remote sensing precipitation data
when only precipitation data is
considered.
Severity:
An aggregate of several measures through a formula or set of logical criteria
applied on magnitude and duration. It should be categorized in 3
categories:moderate, severe and extreme.

GUIDELINES ON THE DEFINTION AND MONITORING OF EXTREME WEATHER AND CLIMATE EVENTS
28 | P a g e
Table 3.6 Characterization of a drought event
Table 3.7Characterization of a dry spell
Data
req
uir
emen
ts: Historical and real time data needed to compute Di. Continuous
observation
Surface observation complemented
by other means such as remotely
sensed data when observational
network is not sufficiently dense.
Qu
an tit
ati ve
de
scr
ipt
ion : Precipitation index:
Pi
Threshold
(Ps)
Temporal information Spatial information

GUIDELINES ON THE DEFINTION AND MONITORING OF EXTREME WEATHER AND CLIMATE EVENTS
29 | P a g e
Total precipitation in
24 hours.
Pi <1mm Record at station level
information on the
starting time, ending
time and duration of wet
spell. Keep the
information in a
database.
As a dry spell evolves with time
it is important to use preferably a
GIS to:
1. Calculate the area affected by
the wet spell
2. Locate the coordinates of the
impact stations and the center
with the peak values of the index
Even
t ch
ara
cter
izati
on
s: Magnitude Duration Extent
Percent of total number of days with precipitation < 1 mm
compared to the average length of the season.
Dry periods, such as during dry seasons in arid or semi-
arid areas should not be accounted.
Note: the definition of the wet/dry season is defined by
each country, where the start and end of the season should
also be defined based on average conditions.
Computed at station
level which is a number
of consecutive days
satisfying the threshold.
The geographical area computed
based on multi-station data with
gridding when observing
networks are dense. Another
option is to use remote sensing
and model analysis.
Severity:
Is based on duration. It should be categorized in three levels: minor, long, and
verylong.
Data
req
uir
emen
ts: Historical and real time daily precipitation data. Continuous observation Surface observation which can be
complemented by other means
such as remotely sensed data and
NWP model analysis when
observational network is not
sufficiently dense.
GUIDELINES ON THE DEFINTION AND MONITORING OF EXTREME WEATHER AND CLIMATE EVENTS
30 | P a g e
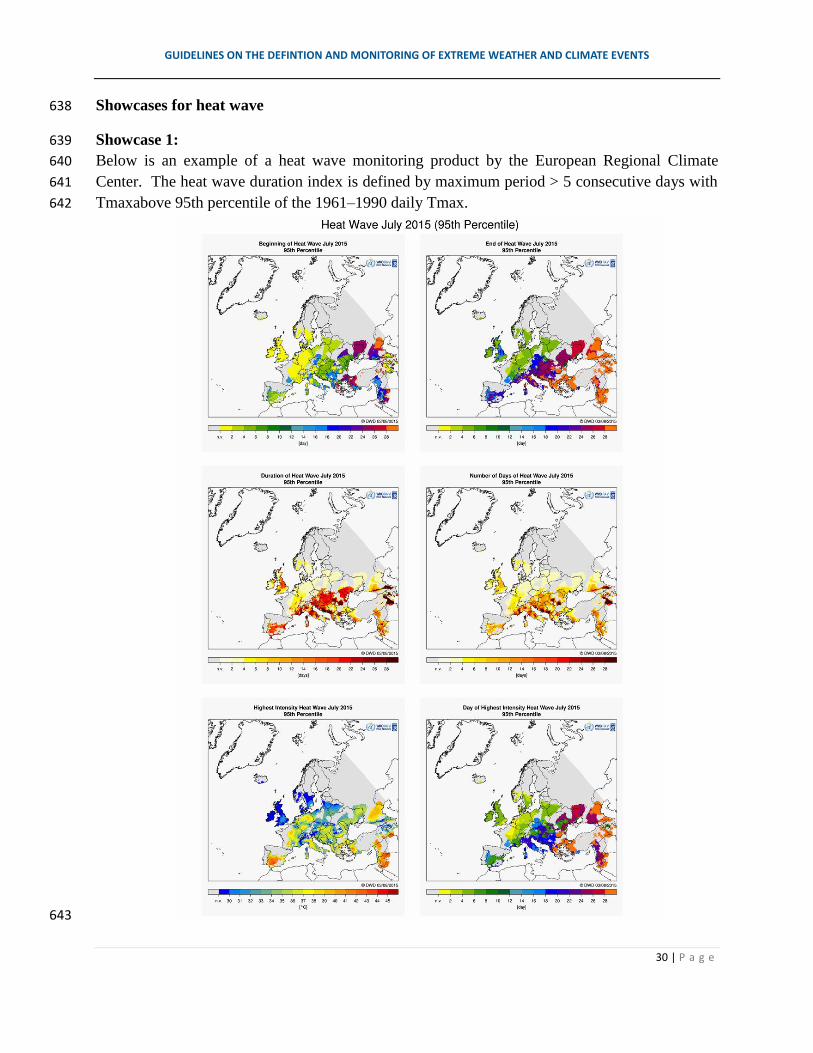
Showcases for heat wave 638
Showcase 1: 639
Below is an example of a heat wave monitoring product by the European Regional Climate 640
Center. The heat wave duration index is defined by maximum period > 5 consecutive days with 641
Tmaxabove 95th percentile of the 1961–1990 daily Tmax. 642
643

GUIDELINES ON THE DEFINTION AND MONITORING OF EXTREME WEATHER AND CLIMATE EVENTS
31 | P a g e
Showcase 2: 644 A more complicated approach that considers human comfort and the magnitude definitions is 645 shown below.In China, to specifically define a heat wave and its intensity, a thermal index is 646 defined based on perceivable temperature, a threshold based on percentile to reflect extremity 647
and an excess heat index to quantify the magnitude of the heat wave event. The steps are as 648 follows: 649
Firstly, an extreme hot day index is calculated when Tmaxis over 33C. 650
( )( )
( )( )
651
Then, a threshold Tis for hot day is defined over the 50th percentile over all the sample days with 652
Tmax over 33C during May-Sept for 1981-2000 reference period. If Ti of a typical day is over 653
Tis, that day will be classified as a hot day. 654
Further, a heat wave(severity)index is defined by Hi, an index taking into account impacts of 655
excess heat of the typical day, and the previous days, as well as impact of the heat wave duration. 656
( ) ∑
( ) ∑
657
where N is the persistent time of the extreme hot weather process (day), Ti the typical day Heat 658 index, Tis the threshold of heat wave, Tii previous i day of the heat wave and ndi the number of 659
heat wave days from day i before the typical day. 660
Based on Hi, magnitude of the heat wave can be assessed by on the following table. 661
Classification of Heat wave Magnitude in China 662
Magnitude
Light Heat
wave
(Class 3)
Moderate Heat
wave
(Class 2)
Sever Heat wave
(Class 1)
Hi 2.8≤Hi<6.5 6.5≤Hi<10.5 Hi≥10.5
663 664 Showcase 3: 665
666 The Australian Bureau of Meteorology provided services for heat wave assessments as well as 667
heat wave forecast services through their website in the following link 668 www.bom.gov.au/australia/heatwave/. The forecast of the heat wave is given over a three-day 669 period for lead times up to six days. The assessment and the forecast inform users on the level of 670 heat waves for the following level of severity: low-intensity heat wave, severe heat wave and 671

GUIDELINES ON THE DEFINTION AND MONITORING OF EXTREME WEATHER AND CLIMATE EVENTS
32 | P a g e
extreme heat wave. The heat wave definition used in this service is three or more days of high 672
maximum and high minimum temperature that are unusual to a certain location. 673
674
675
676
677
678
679
680
Figure S1. Products of the Bureau of Meteorology for a three-day heat wave assessment for the 681
period of 2-4 November 2015 (left), and heat wave forecast for 8-10 November 2015 (right). 682
683
Showcases for cold wave 684
Showcase 1: 685
As a simple case, to produce comparable results for different geographical locations, relative 686
thresholds (e.g., 10thpercentileor a value of 2 standard deviation below normal) from statistical 687
distribution can be used. A cold wave can be considered to have occurred when there are two or 688
more consecutive days on which the maximum and minimum temperature anomalies are 689
simultaneously lower than the thresholds established by the corresponding 10th percentilesor 690
well below normal (DjuroRadinović&Mladjen Ćurić,2012). 691
Showcase 2: In China, the thresholds include sharp drop of temperature in 24, 48, 72 hours and 692
some absolute thresholds for low temperature. For southern and northern regions, the thresholds 693
are different. 694
695
Showcases for drought 696
Other drought indices 697
Other indices that only consider precipitation as a variable that were recommended in the 698
December 2009 expert team meeting in Lincoln, Nebraska, that could also be used to monitor 699
and/or characterize drought are: 700
701

GUIDELINES ON THE DEFINTION AND MONITORING OF EXTREME WEATHER AND CLIMATE EVENTS
33 | P a g e
1. Percent of normal precipitation: this is a simple measure for precipitation. It is 702 computed by dividing the observed precipitation by the 30-year average precipitation. The 703 quotient is then multiplied by 100%. 704 705
706 707 2. Percentile ranking (deciles, terciles, quartiles): is also a simple computation, but 708 requires a long historical precipitation data record. The percentile ranking is done by simply 709
sorting the data record from the lowest to the highest value and then ranking each value from 710 driest (#1) to wettest (# of years in the record). The numeric rank of each value indicates the 711 position of the sorted value throughout the historical record. 712
713
Examples of classification: 714
715 a) 716 717
Percentile Classification
Lowest Decile Much below normal
Lowest Tercile Below normal
Middle Tercile Near normal
Upper Tercile Above normal
Upper Decile Much above normal
Source: NOAA’s NCEI 718
b) 719
720
721 722
723
724
725 726 727 728
Source: National Drought Mitigation Center 729
730 Although it has been shown by multiple studies that precipitation is the major variable in 731 defining and characterizing drought, an index that uses both temperature and precipitation data 732 can also be useful to characterize drought. This index is the Standard Precipitation 733 Evapotranspiration Index (SPEI), which uses temperature and precipitation data. SPEI is very 734
similar to the SPI, but also takes into consideration evapotranspiration, which is the combined 735 processes by which water is transferred from the Earth’s surface to the atmosphere by 736
evaporation from the land and ocean surfaces and by transpiration from vegetation, according to 737 WMO’s Meteoterm. This is an important and useful index because evapotranspiration processes 738
Decile Classification
Deciles 1-2: Lowest 20% Much below normal
Deciles 3-4: Next Lowest 20% Below normal
Deciles 5-6: Middle 20% Near normal
Deciles 7-8: Next Highest 20% Above normal
Deciles 9-10: Highest 20% Much above normal

GUIDELINES ON THE DEFINTION AND MONITORING OF EXTREME WEATHER AND CLIMATE EVENTS
34 | P a g e
could potentially increase the drought severity (warmer temperatures tend to increase the 739 evapotranspiration and thus exacerbating drought conditions). 740 741 Guidance and software to compute SPEI were developed by Spain’s “Consejo Superior de 742
InvestigacionesCientíficas” (CSIC) and can be accessed at the following link: 743 http://sac.csic.es/spei/index.html 744 745 A global monitoring map of SPEI is also available on a monthly basis, courtesy of CSIC, at 746 http://sac.csic.es/spei/map/maps.html 747
748
Timescale 749 All of the indices recommended in this showcase for drought can be computed on a range of 750 timescales, from monthly to longer timescales. 751
752

GUIDELINES ON THE DEFINTION AND MONITORING OF EXTREME WEATHER AND CLIMATE EVENTS
35 | P a g e
Showcase 1: 753
754 Fig S1.1: Standardized Precipitation Index map for the contiguous U.S. 755
756
The U.S. Drought Monitor assesses and communicates the state of drought in the United States 757
on a weekly basis. It is a synthesis of multiple indices and local impacts to best represent the 758
current drought conditions. 759
760
761
762
763
764
765
766
767
768
Figure S1.2: U.S. Drought Monitor Map (Source: drought.gov) 769
The U.S. drought monitor identifies the intensity using five indicators, drought impacts, and 770
local reports from expert observers around the country. The table found below shows the ranges 771
for each indicator for each dryness level. 772

GUIDELINES ON THE DEFINTION AND MONITORING OF EXTREME WEATHER AND CLIMATE EVENTS
36 | P a g e
773
774
775
776
777
778
779
780
Figure S1.3: Table shows the ranges for each indicator for each dryness level in the U.S. Drought 781
Monitor. (Source: drought.gov) 782
Showcase 2: 783
The Drought monitoring in Montenegro is based on precipitation percentiles, SPI index in 784
daily/monthly basis and remote sensing data, i.e. FVC (fraction of vegetation cover) and LAI 785
(leaf area index) indexes for selected area in Montenegro computed from the LANDSAF data 786
within DMCSEE (Drought Management Centre for Southeastern Europe). 787
SPI values are computed separately for 1, 3, 6, 9 and 12 months and 1, 2, 3, 4, 5, 6, 9 and 12 in 788
days. 789
790
Figure S2.1:National level: SPI 12 shows intensity of hydrological drought in November 2011 791
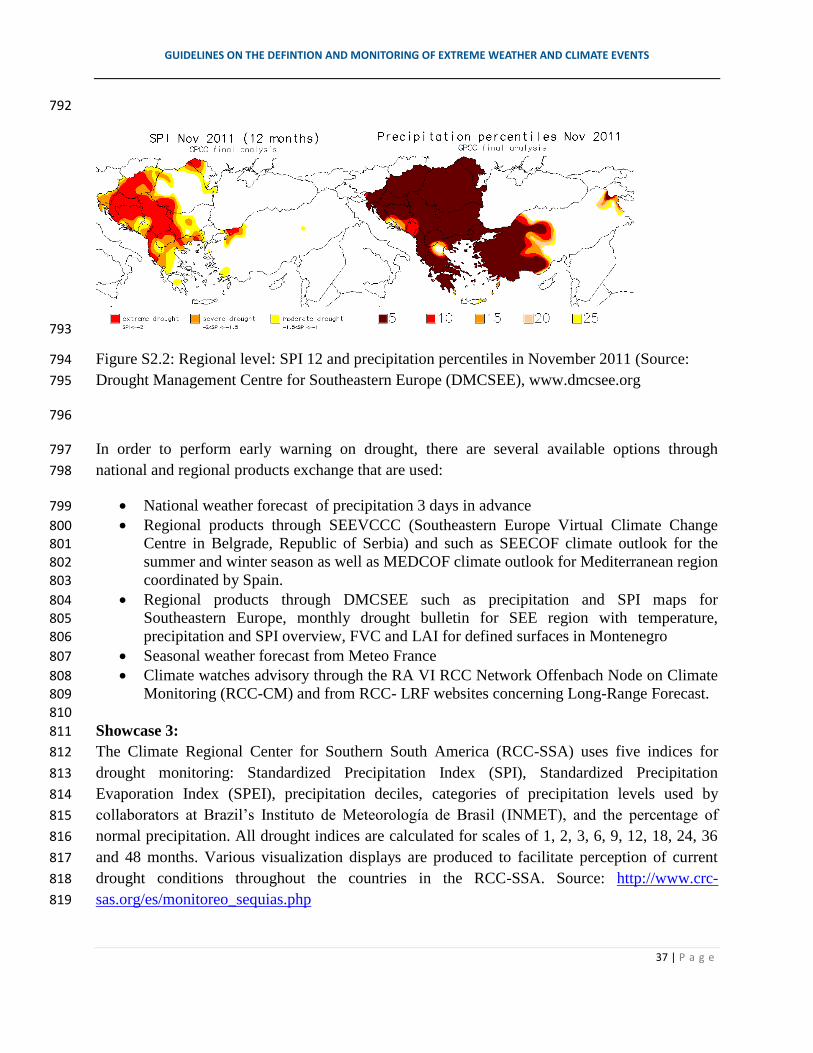
GUIDELINES ON THE DEFINTION AND MONITORING OF EXTREME WEATHER AND CLIMATE EVENTS
37 | P a g e
792
793
Figure S2.2: Regional level: SPI 12 and precipitation percentiles in November 2011 (Source: 794
Drought Management Centre for Southeastern Europe (DMCSEE), www.dmcsee.org 795
796
In order to perform early warning on drought, there are several available options through 797
national and regional products exchange that are used: 798
National weather forecast of precipitation 3 days in advance 799
Regional products through SEEVCCC (Southeastern Europe Virtual Climate Change 800 Centre in Belgrade, Republic of Serbia) and such as SEECOF climate outlook for the 801 summer and winter season as well as MEDCOF climate outlook for Mediterranean region 802 coordinated by Spain. 803
Regional products through DMCSEE such as precipitation and SPI maps for 804 Southeastern Europe, monthly drought bulletin for SEE region with temperature, 805
precipitation and SPI overview, FVC and LAI for defined surfaces in Montenegro 806
Seasonal weather forecast from Meteo France 807
Climate watches advisory through the RA VI RCC Network Offenbach Node on Climate 808 Monitoring (RCC-CM) and from RCC- LRF websites concerning Long-Range Forecast. 809
810
Showcase 3: 811
The Climate Regional Center for Southern South America (RCC-SSA) uses five indices for 812
drought monitoring: Standardized Precipitation Index (SPI), Standardized Precipitation 813
Evaporation Index (SPEI), precipitation deciles, categories of precipitation levels used by 814
collaborators at Brazil’s Instituto de Meteorología de Brasil (INMET), and the percentage of 815
normal precipitation. All drought indices are calculated for scales of 1, 2, 3, 6, 9, 12, 18, 24, 36 816
and 48 months. Various visualization displays are produced to facilitate perception of current 817
drought conditions throughout the countries in the RCC-SSA. Source: http://www.crc-818
sas.org/es/monitoreo_sequias.php 819
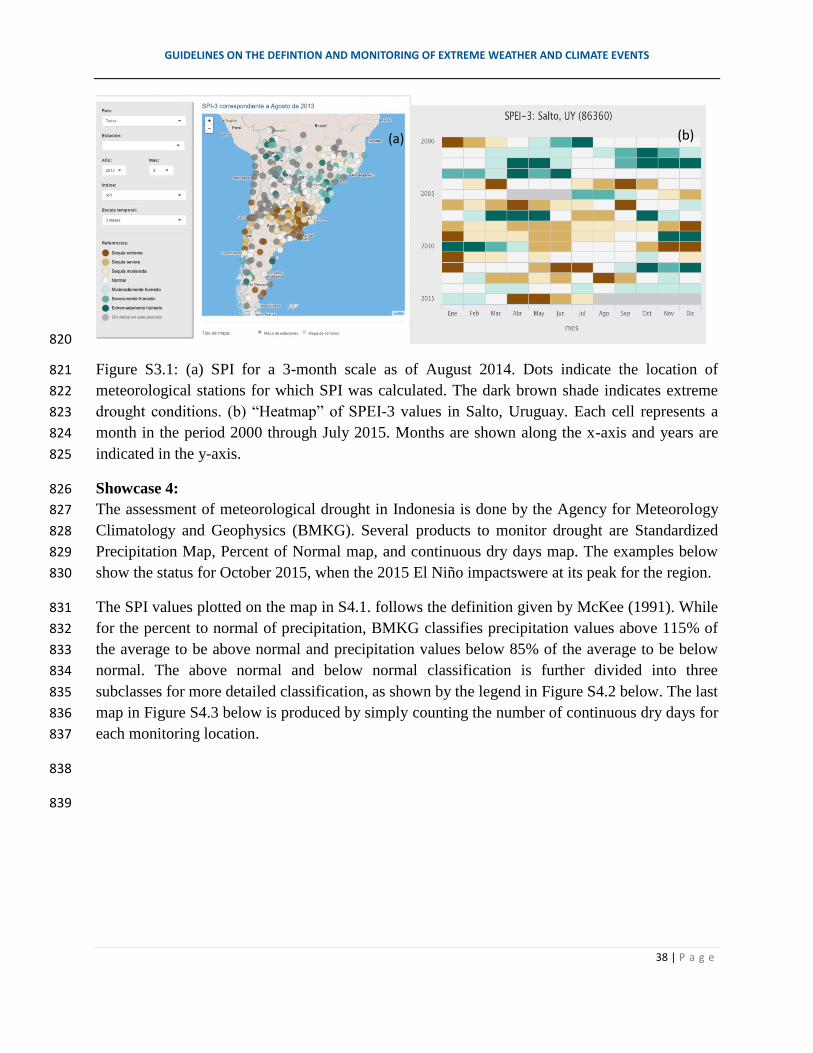
GUIDELINES ON THE DEFINTION AND MONITORING OF EXTREME WEATHER AND CLIMATE EVENTS
38 | P a g e
820
Figure S3.1: (a) SPI for a 3-month scale as of August 2014. Dots indicate the location of 821
meteorological stations for which SPI was calculated. The dark brown shade indicates extreme 822
drought conditions. (b) “Heatmap” of SPEI-3 values in Salto, Uruguay. Each cell represents a 823
month in the period 2000 through July 2015. Months are shown along the x-axis and years are 824
indicated in the y-axis. 825
Showcase 4: 826
The assessment of meteorological drought in Indonesia is done by the Agency for Meteorology 827
Climatology and Geophysics (BMKG). Several products to monitor drought are Standardized 828
Precipitation Map, Percent of Normal map, and continuous dry days map. The examples below 829
show the status for October 2015, when the 2015 El Niño impactswere at its peak for the region. 830
The SPI values plotted on the map in S4.1. follows the definition given by McKee (1991). While 831
for the percent to normal of precipitation, BMKG classifies precipitation values above 115% of 832
the average to be above normal and precipitation values below 85% of the average to be below 833
normal. The above normal and below normal classification is further divided into three 834
subclasses for more detailed classification, as shown by the legend in Figure S4.2 below. The last 835
map in Figure S4.3 below is produced by simply counting the number of continuous dry days for 836
each monitoring location. 837
838
839
(a) (b)

GUIDELINES ON THE DEFINTION AND MONITORING OF EXTREME WEATHER AND CLIMATE EVENTS
39 | P a g e
840
Figure S4.1.SPI for 1-month for October 2015.Colors denotes the classification of the SPI value, 841
according to McKee. 842
843
Figure S4.2. Percent to normal map for October 2015. The map shows the extent of the dry 844
conditions during the peak of the 2015 El Niño in the Indonesian area. Note that from East to 845
West spans around 46 degrees, showing the vast regional scale of the drought condition. 846

GUIDELINES ON THE DEFINTION AND MONITORING OF EXTREME WEATHER AND CLIMATE EVENTS
40 | P a g e
847
Figure S4.3. Continuous Dry Days map showing the condition for early October 2015. Colors of 848
the circles denote the length of the dry days, ranging from short (green) to long (red). 849
850
Showcase 5: 851
852
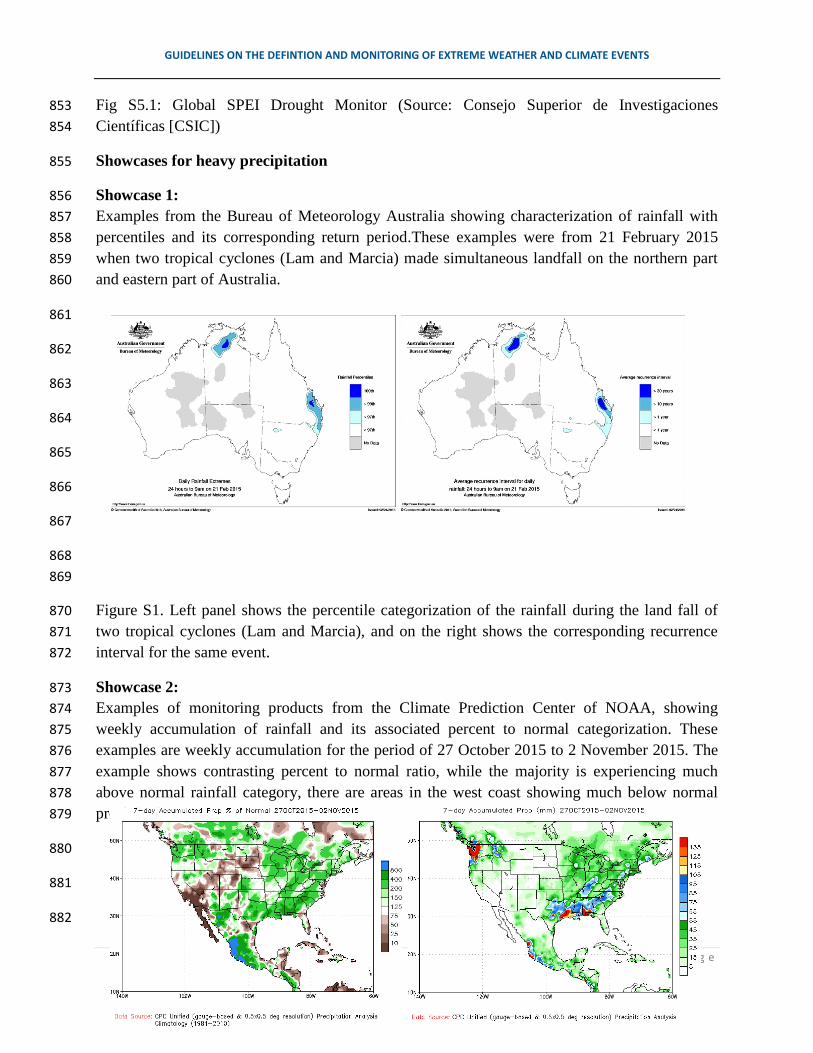
GUIDELINES ON THE DEFINTION AND MONITORING OF EXTREME WEATHER AND CLIMATE EVENTS
41 | P a g e
Fig S5.1: Global SPEI Drought Monitor (Source: Consejo Superior de Investigaciones 853
Científicas [CSIC]) 854
Showcases for heavy precipitation 855
Showcase 1: 856
Examples from the Bureau of Meteorology Australia showing characterization of rainfall with 857
percentiles and its corresponding return period.These examples were from 21 February 2015 858
when two tropical cyclones (Lam and Marcia) made simultaneous landfall on the northern part 859
and eastern part of Australia. 860
861
862
863
864
865
866
867
868
869
Figure S1. Left panel shows the percentile categorization of the rainfall during the land fall of 870
two tropical cyclones (Lam and Marcia), and on the right shows the corresponding recurrence 871
interval for the same event. 872
Showcase 2: 873
Examples of monitoring products from the Climate Prediction Center of NOAA, showing 874
weekly accumulation of rainfall and its associated percent to normal categorization. These 875
examples are weekly accumulation for the period of 27 October 2015 to 2 November 2015. The 876
example shows contrasting percent to normal ratio, while the majority is experiencing much 877
above normal rainfall category, there are areas in the west coast showing much below normal 878
precipitation. 879
880
881
882

GUIDELINES ON THE DEFINTION AND MONITORING OF EXTREME WEATHER AND CLIMATE EVENTS
42 | P a g e
883
884
885
886
887
888
Figure S2.Examples of weekly rainfall accumulation from CPC NOAA on the left panel and 889
its corresponding percent to normal categorization on the right. 890
891

GUIDELINES ON THE DEFINTION AND MONITORING OF EXTREME WEATHER AND CLIMATE EVENTS
43 | P a g e
Showcase 3. Examples of monthly rainfall analysis from the UK Met Office, for the month 892
January 2015.The examples are taken from the website of the UK Met Office, for the climate 893
summary page: www.metoffice.gov.uk/climate/uk/summaries/anomacts. 894
895
896
897
898
899
900
901
902
903
904
905
906
907
908
909
Figure S3. Example of rainfall categorization with percent to normal for the UK, for the 910
month of January 2015 (left) and its corresponding return period (right). 911
912

GUIDELINES ON THE DEFINTION AND MONITORING OF EXTREME WEATHER AND CLIMATE EVENTS
44 | P a g e
Showcase 4: 913
A simple year to year heavy rainfall characterization from Indonesia. Operationally the 914
characterization of rainfall that is used in the Agency for Meteorology Climatology and 915
Geophysics (BMKG) is the following: 916
• Light rain : 5 - 20 mm/day 917
• Moderate rain : 20 - 50 mm/day 918
• Heavy rain : 50 - 100 mm/day 919
• Very heavy rain: >100 mm/day 920
The figures below show the number of heavy rain and very heavy rain from year to year for 921
the city of Bogor. 922
923
924
925
926
927
928
929
930
931
932
933
934
935
936
Figure S4.Year to year values of the number of days with heavy rainfall (>50mm/24hr) on 937
the left, and year to year values of the number of days with very heavy rainfall 938
(>100mm/24hr) on the right, for the city of Bogor in Indonesia. 939
940
941
942
943
944
945
946
947
948
949
950
951
Showcase 5: 952

GUIDELINES ON THE DEFINTION AND MONITORING OF EXTREME WEATHER AND CLIMATE EVENTS
45 | P a g e
A simple case of persistent precipitation extremes provided by Chen and Zhai (2013). This 953
case occurred during 1stJuly -11
th July 1991. Every station experienced at least three 954
consecutive days with heavy precipitation of at least 50mm day-1
and at least one 955
overlapping day existed during the durations between neighboring stations. 956
957
958
959
960
Figure S5.A typical case of persistent precipitation extremes, which occurred during 1stJuly -961
11th
July 1991. Shadings indicate accumulated precipitation (mm), and red triangles label the 962
stations which experienced at least three consecutive days with heavy precipitation of at least 963
50mm day-1
964
965
105 110 115 120 125 130 135
20
25
30
35
40
45
50
1991.7.1-7.11
100mm
200mm
300mm
400mm
500mm

GUIDELINES ON THE DEFINTION AND MONITORING OF EXTREME WEATHER AND CLIMATE EVENTS
46 | P a g e
4. Catalogue and data bases on Hazards and Extreme Weather and Climate Events 966
A standard approach for the characterization and reporting of extreme events is necessary to 967
support global assessment of the climate, which will be the input for the WMO annual, multiyear 968
climate statements and special climate reports. It will be possible to identify and report regional 969
extreme events routinely by the WMO member countries’ NMHSs, albeit having different 970
operational definition of the extreme events. For example, it will be possible to identify the 971
spatial extent of a regional heat wave event by consolidating national-level reports. 972
A standard approach for characterization and reporting extreme events is also required for 973
implementing climate watch systems in a harmonized manner. The National Meteorological and 974
Hydrological Services will be able to provide input on the extreme events for the consolidation 975
of the climate watches by the Regional Climate Centers based on a standard coding system of the 976
events, such that near-real time assessments of the origin, characteristics and evolution of events 977
will be possible. Other international climate assessments may also benefit from the analysis of 978
extreme events. 979
For the operational monitoring of hazards and extreme weather and climate events, it is 980
necessary that the underlying information on the occurrence (time and location), duration, 981
magnitude and extent should be systematically recorded by the operational entities at the national 982
level. These entities are usually the NMHS. At the regional level, the RCCs also have a mandate 983
to monitor climate anomalies and climate extremes occurring in the region of their mandate. The 984
role of RCCs in monitoring extremes is critically important as it provides a larger geographical 985
context that is necessary to understand the dynamical mechanisms that trigger the extremes, such 986
as, for example, the large scale climate variability modes, including the atmospheric and oceanic 987
changing patterns, oscillations and dipoles. This in turn helps in enabling an efficient climate 988
watch system at national and regional levels. Therefore, recording hazards and extreme events 989
both at regional and national level should be based on a well-defined catalogue which informs on 990
the terminology, definitions and codes. 991
A standard database model should be built in compliance with the definitions provided in such 992
catalogue at the extent possible, to allow an easy use in the monitoring of the hazards and 993
extremes. 994
4.1 Cataloguing Hazards and Extremes 995
4.1.1 Structure 996
The focus will be made on cataloguing major hydro-meteorological hazards and extreme 997
events. The corresponding catalogue isa table(Table4.1) with a structurethat includes 998
briefcodes of the hazards and extremes, their terminologyand definitionsmostly according to 999
the definitions given in the International Meteorological Vocabulary (WMO No. 182). 1000

GUIDELINES ON THE DEFINTION AND MONITORING OF EXTREME WEATHER AND CLIMATE EVENTS
47 | P a g e
Table 4.1 1001
Code Terminology of the Extreme
Event
Definition
Code Extreme Event Definition
... … …
Code Extreme Event Definition
1002
A completed table with content is provided in the appendix (it will be available online in 1003
http://location) 1004
4.1.2 Update of the Catalogue 1005
The catalogue should contain standard content, which needs to be maintained based on 1006
WMO technical regulations. The review of the Catalogue will be decided by the CCl in 1007
collaboration with the Commission for Basic Systems (CBS), the Commission for 1008
Agriculture Meteorology and the Commission for Hydrology.It is recommended that the 1009
Catalogue be published as an appendixof the WMO Manual on Global Data Processing and 1010
Forecasting System (GDPFS). For operational use of the catalogue, it is recommended that a 1011
web searchable version be made online through the global portal on hazards and extremes 1012
(Chapter 5). 1013
4.2 Database for recording extremes 1014
It is therefore important that the recording of the extreme events should be undertaken in a 1015
consistent and systematic way so that integration of information from national data bases to 1016
regional databases and vice versa is made with a minimum transformation and interface 1017
software. 1018
4.2.1 Data Base Model 1019 1020
The database model provides a general structure used for the information on hazards and 1021
extremes that is required to be stored in a data base in an operational mode. This subsection 1022
describes key elements in the logical structure of the database and in which manner data can 1023
be stored, organized, and manipulated. 1024
1025
It is recommended (but not necessary) for NMHSs that the database be built as part of a 1026
single integrated and administrated Climate Data Management Systems (CDMS, Climate 1027
Data Management System Specifications, WMO-No 1131, 2014). This would allow 1028
optimization of IT and Staff resources. It would also allow benefiting from a single 1029
governance and system administration which are critical for an efficient upgrade, security 1030

GUIDELINES ON THE DEFINTION AND MONITORING OF EXTREME WEATHER AND CLIMATE EVENTS
48 | P a g e
and maintenance of the database. The proposed data model describes the data structure on 1031
hazards and extremes. The Structure should consist of: metadata records and data records. 1032
4.2.1.1 Metadata Records 1033 They describe the context in which the recording of the hazards and extremes was done, 1034
including administrative information and brief citation and reference of the methodology and 1035
the data type used to record the extreme event in the data base. 1036
1037
Administrative metadata 1038
Region (according to the WMO definition), Country Name, Operational entity name and 1039
focal point contact information. 1040
1041
Methodology metadata 1042
Description of the method used to define and characterize the hazards and extremes 1043
including, terminology, indices, and thresholds, methods for computing extent, duration and 1044
magnitude. It will also be useful, if available, to provide references to the key relevant 1045
publications. 1046
1047
Data type metadata 1048
Describe the type of data used in recording the hazards and extremes, such as observations 1049
network, remote sensing, or model analysis, among others. 1050
1051 4.2.1.2 Data Records 1052 It is the data that helps characterize the various aspects of the extreme events, such as 1053
duration, location, magnitude and extent. 1054
1055
Type of the hazard or extreme 1056
The type of extreme will depend on the country’s definition of the extreme(See 4.5) and the 1057
WMO catalogue of hazards(see 4.xx). 1058
Date of occurrence 1059
- Start Date: YY-MM-DD 1060
- End Date: YY-MM-DD 1061
Note: For long term events like drought, YY-MM will be sufficient 1062
1063
Geographical location 1064
Describe the location affected by the hazards and extremes during their occurrence, from 1065
Start Date to End Date. It should be described with general position identification and in 1066
geographical coordinates 1067
1068

GUIDELINES ON THE DEFINTION AND MONITORING OF EXTREME WEATHER AND CLIMATE EVENTS
49 | P a g e
General Position 1069
The name of the area affected during the date of occurrence and its position relative to North, 1070
South, East and West. The position is given in general terms, such as North, North West, the 1071
southern part of, etc. 1072
1073
Geographical coordinates 1074
Provides the coordinate of the box which delineate the location affected by the hazard or 1075
extreme event during the data of occurrence, in terms of 1076
- Minimum Latitude, Maximum Latitude 1077
- Eastern Longitude, Western longitude 1078
1079
1080
1081
1082
Daily Positions of extreme value during the period of record (Start date and End Date). 1083
- Name of the locations: City, town, district, village, etc. 1084
- Coordinate of the locations: latitude, longitude 1085
- Magnitude: The Magnitude at the position of extreme value 1086
- Date of extreme value: Day: DDMMYYYY 1087
Note: Daily positions of extreme event can be multiple if such extreme is recorded in several 1088
positions. For long term events based on monthly data, such as drought, this record might can 1089
be omitted. 1090
1091
Extent 1092
Total area (km2, hectares, other units.) affected by the extreme event during the period of 1093
occurrence from Start date to End date. 1094
Affected area from Start date to End date
X
X
Maximum Latitude
Minimum Latitude
Western-Most longitude Latitude
East-Most longitude Latitude
X: Position of extreme value
X

GUIDELINES ON THE DEFINTION AND MONITORING OF EXTREME WEATHER AND CLIMATE EVENTS
50 | P a g e
4.2.2Data Base Management 1095
4.2.2.1 Operational characteristics 1096
Inter-operability 1097
i. The system used to store the data should be inter-operable and has at least English 1098
version. 1099
ii. Readily for easy update, upgrade and maintenance (preferably locally, with a 1100
minimum external intervention) 1101
iii. Allow import and export of at least one of most popular data file format such as text 1102
files and spreadsheet files 1103
1104
Practical usability 1105
i. It should allow practical and easy retrieval and manipulation (recording, correction 1106
and visualization, etc.) of the information in the database. 1107
ii. It should allow the use of criteria for selection of entry variables (metadata and data 1108
records) to be retrieved or manipulated individually or in groups. 1109
iii. Relational Data bases are preferable, data bases such as those build on standard 1110
spreadsheet could be also usable if more sophisticated database are not affordable 1111
1112
Products generation 1113
i. It is recommended that the database system allows generation of quick summaries of 1114
the data such as number of hazards or extremes recorded of each category during a 1115
predefined period of time, week, month, season, year, etc. This can also be made 1116
more flexible by allowing such summaries on a non-fixed period of time, such as 1117
periods with starting and ending dates selected at the choice of the user. 1118
ii. It should also allow generation of customized files with easy data format and 1119
structure to conduct in-depth assessment using sophisticated statistical tools which 1120
are not part of the database system. 1121
4.2.2.2 Archiving Requirements 1122
Storage 1123
The database system should allow sufficient local storage capacity for storing data that can 1124
be accessible on operational mode. Data should cover a period at least 30 years of 1125
climatology based on the WMO definition of Climatological Standard normal, currently 1126
(1981-2010) and data for reference period (1961-1990) for climate change assessment as well 1127
as the most recent data available. 1128
1129
All data need to be duplicated in a back-up data base to ensure continuity as well as archived 1130
in external archiving digital storage. 1131
1132
Historical Data Recovery 1133

GUIDELINES ON THE DEFINTION AND MONITORING OF EXTREME WEATHER AND CLIMATE EVENTS
51 | P a g e
In many cases complete data in digital form and complying with the structure of the data 1134
model described above is not readily available. It is therefore very important to quickly 1135
recover the paper archives that include this information and make it available in digital 1136
format for use in operational climate monitoring and watch systems, as well as for assessing 1137
the changing behavior of the hazards and extremes in response to the changing climate. 1138
1139
Reconstructing extremes from past data 1140
It is possible to use tools that can use the archived basic climate data to reprocess the 1141
information on extremes based on the definitions and the thresholds that describe for 1142
example, heat-waves, cold waves, heavy precipitation and wet spells, drought and dry spells. 1143
4.3Unique identifier of extreme events 1144
The identifier is a mean to code an event in the way that its monitoring and tracking from its 1145
onset to cessation is made in a consistent way at national level but also across the borders. It 1146
helps communicate the characteristics of the event, in a minimum text message using standard 1147
agreed codes. These codes should encapsulate briefly the type of the event and its fundamental 1148
characteristics, particularly the location and magnitude. 1149
4.3.1 Role in communicating in a consistent and standard way 1150
4.3.1.1 Climate watches 1151
Identifiers for weather and climate extreme events can provide a useful and simple tool for 1152
improving the provision and communication of information that is required as input for 1153
climate watches which are coordinated regionally by the RCCs and issued at national level 1154
by the NMHS to the authorities in managing impacts ofextremes (Disaster Risk Reduction 1155
[DRR], emergency, etc.). 1156
1157
As part of a Climate Watch system (WMO TD No 118), the NMHS should continuously 1158
monitor and assess the state of the climate, evaluate available climate forecasts, and, when 1159
conditions warrant for adverse climate-related impacts, issue formal climate watches to alert 1160
end users. Stakeholders would then be in a position to undertake actions to mitigate the 1161
climate-related impacts. 1162
1163
For example, excessive rainfall over a period of weeks may saturate soils, leading to higher-1164
than-average probabilities for flooding, land erosion and mudslides; while rainfall deficits 1165
may lead to crop failures, famine and economic loss. 1166
1167
A Climate Watch uses operational climate monitoring and forecasts, to produce proactive 1168
alert of impending unfavorable climate anomalies with potential high impacts. 1169
1170

GUIDELINES ON THE DEFINTION AND MONITORING OF EXTREME WEATHER AND CLIMATE EVENTS
52 | P a g e
While efforts have been progressed in establishing climate watches at regional level using 1171
available observations and model products at the regional climate centers and global 1172
forecasting centers, there is a lack of systematic communication of hazards and extremes 1173
from national to regional level in a standard format. This hampers the near-real time 1174
assessment of the origin, characteristics and evolution of these events. 1175
1176
It is expected that a standard identification of the events would help establish such a 1177
systematic communication for provision of data on hazards and extremes in an easy and 1178
inter-operable coding system. 1179
1180
4.3.1.2 Role in the assessment of losses and damages 1181
Developing identifiers for cataloguing weather and climate extreme events in cooperation 1182
with institutions that have the capability to identify the possible impact of those weather 1183
events can provide also an unambiguous reference for associated losses and damages and can 1184
promote consistency in the characterization of extreme events. Furthermore, consistent event 1185
characterization in terms of type of event, location, duration, magnitude and timing would 1186
allow for better evaluation of the types of losses and damages associated with different types 1187
of events, and the most damaging events and thresholds, and trends. 1188
1189
Developing identifieris an important prerequisite for the Atlas of Mortality and Economic 1190
Losses from Weather, Climate and Water Extremes and the United Nations Office for DRR 1191
Global Assessment Reports on DRR, and it could greatly assist the Global Framework for 1192
Climate Services by bringing a standardized approach of NMHSs to the analysis and 1193
recording of extreme hydro-meteorological events in national databases, and by supporting 1194
the international exchange and validation of these data. (Resolution 9 (Cg-17)). 1195
4.3.2 The proposed approach for coding extreme events 1196
4.3.2.1 Coding 1197
The table below proposes the coding for identifying and characterizing weather and climate 1198
extreme events. 1199
Table 4.2 1200
Metadat
a
Record
Even
t
Code
Region Countr
y
Data
Record
1
Date
Genera
l
Positio
n
Positio
n
Extrem
e
Value-
…
.
Positio
n
Extrem
e
Value-
Max
Magnitud
e
Exten
t
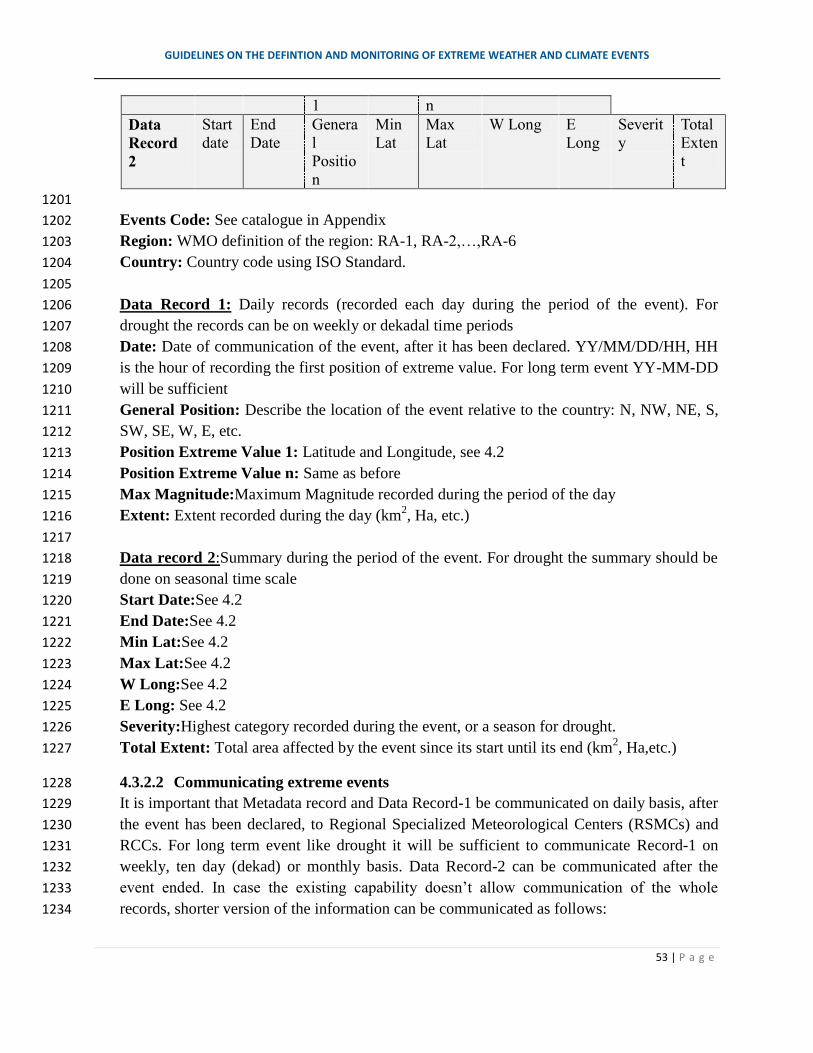
GUIDELINES ON THE DEFINTION AND MONITORING OF EXTREME WEATHER AND CLIMATE EVENTS
53 | P a g e
1 n
Data
Record
2
Start
date
End
Date
Genera
l
Positio
n
Min
Lat
Max
Lat
W Long E
Long
Severit
y
Total
Exten
t
1201
Events Code: See catalogue in Appendix 1202
Region: WMO definition of the region: RA-1, RA-2,…,RA-6 1203
Country: Country code using ISO Standard. 1204
1205
Data Record 1: Daily records (recorded each day during the period of the event). For 1206
drought the records can be on weekly or dekadal time periods 1207
Date: Date of communication of the event, after it has been declared. YY/MM/DD/HH, HH 1208
is the hour of recording the first position of extreme value. For long term event YY-MM-DD 1209
will be sufficient 1210
General Position: Describe the location of the event relative to the country: N, NW, NE, S, 1211
SW, SE, W, E, etc. 1212
Position Extreme Value 1: Latitude and Longitude, see 4.2 1213
Position Extreme Value n: Same as before 1214
Max Magnitude:Maximum Magnitude recorded during the period of the day 1215
Extent: Extent recorded during the day (km2, Ha, etc.) 1216
1217
Data record 2:Summary during the period of the event. For drought the summary should be 1218
done on seasonal time scale 1219
Start Date:See 4.2 1220
End Date:See 4.2 1221
Min Lat:See 4.2 1222
Max Lat:See 4.2 1223
W Long:See 4.2 1224
E Long: See 4.2 1225
Severity:Highest category recorded during the event, or a season for drought. 1226
Total Extent: Total area affected by the event since its start until its end (km2, Ha,etc.) 1227
4.3.2.2 Communicating extreme events 1228
It is important that Metadata record and Data Record-1 be communicated on daily basis, after 1229
the event has been declared, to Regional Specialized Meteorological Centers (RSMCs) and 1230
RCCs. For long term event like drought it will be sufficient to communicate Record-1 on 1231
weekly, ten day (dekad) or monthly basis. Data Record-2 can be communicated after the 1232
event ended. In case the existing capability doesn’t allow communication of the whole 1233
records, shorter version of the information can be communicated as follows: 1234

GUIDELINES ON THE DEFINTION AND MONITORING OF EXTREME WEATHER AND CLIMATE EVENTS
54 | P a g e
Table 4.3 1235
1236
1237
1238
1239
1240
4.4 The role of the WMO Information System and the Global Data Processing and 1241
Forecasting System 1242
4.4.1 WMO Information System role in Extremes and Hazards 1243
The WMO Information System (WIS) is the WMO’s single coordinated global infrastructure 1244
for managing and exchanging weather, climate and water information. The WIS functions 1245
that are carried out by the WIS centers include: 1246
1) Collect observations, generate products, create metadata and archive information; 1247
2) Assign user role, 1248
3) Maintain and expose a catalogue of services and information; 1249
4) Authorize access to information by users 1250
5) Deliver information to users 1251
6) Manage System performance 1252
1253
1254
Metadata
Record
Event
Code
Region Country
Data
Record 1
Date
General
Position
Position
Extreme
Value-1
Max
Magnitude
Data
Record 2
Start
Date
End
Date
General
Position
Severity

GUIDELINES ON THE DEFINTION AND MONITORING OF EXTREME WEATHER AND CLIMATE EVENTS
55 | P a g e
1255
Fig. X Functional Structure and User Community of WIS 1256
WIS deals mainly with information management and dissemination aspects, while the actual 1257
content of data and products falls outside the scope of WIS and is matter for the specific 1258
program which generates that data and products. 1259
The WMO Manual on WIS (WMO-No.1060) provides the organizational, functional and 1260
technical specifications of the various WIS centres. It also gives the updated list of these 1261
centres as per CBS recommendations and WMO executive council and Congress approval. 1262
WIS role is expected to be the main vehicle of information on extremes and hazards using its 1263
infrastructure and standards as follow: 1264
1) WIS will ensure an easy discovery of, access to and dissemination of information on 1265
extremes based on the WMO catalogue on weather and climate extremes and hazards 1266
and the adopted codes for identification of extremes. 1267
2) The National Meteorological and Hydrological Services will be in charge of 1268
collecting all the information on extremes and hazards and disseminate as described 1269
in section 4.3, using the extreme identifier codes. In this context the NMHS acts as 1270
WIS National Centers. 1271
3) The NMHS should communicate to the Relevant RCCs the information on extremes 1272
and hazards as indicated in section 4.3. The RCC plays in this context the role of a 1273
Data Collection and Production Center (DCPC). 1274

GUIDELINES ON THE DEFINTION AND MONITORING OF EXTREME WEATHER AND CLIMATE EVENTS
56 | P a g e
1275
4.4.2 Global Data Processing and Forecasting System Role 1276
The current version of the GDPFS doesn’t accommodate appropriately the requirements for 1277
processing and monitoring information on extreme weather and climate events as described 1278
in the context of these guidelines. It is hoped that the new version of GDPFS which is under 1279
preparation will allow this possibility. In this regards, for example the content of the 1280
catalogue on extremes and hazards can be maintained within the planned GDPFS, in such an 1281
Annex form or appendix. In addition, the regulations on processing information on extremes 1282
and hazards as described in chapter 3 and mechanisms such as climate watches and climate 1283
risk warning issued in real or quasi-real time basis can also be described. The provisions on 1284
extremes and hazards in the GDPFS should be defined more clearly in consultation between 1285
CCl and CBS. 1286
1287
GUIDELINES ON THE DEFINTION AND MONITORING OF EXTREME WEATHER AND CLIMATE EVENTS
57 | P a g e
5. WMO portal on Extreme Weather and Climate Events 1288
1289
5.1 Present status of information on extremes weather and climate extremes 1290 1291
A wide range of information is available on the meteorological and climatological aspects1 of 1292
extreme weather and climate events, or hazards. At the national level, much information is 1293
produced by NMHSs and other relevant official agencies. Several agencies, as well as regional 1294
organisations such as RCCs (especially the RA-II Centre in Japan and the RA-VI Centre in 1295
Germany) and the European Centre for Medium Range Weather Forecast (ECMWF), also 1296
produce information relating to extreme events on a global and continental scale, drawing on a 1297
variety of sources, including Global Telecommunication System (GTS) data and material 1298
supplied by individual countries. Information on extreme events also form a significant part of 1299
international publications such as the annual WMO Statement on the Status of the Global 1300
Climate and the State of the Climate report published as a supplement to journals such as the 1301
Bulletin of the American Meteorological Society. 1302
1303
There are also many sources of information on such events from non-official sources, including 1304
media outlets, Wikipedia and similar sites, and blogs (some specific examples of which are cited 1305
later in this report). Sometimes such information is traceable back to an official source, 1306
sometimes not. On occasions, extensive coverage of an extreme event can result in the 1307
widespread propagation of incorrect information (e.g. the widely reported claim that the 2010 1308
Pakistan floods inundated 20 per cent of Pakistan’s land area. Also, it was reported by a number 1309
of credible, but non-official sources, that 18 countries had set national temperature records in 1310
2010, but only four of these could be confirmed with the countries concerned for use in the 1311
WMO Statement. 1312
1313
1314
Access to authoritative official information, either at the national level or through organizations 1315
such as the RCCs, is important to make the best possible information on extreme weather and 1316
climate events available to the global community. Such a portal would also be a very useful 1317
source of information for publications such as the WMO Statement. 1318
1319
Information on extreme events can be found on national websites in local languages. The wide 1320
availability of automatic translators online often allows useful information to be obtained from 1321
such products, if they can be located. It is, however, often very difficult. 1322
1323 1324
5.2 Purpose of the WMO portal 1325
1 Information on the impacts of extreme weather and climate events is outside the scope of TT-DEWCE, although some national/international products referred to in this paper contain information.

GUIDELINES ON THE DEFINTION AND MONITORING OF EXTREME WEATHER AND CLIMATE EVENTS
58 | P a g e
1326 The purpose of the WMO portal on extreme weather and climate events, or hazards is to provide 1327
a single point of access to a wide range of national and regional material on extreme weather and 1328
climate events, thus assisting in making such information accessible and disseminating it to the 1329
widest possible audience. A great deal of material is being produced by NMHSs on extreme 1330
weather and climate events, but it is spread across a very large number of national-level sites and 1331
is often difficult to locate and access, especially for those unfamiliar with the local language. In 1332
other cases, such material is not available on line even if it exists. 1333
1334
An NMHS or other institution is sought to be the host for the infrastructure for the portal. This 1335
could be done by the NMHS alone or with the support of a group of relevant experts from 1336
elsewhere. In the first instance, it is not proposed that the host of a portal carry out any data 1337
analysis of its own, although that could be part of a longer-term extension in a second or 1338
subsequent stage development. 1339
1340
5.3 Functions of the portal 1341
1342
The following products are proposed for inclusion in a first-stage portal: 1343
Links to published national monthly, seasonal and annual climate summaries. 1344
Links to known, stable sources of national-level information on extreme events (e.g. the 1345
Special Climate Statements produced by Australia). 1346
Providing the capacity for NMHSs to upload information on high-impact events which 1347
have taken place in their country, using a defined catalogue of extreme weather and 1348
climate events and data base model. 1349
Analyses, using GTS data, of extreme values at the monthly timescale. (In the first 1350
instance it is suggested that the Tokyo Climate Centre or NCEIbe approached to make 1351
their analyses available to the portal, but at a later stage such an analysis could be carried 1352
out independently). 1353
A consolidated set of tropical cyclone information available soon after each cyclone. 1354
(This is suggested as a good initial option because there are only a relatively small 1355
number of data centres to deal with). 1356
An extension of the existing global and continental records portal, currently hosted by 1357
Arizona State University, to cover national and location-specific record information. An 1358
alternative platform for this could be a WMO climate normals page, if one is likely to go 1359
online in the foreseeable future. 1360
A list of recommended documents (or links to these documents) that can help members in 1361
reporting about the extremes (this includes WMO, TT-DEWCE documents and others). 1362
A link to the recommended software (if any) for calculations with a downloading 1363
possibility. 1364
1365

GUIDELINES ON THE DEFINTION AND MONITORING OF EXTREME WEATHER AND CLIMATE EVENTS
59 | P a g e
It is expected, on the basis of experience with the RA-VI RCC (which is seen as a possible 1366
model for the proposed portal), that the host will need to play a reasonably active role in 1367
collecting and curetting content; some countries will actively send material but other material 1368
will need to be actively sought if the portal is to have reasonable global coverage. 1369
1370
1371
1372
1373
1374
1375
1376
1377
1378
GUIDELINES ON THE DEFINTION AND MONITORING OF EXTREME WEATHER AND CLIMATE EVENTS
60 | P a g e
References: 1379
1. Acero, F. J., J. A. Garcia & M. C. Gallego (2011) Peaks-over-Threshold Study of Trends in Extreme Rainfall over the 1380
Iberian Peninsula. Journal of Climate, 24, 1089-1105. 1381
2. Alexander, L.V., X. Zhang, T.C. Peterson, J. Caesar, B. Gleason, A.M.G. Klein Tank, M. Haylock, D. Collins, B. 1382
Trewin, F. Rahimzadeh, A. Tagipour, K. Rupa Kumar, J. Revadekar, G. Griffiths, L. Vincent, D.B. Stephenson, J. 1383
Burn, E. Aguilar, M. Brunet, M. Taylor, M. New, P. Zhai, M. Rusticucci and J.L. Vazquez-Aguirre, 2006: Global 1384
observed changes in daily climate extremes of temperature and precipitation, J. Geophys. Res. 111, DO5109 doi: 1385
10.1029/2005JD00690. 1386
3. Chen, Y. and Zhai, P. (2014), Two types of typical circulation pattern for persistent extreme precipitation in Central–1387
Eastern China. Q.J.R. Meteorol. Soc., 140: 1467–1478. doi: 10.1002/qj.2231 1388
4. Dash, SK and A. Mamgain, 2011: Changes in the Frequency of Different Categories of Temperature Extremes in India 1389
Journal of Applied Meteorology and Climatology 50(9): 1842-1858 DOI: 10.1175/2011JAMC2687.1 1390
5. Hayes, M., M. Svoboda, N. Wall, and M. Widhalm, 2011: The Lincoln declaration on drought indices: Universal 1391
meteorological drought index recommended. Bull. Amer. Meteor. Soc., 92, 485–488, doi:10.1175/2010BAMS3103.1 1392
6. Heim RR Jr, 2002: A review of twentieth-century drought indices used in the United States. Bull Am MeteorolSoc 1393
83:1149–1165. 1394
7. Karl, Thomas R.; Jones, Philip D.; Knight, Richard W.; Kukla, George; Plummer, Neil; Razuvayev, Vyacheslav; Gallo, 1395
Kevin P.; Lindseay, Janette; Charlson, Robert J.; and Peterson, Thomas C., Asymmetric Trends of Daily Maximum and 1396
Minimum Temperature (1993). Papers in Natural Resources. Paper 185. 1397
8. Karl, T.R. and R.W. Knight, 1998: Secular Trends of Precipitation Amount, Frequency, and Intensity in the United 1398
States, Bulletin of the American Meteorological Society, 79, 231–241. 1399
9. Kharin, V.V., F.W. Zwiers, X. Zhang, G.C. Hegerl, 2007: Changes in Temperature and Precipitation Extremes in the 1400
IPCC Ensemble of Global Coupled Model Simulations. Journal of Climate. Vol 20, 1419-1444 1401
10. Kunkel, K.E., K. Andsager and D.R. Easterling, 1999: Long-term trends in extreme precipitation events over the 1402
conterminous United States and Canada, Journal of Climate, 12 (8): 2515-2527. 1403
11. IPCC, 2007: Climate Change 2007: The Physical Science Basis. Contribution of Working Group I to the Fourth 1404
Assessment Report of the Intergovernmental Panel on Climate Change [Solomon, S., D. Qin, M. Manning, Z. Chen, M. 1405
Marquis, K.B. Averyt, M.Tignor and H.L. Miller (eds.)]. Cambridge University Press, Cambridge, United Kingdom 1406
and New York, NY, USA. 1407
12. IPCC, 2012: Managing the Risks of Extreme Events and Disasters to Advance ClimateChange Adaptation. A Special 1408
Report of Working Groups I and II of theIntergovernmental Panel on Climate Change [Field, C.B., V. Barros, T.F. 1409
Stocker,D. Qin, D.J. Dokken, K.L. Ebi, M.D. Mastrandrea, K.J. Mach, G.-K. Plattner, S.K. Allen,M. Tignor, and P.M. 1410
Midgley (eds.)]. Cambridge University Press, Cambridge, UK,and New York, NY, USA, 582 pp 1411
13. IPCC, 2013: Climate Change 2013: The Physical Science Basis. Contribution of Working Group I to the Fifth 1412
Assessment Report of the Intergovernmental Panel on Climate Change [Stocker, T.F., D. Qin, G.-K. Plattner, M. 1413
Tignor, S.K. Allen, J. Boschung, A. Nauels, Y. Xia, V. Bex and P.M. Midgley (eds.)]. Cambridge University Press, 1414
Cambridge, United Kingdom and New York, NY, USA, 1535 pp, doi:10.1017/CBO9781107415324. 1415
14. Metzger, KB; Ito, K; Matte, TD, 2010: Summer Heat and Mortality in New York City: How Hot Is Too Hot? 1416
Environmental Health Perspectives 118:80-86 1417

GUIDELINES ON THE DEFINTION AND MONITORING OF EXTREME WEATHER AND CLIMATE EVENTS
61 | P a g e
15. Palmer, Wayne C., 1965: Meteorological Drought -- https://www.ncdc.noaa.gov/temp-and-1418
precip/drought/docs/palmer.pdf 1419
16. Peterson, T. C., M. P. Hoerling, P. A. Stott and S. Herring, Eds., 2013: Explaining Extreme Events of 2012 from a 1420
Climate Perspective. Bull. Amer. Meteor. Soc., 94 (9), S1–S74 1421
17. Pezza, AB.,Rensch, P .,Cai, WJ.,(2012) Severe heat waves in Southern Australia: synoptic climatology and large scale 1422
connections Climate Dynamics: 38:209-224 1423
18. Radinović, D. and Ćurić, M. (2014), Measuring scales for daily temperature extremes, precipitation and wind velocity. 1424
Met. Apps, 21: 461–465. doi: 10.1002/met.1356 1425
19. Ren, L., P.A. Arkin, T.M. Smith, and S.S.P. Shen, 2013: Global precipitation trends in 1900-2005 from a 1426
reconstruction and coupled model simulations. J. Geophys. Res., 118, 1-11, doi:10.1002/jgrd.50212. 1427
20. Svensson and Jones, 2002: Dependence between sea surge, river flow and precipitation in south and west Britain. 1428
Hydrology and Earth System Sciences, 8(5), 973–992 1429
21. Svoboda, MD, Hayes MJ, Wilhite DA, 2001: The role of integrated drought monitoring in drought mitigation planning, 1430
Annals of Arid Zone 40(1): 1-11. 1431
22. Van den Brink, H. W., onnen, G. P., Opsteegh, . D., van Olden-borgh, G. J., and Burgers, G.: Estimating return 1432
periods of extreme events from ECMWF seasonal forecast ensembles, Int. J. Climatol., 25, 1345–1354, 2005 1433
23. Willett, KM., Sherwood, S. 2012, Exceedence of heat index thresholds for 15 regions under a warming climate using 1434
the wet-bulb globe temperature International Journal of Climatology, 32 :161-177 1435
24. World Health Organization, 2012: DROUGHT - Technical Hazard Sheet - Natural Disaster Profiles, retrieved 23 1436
February 2016, http://www.who.int/hac/techguidance/ems/drought/en/ 1437
25. World Health Organization, Flooding and communicable diseases fact sheet, retrieved 23 February 2016, 1438
http://www.who.int/hac/techguidance/ems/flood_cds/en/ 1439
26. World Meteorological Organization, 1983: Guide to Climatological Practices, Second edition, WMO-182 1440
27. World Meteorological Organization, 2005: Guidelines on Climate Watches, WMO-TD No. 118 1441
28. World Meteorological Organization, 2009: Guidelines on Analysis of extremes in a changing climate in support of 1442
informed decisions for adaptation, WMO-TD No. 1500 1443
29. World Meteorological Organization, 2012: Manual on WMO Information System (WIS), WMO-TD No. 1060 1444
30. World Meteorological Organization, 2014: Climate Data Management System Specifications, WMO-No 1131 1445
31. World Meteorological Organization and World Health Organization, 2015:Heatwaves and Health: Guidance on 1446
Warning-System Development, WMO- No. 1142 1447
32. Mason SJ, Waylen PR, Mimmack GM, Rajaratnam B, Harrison JM. 1999. Changes in extreme rainfall events in South 1448
Africa. Climate Change 41: 249 – 257. 1449
33. Melillo, Jerry M., Terese (T.C.) Richmond, and Gary W. Yohe, Eds., 2014: Highlights of Climate Change Impacts in 1450
the United States: The Third National Climate Assessment. U.S. Global Change Research Program, 148 pp. 1451
34. Zhai, P., X. Zhang, H. Wan, X. Pan, 2005: Trends in Total Precipitation and Frequency of Daily Precipitation 1452
Extremes over China. Journal of Climate.Vol 18.1096-1107. 1453
1454