
Guidelines on Handheld Raman Field Identification Devices ... · General guidelines for Raman...
46
1 Guidelines on Handheld Raman Field Identification Devices for Seized Material
Transcript of Guidelines on Handheld Raman Field Identification Devices ... · General guidelines for Raman...

1
Guidelines on
Handheld Raman Field Identification
Devices for Seized Material

Acknowledgements
UNODC’s Laboratory and Scientific Section (LSS, headed by Dr. Justice Tettey) wishes to express its
appreciation and thanks to Ms. Ying Ying Tan, Health Sciences Authority, Singapore, for the
preparation of the final draft of the present Guidelines.
The preparation of the present Guidelines was coordinated by Ms. Yen Ling Wong, Scientific Affairs
Officer, LSS. The contribution of UNODC staff members is gratefully acknowledged.
Photos © UNODC, Health Sciences Authority, Singapore and Johannes Kittel

2
Table of Contents
Acknowledgements ................................................................................................................................. 2
Part 1. General guidelines for Raman devices ...................................................................................... 3
1. Introduction ................................................................................................................................ 4
2. Principles of Raman spectroscopy .............................................................................................. 5
3. Strengths and limitations of Raman technology ......................................................................... 6
4. General operating principles....................................................................................................... 7
5. Preventing cross contamination ................................................................................................. 9
6. Interpretation and documentation of scan results ..................................................................... 9
7. Validation of Raman devices ....................................................................................................... 9
8. Customisable user libraries ....................................................................................................... 11
Part 2. User guide for TruNarc handheld narcotics analyzer .............................................................. 13
1. Introduction to TruNarc handheld narcotics analyzer .............................................................. 14
2. Key components of TruNarc analyzer ....................................................................................... 15
3. Working principle of TruNarc analyzer ..................................................................................... 17
4. TruNarc Substance Library ........................................................................................................ 18
5. Safety precautions .................................................................................................................... 19
6. Operation of TruNarc analyzer ................................................................................................. 20
7. TruNarc Admin software ........................................................................................................... 31
8. References ................................................................................................................................ 45

3
Part 1.
General guidelines for
Raman devices

4
1. Introduction
In recent years, there has been a significant increase in the use of Raman spectroscopy for
forensic analysis of substances of abuse. Raman spectrometers are available both as bench-top units
as well as handheld devices. The development of handheld Raman devices has drastically impacted
end-users’ ability to conduct field-based as well as in-situ analysis, allowing a rapid and non-destructive
identification of unknown samples including controlled drugs, precursors, chemicals and cutting
agents.
However, it is important to recognise and understand the limitations of such devices. For
instance, the handheld Raman devices cannot be used to analyse compounds that are dark in colour
or fluoresce. Its use in identifying mixtures with complex sample matrices may also be limited. As such,
these devices should only be used as a preliminary screening tool to provide information on the
possible identity of the seized material and should always be complemented with analysis using a
confirmatory technique performed by a laboratory.
Preliminary screening
Confirmatory testing
Fig. 1: Use of handheld Raman device as a preliminary screening tool, followed by confirmatory testing in a
laboratory

5
2. Principles of Raman spectroscopy
Raman spectroscopy1,2,3 is a form of molecular spectroscopy, based on inelastic scattering of
monochromatic light, discovered by C.V. Raman and K.S. Krishnan in 19284.
In Raman spectroscopy, the sample is first illuminated with a monochromatic laser beam which
interacts with the sample molecule, resulting in scattering of light. The majority of the photons
(>99.99999%5) will be elastically scattered, i.e. photons will be scattered in all directions without a loss
in energy or change in frequency. This form of scattering is known as Rayleigh scattering. On the other
hand, a small amount of scattered photons will be inelastically scattered, resulting in photons having
a change in energy. This form of scattering is known as Raman scattering.
A Raman spectrum is a plot of the intensity of Raman scattered light as a function of its
frequency difference from the incident radiation (usually expressed in wavenumber, cm-1)5. This
difference is commonly known as Raman shifts and such shifts provide information about vibrational
and rotational transitions in a molecule.
Generally, the vibrational and rotational transitions are unique for every molecule. As such,
Raman spectroscopy can be an invaluable and powerful tool in providing molecular information, based
on the structure of the molecule and its light scattering properties.
Fig. 2: A Raman spectrum of a GBL sample (in blue) compared to a reference spectrum (in red)

6
3. Strengths and limitations of Raman technology
While there are numerous strengths that promote the use of handheld Raman devices in the
analysis of unknown samples in the field, users need to be aware of the limitations of such devices.
Some notable strengths and limitations of this technology are highlighted below:
� Analysis is rapid and easy to perform
� Non-destructive
� High selectivity
� Provides specific functional group
information
� Samples can be analysed directly
through transparent or translucent
containers (e.g. plastic, glass)
� Suitable for diverse types of samples:
solid, liquid or slurry, either
transparent or opaque
� Little or no sample preparation
required
� No interference from water. Aqueous
samples are possible
� Relatively low sensitivity; may not be
able to detect drugs of interest present
in low levels
� Fluorescence from sample interferes
with analysis
� Not suitable for dark samples, which
absorb laser energy and can heat up or
ignite
� Not suitable for a sample with a
complex matrix
� Laser source may experience
fluctuation
� Only suitable for qualitative analysis
Strengths
Limitations

7
4. General operating principles
4.1 Performance check
A performance check is conducted to demonstrate that an instrument or equipment is able to
perform according to the manufacturer’s specifications and is appropriate for routine use. Most
handheld Raman devices are equipped with a reference material for conducting this check. Such
performance checks should be performed once at the beginning of a batch analysis.
4.2 Analysis of samples
Direct analysis of the samples can be performed using handheld Raman devices with minimum
or no sample preparation. Such devices can be used to analyse samples present in different forms such
as powder, crystal, tablet, capsule and liquid as well as scan through a thin layer of common packaging
material such as transparent or translucent glass or plastic.
However, in some cases where the laser beam is unable to penetrate the packaging material,
sample preparation may be necessary. For solid samples, an appropriate amount is transferred into a
transparent plastic packet while for liquid samples, a small quantity is placed into a transparent glass
vial for direct scanning.
Scanning is usually performed by holding the test sample close to the laser aperture (for instance
through direct contact or point-and-shoot) and pressing a few buttons on the Raman device to initiate
the scan. Results of the scan will then appear on the screen of the device within 1 to 2 minutes.
TIPS
� Perform 3 scans in different positions as sample may not be
homogeneous
� To minimise interference from background light, perform scan in a
shaded area or away from direct sunlight

8
4.3 Safety precautions
General safety precautions should be adhered to when handling test samples, including the use
of protective gloves and eye protection e.g. safety glasses, if necessary.
The device makes use of a laser beam and as such, it is important for users to be aware of safety
issues associated with the use of this device and the types of samples that require extra care.
The following safety precautions should be adhered to at all times when operating the handheld
Raman devices:
! Handle the device at a safety distance recommended by the manufacturer in all direction
during a scan.
! Never look directly into the laser source, laser beam path or scattered laser light from any
reflective surface.
! Never point the device directly at a person.
! Avoid scanning dark-coloured compounds. The laser beam in this analyzer can potentially
cause the dark-coloured substance to burn or ignite if scanned directly.
! Avoid scanning a sample that is suspected to be explosive as the sample may burn or ignite
if scanned directly (for both light- or dark-coloured compounds).
! Avoid performing “point-and-shoot” scan on samples placed on a dark-coloured surface as
the surface may absorb enough laser energy to ignite a potential flammable or explosive
material.

9
5. Preventing cross contamination
Contaminated surfaces may result in inaccurate scan result indicated on the Raman device. All
working surfaces where sample analysis is performed should be properly wiped with alcohol (e.g.
ethanol, isopropanol) prior to performing each scan, to prevent cross contamination.
6. Interpretation and documentation of scan results
Interpretation of scanned results may be necessary when inconclusive results are obtained or
where additional intelligence information is available. In such situations, further confirmatory testing
performed by a laboratory is necessary. For instance, a packet of crystalline substance is tested
positive for lactose on the handheld Raman device. However, prior intelligence information indicated
otherwise, i.e. methamphetamine is present. In such a situation, it is still necessary to send the sample
to a laboratory for confirmatory testing to rule out the presence of methamphetamine, which may be
present at a low level that is beyond the sensitivity of the device.
Most Raman devices are supported with software which allows the user to upload or copy scan
results stored in the device to a computer or laptop for review, generation of test reports or archiving.
Alternatively, the scan results can be documented manually using a recording sheet for information
such as scan ID, date and time of analysis, test results and name of analyst performing the scan.
7. Validation of Raman devices
It is recommended that validation of the Raman device is performed by a laboratory to assess
and verify its operational performance and effectiveness in the preliminary screening of seized
material. The following studies may be performed:
(i) Verification study of the spectral library
(ii) Repeatability and reproducibility study
(iii) Interference study for packaging materials
(iv) Studies on matrix effects using street samples and sample mixtures prepared in-house

10
7.1 Verification study of library
The validity of the spectral library installed on the device can be verified by scanning a variety
of drug reference materials of different drug classes to determine if a correct identification can be
made. An example of a validation plan comprising of multiple drugs from different drug classes is
shown below:
Drug classes Examples of drug reference materials used for verification
Amphetamine-type stimulants Amphetamine, MDEA, MDMA, methamphetamine
Benzodiazepines Clonazepam, diazepam, nimetazepam, oxazepam
Opiates Heroin, methadone, morphine, oxycodone
Synthetic cathinones alpha-PVP, MDPV, mephedrone, methylone
Synthetic cannabinoids 5F-APINACA, JWH-018, MDMB-CHMICA, XLR-11
Other drugs 25B-NBOMe, acetylfentanyl, cocaine hydrochloride, GHB
Precursors Acetic anhydride, ephedrine, phenyl-2-propanone, safrole
Cutting agents/diluents Acetaminophen, caffeine, lactose, levamisole
Solvents Acetone, chloroform, methyl ethyl ketone, toluene
Table 1: Examples of reference material used for verification study of library
7.2 Repeatability and reproducibility study
For the repeatability and reproducibility study, each sample prepared for the above study (i.e.
verification study of library in Section 7.1) can be scanned in triplicate by three different operators.
The triplicate analysis conducted on each sample will provide the repeatability data while the analysis
conducted by three different operators will provide the reproducibility data.
7.3 Interference study for packaging materials
Common packaging materials used to contain seized material can be used in this interference
study and may include plastic packet, straw and container as well as glass vial, bottle and tube.
Appropriate reference materials or street samples can be placed into these packaging materials for
direct scanning to determine if a positive identification is possible.

11
7.4 Studies on matrix effects
7.4.1 Study on matrix effects using prepared sample mixtures
Sample mixtures can be prepared by mixing drug reference material with common cutting
agents in different proportions. Each mixture should be sufficiently pulverized and homogenized using
a mortar and pestle prior to scanning. This study can be further extended to determine the
approximate limit of detection for the drug of interest. An example is shown below:
Mixture
No.
Drug of interest Cutting agents
Controlled substance Percentage (%) Cutting agent Percentage (%)
1 Heroin 75 Caffeine 25
2 Heroin 50 Caffeine 50
3 Heroin 25 Caffeine 75
4 Heroin 10 Caffeine 90
Table 2: Sample mixtures for study on matrix effects
7.4.2 Study on matrix effects using street samples
Street samples of the different drug classes with different purity and sample matrix are
scanned with the handheld Raman device. The scan results obtained by the device will then be
compared to that obtained using a confirmatory analytical technique (e.g. Gas Chromatograph-Mass
Spectrometry, GCMS).
8. Customisable user libraries
Some handheld Raman devices allow users to customise their own user libraries. This additional
feature is very useful especially when the substance of interest is not available in the in-built
commercial libraries. Some devices also permit users to highlight priority substances according to the
control status or level of safety risks.
For addition of new substances to the user libraries, certified reference material should be used.
When certified reference material is not available, a secondary standard verified by a combination of
confirmatory laboratory analysis can be used. The source of the reference material must be
documented manually for every new library entry. This traceability measure is important to ensure
the quality of results obtained.
12
Key information
� Handheld Raman devices should only be used as screening tools
� Follow-up confirmatory analysis should be conducted in a laboratory
� The device makes use of a laser beam, thus all users must understand
the potential dangers of this device and the types of samples that
require extra care
� As far as possible, certified reference materials should be used to build a
user-customised library

13
Part 2.
User guide for
TruNarc handheld
narcotics analyzer

14
1. Introduction to TruNarc handheld narcotics analyzer
The TruNarc analyzer is one of a number of commercially available handheld Raman devices.
It is used for the presumptive screening of suspected controlled substances, precursors, chemicals and
cutting agents. There are also other handheld Raman devices which are capable of screening other
analytes such as pharmaceuticals and toxic industrial chemicals.
Samples in various forms such as powder, crystal, tablet, capsule and liquid can be screened
directly on the TruNarc analyzer. Drugs or analytes that can be identified by the TruNarc analyzer
include:
• Opioids (e.g. heroin, oxycodone)
• Stimulants (e.g. cocaine, methamphetamine)
• Sedative/hypnotics (e.g. clonazepam, diazepam)
• Hallucinogens (e.g. GHB, ketamine)
• New Psychoactive Substances (NPS) (e.g. synthetic cannabinoids, synthetic cathinones)
• Precursors and chemicals (e.g. acetic anhydride, ephedrine, piperonal, safrole)
• Cutting agents and diluents (e.g. caffeine, dimethyl sulfone, lactose)
Fig. 3: Common drugs of abuse which can be screened using the TruNarc Analyzer

15
2. Key components of TruNarc analyzer
The key components of the TruNarc analyzer include the nose cone, keys on the analyzer unit,
self-check standard, laser indicator light/aperture, USB connector as well as the AC adaptor cable.
Nose cone
• Removable black plastic cap used for
holding of sample in the correct position
for scanning
Keys
• Buttons on the analyzer used for the
selection of the respective menu options
Self-check standard
• Removable transparent plastic bar used
for the performance of a self-check
Laser indicator light
• Indicator light on the analyzer that glows
when the laser light is active during a scan
(a safety feature)
Nose cone Keys
Self-check standard
Laser indicator light

16
Laser aperture
• Clear glass window beneath the nose
cone where the laser beam exits to strike
the sample during a scan
USB connector
• Beneath the access door of the analyzer
is the USB connector which allows two
types of cables to be attached:
o AC adaptor cable to connect the
analyzer to an electrical outlet for
charging the analyzer battery
o USB cable to connect the analyzer to a
computer/laptop for the
synchronization of scan results from
the analyzer to the computer/ laptop
as well as for software upgrades and
library updates of the analyzer
• To open the access door, grasp the tab on
the door and tug/pull gently to open it
AC adaptor cable
• AC adaptor cable connects the analyzer
to an electrical outlet for charging.
• A fully charged battery can last for
approximately 8 to 10 hours
Laser aperture
Nose cone
Self-check
standard
USB connector
Connect to
electrical outlet
Fig. 4: Key components of TruNarc analyser and their functions

17
3. Working principle of TruNarc analyzer
3.1 How the TruNarc analyzer works
The TruNarc analyzer is based on Raman spectroscopy. Fig. 5 illustrates the working principle
of this device.
1. The sample packet is
placed against the nose
cone of the analyzer. The
key on the analyzer is
pressed to initiate the
laser beam.
2. The laser beam exits the
analyzer through the
nose cone and strikes the
sample contained in the
packet.
3. The energy of the laser
beam excites the molecules
in the sample causing them
to scatter Raman light. Some
of the scattered Raman light
enters the analyzer through
the nose cone, where it is
collected and analysed by
the detector.
4. The analysis produces
information about the
wavelength in the
collected Raman light and
creates a spectrum.
5. The spectrum created is
then compared and
matched against the
TruNarc substance library
using a chemometric
algorithm.
6. If a positive match is
found, the identity of
the drug of interest will
be reflected on the
screen of the TruNarc
analyzer.
Fig. 5: How the TruNarc analyzer works

18
3.2 Second derivative processing of spectral plot
The TruNarc analyzer uses the second derivative processing of spectral plot to sharpen peaks
of interest and remove broad fluorescence bands. As such, this helps to improve the sensitivity of this
analyzer, especially in the detection of drugs of interest in sample mixtures.
However, one drawback of the second derivative plot is that the spectrum obtained by the
analyzer cannot be compared with that found in literature which is normally a plot of the intensity of
Raman scattered light as a function of its frequency difference from the incident radiation (see Fig. 2).
4. TruNarc Substance Library
The TruNarc Substance Library is used by the TruNarc analyzer to identify compounds of
interest present in the unknown sample. This library can be updated during software upgrade which
is provided by Thermo Scientific annually throughout the lifetime of the analyzer.
Categories Types of Compounds
Alarm Controlled substances
Clear Cutting agents and diluents
Precursor/
Chemical Precursors and chemicals
Warning
(Cannot rule
out the
presence of
narcotic)
Substances that have strong Raman signals which can potentially mask
certain drugs of interest (e.g. aspirin, ephedrine, ibuprofen,
paracetamol). An alternative test method is recommended
Fig. 6: Second derivative processing of spectral plot
Table 3: Different categories of compounds of interest in TruNarc Substance Library

19
5. Safety precautions
The TruNarc analyzer makes use of a Class 3B laser to perform scans and this can cause ocular
damage. As such, they should be operated by trained personnel who are familiar with the safety
precautions when handling such devices. The safety distance of this device is 35 cm from the nose
cone of the analyzer in all direction.
Care should be taken to avoid performing “point-and-shoot” scan on dark-coloured samples,
or samples placed on a dark-coloured surface as the surface may absorb enough laser energy to ignite
potentially flammable or explosive material.
Fig. 7: Left and middle picture: Adhere to safety distances when scanning is performed. Right picture: Avoid
scanning substances on dark surfaces.
35 cm
� � �

20
6. Operation of TruNarc analyzer
6.1 Power on/off the TruNarc analyzer
6.1.1 Power on the TruNarc analyzer
The TruNarc analyzer can be switched on using the following procedures:
Fig. 8: Power on the TruNarc analyzer
2
1. Press and release the bottom key on the
TruNarc analyzer.
2. The Activate Laser screen appears.
Enter the laser activation code by
pressing the button next to each
number.
4. When you enter the last number of the
code, the laser activates and the
Welcome screen appears.
3. As the code is entered, asterisks will
appear in the boxes on the screen.
1
2
3

21
6.1.2 Power off the TruNarc analyzer
The TruNarc analyzer can be switched off at any time, even during the scan. The TruNarc
analyzer can be switched off using the following procedure:
6.2 Performing a self-check
A self-check serves as a performance check to ensure proper functioning of the TruNarc
analyzer in accordance to the manufacturer’s specifications. It is recommend that a self-check is
performed once at the beginning of a batch analysis.
The results of such self-checks will be stored in the analyzer and can be uploaded or copied
from the analyzer to the TruNarc Admin software along with other scan results. Reports of a self-check
can also be created and printed using this software and be kept as supporting evidence of proper
functioning of the analyzer during the sample scans.
For procedures on uploading of self-check results from the analyzer to TruNarc Admin software
as well as creation and printing of such reports, refer to Sections 7.2 and 7.4, respectively.
Fig. 9: Power off the TruNarc analyzer
1. Press and hold the bottom key for 10
seconds.
2. After holding for 5 seconds, the analyzer
will begin a 5 seconds countdown before
switching off.

22
6.2.1 Self-check procedures
A self-check can be performed using the following procedures:
1. Place the self-check standard in the closed
position
closed position
2. Select the “Check” option in the
Welcome screen by pressing the key next
to it.
3. The Self-check screen appears.
Select “Check” option again by pressing
the key next to it
4. The laser light glows indicating that the
laser is on and analyzer is scanning.
5. The analyser will display a result in the
Self-check Result screen.
Select “OK” to return to the Welcome
screen.
1
2
3
4
Fig. 10: Procedures to perform self-check

23
6.2.2 Types of self-check results:
Two possible self-check results can be obtained:
6.3 Preparation of sample for scanning
The TruNarc analyzer can be used to scan samples present in different forms, such as powder,
crystal, tablet, capsule or liquid. In addition, the analyzer can scan through common packaging
materials such as transparent or translucent glass or plastic with a thickness of less than 2 mm. As
such, direct scanning can be easily performed with minimum or no sample preparation except in
situations where the Type H test kits are used. For sample preparation procedures using such test kits,
refer to Section 6.6.3.
PASS
� This result indicates that the analyzer is
operating in accordance to the factory
specifications.
FAIL
� This result means that the analyzer is not
operating correctly.
� Wipe the self-check standard with a
clean tissue damped with ethanol.
� Perform the self-check again. If a “Pass”
result is achieved, select “OK” to return
to the Welcome screen to start scanning
samples.
� If a “Fail” result is achieved again,
remove the analyzer from use and
contact Thermo Scientific Customer
Support for technical help.

24
6.4 Scanning of sample
6.4.1 Scanning of sample through a plastic packet
Scanning of a sample contained in a plastic packet can be performed using the following procedures:
Fig. 11: Procedures to scan samples
6. The analyzer will display a result in the
Scan Result screen. Select “OK” to return to
the Welcome screen.
2. Select the “Scan” option in the Welcome
screen by pressing the key next to it.
3. The Scan Ready screen appears. In this
screen, select the “Scan” option again by
pressing the key next to it.
1. Self-check standard should be in the open
position. Press the packet of sample firmly
against the nose cone of the analyzer. Ensure
the laser focal point (i.e. 2 mm away from nose
cone) is positioned at the sample inside the
packet.
1
4. The laser light glows indicating that the laser
is on and the analyzer is scanning. Hold the
sample still during the scan.
5. When the laser indicator light turns off,
the analysis screen appears. The packet can
now be removed away from the nose cone.
3
5
2
4

25
6.4.2 Scanning of sample through a container
Scanning of a sample contained in a plastic or
glass container can be performed using the same
procedures outlined in Section 6.4.1. However, the
wall of such containers must be relatively thin (i.e. < 2
mm) since the laser focal point is only 2 mm from the
nose cone. When you try to scan through a thick-
walled container, the laser focal point is inside the
container wall instead of the sample contained within
the container. This makes it hard for the analyzer to collect enough data to identify the sample.
6.4.3 Scanning a tablet or pill
Scanning of a tablet or pill can be performed
using the same procedures outlined in Section 6.4.1,
except that the tablet or pill must be pressed firmly
against the nose cone.
If the tablet or pill is coated, its coating may
interfere with the scan. In such a scenario, the coating
can be removed by scraping it off and the resulting
exposed surface is then pressed against the nose cone
for scanning. Alternatively, the tablet or pill may be broken into half and the exposed interior surface
is then scanned.
6.4.4 Scanning a spilled powder
Scanning of spilled powder can be performed using
the “point-and-shoot” technique. The powder is first worked
into a pile and the nose cone is positioned on the surface of
the pile to perform the scan using procedures outlined in
Section 6.4.1.
6.5 Types of scan results
Different types of scan results may be returned by the TruNarc analyzer. Examples of possible
scan results obtained are shown in Table 4 below.

26
Type of scan
results Display on result screen What it means?
Alarm
• A controlled substance present in the TruNarc
Substance Library is detected
• If any precursor, chemical, cutting agent or
diluent is also present, it will not be identified
Precursor/
chemical
• A precursor or chemical used in the
manufacture of illicit drugs and present in the
TruNarc Substance Library is detected
• No controlled substance present in the TruNarc
Substance Library is detected
• Note: If a controlled substance is present in
trace amounts as compared to that of the
precursor or chemical, it may not be detected
Clear
• A cutting agent or diluent present in the
TruNarc Substance Library is detected
• No controlled substance, precursor or chemical
present in the TruNarc Substance Library is
detected
• Note: If a controlled substance, precursor or
chemical is present in trace amounts as
compared to that of the cutting agent or
diluent, it may not be detected
Inconclusive
• No controlled substance, precursor or chemical
as well as cutting agent or diluent present in
TruNarc Substance Library is detected
• However, the possibility of the above
substances not present in the library, cannot be
ruled out
• Other techniques of analysis should be used to
identify the unknown sample
Cannot rule
out presence
of narcotics
• Acetaminophen/aspirin is detected
• Such drug is sometimes found in combination
with narcotics present in trace amounts which is
below the detection limit of this analyzer
• Other techniques of analysis should be used to
rule out the presence of controlled substances
Polystyrene
(check that
self-test
standard is not
in the closed
position)
• Polystyrene warning indicates that the self-
check standard may be in the closed position
Table 4: Different types of scan results shown on TruNarc analyzer

27
The priority of scan results displayed on the Scan Result screen is in the following order:
(i) Controlled substances
(ii) Precursors or chemicals
(iii) Cutting agents or diluents
If the sample contains a mixture of substances in group (i) to (iii), only substances in the higher
priority group will be displayed on the screen.
6.6 Scanning of high fluorescence samples using Type H test kits
6.6.1 Emission of fluorescence light by test samples
Detection of test samples which fluoresce pose a challenge for the TruNarc analyzer. When a
laser beam strikes such a sample, it spontaneously emits a high amount of fluorescent light which
interferes and masks the Raman signals obtained. This makes it difficult for the analyzer to detect and
identify any substance of interest present in the sample and an inconclusive result will be obtained.
Some examples of high fluorescence samples include morphine and heroin.
6.6.2 Type H test kits
To resolve this problem, a special test kit that compensates for the emission of fluorescence
light can be used to produce a more reliable scan. This test kit is known as the Type H test kit. They are
equipped with a small 4 mL vial containing 1 mL of ethanol and a plastic test stick with a scoop at one
end.
At the base of the scoop is a small metal wafer that has been chemically treated to reduce the
amount of fluorescence light emitted by the test samples and therefore enhancing the Raman signal
received by the analyzer.
Fig. 12: Components of a Type H test kit
Metal wafer chemically
treated to reduce the
amount of fluorescence light

28
6.6.3 Preparation of sample for scanning using Type H test kit
Preparation of sample for scanning using the Type H test kits can be performed using the
following procedures:
Fig. 13: Procedures to prepare sample for scanning using the Type H test kit
1. Open the test kit from the package 2. Remove an appropriate amount of test
sample (~10 mg or ¼ scoop) using the
scoop of the test kit.
3. Insert the scoop containing the sample
into the vial and stir gently to dissolve the
sample. Ensure the filled scoop is fully
submerged in the ethanol solution.
4. Remove the test stick and shake it in the air
to allow the ethanol to evaporate.
A thin film of dried sample will be coated on
the metal wafer at the base of the scoop.
1
2
3

29
6.6.4 Procedures for scanning
Scanning of the metal wafer prepared in Section 6.6.3 can be performed using the following
procedures:
Fig. 14: Procedures to scan samples using Type H test kit
1. Hold the scoop end of the test kit against the
nose cone of the analyzer to scan the metal wafer.
The cup of the scoop should be centred over the
opening of the nose cone. Use the forefinger to
firmly press against the nose cone.
2. When the test kit is in the correct position,
select the “Scan” option in the Welcome screen
by pressing the key next to it.
3. The Scan Ready screen appears. In this
screen, select the “Scan” option again by
pressing the key next to it.
4. The laser light glows indicating that the laser
is on and the analyzer is scanning. Hold the test
kit firmly during the scan.
5. When the laser indicator light turns off, the
analysis screen appears. The test kit can now
be removed away from the nose cone.
6. The analyzer will display a result in the Scan
Result screen. Select “OK” to return to the
Welcome screen.
1
2
3
4
5
30
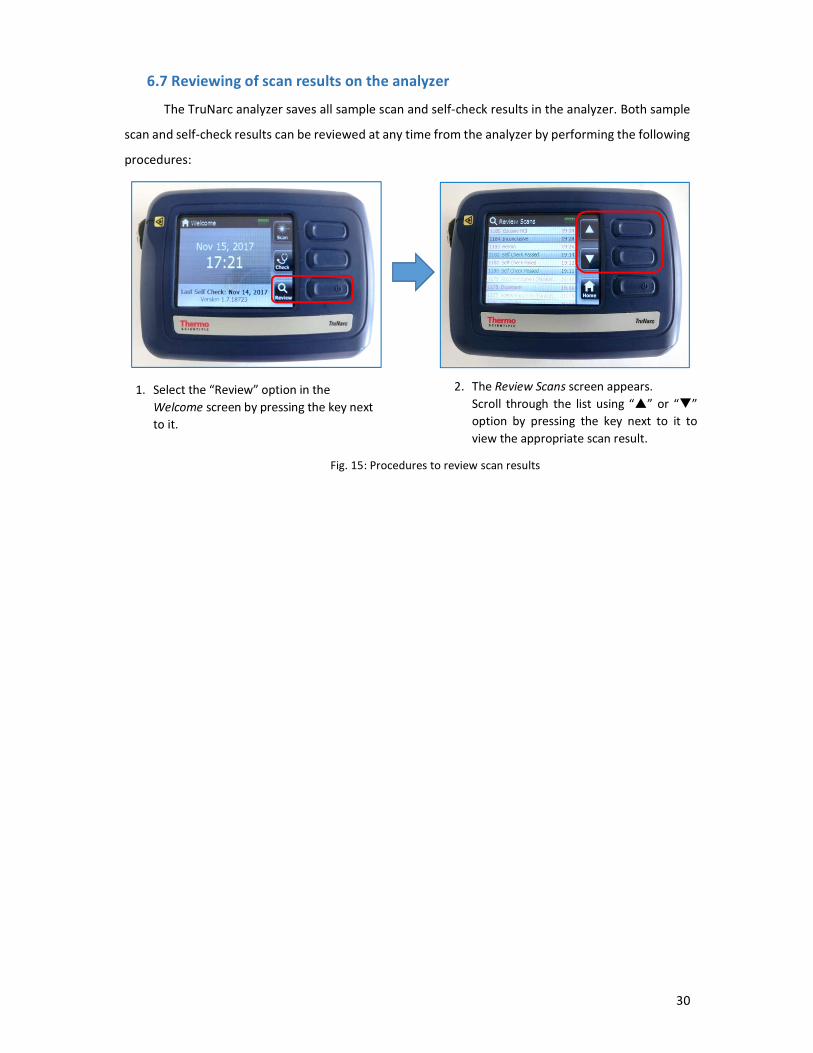
6.7 Reviewing of scan results on the analyzer
The TruNarc analyzer saves all sample scan and self-check results in the analyzer. Both sample
scan and self-check results can be reviewed at any time from the analyzer by performing the following
procedures:
Fig. 15: Procedures to review scan results
2. The Review Scans screen appears.
Scroll through the list using “�” or “�”
option by pressing the key next to it to
view the appropriate scan result.
1. Select the “Review” option in the
Welcome screen by pressing the key next
to it.
1

31
7. TruNarc Admin software
7.1 Introduction to TruNarc Admin software
The TruNarc Admin software is a program used by the TruNarc analyzer to allow users to
manage scan results on a computer/laptop. With the scan results are uploaded or copied from the
analyzer to the computer/laptop, users will be able to:
� create customised columns in the database to input additional information (e.g. case
officer’s name, case name)
� search for scan results by selection of different categories (e.g. name, result type, dates)
� create, save and print scan results as reports
� set date and time on the analyzer
� remove scan results from the analyzer
� view and update the TruNarc Substance Library on the analyzer
� revise customer account information and send email to customer service support
7.1.1 Launching of the TruNarc Admin software
After the TruNarc Admin software has been installed onto the
computer/laptop, this program can be launched by double-clicking this software
desktop icon as shown on the right.
Once the program is opened, the main window of the software appears. If the display area of
this window is empty, this means that the user has not synchronised the analyzer with the software.
On the other hand, if the display area of the main window of this software shows scan results,
this means that the analyzer has already been synchronised with the software and scan results
available on the analyzer have been uploaded or copied onto the database.
Fig. 16: Main window of TruNarc Admin software with scan results

32
7.1.2 Key features on main window of the TruNarc Admin software
The key features on the main window of the TruNarc Admin software include:
(i) Display area showing rows of scan results (available after synchronisation)
(ii) Serial number of the analyzer that is connected to the computer/laptop
(iii) Buttons that are only visible when the analyzer is connected
(iv) Buttons that are always visible (i.e. even when analyzer is not connected)
(v) Tools for searching of scan results by selection of category or date
(vi) Buttons for generating scan reports for printing and saving scan data in a specified format (e.g.
PDF)
(vii) Check boxes for selection of scan results
(viii) Customisable headers for entry of useful information (e.g. case officer’s name, comments)
Fig. 17: Key features on main window of the TruNarc Admin software
(i)
(v) (ii)
(iii)
(iv)
(vi)
(vii)
(viii)
33
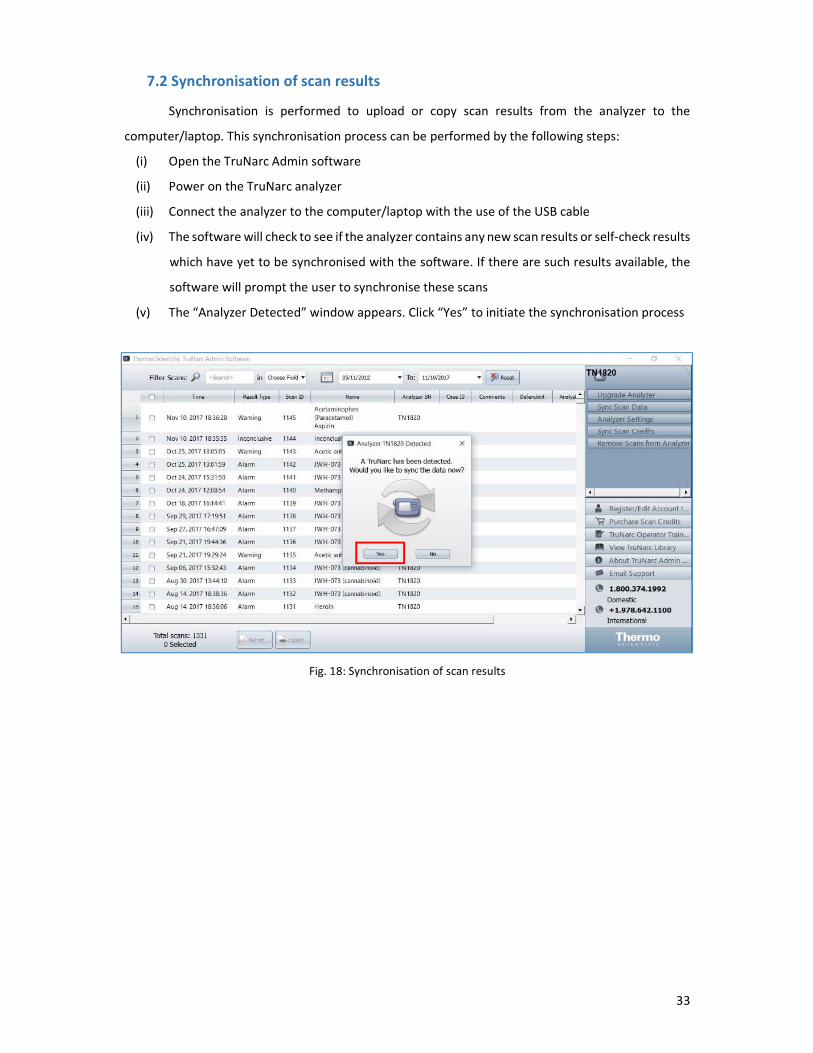
7.2 Synchronisation of scan results
Synchronisation is performed to upload or copy scan results from the analyzer to the
computer/laptop. This synchronisation process can be performed by the following steps:
(i) Open the TruNarc Admin software
(ii) Power on the TruNarc analyzer
(iii) Connect the analyzer to the computer/laptop with the use of the USB cable
(iv) The software will check to see if the analyzer contains any new scan results or self-check results
which have yet to be synchronised with the software. If there are such results available, the
software will prompt the user to synchronise these scans
(v) The “Analyzer Detected” window appears. Click “Yes” to initiate the synchronisation process
Fig. 18: Synchronisation of scan results

34
7.3 Searching for scan results
The TruNarc Admin software has search tools which allow users to quickly locate their scans
of interest. The search tools can be found in the main window of the software above the header row.
Searching for scan results can be performed at any time even when the analyzer is not connected to
the computer/laptop as long as the required scans have already been synchronised with the software.
Search for scan results can be performed either by selecting a category of interest or by selecting a
date range.
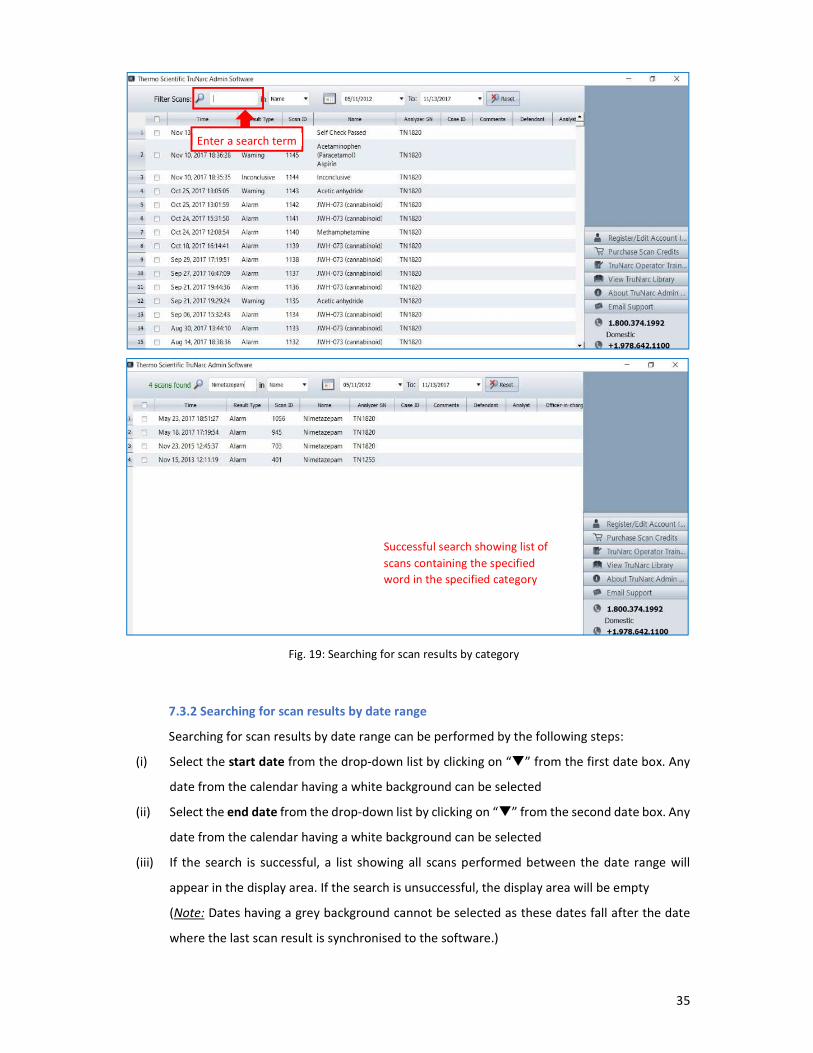
7.3.1 Searching for scan results by category
Searching for scan results by category can be performed by the following steps:
(i) Select the category of interest from the drop-down list by clicking on “�”
(ii) Enter a search term in the box next to “Filter scans”
(iii) If the search is successful, a list showing all scans containing the specified word in the specified
category will appear in the display area. If the search is unsuccessful, the display area will be
empty
Select a category
35
7.3.2 Searching for scan results by date range
Searching for scan results by date range can be performed by the following steps:
(i) Select the start date from the drop-down list by clicking on “�” from the first date box. Any
date from the calendar having a white background can be selected
(ii) Select the end date from the drop-down list by clicking on “�” from the second date box. Any
date from the calendar having a white background can be selected
(iii) If the search is successful, a list showing all scans performed between the date range will
appear in the display area. If the search is unsuccessful, the display area will be empty
(Note: Dates having a grey background cannot be selected as these dates fall after the date
where the last scan result is synchronised to the software.)
Enter a search term
Fig. 19: Searching for scan results by category
Successful search showing list of
scans containing the specified
word in the specified category

36
Selection of start date
Selection of end date
Successful search showing list of
scans performed between the date
range
Fig. 20: Searching for scan results by date range

37
7.4 Report files
7.4.1 Information on report files
A report file is a printable record of a specific scan result which can be attached to case records.
Multiple report files can be easily created at any one time and information on the report files include:
(i) Scan spectrum which is the spectrum created by TruNarc analyzer from the scan data it collects
(ii) Library spectrum which is the spectrum that is saved in the TruNarc Substance Library
(iii) Summary of information about the scan and self-checks performed before and after the scan:
Scan: Result Scan ID Date and Time of Scan Name of
Compound
Analyzer
Serial No.
Self Check: Result Scan ID Date and Time of Scan
(iv) Thermo Scientific logo which can be replaced with the organisational logo
(i) Scan spectrum
(ii) Library spectrum
(iii) Summary of Information
(iv) Logo
Fig. 21: Example of a report file

38
7.4.2 Creation of report files
Report files can be created using the TruNarc Admin software by performing the following
steps:
(i) Select the scan of interest by clicking on the check boxes of the scan
(ii) Once the scans are selected (i.e. check boxes are ticked), the rows will be highlighted in yellow
(iii) Click the “Report” button located at the bottom of the screen
(iv) The Report Preview Window will appear immediately
(v) If multiple scans are selected, click on “�” or “�” to scroll through the preview of each report
Click on the check boxes to select the scans
The selected scans are
highlighted in yellow Click on the Report button to generate reports
39
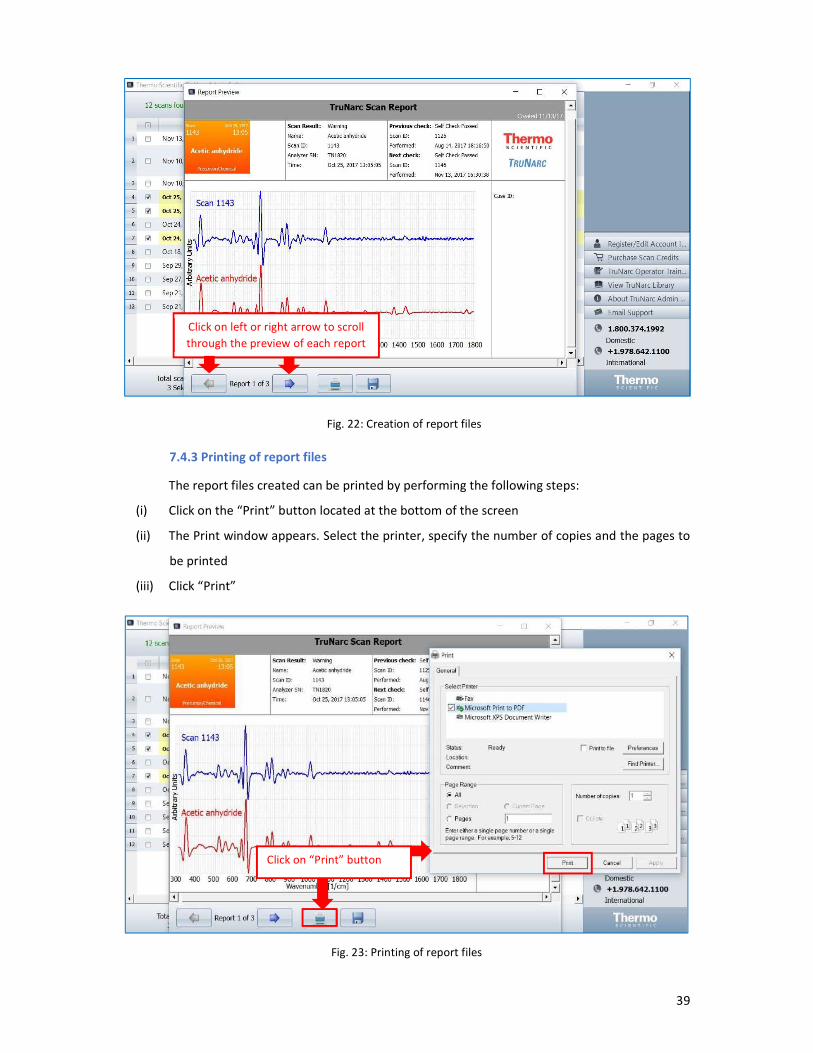
7.4.3 Printing of report files
The report files created can be printed by performing the following steps:
(i) Click on the “Print” button located at the bottom of the screen
(ii) The Print window appears. Select the printer, specify the number of copies and the pages to
be printed
(iii) Click “Print”
Click on “Print” button
Fig. 23: Printing of report files
Fig. 22: Creation of report files
Click on left or right arrow to scroll
through the preview of each report

40
7.4.4 Saving of report files
A PDF copy of report files created can be saved by performing the following steps:
(i) Click on the “Save” button located at the bottom of the screen
(ii) The Save PDF window appears. Specify the filename and location of the PDF file to be saved
(iii) Click “Save”
(Note: If the report preview shows more than one report, the PDF file saved will include all
reports created.)
Click on “Save” button
Fig. 24: Saving of report files

41
7.5 Resetting of date/time/time zone on TruNarc analyzer
It is important to update the date, time and time zone of the TruNarc analyzer to match the
local date and time of your country so that the timestamp on the scan results will be correct. Time
setting on the TruNarc analyzer can be changed using the TruNarc Admin software by performing the
following steps:
(i) Open the TruNarc Admin software
(ii) Power on the TruNarc analyzer
(iii) Connect the analyzer to the computer/laptop with the use of the USB cable
(iv) Click on the “Analyzer Settings” button located on the right hand column
(v) The Analyzer Setting window appears and shows the date, time and time zone currently set
on the analyzer
Note: Format of date setting: Year-Month-Day (e.g. 2017-11-13)
Format of time setting: Hour-Minutes-Seconds (e.g. 09: 52: 16)
(vi) To reset the date and time on the analyzer, click on “Same Time as This Computer” check box
and click “Set”. The date and time on the analyzer will be updated to match that of the
computer or laptop
(vii) To reset the time zone, click on “�” from the time zone drop-down list. Select the
appropriate time zone and click “Set”
Click on “Analyzer Settings”

42
Click on check box to
reset date and time
Current date and time
indicated on analyzer
Fig. 25: Resetting of date, time and time zone on TruNarc analyzer
Click on � to select the
appropriate time zone

43
7.6 Removal of scan results from the TruNarc analyzer
Scan results may be removed from the TruNarc analyzer once these scans have been uploaded
or copied to the computer/laptop after synchronisation. For scan results that have yet to be
synchronised, the TruNarc Admin software will prompt the user to perform synchronisation before
the user is allowed to remove these scans. Once the scan results are removed, they cannot be restored.
Scan results from the TruNarc analyzer can be removed by performing the following steps:
(i) Open the TruNarc Admin software
(ii) Power on the TruNarc analyzer
(iii) Connect the analyzer to the computer/laptop with the use of the USB cable
(iv) Click on the “Remove Scans from Analyzer” button located on right hand column
(v) The Remove Scans window appears. Click “Yes”
Fig. 26: Removing of scan results from TruNarc analyzer
Click on “Remove Scans from
Analyzer”

44
7.7 Viewing and updating of TruNarc substance library
The list of compounds present in the TruNarc Substance Library installed on the TruNarc
analyzer can be viewed using the TruNarc Admin software by performing the following steps:
(i) Click on the “View TruNarc Library” button located on the right hand column
(ii) The TruNarc Substance Library window appears showing three columns, namely “Alarm”,
“Warning” and “Benign”
Alarm Controlled substances
Warning Precursors, chemicals as well as acetaminophen, aspirin and substances that
create special scan warnings (e.g. polycarbonate and polystyrene)
Benign Cutting agents and diluents
(iii) Click on “Close” button to exit this window after viewing
Fig. 27: Viewing of TruNarc Substance Library
Click on “View
TruNarc Library”

45
8. References
1. D.A. Skoog, F.J. Holler and S.R. Crouch, Principles of Instrumental Analysis, Cengage
Learning, 6th edition, 2006.
2. H.H. Willard, L.L. Meritt Jr., J.J. Dean. F.A. Settle Jr. Instrumental Methods of Analysis, CBS
Publisher & Distributors, 7th Edition, New Delhi, 1998.
3. G.S. Bumbrah, R. M. Sharma, Raman Spectroscopy – Basic Principles, Instrumentation and
Selected Applications for the Characterisation of Drugs of Abuse, Egyptian Journal of
Forensic Science, Vol. 6, Issue 3, 2016, page 209-215.
4. C.V. Raman, K.S. Krishnan, A New Type of Secondary Radiation, Nature, 121, 3048, 1928,
page 501-502.
5. http://www.nanophoton.net/raman/raman-spectroscopy.html; accessed 17 November
2017.
6. TruNarc Handheld Narcotics Analyser, Product Specifications, v.17_0817.
(http://www.thermofisher.com/order/catalog/product/TRUNARC; accessed 17
November 2017).
7. TruNarc Technical Evaluation Report, National Forensic Science Technology Center, 2012
(http://www.nfstc.org/forensic-technology/technology-evaluation/chemistry/; accessed
17 November 2017).
8. TruNarc Narcotics Analyzer, Training Guide, Thermo Scientific
(http://portables.thermoscientific.com/trunarctraining; accessed 17 November 2017).
9. TruNarc Substance Library: Display Names, Ver 1.7, Thermo Scientific, Aug 17
(http://www.thermofisher.com/order/catalog/product/TRUNARC; accessed 17
November 2017).


