Guidebook to Geothermal Power Finance · shows a schematic of a typical binary geothermal power...
61
NREL is a national laboratory of the U.S. Department of Energy, Office of Energy Efficiency & Renewable Energy, operated by the Alliance for Sustainable Energy, LLC. Contract No. DE-AC36-08GO28308 Guidebook to Geothermal Power Finance J. Pater Salmon, J. Meurice, N. Wobus, F. Stern, and M. Duaime Navigant Consulting Boulder, Colorado Subcontract Report NREL/SR-6A20-49391 March 2011
Transcript of Guidebook to Geothermal Power Finance · shows a schematic of a typical binary geothermal power...
NREL is a national laboratory of the U.S. Department of Energy, Office of Energy Efficiency & Renewable Energy, operated by the Alliance for Sustainable Energy, LLC.
Contract No. DE-AC36-08GO28308
Guidebook to Geothermal Power Finance J. Pater Salmon, J. Meurice, N. Wobus, F. Stern, and M. Duaime Navigant Consulting Boulder, Colorado
Subcontract Report NREL/SR-6A20-49391 March 2011
NREL is a national laboratory of the U.S. Department of Energy, Office of Energy Efficiency & Renewable Energy, operated by the Alliance for Sustainable Energy, LLC.
National Renewable Energy Laboratory 1617 Cole Boulevard Golden, Colorado 80401 303-275-3000 • www.nrel.gov
Contract No. DE-AC36-08GO28308
Guidebook to Geothermal Power Finance J. Pater Salmon, J. Meurice, N. Wobus, F. Stern, and M. Duaime Navigant Consulting Boulder, Colorado
NREL Technical Monitor: Paul Schwabe Prepared under Subcontract No. LGJ-0-40242-01
Subcontract Report NREL/SR-6A20-49391 March 2011
NOTICE
This report was prepared as an account of work sponsored by an agency of the United States government. Neither the United States government nor any agency thereof, nor any of their employees, makes any warranty, express or implied, or assumes any legal liability or responsibility for the accuracy, completeness, or usefulness of any information, apparatus, product, or process disclosed, or represents that its use would not infringe privately owned rights. Reference herein to any specific commercial product, process, or service by trade name, trademark, manufacturer, or otherwise does not necessarily constitute or imply its endorsement, recommendation, or favoring by the United States government or any agency thereof. The views and opinions of authors expressed herein do not necessarily state or reflect those of the United States government or any agency thereof.
Available electronically at http://www.osti.gov/bridge
Available for a processing fee to U.S. Department of Energy and its contractors, in paper, from:
U.S. Department of Energy Office of Scientific and Technical Information
P.O. Box 62 Oak Ridge, TN 37831-0062 phone: 865.576.8401 fax: 865.576.5728 email: mailto:[email protected]
Available for sale to the public, in paper, from:
U.S. Department of Commerce National Technical Information Service 5285 Port Royal Road Springfield, VA 22161 phone: 800.553.6847 fax: 703.605.6900 email: [email protected] online ordering: http://www.ntis.gov/help/ordermethods.aspx
Cover Photos: (left to right) PIX 16416, PIX 17423, PIX 16560, PIX 17613, PIX 17436, PIX 17721
Printed on paper containing at least 50% wastepaper, including 10% post consumer waste.
iii
Acknowledgements
This work was funded by the U.S. Department of Energy’s (DOE) Geothermal Technologies Program (GTP). The authors wish to thank Arlene Anderson and GTP for their support of this work. The authors also wish to thank the following individuals for providing information and valuable perspectives for this report: John C. S. Anderson, John Hancock Financial Services; C.J. Arrigo, Glacier Capital Partners; Todd Eagleston, NV Energy; Marco Fossataro, ENEL; Karl Gawell and Dan Jennejohn, Geothermal Energy Association; Smadar Lavi, Ormat; Martin Piszczalski, Sextant Research; Stephen Ponder, NV Energy; Alexander Richter, Islandsbanki; Dan Schochet, Ram Power; Michael Ware, Good Energies.
In addition, the authors would like to express their gratitude for the guidance, assistance, and input provided by key staff members at the National Renewable Energy Laboratory. Chad Augustine, Karlynn Cory, Paul Schwabe, Bethany Speer, and Katherine Young added significant value to this report through their initial framing of the project, regular input into the underlying research, and review of the draft versions of this report. The authors appreciate the opportunity to work with this dynamic team.
Finally, the authors also offer their gratitude to Devin Egan in NREL’s Communications Office for providing editorial support.
iv
Abstract
Investment in conventional geothermal projects on the utility side of the meter has evolved dramatically since the economic downturn began in 2008. Developers and investors identified innovative approaches to address the capital constraints that permeate the market and to take advantage of new policy incentives that emerged. These innovations are especially important in the early stages of project development, when capital providers must be comfortable with the risk associated with resource identification and test well drilling. Innovations later in the project development process responded to changes in the way that projects took advantage of federal incentives including the Section 1603 Treasury Cash Grant Program that reduced the need for tax equity in 2009 – 2011 and possibly beyond.
This guidebook is intended to facilitate further investment in conventional geothermal projects in the United States. It includes a brief primer on geothermal technology and the most relevant policies related to geothermal project development. The trends in geothermal project finance are the focus of this tool, relying heavily on interviews with leaders in the field of geothermal project finance. Using the information provided, developers and investors may innovate in new ways, developing partnerships that match investors’ risk tolerance with the capital requirements of geothermal projects in this dynamic and evolving marketplace.
v
Table of Contents
Acknowledgements ...................................................................................................... iii Abstract ......................................................................................................................... iv Table of Contents .......................................................................................................... v List of Figures .............................................................................................................. vi List of Tables ................................................................................................................ vi 1 Introduction .............................................................................................................. 1 2 Technology ............................................................................................................... 2
2.1 Basic Geothermal Technology .............................................................................................2 2.2 Emerging Geothermal Technologies ...................................................................................5
3 Policies and Incentives ........................................................................................... 7 3.1 Current Federal and State Policies and Incentives ...............................................................7
3.1.1 Tax Incentives .............................................................................................................7 3.1.2 Inter-agency Coordination and Streamlining of Federal Permitting
and Land Lease Processes ..............................................................................................9 3.1.3 Renewable Portfolio Standards .................................................................................10 3.1.4 Greenhouse Gas Emissions Reduction Policies ........................................................11
3.2 Roles of Key Policy Considerations ..................................................................................12
4 Financing Geothermal Projects ............................................................................ 14 4.1 The New World of Renewables Financing ........................................................................14 4.2 Financing Geothermal Projects ..........................................................................................15 4.3 The Staging of Geothermal Project Financing ...................................................................16
4.3.1 Early-Stage Financing ...............................................................................................17 4.3.2 Late Development Financing ....................................................................................21 4.3.3Construction & Operation Financing .........................................................................22
4.4 Common Pitfalls in Obtaining Geothermal Financing ......................................................28
5 Conclusion ............................................................................................................. 29 6 References ............................................................................................................. 32 Appendix A. Additional Detail on Relevant Policies ................................................ 39 Appendix B. Renewable Energy Certificate Value in Geothermal Project Finance 44 Appendix C. Greenhouse Gas Policy ........................................................................ 50 Appendix D. Additional Resources ............................................................................ 53
vi
List of Figures
Figure 2-1. Depiction of typical binary geothermal power plant ...............................................2 Figure 2-2. Cost per kW of geothermal energy developmental stages (typical 50 MW plant) .5 Figure 2-3. Identified potential geothermal sites in the United States (black dots) ...................5 Figure 3-1. Key federal legislation for geothermal project activity ...........................................7 Figure 3-2. EPAct 2005 provisions for geothermal .................................................................10 Figure 3-3. Effect of key policies on geothermal project income statement ...........................13 Figure 4-1. Reasons for lack of utility activity in geothermal project development and
ownership ...........................................................................................................................16 Figure 4-2. Geothermal project development and financing by stage .....................................17 Figure 5-1. Summary of this guidebook’s key information for financing
geothermal projects ............................................................................................................31 Figure B-1. Policy provisions and market forces that shape REC prices ................................46 Figure B-2. Example of the role of REC revenue in project finance .......................................48 Figure B-3. Map of North American REC tracking and trading systems ................................49
List of Tables
Table 2-1. Description of Three Geothermal Power Plant Technologies ..................................3 Table 3-2. Summary of Federal Financial Incentives for Geothermal Projects ........................8 Table 3-3. Roles of Four Policy Types in the Project Development Process ..........................12 Table 4-1. Early-Stage Equity Financing Requirements .........................................................21 Table 4-2. Mezzanine Financing Requirements ......................................................................22 Table 4-3. Possible Construction Financing Requirements .....................................................27 Table 4-4. Possible Post-Construction Project Financing Requirements ................................28 Table A-5. Summary of State RPS Policies .............................................................................42 Table B-6. REC Pricing Across Markets .................................................................................45
1
1 Introduction
The United States is the global leader in installed geothermal capacity with approximately 3,086 megawatts (MW) of installed capacity, and is expected to continue that leadership in the next decade (Islandsbanki 2009). Even so, less than 0.5% of the United States’ electricity generation currently comes from geothermal resources (Jennejohn 2010). Yet, geothermal energy could be an important contributor to a sustainable energy portfolio in the United States (Tester et al. 2006).
One of the main constraints on geothermal project development is the ability to secure capital. Despite the technology’s 50-year history of providing power at the utility scale (U.S. DOE 2006(c)), challenges remain in raising sufficient capital, especially during the early stages of project development. The 2008 economic downturn exacerbated this situation and re-shaped the market for capital across all technologies.
This guidebook provides an overview of the strategies currently used to raise capital for geothermal projects with the following characteristics:
• Use conventional, proven technologies
• Located in the United States
• Produce utility power (roughly 10 MW or larger)
This guidebook builds on a fundamental understanding of investment decisions. The acceptance of risk must be rewarded through financial returns. Different types of investors tolerate different levels of risk and offer various financial products based on their risk thresholds in order to access those opportunities. The market for all types of investment is much different in late 2010 than it was before the economic downturn that started in 2008; this guidebook provides information about how investment decisions are made in the current environment.
The information in this guidebook includes a high-level overview of relevant geothermal technology and policy and a more in-depth discussion of the strategies used to fund geothermal projects:
• Section 2 provides an overview of the most widely used electricity-producing geothermal technologies.
• Section 3 summarizes the current policy environment that supports geothermal projects.
• Section 4 summarizes the innovations in financing used since the 2008 economic downturn, highlighting the types of investors interested in funding each stage of project development and the requirements for competing for their capital.
2
2 Technology
Geothermal electricity generation has a long track record. The first geothermal power plant was built in Lardellero, Italy, in 1904 (Lund 2004). The first U.S. geothermal power plant was built in the early 1930s at the Geysers in California (Lund 2004) in the same location as the first large-scale plant (11 MW), which began operation in 1960 (U.S. DOE 2006(c)). The basic technologies are discussed in Section 2.1. Recent developments of new technologies are briefly discussed in Section 2.2.
2.1 Basic Geothermal Technology Geothermal power plants work similarly to traditional thermal plants in many respects in that they convert heat to electricity using a turbine-generator. The difference is the source of the heat: in geothermal projects, heat is provided by underground geothermal fluids.
The process used to extract geothermal fluids is similar to the process used to extract oil and gas. Before any drilling can take place, developers must invest in exploration of potential areas to identify the location of actual geothermal resources. Wells are then drilled thousands of feet deep to tap into steam and hot water reservoirs.
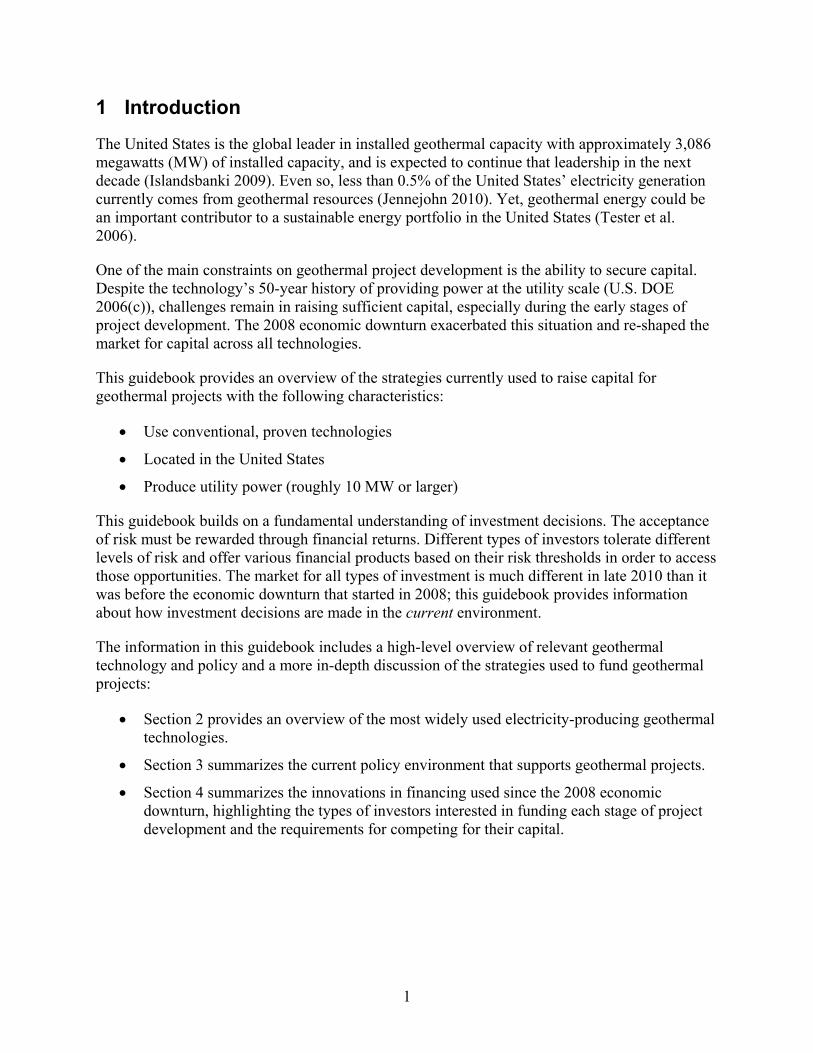
Figure 2-1 shows a schematic of a typical binary geothermal power plant, including the pathways of the fluids.
Figure 2-1. Depiction of typical binary geothermal power plant
Source: NREL 2010
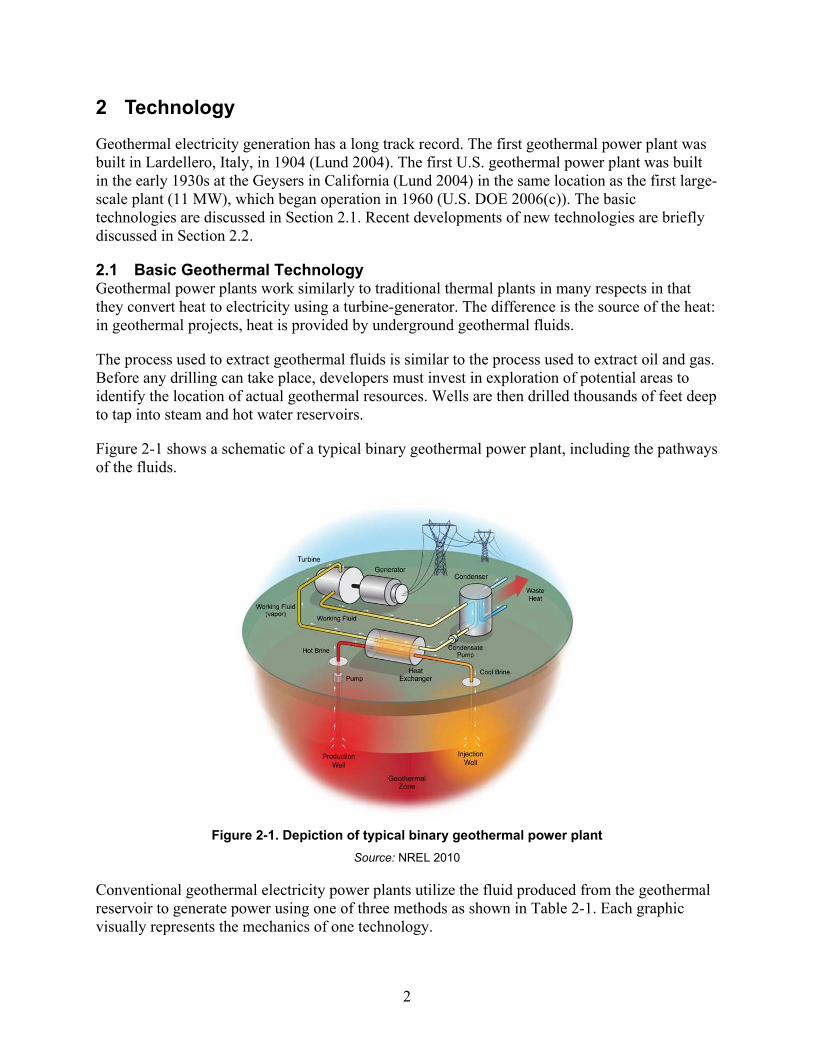
Conventional geothermal electricity power plants utilize the fluid produced from the geothermal reservoir to generate power using one of three methods as shown in Table 2-1. Each graphic visually represents the mechanics of one technology.
3
Table 2-1. Description of Three Geothermal Power Plant Technologies
Power Plant Description Graphic Representation
Flash Steam Plant
» Description: Geothermal fluids lose pressure as they rise to the surface and flash (i.e., boil) to create steam that turns turbines
» Market: Composes about 45% of electrical generation in the U.S. geothermal market
» Technology Specification: Better for high-temperature reservoirs (>360°F/182°C) with a mix of hot water and steam to allow for an easier transition from water to steam
» Example: Dixie Valley, Nevada
Dry Steam Plant
» Description: The simplest plant design, as dry steam is produced from the reservoir and piped from wells to the plant to directly turn turbines
» Market: Composes less than 40% of electrical generation in the U.S. geothermal market
» Technology Specification: Possible when the reservoir produces only high-temperature steam
» Example: The Geysers, California
Binary-Cycle Plant
» Description: Passes geothermal fluids through a heat exchanger to boil organic fluids that vaporize at a lower temperature than water. Vapor turns turbines, is condensed, re-pressurized, and returned to the heat exchanger to be used again in a closed-loop
» Market: Composes about 15% of electrical generation in the U.S. geothermal market, but is most common on a units-installed basis
» Technology Specification: Best for lower-temperature reservoirs (up to 360°F/182°C)
» Air emissions are minimized by separating the water/steam and organic materials in separate closed loops
» Example: Raft River, Idaho
Sources: Idaho National Energy Laboratory 2010; Kagel 2008; and U.S. DOE 2008(a)
4
The overall installed costs range from approximately $3,000 to $4,000 per kilowatt (kW) for each of the three technologies (Cross and Freeman 2009). Costs have increased significantly in recent years and are subject to change due to changes in commodity costs (e.g., for steel and cement), cooling technology, and demand for drilling rigs for oil and gas exploration, among others (GEA 2009).
The choice of power plant technology is usually based on the characteristics of the available resource. While the three technologies are typically used autonomously, they can also be used in conjunction with one another (e.g., a flash-binary plant) to achieve higher efficiency.
Cooling systems are an important part of power plants as they can greatly affect the maximum amount of power that can be extracted from the geothermal fluids—the lower the cooling temperature, the greater the potential plant efficiency. Geothermal power plants typically use water as a cooling fluid in cooling towers when water is inexpensive and available for use. In some cases, air may also be used as a cooling agent if water resources are limited. Air cooling has higher capital costs and parasitic load but lower non-energy operating and maintenance costs. The cooling ability of air is directly proportional to the outside temperature, so there can be significant diurnal and seasonal cooling capacity fluctuations. The resulting potential lack of stability in plant output from air cooling can be a deterrent for those seeking consistent operational efficiency (Kagel 2008).
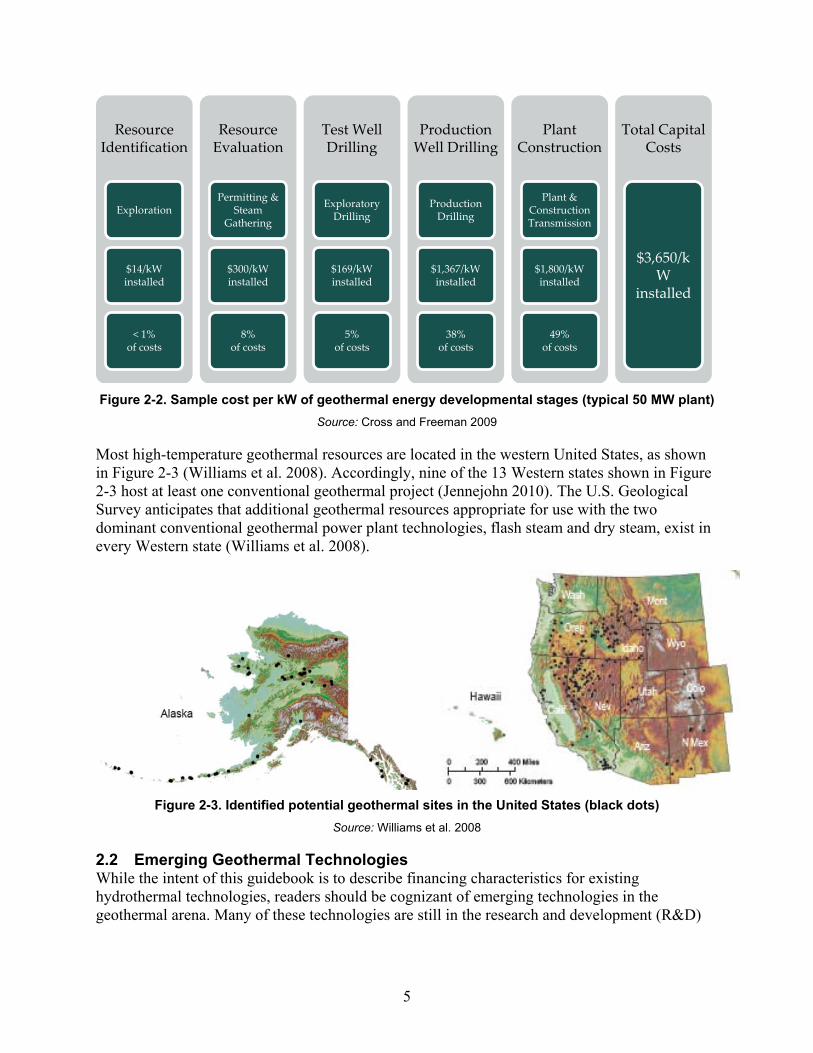
There are several phases between exploration of potential resources and construction of a power plant. Figure 2-2 shows the estimated development costs for a typical geothermal power plant.1 As shown in Figure 2-2, the upfront activities of Resource Identification, Resource Evaluation, and Test Well Drilling account for approximately 13% of the overall cost; these costs are nonetheless significant because they are risky activities (i.e., subject to dry holes) and, as a result, have high financing costs. The remainder of the capital investment (87%) comes in the later phases of drilling and construction.
1 These project costs are location-specific and can vary significantly from one site to another. The breakdown of costs among the various stages of project will also vary by site. Figure 2-2 is for illustrative purposes only.
5
Figure 2-2. Sample cost per kW of geothermal energy developmental stages (typical 50 MW plant)
Source: Cross and Freeman 2009
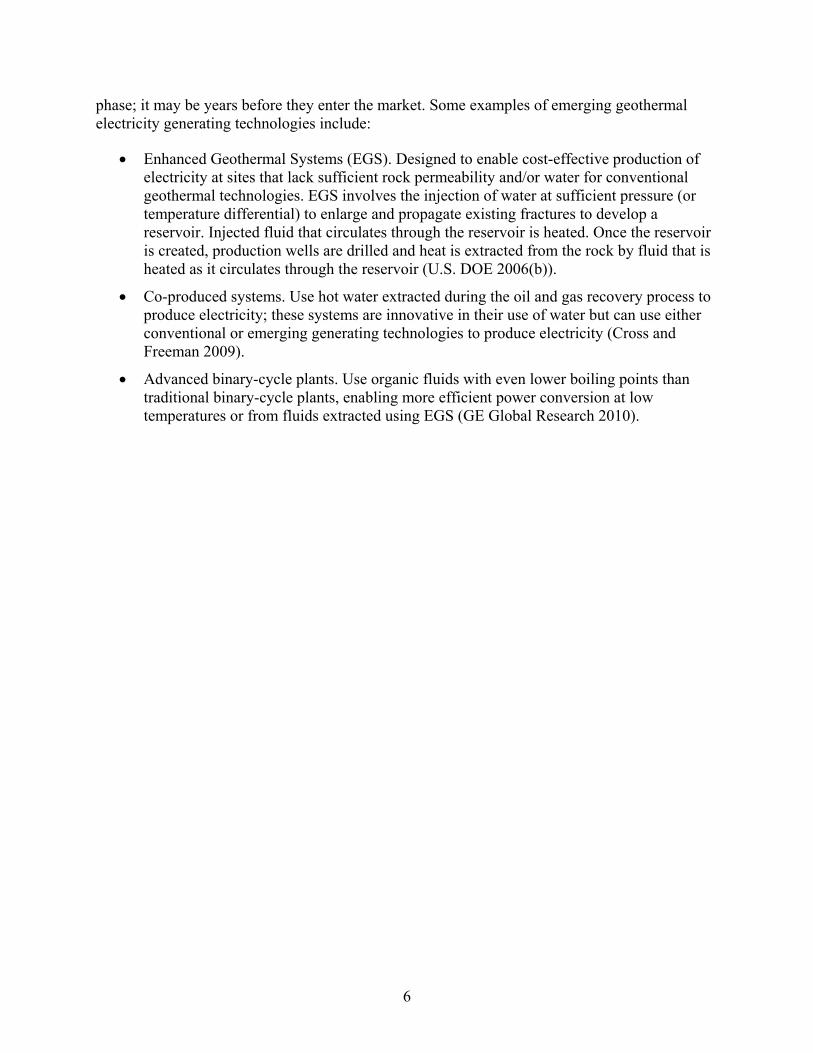
Most high-temperature geothermal resources are located in the western United States, as shown in Figure 2-3 (Williams et al. 2008). Accordingly, nine of the 13 Western states shown in Figure 2-3 host at least one conventional geothermal project (Jennejohn 2010). The U.S. Geological Survey anticipates that additional geothermal resources appropriate for use with the two dominant conventional geothermal power plant technologies, flash steam and dry steam, exist in every Western state (Williams et al. 2008).
Figure 2-3. Identified potential geothermal sites in the United States (black dots)
Source: Williams et al. 2008
2.2 Emerging Geothermal Technologies While the intent of this guidebook is to describe financing characteristics for existing hydrothermal technologies, readers should be cognizant of emerging technologies in the geothermal arena. Many of these technologies are still in the research and development (R&D)
Resource Identification
Exploration
$14/kW installed
< 1% of costs
Resource Evaluation
Permitting &Steam
Gathering
$300/kW installed
8% of costs
Test Well Drilling
Exploratory Drilling
$169/kW installed
5% of costs
Production Well Drilling
Production Drilling
$1,367/kW installed
38% of costs
Plant Construction
Plant & ConstructionTransmission
$1,800/kW installed
49% of costs
Total Capital Costs
$3,650/kW
installed
6
phase; it may be years before they enter the market. Some examples of emerging geothermal electricity generating technologies include:
• Enhanced Geothermal Systems (EGS). Designed to enable cost-effective production of electricity at sites that lack sufficient rock permeability and/or water for conventional geothermal technologies. EGS involves the injection of water at sufficient pressure (or temperature differential) to enlarge and propagate existing fractures to develop a reservoir. Injected fluid that circulates through the reservoir is heated. Once the reservoir is created, production wells are drilled and heat is extracted from the rock by fluid that is heated as it circulates through the reservoir (U.S. DOE 2006(b)).
• Co-produced systems. Use hot water extracted during the oil and gas recovery process to produce electricity; these systems are innovative in their use of water but can use either conventional or emerging generating technologies to produce electricity (Cross and Freeman 2009).
• Advanced binary-cycle plants. Use organic fluids with even lower boiling points than traditional binary-cycle plants, enabling more efficient power conversion at low temperatures or from fluids extracted using EGS (GE Global Research 2010).
7
3 Policies and Incentives
A variety of federal and state policies and incentives support geothermal electricity project development. Some directly benefit a project’s financial outlook by providing grants and tax incentives and defraying upfront costs. Others affect a project’s financial returns through less direct means, such as reducing the cost of leasing and permitting by streamlining processes.
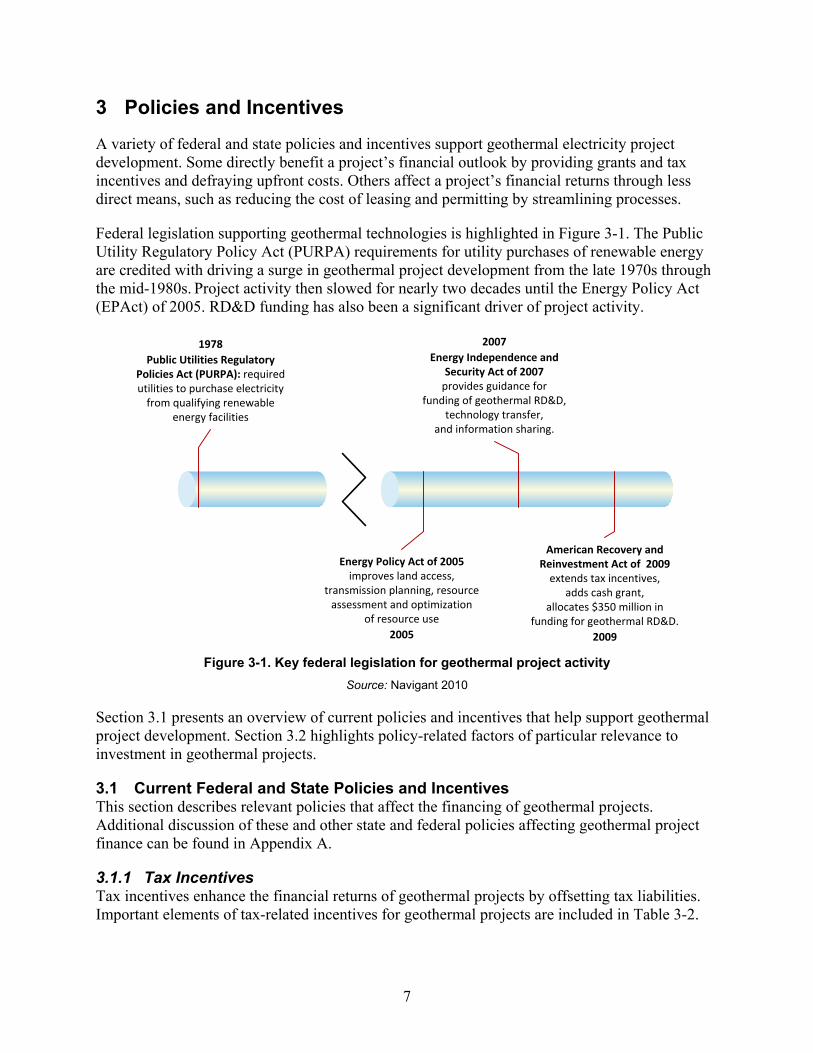
Federal legislation supporting geothermal technologies is highlighted in Figure 3-1. The Public Utility Regulatory Policy Act (PURPA) requirements for utility purchases of renewable energy are credited with driving a surge in geothermal project development from the late 1970s through the mid-1980s. Project activity then slowed for nearly two decades until the Energy Policy Act (EPAct) of 2005. RD&D funding has also been a significant driver of project activity.
Figure 3-1. Key federal legislation for geothermal project activity
Source: Navigant 2010
Section 3.1 presents an overview of current policies and incentives that help support geothermal project development. Section 3.2 highlights policy-related factors of particular relevance to investment in geothermal projects.
3.1 Current Federal and State Policies and Incentives This section describes relevant policies that affect the financing of geothermal projects. Additional discussion of these and other state and federal policies affecting geothermal project finance can be found in Appendix A.
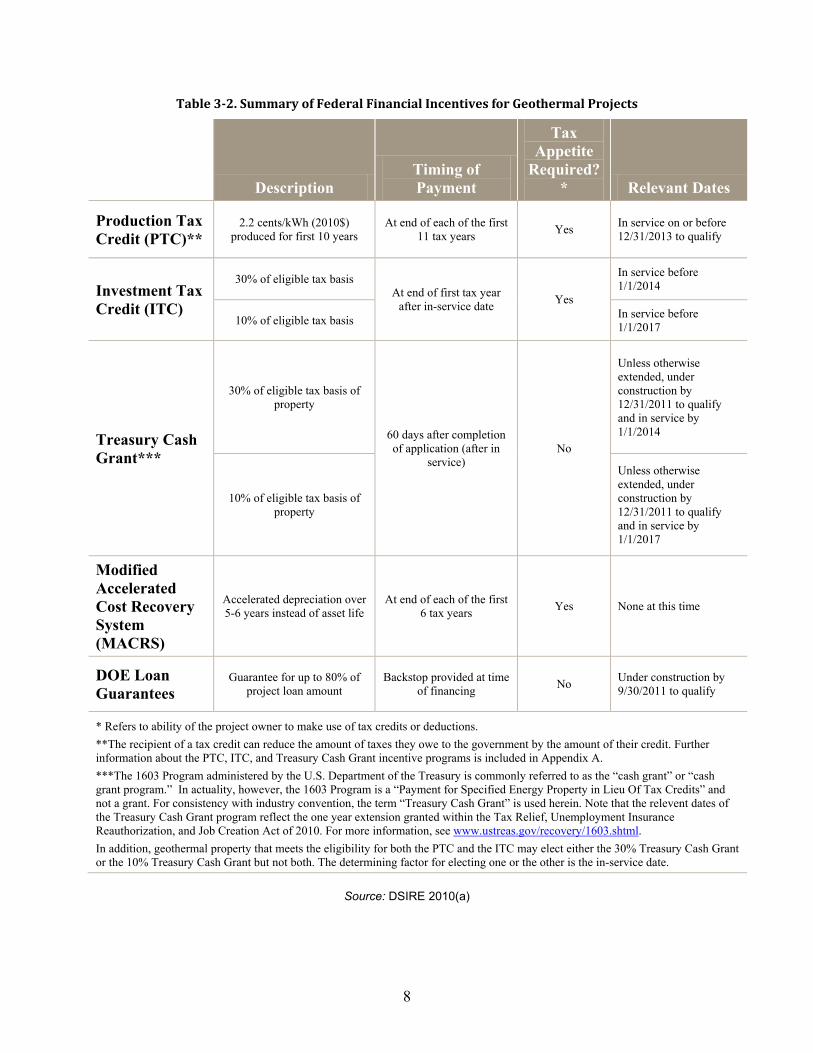
3.1.1 Tax Incentives Tax incentives enhance the financial returns of geothermal projects by offsetting tax liabilities. Important elements of tax-related incentives for geothermal projects are included in Table 3-2.
2005
Energy Policy Act of 2005 improves land access,
transmission planning, resource assessment and optimization
of resource use
2009
American Recovery and Reinvestment Act of 2009
extends tax incentives, adds cash grant,
allocates $350 million in funding for geothermal RD&D.
1978Public Utilities Regulatory
Policies Act (PURPA): required utilities to purchase electricity
from qualifying renewable energy facilities
2007Energy Independence and
Security Act of 2007 provides guidance for
funding of geothermal RD&D, technology transfer,
and information sharing.
8
Table 3-2. Summary of Federal Financial Incentives for Geothermal Projects
Source: DSIRE 2010(a)
Description Timing of Payment
Tax Appetite
Required?* Relevant Dates
Production Tax Credit (PTC)**
2.2 cents/kWh (2010$) produced for first 10 years
At end of each of the first 11 tax years Yes In service on or before
12/31/2013 to qualify
Investment Tax Credit (ITC)
30% of eligible tax basis At end of first tax year
after in-service date Yes
In service before 1/1/2014
10% of eligible tax basis In service before 1/1/2017
Treasury Cash Grant***
30% of eligible tax basis of property
60 days after completion of application (after in
service) No
Unless otherwise extended, under construction by 12/31/2011 to qualify and in service by 1/1/2014
10% of eligible tax basis of property
Unless otherwise extended, under construction by 12/31/2011 to qualify and in service by 1/1/2017
Modified Accelerated Cost Recovery System (MACRS)
Accelerated depreciation over 5-6 years instead of asset life
At end of each of the first 6 tax years Yes None at this time
DOE Loan Guarantees
Guarantee for up to 80% of project loan amount
Backstop provided at time of financing No Under construction by
9/30/2011 to qualify
* Refers to ability of the project owner to make use of tax credits or deductions. **The recipient of a tax credit can reduce the amount of taxes they owe to the government by the amount of their credit. Further information about the PTC, ITC, and Treasury Cash Grant incentive programs is included in Appendix A. ***The 1603 Program administered by the U.S. Department of the Treasury is commonly referred to as the “cash grant” or “cash grant program.” In actuality, however, the 1603 Program is a “Payment for Specified Energy Property in Lieu Of Tax Credits” and not a grant. For consistency with industry convention, the term “Treasury Cash Grant” is used herein. Note that the relevent dates of the Treasury Cash Grant program reflect the one year extension granted within the Tax Relief, Unemployment Insurance Reauthorization, and Job Creation Act of 2010. For more information, see www.ustreas.gov/recovery/1603.shtml. In addition, geothermal property that meets the eligibility for both the PTC and the ITC may elect either the 30% Treasury Cash Grant or the 10% Treasury Cash Grant but not both. The determining factor for electing one or the other is the in-service date.
9
For a given project investment, investors must choose whether to pursue the PTC, the ITC, or the Treasury Cash Grant. Analysis comparing the value of these three incentives indicates that the PTC has a higher discounted cash value than the ITC or Treasury Cash Grant for geothermal projects in the vast majority of cases (Bolinger et al. 2009). However, comments from industry representatives indicate that other benefits of the Treasury Cash Grant cause geothermal developers to choose the Treasury Cash Grant over the PTC or ITC. Specifically, many project owners do not have enough taxable income to take advantage of tax credits and must sell them at a discount to other investors while they can use the Treasury Cash Grant right away to pay off construction loans or term loans. This reduces the amount of debt on their corporate balance sheets, which can improve developers’ access to capital at the corporate level for other projects.
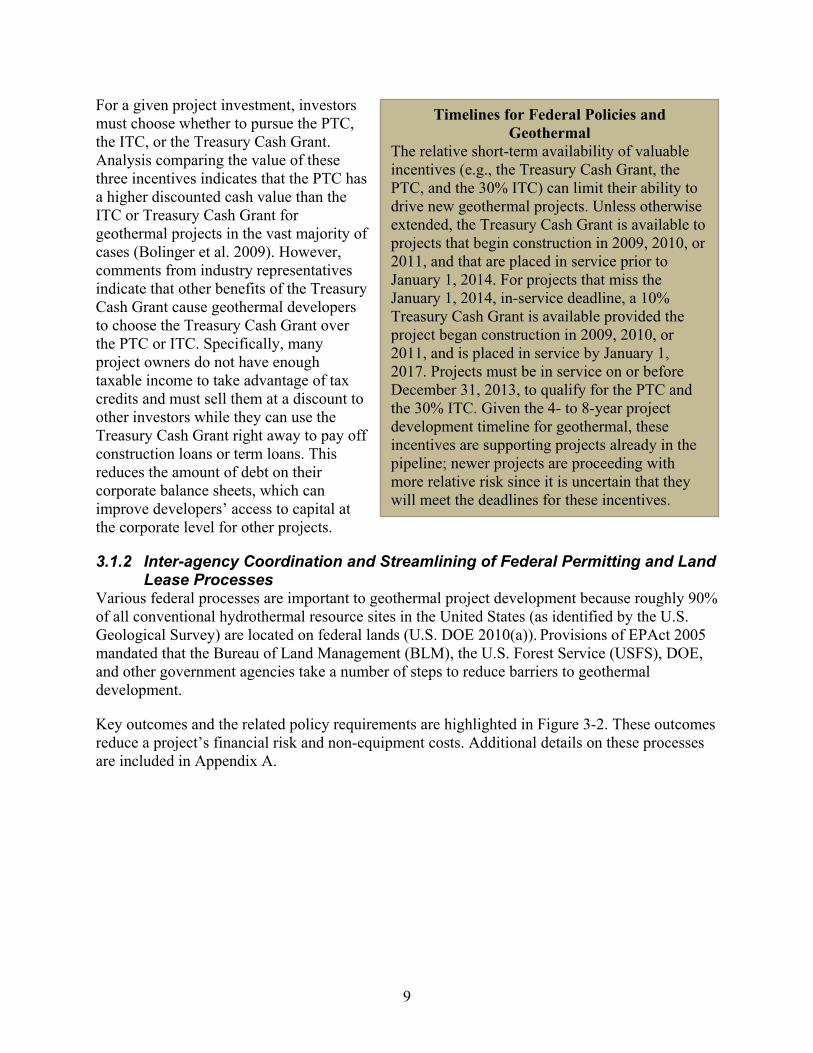
3.1.2 Inter-agency Coordination and Streamlining of Federal Permitting and Land Lease Processes
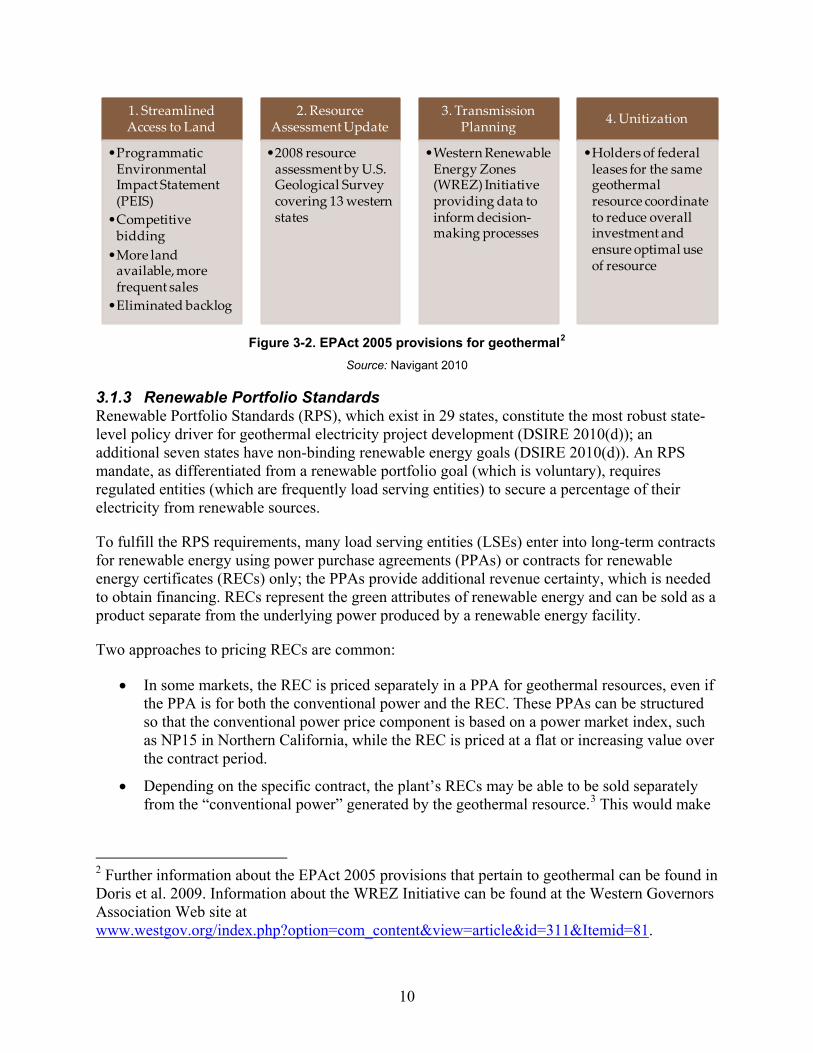
Various federal processes are important to geothermal project development because roughly 90% of all conventional hydrothermal resource sites in the United States (as identified by the U.S. Geological Survey) are located on federal lands (U.S. DOE 2010(a)). Provisions of EPAct 2005 mandated that the Bureau of Land Management (BLM), the U.S. Forest Service (USFS), DOE, and other government agencies take a number of steps to reduce barriers to geothermal development.
Key outcomes and the related policy requirements are highlighted in Figure 3-2. These outcomes reduce a project’s financial risk and non-equipment costs. Additional details on these processes are included in Appendix A.
Timelines for Federal Policies and Geothermal
The relative short-term availability of valuable incentives (e.g., the Treasury Cash Grant, the PTC, and the 30% ITC) can limit their ability to drive new geothermal projects. Unless otherwise extended, the Treasury Cash Grant is available to projects that begin construction in 2009, 2010, or 2011, and that are placed in service prior to January 1, 2014. For projects that miss the January 1, 2014, in-service deadline, a 10% Treasury Cash Grant is available provided the project began construction in 2009, 2010, or 2011, and is placed in service by January 1, 2017. Projects must be in service on or before December 31, 2013, to qualify for the PTC and the 30% ITC. Given the 4- to 8-year project development timeline for geothermal, these incentives are supporting projects already in the pipeline; newer projects are proceeding with more relative risk since it is uncertain that they will meet the deadlines for these incentives.
10
Figure 3-2. EPAct 2005 provisions for geothermal2
Source: Navigant 2010
3.1.3 Renewable Portfolio Standards Renewable Portfolio Standards (RPS), which exist in 29 states, constitute the most robust state-level policy driver for geothermal electricity project development (DSIRE 2010(d)); an additional seven states have non-binding renewable energy goals (DSIRE 2010(d)). An RPS mandate, as differentiated from a renewable portfolio goal (which is voluntary), requires regulated entities (which are frequently load serving entities) to secure a percentage of their electricity from renewable sources.
To fulfill the RPS requirements, many load serving entities (LSEs) enter into long-term contracts for renewable energy using power purchase agreements (PPAs) or contracts for renewable energy certificates (RECs) only; the PPAs provide additional revenue certainty, which is needed to obtain financing. RECs represent the green attributes of renewable energy and can be sold as a product separate from the underlying power produced by a renewable energy facility.
Two approaches to pricing RECs are common:
• In some markets, the REC is priced separately in a PPA for geothermal resources, even if the PPA is for both the conventional power and the REC. These PPAs can be structured so that the conventional power price component is based on a power market index, such as NP15 in Northern California, while the REC is priced at a flat or increasing value over the contract period.
• Depending on the specific contract, the plant’s RECs may be able to be sold separately from the “conventional power” generated by the geothermal resource.3
2 Further information about the EPAct 2005 provisions that pertain to geothermal can be found in Doris et al. 2009. Information about the WREZ Initiative can be found at the Western Governors Association Web site at
This would make
www.westgov.org/index.php?option=com_content&view=article&id=311&Itemid=81.
1. Streamlined Access to Land
•Programmatic Environmental Impact Statement (PEIS)•Competitive
bidding•More land
available, more frequent sales•Eliminated backlog
2. Resource Assessment Update
•2008 resource assessment by U.S. Geological Survey covering 13 western states
3. Transmission Planning
•Western Renewable Energy Zones (WREZ) Initiative providing data to inform decision-making processes
4. Unitization
•Holders of federal leases for the same geothermal resource coordinate to reduce overall investment and ensure optimal use of resource
11
sense financially, if, for example, the developer has a purchaser for the conventional power and a separate purchaser for the REC, either to meet requirements for voluntary REC sales or in a state that allows unbundling of the REC from the green power source.
Appendix A presents additional details on capitalizing on this revenue stream for geothermal projects.
3.1.4 Greenhouse Gas Emissions Reduction Policies Greenhouse gas emissions (GHG) regulations may assist geothermal project developers in securing PPAs. If implemented, GHG regulations could increase the price of power from conventional sources by internalizing the cost of GHG emissions, potentially making geothermal power more cost-competitive because GHG emissions from geothermal plants are minimal. Energy from geothermal resources may serve as a risk mitigation strategy because there is limited GHG regulatory risk associated with energy from geothermal sources.
A number of states with strong geothermal resources have pursued GHG emissions reduction policies, including California, Oregon, and Colorado (Pew Center 2010(b)). Notable among these states is California, where a cap-and-trade program is scheduled to be implemented in 2012 (California Air Resources Board 2010). Seven Western states participate in the Western Climate Initiative, a regional effort launched in 2007 to facilitate a coordinated approach to climate action among Western states and Canadian provinces. See Appendix C for more details on the Western Climate Initiative.
The Environmental Protection Agency (EPA) has taken some initial steps toward regulating GHGs. Using its authority under the Clean Air Act, the EPA proposed its first federal emissions standards for GHGs in September 2009; these standards address emissions from light-duty vehicles. In 2009, EPA also introduced a rule requiring the largest emitters of GHGs to report GHG emissions annually starting in 2011. In December 2009, the EPA found that the concentrations of six different types of GHGs in the atmosphere threaten the health and welfare of current and future generations. This “endangerment finding” may require regulation of additional GHG sources by the EPA in the future (U.S. Department of State 2010). At the time of this writing, litigation is expected; it is unclear when this regulation could go into effect (Nelson 2010).
Actions by Congress in recent years indicate that some form of comprehensive federal GHG regulation may be considered in the future. The House passed the American Clean Energy and Security Act in 2009 (ACES), which included an economy-wide cap-and-trade program. A variety of bills that build on provisions of ACES are under consideration in the Senate (Pew Center 2010(a)).
The market for RECs (used for compliance with RPSs) and the market for GHG compliance units (both allowances and offsets used for compliance with GHG regulations) are separate and
3 If the RECs are sold separately from the power, the unbundled energy is no longer considered renewable.
12
distinct. A geothermal generator operating in a state with both an RPS and a GHG cap-and-trade program would sell RECs to entities responsible for complying with the RPS. The generator itself would be responsible for surrendering enough GHG emission allowances to cover any GHG emissions of its own. Any additional allowances owned by the generator could be sold.4
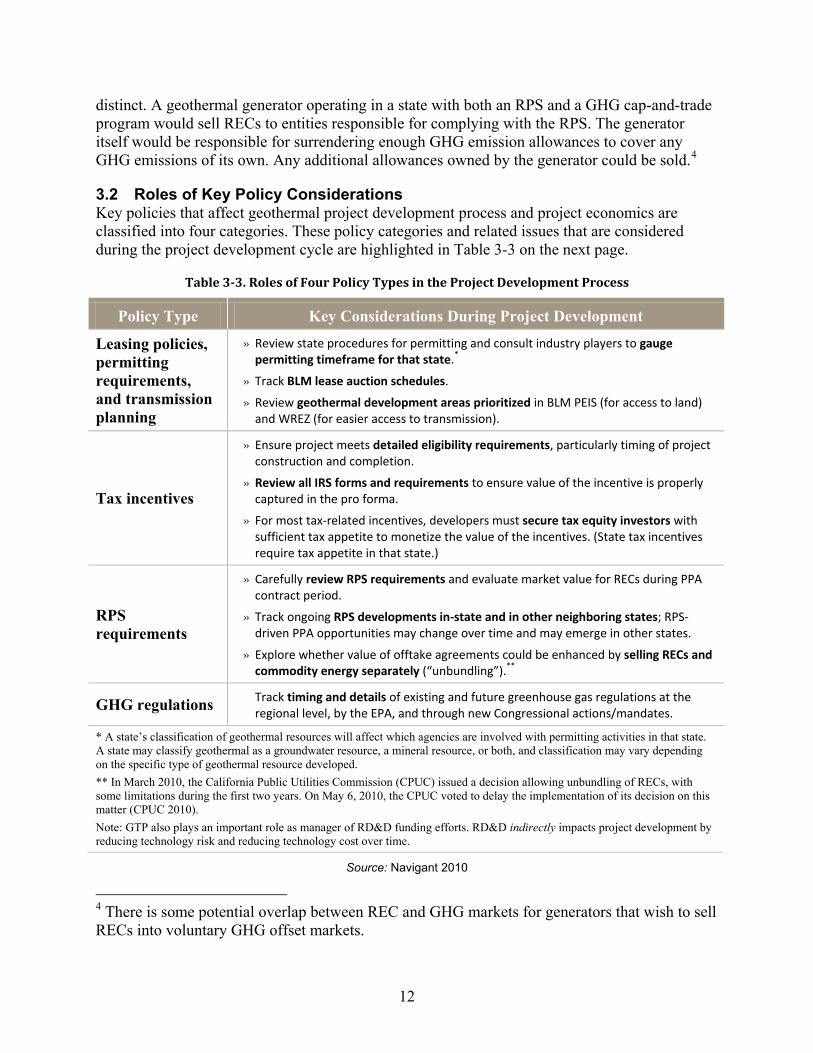
3.2 Roles of Key Policy Considerations
Key policies that affect geothermal project development process and project economics are classified into four categories. These policy categories and related issues that are considered during the project development cycle are highlighted in Table 3-3 on the next page.
Table 3-3. Roles of Four Policy Types in the Project Development Process
Policy Type Key Considerations During Project Development
Leasing policies, permitting requirements, and transmission planning
» Review state procedures for permitting and consult industry players to gauge permitting timeframe for that state.*
» Track BLM lease auction schedules.
» Review geothermal development areas prioritized in BLM PEIS (for access to land) and WREZ (for easier access to transmission).
Tax incentives
» Ensure project meets detailed eligibility requirements, particularly timing of project construction and completion.
» Review all IRS forms and requirements to ensure value of the incentive is properly captured in the pro forma.
» For most tax-related incentives, developers must secure tax equity investors with sufficient tax appetite to monetize the value of the incentives. (State tax incentives require tax appetite in that state.)
RPS requirements
» Carefully review RPS requirements and evaluate market value for RECs during PPA contract period.
» Track ongoing RPS developments in-state and in other neighboring states; RPS-driven PPA opportunities may change over time and may emerge in other states.
» Explore whether value of offtake agreements could be enhanced by selling RECs and commodity energy separately (“unbundling”).**
GHG regulations » Track timing and details of existing and future greenhouse gas regulations at the regional level, by the EPA, and through new Congressional actions/mandates.
* A state’s classification of geothermal resources will affect which agencies are involved with permitting activities in that state. A state may classify geothermal as a groundwater resource, a mineral resource, or both, and classification may vary depending on the specific type of geothermal resource developed. ** In March 2010, the California Public Utilities Commission (CPUC) issued a decision allowing unbundling of RECs, with some limitations during the first two years. On May 6, 2010, the CPUC voted to delay the implementation of its decision on this matter (CPUC 2010). Note: GTP also plays an important role as manager of RD&D funding efforts. RD&D indirectly impacts project development by reducing technology risk and reducing technology cost over time.
Source: Navigant 2010
4 There is some potential overlap between REC and GHG markets for generators that wish to sell RECs into voluntary GHG offset markets.
13
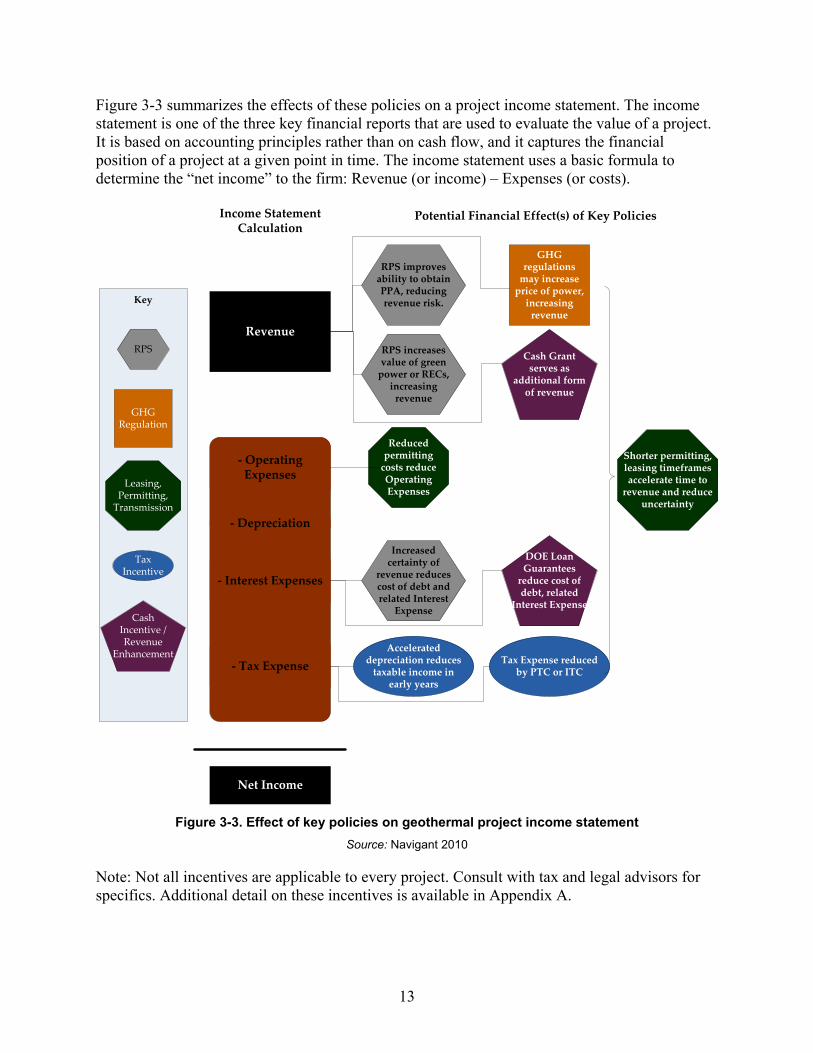
Figure 3-3 summarizes the effects of these policies on a project income statement. The income statement is one of the three key financial reports that are used to evaluate the value of a project. It is based on accounting principles rather than on cash flow, and it captures the financial position of a project at a given point in time. The income statement uses a basic formula to determine the “net income” to the firm: Revenue (or income) – Expenses (or costs).
Figure 3-3. Effect of key policies on geothermal project income statement
Source: Navigant 2010
Note: Not all incentives are applicable to every project. Consult with tax and legal advisors for specifics. Additional detail on these incentives is available in Appendix A.
Revenue
- Operating Expenses
- Depreciation
- Interest Expenses
- Tax ExpenseAccelerated
depreciation reduces taxable income in
early years
Tax Expense reduced by PTC or ITC
RPS improves ability to obtain PPA, reducing revenue risk.
RPS increases value of green
power or RECs, increasing
revenue
Increased certainty of
revenue reduces cost of debt and related Interest
Expense
Reduced permitting
costs reduce Operating Expenses
Shorter permitting, leasing timeframes accelerate time to
revenue and reduce uncertainty
GHG regulations
may increase price of power,
increasing revenue
Net Income
Key
Tax Incentive
RPS
Leasing, Permitting,
Transmission
GHG Regulation
Cash Grant serves as
additional form of revenue
DOE Loan Guarantees
reduce cost of debt, related
Interest ExpenseCash
Incentive / Revenue
Enhancement
Income Statement Calculation
Potential Financial Effect(s) of Key Policies
14
4 Financing Geothermal Projects
Geothermal resource development is critically dependent on access to financing under attractive conditions. As a result of the global economic contraction that began in 2008, access to financing in general became more challenging, though recent indications are that both access and financing terms are improving.
This chapter begins with a summary of the changes in the market for geothermal project finance that resulted from the 2008 downturn. Next, Section 4.2 highlights the unique aspects of geothermal energy projects relative to other renewable energy projects. Section 4.3 summarizes the sequence of investment needed to complete a geothermal project and the financial and non-financial requirements for each stage. Finally, the last part of this chapter identifies some common missteps made by those seeking project financing.
This section largely reflects the results of interviews with market participants complemented by selected Internet-based research. Interviews were conducted between April 2010 and June 2010 with 15 developers, financiers, and other industry experts. These interviewees were asked to comment on the following topics:
• Availability of financing for renewable energy projects in general and specifically for geothermal projects
• How geothermal project financing differs from other renewable energy resources
• Providers of different types of geothermal project financing and their investment requirements at each stage of project development
• The importance of federal, state, and local incentives in project financing
• Common pitfalls for those seeking financing
4.1 The New World of Renewables Financing The global credit crunch and economic contraction, which began in 2008, impacted many financial institutions, and this impact was felt across the renewable energy financing spectrum. Loan losses and bankruptcies removed many financing providers from the market at least temporarily. Financial losses reduced the availability of tax equity by wiping out taxable income against which investors could apply tax credits, taking most investors out of the market. In addition, these shocks eliminated a major source of specialist geothermal project financing: Iceland-based Glitnir Bank. Lenders and investors still in the market became considerably more risk averse and were operating with less capital than before the contraction. Consequently, lenders were willing to lend less to a given project for shorter periods of time and at higher interest rates (Schwabe et al. 2009). Increased perceived risk also resulted in many private equity funds cutting back on their investment in general and renewable energy investment in particular. At the same time, the private equity investors demanded significantly higher projected returns or higher ownership shares in the investment.
Today, there are fewer institutions actively providing financing for renewable energy projects than there were before 2008 (Chadbourne and Parke 2009). Prior to 2008, many investment banks provided the tax appetite that many renewable energy project developers lacked; that “tax
15
appetite” was a tax liability sufficient to absorb the tax incentives for investment in renewable energy projects. With the economic contraction, some of these institutions failed or were acquired by other banks that were less active in tax equity. In addition, the banks’ tax appetite shrank due to decreased earnings and increased perceived risk. According to market actors, large insurance companies and pension funds remained somewhat active in lending to renewable energy projects, but other investors, such as investment banks, limited their involvement in the market.
Market participants say that financing is now becoming more widely available than during either of the past two years, though it is not yet at levels seen pre-2008. Loan tenors and risk tolerance are increasing; the mix of investors is shifting and interest rates and expected returns are declining. While the recession has taken some bank lenders out of the market, the appetites of those that remain are growing. There has also been strong growth in appetite from fixed-rate insurance company lenders in financing renewable energy projects; to date, 2010 has witnessed large syndicated financing at tenors of 20 and 25 years. As of late 2010, the unprecedented low yields on Treasuries and tight spreads on high-quality credit have taken the all-in cost for these sources of financing to historic lows. At the same time, the Treasury Cash Grant has made tax equity less essential for moving forward projects that meet the requirements discussed in Section 3.1.1.
4.2 Financing Geothermal Projects Geothermal projects have one significant difference in their energy production profile compared to most other renewable energy technologies: they provide relatively constant power using a technology that has been operating at utility scale for over 50 years (CEC 2009). According to the California Energy Commission, some geothermal power projects may operate with capacity factors of in excess of 90% - typically higher than other renewable energy technologies that use intermittent resources (CEC 2009).
On the other hand, geothermal projects are less attractive than other renewable energy technologies in ways that make obtaining financing more challenging. The significant investment required to find and prove the geothermal resource, an activity akin to oil and gas exploration, is unique to geothermal among renewable energy resources. This facet substantially changes the power project’s level of certainty in its early stages as well as the development time required relative to other renewable energy resources. Renewable energy projects compete with low-income housing for tax equity financing due to similar investor tax benefits (Schwabe et al. 2009); yet, geothermal market participants report that only geothermal is also competing for capital (and drilling rigs) with other underground resource-oriented investments, such as mineral, coal, and oil and gas exploration. In the early project stages, geothermal developers must target investors who are comfortable with higher levels of risk and longer development time horizons. The difficulty (and cost) of proving a geothermal resource significantly increases the risk of investing in a geothermal project in its early stages.
At the same time, permitting can be more challenging because multiple permits may be required due to the nature of the resource and the location of the plant (The Wilderness Society 2008). Additionally, according to interviewees, development of that resource can take three to four years, while plant construction can take another 18 months to four years.

16
The higher overall project risk of geothermal has recently led to limited utility investment in geothermal project development. Currently, utilities own and operate only 170 MW of geothermal power plants, all of which were developed in the early 1980s (SNL Financial 2010). At this time, investor-owned utilities (IOUs) are not in the process of building utility-owned geothermal plants that use conventional technology (SNL Financial 2010). Some municipal utilities, including the Snohomish Public Utilities District (Snohomish, Washington), are considering geothermal investments, but none of these projects are moving toward construction at this time (SNL Financial 2010; Sheets 2010). Four main challenges persist for utilities to move forward with geothermal project investment and construction, according to market participants, as shown in Figure 4-1.
Figure 4-1. Reasons for lack of utility activity in geothermal project development and ownership
Source: Navigant interviews with market actors 2010
Historically, larger scale geothermal resources were developed by natural resource companies, with utility involvement typically limited to power plant construction and power production. The earliest utility-scale geothermal field development in the United States occurred in the Geysers field in Northern California (U.S. DOE 2006(c)). The steam field was developed in the 1960s and 1970s by a partnership of Union Oil Company of California, Magma Energy Company, and Thermal Power Company to serve Pacific Gas & Electric’s (PG&E) geothermal power plants (Geysers Geothermal Association 2005). PG&E sold its interest in its Geysers plants (it did not own the steam fields) as part of the California power market deregulation in 1998 (Geysers Geothermal Association 2005). Other geothermal resources saw limited development until the late 1990s and thereafter with the growing interest and market support for renewable power.
4.3 The Staging of Geothermal Project Financing Different sources of financing are tapped in series at each stage of geothermal project development. Each source earns a return commensurate with the risk accepted at that point in the project life cycle. At later stages, some of the new financing pays off a portion of the existing debt from previous stages. Figure 4-2 depicts an estimation of the probability a project will be built at each stage of geothermal project development along with the relative investment magnitude for a 50 MW plant; in addition, the bottom part of the figure captures the type of financing that is available for each stage.
Fam
iliar
ity Utilities are unfamiliar with the technology.
Similarly, regulators are not familiar with the technology.
Inve
stm
ent M
etri
cs Utilities’ approved rates of return are not sufficient to accommodate the early-stage risk. Re
gula
tors Without a
mechanism to hedge risk, regulators hesitate to commit ratepayer funds to risky development (20% to 50% dry holes).
Com
petit
ion By the time
utilities’ rates of return are sufficient to warrant investment (i.e., construction), other entities offer financing at more attractive rates.

17
Figure 4-2. Geothermal project development and financing by stage
Source: Deloitte 2008
The following sections discuss the types of, and potential sources for, financing in the various stages of project development noted in Figure 4-2 as well as the investors’ financial and non-financial requirements. The information in this section is based on interviews with industry experts unless otherwise noted.
4.3.1 Early-Stage Financing
The three earliest and highest risk development phases for geothermal are the most difficult for raising capital. These are the project phases that differentiate geothermal from other renewable resources and the phases that have strong similarities to oil and gas exploration. Financing in these phases presents the greatest challenge because of its uncertain opportunity for returns and the lack of familiarity with the technology in the renewable energy financing market. Before the 2008 market downturn, assembling a group of private investors to support the early stages of a geothermal (or any generation) project was done regularly. A developer would have started with a relatively small amount of seed capital raised from “angel investors.” The developer would have then turned to private equity firms for Series A financing, the first financing after their seed capital investment. Because of the credit crisis, however, market participants report that both of those sources of capital have largely dried up; limited to no project equity is available at this stage.
Resource Identification
Resource Evaluation Test Well Drilling Production Well
Drilling Plant Construction Plant Operation
18
Three approaches to raising early-stage funding have been used since the 2008 market downturn:
• Private equity placements of a portfolio of projects
• Exchange-traded corporate equity financing
• Balance sheet financing (effectively a combination of corporate debt and retained earnings) by more established companies
4.3.1.1 Private Equity Financing of a Portfolio of Projects A strong cadre of companies has successfully raised private equity during these early and higher-risk development stages by offering a portfolio of projects. For example, Vulcan Power Company raised a second round of private equity in early 2010 from Denham Capital Partners (RenewableEnergyWorld.com 2010). Vulcan has a portfolio of five projects in advanced development and another five projects in earlier development stages (Jennejohn 2010). In addition, Toronto Stock Exchange (TSX)-listed U.S. Geothermal successfully executed two private placements within the last nine months (U.S. Geothermal 2009; U.S. Geothermal 2010).
Other private equity companies with geothermal investment include ArcLight Capital Partners through its Terra-Gen subsidiary, and U.S. Renewables. The last of these has been notably active in the geothermal space recently (U.S. Renewables 2010). ArcLight actually reduced its investment in its renewable portfolio in late 2009 by selling up to a 40% convertible preferred interest in Terra-Gen to international infrastructure fund Global Infrastructure Partners (PR Newswire 2009).
Given the similarity in development risks to oil and gas exploration and production, private equity funds with experience in this arena may be more comfortable than others in taking on the risks of geothermal development. Some private equity providers that fit this mold include Riverstone Holdings, First Reserve, and Energy Capital Partners.
4.3.1.2 Exchange-Traded Corporate Equity One of the most common sources of early-stage funding since the 2008 market downturn has been corporate equity financing according to market participants. Considerable development of North American geothermal projects has been financed by companies with expertise in geothermal power that filed for their initial public offering (IPO). Companies seeking to list on the public exchanges have three important competitive advantages that may enable them to raise equity at the corporate level:
• Technology expertise and experience that improves the likelihood of success of any individual project.
• Project portfolios that reduce the risk of an individual project by spreading the risk across an entire investment portfolio; the broader portfolio may include diverse investments beyond geothermal projects and/or multiple geothermal projects in various stages of development.
• Expectations of success in the project portfolio, which may be justified by projects located in proven fields or by receiving favorable resource reports by well-respected engineering firms.
19
Many younger geothermal companies have succeeded in raising capital through public exchanges. These younger companies have followed the path of larger companies that have been in the publicly-traded market for an extended period of time. Examples of such companies with long histories of public equity include Calpine Corporation, Rocky Mountain Power, ENEL, and Ormat. CalEnergy, a subsidiary of Mid-American Energy, also has geothermal expertise and a substantial portfolio of geothermal plants, but has not been that active in project development recently. More recent market entrants that raised capital through public exchanges include U.S. Geothermal (U.S. Geothermal 2008) and Nevada Geothermal Power (Nevada Geothermal 2010).
The U.S. stock exchanges have been less receptive to listing geothermal power development companies than the Canadian and Australian exchanges. The Canadian stock exchanges are known to have more investors who are comfortable with resource development risks, which are common to the oil, gas, and mining companies that are listed on these exchanges. The TSX is one of the major North American exchanges and typically caters to larger, more established companies; however, companies such as Ram Power, discussed below, have succeeded in listing there. An alternative source of capital for smaller and higher risk companies is the TSX Venture Exchange, which is the combination of the former Alberta and Vancouver exchanges. Many smaller geothermal companies in North America are listed on this exchange. In addition, the Australian Stock Exchange is more familiar and comfortable with resource development risks because of the considerable number of mining companies traded on those exchanges. Of particular note in Australia is the rapid growth in EGS investment due to strong government investment (Biello 2008).
Ram Power’s story demonstrates how public equity has become a more important source of equity since the economic downturn and how receptive the Canadian markets are to small geothermal companies. Initially, according to interviewees, Ram Power attempted to raise development equity from private sources while depleting its seed capital. Private equity investors, however, were uncomfortable committing significant funding to a company with a portfolio of geothermal projects in development and with the drilling risk profile surrounding its business plan, including its plans for success and exit strategy. When that approach proved unsuccessful, Ram Power broadened its project portfolio by combining with two small geothermal companies listed on the TSX and TSX Venture Exchange: Polaris Geothermal and Western GeoPower (eMedia World 2009). The combined firm, bearing the Ram Power name, then raised over $180 million (Can) in subscription receipts (equity) financing on the TSX in 2009, where the capital markets were receptive to resource-based investments (ThinkGeoEnergy 2009). Effectively, with the Ram Power merger and TSX listing, investors were offered three benefits relative to the pre-merger company: (1) a broader portfolio that reduced risk, (2) a potential return of multiple times their initial investment, and (3) a means to liquidate their investment relatively rapidly whenever desired.
Conversely, in April 2010, Colorado-based Standard Steam Trust called off an IPO that was planned for December 2010 on the TSX (Richter 2010). Weak market demand for exchange-traded investments in emerging companies with small market capitalization, short operating history, and low earnings drove the Standard Steam Trust decision (Richter 2010). Similar thinking derailed IPOs around the world in the second quarter of 2010, in large part due to the uncertainty related to the European sovereign debt crisis (Cowan 2010). As of late 2010, it is too early to predict the long-term effects on the market for geothermal company IPOs.
20
4.3.1.3 Balance Sheet Financing Companies with a long track record of geothermal project development have used both internal funds and raised corporate debt to fund early-stage project development. Investing internal funds requires strong positive cash flow to make funds available. Providers of corporate-level debt have recourse to a company’s other assets, reducing the risk of this type of investment. The investments are evaluated by considering the financial stability and strength of the company as a whole, rather than the characteristics of any specific project. Companies with low levels of existing debt are in a strong position to raise additional capital at attractive prices through the debt markets. Once the corporation receives the debt, it is able to apply the funds to any existing needs, including early-stage project development. Ormat has used both corporate debt and lines of credit to fund early-stage projects (Ormat Technologies 2010).
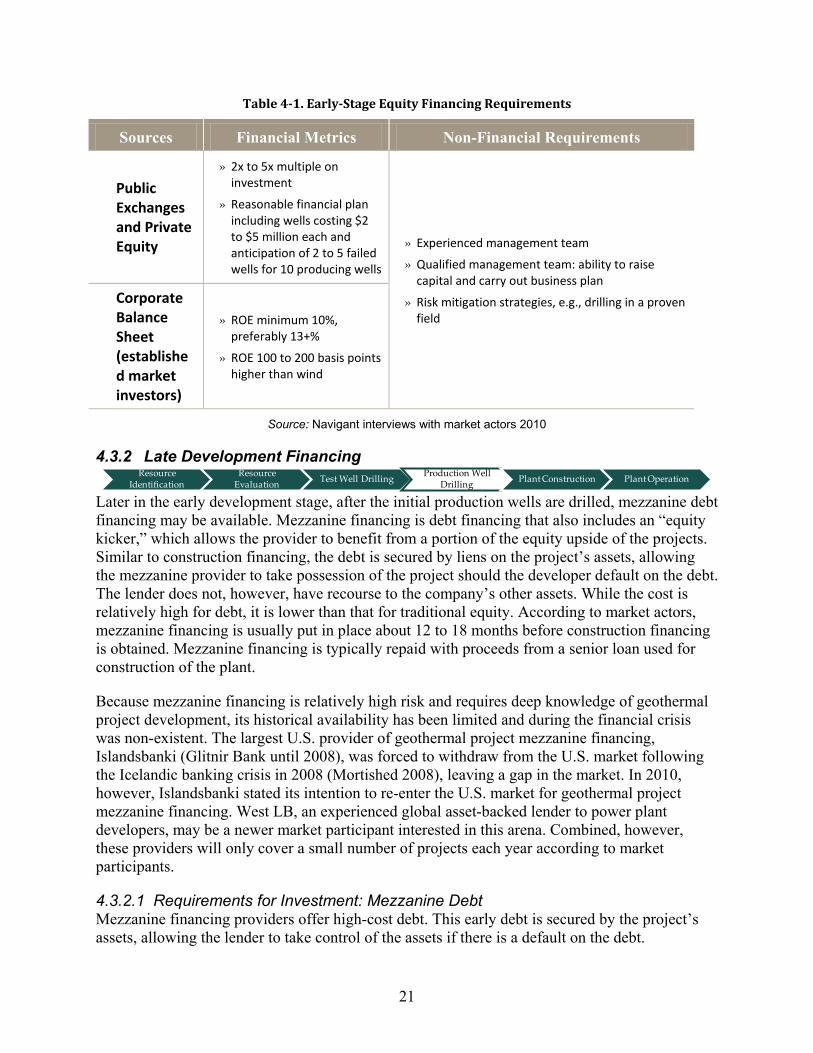
4.3.1.4 Requirements for Investment: Early Stage Financing Market participants report that investors in the earliest stages of geothermal financing are interested in the higher returns associated with ownership (equity). Lenders are not typically interested in project-level debt at this stage because of the high risk, although corporate-level debt can be acceptable as discussed above. As shown in Table 4-1, private and public investors are buying small company equity with expectations of returns in the 2x to 5x range. They require a well-thought-through development and financial plan, as well as a proven management team.
Established corporations with strong balance sheets and a diverse asset portfolio that includes geothermal power plants have very different return expectations for new geothermal projects according to market participants. While they are looking for marginally higher returns from geothermal projects than from wind, market participants have stated they prefer a return on equity (ROE) greater than 13%, but their minimum ROE would be as low as 10%. The diversity of their asset portfolio, the related lower cost of capital, and their familiarity with the technology enable them to accept lower rates of return from their geothermal investments when compared to other investors in geothermal projects.
21
Table 4-1. Early-Stage Equity Financing Requirements
Sources Financial Metrics Non-Financial Requirements
Public Exchanges and Private Equity
» 2x to 5x multiple on investment
» Reasonable financial plan including wells costing $2 to $5 million each and anticipation of 2 to 5 failed wells for 10 producing wells
» Experienced management team
» Qualified management team: ability to raise capital and carry out business plan
» Risk mitigation strategies, e.g., drilling in a proven field
Corporate Balance Sheet (established market investors)
» ROE minimum 10%, preferably 13+%
» ROE 100 to 200 basis points higher than wind
Source: Navigant interviews with market actors 2010
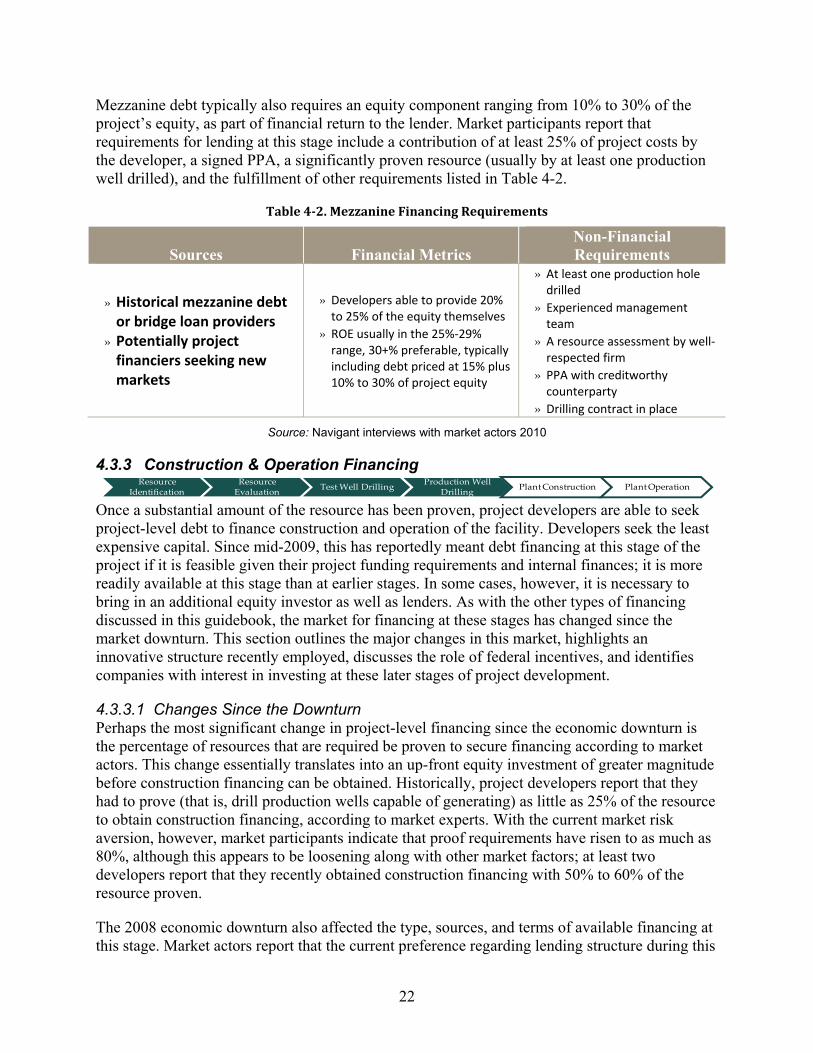
4.3.2 Late Development Financing
Later in the early development stage, after the initial production wells are drilled, mezzanine debt financing may be available. Mezzanine financing is debt financing that also includes an “equity kicker,” which allows the provider to benefit from a portion of the equity upside of the projects. Similar to construction financing, the debt is secured by liens on the project’s assets, allowing the mezzanine provider to take possession of the project should the developer default on the debt. The lender does not, however, have recourse to the company’s other assets. While the cost is relatively high for debt, it is lower than that for traditional equity. According to market actors, mezzanine financing is usually put in place about 12 to 18 months before construction financing is obtained. Mezzanine financing is typically repaid with proceeds from a senior loan used for construction of the plant.
Because mezzanine financing is relatively high risk and requires deep knowledge of geothermal project development, its historical availability has been limited and during the financial crisis was non-existent. The largest U.S. provider of geothermal project mezzanine financing, Islandsbanki (Glitnir Bank until 2008), was forced to withdraw from the U.S. market following the Icelandic banking crisis in 2008 (Mortished 2008), leaving a gap in the market. In 2010, however, Islandsbanki stated its intention to re-enter the U.S. market for geothermal project mezzanine financing. West LB, an experienced global asset-backed lender to power plant developers, may be a newer market participant interested in this arena. Combined, however, these providers will only cover a small number of projects each year according to market participants.
4.3.2.1 Requirements for Investment: Mezzanine Debt Mezzanine financing providers offer high-cost debt. This early debt is secured by the project’s assets, allowing the lender to take control of the assets if there is a default on the debt.
Resource Identification
Resource Evaluation Test Well Drilling Production Well
Drilling Plant Construction Plant Operation
22
Mezzanine debt typically also requires an equity component ranging from 10% to 30% of the project’s equity, as part of financial return to the lender. Market participants report that requirements for lending at this stage include a contribution of at least 25% of project costs by the developer, a signed PPA, a significantly proven resource (usually by at least one production well drilled), and the fulfillment of other requirements listed in Table 4-2.
Table 4-2. Mezzanine Financing Requirements
Sources Financial Metrics Non-Financial Requirements
» Historical mezzanine debt or bridge loan providers
» Potentially project financiers seeking new markets
» Developers able to provide 20% to 25% of the equity themselves
» ROE usually in the 25%-29% range, 30+% preferable, typically including debt priced at 15% plus 10% to 30% of project equity
» At least one production hole drilled
» Experienced management team
» A resource assessment by well-respected firm
» PPA with creditworthy counterparty
» Drilling contract in place
Source: Navigant interviews with market actors 2010
4.3.3 Construction & Operation Financing
Once a substantial amount of the resource has been proven, project developers are able to seek project-level debt to finance construction and operation of the facility. Developers seek the least expensive capital. Since mid-2009, this has reportedly meant debt financing at this stage of the project if it is feasible given their project funding requirements and internal finances; it is more readily available at this stage than at earlier stages. In some cases, however, it is necessary to bring in an additional equity investor as well as lenders. As with the other types of financing discussed in this guidebook, the market for financing at these stages has changed since the market downturn. This section outlines the major changes in this market, highlights an innovative structure recently employed, discusses the role of federal incentives, and identifies companies with interest in investing at these later stages of project development.
4.3.3.1 Changes Since the Downturn Perhaps the most significant change in project-level financing since the economic downturn is the percentage of resources that are required be proven to secure financing according to market actors. This change essentially translates into an up-front equity investment of greater magnitude before construction financing can be obtained. Historically, project developers report that they had to prove (that is, drill production wells capable of generating) as little as 25% of the resource to obtain construction financing, according to market experts. With the current market risk aversion, however, market participants indicate that proof requirements have risen to as much as 80%, although this appears to be loosening along with other market factors; at least two developers report that they recently obtained construction financing with 50% to 60% of the resource proven.
The 2008 economic downturn also affected the type, sources, and terms of available financing at this stage. Market actors report that the current preference regarding lending structure during this
Resource Identification
Resource Evaluation Test Well Drilling Production Well
Drilling Plant Construction Plant Operation
23
stage is for conversion of construction financing to term loans, with the term loan used to pay off the construction loan. This is a more recent phenomenon and appears largely to be the result of the availability of the Treasury Cash Grant in place of the ITC or PTC. With the Treasury Cash Grant being used to pay down some of the debt at the conclusion of construction, lenders are willing to finance the project using term loans as opposed to the tax equity structure. Prior to the establishment of the Treasury Cash Grant, project developers most commonly used tax equity, which was priced similarly to many debt products because it was very low-risk equity (Harper et al. 2007). The tax equity approach may become more common in the future with the expiration of the Treasury Cash Grant.5
At present, no sale-leaseback transactions and very little tax equity financing are occurring in the geothermal sphere. Prior to the 2008 downturn, the tax equity flip structure was quite common, and some sale-leaseback transactions occurred with renewable energy plants. Essentially, the tax equity flip structure has the same key feature as a sale-leaseback arrangement: both allow the monetization of the tax benefits of the investment. With the partnership flip structure, the ownership of the project flips among partners (including a tax equity investor) at negotiated stages of the arrangement. Historically, the flip typically occurred at 11 years with the PTC and 6 years with the ITC (U.S. DOE 2007). Market actors report that previous tax equity providers were primarily investment and commercial banks, but some insurance companies were also active. JP Morgan has reportedly been active in this arena recently. Under a sale-leaseback transaction, the developer sells the plant to a bank, and then leases it back from the purchaser. As of September 2010, industry experts report that John Hancock is working on lending into a sale-leaseback project finance transaction for wind, though not for geothermal at this time.
As indicated previously, in the current market, construction financing providers are commonly locking in the term loan as well.
4.3.3.2 Innovative Lending Structure A recent example of construction finance indicated a shift in the terms of construction finance. Previously, financing at the construction stage typically was funded by 80% debt, which was refinanced once the plant had reached production with either a more permanent long-term senior debt facility or a tax equity investment. The May 2010 financing of the 49.9 MW Hudson Ranch geothermal project in the Salton Sea Known Geothermal Resource Area raised $300 million in debt and $100 million in additional equity. Further, the debt comprised two components:
• A $95 million cash grant bridge loan for the two-year construction period plus 120 days afterward, which will be repaid with the proceeds from the Treasury Cash Grant (calculated using the ITC)
• A $205 million “mini-perm” loan (Power Finance & Risk 2010)
A “mini-perm” loan is a senior debt facility with a term that is longer than typical bank debt but shorter than long-term “permanent” facilities. These facilities are typically payable over five to seven years and include a balloon payment at the end of the facility. In this case, the facility has a 7-year term: 2 years of construction and 5 years of production. This structure, according to an
5 Unless otherwise modified, the Treasury Cash Grant eligibility rules require that a plant must be under construction by December 31, 2011.
24
interviewee familiar with the transaction, then enables the lender to reduce its risk (through the shorter loan tenor) while allowing the developer time to obtain a longer term loan after building an operational track record, thereby lowering the “permanent” loan’s cost to the developer.
The Hudson Ranch 5-year term loan reflects another recent post-2008 financing market development: shorter loan tenors. For the last couple of years, in contrast to 15- to 20-year financing available before 2008, term loans from banks have generally been running only five to seven years. This has been slowly increasing again, according to market participants, and now some loans are going out 15 years. Insurance companies generally have the longer-term horizon that developers prefer – 18 to 20 years on a 20-year PPA – and they have reportedly become more active in the market in recent months.
4.3.3.3 Role of Federal Incentives Many geothermal power plant developers also seek a loan guarantee from the DOE (GEA 2010) in addition to taking advantage of the PTC, ITC, or Treasury Cash Grant. The DOE Loan Guarantee for renewable energy projects is designed to help lower the cost of borrowing during both the construction and the operation phases of project financing (U.S. DOE 2010(a)). It includes both a fully-guaranteed experimental technology program (section 1703) and a partially-guaranteed conventional technology program (section 1705). Developers report facing some challenges in meeting the necessary conditions for these programs and taking advantage of the tax-based incentives at the same time:
• The first challenge is timing the initial ground-breaking after the necessary federal environmental review under the National Energy Policy Act (NEPA) and before the expiration of the Treasury Cash Grant eligibility at the end of 2011, which is more valuable to developers than the Loan Guarantee according to market experts interviewed. The ITC would be available if the initiation of project construction slips beyond 2011 when the Treasury Cash Grant eligibility would no longer be available (unless otherwise extended).
• If the project misses the potential 2011 construction start date deadline, the second challenge is then to bring the project on-line before the end of 2013 to be able to take advantage of the 30% ITC, which has a deadline for the construction start date. Completing construction between January 1, 2012 and December 31, 2013 may be a challenge for projects with construction timelines closer to 4 years than to 18 months.
Because of these two timing-related challenges, industry sources report that the project pool has been limited. Applications to the DOE Loan Guarantee program under section 1705 have been dominated by projects that were completing NEPA compliance certifications anyway as part of being located on federal land or having another permitting interaction with a federal agency as part of their project. Industry sources report that projects that did not previously have the NEPA process incorporated into their project timelines would generally be unable to meet the timelines for the Treasury Cash Grant or 30% ITC.
Industry experts report that, while the DOE Loan Guarantee can be difficult and expensive to obtain, it can have a very beneficial impact on project cost of capital. According to interviewees, the DOE Loan Guarantee can reportedly reduce the debt cost by 100 to 200 basis points (bps). John Hancock has filed loan guarantee applications under section 1705 of the program for five

25
geothermal projects. One of these, Blue Mountain, was the first geothermal project to be approved by DOE under the conventional technology / Financial Institution Partnership Program (Pettit 2010).
Looking forward, with the potential expiration of eligibility for the Treasury Cash Grant alternative to the ITC and PTC at the end of 2011, it is possible that historical financing structures like tax equity and sale-leaseback deals will regain their place in the market. It is difficult to project at this point what terms providers will seek or how they will structure their transactions; no such transactions for geothermal projects have occurred since the 2008 credit crunch (transactions have occurred for wind and solar), and many of the traditional market players have left the market. Tax equity investors in the solar and wind space have focused their resources on only the best projects with the most proven management teams, leading a “flight to quality” to help mitigate risk (Schwabe et. al 2009).
Based on recent financing activity at other investment stages it appears likely that two changes will occur: (1) there will be new financing structures; and (2) the new financing structures will be designed to reduce the lenders’ risk from the level they assumed before 2008. Without recent geothermal tax equity financing activity, it is difficult to suggest any likely investor requirements. It is probable, however, that these financiers will be looking for the same non-financial characteristics as are providers of term loans detailed in Table 4-3.
4.3.3.4 Interested Providers of Construction and Operations Debt Geothermal construction financing presently is being offered by a number of insurance companies and pension funds with such construction financing typically convertible to term loans at the end of construction, according to market actors. Companies who have been active in this market recently include Manulife (through U.S. subsidiary John Hancock), MetLife, Prudential Life Insurance, and larger North American pension funds. Others active in the just-closed Hudson Ranch project financing include ING, WestLB, Société Generale, Union Bank, CIBC, Investec of South Africa, and Siemens (Power Finance and Risk 2010). The additional Hudson Ranch equity financing was provided by three investors: GeoGlobal Energy (GGE) backed by Mighty River Power (a state-owned New Zealand utility), Hannon Armstrong (a small investment bank), and Catalyst (a biomass developer) (interviewees and Power Finance and Risk 2010). The latter two private equity providers were prior owners of Hudson Ranch; GGE will become a 20% investor in EnergySource, a new company that will oversee Hudson Ranch and develop additional resources in Imperial County, California (Power Finance and Risk 2010).
4.3.3.5 Construction and Operations Equity Developers currently seeking financing identified only one active provider of equity in the later stages of project development: GGE. When lenders required additional equity injections, interviewed developers all raised the funds internally. JP Morgan was identified as one market participant seeking tax equity opportunities, but no geothermal deals of this type are currently public knowledge.
4.3.3.6 Requirements for Investment: Project Financing Construction financing providers require that considerably more of the resource be proven than for mezzanine financing. In the recent economic downturn, market experts report that the requirement rose as high as 80%. More recently, market experts indicate that this requirement is
26
in the range of 50% to 60%; this requirement varies at least in part with the nature of the steam field. Pre-2008, this figure could have been as low as 25% according to market actors. Developer equity requirements have also risen to 40% to 45%, as shown in Table 4-3. Once geothermal projects meet the current investment requirement for 50% to 80% of geothermal resources to be proven, financing risk is currently considered on par with that for gas-fired plants, according to one financier involved with both types of development. Market experts provided data from two different perspectives:
• Borrower Data Point: In late spring 2010, a borrower reported that banks were offering interest rates on project-specific loans that could be as low as 10-year U.S. Treasuries plus 250 to 300 bps with a PPA.
• Financier Data Point: In late summer 2010, a financier reported that insurance companies were offering interest rates on these project-specific loans on the order of 10-year U.S. Treasuries plus 325 to 375 bps for projects with a PPA.
These differences are to be expected, given that the financier’s target project type may differ from the types of projects in the borrower’s portfolio. Both data points are reported to provide some perspective on the variability in the market for geothermal project finance across time and project definitions. The rates for the Hudson Ranch project were at London Interbank Offered Rate (LIBOR) plus 325 escalating to 375 bps (Power Finance and Risk 2010; LCD News 2010).
While typically lenders at this stage will expect a signed PPA with a creditworthy counterparty, there is at least one market, according to interviewees, where a PPA may not be necessary to obtain financing: California. The RPS of 33% in California is so stringent that lenders perceive minimal risk of failure to sell the energy. At the same time, market participants indicated that lenders would expect to see more equity in the project if no PPA were in place.
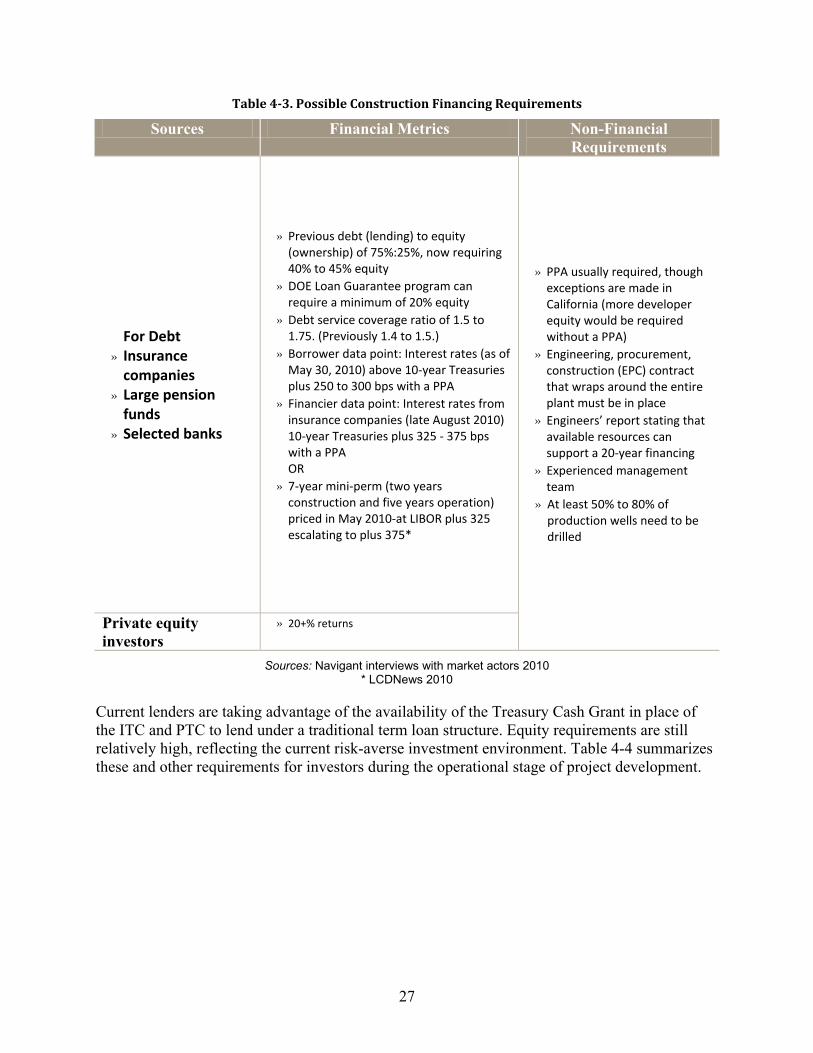
27
Table 4-3. Possible Construction Financing Requirements
Sources: Navigant interviews with market actors 2010 * LCDNews 2010
Current lenders are taking advantage of the availability of the Treasury Cash Grant in place of the ITC and PTC to lend under a traditional term loan structure. Equity requirements are still relatively high, reflecting the current risk-averse investment environment. Table 4-4 summarizes these and other requirements for investors during the operational stage of project development.
Sources Financial Metrics Non-Financial Requirements
For Debt » Insurance
companies » Large pension
funds » Selected banks
» Previous debt (lending) to equity (ownership) of 75%:25%, now requiring 40% to 45% equity
» DOE Loan Guarantee program can require a minimum of 20% equity
» Debt service coverage ratio of 1.5 to 1.75. (Previously 1.4 to 1.5.)
» Borrower data point: Interest rates (as of May 30, 2010) above 10-year Treasuries plus 250 to 300 bps with a PPA
» Financier data point: Interest rates from insurance companies (late August 2010) 10-year Treasuries plus 325 - 375 bps with a PPA OR
» 7-year mini-perm (two years construction and five years operation) priced in May 2010-at LIBOR plus 325 escalating to plus 375*
» PPA usually required, though exceptions are made in California (more developer equity would be required without a PPA)
» Engineering, procurement, construction (EPC) contract that wraps around the entire plant must be in place
» Engineers’ report stating that available resources can support a 20-year financing
» Experienced management team
» At least 50% to 80% of production wells need to be drilled
Private equity investors
» 20+% returns

28
Table 4-4. Possible Post-Construction Project Financing Requirements
Sources Financial Metrics Non-Financial Requirements
» Insurance companies
» Large pension funds
» Selected banks
» Construction loan typically paid down with Treasury Cash Grant
» DOE Loan Guarantee program requires a minimum of 20% equity and, if getting the 30% ITC or Treasury Cash Grant, they want 14% equity after the 30% ITC
» Previously required debt to equity of 75%:25%, now 40% to 45% equity
» Debt service coverage ratio (DSCR) of at least 1.5
» Experienced management team
» Typically require a PPA with a creditworthy counterpart
» Engineers’ report stating that the resources are available to support a 20-year financing
Source: Navigant interviews with market actors 2010
4.4 Common Pitfalls in Obtaining Geothermal Financing For developers interested in financing their projects, there are a number of common pitfalls to be aware of and avoid in the process. Perhaps the most common pitfall is excessive optimism. Investors need to have confidence that the developer knows what they are doing; developers that neglect to plan for the inevitable dry hole or to adequately account for production wells in their financial forecast are setting themselves up for failure. The best case is inability to raise capital; the worst case is undercapitalized and comprehensive losses. It is essential to incorporate adequate contingencies to protect all investors and demonstrate a thorough understanding of project development risks and requirements. Some specific areas to pay particular attention to include the following:
• Adequate production well drilling funding that assumes a credible rate of dry holes
• A reasonable drilling cost per well that reflects the required well depth and hydrothermal geology
• Funding to cover an adequate number of injection wells
• Time and investment to obtain all necessary permits
• A reasonable all-in cost of plant construction assuming use of an EPC contractor
• Reasonable development and construction time horizon
A second common pitfall is seeking funding from the wrong sources for the particular project’s stage of development. An insurance company is not going to be interested in providing capital early in the resource identification and valuation stages. A private equity investor would be an unnecessarily expensive funding source in the later project development stages when construction and term loans are available.
Another frequent mistake is seeking financing before the project development is mature enough. It is important to understand the risk parameters, financial metrics, and non-financial requirements of prospective lenders before they are approached. This includes making sure the property and resource rights are all secured and that those rights are fully understood – as are the permitting and approval processes. Additionally, the developer needs to have a good engineering analysis of the resource available.
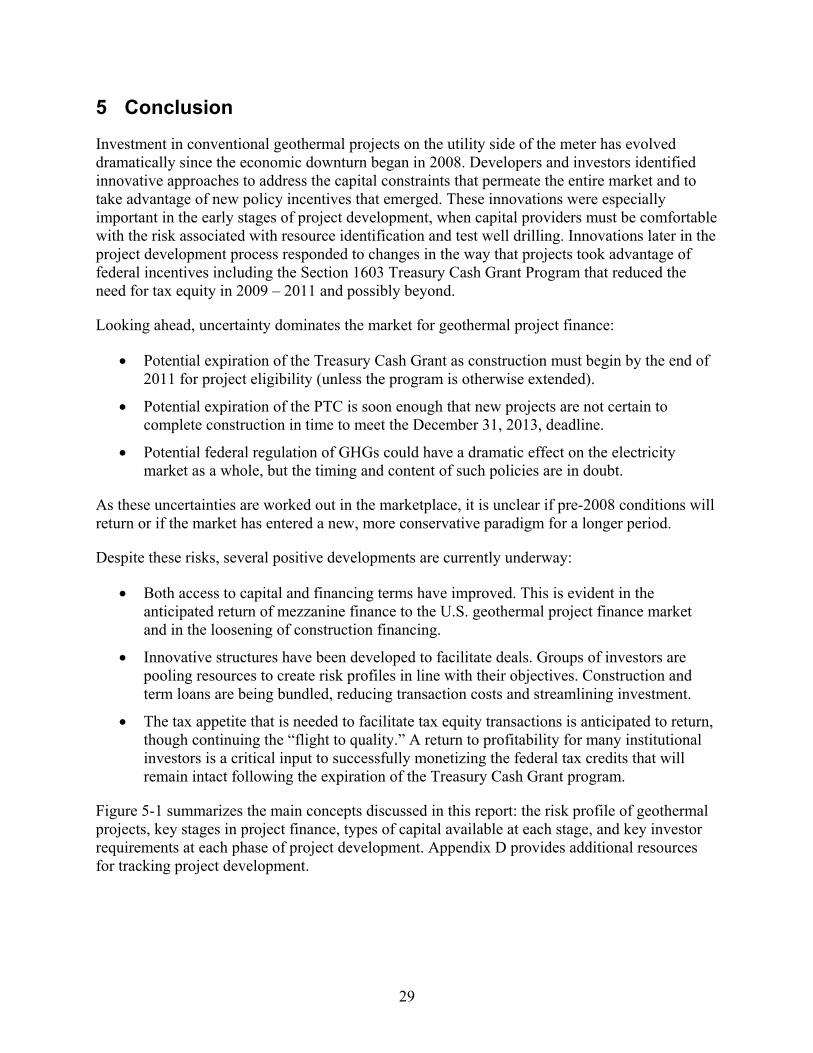
29
5 Conclusion
Investment in conventional geothermal projects on the utility side of the meter has evolved dramatically since the economic downturn began in 2008. Developers and investors identified innovative approaches to address the capital constraints that permeate the entire market and to take advantage of new policy incentives that emerged. These innovations were especially important in the early stages of project development, when capital providers must be comfortable with the risk associated with resource identification and test well drilling. Innovations later in the project development process responded to changes in the way that projects took advantage of federal incentives including the Section 1603 Treasury Cash Grant Program that reduced the need for tax equity in 2009 – 2011 and possibly beyond.
Looking ahead, uncertainty dominates the market for geothermal project finance:
• Potential expiration of the Treasury Cash Grant as construction must begin by the end of 2011 for project eligibility (unless the program is otherwise extended).
• Potential expiration of the PTC is soon enough that new projects are not certain to complete construction in time to meet the December 31, 2013, deadline.
• Potential federal regulation of GHGs could have a dramatic effect on the electricity market as a whole, but the timing and content of such policies are in doubt.
As these uncertainties are worked out in the marketplace, it is unclear if pre-2008 conditions will return or if the market has entered a new, more conservative paradigm for a longer period.
Despite these risks, several positive developments are currently underway:
• Both access to capital and financing terms have improved. This is evident in the anticipated return of mezzanine finance to the U.S. geothermal project finance market and in the loosening of construction financing.
• Innovative structures have been developed to facilitate deals. Groups of investors are pooling resources to create risk profiles in line with their objectives. Construction and term loans are being bundled, reducing transaction costs and streamlining investment.
• The tax appetite that is needed to facilitate tax equity transactions is anticipated to return, though continuing the “flight to quality.” A return to profitability for many institutional investors is a critical input to successfully monetizing the federal tax credits that will remain intact following the expiration of the Treasury Cash Grant program.
Figure 5-1 summarizes the main concepts discussed in this report: the risk profile of geothermal projects, key stages in project finance, types of capital available at each stage, and key investor requirements at each phase of project development. Appendix D provides additional resources for tracking project development.

30
This guidebook is intended to facilitate further investment in conventional geothermal projects in the United States. Using the information provided, developers and investors may innovate in new ways, developing partnerships that match investors’ risk tolerance with the capital requirements of geothermal projects. The marketplace is dynamic and will continue to evolve.
31
Figure 5-1. Summary of this guidebook’s key information for financing geothermal projects
Source: Navigant interviews with market actors 2010
Resource Identification
Resource Evaluation Test Well Drilling Production Well
Drilling Plant Construction Plant Operation
Early-Stage Financing Late Development Construction and Project Finance
Public Exchanges and Private Equity Corporate Balance Sheet Mezzanine Debt Construction Loan Term Loan
» Financial plan with reasonable assumptions about well costs and failed wells
» 2x to 5x multiple on investment
» ROE of minimum 10%, preferably 13+%
» ROE 100 to 200 basis points higher than wind
» ROE usually in the 25-29% range, 30+% preferable,typically includes debt priced at 15% plus 10-30% of equity
» Developers able to provide 20 to 25% of the equity
» Debt to equity ratio of 55%:45% or less
» DOE Loan Guarantee requires at least20% equity
» DSCR of 1.5 to 1.75» Interest rates at
10-year U.S. Treasuries plus 325-375 basis points with PPA
» Debt to equity ratio of 55%:45% or less
» DOE Loan Guarantee requires at least 20% equity
» DSCR of at least 1.5
» Construction loan typically paid down with Treasury Cash Grant
» Experienced and qualified management team
» Risk mitigation strategies planned and implemented » PPA with creditworthy counterparty (exceptions for California)
» Resource assessment from a well-respected firm
» Drilling contract in place
» At least one production well drilled
» Engineers’ report affirming resource availability to support 20-year financing
» At least 50-80% of production wells drilled
» EPC contract in place
Fina
ncia
l Req
uire
men
tsN
on-F
inan
cial
Req
uire
men
tsRisk Profile
32
6 References
Biello, D. (2008). “Drilling for Hot Rocks: Google Sinks Cash into Advanced Geothermal Technology.” Scientific American. http://www.scientificamerican.com/article.cfm?id=google-invests-in-geothermal. (Accessed July 1, 2010).
Bird, L.; Holt, E.; Carroll, G. (2007). Implications of Carbon Regulation for Green Power Markets. NREL-TP-640-41076. Golden, CO: National Renewable Energy Laboratory. http://www.nrel.gov/docs/fy07osti/41076.pdf. (Accessed July 2, 2010).
Bolinger, M., et. al. (2009). PTC, ITC, or Cash Grant? An Analysis of the Choice Facing Renewable Power Projects in the United States. LBNL-1642E. Berkeley, CA: Lawrence Berkeley National Laboratory; NREL/TP-6A2-45359. Golden, CO: National Renewable Energy Laboratory. http://eetd.lbl.gov/ea/emp. (Accessed July 1, 2010).
California Air Resources Board. (2009). Preliminary Draft Regulation for a California Cap-and-Trade Program. http://www.arb.ca.gov/cc/capandtrade/meetings/121409/pdr.pdf. (Accessed July 1, 2010).
California Air Resources Board (CARB). (2010). “Cap-and-Trade.” http://www.arb.ca.gov/cc/capandtrade/capandtrade.htm. (Accessed July 1, 2010).
California Energy Commission (CEC). (2009). Renewable Energy Cost of Generation Update. http://www.energy.ca.gov/2009publications/CEC-500-2009-084/CEC-500-2009-084.PDF. (Accessed July 1, 2010).
California Energy Commission (CEC). (2010). “Geothermal Energy in California.” http://www.energy.ca.gov/geothermal/index.html. (Accessed July 1, 2010).
California Public Utilities Commission (CPUC). (2010). Decision Staying Decision 10-03-021 and Implementing Temporary Moratorium on Commission Approval of Certain Contracts. Rulemaking 06-02-012. http://docs.cpuc.ca.gov/PUBLISHED/FINAL_DECISION/117847.htm. (Accessed July 1, 2010).
Chadbourne and Parke LLP. (2009). Project Finance NewsWire. http://www.chadbourne.com/files/Publication/810dde60-3c78-4a9a-9c5d-a5fae8014b4f/Presentation/PublicationAttachment/51fc06c5-1407-48ac-9dff-a605de0f58e1/pfn0109.pdf. (Accessed July 2, 2010).
Cowan, L. (2010). “IPOs Trail Off as the Market’s Tumult Takes Toll.” Wall Street Journal.
Cross, J.; Freeman, J. (2009). 2008 Geothermal Technologies Market Report. U.S. Department of Energy. http://www1.eere.energy.gov/geothermal/pdfs/2008_market_report.pdf. (Accessed July 1, 2010).
Database of State Incentives for Renewables and Efficiency (DSIRE). (2010(a)). “Federal Incentives and Policies for Renewables and Efficiency.” http://www.dsireusa.org/incentives/index.cfm?state=us&re=1&EE=1. (Accessed July 1, 2010).
33
Database of State Incentives for Renewables and Efficiency (DSIRE). (2010(b)). “Oregon Incentives / Policies for Renewable Energy.” http://www.dsireusa.org/incentives/incentive.cfm?Incentive_Code=OR22F&re=1&ee=1. (Accessed July 1, 2010).
Database of State Incentives for Renewables and Efficiency (DSIRE). (2010(c)). “Renewable Energy Production Tax Credit.” http://www.dsireusa.org/incentives/incentive.cfm?Incentive_Code=US13F&re=1&ee=1. (Accessed July 1, 2010).
Database of State Incentives for Renewables and Efficiency (DSIRE). (2010(d)). “Rules, Regulations and Policies for Renewable Energy.” http://www.dsireusa.org/summarytables/rrpre.cfm. (Accessed July 1, 2010).
Database of State Incentives for Renewables and Efficiency (DSIRE) (2010(e)). “Delaware: Renewable Portfolio Standard.” http://www.dsireusa.org/incentives/incentive.cfm?Incentive_Code=DE06R&re=1&ee=1. (Accessed July 2, 2010).
Database of State Incentives for Renewables and Efficiency (DSIRE) (2010(f)). “Massachusetts: Renewable Portfolio Standard.” http://www.dsireusa.org/incentives/incentive.cfm?Incentive_Code=MA05R&re=1&ee=1. (Accessed July 2, 2010).
Deloitte. 2008. Department of Energy – Office of Energy Efficiency and Renewable Energy Geothermal Program: Geothermal Risk Mitigation Strategies Report. http://www1.eere.energy.gov/geothermal/pdfs/geothermal_risk_mitigation.pdf (Accessed November 10, 2010).
Doris, E.; Kreycik, C.; Young, K. (2009). Policy Overview and Options for Maximizing the Role of Policy in Geothermal Electricity Development. NREL/TP-6A2-46653. Golden, CO: National Renewable Energy Laboratory. http://www.nrel.gov/docs/fy10osti/46653.pdf. (Accessed July 1, 2010).
eMedia World. (2009). “Geothermal Power Companies Announce Intent to Combine Businesses and Concurrently Raise $100 Million Equity Financing.” http://www.emediaworld.com/press_release/release_detail.php?id=641274. (Accessed July 1, 2010).
Environmental Tracking Network of North America (ETNNA). (2010). “Renewable Energy Tracking Systems.” http://www.etnna.org/images/ETNNA-Tracking-System-Map.gif. (Accessed July 2, 2010).
Environmental Tracking Network of North America (ETNNA). (2010). “Learn About Tracking Systems.” http://www.etnna.org/learn.html. (Accessed June 29, 2010).
34
Evolution Markets. (2010). REC Markets – February 2010: Monthly Market Update. http://new.evomarkets.com/scripts/getmmu.php?uid=web&mmu_id=509. (Accessed June 29, 2010).
Fleishmann, D. (2007). An Assessment of Geothermal Resource Development Needs in the Western United States. Geothermal Energy Association. http://www.geo-energy.org/reports/States%20Guide.pdf. (Accessed July 1, 2010).
GE Global Research. (2010). “High-Potential Working Fluids for Next Generation Binary Cycle Geothermal Power Plants.” U.S. Department of Energy, Office of Energy Efficiency and Renewable Energy, Geothermal Technologies Program Projects Database. http://apps1.eere.energy.gov/geothermal/projects/projects.cfm/ProjectID=177. (Accessed July 1, 2010).
Geothermal Energy Association (GEA). (2009). “Geothermal Energy Basics.” www.geo-energy.org/geo_introduction.aspx. (Accessed July 1, 2010).
Geothermal Energy Association (GEA). (2010). “DOE Offers First Geothermal Loan Guarantees to Projects in Nevada and Oregon.” Geothermal Energy Weekly. http://www.geo-energy.org/pdf/updates/2010/Geothermal_Energy_Weekly_June_21_2010.pdf. (Accessed July 29, 2010).
Geysers Geothermal Association. (2005). “Geysers Geothermal History.” http://www.thegga.org/GGAhistory.html. (Accessed June 15, 2010).
Harper, J.; Karcher, M.; Bolinger, M. (2007). Wind Project Financing Structures: A Review and Comparative Analysis. LBNL-63434. Berkeley, CA: Lawrence Berkeley National Laboratory. http://eetd.lbl.gov/ea/emp. (Accessed July 1, 2010).
Idaho National Energy Laboratory. (2010). “Production of Geothermal Energy.” https://inlportal.inl.gov/portal/server.pt/community/geothermal/422/what_is_geothermal_energy (Accessed July 1, 2010).
Investopedia. (2010). http://www.investopedia.com/terms/m/miniperm.asp. (Accessed June 30, 2010).
Islandsbanki. (2009). United States Geothermal Energy Market Report. Islandsbanki. http://www.islandsbanki.is/english/industry-focus/sustainable-energy/research-and-publications/usgeothermal/. (Accessed July 1, 2010).
Jennejohn, D. (2010). U.S. Geothermal Power Production and Development Update. Geothermal Energy Association. http://www.geo-energy.org/pdf/reports/April_2010_US_Geothermal_Industry_Update_Final.pdf. (Accessed July 1, 2010).
Kagel, A. (2008). The State of Geothermal Technology, Part II: Surface Technology. Geothermal Energy Association. http://www.geo-energy.org/reports/Geothermal%20Technology%20-%20Part%20II%20(Surface).pdf. (Accessed September 14, 2010).

35
LCDNews. (2010). “Hudson Ranch Wraps $300 Million Loan for Geothermal Project.” (Accessed July 1, 2010).
Lund, J. (2004). "100 Years of Geothermal Power Production." Geo-Heat Centre Quarterly Bulletin 25 (3): 11–19, ISSN 0276-1084. Klamath Falls, Oregon: Oregon Institute of Technology. http://geoheat.oit.edu/bulletin/bull25-3/art2.pdf. (Accessed July 1, 2010).
Midwest Greenhouse Gas Accord (MGGRA). (2009). “Midwestern Accord Executive Committee Straw Proposal on Major Unresolved Issues, Draft 5/5/09.” http://www.midwesternaccord.org/Meeting%20material%20pages/GHG-meeting-10/MGGRA%20Straw_5-6-09.doc. (Accessed December 14, 2010).
Mortished, C. (2008). “Government Takes Control of Glitnir, Iceland’s Third-Largest Bank.” Sunday Times. http://business.timesonline.co.uk/tol/business/industry_sectors/banking_and_finance/article4849302.ece. (Accessed June 29, 2010).
Nelson, G. (2010). “Court Freezes Bids to Return Greenhouse Gas ‘Endangerment’ Finding to EPA.” New York Times. http://www.nytimes.com/gwire/2010/06/18/18greenwire-court-freezes-bids-to-return-greenhouse-gas-en-15799.html. (Accessed July 1, 2010).
Nevada Geothermal. (2010). “Named as part of 2010 TSX Venture 50.” http://www.nevadageothermal.com/s/News.asp?ReportID=384008&_Type=News&_Title=Named-as-part-of-2010-TSX-Venture-50. (Accessed June 29, 2010).
Offset Quality Initiative. (2009). “Maintaining Carbon Market Integrity: Why Renewable Energy Certificates Are Not Offsets.” http://climatetrust.org/pdfs/JuneBrief.pdf. (Accessed June 3, 2010).
Ormat Technologies. (2010). 10-K. http://edgar.sec.gov/Archives/edgar/data/1296445/000095012310022121/0000950123-10-022121-index.htm. (Accessed June 29, 2010).
Pettit, J. (2010). “Geothermal Projects Recent Beneficiaries of DOE’s Loan Guarantee Programs.” Stoel Rives Renewable + LawSM. http://www.lawofrenewableenergy.com/2010/06/articles/geothermal/geothermal-projects-recent-beneficiaries-of-does-loan-guarantee-programs/. (Accessed September 13, 2010).
Pew Center for Global Climate Change. (2010(a)). “U.S. Federal.” http://www.pewclimate.org/federal. (Accessed July 1, 2010).
Pew Center for Global Climate Change. (2010(b)). “U.S. States and Regions: Climate Action Summary by State.” http://www.pewclimate.org/states-regions. (Accessed July 1, 2010).
Power Finance and Risk. (2010). “Hudson Geothermal Deal Closes, Marks Milestone.” http://www.iipower.com/Article/2576373/Hudson-Geothermal-Deal-Closes-Marks-Milestone.html. (Accessed July 1, 2010).
36
PR Newswire. (2009). “ArcLight Capital Partners Announces Partnership in Terra-Gen Partners.” http://www.prnewswire.com/news-releases/arclight-capital-partners-announce-partnership-in-terra-gen-power-67320282.html. (Accessed July 1, 2010).
Regional Greenhouse Gas Initiative (RGGI). (2010). http://www.rggi.org/. (Accessed July 1, 2010).
RenewableEnergyWorld.com. (2010). “Denham Capital Invests $108 Million in Geothermal Developer Vulcan Power Company.” http://www.renewableenergyworld.com/rea/news/article/2010/02. (Accessed July 1, 2010).
Richter, A. (2010). “Standard Steam Trust Pulling December IPO.” ThinkGeoEnergy.com. http://thinkgeoenergy.com/archives/4560. (Accessed September 14, 2010).
Roberts, B. (2010). Geothermal Power Generation: Current and Planned Capacity (MW) by State. National Renewable Energy Laboratory.
Schwabe, P.; Cory, K.; Newcomb, J. (2009). Renewable Energy Project Financing: Impacts of the Financial Crisis and Federal Legislation. NREL-TP-6A2-44930. Golden, CO: National Renewable Energy Laboratory. http://www.nrel.gov/docs/fy09osti/44930.pdf. (Accessed July 2, 2010).
Sheets, B. (2010). “Snohomish County PUD to Probe for Sources of Geothermal Energy.”Daily Herald (Everett, WA). http://www.heraldnet.com/article/20100816/NEWS01/708169924&news01ad=1#Snohomish.County.PUD.to.probe.for.sources.of.geothermal.energy. (September 14, 2010).
SNL Financial. (2010). SNLxI (a private, subscription-based database). Charlottesville, VA. (Accessed June 30, 2010).
Summit Blue Consulting. (2009). New York Renewable Portfolio Standard Market Conditions Assessment: Final Report. Completed for the New York State Energy Research and Development Authority. Agreement number 10430. http://www.nyserda.org/Energy_Information/Market%20Conditions%20Final%20Report.pdf. (Accessed July 2, 2010).
Tester, J.W., et al. (2006). Impact of Enhanced Geothermal Systems on U.S. Energy Supply in the Twenty-First Century. Produced by Massachusetts Institute of Technology for the U.S. Department of Energy. http://www1.eere.energy.gov/geothermal/pdfs/future_geo_energy.pdf. (Accessed July 1, 2010).
The Wilderness Society. (2008). “Geothermal Development on Public Lands.” http://wilderness.org/files/Website-Geothermal%20Development%20On%20Public%20Lands.pdf. (Accessed July 1, 2010).
ThinkGeoEnergy. (2009). “Merger Between Ram Power, Polaris Geothermal and Western GeoPower Complete.” http://thinkgeoenergy.com/archives/2758. (Accessed July 1, 2010).
37
U.S. Department of Energy. (1992). “The U.S. Geothermal Industry: Three Decades of Growth.” http://geothermal.id.doe.gov/publications/articles/mclarty/mclarty-reed.pdf. (Accessed July 1, 2010).
U.S. Department of Energy (DOE). (2006(a)). “U.S. Geothermal Resource Map.” Office of Energy Efficiency and Renewable Energy, Geothermal Technologies Program. http://www1.eere.energy.gov/geothermal/geomap.html. (Accessed July 1, 2010).
U.S. Department of Energy (DOE). (2006(b)). “How an Enhanced Geothermal System Works.” Office of Energy Efficiency and Renewable Energy, Geothermal Technologies Program. http://www1.eere.energy.gov/geothermal/egs_animation.html. (Accessed July 1, 2010).
U.S. Department of Energy (DOE). (2006(c)). “A History of Geothermal Energy in the United States.” Office of Energy Efficiency and Renewable Energy, Geothermal Technologies Program. http://www1.eere.energy.gov/geothermal/history.html. (Accessed July 1, 2010).
U.S. Department of Energy (DOE). (2007). Wind Project Financing Structures: A Review and Comparative Analysis. Office of Energy Efficiency and Renewable Energy, Geothermal Technologies Program. http://eetd.lbl.gov/ea/emp/reports/63434.pdf. (Accessed July 1, 2010).
U.S. Department of Energy (DOE). (2008(a)). “Hydrothermal Power Systems.” Office of Energy Efficiency and Renewable Energy, Geothermal Technologies Program. http://www1.eere.energy.gov/geothermal/powerplants.html. (Accessed July 1, 2010).
U.S. Department of Energy (DOE). (2008(b)). Geothermal Technologies Program Multi-Year Research, Development and Demonstration Plan: 2009-2015 with program activities to 2025. Office of Energy Efficiency and Renewable Energy, Geothermal Technologies Program. http://www1.eere.energy.gov/geothermal/plans.html. (Accessed July 1, 2010).
U.S. Department of Energy (DOE). (2010(a)). Federal Interagency Geothermal Activities. Office of Energy Efficiency and Renewable Energy, Geothermal Technologies Program. http://www1.eere.energy.gov/geothermal/pdfs/ngap.pdf. (Accessed July 1, 2010).
U.S. Department of Energy (DOE). (2010(b)). Annual Energy Outlook 2010. Energy Information Administration. DOE/EIA-0383(2010). http://www.eia.doe.gov/oiaf/aeo/index.html. (Accessed September 13, 2010).
U.S. Department of State. (2010). U.S. Climate Action Report 2010. Washington: Global Publishing Services. http://www.state.gov/documents/organization/140636.pdf. (Accessed May 1, 2010).
U.S. Geothermal. (2008). “Now Trading on the American Stock Exchange.” http://www.usgeothermal.com/NewsReleases/Apr-16-2008.pdf. (Accessed June 29, 2010).
U.S. Geothermal. (2009). “U.S. Geothermal Announces C$10.9 Million Private Placement Financing.” http://www.usgeothermal.com/NewsReleases/2009-August-17.pdf. (Accessed July 1, 2010).
38
U.S. Geothermal. (2010). “U.S. Geothermal Closes $8.6 Million Private Placement Financing.” http://www.usgeothermal.com/NewsReleases/March-09-2010.pdf. (Accessed July 1, 2010).
U.S. Renewables. (2010). “Power Generation.” http://www.usregroup.com/power-generation.html. (December 14, 2010).
Western Climate Initiative Cap Setting and Allowance Allocation Committee. (2009). Draft Guidance for Developing Partner Allowance Budgets. http://www.westernclimateinitiative.org/component/remository/Cap-Setting--and--Allowance-Distribution-Committee-Documents/Draft-Guidance-for-Developing-WCI-Partner-Allowance-Budgets/. (Accessed July 1, 2010).
Western Climate Initiative. (2008). Design Recommendations for the WCI Regional Cap-and-Trade Program. http://www.westernclimateinitiative.org/the-wci-cap-and-trade-program/design-recommendations. (Accessed July 2, 2010).
Williams, C. F.; Reed, M.J.; Mariner, R.H.; DeAngelo, J.; Galanis, S.P. Jr. (2008). “Assessment of Moderate- and High-Temperature Geothermal Resources of the United States.” U.S. Geological Survey Fact Sheet 2008-3082. http://pubs.usgs.gov/fs/2008/3082/. (Accessed September 14, 2010).
Wiser, R.; Barbose, G. (2008). Renewable Portfolio Standards in the United States: A Status Report with Data through 2007. LBNL-154E. Berkeley, CA: Lawrence Berkeley National Laboratory. http://eetd.lbl.gov/ea/emp/reports/lbnl-154e-revised.pdf. (Accessed July 2, 2010).
39
Appendix A. Additional Detail on Relevant Policies
Several current policies and incentives supporting geothermal electricity development are iterations of earlier programs first introduced during the 1970s. RD&D funding and PURPA requirements for utility purchases of renewable energy are credited with driving a surge in geothermal project development from the late 1970s through the mid 1980s. PURPA has become a less significant driver, largely due to a decrease in utility avoided costs (Doris et al. 2009). However, RD&D funding continues to play a critical role in advancing the market for geothermal electricity today as newer types of geothermal technology, such as EGS, could dramatically increase the amount of geothermal resource potential in the United States. Key areas of current policy and incentive support for geothermal electricity development are summarized here.
Federal Tax Incentives, Grants, and Loan Guarantees Developers depend on tax incentives to provide financial returns sufficient to attract project investment. The PTC has functioned as a key project development driver since it became available to geothermal projects in 2004. This performance-based incentive provides a tax credit of 2.2 cents (2010$)/kWh to geothermal electric projects for the first 10 years of project operations (DSIRE 2010(c)). A project must be put in service by December 31, 2013, to qualify. Given the 4- to 7-year development timeline for geothermal projects, the incentive may be limited in its ability to spur development of projects that are not already in the development pipeline unless it is extended.
Since 2004, geothermal project investors have been able to choose between the PTC and an ITC worth 10% of qualified expenditures. The Recovery Act increased this ITC to 30% for geothermal projects placed in service through December 31, 2013. After that date, geothermal projects will continue to be eligible to receive a 10% ITC; there is no sunset date for the 10% ITC level.
Following passage of the Recovery Act in February 2009, project investors can opt to take a Treasury Cash Grant in lieu of the PTC or ITC. The applicability of the Treasury Cash Grant for geothermal projects is complex and can be challenging to understand. During the appropriate eligibility timeframe, projects can take either the ITC or the PTC in the form of the Treasury Cash Grant. However, because of the way the ITC defines property eligible for the incentive,6
6 For the ITC (26 USC § 48) equipment used to produce, distribute, or use energy derived from a geothermal deposit (also defined according to section 613(e)(2)) is eligible for the 10% incentive level, and this only applies to equipment “up to (but not including) the transmission stage.” For the PTC (26 USC § 45), “geothermal energy" is defined as energy derived from a geothermal deposit (within the meaning of section 613(e)(2). See Doris et al. 2009 for additional discussion of the issues surrounding eligibility for the PTC, ITC, and Treasury Cash Grant.
different components of the geothermal project qualify for different incentive levels; the power plant equipment is eligible for the 30% incentive level while the equipment used to derive the
40
energy from the deposit (e.g., wells) is only eligible for the 10% incentive level (Doris et al. 2009). 7
Industry representatives report that the majority of geothermal projects that have come online since the Treasury Cash Grant has been available have opted to take this incentive (personal communications with industry experts, May 2010). The grant is attractive to project investors because: 1) the full value of the grant is paid out quickly (within 60 days of the receipt of a complete application and only after the project is operational)
8
Unless otherwise extended, the 30% Treasury Cash Grant is available to projects that begin construction in 2009, 2010, or 2011, and that are placed in service prior to January 1, 2014; a 10% Treasury Cash Grant is available to projects that begin construction in 2009, 2010, or 2011, and that are placed in service prior to January 1, 2017.
and 2) the value is not limited by a recipient’s tax liability. These features of the Treasury Cash Grant mean that developers can avoid the need to seek out tax equity investors with sufficient tax appetite, and can reap balance sheet benefits since the full value of the grant is realized so quickly.
9
Inter-Agency Coordination and Streamlining of Federal Permitting and Land Lease Processes
Developers have had an easier time gaining access to federal lands recently than in past years. This is due both to improvements in the process for obtaining leases and a reduction in the environmental review process necessary for many development sites. Leases are now issued by BLM through a fully competitive bidding process, and a greater volume of land is available for lease. BLM has also processed its backlog of lease applications, and offers leases for sale on a more frequent schedule (Doris et al. 2009).
Completion of a PEIS by BLM in 2008 also improved the lease process substantially. The PEIS involved an analysis of the environmental impacts of potential geothermal development on federally owned land in areas of the western United States with strong resource availability. Use of this analysis, as well as best practices defined in the PEIS, will help reduce lease and permit processing times.10
7 26 U.S.C. § 613(3)(2) defines a geothermal deposit as “a geothermal reservoir consisting of natural heat which is stored in rocks or in an aqueous liquid or vapor (whether or not under pressure).”
8 Applications deemed incomplete are sent back to the applicants, restarting the 60-day clock. 9 Per U.S. Treasury Department guidance, “Construction begins when physical work of a significant nature begins. Work performed by the applicant and by other persons under a written binding contract is taken into account in determining when construction begins.” Treasury Department guidance also notes that an applicant may also make use of a safe harbor provision for purposes of determining when construction begins. 10 Further information on the BLM’s PEIS process for geothermal can be found at: http://www.blm.gov/wo/st/en/prog/energy/geothermal/geothermal_nationwide.html. Accessed June 29, 2010.
41
In 2008, the U.S. Geological Survey completed an assessment of geothermal resources that covered moderate- and high-temperature resources in 13 states. Providing access to these data will help lower project costs and risk for project developers by shortening the early resource identification phase of project development (U.S. DOE 2010(a)).11
Improved transmission infrastructure is essential to geothermal project development, since geothermal resources are typically located in remote areas far from load centers. Further, proof of transmission access can be necessary in order to line up project financing. Federal agencies are collaborating with numerous stakeholders in the WREZ Initiative. The WREZ Initiative seeks to facilitate efficient, environmentally sound development of transmission infrastructure to enhance development opportunities in renewable energy resource zones.
12
Renewable Portfolio Standards
Binding RPSs exist in 29 states, while seven states have non-binding targets for renewable energy (DSIRE 2010(d)). These constitute the most robust state-level policy drivers for geothermal electricity project development (DSIRE 2010(d)). The potential revenue impacts are discussed in the main body of the report in Section 3.1.3 and in section 4.3.2. Additional detail on the use of RECs in geothermal project finance is provided in Appendix B. Table A-5 includes more detail on the RPS policies in the states with conventional, electricity-generating geothermal projects already installed or in the pipeline.
11 The assessment produced GIS data available to the public. Further information about the USGS geothermal resource assessment is available at http://pubs.usgs.gov/fs/2008/3082/ (accessed June 29, 2010), and GIS data files can be obtained at http://www.blm.gov/wo/st/en/prog/energy/geothermal/geothermal_nationwide/Documents/GIS_Data.html. Accessed June 29, 2010. 12 Additional detail about the WREZ process can be found on the Western Governors Association Web site: http://www.westgov.org/index.php?option=com_content&view=article&id=219&Itemid=81

42
Table A-5. Summary of State RPS Policies
State Installed Hydrothermal Capacity (MW)
Hydrothermal Capacity in
Development (MW) (Min-
Max)
Current RPS Target
Year of First Requirement
California 2,565.5 1,609.7 – 1,997.7 20% by 2010; 33% by 2030
2003
Nevada 426.8 2,120.43 – 3,686.43 25% by 2025 2006
Utah 42 628 – 883 No RPS (Goal: 20% by 2025)
Hawaii 35 8 40% by 2030 2010
Idaho 15.8 413 – 676 No RPS
Alaska 0.73 80 No RPS
Oregon 0.28 342 – 473 Large Utilities 25% by 2025; Small
Utilities 10% or 5% by 2025 depending
on size
2011
Wyoming 0.25 0.28 No RPS
New Mexico 0.24 35 IOUs 20% by 2010; Co-ops 10% by
2020
2002
Washington 0 Undefined 15% by 2020 2012
Arizona 0 2 – 20 15% by 2025 1999
Colorado 0 10 IOUs (Coops/munis):
30% (10%)* by 2020
2007
Florida** 0 0.2 – 1 No RPS
Total 3,086.6 5,249-7,840
* Co-ops and municipal utilities with >40,000 customers are subject to RPS requirements
Sources: Roberts 2010; DSIRE 2010(a); Jennejohn 2010
43
Other State Incentives A number of states offer other policies and incentives aimed at driving geothermal project development. Notable among these are California’s funding for research, development, and commercialization efforts, and Oregon’s significant investment tax credit and direct project funding.13
Though often funded by federal dollars, state universities can also play an important role in resource assessment and data-sharing activities. For example, research findings from the University of Nevada-Reno’s Great Basin Center for Geothermal Energy have played an important role in the industry (Fleishmann 2007). Access to these data can reduce resource identification costs for project developers. A number of states also offer sales tax and property tax abatement; the impacts of these policies are small relative to RPSs but can improve project economics.
California’s Geothermal Resources Development Account (GRDA) provides substantial industry development support and is funded with royalties the state receives from federal leases (CEC 2010). Energy Trust of Oregon makes funding available to geothermal projects in Oregon that draw on dollars collected through customers’ utility bills (DSIRE 2010(b)).
State policies that limit greenhouse gas emissions also favor geothermal development. Strong geothermal states with such policies include California, Oregon, and Colorado (Pew Center 2010(b)). A state’s electric industry regulatory framework can also influence project finance to the extent that it encourages or discourages utility ownership of generation assets. More detail on these policies is provided in Appendix C.
Federal Research, Development, and Demonstration Funding DOE’s GTP manages RD&D funding efforts. GTP funds activities across the full range of geothermal technologies, including EGS demonstration. GTP is working to demonstrate EGS technology readiness by 2015, and recent expenditures reflect this commitment; industry experts report that many of these EGS-driven activities also benefit conventional geothermal technologies. GTP’s numerous and wide-ranging activities include, but are not limited to the following: site selection, reservoir characterization and creation, system demonstrations (U.S. DOE 2008). Exploratory drilling occurs as a component of some of these activities. In addition to supporting industry and research institutions, GTP works to facilitate effective inter-agency collaboration to support geothermal industry advancement. These R&D efforts provide indirect benefits to project developers by helping to reduce technology risk, which drives down the cost of capital.
13 Direct project funding is available through the Energy Trust of Oregon.
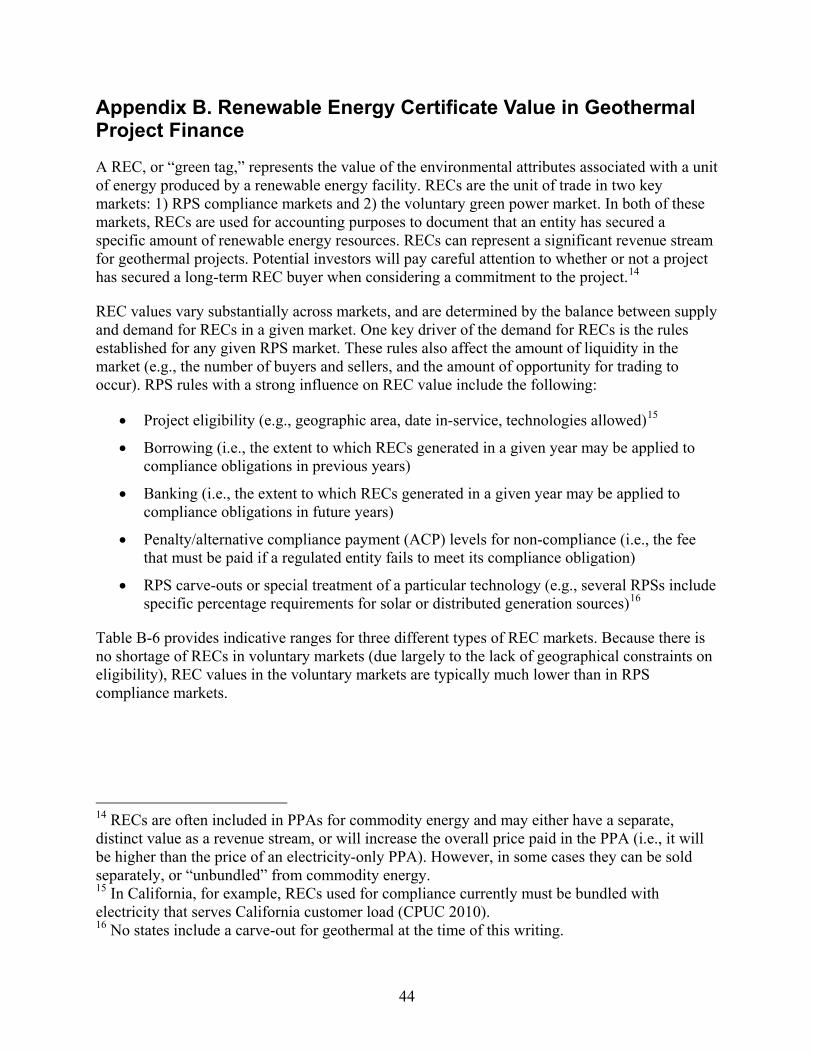
44
Appendix B. Renewable Energy Certificate Value in Geothermal Project Finance
A REC, or “green tag,” represents the value of the environmental attributes associated with a unit of energy produced by a renewable energy facility. RECs are the unit of trade in two key markets: 1) RPS compliance markets and 2) the voluntary green power market. In both of these markets, RECs are used for accounting purposes to document that an entity has secured a specific amount of renewable energy resources. RECs can represent a significant revenue stream for geothermal projects. Potential investors will pay careful attention to whether or not a project has secured a long-term REC buyer when considering a commitment to the project.14
REC values vary substantially across markets, and are determined by the balance between supply and demand for RECs in a given market. One key driver of the demand for RECs is the rules established for any given RPS market. These rules also affect the amount of liquidity in the market (e.g., the number of buyers and sellers, and the amount of opportunity for trading to occur). RPS rules with a strong influence on REC value include the following:
• Project eligibility (e.g., geographic area, date in-service, technologies allowed)15
• Borrowing (i.e., the extent to which RECs generated in a given year may be applied to compliance obligations in previous years)
• Banking (i.e., the extent to which RECs generated in a given year may be applied to compliance obligations in future years)
• Penalty/alternative compliance payment (ACP) levels for non-compliance (i.e., the fee that must be paid if a regulated entity fails to meet its compliance obligation)
• RPS carve-outs or special treatment of a particular technology (e.g., several RPSs include specific percentage requirements for solar or distributed generation sources)16
Table B-6
provides indicative ranges for three different types of REC markets. Because there is no shortage of RECs in voluntary markets (due largely to the lack of geographical constraints on eligibility), REC values in the voluntary markets are typically much lower than in RPS compliance markets.
14 RECs are often included in PPAs for commodity energy and may either have a separate, distinct value as a revenue stream, or will increase the overall price paid in the PPA (i.e., it will be higher than the price of an electricity-only PPA). However, in some cases they can be sold separately, or “unbundled” from commodity energy. 15 In California, for example, RECs used for compliance currently must be bundled with electricity that serves California customer load (CPUC 2010). 16 No states include a carve-out for geothermal at the time of this writing.
45
Table B-6. REC Pricing Across Markets 17
REC Market
REC Pricing
Voluntary $1-10/MWh
RPS $3-60/MWh
RPS Shortage $48-56/MWh (or $25-65/MWh based on ACP levels – applicable in DE, MA)
Note: Pricing data for the RPS and RPS shortage markets is becoming more difficult to obtain. The ranges are intended to demonstrate the variability across states’ markets due to differences in policy provisions rather than serve as precise pricing data
Sources: Evolution Markets (2010), Wiser and Barbose 2008, DSIRE 2010(e), DSIRE 2010(f)
These policy provisions combine with market forces to determine the ultimate REC price. Figure B-1 summarizes the policy provisions and the market forces that significantly impact REC prices in any given market. The inner ring summarizes the components of an RPS that can affect the supply or demand for RECs in a given market. The outer ring captures the market forces, those outside of RPS mandates, that affect the finances (i.e., costs and revenues) of a project.
17 Values exclude solar RECs in markets with solar carve-outs in their RPSs. Values are based on a combination of historic REC price ranges reported in Wiser and Barbose 2008, along with market prices presented in Evolution Markets’ February 2010 Monthly REC market report. Evolution Markets’ reporting is based on data from transactions by that REC brokerage, one of the largest in the United States. Shortage prices are based on alternative compliance payment levels that exist in some RPS markets, as well as the highest REC prices reported by Evolution Markets.

46
Figure B-1. Policy provisions and market forces that shape REC prices
Source: Navigant 2010
REC PRICES
Market Forces
Policy Provisions Compliance Targets Bundling Requirements Delivery Requirements (e.g.,
in-state or in-service territory) Banking Borrowing Penalty / ACP Technology Carve-Outs
Development Costs
Supply-Demand Balance for RECs
Robustness of Resource
Capital Structure
Monetization of Tax Benefits
REC Prices
REC Prices
Cost of Capital
GHG Market
Energy Prices
47
RECs may help acceptable returns for renewable energy projects. The revenue that can be generated from RECs serves as an additional revenue source, in addition to energy sales revenue and monetized tax benefits. Together, these revenue streams must achieve a desireable rate of return on the costs incurred throughout the life of the project, from resource exploration through operation and maintenance. In some cases, long-term contracts for the sale of RECs are a piece of the financial equation; in order to consider the REC revenue as a reliable source of revenue, the contracts must be signed with a creditworthy counterparty.
The threshold level of return on investment (ROI) is established by the investors in a project.18
RECs are considered the premium that a project may or may not need to receive in order for it to meet the target ROI. At a fundamental level, investors evaluate the other revenues and expenses that make up a project’s economics to determine the premium necessary to achieve the ROI. RECs are the last piece of the financial package for renewable energy.
Each investor will establish a ROI commensurate with the risk it assumes through its capital contribution and through the anticipated repayment. These rates of return are then weighted according to the share of overall capital contributed by each investor respectively. This overall ROI is then set as the minimum return that will be accepted in order for the project to move forward.
Figure B-2 presents a theoretical example of how REC revenue streams can help determine the success of a theoretical renewable energy project. Revenue from energy sales and the monetized tax benefits would not be sufficient to achieve sufficient returns in this example. In this example, the REC revenue provides additional revenue, enabling the project owners to receive an adequate return on their investment. These values are provided for illustrative purposes only.
18 The discussion of the role of RECs in a specific project’s financial returns is extracted from Summit Blue Consulting 2009. Additional details on the factors driving the supply and demand of RECs can be found in that report.
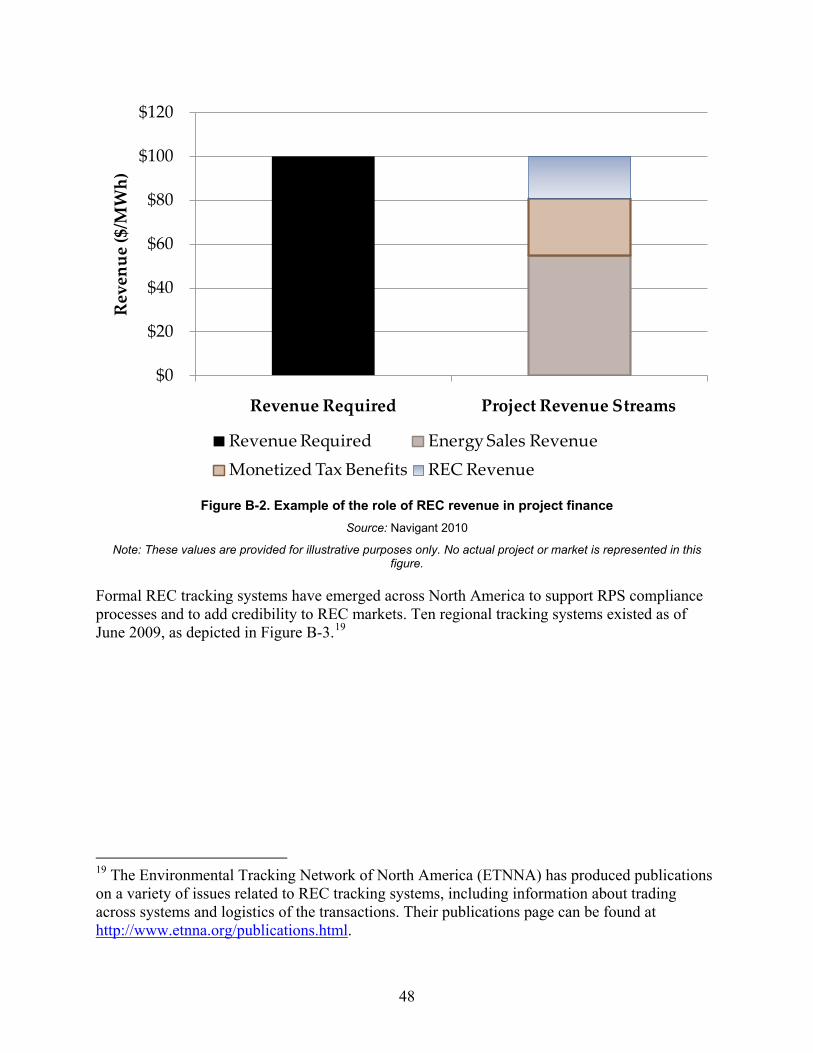
48
Figure B-2. Example of the role of REC revenue in project finance
Source: Navigant 2010
Note: These values are provided for illustrative purposes only. No actual project or market is represented in this figure.
Formal REC tracking systems have emerged across North America to support RPS compliance processes and to add credibility to REC markets. Ten regional tracking systems existed as of June 2009, as depicted in Figure B-3.19
19 The Environmental Tracking Network of North America (ETNNA) has produced publications on a variety of issues related to REC tracking systems, including information about trading across systems and logistics of the transactions. Their publications page can be found at
http://www.etnna.org/publications.html.
$0
$20
$40
$60
$80
$100
$120
Revenue Required Project Revenue Streams
Rev
enue
($/M
Wh)
Revenue Required Energy Sales RevenueMonetized Tax Benefits REC Revenue
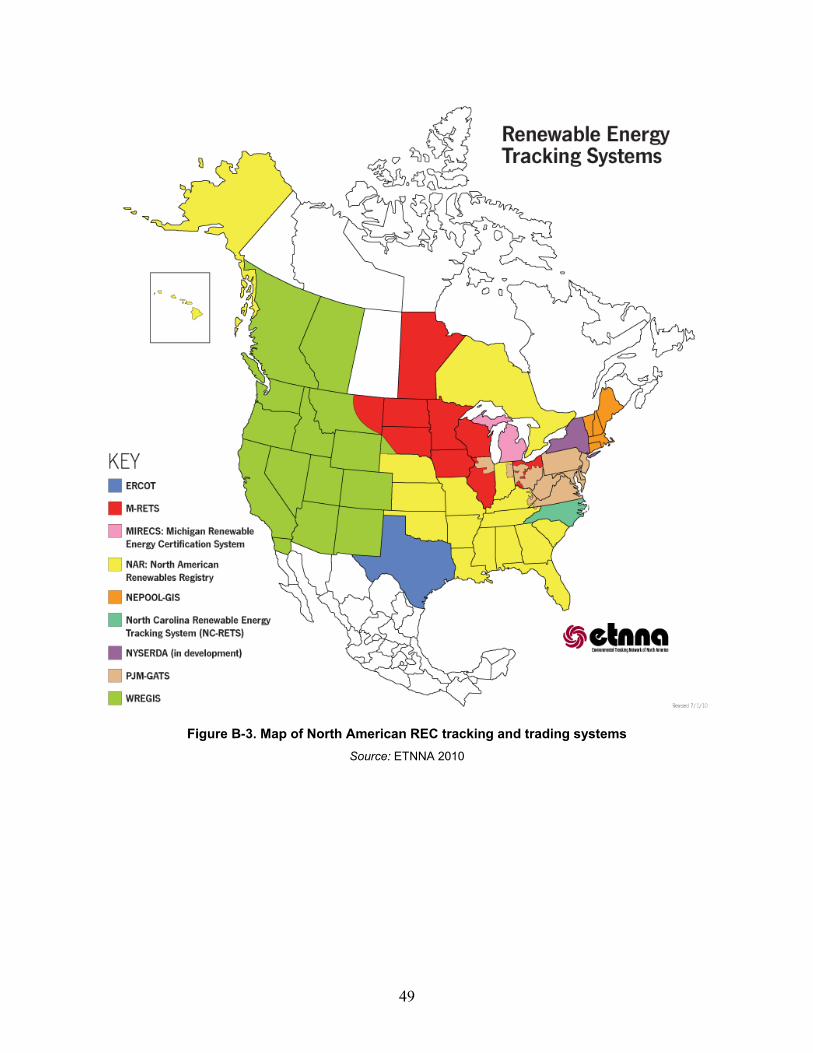
49
Figure B-3. Map of North American REC tracking and trading systems
Source: ETNNA 2010
50
Appendix C. Greenhouse Gas Policy
This appendix provides a brief overview of key state, regional, and federal GHG policy activity, as well as a discussion of the implications of GHG regulations for geothermal and other renewable energy generators.
Current Status of GHG Regulation This section provides a brief overview of the status of GHG regulation in four areas: California, the Western Climate Initiative (WCI), other regions of the United States, and the federal level.
California California has been a leader in climate change policy in the United States. The goals and principles underlying this leadership are set forth in an Executive Order signed in 2005 (Executive Order S-3-05) and Assembly Bill 32 (AB32) signed into law in 2006. The state is pursuing an overarching goal of reducing the state’s emissions to 1990 levels by 2020, and to 80% below 1990 levels by 2050.
California’s Air Resources Board (CARB) is the lead implementer of AB32 and is tasked with establishing a plan for achieving the GHG reduction goals cost-effectively. In 2008, CARB approved a scoping plan for implementing AB32. The plan calls for introducing a cap-and-trade system starting in 2012 that would cover about 85% of all GHG sources in the state, including electricity generation.
Preliminary draft regulations for the cap-and-trade program were released for comment in November 2009 (CARB 2009). Based on these draft regulations, electricity generators would be required to register and report compliance data to the state starting in the first compliance period in 2012. The draft regulations establish a declining cap on the amount of allowances that will be issued over time. The way in which the value of allocations will be distributed across entities covered under the regulations has yet to be determined, though some combination of auctions and free allocations will be used. CARB intends to reward entities for early action to the extent possible and is still considering options for allocating proceeds of allowance auctions. Those proceeds may be used to support additional renewable energy generation. Final regulations must be promulgated by 2011.
WCI The WCI was established in 2007 in an effort to facilitate a coordinated approach to GHG emissions reductions among Western states. The regional effort built on existing state-level efforts underway in California and other states. The seven states and four Canadian provinces currently participating in WCI are Arizona, British Columbia, California, Manitoba, Montana, New Mexico, Ontario, Oregon, Quebec, Utah, and Washington. WCI’s target is to reduce regional GHG emissions by 15% below 2005 levels by 2020; as of this writing, it is not a legally-binding target. A cap-and-trade program is the primary tool WCI plans to use to achieve this target. The proposed program design assigns a penalty for any regulated entity that fails to meet its compliance target; the non-compliant entities will be required to obtain and surrender three allowances for every ton of carbon dioxide equivalent that was not covered by an allowance at the compliance deadline (WCI 2008).
51
WCI released a recommended cap-and-trade program design in 2008. The program design is generally consistent with the design that is taking shape in California. Electric generators and other major industrial sources of emissions are required to comply starting in 2012, the beginning of the first three-year compliance period. The types of entities required to comply expands during the second compliance period, which starts in 2015. The recommended program design is expected to cover nearly 90% of GHG emissions in partner states and provinces.
The WCI cap-and-trade program is intended to complement rules in place in any of the partner jurisdictions. Each jurisdiction will be given an allowance budget, and the jurisdiction will determine how to allocate the value of those allowances. Such allocation specifications may include the share of allowances to be auctioned in each year and the distribution of free allowances (WCI 2009).
Other Regional Initiatives Other major GHG initiatives in the United States and Canada exist in states and provinces with resources that are not ideal for conventional hydrothermal development. The Regional Greenhouse Gas Initiative (RGGI) and the Midwest Greenhouse Gas Reduction Accord (MGGRA) are the two most prominent efforts.
RGGI is the first mandatory cap-and-trade program in the United States. RGGI partners include 10 participating states in the Northeast and Mid-Atlantic (Connecticut, Delaware, Maine, Maryland, Massachusetts, New Hampshire, New Jersey, New York, Rhode Island, and Vermont). When the cap-and-trade program began in 2009, these states capped their GHG emissions and set a target to reduce emissions by 10% by 2018. The majority of allowances are auctioned, and RGGI had completed eight allowance auctions as of July 2010 (RGGI 2010).
The MGGRA was signed in 2007. This collaborative effort to reduce GHG emissions in the Midwest and Canada includes seven member jurisdictions: Iowa, Illinois, Kansas, Manitoba, Michigan, Minnesota, and Wisconsin. A working group operating through the Midwest Governors’ Association is designing a cap-and-trade system for use by MGGRA members; as of this writing, it is not a legally binding system. An initial straw version of the program rules released in May 2009 called for a 20% reduction below 2005 levels by 2020 (MGGRA 2009).
Federal Legislation The House passed ACES in June 2009, which included an economy-wide cap-and-trade program. A variety of bills that build on provisions of ACES are under consideration in the Senate (Pew Center 2010(a)). Six different Senate committees have jurisdiction over climate legislation, making timing and coordination issues complex.
As of June 2010, two bills have been passed by Senate committees. The American Clean Energy Leadership Act of 2009 (S.1462), sponsored by Jeff Bingaman (D-NM), was passed in June 2009 by the Senate Energy and Natural Resources Committee. The Clean Energy Jobs and American Power Act of 2009 (S.1733), sponsored by Barbara Boxer (D-CA) and John Kerry (D-MA), was passed by the Senate Environment and Public Works Committee in November 2009. S.1462 addresses a host of clean energy issues, while S.1733 focuses more specifically on GHG reductions. Senators Kerry (D-MA), Graham (R-SC), and Lieberman (I-CT) have worked outside the committee process to draft a Framework for Climate Action and Energy
52
Independence in the U.S. Senate in December 2009. The Framework outlines principles for developing comprehensive GHG policy.
State and regional GHG cap-and-trade programs would either link with or transition to a national system if and when comprehensive federal GHG regulations are in place.
What GHG Regulations May Mean for Renewable Energy The implications of GHG regulations for renewable energy and geothermal resources specifically depend on the details of the regulations. Key design principles include the level of the cap (e.g., how dramatic a reduction in emissions is sought) and the approach to allocating allowances (e.g., the balance between auctions and free allocations). In principle, the types of effects of a cap-and-trade program on renewable energy should remain the same regardless of the details. The magnitude of the effects, however, will vary depending on design details.
In general, GHG regulations are anticipated to increase conventional energy prices. Many power plants will need to secure allowances to comply with cap-and-trade regulations. It is possible that the generators will pass along these cost increases to consumers. Consumers may be buffered from the cost impacts felt by the generators by various allowance allocation design strategies.20
Many cap-and-trade programs also include provisions that allocate allowances and/or proceeds from allowance auctions to fund programs that support renewable energy and energy efficiency. Some federal climate legislation is also coupled with other clean energy policies that would support geothermal development. For example, the ACES bill passed in the House would include a national RPS.
The market for RECs (used for compliance with RPSs) and the market for GHG compliance units (both allowances and offsets used for compliance with GHG regulations) are separate and distinct. A geothermal generator operating in a state with both an RPS and a GHG cap-and-trade program would sell RECs to load-serving entities responsible for complying with the RPS, and the generator itself would be responsible for surrendering enough allowances to cover GHG emissions generated by the facility (if any). Any additional allowances owned by the generator could be sold.
There is some potential overlap between REC and GHG markets for generators that wish to sell RECs into voluntary GHG offset markets.21
20 For example, the House’s ACES bill stipulates that over 20% of allowances would initially be allocated to local electric and gas distribution companies, and that the value of these allowances would need to be passed along to consumers (Pew Center on Climate 2010).
In general, RECs are considered to include all environmental attributes, including GHG attributes associated with a unit of energy. However, some RECs would fail the “additionality” test needed to secure certification as a high-quality offset. That is, the generator would be unable to demonstrate that the RECs sold are in addition to what would have been produced in the absence of a REC market.
21 Additional details on the potential for overlap between GHG and REC markets can be found in Bird et al. 2007.
53
Appendix D. Additional Resources
Many resources are available to supplement the information in this report. A listing of some of the most relevant resources follows in alphabetical order.
Database of State Incentives for Renewables and Efficiency (DSIRE): http://www.dsireusa.org/.
Geothermal Energy Association: http://www.geo-energy.org/.
Investopedia ULC: http://www.investopedia.com/.
Lawrence Berkeley National Laboratory, Electricity Market and Policy Program: http://eetd.lbl.gov/ea/emp/re-pubs.html.
Midwest Regional Greenhouse Gas Reduction Accord Advisory Group. (2009). Executive Committee Straw Proposal. http://www.midwesternaccord.org/Meeting%20material%20pages/GHG-meeting-10_509.html.
National Renewable Energy Laboratory. Geothermal Policymakers’ Guidebooks: http://www.nrel.gov/geothermal/guidebooks/.
National Renewable Energy Laboratory, Strategic Energy Analysis Center: http://www.nrel.gov/analysis/.
Pew Center on Global Climate Change: http://www.pewclimate.org/.
ThinkGeoEnergy Blog: http://thinkgeoenergy.com/.
U.S. Department of Energy, Office of Energy Efficiency and Renewable Energy, Geothermal Technologies Program: http://www1.eere.energy.gov/geothermal/.
U.S. Treasury Department, Office of the Fiscal Assistant Secretary. (2010) Payments for Specified Energy Property in Lieu of Tax Credits under the American Recovery and Reinvestment Act of 2009: http://www.treas.gov/recovery/docs/guidance.pdf .
Western Climate Initiative (WCI): http://www.westernclimateinitiative.org/documents.
Western Governors' Association: http://www.westgov.org/.
Western Renewable Energy Generation Information System (WREGIS): http://www.wregis.org/.
Western Renewable Energy Zones (WREZ) Transmission: http://www.westgov.org/index.php?option=com_content&view=article&catid=102:initiatives&id=220:wrez-transmission-model-page&Itemid=81.
In addition, a set of guidebooks to help project developers navigate the permitting process is under development through funding from the U.S. DOE. Check NREL’s Geothermal Web site for the posting when it becomes available: http://www.nrel.gov/geothermal/.
F1146-E(10/2008)
REPORT DOCUMENTATION PAGE Form Approved OMB No. 0704-0188
The public reporting burden for this collection of information is estimated to average 1 hour per response, including the time for reviewing instructions, searching existing data sources, gathering and maintaining the data needed, and completing and reviewing the collection of information. Send comments regarding this burden estimate or any other aspect of this collection of information, including suggestions for reducing the burden, to Department of Defense, Executive Services and Communications Directorate (0704-0188). Respondents should be aware that notwithstanding any other provision of law, no person shall be subject to any penalty for failing to comply with a collection of information if it does not display a currently valid OMB control number. PLEASE DO NOT RETURN YOUR FORM TO THE ABOVE ORGANIZATION. 1. REPORT DATE (DD-MM-YYYY)
March 2011 2. REPORT TYPE
Subcontract Report 3. DATES COVERED (From - To)
February 17, 2010 – March 15, 2011 4. TITLE AND SUBTITLE
Guidebook to Geothermal Power Finance 5a. CONTRACT NUMBER
DE-AC36-08GO28308
5b. GRANT NUMBER
5c. PROGRAM ELEMENT NUMBER
6. AUTHOR(S) Jane Pater Salmon, Julianne Meurice, Nicole Wobus, Frank Stern, Maria Duaime
5d. PROJECT NUMBER NREL/SR-6A20-49391
5e. TASK NUMBER GT08.300R
5f. WORK UNIT NUMBER
7. PERFORMING ORGANIZATION NAME(S) AND ADDRESS(ES) Navigant Consulting 1722 14th St. Suite 230 Boulder, CO 80302
8. PERFORMING ORGANIZATION REPORT NUMBER LGJ-0-40242-01
9. SPONSORING/MONITORING AGENCY NAME(S) AND ADDRESS(ES) National Renewable Energy Laboratory 1617 Cole Blvd. Golden, CO 80401-3393
10. SPONSOR/MONITOR'S ACRONYM(S) NREL
11. SPONSORING/MONITORING AGENCY REPORT NUMBER NREL/SR-6A20-49391
12. DISTRIBUTION AVAILABILITY STATEMENT National Technical Information Service U.S. Department of Commerce 5285 Port Royal Road Springfield, VA 22161
13. SUPPLEMENTARY NOTES NREL Technical Monitor: Paul Schwabe
14. ABSTRACT (Maximum 200 Words) This guidebook is intended to facilitate further investment in conventional geothermal projects in the United States. It includes a brief primer on geothermal technology and the most relevant policies related to geothermal project development. The trends in geothermal project finance are the focus of this tool, relying heavily on interviews with leaders in the field of geothermal project finance. Using the information provided, developers and investors may innovate in new ways, developing partnerships that match investors’ risk tolerance with the capital requirements of geothermal projects in this dynamic and evolving marketplace.
15. SUBJECT TERMS geothermal; geothermal electricity generation; investing; developers; policy
16. SECURITY CLASSIFICATION OF: 17. LIMITATION OF ABSTRACT
UL
18. NUMBER OF PAGES
19a. NAME OF RESPONSIBLE PERSON a. REPORT
Unclassified b. ABSTRACT Unclassified
c. THIS PAGE Unclassified 19b. TELEPHONE NUMBER (Include area code)
Standard Form 298 (Rev. 8/98) Prescribed by ANSI Std. Z39.18