Guide to MACRO STRATEGY FUND (MCRAX)/media/Mutual Funds/Macro...› In 1994, launched Denali to...
16
GUIDE TO MACRO STRATEGY FUND (MCRAX)
Transcript of Guide to MACRO STRATEGY FUND (MCRAX)/media/Mutual Funds/Macro...› In 1994, launched Denali to...
Guide to MACRO STRATEGY FUND (MCRAX)

2 888.524.9441 | altegris.com/mutualfunds
Not all global macro managers trade across all asset classes. See definitions of long and short on page 11. There is no guarantee that any investment product will achieve its objectives, generate profits or avoid losses. The success of an investment is dependent upon the ability of a global macro manager to identify profitable investment opportunities and successfully trade. The identification of attractive trading opportunities is difficult, requires skill, and involves a significant degree of uncertainty. The high degree of leverage often obtainable in commodity trading can work against you as well as for you, and can lead to large losses as well as gains. Managers may trade highly illiquid markets, or on foreign markets, and may not be able to close or offset positions immediately upon request. You can lose all or a substantial amount of your investment. Global macro and commodities accounts may be subject to substantial charges for management and advisory fees. PAST PERFORMANCE IS NOT INDICATIVE OF FUTURE RESULTS.
Global macro is an opportunistic, predominantly discretionary, strategy that seeks to predict price movement, using fundamental macroeconomic data to make buy and sell decisions. The typically flexible nature of global macro strategies gives managers the opportunity to potentially profit from both positive and negative developments across multiple markets simultaneously.
Long or Short PositionsThe ability to go long or short gives managers the opportunity to potentially profit from both positive and negative developments
Multiple Asset ClassesGlobal macro managers have the ability to gain exposure to four major asset classes: stocks, bonds, currencies, commodities
Global MarketsGlobal macro managers utilize a top-down approach that analyzes fundamental macroeconomic data to predict price movements across multiple global markets
About Global Macro
TrusTed AlTernATives. inTelligenT invesTing.® 3
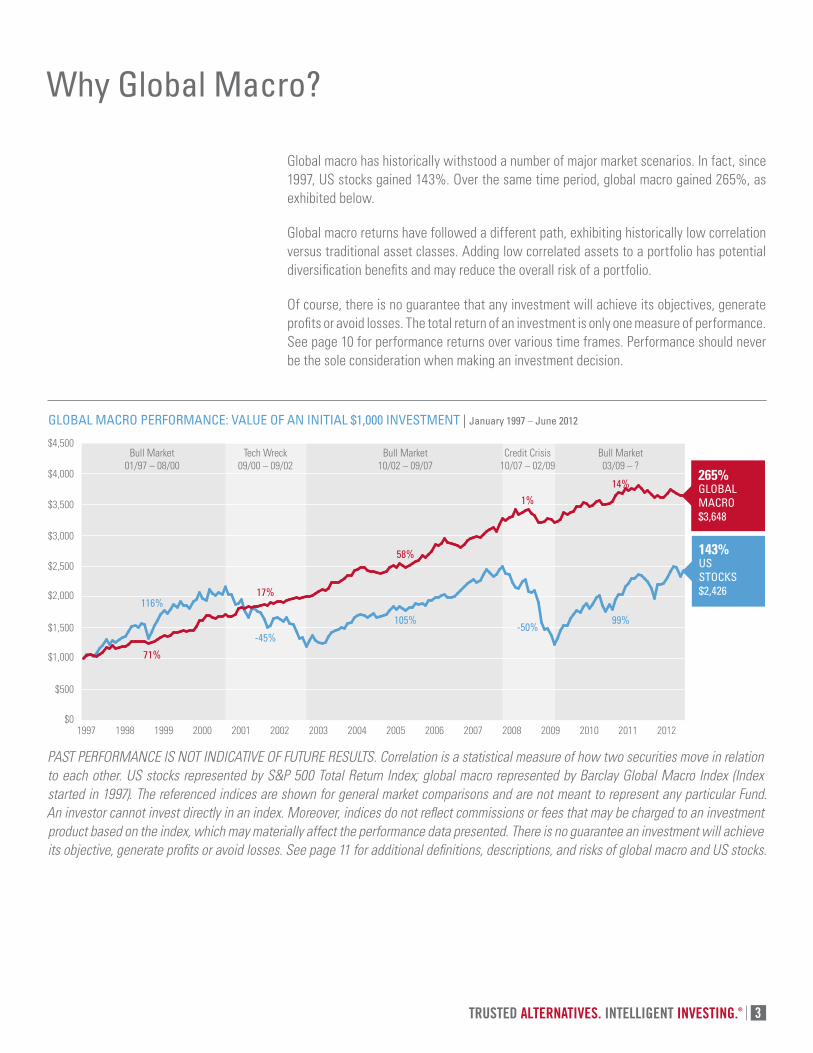
GLobAL MACro PerforMAnCe: VALue of An InItIAL $1,000 InVeStMent | January 1997 – June 2012
Why Global Macro?
Global macro has historically withstood a number of major market scenarios. In fact, since 1997, US stocks gained 143%. Over the same time period, global macro gained 265%, as exhibited below.
Global macro returns have followed a different path, exhibiting historically low correlation versus traditional asset classes. Adding low correlated assets to a portfolio has potential diversification benefits and may reduce the overall risk of a portfolio.
Of course, there is no guarantee that any investment will achieve its objectives, generate profits or avoid losses. The total return of an investment is only one measure of performance. See page 10 for performance returns over various time frames. Performance should never be the sole consideration when making an investment decision.
PAST PERFORMANCE IS NOT INDICATIVE OF FUTURE RESULTS. Correlation is a statistical measure of how two securities move in relation to each other. US stocks represented by S&P 500 Total Return Index; global macro represented by Barclay Global Macro Index (Index started in 1997). The referenced indices are shown for general market comparisons and are not meant to represent any particular Fund. An investor cannot invest directly in an index. Moreover, indices do not reflect commissions or fees that may be charged to an investment product based on the index, which may materially affect the performance data presented. There is no guarantee an investment will achieve its objective, generate profits or avoid losses. See page 11 for additional definitions, descriptions, and risks of global macro and US stocks.
GLOBALMACRO$3,648
265%
$0
$500
$1,000
$1,500
$2,000
$2,500
$3,000
$3,500
$4,000
$4,500
2001 2002 2003 2004 20062005 2007 2008 2009 2010 2011
Credit Crisis10/07 – 02/09
Bull Market10/02 – 09/07
Tech Wreck09/00 – 09/02
Bull Market03/09 – ?
-50%105% 99%
1%
58%
17%
14%
1997 1998 1999 2000
71%
Bull Market01/97 – 08/00
116%
-45%
USSTOCKS$2,426
143%
2012

4 888.524.9441 | altegris.com/mutualfunds
PotentIAL fund benefItS
› Active management
› Daily liquidity
› Low minimum investment
› No investor qualifications
› Potential diversification
› Transparency
› 1099 tax reporting
› Individual and institutional share classes available
Altegris Macro Strategy fund
The Altegris Macro Strategy Fund (MCRAX) seeks to achieve absolute returns from income and capital appreciation, regardless of the direction of the securities market.
To achieve its objectives, the Fund utilizes two principal strategies — global macro and fixed income.†
Global Macro | designed to achieve capital appreciation in the financial and commodities futures markets
› Utilizes investment adviser asset allocation and investment skill to allocate among global macro strategies with a bias toward foreign exchange.
› Diversifies investments among strategies and asset classes that are not expected to have returns that are highly correlated to each other or the broad equity market.
fixed Income | designed to generate interest income and capital appreciation with the objective to diversify returns under the global macro strategies
› Securities rated, at the time of purchase, in the top four categories by a rating agency such as Moody’s Investors Service, Inc. or Standard & Poor’s Ratings Group, or if unrated determined to be of comparable quality.
› Will maintain an average maturity that ranges between short term (less than 1 year) and intermediate term (4-7 years).
†The Fund may invest up to 25% of its total assets in a wholly-owned subsidiary, which will invest in underlying global macro securities. The remainder is invested in fixed income strategies. However, the allocation ranges to each strategy may be higher or lower.
The Fund will attempt to maintain an exposure to global macro strategies as if between 100% and 125% of the Fund’s net assets were invested in those strategies. There is no guarantee that any investment product will achieve its objectives, generate profits or avoid losses. PAST PERFORMANCE IS NOT INDICATIVE OF FUTURE RESULTS. For additional information see the Prospectus.

TrusTed AlTernATives. inTelligenT invesTing.® 5
Portfolio Holdings
Investors are able to access a diverse group of global macro strategies that predominantly use fundamental macroeconomic data with a bias toward foreign exchange.
The Fund may invest up to 25% of its total assets in a wholly-owned subsidiary, which will invest in global macro securities with the aim of providing 100%* aggregate exposure to the global macro programs selected by Altegris Advisors.
For additional information about Fund allocations and exposures, see the Principal Investment Strategies section of the Prospectus.
Portfolio holdings, investment strategies, and global macro exposures are presented to illustrate examples of allocations the adviser expects the Fund to have and the diversity of areas in which the Fund may invest, and may not be representative of the Fund’s current or future holdings or exposures. Portfolio holdings and global macro exposures are subject to change and should not be construed as investment advice.
*Typical global macro strategy exposure will be 100%, up to a maximum of 125%.
100%*Global Macro
Manager Exposure
~75%Fixed Income(J.P. Morgan InvestmentManagement, Inc.)
~25% GlobalMacro
35%Denali
Fund Allocation
25%Krom River
25%Ortus
15%P/E
As of 30 June 2012

6 888.524.9441 | altegris.com/mutualfunds
*As of March 2012. The Fund currently pursues its global macro strategy through investments in securities that access returns of the global macro managers described above.
The Altegris Macro Strategy Fund provides access to what we believe are premier global macro investment managers in an actively managed mutual fund.
denali Asset Management › Founded in 1994, currently manages over $1.0 billion in assets*
› Discretionary global macro trading strategy
› Trades primarily financial futures, foreign exchange and commodity futures
› Active, short-term management of positions utilizing fundamentals and technicals
› Relies upon the extensive experience and insights of trading team to develop fundamental themes or biases
Scott ramsey, founder, Chief executive officer and Portfolio Manager › 30+ years of experience trading the financial and commodity futures markets
› Started career at the Chicago Mercantile Exchange and was a member of the International Monetary Markets Division
› Studied mechanical engineering at the University of Missouri
› In 1994, launched Denali to manage money for external investors
Krom river Investment Management › Founded in 2006, currently manages $890 million in assets*
› 100% discretionary commodity trading strategy that combines fundamental and technical analysis
› Hedge Funds Review European Performance Awards winner of Best Commodity or Energy Fund (2011) and Best Commodity Fund (2009) and 2008 EuroHedge Awards winner of Best Commodity Fund
› Amber Partners Operational Certification (2011) representing a commitment to operational best practices and Hedge Fund Standards Board Signatory (2010)
Christopher brodie, founder and Portfolio Manager › 23+ years of experience in commodity markets
› Co-founder of the Armajaro Commodity Fund
› In 2006, founded Krom River
Global Macro Managers
TrusTed AlTernATives. inTelligenT invesTing.® 7
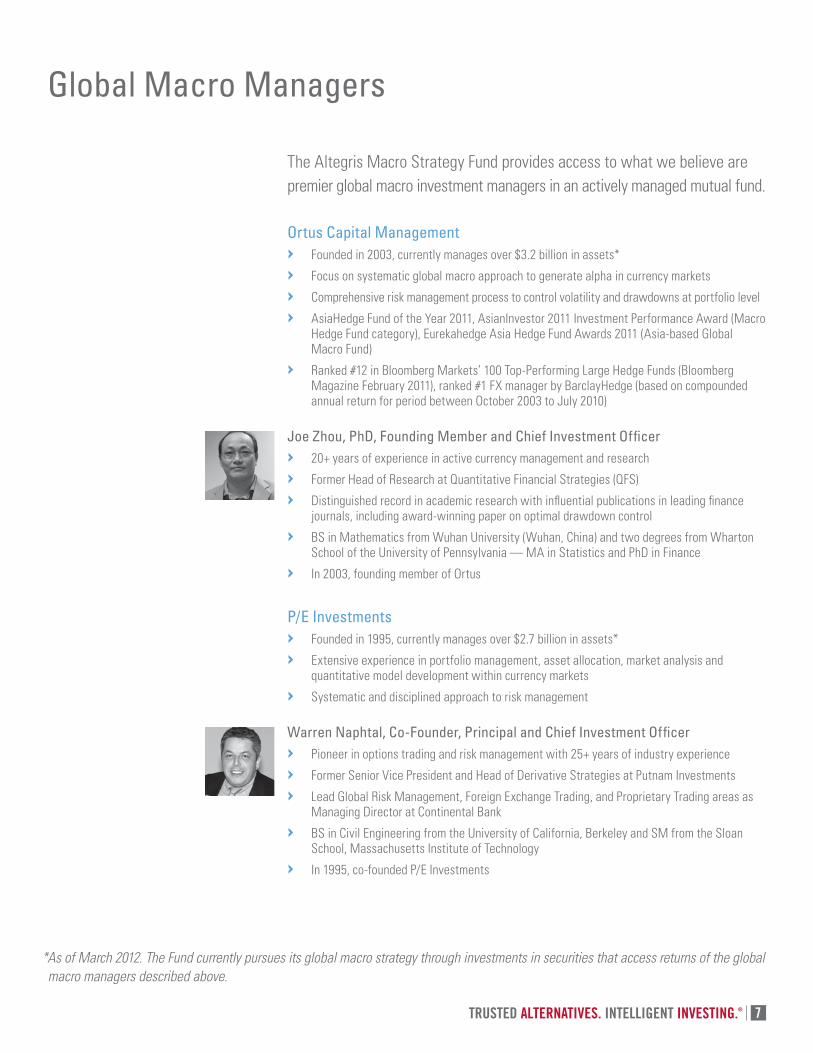
*As of March 2012. The Fund currently pursues its global macro strategy through investments in securities that access returns of the global macro managers described above.
The Altegris Macro Strategy Fund provides access to what we believe are premier global macro investment managers in an actively managed mutual fund.
ortus Capital Management › Founded in 2003, currently manages over $3.2 billion in assets*
› Focus on systematic global macro approach to generate alpha in currency markets
› Comprehensive risk management process to control volatility and drawdowns at portfolio level
› AsiaHedge Fund of the Year 2011, AsianInvestor 2011 Investment Performance Award (Macro Hedge Fund category), Eurekahedge Asia Hedge Fund Awards 2011 (Asia-based Global Macro Fund)
› Ranked #12 in Bloomberg Markets’ 100 Top-Performing Large Hedge Funds (Bloomberg Magazine February 2011), ranked #1 FX manager by BarclayHedge (based on compounded annual return for period between October 2003 to July 2010)
Joe Zhou, Phd, founding Member and Chief Investment officer › 20+ years of experience in active currency management and research
› Former Head of Research at Quantitative Financial Strategies (QFS)
› Distinguished record in academic research with influential publications in leading finance journals, including award-winning paper on optimal drawdown control
› BS in Mathematics from Wuhan University (Wuhan, China) and two degrees from Wharton School of the University of Pennsylvania — MA in Statistics and PhD in Finance
› In 2003, founding member of Ortus
P/e Investments › Founded in 1995, currently manages over $2.7 billion in assets*
› Extensive experience in portfolio management, asset allocation, market analysis and quantitative model development within currency markets
› Systematic and disciplined approach to risk management
Warren naphtal, Co-founder, Principal and Chief Investment officer › Pioneer in options trading and risk management with 25+ years of industry experience
› Former Senior Vice President and Head of Derivative Strategies at Putnam Investments
› Lead Global Risk Management, Foreign Exchange Trading, and Proprietary Trading areas as Managing Director at Continental Bank
› BS in Civil Engineering from the University of California, Berkeley and SM from the Sloan School, Massachusetts Institute of Technology
› In 1995, co-founded P/E Investments
Global Macro Managers

8 888.524.9441 | altegris.com/mutualfunds
*The inception date of Class A, Class N and Class I is 06/01/11; the inception date of Class C is 10/20/11. PAST PERFORMANCE IS NOT NECESSARILY INDICATIVE OF FUTURE RESULTS. Returns for periods longer than one year are annualized.
**The maximum sales charge (load) for class A is 5.75%. Class A Share investors may be eligible for a reduction in sales charges. See prospectus for more information. The Fund’s adviser has contractually agreed to reduce fees and absorb expenses of the Fund until at least October 31, 2012. This agreement may be terminated by the Fund’s Board of Trustees on 60 days written notice to the adviser.
The performance data quoted here represents past performance. Current performance may be lower or higher than the performance data quoted above. Past performance is no guarantee of future results. The investment return and principal value of an investment will fluctuate so that investor’s shares, when redeemed, may be worth more or less than their original cost. Past performance is no guarantee of future results. The Fund’s investment adviser has contractually agreed to reduce its fees and/or absorb expenses of the Fund, at least until October 31, 2012, to ensure that the net annual fund operating expenses will not exceed 1.95% for Class A, 2.70% for Class C, 1.70% for Class I, and 1.95% for Class N. Without these waivers, the Fund’s total annual operating expenses would be 1.99% for Class A, 2.74% for Class C, 1.74% for Class I, and 1.99% for Class N, subject to possible recoupment from the Fund in future years. Please review the Fund’s Prospectus for more detail on the expense waiver. Results shown reflect the waiver, without which the results could have been lower. A Fund’s performance, especially for very short periods of time, should not be the sole factor in making your investment decisions. For performance information current to the most recent month-end, please call toll-free (888) 524-9441.
Altegris Macro Strategy fund facts
fund PerforMAnCe returnS | As of 30 June 2012
Quarter to Date
Year to Date
Since Inception*1-Year
MCRAX: Class A (NAV) -0.11% -3.54% -3.05% -4.17%
MCRAX: Class A (max load)* -5.82% -9.05% -8.61% -9.27%
MCRNX: Class N (NAV) -0.11% -3.64% -3.15% -4.26%
MCRIX: Class I (NAV) -0.10% -3.53% -2.84% -3.98%
BofA Merrill Lynch 3 Month T-Bill Index 0.02% 0.04% 0.05% 0.06%
10/20/11-06/30/12
MCRCX: Class C (NAV) -0.21% -3.84% NA -4.42%

TrusTed AlTernATives. inTelligenT invesTing.® 9
obJeCtIVeThe fund seeks to achieve absolute returns from income and capital appreciation, regardless of the direction of the securities market.+
fund AdVISerAltegris Advisors, LLC
fund Sub-AdVISerJ.P. Morgan Investment Management Inc.
SYMboL & CuSIPClass A: MCRAX-66537Y306Class N: MCRNX-66537Y603Class C: MCRCX-66537Y405Class I: MCRIX-66537Y504
MInIMuM InItIAL/SubSeQuent InVeStMentClass A: $2,500 / $250Class N: $2,500 / $250Class C: $5,000 / $250Class I: $1,000,000 / $250
redeMPtIon fee1% fee on shares redeemed within 30 days
InCePtIon dAteClass A, Class N, Class I: June 1, 2011Class C: October 20, 2011
InCoMe dIStrIbutIonAnnual
fund tYPeAlternative Investment Fund
+Based upon the analysis of long-term historical returns and volatility of various asset classes, the Fund will allocate approximately twenty five percent of its assets to the global macro strategy and approximately seventy five percent of its assets to the fixed income strategy. However, to stay flexible and to respond to various changes in market conditions, the allocation ranges to each strategy may be higher or lower.
AnnuAL fund oPerAtInG eXPenSeS
Class A* Class N Class C Class I
Management Fees 1.50% 1.50% 1.50% 1.50%
Distribution and/or Service (12b-1) Fees 0.25% 0.25% 1.00% 0.00%
Other Expenses(1) 0.24% 0.24% 0.24% 0.24%
Total Annual fund Operating Expenses 1.99% 1.99% 2.74% 1.74%
Fee Waiver and/or Reimbursement(2) -0.04% -0.04% -0.04% -0.04%
Total Annual Fund Operating Expenses After Fee Waiver and/or Reimbursement
1.95% 1.95% 2.70% 1.70%
Altegris Macro Strategy fund facts
*The maximum sales charge (load) for class A is 5.75%. Class A Share investors may be eligible for a reduction in sales charges. PAST PERFORMANCE IS NOT NECESSARILY INDICATIVE OF FUTURE RESULTS.
(1) Based on estimated amounts for the current fiscal year. The other expenses estimate does not include the cost of investing in underlying pools, like commodity pools, that are not investment companies. The Fund estimates that underlying pool expenses, if presented, would be 1.32%. This estimate does not include performance based fees, which cannot be meaningfully estimated, paid by underlying pools which range from 20% to 30% of an underlying pool’s profits.
(2) The Fund’s adviser has contractually agreed to reduce its fees and to reimburse expenses, at least until October 31, 2012, to ensure that total annual Fund operating expenses after fee waiver and/or reimbursement (exclusive of any taxes, interest, brokerage commissions, expenses incurred in connection with any merger or reorganization, indirect expenses, expenses of other investment companies in which the Fund may invest, or extraordinary expenses such as litigation) will not exceed 1.95%, 2.70%, 1.70% and 1.95% of average daily net assets attributable to Class A, Class C, Class I and Class N shares, respectively. These fee waivers and expense reimbursements are subject to possible recoupment from the Fund in future years on a rolling three year basis (within the three years after the fees have been waived or reimbursed) if such recoupment can be achieved within the foregoing expense limits. This agreement may be terminated only by the Fund’s Board of Trustees, on 60 days written notice to the adviser.

10 888.524.9441 | altegris.com/mutualfunds
Index Historical Performance
AnnuALIZed returnS: 10-, 5-, 3-, And 1-YeAr CoMPArISonAs of 30 June 2012
10-Year Jul 02 – Jun 12
5-Year Jul 07 – Jun 12
3-Year Jul 09 – Jun 12
1-Year Jul 11 – Jun 12
Global Macro 6.22% 3.30% 3.06% -1.25%
US Stocks 5.33% 0.21% 16.39% 5.44%
AnnuALIZed StAndArd deVIAtIon: 10-, 5-, 3-, And 1-YeAr CoMPArISonAs of 30 June 2012
10-Year Jul 02 – Jun 12
5-Year Jul 07 – Jun 12
3-Year Jul 09 – Jun 12
1-Year Jul 11 – Jun 12
Global Macro 5.30% 5.42% 4.40% 3.87%
US Stocks 15.78% 19.05% 15.88% 17.40%
CorreLAtIon: 10-, 5-, And 3-YeAr CoMPArISonAs of 30 June 2012
PAST PERFORMANCE IS NOT INDICATIVE OF FUTURE RESULTS. Correlation is a statistical measure of how two securities move in relation to each other. Standard deviation is a statistical measure of how consistent returns are over time; a lower standard deviation indicates historically less volatility. US stocks represented by S&P 500 Total Return Index; global macro represented by Barclay Global Macro Index. The referenced indices are shown for general market comparisons and are not meant to represent any particular Fund. An investor cannot invest directly in an index. Moreover, indices do not reflect commissions or fees that may be charged to an investment product based on the index, which may materially affect the performance data presented. There is no guarantee any investment will achieve its objective, generate profits or avoid losses. The S&P 500 Total Return Index is the total return version of the S&P 500 Index, which is unmanaged and generally representative of certain portions of the U.S. equity markets. The Barclay Global Macro Index tracks approximately 175 global macro programs by monthly values, as reported to Barclay.
10-Year Jul 02 – Jun 12
5-Year Jul 07 – Jun 12
3-Year Jul 09 – Jun 12
Global Macro – US Stocks 0.44 0.50 0.73

TrusTed AlTernATives. inTelligenT invesTing.® 11
Index descriptions and Glossary
An investor cannot invest directly in an index. Moreover, indices do not reflect commissions or fees that may be charged to an investment product based on the index, which may materially affect the performance data presented.
Index definitions, Characteristics and risks
US Stocks / S&P 500 Total Return Index. The S&P 500 Total Return Index is the total return version of S&P 500 index. The S&P 500 index is unmanaged and is generally representative of certain portions of the U.S. equity markets. For the S&P 500 Total Return Index, dividends are reinvested on a daily basis and the base date for the index is January 4, 1988. All regular cash dividends are assumed reinvested in the S&P 500 index on the ex-date. Special cash dividends trigger a price adjustment in the price return index.
Characteristics: 500 US stocks; weighted towards large capitalizations Key Risks: stock market risk — stock prices may decline; country/regional risk—world events may adversely affect values
Global Macro / Barclay Global Macro Index. The Barclay Global Macro Index tracks the performance of ~175 global macro programs, be ending monthly values, net of fees, as reported to Barclay Hedge.
Characteristics: ~175 global macro programs by monthly values as reported to BarclayRisks: market risk — prices may decline; leverage risk — volatility and risk of loss may magnify with use of leverage; country/regional risk — world events may adversely affect values
BofA Merrill Lynch 3 Month T-Bill Index. The BofA Merrill Lynch 3 Month T-Bill Index is an unmanaged index that measure returns of three-month Treasury Bills.
Glossary
Correlation. A statistical measure of how two securities move in relation to each other. Correlation is computed into what is known as the correlation coefficient, which ranges between -1 and +1. Perfect positive correlation (a correlation co-efficient of +1) implies that as one security moves, either up or down, the other security will move in lockstep, in the same direction. Alternatively, perfect negative correlation means that if one security moves in either direction the security that is perfectly negatively correlated will move by an equal amount in the opposite direction. If the correlation is 0, the movements of the securities are said to have no correlation; they are completely random.
Long. Buying an asset/security that gives partial ownership to the buyer of the position. Long positions profit from an increase in price.
Short. Selling an asset/security that may have been borrowed from a third party with the intention of buying back at a later date. Short positions profit from a decline in price. If a short position increases in price, covering the short position at a higher price may result in a loss.
Standard Deviation. A statistical measure of how consistent returns are over time; a lower standard deviation indicates historically less volatility.

12 888.524.9441 | altegris.com/mutualfunds
Investors should carefully consider the investment objectives, risks, charges and expenses of the Altegris Macro Strategy Fund described herein. This and other important information about a Fund is contained in a Fund’s Prospectus, which can be obtained by calling (888) 524-9441. The Prospectus should be read carefully before investing. Funds are distributed by Northern Lights Distributors, LLC member FINRA. Altegris Advisors, J.P. Morgan Investment Management, and Northern Lights Distributors are not affiliated.
MUTUAL FUNDS INVOLVE RISK INCLUDING POSSIBLE LOSS OF PRINCIPAL.
The funds are “non-diversified” for purposes of the Investment Company Act of 1940, which means that the funds may invest in fewer securities at any one time than a diversified fund. When the funds invest in fixed income securities or derivatives, the value of your investment in the fund will fluctuate inversely with changes in interest rates. In general, the market price of debt securities with longer maturities will increase or decrease more in response to changes in interest rates than shorter-term securities. Other risk factors include credit risk and prepayment risk. These risks could affect the value of a particular investment by the fund(s) possibly causing the fund’s share price and total return to be reduced and fluctuate more than other types of investments. To respond to adverse market, economic, political or other conditions, the fund(s) may invest 100% of its total assets, without limitation, in high-quality short-term debt securities and money market instruments. The fund’s indirect and direct exposure to foreign currencies subjects the Fund to the risk that those currencies will decline in value relative to the U.S. Dollar, or, in the case of short positions, that the U.S. Dollar will decline in value relative to the currency that the fund is short. Currency rates in foreign countries may fluctuate significantly over short periods of time for a number of reasons, including changes in interest rates and the imposition of currency controls or other global political developments. In addition, the funds may incur currency conversion transaction costs.
The fund(s) will invest a percentage of its assets in derivatives, such as futures and options contracts. The use of such derivatives may expose the fund(s) to additional risks that it would not be subject to if it invested directly in the securities and commodities underlying those derivatives. The fund(s) may experience losses that exceed losses experienced by funds that do not use futures contracts and options. There may be an imperfect correlation between the changes in market value of the securities held by the fund(s) and the prices of futures and options on futures. Although futures contracts are generally liquid instruments, under certain market conditions there may not always be a liquid secondary market for a futures contract. As a result, the fund(s) may be unable to close out its futures contracts at a time which is advantageous. Trading restrictions or limitations may be imposed by an exchange, and government regulations may restrict trading in futures contracts and options. Because option premiums paid or received by the Fund are small in relation to the market value of the investments underlying the options, buying and selling put and call options can be more speculative than investing directly in securities. Over-the-counter transactions are subject to little, if any, regulation and may be subject to the risk of counterparty default. A portion of the fund’s assets may be used to trade OTC commodity interest contracts, such as forward contracts, option contracts in foreign currencies and other commodities, or swaps or spot contracts.
A substantial portion of the trades of the programs are expected to take place on markets or exchanges outside the United States. Some foreign markets present additional risk, including foreign exchange risk, because they are not subject to the same degree of regulation as their U.S. counterparts. Trading on foreign exchanges is subject to the risks presented by exchange controls, expropriation, increased tax burdens and exposure to local economic declines and political instability. An adverse development with respect to any of these variables could reduce the profit or increase the loss earned on trades in the affected international markets. The fund(s) may employ leverage and may invest in leveraged instruments. The more the fund(s) invests in leveraged instruments, the more this leverage will magnify any losses on those investments; share value will be more volatile than if leverage was not used. The fund(s) may take short positions, directly and indirectly through its Subsidiary, in derivatives. If a derivative in which the funds have short positions increases in price, the Underlying Pool may have to cover its short position at a higher price than the short sale price, resulting in a loss.
Structured notes involve leverage risk, tracking risk and issuer default risk. Taxation Risk involves investing in commodities indirectly through the fund’s subsidiary, through which the funds will obtain exposure to the commodities markets within the federal tax requirements that apply to the fund(s). However because the subsidiaries are controlled foreign corporations, any income received from such investments in Underlying Pools will be passed through to the fund(s) as ordinary income, which may be taxed at less favorable rates than capital gains. Underlying Pools in which the subsidiaries invest will retain investment managers and be subject to investment advisory and other expenses which are indirectly paid by the funds. As a result, the cost of investing in the funds may be higher than other mutual funds that invest directly in stocks and bonds. Each Underlying Pool will pay management fees, brokerage commissions, operating expenses and performance based fees to each manager it retains. Performance based fees will be paid without regard to the performance of any other managers retained or to the overall profitability of the Underlying Pool. Underlying Pools are subject to specific risks, depending on the nature of the managers they retain. There is no guarantee that any of the trading strategies used by the managers retained by an Underlying Pool will be profitable or avoid losses.
Mutual fund disclosure

TrusTed AlTernATives. inTelligenT invesTing.® 13
Alternative investments involve a high degree of risk and can be illiquid due to restrictions on transfer and lack of a secondary trading market. They can be highly leveraged, speculative and volatile, and an investor could lose all or a substantial amount of an investment. Alternative investments may lack transparency as to share price, valuation and portfolio holdings. Complex tax structures often result in delayed tax reporting. Alternative investment managers typically exercise broad investment discretion and may apply similar strategies across multiple investment vehicles, resulting in less diversification. Trading may occur outside the United States which may pose greater risks than trading on U.S. exchanges and in U.S. markets.
There are substantial risks and conflicts of interests associated with managed futures and commodities accounts, and you should only invest risk capital. The success of an investment is dependent upon the ability of a commodity trading advisor (CTA) to identify profitable investment opportunities and successfully trade. The identification of attractive trading opportunities is difficult, requires skill, and involves a significant degree of uncertainty. CTAs have total trading authority, and the use of a single CTA could mean a lack of diversification and higher risk. The high degree of leverage often obtainable in commodity trading can work against you as well as for you, and can lead to large losses as well as gains. Alternative investments may be subject to substantial charges for management and advisory fees. It may be necessary for accounts that are subject to these charges to make substantial trading profits in order to avoid depletion or exhaustion of their assets.
Altegris Advisors
Altegris Advisors LLC is an SEC-registered investment adviser that advises alternative strategy mutual funds that may pursue investment returns through a combination of managed futures, equities, fixed income and/or other investment strategies.
1124-NLD-7/23/2012
Important Considerations

14 888.524.9441 | altegris.com/mutualfunds
About Altegris
Altegris searches the world to find what we believe are the best alternative investments. Our suite of alternative investment solutions are designed for financial professionals and individuals seeking to improve portfolio diversification.
With one of the leading research and investment groups focused solely on alternatives, Altegris follows a disciplined process for identifying, evaluating, selecting and monitoring investment talent across a spectrum of alternative strategies including managed futures, global macro, long/short equity, event-driven and others.
Veteran experts in the art and science of alternatives, Altegris guides investors through the complex and often opaque universe of alternative investing. Alternatives are in our DNA. Our very name, Altegris, highlights our singular focus on alternatives, the highest standards of integrity, and a process that constantly seeks to minimize investor risk while maximizing potential returns.
The Altegris Companies,* wholly owned subsidiaries of Genworth Financial, Inc., include Altegris Investments, Altegris Advisors, Altegris Funds, and Altegris Clearing Solutions. Altegris currently has approximately $3.27 billion in client assets, and provides clearing services to $997 million in institutional client assets.
*Altegris and its affiliates are subsidiaries of Genworth Financial, Inc. and are affiliated with Genworth Financial Wealth Management, Inc., and include: (1) Altegris Advisors, L.L.C., an SEC-registered investment adviser, CFTC-registered commodity pool operator, commodity trading advisor, and NFA member; (2) Altegris Investments, Inc., an SEC-registered broker-dealer and FINRA member; (3) Altegris Portfolio Management, Inc. (dba Altegris Funds), a CFTC-registered commodity pool operator, NFA member and SEC-registered investment adviser; and (4) Altegris Clearing Solutions, LLC, a CFTC-registered futures introducing broker and commodity trading advisor and NFA member. The Altegris Companies and their affiliates have a financial interest in the products they sponsor, advise and/or recommend, as applicable. Depending on the investment, the Altegris Companies and their affiliates and employees may receive sales commissions, a portion of management or incentive fees, investment advisory fees, 12b-1 fees or similar payment for distribution, a portion of commodity futures trading commissions, margin interest and other futures-related charges, fee revenue, and/or advisory consulting fees.
Genworth Financial, Inc. (NYSE: GNW) is a leading Fortune 500 insurance holding company dedicated to helping people secure their financial lives, families and futures. Genworth has leadership positions in offerings that assist consumers in protecting themselves, investing for the future and planning for retirement — including life insurance, long term care insurance, financial protection coverages, and independent advisor-based wealth management — and mortgage insurance that helps consumers achieve home ownership while assisting lenders in managing their risk and capital.
Genworth has approximately 6,400 employees and operates through three divisions: Insurance and Wealth Management, which includes U.S. Life Insurance, Wealth Management, and International Protection segments; Mortgage Insurance, which includes U.S. and International Mortgage Insurance segments; and the Corporate and Runoff division. Its products and services are offered through financial intermediaries, advisors, independent distributors and sales specialists. Genworth Financial, Inc., which traces its roots back to 1871, became a public company in 2004 and is headquartered in Richmond, Virginia. For more information, visit genworth.com. From time to time, Genworth Financial, Inc. releases important information via postings on its corporate website. Accordingly, investors and other interested parties are encouraged to enroll to receive automatic email alerts and Really Simple Syndication (RSS) feeds regarding new postings. Enrollment information is found under the “Investors” section of genworth.com.

TrusTed AlTernATives. inTelligenT invesTing.® 15

ALteGrIS AdVISorS888.524.9441www.altegris.com/mutualfunds
Printed July 2012419008_072312