
Guide to Interpreting Spectral Domain - Home - Medilex...
98
Transcript of Guide to Interpreting Spectral Domain - Home - Medilex...


Guide to InterpretingSpectral Domain
Optical Coherence Tomography
BRUNO LUMBROSO MARCO RISPOLI
© Copyright 2009Bruno Lumbroso
ISBN 978-88-86193-89-4
EditorI.N.C. Innovation-News-Communication®
Via Troilo il Grande, 11 - 00131 RomaTel. +39 06 41405454 - Fax +39 06 41405453E-mail: [email protected] - Web: inc-innov.com
Clinical EditorLindaA. Lam, M.D.Assistant Professor of OphthalmologyDoheny Eye InstituteUSC Keck School of MedicineLosAngeles, California, USA
Graphic project - Editing - PaginationI.N.C. Innovation-News-Communication®
PrintingJamesAllyn, Inc.6575B Trinity Court, Dublin, CA 94568
Printing complete in the month of March 2010
Non-commercial editionGift for senior ophthalmologists
This publication was made possible by a grant from Carl Zeiss Meditec.
The authors would like to thank Mrs. Donata Piccioli, who executed the drawings and illustrations for this manualwith precision and skill.
All rights reserved, in particular the rights of duplication and distribution, as well as the right to translations.No part of this work may be reproduced in any form, by photocopy, microfilm, CD-ROM or other electronic means, without thewritten permission of the editors and the authors. Data, figures, opinions and statements remain exclusively the responsibility ofthe authors and not of the editors. Any product mentioned must be used in accordance with the technical information providedby its manufacturer.

3
Contents
PART ONE
CHAPTER 1Overview of Optical Coherence Tomography Page 7
CHAPTER 2General Principles for Obtaining and Interpreting Spectral Domain OCT Images Page 9
CHAPTER 3Interpretation of the Pathological Cross-sectional OCT Page 13
CHAPTER 4Visualizing Ocular Structures in Three Dimensions Page 37
CHAPTER 5Retinal Topography With Spectral Domain OCT Page 51
CHAPTER 6SD-OCT for the Study and Management of Glaucoma Page 55
PART TWO
CLINICAL REFERENCE CASESIntroduction Page 59Vitreous and Pathologies of the Vitreoretinal Interface Page 61Macular Degeneration Page 67Diabetic Retinopathy Page 75Vascular Occlusion of the Retina Page 80Retinal Epitheliopathy Page 84Cysticercosis Page 89Vogt-Koyanagi-Harada Syndrome Page 91Complex Cases Page 93


5
Optical coherence tomography (OCT) is an essential tool for diagnosing and
managing retinal diseases and glaucoma.In this handbook, which features de-
tailed schematic illustrations as well as actual OCT scans, we offer a step-by-
step guide for interpreting images and data acquired by the revolutionary and
novel spectral domain OCT technology.
We believe this handbook is important because spectral domain technology
offers significant advances over time domain technology.For example, spectral
domain OCT offers:
1. Improvements to the sagittal OCT B-scan, which reveals previously un-
detected structures
2.Technical and clinical improvements in the study of glaucoma
3.Three-dimensional images that provide new information. (Although this
is a new way to view ocular structures, interpretation can be learned
quickly and easily, and these images enable more accurate diagnosis.)
All references to spectral domain OCT in this handbook are based on our ex-
periences with the spectral domain Cirrus™ HD-OCT manufactured by Carl
Zeiss Meditec, Inc., Dublin, Calif.(U.S.headquarters). All images were generated
by the Cirrus™ HD-OCT.
In these pages, we have ascribed great importance to explaining the mean-
ing of OCT images. In addition, we have tried to set forth a logical method for
interpreting ophthalmic images.The first phase of analysis subdivides each im-
age into its smallest components.The second phase combines these fine details
to synthesize the data, enabling us to arrive at an accurate diagnosis and to de-
cide on appropriate therapy.We hope this handbook helps eyecare practitioners
appreciate the new possibilities offered by spectral domain OCT.
Bruno Lumbroso • Marco Rispoli
PART ONE
Introduction


7
Chapter 1
OVERVIEW OF OPTICALCOHERENCE TOMOGRAPHYAdvances in technology usher ina new era of expanded functionality
Optical coherence tomography (OCT) is an es-sential tool for noninvasive in vivo analysis of retinaltissue for diagnosis and management of retinal dis-ease and glaucoma.This technique is based on thedegree of absorption or dispersion of light traversingthe tissue.The light,which is divided into a detectionarm and a reference arm, is emitted by a superlumi-nescent diode at a wavelength of approximately 840nm.
Time domain OCT, which was commercialized atthe end of 1996 and improved with increased resolu-tion in 2002, compares a reflected beam of light to abeam of light from a reference mirror.Time delays be-tween the two beams can then be measured. Althoughthe low acquisition rate exposes the images to aberra-tions caused by eye movement, increasing the acquisi-tion speed would degrade image resolution. At goodresolution (1024 points in 6 mm of tissue), time do-
FIGURE 1.Cirrus™ HD-OCT image of a healthy retina. Courtesy of David S. Boyer, M.D.

8
Chapter 1
main OCT can produce one B-scan every 1.6 seconds(400 A-scans per second).
SPECTRAL DOMAIN OCT
Recently, we have seen the emergence of a newtechnology called Fourier domain or spectral domainOCT, which employs a different acquisition tech-nique. This technique uses a spectrometer on the de-tector arm to measure the difference in wavelengthbetween the light from the fixed reference arm andthat returning from the tissue.The instrument usesFourier analysis to analyze the images according tothe light wavelength recorded.
This type of OCT technology avoids moving thereference arm and instead analyzes the reflectedlight using a spectrometer.The immediate advantageof this technology is the high number of scans ac-qu i red per second – approximate ly 27 ,000A-scans per second – making true three-dimensional(3-D) imaging possible and practical in a clinical en-vironment.
This sampling frequency has notable advantages.The possibility of artifacts due to eye movement isminimized because the operator can easily positionand center the beam to control the image, especiallywhen working with pseudophakic or highly myopiceyes, or when there is relevant media opacity. Given
the increased resolution, fine retinal detail is compa-rable to what is visible on a histology slide.
The Cirrus™ HD-OCT combines image accuracyand ease of use.The acquisition process is fully auto-mated, including:
• Auto focus• Auto optimization• Auto polarization.Cycles follow one another in a few seconds, plac-
ing the retinal plane in the center of the screen.Theoperator need only position the scanner on the areaof the retina to be studied.The instrument acquiresimages in high-resolution or high-speed mode, takinginto consideration the inverse proportions betweenthese variables.
As mentioned previously, the wavelength of thelight source is 840 nm,and the sampling frequency isabout 27,000 A-scans per second.The instrument ac-quires 200 to 512 B-scans in rapid succession, fromtop to bottom, then constructs a 3-D retinal map byaligning the B-scans.Acquisition speed determinesthe accuracy of the retinal map, so with spectral do-main technology, it is possible to obtain very detailedretinal maps.
The analysis speed for calculation of average thick-ness and the display of ETDRS grid averages is almostthe same.The higher density of data collected withspectral domain technology also allows for 3-D dis-play.

Compared with time domain OCT, spectral domain OCT provides more detailed images andmore data with improved speed and accuracy for in-depth analysis.
Spectral domain optical coherence tomography(SD-OCT) allows us to visualize cross-sectional, ante-rior segment, and three-dimensional (3-D) views ofthe retina.This enables us to diagnose glaucoma andretinal diseases and monitor treatment efficacy.Thedata provided by SD-OCT are analogous to those ob-tained with ultrasound B examinations, but withsome notable advantages. For example, the resolu-tion of ultrasound B is about 150 microns, while theresolution of time domain OCT is 10 microns, andthe resolution of SD-OCT is 5 microns.
Retinal scans with SD-OCT are highly repro-ducible.A few trace points on the margin of the opticnerve or the retinal vasculature allow the registrationof one scan to another. In addition, the instrument iseasy to operate.
Optical coherence tomography allows clinical ob-servation, measurement, and identification of struc-tures that otherwise are not easily visible, such as theexternal limiting membrane (ELM) and the junctionbetween the internal and external segment of thephotoreceptors (IS/OS junction). It also shows vari-ous types of lesions with altered morphology, alteredreflectivity, and/or optically blank areas. OCT per-forms the following functions:
• Measures retinal thickness• Measures the retinal nerve fiber layer (RNFL)• Measures the volume of the retina• Creates retinal thickness maps• Isolates and creates maps of the internal limiting
membrane (ILM) and the retinal pigment epithe-lium (RPE)
• Measures various parameters of the optic disc• Displays three-dimensional views• Provides classic C-scan (en face) analyses, creat-
ing horizontal tissue sections• Offers an RPE-fit function, which provides a
view of a tissue section.The images obtained can be analyzed, quantified,
saved, compared with other results, and superim-
posed on f luorescein angiography, indocyaninegreen,and microperimetry.
Spectral domain OCT is a reliable and sensitive ex-amination.The images are reproducible.Scan acquisi-tion is rapid and simple, and does not require the ad-ministration of intravenous contrast media. In somecases, such as retinal edema follow-up, OCT may bepreferable to fluorescein angiography, which is an in-vasive test that may lead to complications.
OBTAINING OPTIMAL OCT IMAGES
The most frequent impediments to acquiringgood OCT images are ocular movement,media opaci-ty, and an uncooperative patient. Images takenthrough miotic pupils are generally good. In rare cas-es, dilation of the pupils is necessary. A normallacrimal film or good corneal hydration with artificialtears is necessary.Although it is possible to obtain im-ages when early cataracts are present or when in-traocular silicone oil is present, these conditions mayinterfere with scan quality.The following tips mayhelp you obtain optimal OCT images.
GENERAL
Corneal conditions can affect the clarity of anOCT image and, therefore, may interfere with accu-rate interpretation.A dry eye, especially in the elder-ly, can lead to greatly compromised images. In thesecases, it is best to instill artificial tears before theOCT examination.
Acquisitions with SD-OCT instruments can some-times produce artifacts.Artifacts are often caused bypoor fixation or lack of cooperation by the patient,including excessive blinking.The patient should fix-ate on the stimulus – a cross of green segments simi-lar to a star – in the interior of the instrument’s op-
GENERAL PRINCIPLES FOR OBTAINING ANDINTERPRETING SPECTRAL DOMAIN OCT IMAGES
Chapter 2
9

Interpreting the Complete Image: Analysis and SynthesisEven before we began our study of medicine, we learned that in order to decipher various data in sci-
ence, we must apply a logical method according to coherent criteria. Studying a complete image to ob-tain a diagnosis and thus formulate a therapeutic decision is not a simple process.The logical method isdivided into two parts: the analysis, which further divides each argument or image into its constituentelements, and the synthesis, which then reunites the elements that were isolated.
A logical method underlies evidence-based medicine and should be applied in all of our activities asclinicians, including OCT analysis.Reading an OCT report involves:
• Qualitative, 2-D, and 3-D images and maps• Quantitative analytical tests: retinal thickness, retinal map, volumetry• Synthesis of all examination findings, including retinal thickness, morphological alterations, hy-
per- and hyporeflectivity, and anomalous structures apparent with fluorescein and indocyanine green.Using this information, we can reach a diagnosis.
B. Lumbroso, M. Rispoli
10
tics. During the examination, the patient can see thestimulus and the red scanning segment at the sametime, which may distract the patient, especially if thevisual acuity is good.
These intrinsic and extrinsic factors may cause ar-tifacts to a greater or lesser degree, depending on thetype of acquisition protocol.
5-LINE RASTER
Usually, this test is less affected by ocular move-ment because scanning time is relatively short.Themost frequent artifact is a shading or, more precise-ly, a portion of the scan showing an offset of the pix-els on the horizontal axis that is distinct from the“granular” pixelation display of the rest of the B-scan.
MACULAR CUBE 512X128
For this type of acquisition, the patient must fixateon the target for 2.4 seconds. During the scan, thescreen shows the operator an external view of theeye, a real-time fundus image, OCT images of the cen-tral crosshair, and the top and bottom B-scans.Aftercapture, the “Review” screen provides qualitative in-formation on the scan. If a patient blinks during thescan,the horizontal segments will appear black on theOCT image. If a patient loses fixation,saccades will bepresent where the blood vessels are not contiguous. Ifblinks or numerous artifacts are present, the operatorclicks the“Try Again”button to return to the“Scan Ac-quisition” screen.
CAPABILITIES OF SD-OCT
In our experience, spectral domain opticalcoherence tomography (SD-OCT) offers thefollowing advantages:• Simple, with a short learning curve• Fast (2.4 seconds or less)• Reliable• Sensitive (resolution of 5 microns)• Reproducible• Noninvasive, noncontact and safe
With SD-OCT, clinicians can:• Detect disease• Evaluate treatment efficacy over time• Quantify lesion thickness and volume• Track disease progression• Evaluate postoperative status• Study 3-D views
Conditions that can affect the quality ofOCT scans include:• Transparency of the optic media• Poor corneal condition or lacrimal film
Summary Table

11
Chapter 2 General Principles for Obtaining and Interpreting Spectral Domain OCT Images
Enduring PhilosophyRené Descartes, the 17th-century French philosopher, elucidated the principles of analysis andsynthesis in “Le Discours de la Mèthode” in 1637, which stated:The science of the intellect is universal, and there can only be one true method, which consists of sepa-rating what is already simple and clear in order then to attempt to understand that which is complexand obscure.The method is a collection of reliable, easy rules, observing which there is no risk of mis-taking the false for the true.In a logical process, the analyses of each of the possible elements is first performed: Then after thisphase, the synthesis of all these elements is performed, and the results of these flow into the conclusions.To replace the apparent chaos of data with an ordered and rationally constructed system.


13
Chapter 3
INTERPRETATION OF PATHOLOGICALCROSS-SECTIONAL OCT
al
Following a logical sequence is essential whenanalyzing an optical coherence tomography (OCT)scan. Initially, each of the elements – hyperreflectivelesions, hyporeflective lesions, anatomical changes,quantitative alterations, retinal thickness, and retinalmap – must be analyzed to arrive at an interpreta-tion.
INTERPRETING COLORSON SPECTRAL DOMAIN OCT
Generally, it is preferable to study images in grayscale instead of conventional pseudo colors.This al-lows us to evaluate slight variations in the intensi-ties of gray to distinguish details that are easy tomiss.
The spectral domain OCT (SD-OCT) software arbi-trarily assigns a color for each degree of reflectivity,al-lowing us to see marked differences in color wherewe would otherwise observe a gradual change in re-flectivity (Figures 1, 2).
In this chapter, we discuss how to interpretthe two-dimensional cross-sectionalspectral domain OCT scan, the B-scan.
I. ANALYTIC STUDY
QUALITATIVE ANALYSIS
A. MORPHOLOGYMorphological alterations- Deformation of the entire retina- Alteration of the retinal profile- Intraretinal structural alteration- Morphological alteration of the posterior layer
Anomalous structures- Preretinal- Epiretinal- Intraretinal- Subretinal
3-D and C-scan studies- Cystoid edema- Serous RPE detachment- Serous neuroepithelium detachment- Neovascular membrane- Lamellar hole- Macular hole
B. REFLECTIVITYIncreased reflectivity- Superficial- Intraretinal- DeepDecreased reflectivity- Superficial- Intraretinal- DeepShadow zones - screen effect- Anterior- Superficial- Deep
QUANTITATIVE ANALYSIS- Thickness- Volume- Map
II. SYNTHESISBy evaluating and comparing OCT data in con-
junction with the patient’s history, the clinical exami-nation and other tests, clinicians can arrive at a diag-nosis or evaluate the patient’s response to therapy.
ANALYSIS AND SYNTHESIS USING OCT
B. Lumbroso, M. Rispoli
14
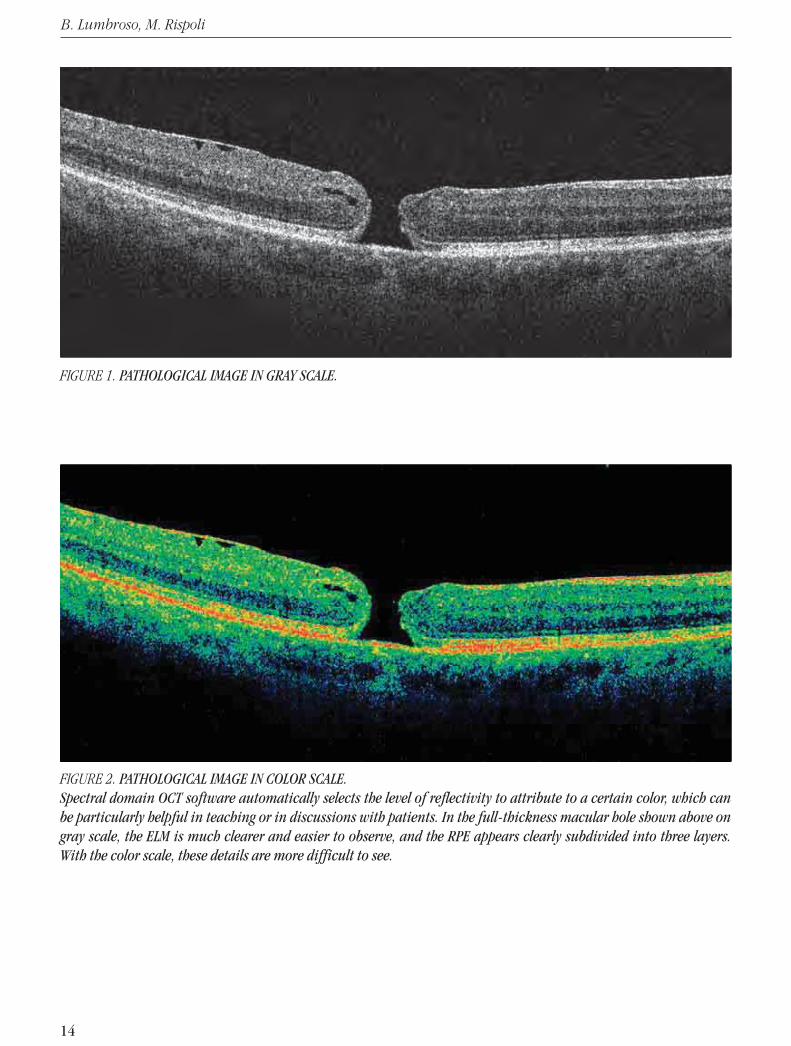
FIGURE 1. PATHOLOGICAL IMAGE IN GRAY SCALE.
FIGURE 2. PATHOLOGICAL IMAGE IN COLOR SCALE.Spectral domain OCT software automatically selects the level of reflectivity to attribute to a certain color, which canbe particularly helpful in teaching or in discussions with patients. In the full-thickness macular hole shown above ongray scale, the ELM is much clearer and easier to observe, and the RPE appears clearly subdivided into three layers.With the color scale, these details are more difficult to see.

15
Chapter 3 Interpretation of Pathological Cross-sectional OCT
QUALITATIVE ANALYSIS: MORPHOLOGY
Compared with time domain OCT, SD-OCT instru-ments offer a clearer and more detailed view ofpathology throughout the entire retina.With SD-OCT,retinal layers,particularly the external retina, the pho-toreceptors, and the retinal pigment epithelium(RPE), can be differentiated, and morphological varia-tions can be evaluated. Subtle histological structures,which may be missed with time domain OCT, can bedetected with SD-OCT.
In addition, SD-OCT can discern the intravitrealformations, strands, and particles that may be foundin inflammation, hemorrhage, or neovascularization.The vitreoretinal interface and hyaloid are also morevisible with SD-OCT.
RETINAL DEFORMATIONS
• Concavity (myopia): In cases of high myopia(Figure 3) and especially posterior myopic staphy-loma (Figure 4),OCT will show a marked concavi-ty. Certain lesions in the sclera (staphylomas) con-tribute to a localized depression of the retinathroughout its thickness.
• Convexity (cysts or subretinal tumors): In casesof serous detachment of the RPE, OCT oftenshows a convex shape. In rare instances, however,convexity may be due to subretinal cysts. In thesecases, the convexity is less pronounced and in-cludes the subretinal layers (the epithelium andchoriocapillaris). In subretinal tumors, such asmelanomas, the entire retina, including the RPE,may be raised so that differentiating the tumormay be difficult (Figure 5).
FIGURE 3. QUALITATIVE ANALYSIS – MORPHOLOGY – DEFORMATION OF THE ENTIRE RETINA.Note the abnormally concave structure of this highly myopic eye (21 diopters).

FIGURE 5. QUALITATIVE ANALYSIS – MORPHOLOGY – DEFORMATION OF THE ENTIRE RETINA – CONVEXITY.In cases of subretinal cysts or choroidal tumors, a convex retina that also involves the RPE and the choriocapillarismay be observed. In this case of fibrovascular scarring and neovascularization, retinal edema and small serous de-tachments of the retina are seen. The retina is deformed and convex.
B. Lumbroso, M. Rispoli
16
FIGURE 4. QUALITATIVE ANALYSIS – MORPHOLOGY – DEFORMATION OF THE ENTIRE RETINA – SMALL STAPHYLOMA.This is a rare case of a small posterior staphyloma of the retina due to a localized deformation of the sclera frompossible scleritis. The retina is preserved over all layers and follows the scleral deformation without changing itsstructure.

17
Chapter 3 Interpretation of Pathological Cross-sectional OCT
ABNORMAL RETINAL PROFILE
The normal retinal profile shows a regular, sym-metrical foveal depression.Optical coherence tomog-raphy can detect abnormalities, such as:• Vitreoretinal traction. The normal foveal depres-
sion deforms, becoming convex and/or irregular.This condition is associated with the formation offissures or holes (Figure 6).
• Diffuse retinal edema.The foveal depression maybe reduced or disappear, and the retinal profilemay become flat or slightly irregular.The absenceof the foveal depression is a sign of clinically sig-nificant retinal edema.
• Complex vitreoretinal traction• Retinal folds• Macular pucker. The retinal surface is deformed
by waves and curled by traction caused by theepiretinal membrane (ERM) (Figures 7, 8).
ENLARGED AND IRREGULAR FOVEAL DEPRESSION
Macular pseudoholeAn enlarged foveal depression simulates a retinal
macular hole.The presence of tissue at all retinal lay-
ers above the RPE is a pseudohole.A true lamellarhole is characterized by an absence of some retinallayers above the RPE (Figure 9).
Macular holeOptical coherence tomography facilitates identifica-
tion, measurement, and classification of macular holesaccording to the Gass classifications.The C-scan or RPE-fit view allows qualitative evaluation of edema, if pres-ent.• Stage 1: The foveal depression disappears, and a
small optically blank area (cyst) forms below theretinal surface (Figure 10).
• Stage 2: Partial breaks of the internal retina are ap-parent, with operculum adhering to the margins ofthe hole,and slightly increased thickness.
• Stage 3: The hole’s full-thickness operculum is nolonger adherent to the retina. Retinal edema maybe present, with increased thickness of the retinaand a small detachment.
• Stage 4:The hole is full-thickness, with loss of reti-nal substance, retinal edema on the margins, anddetachment of the margins (Figures 11, 12).
RETINAL PROFILES SEEN WITH SD-OCT
• Normal profile• Enlarged foveal depression• Decreased foveal depression• Asymmetric foveal depression• Absent foveal depression• Retinal convexity from edema or tractioninstead of the depression
• Profile deformed by localized vitreoretinaltraction
• Profile deformed by complex vitreoretinaltraction
• Retinal profile undulating due to retinal folds• Retinal profile corrugated due to narrowretinal folds
• Retinal convexity from edema or tractioninstead of the depression
• Macular hole• Lamellar hole• Macular pucker
Summary Table 1
FEATURES SEEN WITH SD-OCT
Anomalous structures
INTERNAL RETINA
• Vitreoretinal interface abnormalities
• Preretinal and peripapillary neovascular
membranes
• Preretinal or epiretinal membrane
EXTERNAL RETINA
• Exudates
• Drusen
• Neovascular membrane
• Classic lesion
• Occult lesion
• Macular scar
Summary Table 2

B. Lumbroso, M. Rispoli
18
FIGURE 6. QUALITATIVE ANALYSIS – MORPHOLOGY – DEFORMATION OF THE RETINAL PROFILE FROM LOCALIZEDVITREORETINAL TRACTION.Partially adherent epiretinal membrane exerts traction on the retinal surface, causing the foveal depression to disap-pear. An intraretinal cyst forms at the localized traction.
FIGURE 7. QUALITATIVE ANALYSIS – MORPHOLOGY – EPIRETINAL MEMBRANE.Partially adherent epiretinal membrane exerts tangential traction on the retinal surface, causing folds on the ILM.

19
Chapter 3 Interpretation of Pathological Cross-sectional OCT
FIGURE 10. QUALITATIVE ANALYSIS – MORPHOLOGY – STAGE I MACULAR HOLE.In this typical case, a large cystic structure in the internal layers of the retina is visible, while part of the normalretinal structure is preserved.
FIGURE 8. QUALITATIVE ANALYSIS – MORPHOLOGY – MACULAR PUCKER.The ILM is thickened and irregular, with visible vitreoretinal traction and epiretinal membranes. The underlyingretina is thickened by diffuse edema, with a few small pseudocysts mostly in the internal nuclear layer but also inthe external nuclear layer.
FIGURE 9. QUALITATIVE ANALYSIS – MORPHOLOGY – LAMELLAR HOLE.A loss of internal layers of the retina and good preservation of the external layers can be observed here. The ELM andthe IS/OS junction of the photoreceptors are visible.

FIGURE 11. QUALITATIVE ANALYSIS – MORPHOLOGY – STAGE IV MACULAR HOLE.The hole penetrates all layers, with only the RPE visible. Marked CME is thickening the margins of the hole, which areslightly detached from the RPE. These pseudocysts are located in the internal and external nuclear layers. It is impor-tant to measure all components of the hole and its dimensions at different levels to decide if surgical intervention isnecessary and to follow progression. The ILM and the IS/OS junction are normal in the surrounding retina and slight-ly detached at the margins of the hole. They disappear around the fovea with the rest of the retinal tissue. The round-ed central hole surrounded by a crown of regular pseudocystic cavities is visible in the frontal section.
B. Lumbroso, M. Rispoli
20
FIGURE 12. QUALITATIVE ANALYSIS – MORPHOLOGY – FRONTAL SECTION ADAPTED TO RPE CONTOUR – STAGE IVMACULAR HOLE.This is a en face image of the macular hole in Figure 11. The same scan is represented in gray scale and color scale. Anoval hole at the center of the fovea is visible, surrounded by relatively regular cystic formations, elongated toward thecenter and inside the margins of the hole. The margins of the hole are thickened because they intersect the ILM and theIS/OS junction, which point toward one another.

21
Chapter 3 Interpretation of Pathological Cross-sectional OCT
INTRARETINAL MORPHOLOGICAL ALTERATIONS
In this section, we discuss intraretinal fissures,where the retinal surface is not compromised.Whenthe retinal surface is intact, macular pseudoholes canform a retinal fissure, called an impending hole, andthen enlarge.
Posterior morphological alterationsThese anomalies, especially serous or hemorrhag-
ic detachments, are observed at the RPE level. SerousRPE detachments deform the posterior border of theretina and form an obtuse angle with Bruch’s mem-brane and the choriocapillaris.Serous detachments ofthe neuroepithelium are less elevated and form acuteangles with the RPE.
Retinal pigment epitheliumIn cases of atrophy, the RPE deteriorates, revealing
Bruch’s membrane.The RPE can deteriorate irregular-ly, revealing one or more of the three normal layers.
In cases of neovascular membranes, we can ob-serve dissociation and increased thickness of theRPE. Drusen are seen as irregular undulations, withslightly hyperreflective content (Figure 13). Serousdetachments, on the other hand, often have an opti-cally blank or slightly vascularized appearance. It is
then possible to observe Bruch’s membrane as a thinrectilinear line.
Retinal external nuclear layerThe external nuclear layer (ENL) gives information
about the function of the photoreceptors. It can pres-ent as normal,or with the following:
• Increased foveal or localized thickness• Diminished foveal or localized thickness• Globally diminished or increased thickness•Total absence of the ENL• Presence of edema near the RPE layer• Presence of exudates or other material at the RPE
layer.Any of these characteristics will indicate the in-
tegrity of the photoreceptors, especially when com-pared with other indications.The junction of the inter-nal and external segments of the photoreceptors(IS/OS junction) and the external segments of thephotoreceptors are also important (Figure 14).Theappearance can be linear; the junction can be de-formed by folds and RPE detachments, or it can bethickened and altered,absent,or not visible.
FIGURE 13. QUALITATIVE ANALYSIS – MORPHOLOGY – DEEP ANOMALOUS STRUCTURES – DRUSEN.Undulations and a localized increase in thickness of the RPE/choriocapillaris corresponding to drusen can be seen.The ELM and the IS/OS junction are preserved, following the undulations of the RPE. A medium reflective substancefills the drusen. Bruch’s membrane may be visible as a thin line.

B. Lumbroso, M. Rispoli
22
External limiting membraneThe external limiting membrane (ELM) is normally
more resilient than the IS/OS junction. It can be ob-served after the junction has disappeared.The ELM canbe linear, broken, deformed by folds or RPE detach-ments, or altered in various ways. In some lesions, theELM is absent.
ANOMALOUS STRUCTURES
Because of increased scan density and higher reso-lution, SD-OCT provides improved evaluation ofanomalous structures.The study of hyporeflectivestructures is easier, especially at the vitreous level andbehind the RPE/choriocapillaris.
IS/OS JUNCTIONPOSSIBLE OCT MORPHOLOGIES
• Normal linear aspect• Broken• Deformed by folds or RPE detachments• Thickened• Absent
Summary Table 3
EXTERNAL LIMITING MEMBRANEPOSSIBLE OCT MORPHOLOGIES
• Normal linear aspect• Broken• Deformed by folds or RPE detachments• Altered• Absent
Summary Table 4
FIGURE 14. QUALITATIVE ANALYSIS –MORPHOLOGY – ALTERATIONS OF THEIS/OS JUNCTION.A fundamental contribution of spectraldomain OCT is that it allows us to visual-ize the various elements of the photore-ceptors. We can see them well in this fig-ure. The IS/OS junction normally presents as a hyperreflective line parallel to the RPE. Alterations of the photorecep-tors appear as small breaks and irregularities. A slight thickening of the junction is associated with decreased thick-ness of the external nuclear layer. In this case, we also note the absence of the internal line of the RPE, which corre-sponds to the external segment of the photoreceptors. Do not confuse these irregularities with the shadows of the reti-nal blood vessels (visible in this image), which interrupt the IS/OS junction.

Preretinal and epiretinal membraneThe density, thickness, and location of preretinal
and epiretinal membranes can be evaluated.Themembrane may be adherent, fused with the internallimiting membrane (ILM), or fully or partially de-tached. Its reflectivity, however, is greater than thenormal reflectivity of the RNFL.
Alterations of the profile or thickness of the mem-branes can indicate retinal traction. It can be separatefrom or adherent to the retina.It can cause wrinkles inthe retinal surface.The preretinal or epiretinal mem-brane can be seen clearly as hyperreflective becauseof thickening of the fibroglial elements.
If detached, the posterior hyaloid presents onOCT as a slightly reflective image, often broken andwell-delineated, and adherent to the retina at somepoints (Figure 15).
23
Chapter 3 Interpretation of Pathological Cross-sectional OCT
RETINAL PIGMENT EPITHELIUMPOSSIBLE OCT MORPHOLOGIES
• Normal• Increased thickness• Decreased thickness• Irregular thickness with one or two layersabsent
• Anomalous appearance of layers• Undulations (drusen)• Detachments (serous RPE detachments)• Three layers visible• Layers not visible, fused• Anomalous tissue in contact with the RPE:fibrovascular tissue, active neovascularmembranes, lipofuscin deposits
• RPE deformed by anomalous tissue
Summary Table 6
EXTERNAL NUCLEAR LAYERPOSSIBLE OCT MORPHOLOGIES
• Normal• Increased foveal thickness• Localized decreased thickness• Thickness decreased globally• Thickness increased in an organized manner• Thickness increased globally• Absence of the external nuclear layer• Cystoid edema• Exudate
Summary Table 5
FIGURE 15. QUALITATIVE ANALYSIS – MORPHOLOGY – EPIRETINAL MEMBRANE.This image shows partially detached epiretinal membrane combined in part with the RNFL. The foveal depression isabsent. The retina is thickened, with diffuse edema.

FIGURE 16. QUALITATIVE ANALYSIS – MORPHOLOGY – CLASSIC NEOVASCULAR MEMBRANE.In this case of age-related macular degeneration, the neovascular membrane is elongated, fusiform, and located infront of the RPE. The lesions of the RPE and Bruch’s membrane can be distinguished. Note the serous detachment ofthe neuroretina and the diffuse edema that surrounds it. In this case, pseudocystic cavities of edema do not appear.Edema and detachments of the neuroretina are always present with active nerve fiber membranes, whether they areclassic or occult.
B. Lumbroso, M. Rispoli
24
Macular puckerRetraction of the ILM is caused by a fibroglial
proliferation, causing tangential traction.The forceof this action creates retinal folds. Resultant changesoccur to the courses of blood vessels, which appearelongated when parallel to the folds. Generally, reti-nal folds are transverse in the retina underlying themembrane and radial to that outside the area of trac-tion.
Cotton wool spotsThese hyperreflective formations are in contact
with and often confused with the superficial RNFL.They are associated with ischemic lesions of thenerve fibers and are located at the periphery of the is-chemic area.
Intraretinal anomalous structuresHard exudates are localized in the posterior layers
of the retina.They are formed from lipoproteins andcan be isolated or part of the surrounding retina.Theyare found in the external plexiform layer at the
boundary between the edematous area and the nor-mal retina.
Posterior anomalous structuresClassic neovascular membranes are generally
fusiform, nodular, and anterior to the RPE. If active,they are accompanied by edema or serous detach-ments of the neuroretina (Figure 16;also see page 69,Figures 2A and 2B).
Occult neovascular membranes (see page 70, Fig-ure 3) are more difficult to distinguish, presenting asa thickening of the RPE/choriocapillaris complexwith a disassociated aspect.The active occult mem-branes are accompanied by diffuse or cystoid edemaand localized serous detachments of the neuroretina.
Scars in advanced macular degeneration (see page71, Figure 7) or diabetic fibrovascular membranepresent as thickened areas of hyperref lective fi-brovascular tissue.These scars distort the profile ofthe retina and can cause the normal elements of theretina to disappear.3-D STUDY OF MORPHOLOGY

25
Chapter 3 Interpretation of Pathological Cross-sectional OCT
FIGURE 17. QUALITATIVE ANALYSIS – MORPHOLOGY – FRONTAL SECTION ADAPTED TO THE RPE CONTOUR – CME.This is an en face view of diabetic retinopathy in a patient 12 years post diabetes diagnosis. The retina is thickened bydiffuse and pseudocystic edema. Pseudocystic formations are developing in the periphery, especially at the externaland internal nuclear layers. At the fovea, the cysts coalesced into oval cavities with vertical major axes, owing to theanatomical structure of the fovea. The pseudocysts vary in size; some are small and rounded, while others are irregu-lar, formed by the merger of multiple pseudocysts.
Analytical studies provided by the Cirrus™ HD-OCT software include 3-D imaging and frontal orcoronal (en face) images, such as C-scan and RPE-fit(Figure 17).These studies enable global evaluation ofretinal changes.
We have only recently begun using the 3-D study ofretinal pathology, but already we are improving ourcomprehension of certain diseases, such as cystoidmacular edema (CME),pseudocysts within a full-thick-ness macular hole or a lamellar hole, serous detach-ments of the RPE or neuroepithelium,to name a few.
QUALITATIVE ANALYSIS: REFLECTIVITY
The study of reflectivity with SD-OCT does notprecisely correspond to the same study done withtime domain OCT,because we are better able to visu-alize structures with SD-OCT.One of the fundamentalelements in OCT analysis is the ability to assess re-flectivity. Reflectivity can be increased or decreased,
or there can be a shadow zone. Collections of fluidare particularly easy to detect.For example,neovascu-lar membranes examined with time domain OCT ap-pear dense and homogeneous, while the same mem-branes examined with spectral domain OCT showdense zones and less reflective zones, with evidentheterogeneity.
HIGH REFLECTIVITY
The strength of the signal reflected from tissue de-pends on the following factors:
• The quantity of light when it arrives at a particu-lar layer,having been partially absorbed by inter-vening tissues
• The quantity of light reflected• The quantity of light reflected that reaches the
detector after having been reabsorbedHorizontal anatomical structures, such as the
nerve fibers and the plexiform layers,are more reflec-tive than vertical structures.

B. Lumbroso, M. Rispoli
26
Increased reflectivity may be superficial, intrareti-nal or deep. Depending on its location, increased re-flectivity may indicate the following:
Superficial• Syndromes of the vitreoretinal interface, epireti-
nal or retinal fibrosis, macular pucker, preretinalor epiretinal membranes
• Superficial hemorrhage:dense,with a shadow ef-fect of underlying structures; cotton wool spotsare superficial with margins indistinct from themargins of areas of recent ischemia.
Intraretinal• Lesions of the photoreceptors: in these cases,
the IS/OS junction shows irregularity, interrup-tions and areas in which it is no longer visible. Incases of retinal atrophy, the ELM is more resist-
ant, remaining visible longer.• Retinal serous detachment:as in serous choriore-
tinitis, the external segment of the photorecep-tors, which can be thickened, irregular, or haveincreased reflectivity, presents granulations orflaking of the internal face of the detachment inthe detached area.
• Hemorrhage:dense,with a shadow effect• Hard exudate: nodular, hyperreflective zones
composed of lipoproteins at the boundary be-tween the healthy retina and the edematous reti-na.They are generally located in deep layers.
Deep• Drusen cause an undulation or localized in-
crease in thickness of the RPE/choriocapillariscomplex.
• Pre- and retroepithelial neovascular membranesthat merge with the RPE complex;Bruch’s mem-brane and choriocapillaris show increased re-flectivity under a thin retina.
• Scars from choroiditis, traumatic lesions, reti-nal fibrosis, disciform degeneration. Recentlaser impacts are seen as vertical, hyperreflec-tive stripes leading from the RNFL to the RPE.Because of hyperpigmentation, those in thechoroid appear as increased reflectivity in the
CAUSES FOR HYPERREFLECTIVITYON SD-OCT
SUPERFICIAL• Epiretinal or intraretinal fibrosis• Cotton wool spots
INTRARETINAL• Inflammatory infiltrate• Hemorrhage• Hard exudates• Intraretinal neovascularization
DEEP• Accumulation of lipofuscin• Hyperplasia of the RPE• Atrophy of the RPE with retrodiffusion• Classic or occult neovascular membranes
Summary Table 8
DETERMINANTS OF REFLECTIVITYON SD-OCT
HIGHEST• Accumulation of pigment• Hypertrophy of the RPE• Choroidal nevus• Scar tissue
HIGH• Nerve fiber (normal)• IS/OS junction (normal)• External segments of the photoreceptors• External limiting membrane• RPE/choriocapillaris complex (normal)• Hemorrhage• Neovascular membrane• Hard exudate
MEDIUM• Plexiform layer (normal)• Retinal edema
LOW• Nuclear layer (normal)• Collections of fluid: cavity, cyst, detachment• Shadow
Summary Table 7

27
Chapter 3 Interpretation of Pathological Cross-sectional OCT
FIGURE 18. QUALITATIVE ANALYSIS – REFLECTIVITY – HYPERPIGMENTATION FROM CHORIORETINAL SCARRING ANDFIBROSIS.A densely pigmented scar and marked thinning of the adjacent retina is observed. This pigmentation casts a denseshadow on the posterior layers.
FIGURE 19. QUALITATIVE ANALYSIS – LOW REFLECTIVITY – RETRODIFFUSION FROM RPE ATROPHY.Atrophy of the retina and the RPE is characterized by a marked decrease in retinal thickness. The hyporeflective, atrophiedRPE and the reduced thickness of the retina allow more light to penetrate the choroid. Less light is absorbed crossing theretina, and the light reflected is also absorbed less as it returns. At the margins of the atrophied zone, the thickness of theexternal nuclear layer is normal, and the ELM and the IS/OS junction can be seen.

B. Lumbroso, M. Rispoli
28
RPE/choriocapillaris complex and cause ashadow zone (Figure 18). Increased retrodiffu-sion of light may indicate atrophy of the retinaand the RPE.
LOW REFLECTIVITY
Decreased reflectivity may be caused by less re-flective tissue, such as atrophied RPE with less pig-ment (Figure 19).Collections of fluid may be seen ascysts or serous or hemorrhagic detachment of theneuroretina or RPE (Figures 20, 21).
Areas of low reflectivity may be minimal or exten-sive. They take on an important role in 3-D studiesand frontal scans.
• Low intraretinal reflectivity. Edema, CME, cyst,microcyst, impending hole.
• Low subintraretinal reflectivity. Serous detach-ment of the neuroretina.The detachment formsan acute angle with the RPE.
• Low reflectivity under the RPE. Serous detach-ment of the RPE that has separated from Bruch’smembrane.The fluid from the choriocapillarisaccumulates in the subretinal space, creating anobtuse angle with the underlying layers.
Serous detachments can be idiopathic, associatedwith acute or chronic central serous chorioretinopathy,or secondary to serous or hemorrhagic disciform de-generation. Rarer causes may include myopia,angioidstriations, choroiditis, and choroidal neoformations.Often, they are associated with the presence of a neo-vascular membrane.The area of the detachment or thecystic space can be optically blank in cases of serousdetachment or more reflective in cases of inflammato-ry exudations or senile degeneration.
• Hemorrhagic.The detachment shows areas thatare not optically blank; they may be shadowedby highly reflective areas.
• Diminution of the pigment in the atrophiedarea of the pigment epithelium.
SHADOW ZONES
Dense, reflective tissue may create a shadow onposterior elements.The highly sensitive spectral do-main instruments lend far more contrast to the shad-ow zone determined by the retinal blood vessels andintraretinal reflective formations.At the IS/OS junc-tion and the ILM, the shadow of the retinal blood ves-sels obscures these structures and simulates lesions
FIGURE 20. QUALITATIVE ANALYSIS – REFLECTIVITY – RPE DETACHMENT WITH DETACHED NEUROEPITHELIUM INSEROUS CHORIORETINOPATHY.In this case, the contents of the RPE detachment are clear. The detachment forms an obtuse angle with a portion of theRPE still attached. Bruch’s membrane is visible as a thin line, detached from the RPE, having remained horizontal. Inthis serous RPE detachment, the thickness of the boundary is regular and the internal boundaries are smooth. TheRPE detachment is associated with a small detachment of the neuroepithelium.

29
Chapter 3 Interpretation of Pathological Cross-sectional OCT
FIGURE 21. DETACHED NEUROEPITHELIUM.This image shows a detachment of the neuroepithelium in a case of central serous chorioretinopathy. The margins ofthe detachment form an acute angle with the RPE, and the ILM follows the detachment. The line of the IS/OS junctionfollows the changes from the detachment. The RPE/choriocapillaris complex, which spectral domain OCT sees as tworeflective lines separated by a minimal hyporeflective line, shows a fissure. The superior line is separated from theRPE and forms the inferior boundary of the serous detachment. This is formed by the external segment of the photore-ceptors. In cases of prolonged detachment, the segments of the photoreceptors, which form the anterior boundary ofthe detachment, become altered and indistinct, indicating alterations of the photoreceptors.
FIGURE 22. SHADOW OF NORMAL RETINAL BLOOD VESSELS.In spectral domain OCT scans, the normal retinal blood vessels, which are difficult to observe in the RNFL, form verti-cal shadows that interrupt the underlying structures. It is important to recognize these to avoid confusing the inter-ruptions of the ILM and the IS/OS junction with true alterations of the photoreceptors. Spectral domain OCT shows theblood vessel itself or its contents if the vessel is large.

B. Lumbroso, M. Rispoli
30
of the photoreceptors (Figure 22).The structures of the retina can be occluded at
various levels: preretinal, intraretinal, and posterior.We have noted the following with regard to shadowsapparent in spectral domain OCT studies.
Anterior levelThe normal retinal blood vessels are difficult to
distinguish, but they cast a cone of shadow that al-lows us to find them. Superficial or profound hemor-rhage causes a cone of shadow,as do cotton wool ex-udates.
Posterior levelHard lipid exudates in the deep retinal layers cast
dense shadows. Pigmented areas can form a screenwith an inclined shadow.Hyperplasia and hypertrophyof the RPE are seen as dense shadows.
Neovascularization of the choroid is detected by anincrease in reflectivity in the RPE/Bruch’s membranecomplex and a slight increase in the thickness of thislayer,with a shadow cast on the posterior layers.
A dense,pigmented scar casts a shadow.A markedlyhyperreflective subretinal neovascular membrane, ifthick,also casts a shadow.
QUANTITATIVE ANALYSIS
Quantification is an important aspect of an analyticexamination.It allows comparison of numerical data inthe natural course of a disease or its response to thera-py. With certain software, we can quantify the thick-ness of the retina or retinal elements (for example, theRNFL in glaucoma),as well as the volume of the retina.Spectral domain OCT provides better definition andcontrast between the retinal layers, allowing precisestudy and measurement of various layers.
In lesions of the internal retina due to occlusions ofthe retinal venules or arterioles, there are marked varia-tions of the nerve fibers, the ganglion layer, the internalplexiform layer, and the internal nuclear layer. In ve-nous occlusions and recent arterial occlusions, thereis an increase in thickness. In arterial occlusions,aftera few weeks, a marked reduction in internal retinalthickness appears.The external nuclear layer is themost important layer of the external retina to evalu-ate because you can detect damage to the photore-ceptors.
Time domain OCT automatically measures retinalthickness, showing the distance between the vitreo-retinal interface and the anterior surface of the pig-ment epithelium, which varies from 275 to 200 mi-crons. The foveal depression varies from 190 to 170
microns.At the fovea,the average thickness is approx-imately 170 to 190 microns, and the peripheral retinais 240 microns.The retinal fibers are thicker in the in-terpapillomacular area.The nerve fibers form a slight-ly thickened arc of about 500 microns within thefovea, normally reaching 270 microns.The thicknessis measured on single scans and over the retinal map.The normative database software enables us to com-pare variations to the normal eye.
Spectral domain OCT gives higher values for reti-nal thickness because it identifies the RPE more pre-cisely than time domain OCT, which confuses it withthe IS/OS junction.
RETINAL THICKNESS VARIATIONS
With the retinal map, we can immediately visualizeareas of increased or decreased thickness.With Cir-rus™ HD-OCT,we can also evaluate the volume of theretina, enabling us to follow the progression of edemaor atrophy more precisely (Figures 23, 24).
Increased thickness may be observed in the following:• Retinal edema.This is the most frequent cause of
retinal thickening.Our improved ability to studyand evaluate the various forms of retinal edemaconstitutes one of the major advances of OCT.Thethree stages of retinal edema are: simple edema,cystoid macular edema (CME),and chronic edemawith serous detachment of the retina.The presenceof collected liquid in the retinal layers or in front of
CAUSES FOR SHADOWING EFFECTON SD-OCT
ANTERIOR• Hemorrhage• Exudates• Retinal blood vessels (normal)
POSTERIOR• Neovascular membrane• RPE thickening• Accumulation of pigment• Choroidal neovascularization• Retinal scar
Summary Table 9

31
Chapter 3 Interpretation of Pathological Cross-sectional OCT
FIGURE 23. RETINAL ATROPHY.The marked decrease in retinal thickness is shown numerically and by conventional colors. The software also calcu-lates the volume and average thickness of the retina. At the side, we can see the 3-D view of the retinal thickness, theILM, which appears altered, and the RPE, which is altered.
the RPE indicates increased retinal thickness.• Vitreoretinal traction.This is caused when the ERM
from diabetic retinopathy or interface syndromespulls the superficial layers of the retina,withdeformations in the profile and secondary edema.
Decreased thickness may be observed in the following:• Atrophic degeneration.At the posterior pole,we
can see a marked decrease in retinal thickness to150 or even 100 microns.We also can see areas ofRPE atrophy,which are thinner and less reflectiveowing to loss of pigment.The hyporeflective RPEallows increased penetration of light into thechoroid.The reflectivity is increased because lightabsorption is reduced at the retina and the RPE.
• Laser scars, fibrous scars. Scars consequent to lasertreatment,chorioretinitis or trauma indicateatrophy of the retina,with thickening of the
pigment epithelium/choriocapillaris complex.
VARIATIONS IN THICKNESS OF RETINAL LAYERS
Various pathologies cause the retina to becomethicker or thinner in certain areas and in well-definedlayers.The images and the retinal maps generated byOCT enable us to precisely locate and track diseaseprogression.
Morphological alterations may involve the entireretina or the retinal surface, with changes to thefoveal and extrafoveal retinal profile.
In glaucoma, study of RNFL thickness variations isimportant when examined on circular chorioretinalscans of the papilla.

B. Lumbroso, M. Rispoli
32
MACULAR RETINAL MAP:TIME DOMAIN VS. SPECTRAL DOMAIN
A retinal map uses color coding to describe thethickness of the posterior pole as follows:
• White:greater than 450 micron• Red:350 to 450 microns• Orange:320 to 350•Yellow:270 to 320 microns• Green:170 to 250 microns• Blue: less than 170 microns.
Time domain OCTThe time domain retinal map is created from six
consecutive OCT tomograms, following a star-likepattern that intersects at the fovea.Thickness meas-urements are taken at 100 points in each tomogram,with a total of 600 points,six of which coincide at thefoveola.Thus, the measurements are more precise inthe center of the map than in the periphery.The soft-ware calculates average thicknesses.
The results are shown in two modes.A quantita-tive interpretation includes a central subfield with adiameter of 500 microns and two concentric ringssubdivided into four quadrants each.The averagethickness is reported in each defined area.A topo-graphical map in false colors also is created.The nor-mal retinal map appears green (200-250 microns)with a blue fovea (170 microns).The instrument cal-culates the estimated thickness in each slice of theretina between tomograms.
Spectral domain OCTSpectral domain retinal maps incorporate several
important advances. For example, spectral domainOCT acquires 200 to 512 B-scans from top to bottomin rapid succession.The software then constructs aretinal map by aligning the B-scans.The high acquisi-tion speed and finer scan grid allow a high degree ofaccuracy and more detailed maps.
The calculation of the average thickness withgrids and quadrants is improved by new software thatcorrects for artifacts, such as those created by mediaopacity or markedly altered macular morphology(Figures 23, 24).
With this technology, we can determine RNFLthickness and the profile of each scan, compare theaverage RNFL thickness to a normal age-matched pop-ulation, and create a map of the RNFL.RETINAL VOLUME
In addition to creating a retinal thickness map, thespectral domain OCT software calculates the retinalvolume for each map.This is important for following
the progression of edema or a serous detachment, ei-ther the natural history or after laser or surgical inter-vention. This technology is indispensable for study-ing the effects of pharmacological intervention.
DATA SYNTHESIS
Synthesis is the most important aspect of the diag-nostic assessment, because only a complete analysisof all data will produce a precise, well-founded diag-nosis.
In the overall evaluation, the clinician also mustuse data that is not directly associated with OCT. Fac-tors such as the patient’s age, current health status,general and ocular health history, visual acuity, ocularstatus via clinical examination,and additional studies,such as fluorescein angiography and indocyaninegreen angiography,are important.
It is essential to study angiograms at all time se-quences and to compare them with the analyzed ele-ments of hyper- and hyporeflectivity,and morphologi-cal factors, retinal thickness, the retinal map, and vol-umetry. It is also important to anatomically locate thehypo- and hyperref lective structures. Data onchoroidal or retinal pathology may be shown that wasnot detected on a fundus photo or isolated scan. Incertain cases,an anomalous ocular fundus may appearnormal on OCT or vice versa. Combining all of theseelements will lead to a true understanding and evalua-tion of OCT studies.
It is also important to study the three-dimensionalviews provided by the 3-D map,C-scan,and RPE-fit im-ages.When these seemingly disparate elements are an-alyzed together, they take on new significance and al-low the global consideration of the ocular disease.
QUANTITATIVE ANALYTICAL STUDYOF THE RETINA
RETINAL THICKNESS• Increased• Decreased• Variations in thickness of a layer(e.g., nerve fibers)
• Retinal map• Volume
Summary Table 10

33
Chapter 3 Interpretation of Pathological Cross-sectional OCT
SUMMARY
Optical coherence tomography has enabled us toexpand our knowledge of ocular disease by showingus pathology that was previously not well known.Thistechnology has helped improve our understanding ofthe structure and pathophysiology of pseudoholes andmacular holes, retinal traction, macular edema, serousdetachments of the retina and RPE,and choroidal neo-vascularization and its evolution after therapy. In addi-tion, it has modified our understanding of retinal dis-ease and its progression, and changed the indicationsfor vitreoretinal surgery.
Spectral domain OCT has helped us improve ourknowledge of congenital retinoschisis, central serousretinopathies, the progression of neovascular mem-branes, and the presentation and progression of mac-
ular dystrophy and atrophic degeneration.In addition,quantitative OCT is important for evalu-
ating the efficacy of photodynamic therapy, classiclaser therapy,and transpupillary thermotherapy.
We believe one of the most important applica-tions for OCT is the evaluation of new therapies,suchas intravitreal and retrobulbar antiangiogenics,and in-travitreal therapeutic implants, and the effects oftherapy in general on ocular pathology. In these cas-es, it helps us to decide if and when we should repeattherapy, according to the degree of retinal edema, fi-brosis, or atrophy.
FIGURE 24. EDEMA.Note the marked increase in retinal thickness, shown numerically and by conventional colors. The software also cal-culates the volume and average thickness of the retina. The 3-D view of the retinal thickness is shown with an alteredILM and a normal RPE.

DATA SYNTHESIS FOR DIAGNOSIS
CLINICAL EXAMINATION (patient’s history, fluorescein angiography, indocyanine green angiography, etc.)
QUALITATIVE ANALYSIS - Morphology
QUALITATIVE ANALYSIS - 3-D
QUALITATIVE ANALYSIS - Reflectivity
QUANTITATIVE ANALYSIS - Thickness Map and Volume
SYNTHESIS DIAGNOSIS
B. Lumbroso, M. Rispoli
34
SD-OCT PROVIDES IMPROVED CLINICAL UTILITY INTHE STUDY OF THE FOLLOWING:
Summary Table 11
• Alterations of the photoreceptors• External limiting membrane• Retinal pigment epithelium• Bruch’s membrane• Retinal map• Macular degeneration• Macular retinoschisis• Acute and chronic retinal epitheliopathy• Traumatic epitheliopathy• Branch vein occlusion• Arterial occlusion• Solar retinopathy• Acute retinitis• White dot syndromes
• Vitreous and epiretinal membrane• Vitreous opacity• Vitreoretinal interface• Cystoid macular edema• Epiretinal membrane• Vitreoretinal traction• Lamellar holes and holes at all thicknesses• Retinal pigment epithelium atrophy• Hyaloidal interface abnormalities• Diffuse edema• Syndromes of the vitreoretinal interface• Macular pucker• Diabetic retinopathy
Summary Table 12

35
Chapter 3 Interpretation of Pathological Cross-sectional OCT
QUALITATIVE ANALYTICAL STUDYHYPOREFLECTIVITY
Optically Blank Spaces• Cysts, microcysts, cavities• Intraretinal edema• Exudative detachments of theneuroepithelium
• Cystoid macular edema• RPE detachments• RPE hypopigmentation
Summary Table 13
QUALITATIVE ANALYTICAL STUDYBOUNDARIES OF RPE DETACHMENTS
• Regular rounded• Single or multiple• Irregular• Smooth• Bumpy
Table 14


A new and important aspect of spectral domainoptical coherence tomography (SD-OCT) is its abilityto produce three-dimensional (3-D) and frontal orcoronal (en face) images adapted to the scleral cur-vature. With these images, global evaluation of ab-normalities is simpler than with two-dimensional B-scan studies.
Using SD-OCT,we can choose from four views:a 3-D image,a 2-D cross section,a C-scan (i.e., flat en facesections of the retina), or the RPE-fit display, whichcompares a patient’s retinal pigment epithelium(RPE) to a normal parabolic RPE, enabling us to de-tect variations from normal.
3-D STUDIES
To acquire a 3-D study of a macular cube, the in-strument performs multiple scans at high resolution.Serial acquisition of B-scans for the retinal map pro-vides a true representation of tissue for measurementand cross-sectional analysis.Three-dimensional im-ages of the principal structures on which topographi-cal calculation is based are displayed on screen.Thestudy shows a cross section of retinal tissue, with theimage of the fundus aligned below it (Figures 1A-1E).
It takes 1.6 seconds to acquire 200 horizontalscans (B-scans) with 200 scan lines each on the Y axis(A-scans).Average foveal thickness is 160 to 180 mi-crons, so the theoretical resolution of the A-scananalysis is less than 4 microns.
The 3-D images can be displayed in different analy-sis formats.The most widely used is the MacularThickness Analysis.The graphic on the right side ofthe macular map in the Macular Thickness Analysisshows the distance between the internal limitingmembrane (ILM) and the RPE,using a cold/warm col-or scale to differentiate the measure of thickness. Be-low that are the segmented layers of the ILM (paleblue) and the RPE/choriocapillaris complex (brownor cream) (See page 52, Fig 2).
These images can be studied independently or incombination with the 3-D color map of the retina.Aprecise point of the B-scan where the lesion is locat-
ed can be selected and rotated for display.These images are useful for qualitative study of the
pathology of the vitreoretinal interface, macular de-generation, and significant lesions, such as RPE atro-phy, as they appear in the B-scan.They also have greatdidactic value for explaining how lesions present.
C-SCAN BY OCT
In the Advanced Visualization Analysis, it is possi-ble to study the coronal or C-scans.These imagesshow clinically important views, allowing us to plotthe axial images (B-scans) over areas not routinely ex-plored.
C-SCAN (EN FACE) BY SPECTRAL DOMAIN OCT
Spectral domain OCT technology can calculateand reconstruct C-scans from the acquired macularcube.The starting point is the acquisition of a macu-lar cube image,usually with the 512x128 protocol.Anadvanced calculation function aligns and extracts thecoronal planes from the cube.
The analysis of a classic (planar) C-scan operatesdirectly on a reference B-scan moving along a planehorizontal to the tissue, displaying the correspon-ding C-scan on a different area of the monitor (Fig-ures 1E and 4).
RPE-FIT FUNCTION
The RPE-fit function of the Cirrus™ HD-OCT is aninteresting and important innovation to advance ourunderstanding of ocular pathology. It provides an im-proved C-scan adapted to the retinal curvature.Withit,we can obtain en face images that follow the curva-ture of the posterior pole (Figures 3, 5, 6)
The RPE-f i t software identif ies theRPE/choriocapillaris complex and displays it as acurved 3-D section plane.The RPE-fit technology isadapted to the concavity of the RPE/choriocapillaris.
37
Chapter 4
VISUALIZING OCULAR STRUCTURESIN THREE DIMENSIONSSpectral domain OCT provides virtual in vivo 3-D dissection foranalysis and interpretation of retinal pathology.

B. Lumbroso, M. Rispoli
38
The transverse sections follow the shape of theglobe,so that an RPE-fit layer is the virtual representa-tion of an ideally parabolic RPE.This parabolic curveis normal for the eye studied and is a function of thecomplex curvature of the globe.
To obtain a more precise image, we can select thethickness of a section from 2 to 20 microns, depend-ing on our needs for clinical study.Thin sections arecalled slices; thicker sections are called slabs.
Increasing the thickness of the RPE-fit section re-duces the sensitivity of the technique but allows thestudy of deviations over a larger area.This mode pro-vides an optimal display of the choroid. By changingthe thickness of the section,we can display the medi-um and large blood vessels of the choroid with preci-sion (Figures 7C-H, 8C-H, 9B-E)).
READING NORMAL C-SCAN CROSS-SECTIONS
One of the challenges in interpreting a C-scan isthat it is a flat image of a concave structure. In addi-tion, the thickness of the retina is not consistent,par-ticularly near the foveal depression.The normal reti-nal surface has an irregularly undulating profile overthe entire posterior pole, not only at the foveal de-
pression.Thus,a horizontal surface scan can easily in-volve the layers of the nerve fibers and the foveal de-pression (Figure 4).
With the Cirrus™ HD-OCT, we can study a patho-logic lesion on a plane parallel to the RPE and ob-serve the histological peculiarities relative to the dis-ease in question. In a normal C-scan, the structuresare often obliquely sectioned.The variations in tilt ofthe retina in relation to the coronal plane contributeto alterations in image orientation.This modality is ex-tremely sensitive to small inclinations of the eye,which can cause marked variations in the images.
CONCAVITY OF THE POSTERIOR POLE
As the flat C-scan moves deeper during a coronalexamination, we first see the superficial retinal layersin the periphery, then the foveal depression, whichforms an irregular circle connected to the temporalpart of the posterior pole. Given the concave shapeof the retina, a horizontal section will involve multi-ple retinal layers, from the ILM and the RNFL to themore interior layers of the photoreceptors, the RPE,and the choroid (Figures 2-4).
We continue to explore the full utility of 3-D stud-
FIGURE 1A. COLOR B-SCAN OF AN EYE AFFECTED BY INCIPIENT AMD, NUMEROUS DRUSEN, AND RPE DETACHMENTS.The RPE thickness is slightly irregular with undulations formed by the drusen. The IS/OS junction is slightly irregularand altered at several points. The external limiting membrane is slightly altered, as is the thickness of the externalnuclear layer. The drusen are slightly reflective. At some points where the RPE is detached, Bruch’s membrane can beseen. In Figures 1B-1E, a 3-D cube of tissue relative to this scan is shown.
A

39
Chapter 4 Visualizing Ocular Structures in Three Dimensions
FIGURES 1B-E. 3-D STUDY OF A RETINAL CUBE RELATIVE TO AMD WITH NUMEROUS DRUSEN.Figures 1B and 1C: These images are rotated to show different sides of the cube. Slices relative to the RPE elaborated bythe software have been integrated with the cube. Integrations of other slices are also possible.Figure 1D: The 3-D cube has been sectioned to remove part of the retina. The cube can be sectioned along the X-Y-Zaxes. The color and transparency can be adjusted for better visualization of the deep and superficial layers.Figure 1E: This graphic represents a frontal (transverse) C-scan section grazing the RPE, which sections the drusenalong the epithelial slice.
B C
D E

B. Lumbroso, M. Rispoli
40
ies of retinal pathology, but already we recognizehow our understanding of certain diseases can be im-proved. We can now view vitreal and vitreoretinalchanges and identify the resulting distortion in themacula.We also can see the characteristics of tangen-tial or posterior traction, such as cellophane macu-lopathy and macular pucker with centripetal trac-tion, either constant or intermittent (Figures 11A-B).
In cystoid macular edema,the RPE-fit enables us tomeasure pseudocysts and evaluate their topographyto determine if they are circular or irregular withinthe fovea.The C-scan allows us to determine the num-ber, dimensions, and topography of pseudocystswithin a macular or lamellar hole at any thickness(Figures 10A-B). There are, in fact,differences whichmust be examined in depth.
Serous detachments of the RPE reveal that,accord-ing to the etiology, the borders are more or less regu-lar, smooth or irregular, rounded or polyoblate.Thus,we can evaluate the thickness of the borders of thedetachment (Figures 12A-D).
FIGURE 2. C-SCANS. 3-D VIEW OF THE OCULAR FUNDUS.The posterior pole is shaped like a bowl, and the foveal area is shaped like a volcano. The C-scans are flat, sectioningthe curvature of the posterior pole and showing a bean-shaped depression at the posterior pole and a rounded areanear the fovea.

41
Chapter 4 Visualizing Ocular Structures in Three Dimensions
FIGURE 3. TRANSVERSE SECTIONS ADAPTED TO THE CURVATURE OF THE FUNDUS.The retina is shown frontally, sectioned by scans following the average curvature of the posterior pole of the eye(RPE-fit). We can see the posterior retina and three slices adapted to the concavity of the RPE/choriocapillaris. Thus,we can see transverse scans (slices or slabs) that are not flat, but follow the curved shape of the eye.
FIGURE 4. Cross section of posterior pole and optic nerve,sectioned by four planes crossing the fovea.
FIGURE 5. Cross section of posterior pole and optic nerve,sectioned by four concave slices adapted to the averagecurvature of the RPE.
FIGURE 6. NORMAL RPE-fit.Cirrus™ HD-OCT software uses the vitreoretinal interface as an internal marker and successively calculates the averagecurvature of the external marker. In this mode, an ideal concave surface is created, which slices and shows all retinallayers. The thickness of the slice can be adjusted to eliminate small artifacts, which can reduce sensitivity.

B. Lumbroso, M. Rispoli
42
FIGURE 7A. MACULAR PUCKER.The 3-D cube obtained using the Cirrus™ HD-OCT software shows the ILM. It is assumed that under a superficialmembrane, there are striae radiating out from the center. The retraction of the ILM causes vitreoretinal tractiontoward the center, with formation of radial retinal folds.
FIGURE 7B. This illustration shows the ILM covering the posterior pole, the vitreoretinal adherence and the radialretinal folds.
A
B

43
Chapter 4 Visualizing Ocular Structures in Three Dimensions
FIGURES 7C-G. FRONTAL (TRANSVERSE) SECTION ADAPTED TO THE RPE CURVATURE.These concave sections follow the average curvature of the posterior pole of the eye imaged in Figure 7A. Five frontalconcave sections have been captured a few microns apart, starting from the vitreous and moving deeper to the fullthickness of the retina. These sections are not flat but adapted to the curvature of the RPE/choriocapillaris (RPE-fit).These show the radial aspect of the folds with traction toward the center.
C D E
F G

B. Lumbroso, M. Rispoli
44
FIGURE 8A. ANTEROPOSTERIOR VITREORETINAL TRACTION – 3-D CUBE.This cube has been sectioned to show the vitreous with vitreoretinal traction and the superficial film of the ILM. A partof the deep retina has been removed.
FIGURE 8B. This illustration shows the posterior vitreous creating traction on the retina and the vitreoretinal adher-ences. Three frontal (transverse) sections have been designated, sectioning the vitreous and retina at various levels,showing the rings formed by the vitreal traction. The rings become progressively smaller as they approach the fovea.
A
B

45
Chapter 4 Visualizing Ocular Structures in Three Dimensions
FIGURES 8C-H. ANTEROPOSTERIOR VITREORETINAL TRACTION – FRONTAL SECTIONS ADAPTED TO THE RPECURVATURE.These images correspond to the eye in Figure 8A. These six frontal sections are adapted to the curvature of theRPE/choriocapillaris (RPE-fit). They begin in the vitreous and move toward the choroid. The ring formed by the vit-real traction, the direct traction on the retina, and the hole forming deeper into the retina are shown. In the deepestlayer, small radial cavities formed by the vitreal traction on the retinal tissue are shown.
C D E
F G H

B. Lumbroso, M. Rispoli
46
FIGURE 9A. B-SCAN OF STAGE IV MACULAR HOLE.In this cross-section of a full-thickness macular hole, we can see the ILM and the IS/OS junction at the bottom. The di-ameter of the hole is smaller toward the vitreous, and it widens as it extends toward the RPE, giving it the classic anvilform. Small cysts occupy the internal and external nuclear layer. The external cystic formations are long and irregu-lar. The cystic formations at the internal nuclear layer are small and irregular.

47
Chapter 4 Visualizing Ocular Structures in Three Dimensions
FIGURES 9B-E. MACULAR HOLE – FRONTAL SECTIONS ADAPTED TO THE RPE CURVATURE.These images correspond to the eye in Figure 9A. They show four levels of the macular hole, starting in the vitreousand moving toward the choroid.Figure 9B is a superficial view, showing the regular, rounded macular hole, surrounded by a ring of cystoid edemaand a half-ring concentric with the hole.Figure 9C, a deeper section, shows the central hole with thicker boundaries surrounded by two rings of cystoid edemacells. These rings are independent of one another with no contact between the cells of the two rings.At an even deeper level (Figure 9D), the central hole is still visible with thick boundaries and two rings of edematouscells. The section appears as a hyperreflective surface without edematous lesions.The last section (Figure 9E) is close to the RPE level. The macular hole is wider here than in the superficial sections. Acentral ring of cystoid edema can be seen surrounding the hole, and the cells of the cystoid edema clearly are in con-tact with one another. The cells have a radial aspect, starting from the center. The central hole has a rounded, thickboundary, probably representing the ILM and the IS/OS junction. The ILM and the IS/OS junction are raised and sec-tioned transversely in the shape of a crown.
B
ED
C

B. Lumbroso, M. Rispoli
48
FIGURE 10A. LAMELLAR HOLE.This is a 3-D representation of the retinal cube, showing the ILM.
FIGURE 10B. LAMELLAR HOLE.Shown here are frontal RPE-fit sec-tions, moving from the vitreous to-ward the choroid. We can see the ir-regular form of the hole, with thepresence of cells that resemble aretinoschisis more than a true hole.The edges of the lamellar hole appearas fine lines in the coronal section.

49
Chapter 4 Visualizing Ocular Structures in Three Dimensions
FIGURE 11C. PARALLEL FRONTALSECTIONS ADAPTED TO THE RPECURVATURE.These sections are not flat, butadapted to the curvature of theRPE/choriocapillaris by the RPE-fitfunction. The frontal sections beginat the surface and terminate at theRPE, showing the parallelism of thefolds.
FIGURES 11A-B. CHOROIDAL FOLDS IN AN EYE WITH HYPOTONY.A: Internal limiting membrane. Parallel horizontal retinal folds are visible.B: Three-dimensional retinal cube with total removal of the internal retina, showing RPE layer with choroidal folds.
A B

B. Lumbroso, M. Rispoli
50
FIGURE 12B-D. RPE DETACHMENT IN AMD PATIENT. FRONTAL SECTIONS ADAPTED TO THE RPE CURVATURE.These images correspond to the eye shown in Figure 12A. The serous detachment has been sectioned, starting from theretinal surface and moving toward the choroid.Figure 12B, a superficial section, shows the thickened, irregular boundary, with small spikes penetrating the interiorof the detachment.Figure 12C, a deeper section, shows the boundary irregularly thickened in some areas and thinner in others. Insidethis, a hyporeflective area represents a small serous detachment of the epithelium.Figure 12D, a section that passes radially through the RPE, shows the greater irregularity of the base of the detachment.
B C D
FIGURE 12A. RPE DETACHMENT IN AMD PATIENT.The retinal cube has been sectioned to show the RPE detachment.

51
Chapter 5
RETINAL TOPOGRAPHYWITH SPECTRAL DOMAIN OCTSpectral domain OCT technology has significantly advancedthe study of retinal topography.
Topography scans obtained with time domain op-tical coherence tomography (OCT) were producedusing two modes, which have some limitations.Thefirst mode was based on the acquisition of six radialB-scans centered on a fixation point.The softwaredrew two segmentation lines on the OCT scan,whichtraced the retinal structure at the vitreoretinal inter-face and the retinal pigment epithelium (RPE).Timedomain instruments successively calculated thethickness between these six radial scans, interpolat-ing the space between the scans.These calculationswere accurate near the center, but sensitivity de-creased toward the periphery of the scan as the spac-ing between the radial lines decreased.Another limi-tation of this procedure was that the junction of theradial scans sometimes was misaligned because its lo-cation depends on the stability of the patient’s fixa-tion and degree of cooperation.
In comparison, spectral domain OCT technologyproduces scans with better resolution and in lesstime1,2, thus it is possible to apply a topographical ac-quisition algorithm that is more sensitive and morereliably repeatable. Using a series of close horizontalscans, it is possible to construct a three-dimensional(3-D) cube of the retina with resolution that is direct-ly proportional to the acquisition time for each B-scan.
SPECTRAL DOMAIN PROTOCOLSThe Cirrus™ HD-OCT has two commonly used
protocols for retinal imaging, 512x128 and 200x200.The latter is faster and gives good resolution for mostpathologies.The 512x128 protocol analyzes 128 hori-zontal scans at high resolution (512 A-scans per B-scan).This enables the identification of the retinal in-frastructure in far greater detail than can be achievedwith t ime domain technology. The
RPE/choriocapillaris complex, for example, is notcomprised of two hyperreflective bands, but ratherthe external limiting membrane, the junction of theinternal and external segments of the photoreceptors(IS/OS junction), a hyporeflective band, and the com-plex consis t ing of the RPE andBruch’s/choriocapillaris membrane.The software andother calculation functions ensure the correct posi-tioning of the external markers for analysis of the reti-nal map.
From the retinal cube, it is possible to extrapolatea thickness map with reference between the ILM andthe RPE and the 3-D profile of the ILM and the RPEtaken individually.
Using a more precise measurement in the contextof the retinal map, the ETDRS grid is superimposedon the fundus image,automatically and precisely cen-tered on the fovea.Average thickness values for eachsector are indicated numerically and by a color scale.The color map has variable transparency when super-imposed on the fundus image.
To complete the topographical study, there is theoption of extracting the horizontal and vertical B-scans that cross any point on the map to evaluate alesion that causes topographical alterations. In thiscase, the horizontal scan is one of those used by theOCT to produce the map, while the vertical scan isreconstructed from the horizontal A-scans (Figures1-3). In the 200x200 protocol, the vertical and hori-zontal scans have equal resolution. In the 512x128protocol, the vertical scan has lower resolution.

B. Lumbroso, M. Rispoli
52
FIGURE 2. NORMAL MAP.The screen for the retinal map provides numerous data. A false-color representation of the macular area is subdi-vided into sectors, showing average thickness for each sector. Near this are high-resolution horizontal and verticalscans and a display of the OCT fundus image. On the right of the screen are three layer maps: the ILM-RPE, displayingthe retinal thickness in three dimensions, and the ILM and the RPE separately to facilitate evaluation of changes inthe corresponding layer.
FIGURE 1. RETINAL CUBE.Part of the tissue is removed to show the cross section ofa retinal section.

53
Chapter 5 Retinal Topography With Spectral Domain OCT
FIGURE 3. PARTIALLY ATROPHIED RETINA.On the right of the screen, three maps correspond to three distinct layers. The ILM-RPE display the retinal thickness inthree dimensions. The ILM layer and the RPE layer facilitate evaluation of changes.
References1. Gupta V, Gupta P, Singh R, Dogra MR, Gupta A. Spectral-do-main Cirrus high-definition optical coherence tomography isbetter than time-domain Stratus optical coherence tomographyfor evaluation of macular pathologic features in uveitis. Am J
Ophthalmol 2008;146:626-627.2. Leung CK, Cheung CY, Weinreb RN, Lee G, Lin D, Pang CP, LamDS. Comparison of macular thickness measurements betweentime domain and spectral domain optical coherence tomogra-phy. Invest Ophthalmol Vis Sci 2008;49:4893-4897.


55
Chapter 6
SD-OCT FOR THE STUDYAND MANAGEMENT OF GLAUCOMASpectral domain OCT provides important data toguide clinical decision-making
Optical coherence tomography (OCT) con-tributes to our ability to manage glaucoma by provid-ing important qualitative and quantitative data. It en-ables us to study the morphology and morphometryof the optic disc and the peripapillary nerve fibers.Even using first-generation OCT, the direct measure-ment of the thickness of the retinal nerve fiber layer(RNFL) enables in vivo visualization of retinal sec-tions. Numerous studies have shown a correspon-dence between OCT measurements and histologicalmeasurements.1-3 For this reason, clinicians are study-ing RNFL thickness more frequently to aid in early di-agnosis of glaucoma and to obtain an accurate assess-ment of disease progression.
The Cirrus™ HD-OCT spectral domain technologyis further advancing the study of glaucoma. It employsa simple, easy-to-use system that allows us to preciselycapture and clearly display information about the peri-papillary area and the RNFL.
OPTIC DISC SCAN
The Cirrus™ HD-OCT scan of the optic disc cap-tures a 6x6-mm cube, which is formed from 200 A-scans for each of 200 B-scans.The area within the6x6-mm area is segmented for analysis.
From this cube of data, the machine automaticallyidentifies the center of the disc and creates a 3.46-mm calculation circle around the disc.The RNFLthickness along this peripapillary circle is analyzedand compared to normative data.Even if the scan wasnot centered on the optic disc, the RNFL circle analy-sis will be centered automatically, assuring preciseregistration and excellent repeatability.
NORMATIVE DATABASES
The RNFL normative database helps us identify ar-eas of clinical interest by comparing patients’ RNFL
thickness measurements with age-matched normalsubjects.The normative data comparison is availablefor patients over 18 years of age.
The normative database uses color to indicate thenormal distribution percentiles among individuals ofthe same age,as follows:
• Red:The lowest 1% of normal measurements fallwithin the red zone.These readings are consid-ered outside normal limits.
• Yellow: The lowest 5% of normal measurementsfall within or under the yellow zone.
• Green: 90% of all normal measurements fallwithin the green zone.
The highest 5% of measurements fall within thewhite area.
When interpreting the normative data,we must re-member that for each measurement, 1 in 20 normaleyes (5%) will fall below the green zone.
SIGNAL STRENGTH
The Signal Strength Value,which applies to the en-tire scan, ranges from 0 to 10, with 10 being maxi-mum signal strength.Values less than 6 indicate thesignal strength is below expectations.
With some patients, however, a high signals trength may not be poss ible , so the opera -tor/clinician should review the scan and analysis todetermine if it is acceptable.
FUNDUS IMAGE
The line scanning ophthalmoscope (LSO) fundusimage with OCT fundus image overlay is displayed atthe top of the RNFL analysis screen or printout.The lo-cation of the calculation circle for the temporal,superi-or, nasal, inferior, temporal (TSNIT) analysis is shownin red.The operator can reposition the circle for analy-sis after scan acquisition, but this usually is not neces-

B. Lumbroso, M. Rispoli
56
sary because the automatic centering is accurate.TheB-scan image shown is the calculation circle extractedfrom the cube of data and adjusted to aTSNIT orienta-tion.
RNFL THICKNESS MAP
The RNFL thickness map is based on data calculat-ed over the entire cube. Using a color scale similar tothat of a topographical map – cool colors representthinner areas and warm colors represent thicker ar-eas – it shows RNFL thickness at each point withinthe 6x6-mm area.The maps exclude the optic disc,which is displayed in dark blue.The color code ex-presses the thickness from zero (blue) to 350 mi-crometers (white).
Deviation mapThe deviation map compares the patient’s RNFL
thickness versus normative data. Data points that areoutside normal limits are shown in red and yellow asdescribed above.
Average thickness valuesThe RNFL thickness along theTSNIT calculation cir-
cle is also illustrated numerically in chart format.Theaverage thickness for all points along the calculationcircle is shown for both eyes.Average thickness is alsoshown for each quadrant and for the clock hours. Ineach of these charts, the patient’s values are comparedto normative data.The data table calls out symmetry,which is also compared to normative data.
TSNIT THICKNESS PROFILES
The TSNIT profiles show RNFL thickness at eachposition along the peripapillary analysis circle andcompare these measurements with a normative data-base. They are color-coded (white, green, yellow, red)for comparison with the normative RNFL data for
subjects of the same age. A graph showing RNFLthickness for both eyes highlights asymmetry (Figure3).
SUMMARY OF RESULTS
The results of the glaucoma analysis are presentedin a table for easy at-a-glance assessment(Figure 1). Inthe first row at the top are the images of the fundusand the B-scan of the tissue relative to the peripapil-lary circle. In the second row are the relative maps ofthe thickness of the nerve fibers, and next to them,the relative maps of the difference between the nor-mal thickness and the thickness found in the exami-nation (deviation map).
In the third row are the circles showing the thick-ness of the nerve fibers in the quadrants.In the fourthrow, the thickness of the fibers is shown in micronsin a colored table, where we can easily see if thecurve is within or outside normal limits. Data for theright eye are shown on the left,and for the left eye onthe right.
In the fourth row, a graphic combines the curvesof the RNFL thickness of the right eye and those ofthe left eye, showing their difference.
IMPORTANT DIAGNOSTIC TOOL
The Cirrus™ HD-OCT enables us to obtain anddisplay numerous data related to glaucomatous dam-age in a clear manner.The study of glaucoma is com-plex, and the information provided by a single instru-ment, however precise, is not sufficient to diagnosemore difficult cases.We must base our diagnoses onall of our clinical examinations, including perimetry(Figures 2-4).
References1. Abbott CJ, McBrien NA, Grünert U, Pianta MJ. Relationshipof the optical coherence tomography signal to underlyingretinal histology in the tree shrew (Tupaia belangeri). InvestOphthalmol Vis Sci. 2009;50:414-423.2. Chen TC, Cense B, Miller JW, et al. Histologic correlation of
in vivo optical coherence tomography images of the humanretina. Am J Ophthalmol. 2006;141:1165-1168.3. Gloesmann M, Hermann B, Schubert C, Sattmann H,Ahnelt PK, Drexler W. Histologic correlation of pig retina radialstratification with ultra high-resolution optical coherence to-mography. Invest Ophthalmol Vis Sci. 2003;44:1696-1703.
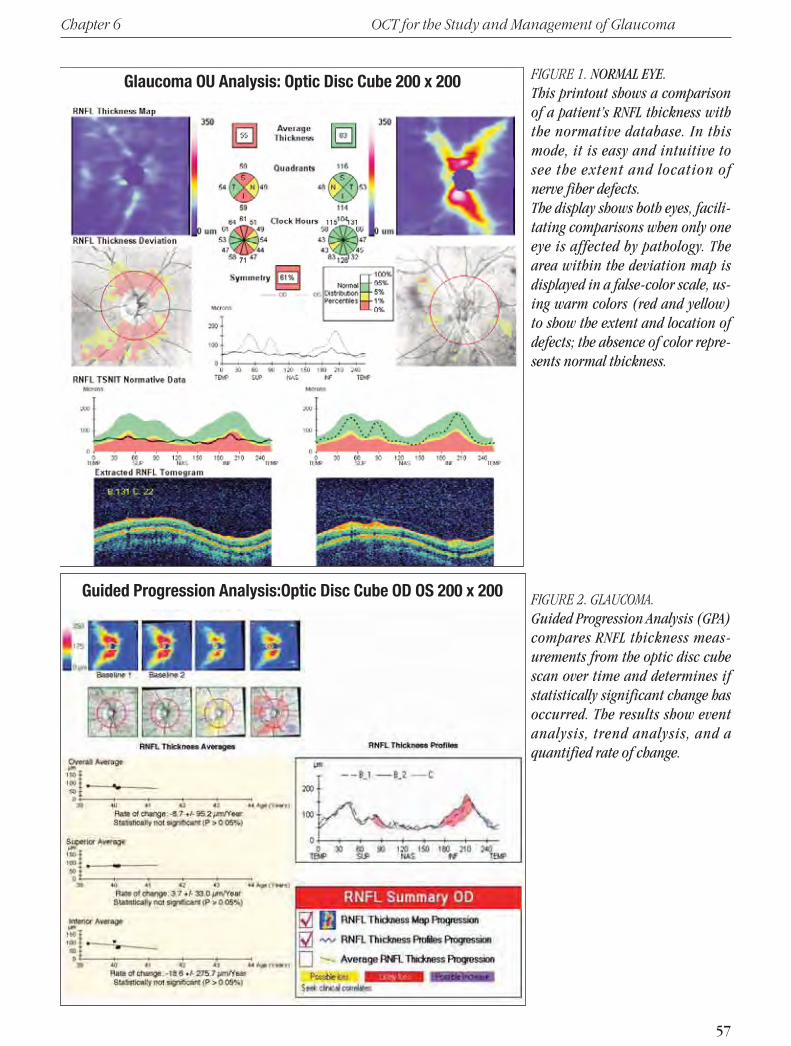
57
Chapter 6 OCT for the Study and Management of Glaucoma
FIGURE 1. NORMAL EYE.This printout shows a comparisonof a patient’s RNFL thickness withthe normative database. In thismode, it is easy and intuitive tosee the extent and location ofnerve fiber defects.The display shows both eyes, facili-tating comparisons when only oneeye is affected by pathology. Thearea within the deviation map isdisplayed in a false-color scale, us-ing warm colors (red and yellow)to show the extent and location ofdefects; the absence of color repre-sents normal thickness.
FIGURE 2. GLAUCOMA.Guided Progression Analysis (GPA)compares RNFL thickness meas-urements from the optic disc cubescan over time and determines ifstatistically significant change hasoccurred. The results show eventanalysis, trend analysis, and aquantified rate of change.
Guided Progression Analysis:Optic Disc Cube OD OS 200 x 200
Glaucoma OU Analysis: Optic Disc Cube 200 x 200

B. Lumbroso, M. Rispoli
58
FIGURE 4. VISUAL FIELDS OF BOTH EYES RELATIVE TO FIGURE 3.The visual field defects correspond with the RNFL deviations shown by the Cirrus™ HD-OCT scan.
FIGURE 3. GLAUCOMA.When compared with the normative database, this patient’s RNFL thickness values for the right eye are almost en-tirely in the green zone, while values for the left eye are within the yellow and red pathological zones. The deviationmap uses warm colors (red and yellow) to show the extent of the deficit in the left eye. These RNFL defects must becompared with the visual fields, as shown in Figure 4.

In Part 2 of this handbook, we present reference cases and examples of the
data that can be obtained via spectral domain optical coherence tomography.
These cases are from our clinical observations in which areas of hyperreflectivity
and hyporeflectivity are identified, studied, and associated with various
syndromes.
The cases presented first in this section are more frequently encountered.
They are followed by more uncommon and complex cases.
• Vitreous and Pathologies of the Vitreoretinal Interface p. 61
• Macular Degeneration p. 67
• Diabetic Retinopathy p. 75
• Vascular Occlusion of the Retina p. 80
• Retinal Epitheliopathy p. 84
• Cysticercosis p. 89
• Vogt-Koyanagi-Harada Syndrome p. 91
• Complex Cases p. 93
PART TWO
CLINICAL REFERENCE CASES
Introduction
Contents
59


CHANGES IN THEVITREORETINAL INTERFACE
• Macular pucker• Anteroposterior traction• Macular hole and pseudohole• Retinoschisis• Syndromes of the interface in diabeticretinopathy
Summary Table 1
VITREOUS OPACITYOpacities of the vitreous are most often associated
with vitreous hemorrhage and posterior vitreous de-tachment. In synchysis scintillans (Figure 1), whichcan occur after trauma, hemorrhage, and inflamma-tion, the vitreous liquefies, and thick crystalline de-posits of cholesterol are present. In asteroid hyalosis(Figure 2), spherical bodies like snowballs of un-known etiology appear in the vitreous.
The syndromes of the vitreoretinal interface varyin severity from simple preretinal membrane to vitre-oretinal traction and macular pucker.
VITREOUS TRACTION
In cases of more consistent vitreous traction, aband of hyperreflective vitreous fluid can be seen, re-sulting from retinal adhesions at one or more points.In these cases, the retinal profile is markedly altered,with a localized increase in retinal thickness and re-duced intraretinal reflectivity, at times surrounding asingle point of traction, indicated by intraretinal ede-ma (Figure 3).
PRERETINAL AND EPIRETINALMEMBRANE, CELLOPHANE MACULOPATHY
Membranes can be adherent or detached at vari-ous points, causing retinal folds. Optical coherence
tomography may show weak reflectivity along theretinal surface, without evidence of changes in thick-ness or intraretinal reflectivity (Figures 4, 5, 6).
MACULAR PUCKER
An epiretinal membrane (ERM) may appear as ahyperreflective band adhering to the internal retinalsurface,with no indication that the retina has separat-ed or that the internal retinal surface has split.A con-sistent increase in reflectivity and extension of theretinal surface is usually seen. Increased macularthickness with a loss of the foveal depression,accom-panied by a somewhat consistent homogeneous anddiffuse reduction in intraretinal reflectivity usually in-dicate macular edema,which may present with a cys-toid aspect (Figure 7).
FULL-THICKNESS MACULAR HOLE
A full-thickness macular hole presents as an ab-sence of foveal neuroretinal tissue.The margins of thehole are thickened and may be slightly detached. In-traretinal reflectivity is reduced because of perilesionalcystoid edema.The foveal retinal operculum alwayspresents in front of the hole with a somewhat hyper-reflective aspect.
With SD-OCT,we can study the vitreoretinal inter-face and evaluate the risk of macular holes forming
VITREOUS AND PATHOLOGIESOF THE VITREORETINAL INTERFACE
Clinical Reference Case
61
TYPES OF PRERETINALAND EPIRETINAL MEMBRANES
• Minimal and translucent• Dense, with a shadowing effect• Detached• Adherent• Macular pucker
Summary Table 2

B. Lumbroso, M. Rispoli
62
in a patient’s other eye based on the presence or ab-sence of traction. Partial detachment of the vitreous,with adherence on the foveal periphery and loss ofthe normal foveal depression often will signal thepotential for a hole.Total detachment of the vitreousimpedes the formation of holes.
The C-scan crosses a full-thickness macular holeand shows a perfectly circular aspect of the hole sec-tion. Data obtained from the C-scan are more com-plete than those obtained using other methods.TheC-scan can be used to evaluate the semicircular formand dimensions of the hole,but above all, it preciselyshows the form and internal location around thehole of the cystoid macular edema (CME) cells.
It appears that the retinal opercula are connectednot only to the superficial retina, but also to the in-ternal limiting membrane (ILM).Three-dimensional(3-D) imaging of the macula enables us to measurethe dimensions and surface of macular holes, partic-ularly when they are irregular.
LAMELLAR HOLEIn partial-thickness macular holes, we can see a
somewhat consistent reduction in foveal retinalthickness, owing to the disappearance of the internalretinal layers.The external layers, in particular the ex-ternal nuclear layer (ENL), the ELM, and the junction
TOPOGRAPHY OF PRERETINAL ANDEPIRETINAL MEMBRANES
• Localized at the macular centers• Decentered• Extend through the posterior pole
CHARACTERISTICS OF TRACTION• Tangential: macular pucker• Centripetal• Anteroposterior with possible macular hole
OUTCOMES OF VITREORETINAL TRACTION• Retinal thickening• Diffuse edema• Cystoid edema• Lamellar hole• Retinal hole• Retinal fold• Hemorrhage• Attenuated blood vessels• Tractional retinal detachment• Retinal tears
Summary Table 3
FIGURE 1. SYNCHYSIS SCINTILLANS.In this eye affected by macular degeneration, small opacities are visible in the vitreous.

63
Clinical Reference Case Vitreous and Pathologies of the Vitreoretinal Interface
FIGURE 2. PRERETINAL OPACITY.A thick, snowball-like preretinal opacity is present in the vitreous a few microns from the retina. This opacity isbound to the retina by fine membranes and forms a shadow on the posterior layers.
FIGURE 3. VITREORETINAL TRACTION.The retinal surface at the fovea is altered by marked traction exerted by the vitreous membrane on the fovea. Underthe retinal surface is an optically blank, irregular cavity. Diffuse retinal edema is also noted.

FIGURE 4. ADHERENT ERM – RETINAL EDEMA.The B-scan shows a hyperreflective, partially detached ERM. There is diffuse retinal edema with a marked increase inthickness at the fovea, where the profile is altered with a convex course. The ELM and the IS/OS junction are normal.
FIGURE 5. ADHERENT ERM – RETINAL EDEMA – FRONTAL SECTIONS ADAPTED TOTHE RPE CURVATURE.This C-scan shows a convex section of the retina in the more internal layers.The scan shows minimal retinal folds formed by the tangential traction exert-ed by the ERM.
between the internal and external segments of thephotoreceptors (IS/OS junction), are well-preserved.This explains why visual acuity is retained.
The cross section shows a rounded but slightly ir-regular hole, and an adjacent cell of cystoid edema(Figures 8A-C).
GASS’S CLASSIFICATIONOF MACULAR HOLES
Stage 1: Diminution and disappearance ofthe foveal depression and presence of a retinalfissure or a cyst under the fovea. It is often pos-sible to discern tangential or horizontal tractionexerted by the posterior hyaloid of the retinalsurface.
Stage 2: The intraretinal cyst has developed,greatly thinning the operculum, which remainsin part but is still adherent.
Stage 3: Full-thickness hole. The operculumis generally, but not always, visible in front of thehole, and retinal edema is noticeable at the mar-gins.
Stage 4: Full-thickness hole, with the pres-ence of cystoid edema in the retinal tissue; themargins of the hole appear rounded with mini-mal detachment.
Summary Table 4
64
B. Lumbroso, M. Rispoli

FIGURE 7. B-SCAN OF MACULAR PUCKER.The scan shows a significantly altered retinal profile. The retina is convex, and the foveal depression is absent; theERM is thick and partially adherent, while at certain points, splits between the membrane and the retina are appar-ent. The retinal thickness is increased by diffuse edema.
65
Clinical Reference Case Vitreous and Pathologies of the Vitreoretinal Interface
FIGURE 6. ADHERENT ERM – RETINAL EDEMA.The retinal section (C-scan) of the underside of the membrane highlights the traction exerted on it and on the retinalfold.

FIGURE 8A. B-SCAN OF LAMELLAR HOLE.The scan shows the absence of the internal layers ofthe retina at the fovea, while the more external lay-ers, the external nuclear membrane, the ELM, andthe photoreceptors are preserved. This explains whyvisual acuity is preserved (20/30). The loss is lessalong the internal layers of the retina in compari-son with the layers below.
FIGURES 8 B-C. LAMELLAR HOLE.Frontal section adapted to the RPE curvature in black and white and color. The lamellar hole seen from the frontexhibits an angular and irregular shape, very different from a full-thickness hole, which usually presents a regularrounded form.
66
B. Lumbroso, M. Rispoli
B
A
C

67
Clinical Reference Case
AGE-RELATED MACULAR DEGENERATION
Age-related macular degeneration (AMD) is eitheratrophic or exudative.Atrophic AMD is more preva-lent than exudative forms with neovascular mem-branes. Exudative or “wet”AMD may involve intrareti-nal retinal angiomatous proliferation (RAP) or anasto-moses and polypoidal angiomatosis choroidopathy.Optical coherence tomography plays an importantrole in guiding treatment decisions.
EXUDATIVE FORM – NEOVASCULAR MEMBRANES
Neovascular membranes appear as one or moremasses with irregular, nonhomogeneous reflectivity.They are usually slightly hyperreflective but withmore reflective points. It is often difficult to see theneovascular vessels themselves.What can be seeneasily is the fibrosity and irregularity of the retinalpigment epithelium (RPE), which appears irregularand thickened.
MEMBRANE LOCATION
In classic neovascularization, illustrated in Figure1, the OCT examination usually shows a hyperreflec-tive mass that extends above the RPE, raising the neu-roretina (Figures 2A, 2B). Retinal edema and smallserous detachments of the neuroretina are visible.When neovascular membrane is present, numeroushyperreflective dots are seen frequently at the ENLand the IS/OS junction.
Classic neovascular membranes may be locatedabove the RPE but, at times, they form a body withthe distorted RPE and penetrate the thickness of theretina.
Occult neovascular membranes, in general, are lo-cated between the RPE and Bruch’s membrane.They can cast a shadow on the posterior layers (Fig-ures 3-4).
In more advanced cases,the RPE and Bruch’s mem-brane are distorted or disrupted, and the neovascularvessels penetrate the retina.At this level, the line cor-responding to the junction between the internal andexternal segments of the photoreceptors generallydisappears.There is a marked decrease in the thick-
ness of the layer of the nuclei of the photoreceptors(the ENL).
If there is a detachment, the RPE and classic or oc-cult membranes are generally located at the marginsof the RPE detachment.When neovascular vesselsseem to be in the center of the RPE detachment, thisis generally an intraretinal anastomosis.
Small hyperreflective points are found within theneovascularization. In cases of anastomosis, there is al-ways localized dissociation of the deeper layers.
SIGNS ASSOCIATED WITHACTIVE NEOVASCULARIZATION
Retinal edema, at times cystic, and somewhat siz-able serous detachments of the neuroretina are usual-ly present in areas of active neovascular membrane.The high resolution of SD-OCT allows precise imag-ing of minute areas of intraretinal or subretinal fluid.Small hyperreflective points near the neovasculariza-tion may be signs of inflammation (Figure 8).
SEROUS RPE DETACHMENTS
It is important to study the content of a serousRPE detachment to determine if it is vascularized orfibrotic. In fibrovascular RPE detachments, there ismarked hyperreflectivity, and the serous detachmentis partially organized (Figures 5-7).
ATROPHIC MACULAR DEGENERATION
In atrophic macular degeneration, the more preva-lent form of AMD, the choriocapillaris and the
MACULAR DEGENERATION
SIGNS ASSOCIATED WITHACTIVE NEOVASCULARIZATION
• Retinal edema• Serous retinal detachment• Hyperreflective points near theneovascularization
Summary Table 1
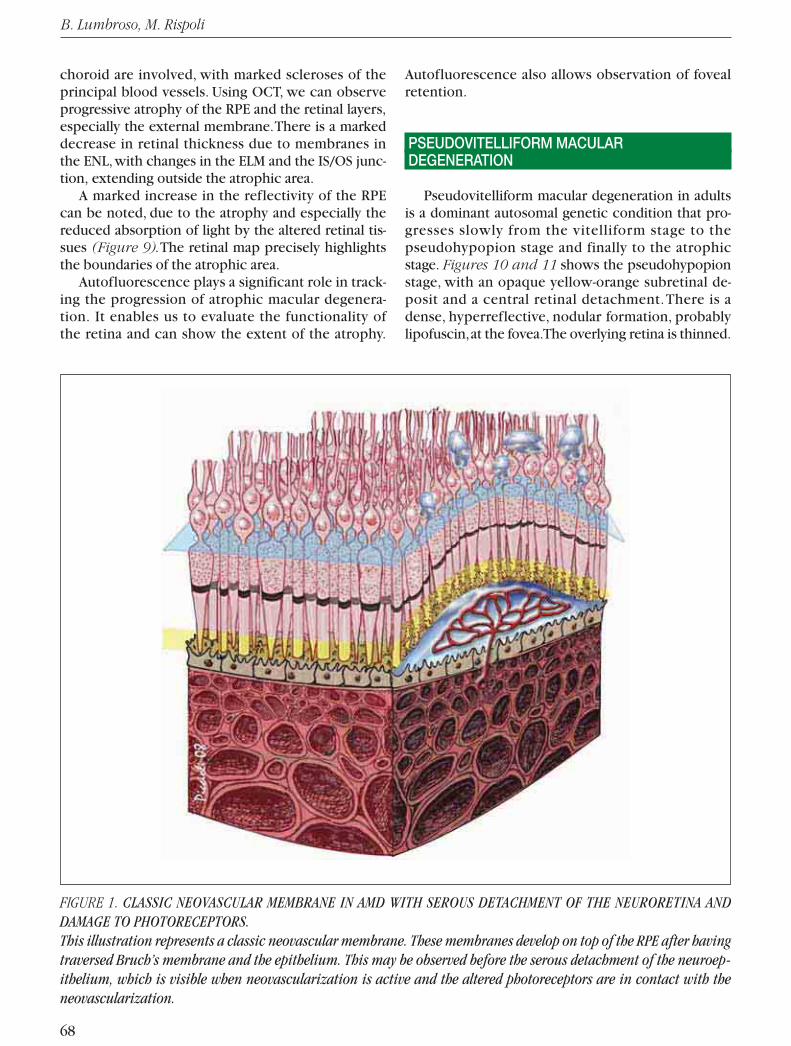
B. Lumbroso, M. Rispoli
68
choroid are involved, with marked scleroses of theprincipal blood vessels. Using OCT, we can observeprogressive atrophy of the RPE and the retinal layers,especially the external membrane.There is a markeddecrease in retinal thickness due to membranes inthe ENL,with changes in the ELM and the IS/OS junc-tion, extending outside the atrophic area.
A marked increase in the reflectivity of the RPEcan be noted, due to the atrophy and especially thereduced absorption of light by the altered retinal tis-sues (Figure 9).The retinal map precisely highlightsthe boundaries of the atrophic area.
Autofluorescence plays a significant role in track-ing the progression of atrophic macular degenera-tion. It enables us to evaluate the functionality ofthe retina and can show the extent of the atrophy.
Autofluorescence also allows observation of fovealretention.
PSEUDOVITELLIFORM MACULARDEGENERATION
Pseudovitelliform macular degeneration in adultsis a dominant autosomal genetic condition that pro-gresses slowly from the vitelliform stage to thepseudohypopion stage and finally to the atrophicstage. Figures 10 and 11 shows the pseudohypopionstage, with an opaque yellow-orange subretinal de-posit and a central retinal detachment.There is adense, hyperreflective, nodular formation, probablylipofuscin,at the fovea.The overlying retina is thinned.
FIGURE 1. CLASSIC NEOVASCULAR MEMBRANE IN AMD WITH SEROUS DETACHMENT OF THE NEURORETINA ANDDAMAGE TO PHOTORECEPTORS.This illustration represents a classic neovascular membrane. These membranes develop on top of the RPE after havingtraversed Bruch’s membrane and the epithelium. This may be observed before the serous detachment of the neuroep-ithelium, which is visible when neovascularization is active and the altered photoreceptors are in contact with theneovascularization.

Clinical Reference Case Macular Degeneration
69
FIGURE 2A. B-SCAN OF CLASSIC NEOVASCULAR MEMBRANE.The retina is deformed by the neovascular membrane, which is forming a localized detachment of the retina. Thisclassic membrane forms a hyperreflective mass with an irregular and nonhomogeneous shape located in the poste-rior pole. Above the lesion, small cells of incipient cystoid edema and small hyperreflective points in the deep retinaare observed. Around the membrane, between the RPE and the neuroretina, a serous retinal detachment is seen. In-cipient cystoid edema, hyperreflective points, and serous retinal detachment are the classic signs that indicate anactive membrane. The ELM and the IS/OS junction are easily visible. Bruch’s membrane is also interrupted at thearea of the neovascularization.
FIGURE 2B. CLASSIC NEOVASCULAR MEMBRANE –FRONTAL SECTION ADAPTED TO THE RPE CONTOUR.This RPE-fit image, slightly anterior of the RPE,shows a serous detachment of the retina aroundthe neovascularization. At the center of the detach-ment, an irregular and nonhomogeneous mass ofneovascularization is seen.
B
A

FIGURE 4. OCCULT NEOVASCULAR MEMBRANE INAMD.This frontal section is adapted to the RPE contour.The scan passes across the neovascularization,which appears as an irregular and nonhomoge-neous mass. Note the two small, round RPE detach-ments and a small detachment of the neuroepithe-lium, both with optically blank content.
FIGURE 3. OCCULT NEOVASCULAR MEMBRANE IN AMD.The retina is thickened, with an altered profile. At the RPE level, two small serous detachments with a small detach-ment of the neuroepithelium are visible. Bruch’s membrane is clearly visible. Near it, the RPE is detached and dissoci-ated. Between Bruch’s membrane and the dissociated RPE, a nonhomogeneous mass, representing the neovascularmembrane is observed. The ELM and the IS/OS junction are altered at the level of the membrane and the RPE detach-ments.
70
B. Lumbroso, M. Rispoli

Clinical Reference Case Macular Degeneration
71
FIGURE 5. NEOVASCULAR MEMBRANE IN AMD –VASCULARIZED RPE DETACHMENT.This illustration shows a serous, vascularized RPE de-tachment. The neovascularization between Bruch’smembrane and the RPE is the beginning of an occultmembrane that will result in fragmentation of the RPE.
FIGURE 6. NEOVASCULAR MEMBRANE IN AMD.This illustration represents the progression of the caseshown in Figure 5. The neovascular membrane, whichoriginated under the RPE, has developed and led to frag-mentation of the epithelium. The neovascular mem-brane penetrates the neuroretina, crossing the damagedepithelium and inserting itself between the photorecep-tors, leading to lesions in the external segments. It thendevelops toward the nuclear layer (between the cells).
FIGURE 7. AMD – EVOLVED DISCIFORM SHAPE.The fibrovascular membrane is represented as a significant mass, which fuses with the RPE. This mass is thick andnot homogeneous. Above it, the disciform scar of cystoid edema is evident at the retina. The normal layers of theretina cannot be discerned.

FIGURE 8. NEOVASCULAR MEMBRANE IN A YOUNG PATIENT WITH HIGH MYOPIA.An ovoid formation in front of the RPE alters the retinal profile. This active fibrovascular formation creates nonho-mogeneous reflectivity. The slight retinal edema adjacent to the formation confirms that this is an active membrane.The RPE to the right of the neovascular membrane is clearly altered, almost duplicated.
72
B. Lumbroso, M. Rispoli

Clinical Reference Case Macular Degeneration
73
FIGURE 9. B-SCAN OF ATROPHIC MACULAR DEGENERATION – DRUSEN.The retina is significantly thinned at the posterior pole, with corresponding changes in retinal contour. The markedhyperreflectivity of the choroid at the level of the thinning is due to the absence of retinal and pigment epithelial tis-sue, permitting light rays to penetrate more deeply into the choroid. In the atrophic area, the retinal layers are al-tered, with a loss of the normal structure. To the sides of the atrophic area, we can see the persistence of the ELM andthe line of the IS/OS junction. In the atrophic area, the RPE is thinned and reduced to Bruch’s membrane.To the left of the retinal atrophy, an undulation in the RPE represents a druse. Under this small undulation, we can seedense, hyperreflective tissue, under which we can see Bruch’s membrane, reduced to a subtle line. On top of the un-dulation, the ELM and the IS/OS junction are normal.

FIGURE 10. PSEUDOVITELLIFORM MACULAR DEGENERATION.The retinal profile is altered by a hyperreflective mass, forming a body with the RPE (probably lipofuscin). The retinais thinner at the level of this mass. Except for a small area, the ELM and the IS/OS junction are normal at the detach-ment. Bruch’s membrane is visible as is the RPE detachment with optically blank content.
FIGURE 11. PSEUDOVITELLIFORM MACULAR DEGENERATION.The retinal map shows decreased retinal thickness at the subretinal mass. The 3-D map of the RPE shows thedetachment at the lipofuscin deposits.
74
B. Lumbroso, M. Rispoli

75
Clinical Reference Case
DIABETIC RETINOPATHY
MACULAR EDEMA INNONPROLIFERATIVE DIABETIC RETINOPATHY
Macular edema is the chief cause of reduced vi-sion in nonproliferative diabetic retinopathy.The SD-OCT examination, which shows retinal sections withnearly histological precision, has enabled furtherstudy of diabetic retinopathy.The edema starts withfocal edema, progresses to diffuse edema, and thencan become cystic. Serous detachment is part of theprogression of diabetic edema.
FOCAL EDEMA
Focal edema can be detected with fluorescein an-giography or with OCT, which shows a thickened reti-na. The OCT retinal map is important in cases of focaledema, because it permits better localization to directtreatment.It also helps confirm treatment efficacy.
DIFFUSE EDEMA
Viewed with OCT, the retina with diffuse edema isthickened and shows small, irregular cavities.The ar-eas of low reflectivity are increased and especially ev-ident in the external retinal layers, where diabeticedema is most frequently found.The external plexi-form layer shows the most edema.Areas of spongyedema shown on OCT likely represent altered Müllercells.After years of progression of diffuse edema, theirregular microcavities merge, resulting in pseudo-cysts (Figures 1A, 1B).
EPIRETINAL MEMBRANE
In many cases of retinal edema,OCT enables us todetect an epiretinal membrane (ERM).At times, theseare easily differentiated, but sometimes they aremerged with the retinal nerve fiber layer (RNFL).Thismembrane,with its retinal tractions, exacerbates ede-ma and can cause serous detachments.The neuroreti-na appears thickened, and the foveal depression dis-appears. In many cases, the tension exerted by theERM leads to a syndrome of the vitreoretinal interface(Figures 2-3).
CYSTOID MACULAR EDEMA
Persistent retinal edema results in necrosis of theMüller cells, leading to the formation of cystoid cavi-ties in the retina.These cavities start in the externalplexiform layer and subsequently penetrate the gran-ular layers and the internal plexiform layer.Advancedcystoid edema permeates the retina, causing residualtissue to atrophy.
It is important to quantify the edema by measur-ing both volume and thickness of the retina to devel-op a map of the retinal edema.
SEROUS DETACHMENT
Optical coherence tomography has shown thatserous detachments are part of the final progressionof diabetic edema.A serous retinal detachment withoptically blank cavity between the detached retinaand the RPE can be seen.A serous detachment can beassociated with increased thickness of the detachedretina, or the detached retina may appear normal oreven atrophied.We have found that serous detach-
THE ROLE OF OCT IN
MANAGING DIABETIC RETINOPATHY
Optical coherence tomography allows us to:
• Investigate causes for decreased visual acuity
• Determine the status of the retina and monitor
changes
• Detect the presence of retinal edema, its ex-
tent and characteristics
• Quantify edema and measure its volume
• Calculate retinal thickness
• Localize treatment areas by means of retinal
topography and C-scan
• Monitor treatment efficacy
• Determine if vitreoretinal surgery is necessary
• Monitor natural history
Summary Table 1

B. Lumbroso, M. Rispoli
76
FIGURE 1A. B-SCAN OF NONPROLIFERATIVE DIABETIC RETINOPATHY – INCIPIENT CME.The hyaloid is detached. The retinal profile is irregular, with deformation of the foveal depression. There are small,optically blank cavities of cystoid edema in the retina, specifically at the INL and the ENL. In place of the fovea, thereis a small serous detachment of the neuroretina, which can often be seen in cases of chronic CME. Dense, hyperreflec-tive points due to the exudates of hard lipids are also seen. The ELM and the IS/OS junction are normal in this case.
FIGURE 1 B. CME IN NONPROLIFERATIVE DIABETICRETINOPATHY, FRONTAL SECTION ADAPTED TO THE RPECONTOUR.Irregular cells of cystoid edema are clearly visible, espe-cially at the foveal level. Dense formations of hard exu-date can be seen.
Optical coherence tomography has become indispensable for detecting and studying diabeticretinopathy in its various stages. In certain cases, it can replace fluorescein angiography,allowing improved detection and quantification of lesions.

Clinical Reference Case Diabetic Retinopathy
77
ment is less frequent than diffuse edema or cystoidedema.
QUANTIFICATION
There is a roughly inverse relationship between vi-sual acuity and retinal thickness.As retinal thicknessincreases, visual acuity decreases with or without thepresence of cystoid edema. Measuring the retina’sthickness and volume is important for determiningprognosis, assessing indications for surgery and moni-toring disease progression.
The retinal map is important for localizing focaledema. Measuring retinal thickness allows us toquantify edema,which enables us to track the effica-cy of therapy. In our experience, when comparedwith fluorescein angiography, OCT has demonstrat-ed superior capabilities to aid in the diagnosis ofmacular edema. It also allows us to distinguish be-tween retinal edema and serous detachment, whichcannot be done using fluorescein angiography.
FIGURE 2. DIABETIC RETINOPATHY WITH EDEMATOUS, THICK RETINA AND THICK, ADHERENT ERM.The retinal profile is irregular. Exudates and cystoid edema are seen in the retina. To the right, corresponding to alaser-treated zone, marked atrophy of the retina is seen, with an increase in reflectivity.

FIGURE 3. DIABETIC RETINOPATHY.This is a 3-D representation of the retinal cube in Figure2. The ILM is adherent to the retina, and variations in theretinal thickness follow.
FIGURE 4. PROLIFERATIVE DIABETIC RETINOPATHY – B-SCAN – OPTIC PAPILLA.Peripapillary neovascular membrane, which is partially regressed after panretinal laser treatment, is seen. Thepapillary excavation is partially filled with fibrovascular tissue. To the right of the image, an area of retinal atrophyresulting from laser treatment is seen.
78
B. Lumbroso, M. Rispoli

Clinical Reference Case Diabetic Retinopathy
79
FIGURE 5A. B-SCAN OF CME AFTER CATARACT SURGERY (IRVINE-GASS SYNDROME).This 82-year-old patient noted decreased visual acuity a few weeks after cataract surgery. The B-scan shows CMEinvolving the INL. We can see optically blank cavities of cystoid edema, mostly in the internal and external nucleuslayers. Retinal thickness is greatly increased, while the ELM and the IS/OS junction are well-preserved.
FIGURE 5B. B-SCAN OF CME AFTER CATARACT SURGERY.This is the fellow eye from the case shown in Figure 5A. CME is also found here, but much less severe than in the other eye.
CME AFTER CATARACT SURGERY (Irvine-Gass Syndrome)
A
B
After cataract surgery, visual acuity may becomemarkedly reduced because of CME,which presents ascentral hyperfluorescence on fluorescein angiogra-phy. Figures 5A and 5B show a case with numerousintraretinal cysts in the perifoveal area, especially in
the internal nuclear layer (INL).The most centralcysts of edema occupy the entire thickness of theretina, terminating at the IS/OS junction, which ap-pears altered.The condition usually resolves aftertreatment.

80
When an occlusion of the central retinal artery isobserved after a few hours, retinal edema is seen asa cherry-red central stain on examination. Opticalcoherence tomography performed in the first fewdays allows us to see marked edema, localized in theinternal layers: the RNFL, the ganglion layer, the in-ternal plexiform layer, and the INL of the bipolarcells.An increase in the reflectivity and thickness ofthe INL and the RNFL can be observed.
After 15 days, the increased reflectivity and thick-ness of the INL and RNFL persist,but the reflectivity
of the outer retina decreases.After 30 days, the reti-nal edema has resolved.At that point, a decrease inthe thickness of the retina can be seen, with distinctchanges, especially of the internal retinal layers.Af-ter 6 months, atrophy of the internal retina is ob-served, with involvement of the photoreceptors(Figure 2, 3, 6, 7).
Vein occlusions can be nonischemic, ischemic,mixed or inflammatory (Figures 4, 5).
VASCULAR OCCLUSION OF THE RETINA
FIGURE 1. 6 MONTHS POST BRANCH RETINAL ARTERY OCCLUSION.On the right of the B-scan is a normal retina with all layers evident; on the left, an atrophic zone corresponds to theocclusion of the arterial branch. Note that the atrophy almost exclusively involves the internal retinal layers, while theENL, the ELM, and the IS/OS junction are nearly normal.
B. Lumbroso, M. Rispoli
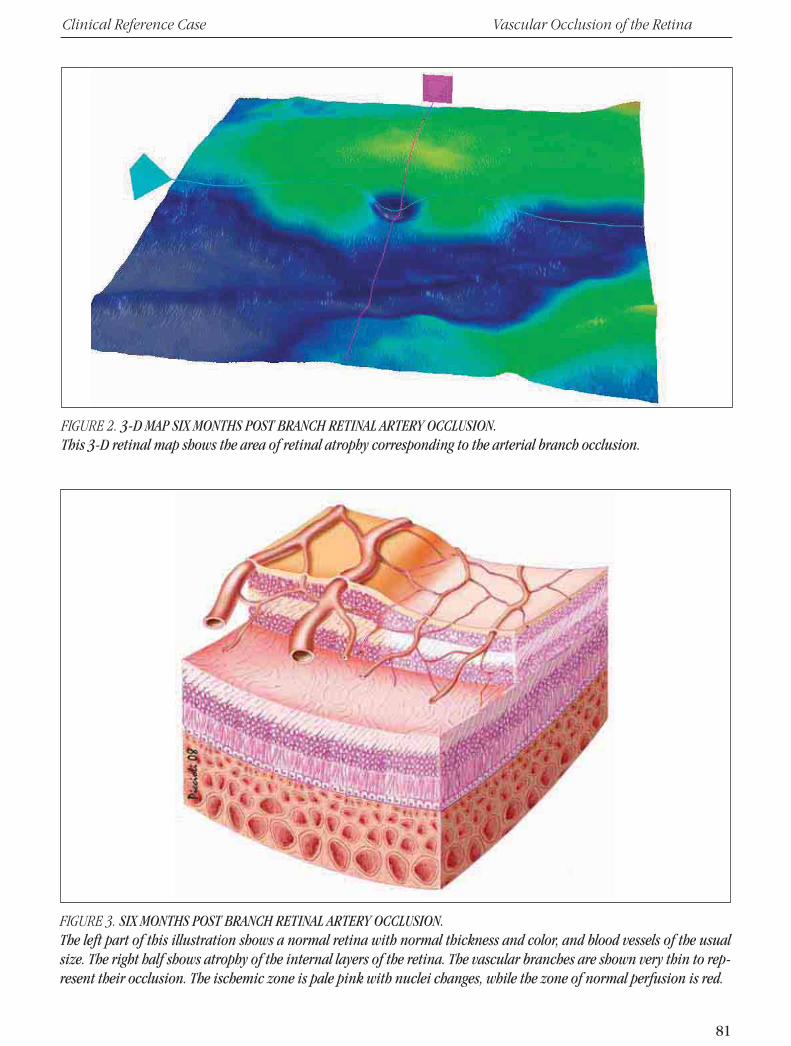
81
Clinical Reference Case Vascular Occlusion of the Retina
FIGURE 2. 3-D MAP SIX MONTHS POST BRANCH RETINAL ARTERY OCCLUSION.This 3-D retinal map shows the area of retinal atrophy corresponding to the arterial branch occlusion.
FIGURE 3. SIX MONTHS POST BRANCH RETINAL ARTERY OCCLUSION.The left part of this illustration shows a normal retina with normal thickness and color, and blood vessels of the usualsize. The right half shows atrophy of the internal layers of the retina. The vascular branches are shown very thin to rep-resent their occlusion. The ischemic zone is pale pink with nuclei changes, while the zone of normal perfusion is red.
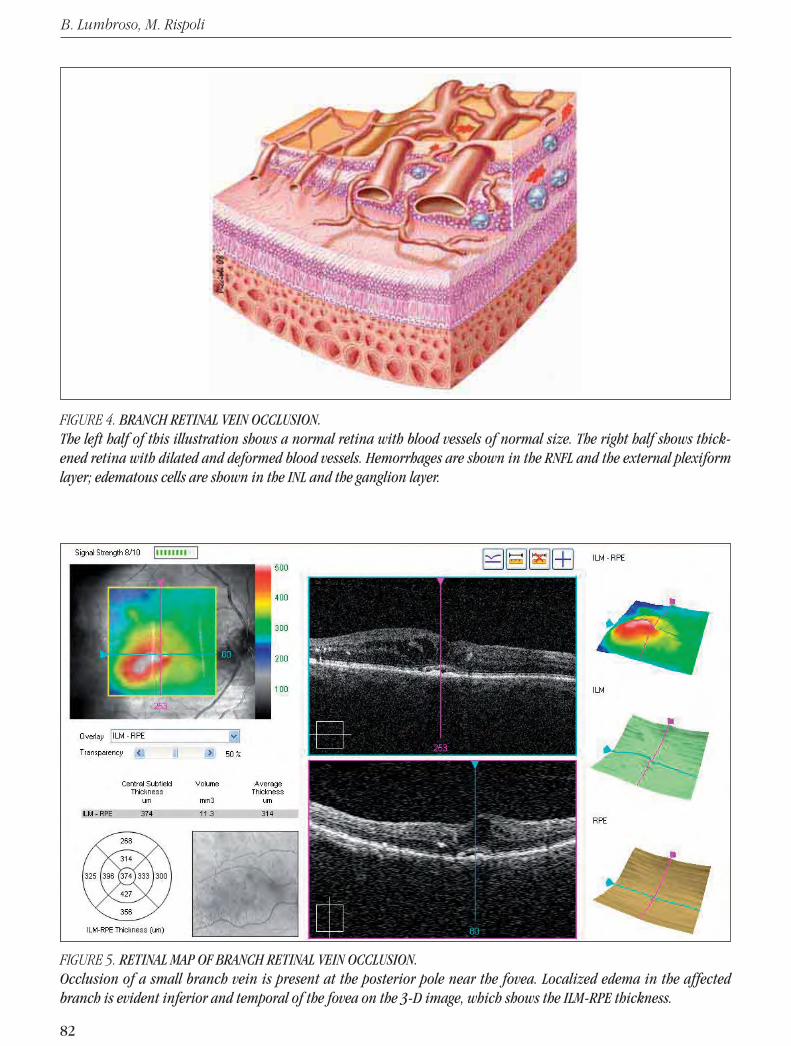
FIGURE 4. BRANCH RETINAL VEIN OCCLUSION.The left half of this illustration shows a normal retina with blood vessels of normal size. The right half shows thick-ened retina with dilated and deformed blood vessels. Hemorrhages are shown in the RNFL and the external plexiformlayer; edematous cells are shown in the INL and the ganglion layer.
82
B. Lumbroso, M. Rispoli
FIGURE 5. RETINAL MAP OF BRANCH RETINAL VEIN OCCLUSION.Occlusion of a small branch vein is present at the posterior pole near the fovea. Localized edema in the affectedbranch is evident inferior and temporal of the fovea on the 3-D image, which shows the ILM-RPE thickness.

83
Clinical Reference Case Vascular Occlusion of the Retina
FIGURE 6. B-SCAN OF BRANCH RETINAL VEIN OCCLUSION.The retinal thickness to the right and left appears normal, while in the center at the fovea, the retina is edematous,thickened with cystoid edema cells. This edema occupies part of the INL with small cysts, while the ENL is involvedwith larger and more irregular cysts. Toward the fovea, a large edematous cavity occupies the entire thickness of theretina. Exudates are visible between the edematous retina and the normal retina, with a shadow on the posterior lay-ers. The ELM is normal, except at the vascular occlusion.
FIGURE 7. B-SCAN OF CENTRAL RETINAL VEIN OCCLUSION.Marked thickening of the retina with diffuse edema at the RNFL and the ganglion layer is seen. The cells of cystoid ede-ma occupy the entire thickness of the INL. The ENL is distorted by large, irregular cells of edema. These cavities causealterations to the ELM and the IS/OS junction.

84
B. Lumbroso, M. Rispoli
RETINAL EPITHELIOPATHY
SEROUS CHORIORETINOPATHY
Central serous chorioretinopathy (CSCR) mostcommonly occurs in men between 25 and 45 years ofage; it is often bilateral and recurrent.Typically, fluores-cein angiography reveals a point of diffusion that ap-pears early and increases progressively. In serous RPEdetachments, multiple points of diffusion may be visi-ble where the RPE is detached from Bruch’s mem-brane, forming spaces that fill with fluorescein dye.
In acute CSCR, OCT may reveal a small break inthe RPE at the diffusion point inside the serous RPEdetachment. From this opening, we may occasionallysee reflective material that seems to leak from thechoroid toward the interior of the detachment.In cas-es of acute CSCR, all layers and retinal stripes appearnormal in the nondetached retina (Figure 1).
At the serous detachment, either the IS/OS junc-tion or the tips of the photoreceptors are detached,showing a marked reflectivity.The external stripescorresponding to the RPE and Bruch’s membrane re-main in place. In most eyes with active serous chori-oretinopathy, structural changes of the external seg-ment of the photoreceptors are evident. It may bethickened, irregular or have increased reflectivity,with granulations of the internal face of the detach-ment in the detached area (Figure 2).The IS/OS junc-tion in the detached retina is often irregular in thick-ness.
CHRONIC EPITHELIOPATHY ORDIFFUSE RETINAL PIGMENT EPITHELIOPATHY
Chronic epitheliopathy usually occurs in people45 to 69 years of age. It is associated with points ofdiffusion, dystrophic changes of the RPE, and serousRPE detachments.Areas of the RPE may be absent,and areas of gravitational epitheliopathy can be ob-served. Choroidal neovascularization is common.
In the advanced, chronic form of serous chori-
oretinopathy, with resolution of the detachments, theELM is generally visible on OCT, and there is thinningof the ENL associated with changes at the IS/OS junc-tion. The foveal ENL shows increased reflectivity incases where the serous detachment has resolved.Thisincreased reflectivity of the nuclear layer of the pho-toreceptors is probably a result of changes to the nor-mal anatomy or formations of fibrous tissue. Othervisible changes are retinal thinning at the fovea and,sometimes, true atrophy.The ELM is always visible, al-lowing evaluation of the changes to the IS/OS junc-tion, which are almost always associated with a thin-ning of the ENL.The margin of IS/OS junction may bethickened, irregular,or distorted.
Over the course of the natural history or aftertreatment, a slight thinning of the retina may be seen,with changes to the ELM and the IS/OS junction (Fig-ures 3A, 3B, 4).
FORMS OF RPE DETACHMENT
Idiopathic detachment• Simple or multiple
Detachment associated with:• Acute CSCR (acute serous retinal epitheliopa-thy)
• Diffuse retinal epitheliopathy or chronic serouschorioretinopathy
Vascularized detachment• Age-related macular degeneration with sub-retinal neovascularization
• Retinal angiomatous proliferation• Polypoidal choroidopathy• Subretinal neovascularization of other origin
Summary Table 1

Clinical Reference Case Retinal Epitheliopathy
85
FIGURE 2. RPE DETACHMENT ASSOCIATED WITH SEROUS DETACHMENT OF THE NEUROEPITHELIUM – LESIONS TO THEPHOTORECEPTORS.In this case of acute CSCR, a point of diffusion has formed between the cells of the altered RPE, and fluid has diffusedbeneath the retina, detaching it. Alterations are apparent in the external segment of the photoreceptors. These alter-ations can be seen when the serous detachment persists for more than a few weeks.
FIGURE 1. SEROUS RPE DETACHMENT IN CSCR.The RPE has detached from Bruch’s membrane, detaching the retina without causing changes to the RPE. The detach-ment is optically clear, and there is no diffusion of the subretinal fluid.
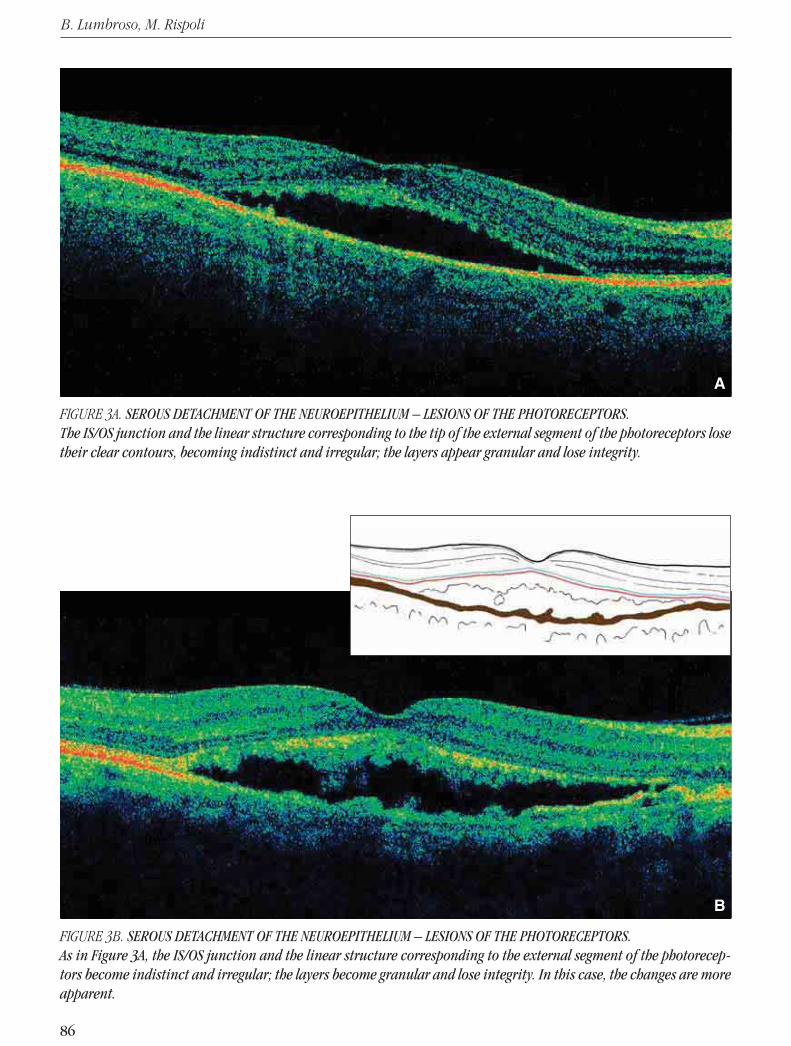
B. Lumbroso, M. Rispoli
86
FIGURE 3A. SEROUS DETACHMENT OF THE NEUROEPITHELIUM – LESIONS OF THE PHOTORECEPTORS.The IS/OS junction and the linear structure corresponding to the tip of the external segment of the photoreceptors losetheir clear contours, becoming indistinct and irregular; the layers appear granular and lose integrity.
FIGURE 3B. SEROUS DETACHMENT OF THE NEUROEPITHELIUM – LESIONS OF THE PHOTORECEPTORS.As in Figure 3A, the IS/OS junction and the linear structure corresponding to the external segment of the photorecep-tors become indistinct and irregular; the layers become granular and lose integrity. In this case, the changes are moreapparent.
A
B

Clinical Reference Case Retinal Epitheliopathy
87
FIGURE 4. SEROUS DETACHMENT OF THE NEUROEPITHELIUM.This 40-year-old patient complained of worsening vision for more than a year. Fluorescein angiography detected aserous detachment of the retina, with a clear point of diffusion away from the fovea.Spectral domain OCT shows a detachment of the neuroepithelium at the fovea, forming an acute angle with the RPE.The ENL, the ELM, and the IS/OS junction are easily seen. Visual acuity (8/10) is well-preserved.The RPE appears shaped by two hyperreflective layers separated by a hyporeflective layer in the detachment.At the detachment, the RPE is divided into two parts: the internal layer follows the detachment and is probably formedby the tip of the photoreceptors; the RPE remains attached.
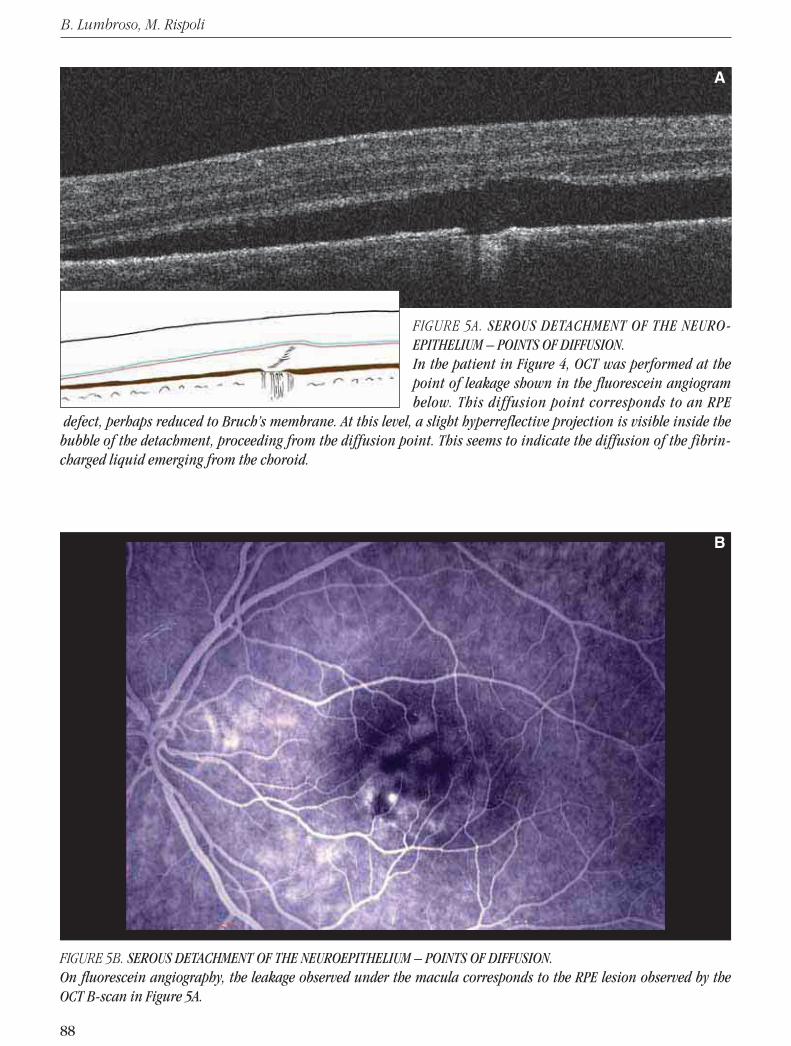
88
B. Lumbroso, M. Rispoli
FIGURE 5A. SEROUS DETACHMENT OF THE NEURO-EPITHELIUM – POINTS OF DIFFUSION.In the patient in Figure 4, OCT was performed at thepoint of leakage shown in the fluorescein angiogrambelow. This diffusion point corresponds to an RPE
defect, perhaps reduced to Bruch’s membrane. At this level, a slight hyperreflective projection is visible inside thebubble of the detachment, proceeding from the diffusion point. This seems to indicate the diffusion of the fibrin-charged liquid emerging from the choroid.
FIGURE 5B. SEROUS DETACHMENT OF THE NEUROEPITHELIUM – POINTS OF DIFFUSION.On fluorescein angiography, the leakage observed under the macula corresponds to the RPE lesion observed by theOCT B-scan in Figure 5A.
A
B
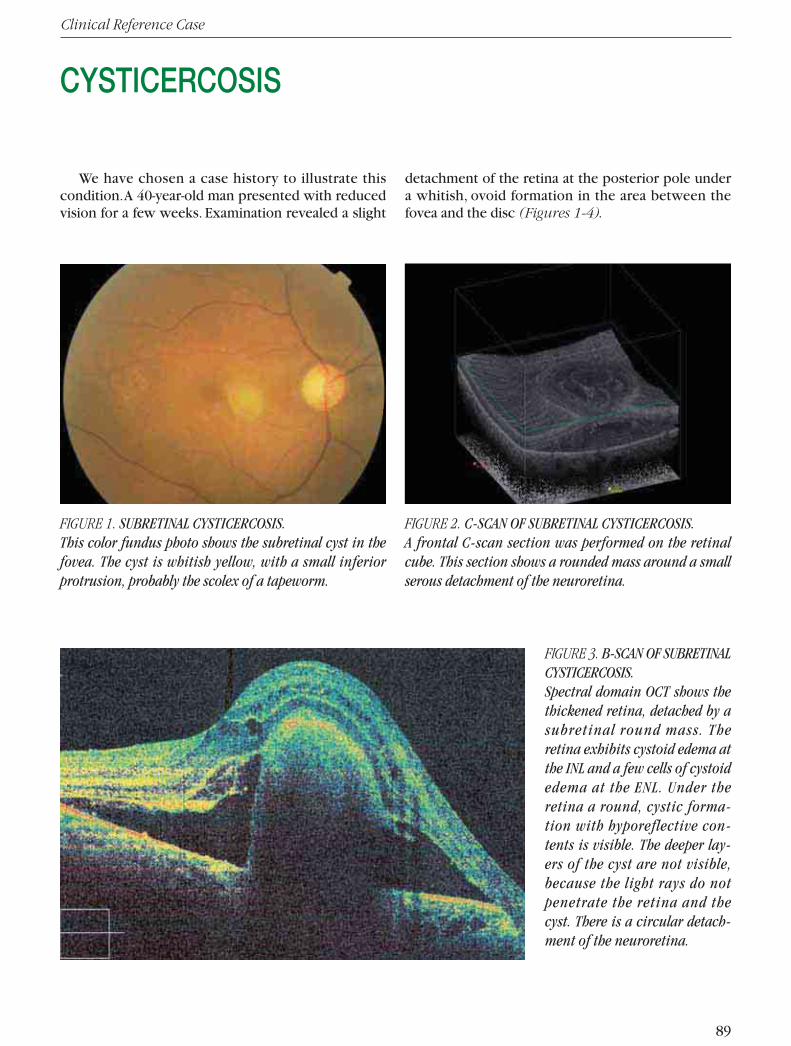
89
Clinical Reference Case
FIGURE 3. B-SCAN OF SUBRETINALCYSTICERCOSIS.Spectral domain OCT shows thethickened retina, detached by asubretinal round mass. Theretina exhibits cystoid edema atthe INL and a few cells of cystoidedema at the ENL. Under theretina a round, cystic forma-tion with hyporeflective con-tents is visible. The deeper lay-ers of the cyst are not visible,because the light rays do notpenetrate the retina and thecyst. There is a circular detach-ment of the neuroretina.
CYSTICERCOSIS
We have chosen a case history to illustrate thiscondition.A 40-year-old man presented with reducedvision for a few weeks. Examination revealed a slight
detachment of the retina at the posterior pole undera whitish, ovoid formation in the area between thefovea and the disc (Figures 1-4).
FIGURE 1. SUBRETINAL CYSTICERCOSIS.This color fundus photo shows the subretinal cyst in thefovea. The cyst is whitish yellow, with a small inferiorprotrusion, probably the scolex of a tapeworm.
FIGURE 2. C-SCAN OF SUBRETINAL CYSTICERCOSIS.A frontal C-scan section was performed on the retinalcube. This section shows a rounded mass around a smallserous detachment of the neuroretina.

90
B. Lumbroso, M. Rispoli
FIGURE 4. SUBRETINAL CYSTICERCOSIS – FRONTAL SECTIONS ADAPTED TO THE RPE CONTOUR.This series of C-scans show the retina and cyst from top to bottom and the consistent lower reflectivity inside the cyst.It was not possible to detect the scolex. The C-scans show the round cyst and the adherence to the posterior side of theretina. A small hyperreflective mass appears to lie within the lesion.

91
Clinical Reference Case
VOGT-KOYANAGI-HARADA SYNDROME
Vogt-Koyanagi-Harada syndrome is characterizedby inflammation of the retina and the choroid inwhich we can observe anterior and posterior uveitis,along with exudative detachments of the retina withwhitish lesions of the base.The serous retinal detach-ments can grow together and cause a significantserous detachment and can involve nearly the entireretina. Disc edema is often associated with this syn-drome.
Onset is characterized by worsening of vision,
which may be associated with headache and dizzi-ness. As the disease progresses, neovascular mem-branes and subretinal fibrosis may appear. Headachesand dermatologic disturbances, such as depigmenta-tion and vitiligo, are not always observed. Deafnessmay also occur.
Fluorescein angiography may demonstrate multi-ple points of leakage causing a serous detachment ofthe neuroretina with areas of RPE disturbances. (Fig-ures 1–3).
FIGURE 1. B-SCAN OF HARADA’S DISEASE.The retina is thickened with irregular accumulations of turbid fluid, which are not typical cells of cystoid edema. TheRPE is significantly thickened in certain areas. Subretinal exudates may form.

B. Lumbroso, M. Rispoli
92
FIGURE 2. HARADA’S DISEASE.Regression of subretinal fluid is shown. A dense band of subretinal fibrosis is seen, with a macular detachment. Noteirregular accumulations of liquid inside the retina.
FIGURE 3. MAP OF HARADA’S DISEASE.The elongated detachment of the retina and the RPE in the inferior peripapillary region subretinal fibrosis, whichappeared after 5 years of disease progression.

Clinical Reference Case
93
COMPLEX CASES
The clinical cases presented thus far have rangedfrom easy to difficult, but all have involved a singlepathology. In daily clinical practice, it is not unusualto encounter patients presenting with more complexscenarios with several pathologies.These cases arecomplicated, requiring analysis of individual patholo-
gies in order to determine the diagnosis that bestmatches one or more illnesses in a single scan.Thefollowing are two particularly complex cases inwhich a diagnosis based on OCT scans may not beobvious.
FIGURE 1A. RETINAL NEVUS – DIABETIC RETINOPATHY AND EPIRETINAL MEMBRANE.This 45-year-old patient has had diabetes for more than 15 years. He presented with pigmented subretinal neoformations.The B-scan shows a convex deformation of the retina, which is detached by a deep, hyperpigmented mass. The lesionprevents light from penetrating into the choroid. Cystoid edema occupies almost the entire thickness of the retina.Hard lipid exudates are seen in the deep retinal layers. The retinal surface is covered by adherent epiretinal membrane,with some small dehiscences visible.
A

B. Lumbroso, M. Rispoli
94
FIGURE 1B. RETINAL NEVUS – DIABETICRETINOPATHY AND EPIRETINAL MEMBRANE –FRONTAL SCAN ADAPTED TO THE RPECONTOUR AT THE LEVEL OF THE NEVUS.The nevus is sectioned transversely, and thescan confirms the presence of a dark, roundedformation circumscribed by a circular hyper-reflective boundary under the RPE.
FIGURE 1C. RETINAL NEVUS – DIABETICRETINOPATHY AND EPIRETINAL MEMBRANE –FRONTAL SCAN ADAPTED TO THE RPECONTOUR AT THE LEVEL OF THE RETINA.This superficial frontal scan traverses theretinal thickness and shows cystoid edemainside a central hyperreflective area. Hardlipid exudates can be observed in the deepretinal layers.
B
C

Clinical Reference Case Complex Cases
95
FIGURE 2A. PSEUDOVITELLIFORM MACULAR DEGENERATION – MACULAR PSEUDOHOLE AND SYNDROME OF THEVITREORETINAL INTERFACE.The B-scan shows that the retinal profile is altered by an adherent preretinal membrane exerting transverse tractionon the retina. Also observed is a pseudohole with loss of substance at the internal retinal layers. Accumulated dense,hyperreflective material on and combined with the RPE is found in this eye with pseudovitelliform macular degener-ation. The ELM and the IS/OS junction are nearly normal, as reflected in the good visual acuity of 7/10.
FIGURE 2B. PSEUDOVITELLIFORM MACULARDEGENERATION – MACULAR PSEUDOHOLE ANDSYNDROME OF THE VITREORETINAL INTERFACE –FRONTAL SCAN ADAPTED TO THE RPE CONTOUR.A dense mass of hyperreflective material can be seen fromthe pseudovitelliform degeneration. Visible inside is ahyperreflective circle representing the IS/OS junction infrontal section.
FIGURE 2C. PSEUDOVITELLIFORM MACULAR DEGENERA-TION – MACULAR PSEUDOHOLE AND SYNDROME OF THEVITREORETINAL INTERFACE – FRONTAL SCAN ADAPTEDTO THE RPE CONTOUR.This scan was performed superficial to the retina. Itshows the pseudohole and the superficial retinal foldsresulting from the contraction of the ILM.
A
B C
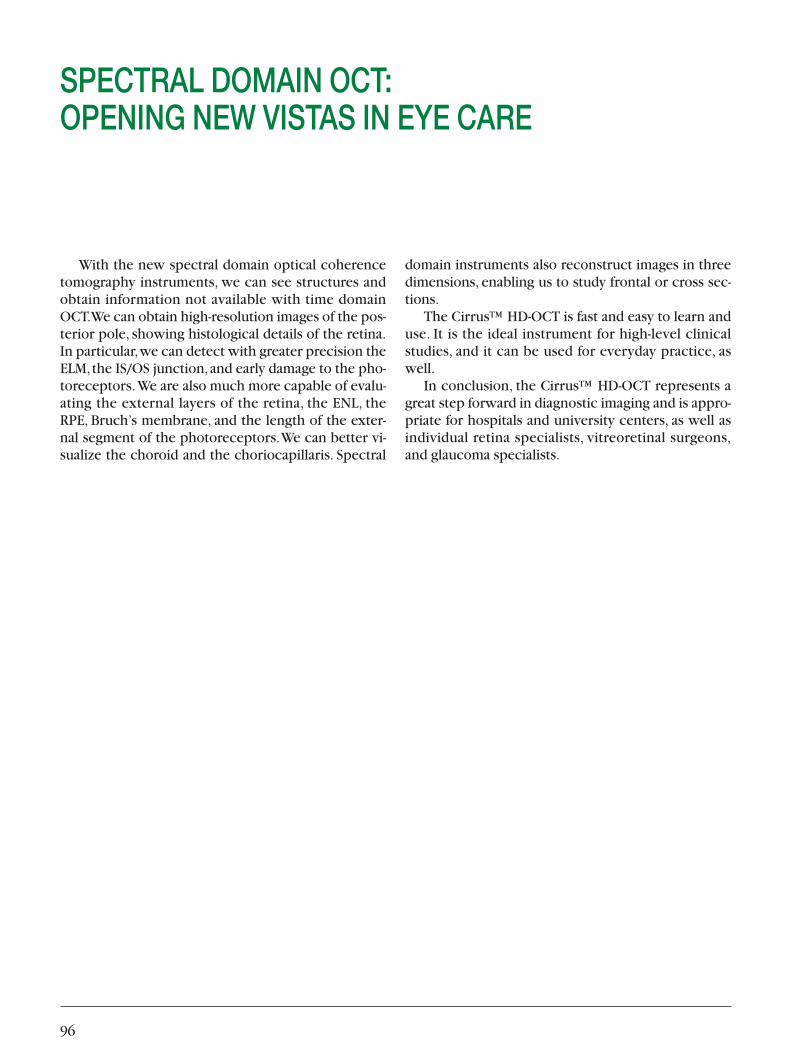
96
SPECTRAL DOMAIN OCT:OPENING NEW VISTAS IN EYE CARE
With the new spectral domain optical coherencetomography instruments, we can see structures andobtain information not available with time domainOCT.We can obtain high-resolution images of the pos-terior pole, showing histological details of the retina.In particular,we can detect with greater precision theELM,the IS/OS junction,and early damage to the pho-toreceptors.We are also much more capable of evalu-ating the external layers of the retina, the ENL, theRPE, Bruch’s membrane, and the length of the exter-nal segment of the photoreceptors.We can better vi-sualize the choroid and the choriocapillaris. Spectral
domain instruments also reconstruct images in threedimensions, enabling us to study frontal or cross sec-tions.
The Cirrus™ HD-OCT is fast and easy to learn anduse. It is the ideal instrument for high-level clinicalstudies, and it can be used for everyday practice, aswell.
In conclusion, the Cirrus™ HD-OCT represents agreat step forward in diagnostic imaging and is appro-priate for hospitals and university centers, as well asindividual retina specialists, vitreoretinal surgeons,and glaucoma specialists.