Guidance Note for Strategic Noise Mapping · GeoDirectory is updated quarterly, for the purpose of...
18
Guidance Note for Strategic Noise Mapping For the Environmental Noise Regulations 2006 Version 2 August 2011 Revised Section 10: Methodology for Exposure Assessment - Post Processing and Analysis October 2017 ENVIRONMENTAL PROTECTION AGENCY An Ghníomhaireacht um Chaomhnú Comhshaoil PO Box 3000, Johnstown Castle, Co. Wexford, Ireland Telephone: +353 53 916 0600 Fax: +353 53 916 0699 Email: [email protected] Website: www.epa.ie © Environmental Protection Agency 2017
Transcript of Guidance Note for Strategic Noise Mapping · GeoDirectory is updated quarterly, for the purpose of...

Guidance Note for Strategic Noise Mapping
For the
Environmental Noise Regulations 2006
Version 2 August 2011
Revised Section 10: Methodology for Exposure Assessment - Post Processing and Analysis
October 2017
ENVIRONMENTAL PROTECTION AGENCY An Ghníomhaireacht um Chaomhnú Comhshaoil
PO Box 3000, Johnstown Castle, Co. Wexford, Ireland
Telephone: +353 53 916 0600 Fax: +353 53 916 0699 Email: [email protected] Website: www.epa.ie
© Environmental Protection Agency 2017

Offer Ref: 587/16/2 Page 1 of 17 October 2017
10 Stage7–PostProcessingandAnalysisAfter the completion of the noise calculations the noise level results are available asderived datasets from the noise modelling process.
The noise results generated can now be mapped, presented graphically, and used asthe basis for supplementary analysis in order to derive the required information forreporting to the Commission.
10.1 ReportingRequirementsThe EPA is to report to the European Environment Agency using the Electronic NoiseData Reporting Mechanism (ENDRM) as set out in EEA Technical Report No 9/2012plus the various Annex documents covering the individual reporting data flows.
The Noise Mapping Bodies (NMBs) are to report results to the EPA using the sameENDRM methodology based upon the templates available from the EEA. The EPAwill provide NMBs with reporting templates and any specific guidance as appropriate.
10.2 RequirementsoftheDirectiveAnnex VI of the END requires that “the estimated number of people living indwellings” exposed to various noise levels “4 m above the ground on the mostexposed façade” is provided for various scenarios.
For this reason, it is necessary to more clearly define the terms “people”, “dwellings”,and “most exposed façade”.
For the purposes of the statistics required by Annex VI, persons (or people) can bedefined as “human” beings, thus being consistent with the scope of the END definedin Article 2, paragraph 1. They are members of “the public” as defined in Article 3 (v)as “one or more natural or legal persons and, in accordance with national legislationor practice, their associations, organisations or groups”.
The term “population” is not referred to in the END, and is only a convenient meansof referring to the exposure assessment, which as noted above is for “the estimatednumber of people living in dwellings”. It should be noted that the estimation of thenumber of people living in dwellings does not directly assess the exposure of people,as individuals move around; rather the exposure assessment is carried out upon thebuilding/dwelling in which people normally reside. In the assessment there is noattempt to reflect the temporal dimension of the movement of population in thisexposure assessment.
The CSO defines dwellings as a self-contained unit of living accommodation that isoccupied or, if vacant, is intended for occupation by one or more households. Adwelling should have a separate access to the street (direct or via a garden orgrounds) or to a common space within a building (staircase, passage gallery, etc.).Examples include: a family home, a family home on a farm, a separate flat,apartment or bed-sit, a caravan, a caretaker’s accommodation located in an officebuilding, living accommodation over a shop.
A household is an occupied dwelling and forms the basis of the population in theCSO published Census data T5_2_TP field as part of the Small Area PopulationStatistics. Almost all of these persons in this field are usually resident in thehousehold.
The CSO also publish SAPS data for Communal Establishments, which are definedas establishments providing managed residential accommodation. Managed means

Offer Ref: 587/16/2 Page 2 of 17 October 2017
full-time or part-time supervision of the accommodation and generally consist ofHotels, Educational establishments, Prisons, Boarding Houses, Religiouscommunities, Defence establishments, Guest Houses, Children’s homes, Civilianships, boats and barges, Bed and breakfast, Nursing home, Garda station, Hostel,Hospital/Nurses’ home and Holiday campsite.
As can be seen some of the people enumerated in Communal Establishmentsconsist of persons who are non-resident and those who are normally residing withinthe establishment, however they do not fit the CSO definition of dwellings, and aretherefore outside the scope of the END assessment. Some of these CommunalEstablishments may be considered as noise sensitive, and their exposure could bedetermined separately, or investigated specifically during the development of theNoise Action Plans.
Importantly, the use of “dwellings” within the END indicates that vacant orunoccupied dwellings should be included within the assessment of exposure ofdwellings, but not within the assessment of exposure of people if the dwellings areknown to be vacant, as this is contra to the phrasing used, e.g. “how many persons inthe above categories live in dwellings that have” and “The estimated total number ofpeople (in hundreds) living in dwellings”. For this reason, the revised approach setout below will provide two approaches to identifying dwellings, one including vacantdwellings, to be used in the dwelling exposure assessment, and the other whichexcludes them, for use in the assessment of numbers of people living in dwellings.
The term “building” as used by CSO is not referred to directly in the context of theexposure assessments required by Annex VI. A building may contain zero, one ormore individual dwellings. Residential buildings can therefore be considered to bethose buildings containing one or more individual “Private dwellings”. Noise-sensitivebuildings may be considered those buildings which contain “Non-private dwellings”,or which have uses which the competent authority deems to be noise sensitive, suchas libraries etc for the purpose of the Noise Action Plan.
The façades of a dwelling shall consist of all externally facing walls. Annex I, 1defines the Lden using the stated formula, and in which: “the incident sound isconsidered, which means that no account is taken of the sound that is reflected atthe façade of the dwelling under consideration”. This indicates that thesubsequent references to façade indicate the façade of the dwelling underconsideration. Which would be consistent with Annex III regarding dose-responserelationships: “dwellings with a quiet façade as defined in Annex VI”.
Regarding the most exposed façade Annex I, 1 states: “the most exposed façade; forthis purpose, the most exposed façade will be the external wall facing onto andnearest to the specific noise source; for other purposes other choices may be made”.Subsequent practical experience has demonstrated that selection of the mostexposed façade based upon distance may lead to contradictory situations. For thisreason, a revised a definition is proposed: “the most exposed façade will be theexternal wall of the dwelling exposed to the highest value of Lden/Lnight from thespecific noise source under consideration (e.g. road traffic).” The proposed definitionis also more consistent with the existing definition of quiet façade.
Regarding quiet façade, Annex VI, 1.5 states: “a quiet façade, meaning the façade ofa dwelling at which the value of Lden four metres above the ground and two metres infront of the façade, for the noise emitted from a specific source, is more than 20 dBlower than at the façade having the highest value of Lden.” This makes determinationof the presence of a quiet façade more complex as it necessary to determine thenoise exposure at a different distance from the façade of the dwelling than for the

Offer Ref: 587/16/2 Page 3 of 17 October 2017
most exposed façade. As the reporting of quiet facades is optional, it is not currentlyproposed to determine the presence of quiet facades.
10.3 PreparingtheInputDatasetsGiven the above definitions the input datasets required to undertake the requiredassessments may be identified.
10.3.1SAPS Census DataCentral Statistics Office (CSO) publish statistical information on population basedupon Census returns. The most recent Census was held on 24 April 2016, and themajority of the information is now available. The information available on populationis issued according to various political boundaries, namely Province or County,Province County or City, Regional Authority, Constituency, Electoral Division andSmall Areas. Data is not made available at Census Output Area level; rather theseare merged up to the Small Area Population Statistics (SAPS) level which providesfor the highest level of resolution available to the location of the population. There are18,641 SAPS covering Ireland in the 2016 Census output data1.
The complete SAPS dataset is contained in a CSV file, “SAPS2016_SA2017.csv”,with each of the entries explained within the glossary file,“SAPS_2016_Glossary.xlsx”. The three most relevant totals within the dataset for theEND assessment are:
· T1_1AGETT – Total Population· T5_2_TP – Total of Persons in Private Households· T7_1_NP – Total of Persons in Communal Establishments
It is suggested that a revised version of the CSV file is created containing the sixrelevant fields: GUID, GEOGID, GEOGDESC, T1_1AGETT, T5_2_TP and T7_1_NP.
Figure 10.1: SAPS data
In order to provide an accurate spatial location for the population within each SAPSarea it is necessary to have an up to date map of SAPS boundaries which matchesthe SAPS codes within the population exposure statistics report. The Small Areas
1 http://www.cso.ie/en/census/census2016reports/census2016smallareapopulationstatistics/ [Accessed September2017]

Offer Ref: 587/16/2 Page 4 of 17 October 2017
Ungeneralised OSi National Statistical Boundaries dataset is available in variousformats2.
The SAPS boundary data is delivered in WGS 1984 projection, and may need to beprojected to either Irish Transverse Mercator (ITM) or Irish National Grid (ING)depending on how the noise mapping datasets have been set up within the project.
The SAPS boundary Shapefile may then be joined to the CSV file based on theGUID which assigns the three population totals to each of the SAPS boundarypolygons.
Figure 10.2: Total population per SAPS area
As this is a national coverage dataset, it is recommended that for specific projectareas it is filtered on NUTS3, COUNTY, EDNAME or SMALL_AREA to producesmaller coverage datasets which may be used going forward.
Note: It is recommended NOT to run an intersect based on boundarypolygons as this can bisect the SAPS polygons and produce erroneouspopulation statistics.
2 https://data.gov.ie/dataset/small-areas-ungeneralised-osi-national-statistical-boundaries [Accessed September2017]

Offer Ref: 587/16/2 Page 5 of 17 October 2017
Figure 10.3: 1,308,854 Person in Private Householdsin 4,882 SAPS area in Dublin County
Figure 10.4: 190,938 Person in Private Householdsin 778 SAPS area in Cork Agglomeration

Offer Ref: 587/16/2 Page 6 of 17 October 2017
With the number of people assigned to each SAPS area, it is now necessary toestablish which buildings contain dwellings, and the total number of people livingwithin those dwellings.
10.3.2 GeoDirectoryThe GeoDirectory data products are developed by OSi and An Post to provide asingle point location object for each building in Ireland. The complete dataset isavailable with the “GeoAddress Locator” product, and each point location has anumber of attributes which may be useful in indentifying both vacant and occupieddwellings.
GeoDirectory is updated quarterly, for the purpose of the R3 strategic noise mappingit is recommended to use the Q1 2016 version following advice from CSO, who usedthis version when developing the SAPS data for Census 2016.
As GeoDirectory provides a location point for each building, it is necessary toundertake a filter procedure in order to identify the two location datasets required forthe assessment, namely:
· Point locations for buildings containing dwellings, and· Point locations for buildings containing occupied dwellings.
The highest level of resolution within GeoDirectory is within the ADDRESS_POINTStable, which has a many-to-one link to the BUILDINGS table i.e. there can be manyaddress points within one building, and one building may contain one or manyaddress delivery points.
The number of linked address points is provided by theRESIDENTIAL_DELIVERY_POINTS and COMMERCIAL_DELIVERY_POINTSattributes. The RESIDENTIAL_DELIVERY_POINTS have a blank entry in theORGANISATION attribute within the ADDRESS_POINTS table, whereas theCOMMERCIAL_DELIVERY_POINTS should have an entry in the ORGANISATIONattribute within the ADDRESS_POINTS table.
The BUILDING_USE attribute has three possible entries: R for Residential, C forCommercial and B for Both. Commercial should have zeroRESIDENTIAL_DELIVERY_POINTs, whilst Residential should have zeroCOMMERCIAL_DELIVERY_POINTS.
The ADDRESS_POINTS table also has attributes for VACANT, INVALID,UNOCCUPIED and UNDER_CONSTRUCTION for each of the entries, whether theyare commercial, residential or both.
In order to produce a location dataset of “RESIDENTIAL_ADDRESS_POINT”, thefollowing filters should be applied to the GeoDirectory ADDRESS_POINTS table:
· BUILDING_USE – filter out all C (commercial);· DERELICT – filter out all Y (yes);· INVALID – filter out all Y (yes);· UNDER_CONSTRUCTION – filter out all Y (yes) entries; and· RESIDENTIAL_DELIVERY_POINTS – filter out all 0 (zero) entries, as they do
not have any residential delivery points.

Offer Ref: 587/16/2 Page 7 of 17 October 2017
The resultant dataset contains the location points for all residential address point,whilst the RESIDENTIAL_DELIVERY_POINTS attribute provides the total number ofresidential dwellings within each building.
In order to create a location dataset for occupied buildings, the following steps shouldbe undertaken. Add Field in the attribute table for VACANT_ADD_PNT, use the FieldCalculator to assign VACANT_ADD_PNT = 1 if VACANT = “Y”.
To produce a building level dataset from the address point data, the GeoDirectorydata should be dissolved to result in one entry per BUILDING_ID, keeping thefollowing fields:
BUILDING_ID - firstADDR_LINE_1 - firstADDR_LINE_2 - firstADDR_LINE_3 - firstADDR_LINE_4 - firstADDR_LINE_5 - firstADDR_LINE_6 - firstRESIDENTIAL_DELIVERY_POINTS - meanCOMMERCIAL_DELIVERY_POINTS - meanBUILDING_USE - firstSMALL_AREA_ID - firstEAST - firstNORTH - firstVACANT_ADD_PNT - sum
Open the attribute table of the new building level dataset and Add FieldOCCUPIED_ADD_PNT and use Field Calculator to populate it withMEAN_RESIDENTIAL_ADDRESS_POINTS – SUM_VACANT_ADD_PNT.
Note: In some cases, there are more entries for a building point in theaddress point dataset than there are residential address points, typically forblocks of flats where the building name has an entry alongside an entry perflat. As a result, this can create negative vales for OCCUPIED_ADD_PNTtherefore it is recommended to add an if statement to ensure any negativevalues of OCCUPIED_ADD_PNT are set to zero.
The building level Geodirectory data now contains the two values required for theexposure assessment per building address point:
· Number of dwelling = MEAN_RESIDENTIAL_ADDRESS_POINTS· Number of occupied dwellings = OCCUPIED_ADD_PNT
As a final step, if necessary, the GeoDirectory point data should be clipped to thedissolved boundaries of the SAPS area covering the project extent.

Offer Ref: 587/16/2 Page 8 of 17 October 2017
Figure 10.5: Dublin Agglomeration = 400,261 dissolved GeoDirectory pointssum RESIDENTIAL_DELIVERY_POINTS = 535,220
sum OCCUPIED_ADD_PNT = 530,832
Figure 10.6: Cork Agglomeration = 69,170 dissolved GeoDirectory pointssum RESIDENTIAL_DELIVERY_POINTS = 82,127
sum OCCUPIED_ADD_PNT = 81,172

Offer Ref: 587/16/2 Page 9 of 17 October 2017
10.3.3 OSi PRIME2 BuildingsOrdnance Survey Ireland PRIME2 is the newly developed spatial data storage modelfirst delivered in 2014. This authoritative spatial reference framework ensuresconsistent and unique referencing of topological state information, both in terms oflocation and in terms ID tag referencing. The database is constantly updated andeach object timestamped, which enables datasets to delivered representative acertain point in time. Following discussions with CSO it is recommended to usePRIME2 datasets from July 2016.
Buildings are represented in two themes, as a point at the centre of the buildingfootprint, and as a polygon objects describing the outline of the building.
Within the areas of noise mapping it is necessary to have building polygon objects inorder to successfully undertake the noise calculations. Detached, semi-detached andterrace properties should have each unit described as a separate polygon i.e. a semi-detached building is two adjoining polygon objects, a row of terrace properties is aseries of adjoining polygon objects.
Within the PRIME2 BUILDING_POLY theme the following attributes may be usefulfor the noise mapping process:
· FORM_ID – building type category, e.g. apartment building, hospital etc· FUNC_ID – building use category, e.g. rectory, convent, residence etc· GEO_ID – GeoDirectory building number· GUID – unique ID of the building polygon· WAY_SEG_VALUE – ID of the adjacent road in the WAY theme· SHAPE_Area – polygon area
Figure 10.7: Cork Agglomeration plus 2km buffer = 121,500 buildings

Offer Ref: 587/16/2 Page 10 of 17 October 2017
Figure 10.8: Dublin Agglomeration plus 2km buffer = 618,687 buildings
10.4 DevelopingthePopulationDistributionDatasetsIdeally the GEO_ID could be used to join the GeoDirectory building data to thebuilding polygons, however it does not form a robust method at present for thefollowing reasons:
· GeoDirectory points for which there is no PRIME2 building polygon, possiblydue to recent construction; and
· Multiple GeoDirectory points within a single PRIME2 building polygon.
In order to address these two issues, and prepare the final population distributiondatasets required for the exposure assessment the following workflow is proposed.
10.4.1 Stage 1: Clip the GeoDirectory points inside building polygonsThe noise mapping software will use the PRIME2 building polygons as part of thenoise calculation model. The building polygons will have a height assigned which willbe used as part of the propagation model, and the basis for the façade receiverpoints. Therefore, the buildings within the PRIME2 theme will be used in thecalculation model, and the façade receivers used for the basis of the dwellings and

Offer Ref: 587/16/2 Page 11 of 17 October 2017
people in dwellings exposure assessment will be placed around these buildingobjects. For this reason, only GeoDirectory points inside building polygons will beconsidered for the exposure assessment, and the SAPS population data will beassigned to these buildings.
Clip dissolved GeoDirectory points with the PRIME2 BUILDING_Poly theme
Dublin County = 398,860 clipped dissolved GeoDirectory pointssum RESIDENTIAL_DELIVERY_POINTS = 532,974sum OCCUPIED_ADD_PNT = 529,265
Cork Agglomeration = 69,001 clipped dissolved GeoDirectory pointssum RESIDENTIAL_DELIVERY_POINTS = 81,913sum OCCUPIED_ADD_PNT = 80,967
10.4.2 Stage 2: Spatial join GeoDirectory Points to SAPS Area DataNext the number of occupied dwellings is to be joined to the SAPS area data.
Spatial Join SAPS areas to the clipped dissolved GeoDirectory points fromStage 1.
Join Operation: JOIN_ONE_TO_ONEKeep All Target Features - TickedMerge Rules:
BUILDING_ID = CountRESDIENTAIL_DELIVERY_POINTS = SumCOMMERCIAL_DELIVERY_POINTS = SumVACANT_ADD_PNT = SumOCCUPIED_ADD_PNT = Sum
Match Option: CONTAINS
Dublin County = 4,882 SAPS areassum RESIDENTIAL_DELIVERY_POINTS = 532,974sum OCCUPIED_ADD_PNT = 529,265
Cork Agglomeration = 778 SAPS areassum RESIDENTIAL_DELIVERY_POINTS = 81,913sum OCCUPIED_ADD_PNT = 80,967
10.4.3 Stage 3: Assign “Persons in Private Households per Occupied AddressPoint” to each SAPS Area
Using the SAPS Area output from Stage 2:
Open Attribute Table - Add Field…PPH_OcAP
Select the new PPH_OcAP attribute and Field Calculator…
PPH_OcAP = [T5_2_TP] / [OCCUPIED_ADD_PNT]
(Persons in Private Households per Occupied Address Point)

Offer Ref: 587/16/2 Page 12 of 17 October 2017
10.4.4 Stage 4: Assign “Population per Residential Delivery Point” to eachGeoDirectory delivery point
Using the SAPS Area output from Stage 3:
Spatial Join SAPS area from the end of Stage 3, to the clipped dissolvedGeoDirectory points.
Join Operation: JOIN_ONE_TO_ONEKeep All Target Features - TickedMerge Rules:
PPH_OcAP = FirstMatch Option: WITHIN
10.4.5 Stage 5: Assign Total Residents Per Building to Residential Delivery PointsUsing the GeoDirectory data output from Stage 4:
Open Attribute Table - Add Field…RESIDENTS
Select the new RESIDENTS attribute and Field Calculator…RESIDENTS = [PPH_OcAP] * [OCCUPIED_ADD_PNT]
Dublin County = 398,860 GeoDirectory pointssum RESIDENTS = 1,308,629sum RESIDENTIAL_DELIVERY_POINTS = 532,974sum OCCUPIED_ADD_PNT = 529,265
Cork Agglomeration = 69,001 GeoDirectory pointssum RESIDENTS = 190,938sum RESIDENTIAL_DELIVERY_POINTS = 81,913sum OCCUPIED_ADD_PNT = 80,967
10.4.6 Stage 6: Assign Building Use and Residents and Dwellings per Building toBuilding Polygons
Using the GeoDirectory data output from Stage 5:
Spatial Join PRIME2 BUILDING_POLY to the GeoDirectory points form theend of Stage 5.
Join Operation: JOIN_ONE_TO_ONEKeep All Target Features – TickedMerge Rules:
RESIDENTIAL_DELIVERY_POINTS = SumBUILING_USE = FirstVACANT_ADD_PNT = SumOCCUPIED_ADDR_PNT = SumPPH_OaAP = MeanRESIDENTS = Sum
Match Option: CONTAINS

Offer Ref: 587/16/2 Page 13 of 17 October 2017
This joins the Geodirectory and population data to each building polygon, and sumsthe attributes where there are multiple GeoDirectory points within a building polygon.
IMPORT TO PREDICTORThese BUILDING_POLYGONS may now be imported to Predictor as Buildings andGrouped according to the Building_Use classes:
C = CommercialB = Both Residential and CommercialR = Residential
This will help Predictor to setup façade receiver points around Residential and Mixed-Use buildings.
Note: When preparing building polygons for the noise calculation model, it is a typicalapproach to remove small buildings from the model, often <25m2, if this isundertaken it is important that only buildings with no residents or dwellings areremoved.
Figure 10.9: Dublin Agglomeration plus 2km buffer = 618,687 buildingssum RESIDENTS = 1,308,640sum RESIDENTIAL_DELIVERY_POINTS = 532,978
10.4.7 Stage 7: Create Address Points from building PolygonsUsing the building polygon data output from Stage 6:
Feature to PointInside – ticked
Offer Ref: 587/16/2 Page 14 of 17 October 2017
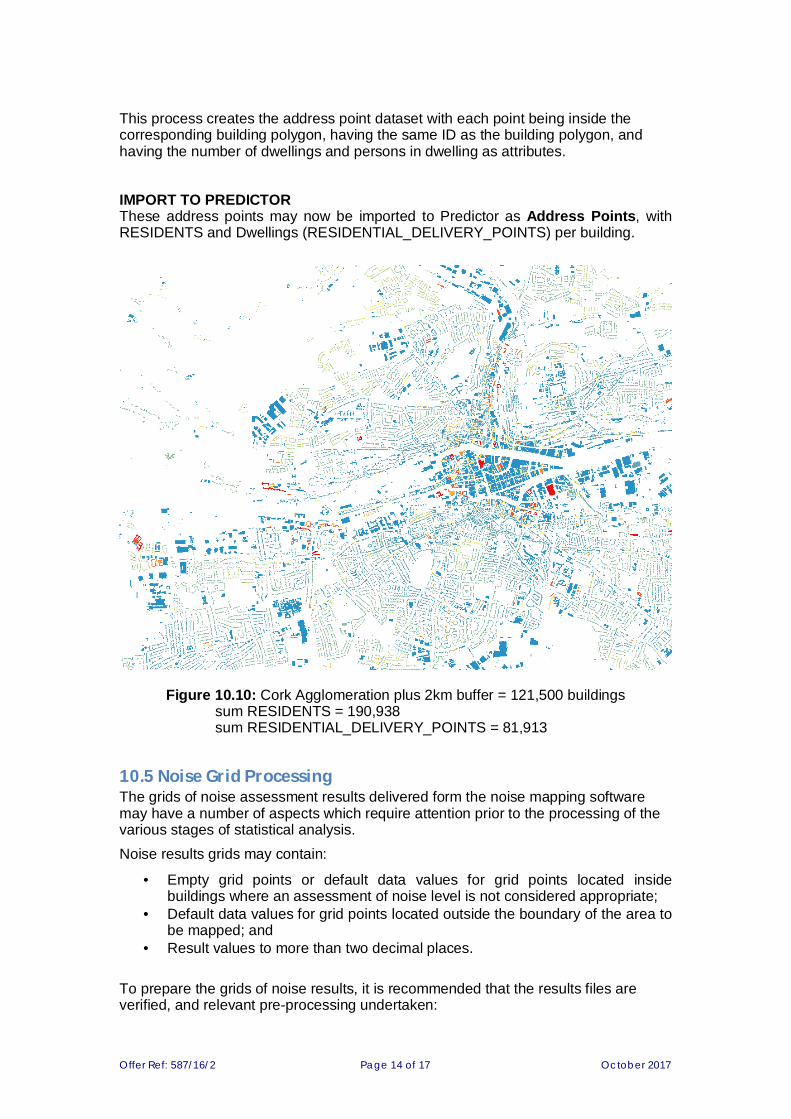
This process creates the address point dataset with each point being inside thecorresponding building polygon, having the same ID as the building polygon, andhaving the number of dwellings and persons in dwelling as attributes.
IMPORT TO PREDICTORThese address points may now be imported to Predictor as Address Points, withRESIDENTS and Dwellings (RESIDENTIAL_DELIVERY_POINTS) per building.
Figure 10.10: Cork Agglomeration plus 2km buffer = 121,500 buildingssum RESIDENTS = 190,938sum RESIDENTIAL_DELIVERY_POINTS = 81,913
10.5 NoiseGridProcessingThe grids of noise assessment results delivered form the noise mapping softwaremay have a number of aspects which require attention prior to the processing of thevarious stages of statistical analysis.
Noise results grids may contain:
· Empty grid points or default data values for grid points located insidebuildings where an assessment of noise level is not considered appropriate;
· Default data values for grid points located outside the boundary of the area tobe mapped; and
· Result values to more than two decimal places.
To prepare the grids of noise results, it is recommended that the results files areverified, and relevant pre-processing undertaken:

Offer Ref: 587/16/2 Page 15 of 17 October 2017
· Interpolation of grid values to assign indicated noise levels to points withblank or default values to produce a “seamless” results grid;
· Rounding of the results to two decimal places; and· Masking of the seamless results grids to the extent of the area to be mapped.
These processed noise results grid files may then be used for the following:
· Production of 5dB noise contour bands for graphical mapping of results; and· Production of reclassified grids into a set of 5dB categories.
o The reclassified grids are produced by assigning each point to aclassification based upon the 5dB band in which the noise levelresides.
The 5dB bands are:
· Lden <55, 55 – 59, 60 – 64, 65 – 69, 70 – 74, >=75· Lnight <50, 50 – 54, 55 – 59, 60 – 64, 65 – 69, >=70
Note: all class boundaries are .00, i.e. 55-59 is actually 55.00 to 59.99. This is inline with the approach of a number of the commercial noise mapping softwarepackages. This may require the use of a database program such as MS Access,MS SQL or MySQL where class boundaries can be programmed. The defaultbehaviour in MS Excel should not be used for this analysis as it rounds at .49 and.50, however the ROUNDDOWN function may be used to apply the classboundaries.
10.6 AreaAnalysisThe EC recommended reporting mechanism, ENDRM 2012 DF8, requiresinformation on the total area, inside and outside agglomerations, (in km2) exposed toLden higher than 55, 65 and 75dB for major roads, major railways and major airports.
The reclassified grid files may be used to calculate these areas as each 10m intervalgrid point is at the centre of an area 10m by 10m, therefore each grid pointrepresents 100 m2. This approach avoids the secondary processing required toproduce equal noise level contours based upon an interpolation between the gridpoints, and therefore avoid introducing any further uncertainty into the results.
Figure 10.11: Summary of area analysis
10.7 FaçadeNoiseLevelsFor the assessment of exposed dwellings and people living in dwellings it isnecessary to have façade noise levels around the perimeter of the buildings whichcontain dwellings.

Offer Ref: 587/16/2 Page 16 of 17 October 2017
Façade noise level calculationsThe PRIME2 building polygon dataset developed above may have been usedwithin the Predictor noise calculation software, and façade receiver pointsautomatically generated around building_use R and B polygons.
Where noise level calculations have been carried out for façade receptors aroundbuildings, they should be used as the source dataset for noise exposure for eachbuilding.
If the façade receptor points are at a distance of 0.1m from the building façade(as recommended by WG-AEN GPG v2) then the building polygon may bebuffered by 0.2m and a spatial search undertaken inside the resulting polygon tofind the highest and lowest noise level figures from the calculation point. Thesehighest and lowest noise levels may then be assigned to the building polygon asattributes.
Grid noise level calculationsWhere only 10m grids of noise levels have been calculated, or where buildingswere absent from the noise assessment model but are available within the OSiPRIME2 data, it will be necessary to generate building façade receptor locations,and assign noise levels to these points based upon interpolation from the grid ofnoise levels.
The façade receptor point should be created on the external building facades inthe following manner:
Figure 10.12: Assignment of receptor points to building facades
a) Façades are split up every 5 m from start position on with a receiver positionplaced at half distance (blue/green).b) The remaining section gets its receiver point in its middle (red).
Note: there are other means of generating façade receptor points which maybe acceptable. This approach is presented one being straightforward toimplement in GIS. It is discussed in detail within Chapter 8 of the DG JRCCNOSSOS-EU Reference Report3
At each façade receptor point the noise level should be determined byinterpolation from the 10m grid noise levels nearby. The highest and lowest noise
3 http://publications.jrc.ec.europa.eu/repository/bitstream/JRC72550/cnossos-eu%20jrc%20reference%20report_final_on%20line%20version_10%20august%202012.pdf[Accessed September 2017]

Offer Ref: 587/16/2 Page 17 of 17 October 2017
levels for each building polygon may then be identified and assigned to thebuilding polygon as attributes.
10.8 AssessmentofNoiseLevelExposureThe total number of features within dataset “RESIDENTIAL_DELIVERY_POINTS”per noise level band then be calculated using the highest noise level per building todetermine the total number of dwellings within each noise level band.
RECLASSIFIEDNOISE LEVEL
GRIDS
Total RDPs in RBsper noise level band
Dwelling Noise LevelExposure
RESIDENTIALBUILDINGS
Figure 10.13: Summary of dwelling analysis
The RESIDENTS = 0 (zero) buildings can then be filtered out of the dataset, and thetotal number of persons per building summed per noise level band, using the highestnoise level per building, to determine the total number of people exposed within eachnoise level band.
Figure 10.14: Summary of persons in dwellings analysis
The 5dB bands to be used are:
· Lden <55, 55 – 59, 60 – 64, 65 – 69, 70 – 74, >=75· Lnight <50, 50 – 54, 55 – 59, 60 – 64, 65 – 69, >=70
Note: all class boundaries are .00, i.e. 55-59 is actually 55.00 to 59.99. This is inline with the approach of a number of the commercial noise mapping softwarepackages. This may require the use of a database program such as MS Access,MS SQL or MySQL where class boundaries can be programmed. The defaultbehaviour in MS Excel should not be used for this analysis as it rounds at .49 and.50, however the ROUNDDOWN function may be used to apply the classboundaries.


![lapres Akustik & Getaran [noise mapping]](https://static.fdocuments.net/doc/165x107/55a1d09e1a28ab94468b46d9/lapres-akustik-getaran-noise-mapping.jpg)