Guidance for Calculating Incidence by Census Tract …Guidance for Calculating Incidence by Census...
51
Guidance for Calculating Incidence by Census Tract Poverty Level Using 2010 Census and 2007-2011 ACS Prepared for CSTE Disparities Workgroup by Karman Tam, MPH and Kimberly Yousey Hindes MPH CPH Kimberly Yousey-Hindes, MPH, CPH Connecticut Emerging Infections Program Yale School of Public Health Last updated July 2013 1
Transcript of Guidance for Calculating Incidence by Census Tract …Guidance for Calculating Incidence by Census...
Guidance for Calculating Incidence by Census Tract Poverty Level Using 2010
Census and 2007-2011 ACS
Prepared for CSTE Disparities Workgroup by Karman Tam, MPH and
Kimberly Yousey Hindes MPH CPHKimberly Yousey-Hindes, MPH, CPH
Connecticut Emerging Infections Program
Yale School of Public Health
Last updated July 2013
1
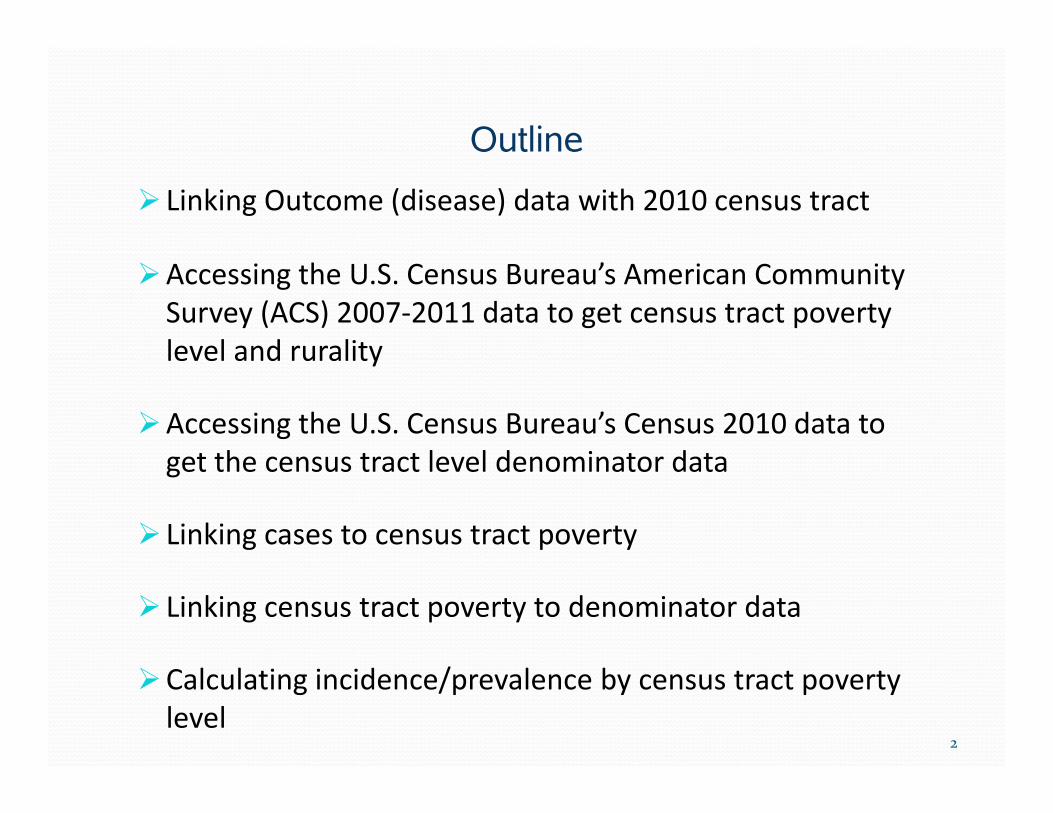
OutlineOutline Linking Outcome (disease) data with 2010 census tract
Accessing the U.S. Census Bureau’s American Community Survey (ACS) 2007‐2011 data to get census tract poverty level and ruralitylevel and rurality
Accessing the U.S. Census Bureau’s Census 2010 data to get the census tract level denominator dataget the census tract level denominator data
Linking cases to census tract poverty
Linking census tract poverty to denominator data
Calculating incidence/prevalence by census tract poverty level
2

OutlineOutline Linking Outcome (disease) data with 2010 census tract
Accessing the U.S. Census Bureau’s American Community Survey (ACS) 2007‐2011 data to get census tract poverty level and ruralitylevel and rurality
Accessing the U.S. Census Bureau’s Census 2010 data to get the census tract level denominator dataget the census tract level denominator data
Linking cases to census tract poverty
Linking census tract poverty to denominator data
Calculating incidence/prevalence by census tract poverty level
3

Linking Outcome (disease) data with 2010 census tractLinking Outcome (disease) data with 2010 census tractDelete
*
Using ArcGIS or another software, geocode patients’ addresses such that a census tract code is associated with each case.
Export the data to a Microsoft Excel spreadsheet.
Keep only the necessary data (i.e., case identification number, name, d h f d d ) dd bdemographic information, and census tract code). Addresses can be removed. This will be your case line list.
If the Census_TractID for your state had a leading zero, remove the leading zeros by doing a find and replacezeros by doing a find and replace.
Save a copy of the table. In this case, we will call the file Case_List.
* For simplicity, race rather than race-ethnicity is used in this example. Ideally, would use race-ethnicity 4

OutlineOutline Linking Outcome (disease) data with 2010 census tract
Accessing the U.S. Census Bureau’s American Community Survey (ACS) 2007‐2011 data to get census tract poverty leveltract poverty level
Accessing the U.S. Census Bureau’s Census 2010 data to get the census tract level denominator dataget the census tract level denominator data
Linking cases to census tract poverty
Linking census tract poverty to denominator data
Calculating incidence/prevalence by census tract poverty level
5

Accessing the U.S. Census Bureau’s American Community Survey (ACS) DataAmerican Community Survey (ACS) Data
Guided Search
Access the U S Census Bureau’s American Community Survey (ACS) data by Access the U.S. Census Bureau’s American Community Survey (ACS) data by going to: http://factfinder2.census.gov/faces/nav/jsf/pages/index.xhtml
Click on the Guided Search tab.6

Accessing the U.S. Census Bureau’s American Community Survey (ACS) DataAmerican Community Survey (ACS) Data
Select the option for information from a specific Select the option for information from a specific DATASET. Then click NEXT.
7
Accessing the U.S. Census Bureau’s American Community Survey (ACS) DataAmerican Community Survey (ACS) Data
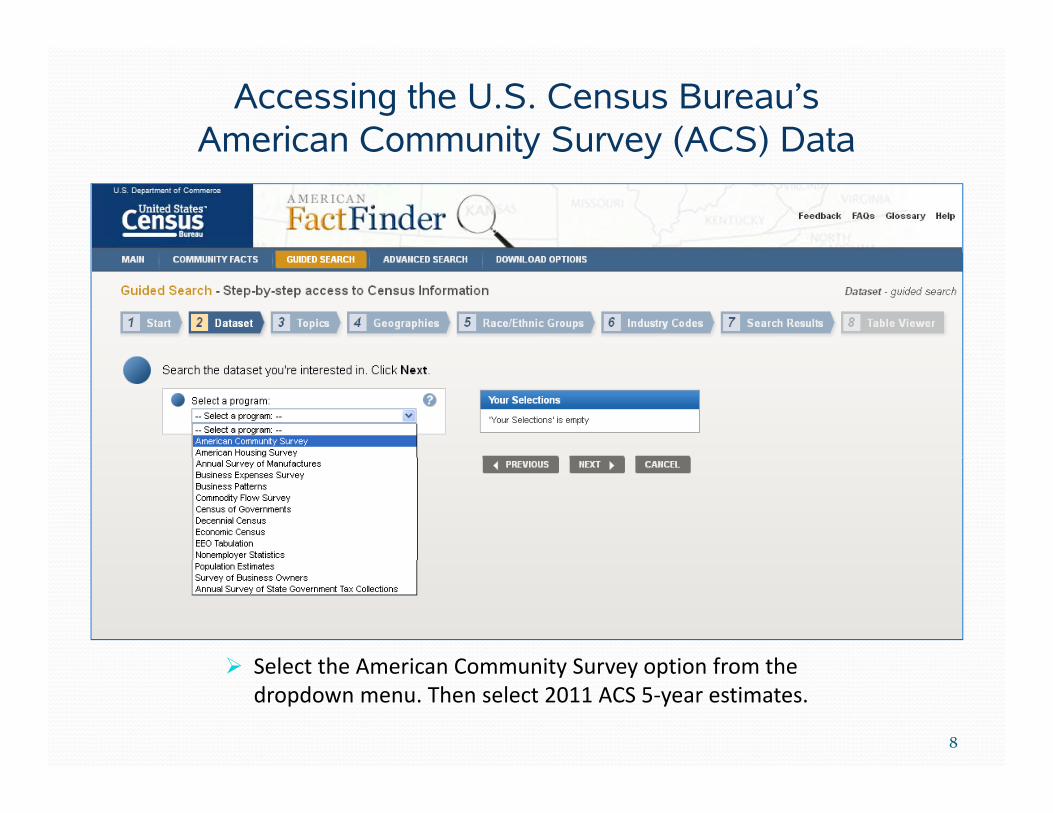
Select the American Community Survey option from the Select the American Community Survey option from the dropdown menu. Then select 2011 ACS 5‐year estimates.
8

Accessing the U.S. Census Bureau’s American Community Survey (ACS) DataAmerican Community Survey (ACS) Data
Then click NEXT Then click NEXT.
9

Accessing the U.S. Census Bureau’s American Community Survey (ACS) DataAmerican Community Survey (ACS) Data
Choose Advanced Search. Then click Continue.
10

Accessing the U.S. Census Bureau’s American Community Survey (ACS) DataAmerican Community Survey (ACS) Data
Click on the Geographies tab at the left (Note that Click on the Geographies tab at the left. (Note that the Selections window includes the correct dataset.)
11
Accessing the U.S. Census Bureau’s American Community Survey (ACS) DataAmerican Community Survey (ACS) Data
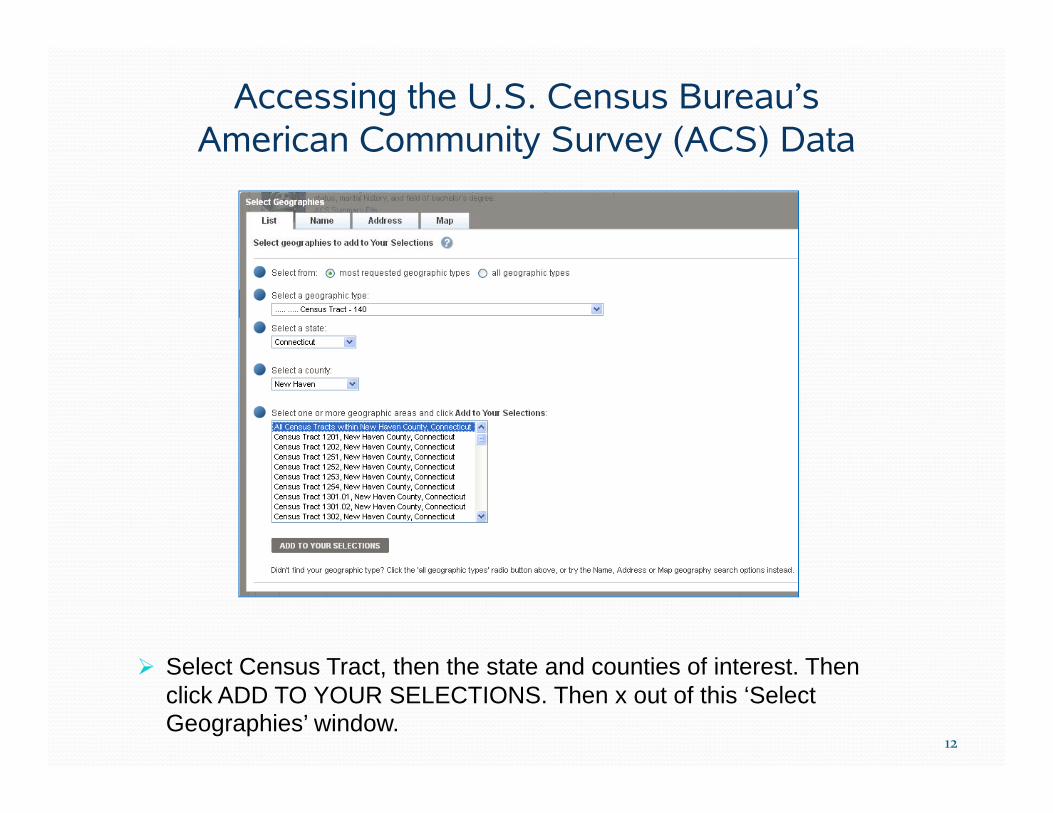
Select Census Tract then the state and counties of interest Then Select Census Tract, then the state and counties of interest. Then click ADD TO YOUR SELECTIONS. Then x out of this ‘Select Geographies’ window.
12

Accessing the U.S. Census Bureau’s American Community Survey (ACS) DataAmerican Community Survey (ACS) Data
Note: Your geographic selection should appear in this window.
Either search for poverty or scroll through the list of tables until you find S1701.
13
Accessing the U.S. Census Bureau’s American Community Survey (ACS) Data
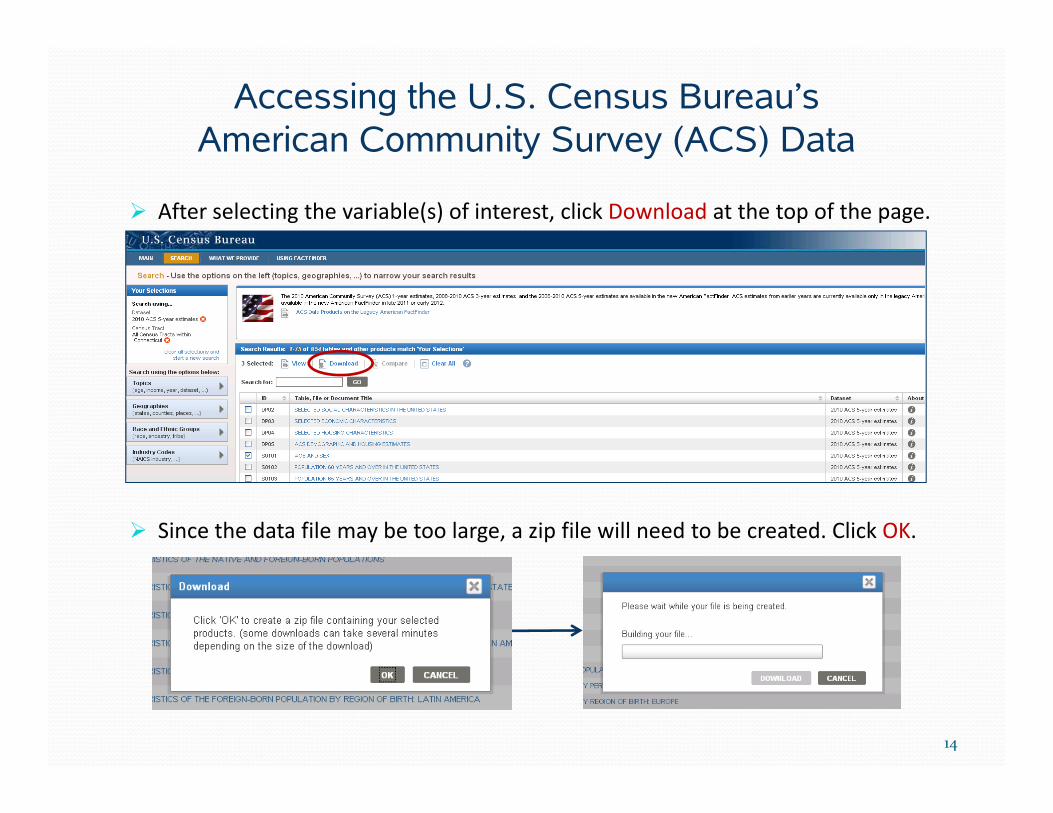
After selecting the variable(s) of interest, click Download at the top of the page.
American Community Survey (ACS) Data
Since the data file may be too large, a zip file will need to be created. Click OK.
14

Accessing the U.S. Census Bureau’s American Community Survey (ACS) Data
Aft th fil i b ilt li k th
American Community Survey (ACS) Data
After the file is built, click on the Download button.
Click OK to open the Click OK to open the file.
15

Accessing the U.S. Census Bureau’s American Community Survey (ACS) DataAmerican Community Survey (ACS) Data
When you open the zip file, you will see .TXT and .CSV files. The .TXT files provide background information related to the file. The CSV files contain the actual data which can be opened by Excel or.CSV files contain the actual data, which can be opened by Excel or other programs.
Open the .CSV file that ends ‘with_ann.csv’.
The .CSV file that ends with ‘metadata.csv’ is useful because it contains the descriptions of each variable in the main .CSV file.
16

Accessing the U.S. Census Bureau’s American Community Survey (ACS) DataAmerican Community Survey (ACS) Data
Save a copy of the table Save a copy of the table.
17
Accessing the U.S. Census Bureau’s American Community Survey (ACS) DataAmerican Community Survey (ACS) Data
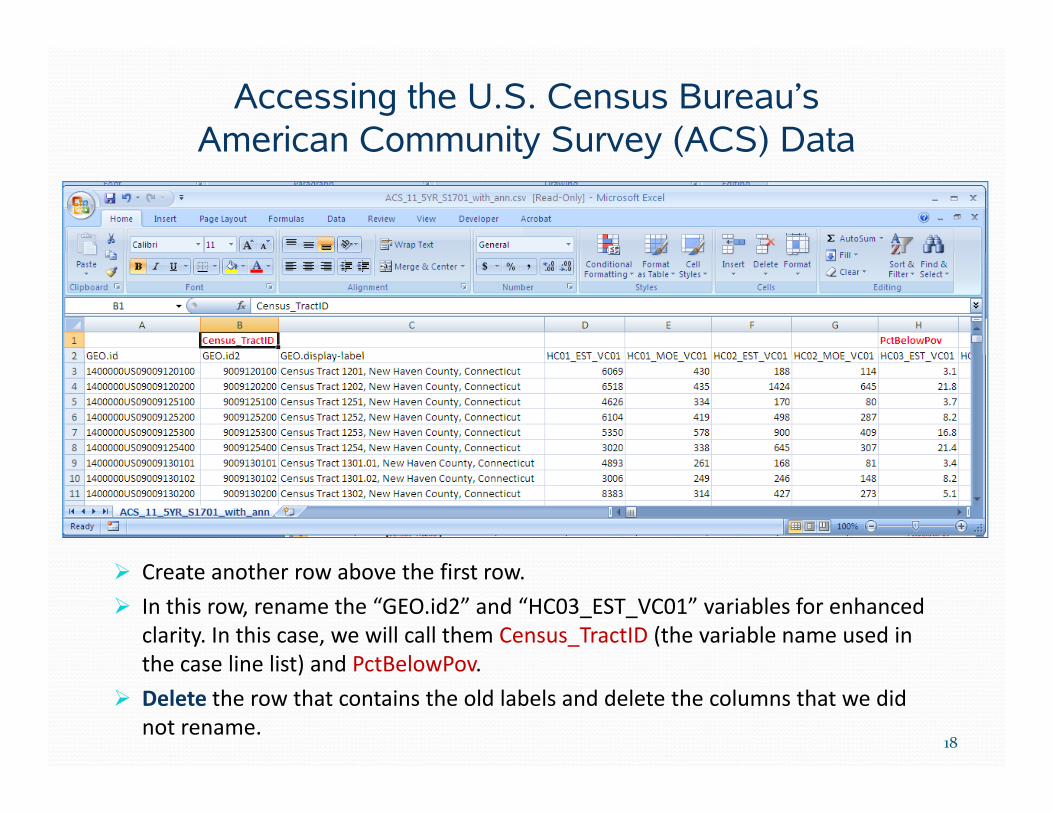
Create another row above the first row.
In this row, rename the “GEO.id2” and “HC03_EST_VC01” variables for enhanced clarity. In this case, we will call them Census_TractID (the variable name used in the case line list) and PctBelowPovthe case line list) and PctBelowPov.
Delete the row that contains the old labels and delete the columns that we did not rename.
18

Accessing the U.S. Census Bureau’s American Community Survey (ACS) DataAmerican Community Survey (ACS) Data
Delete all of the other columns, keeping only Census_TractIDand PctBelowPov.
Don’t forget to save your table! Save As if you would like to Don t forget to save your table! Save As if you would like to keep a copy of the original data for later reference. We will call the file ACS_Poverty.
19

OutlineOutline Linking Outcome (disease) data with 2010 census tract
Accessing the U.S. Census Bureau’s American Community Survey (ACS) 2006‐2010 data to get census tract poverty levellevel
Accessing the U.S. Census Bureau’s Census 2010 data to get the census tract level denominator dataget the census tract level denominator data
Linking cases to census tract poverty
Linking census tract poverty to denominator data
Calculating incidence/prevalence by census tract poverty level
20

Accessing the U.S. Census Bureau’s Census 2010 Data
Guided Search
Census 2010 Data
Access the U S Census Bureau’s American Community Survey (ACS) data at: Access the U.S. Census Bureau’s American Community Survey (ACS) data at: http://factfinder2.census.gov/faces/nav/jsf/pages/index.xhtml
Click on the Guided Search tab.21
Accessing the U.S. Census Bureau’s Census 2010 DataCensus 2010 Data
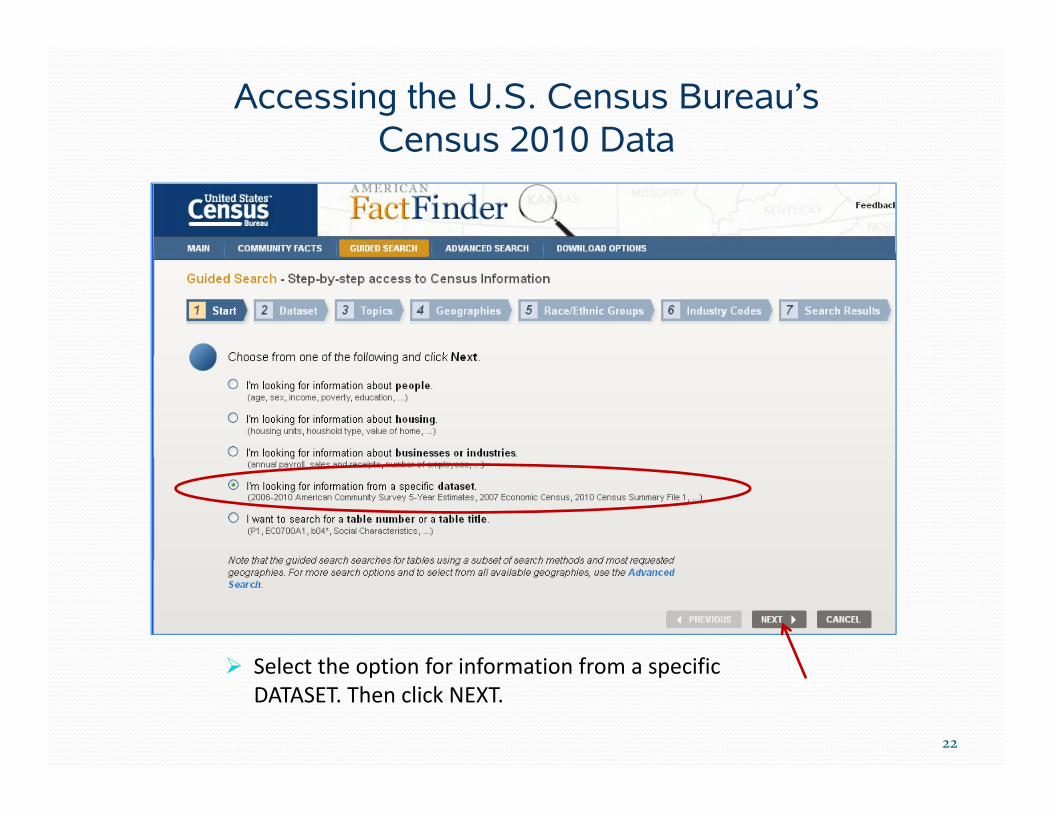
Select the option for information from a specific Select the option for information from a specific DATASET. Then click NEXT.
22
Accessing the U.S. Census Bureau’s Census 2010 DataCensus 2010 Data
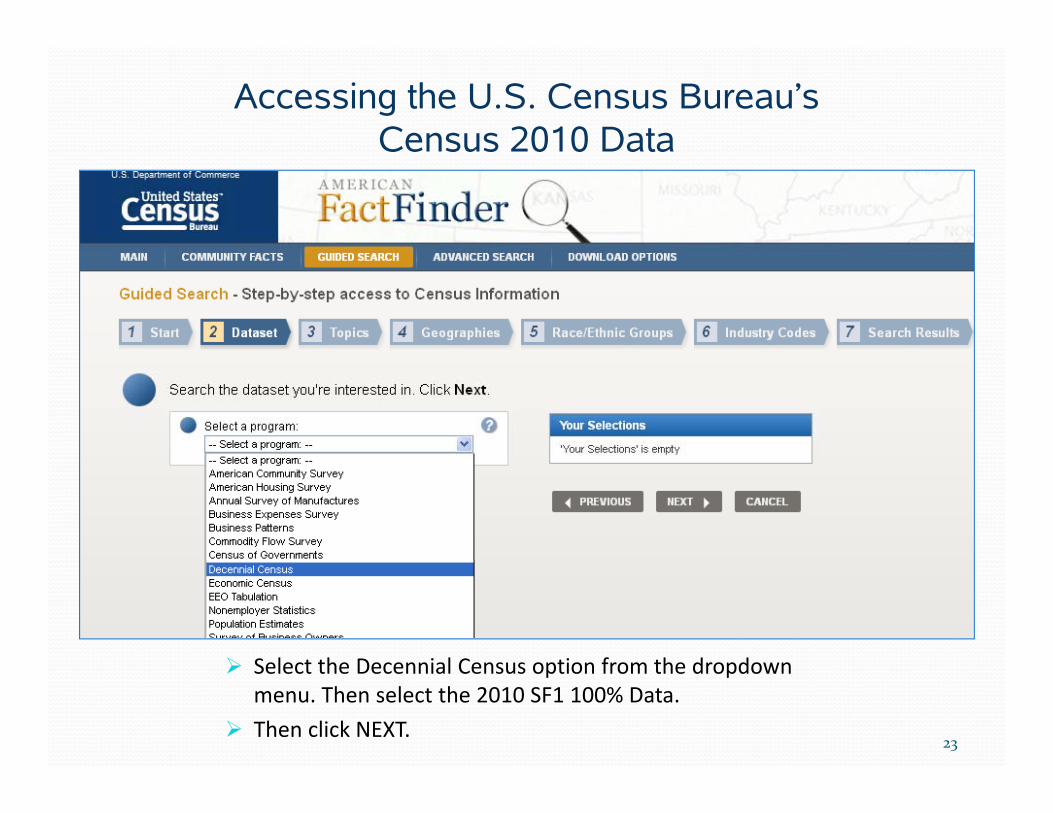
Select the Decennial Census option from the dropdown
23
Select the Decennial Census option from the dropdown menu. Then select the 2010 SF1 100% Data.
Then click NEXT.

Accessing the U.S. Census Bureau’s Census 2010 DataCensus 2010 Data
Choose Advanced Search. Then click Continue.
24

Accessing the U.S. Census Bureau’s Census 2010 DataCensus 2010 Data
25
Click on the Geographies tab at the left. (Note that the Selections window includes the correct dataset.)

Accessing the U.S. Census Bureau’s Census 2010 DataCensus 2010 Data
The Select Geographies pop‐up box will appear.
Select Census Tract, followed by the relevant counties or entire state.26
Accessing the U.S. Census Bureau’s Census 2010 Data
C T t All C
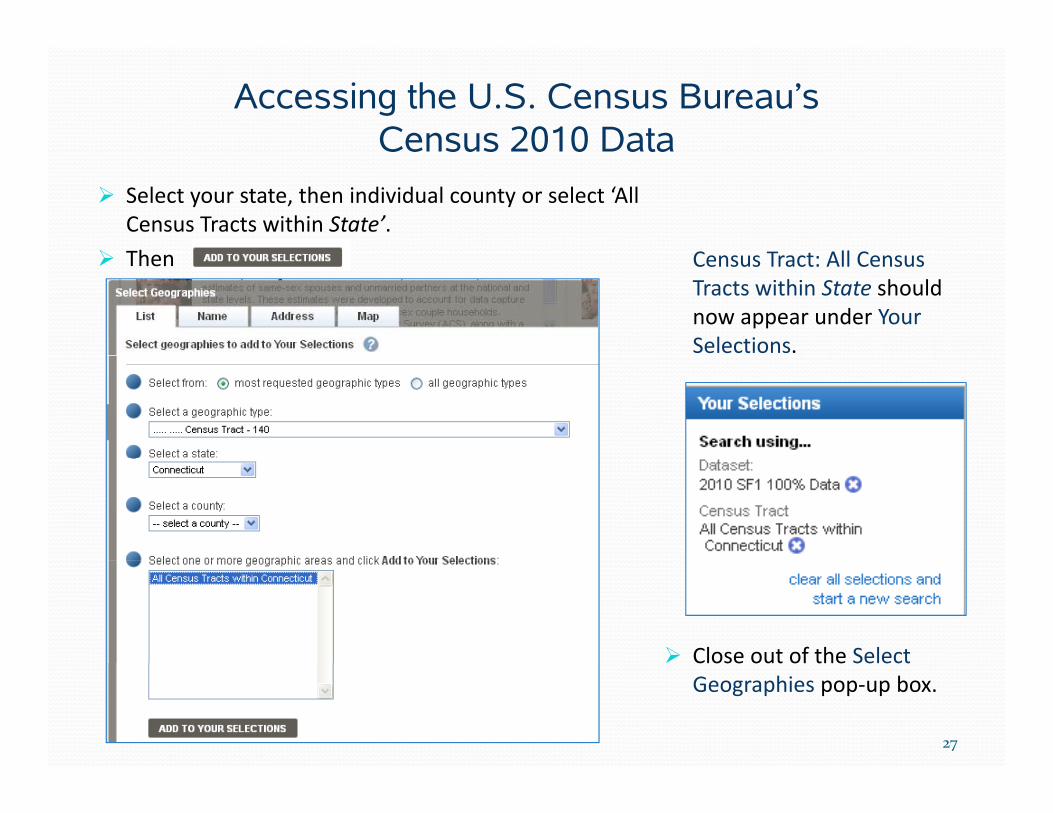
Select your state, then individual county or select ‘All Census Tracts within State’.
Th
Census 2010 Data
Census Tract: All Census Tracts within State should now appear under Your Selections.
Then
Close out of the Select Close out of the SelectGeographies pop‐up box.
27

Accessing the U.S. Census Bureau’s Census 2010 DataCensus 2010 Data
Select (for this demonstration):
Total Population (P1)
Race (P3)See next page for more detailed files for raceRace (P3)
Age Groups and Sex: 2010 (QT‐P1)
then Download.
detailed files for race-ethnicity and race-ethnicity by age
28

Accessing the U.S. Census Bureau’s Census 2010 Data
To use race‐ethnicity instead of race alone, also download:
Census 2010 Data
y ,
Hispanic or Latino and not Hispanic by Race (P9)
May need more detailed file of race‐ethnic groups by age to enable age‐standardization. The following files provide this:
Sex by Age (in single year increments) for various mutually exclusive race‐ethnic groups (8 files, PCT 12H through PCT 12O)
PCT 12H – Sex by Age Hispanic; PCT 12I – Sex by Age non‐Hispanic whites; PCT 12J – Sex by Age non‐Hispanic blacks; etc.
Note: This guide does not cover these files, but the process for using them in incidence calculations is the same.
29

Accessing the U.S. Census Bureau’s Census 2010 Data
Since the data files may be too large, a zip file will need to be created. Click OK.
Census 2010 Data
After the file is built, click on the Download button.
30

Accessing the U.S. Census Bureau’s Census 2010 DataCensus 2010 Data
Click OK to open the file.
There will be a number of .TXT and .CSV files. The .TXT files provide b k d fbackground information about the data files.
Open the .CSV file for Total Population (P1)Total Population (P1).
31
Accessing the U.S. Census Bureau’s Census 2010 DataCensus 2010 Data
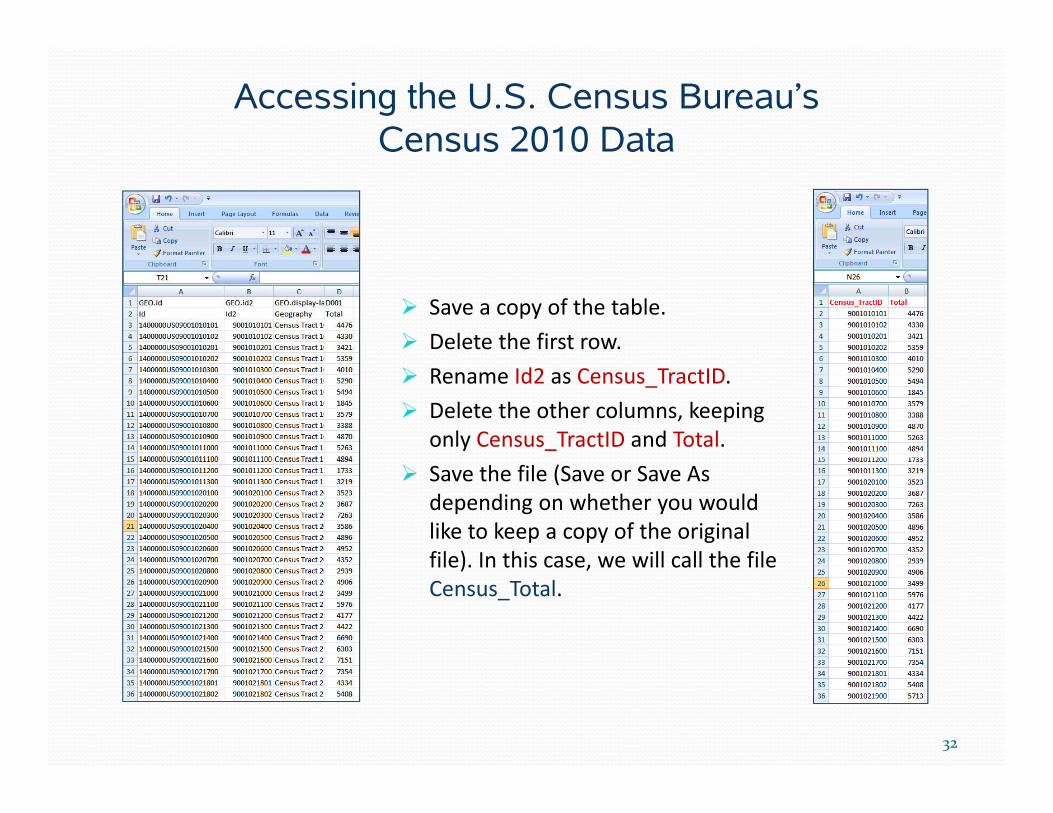
Save a copy of the table.
Delete the first row.
Rename Id2 as Census_TractID.
Delete the other columns, keeping only Census_TractID and Total.
Save the file (Save or Save As depending on whether you would like to keep a copy of the original file) In this case we will call the filefile). In this case, we will call the file Census_Total.
32

Accessing the U.S. Census Bureau’s Census 2010 Data
Open the file for Race (P3) and
Census 2010 Data
save a copy of the table.
Rename GEO.Id2 to Census_TractID.
R th 7 t i Rename the 7 race categories you will keep:
White
BlackBlack
AmIndian
Asian
PacIslPacIsl
Other
Multirace
Delete the other columns Delete the other columns, keeping only Census_TractIDand the race categories.
33

Accessing the U.S. Census Bureau’s Census 2010 DataCensus 2010 Data
Save (Save As if you would Save (Save As if you would like to keep an original copy for future reference). In this case, we will call the file Census_Race.
34
Accessing the U.S. Census Bureau’s Census 2010 Data
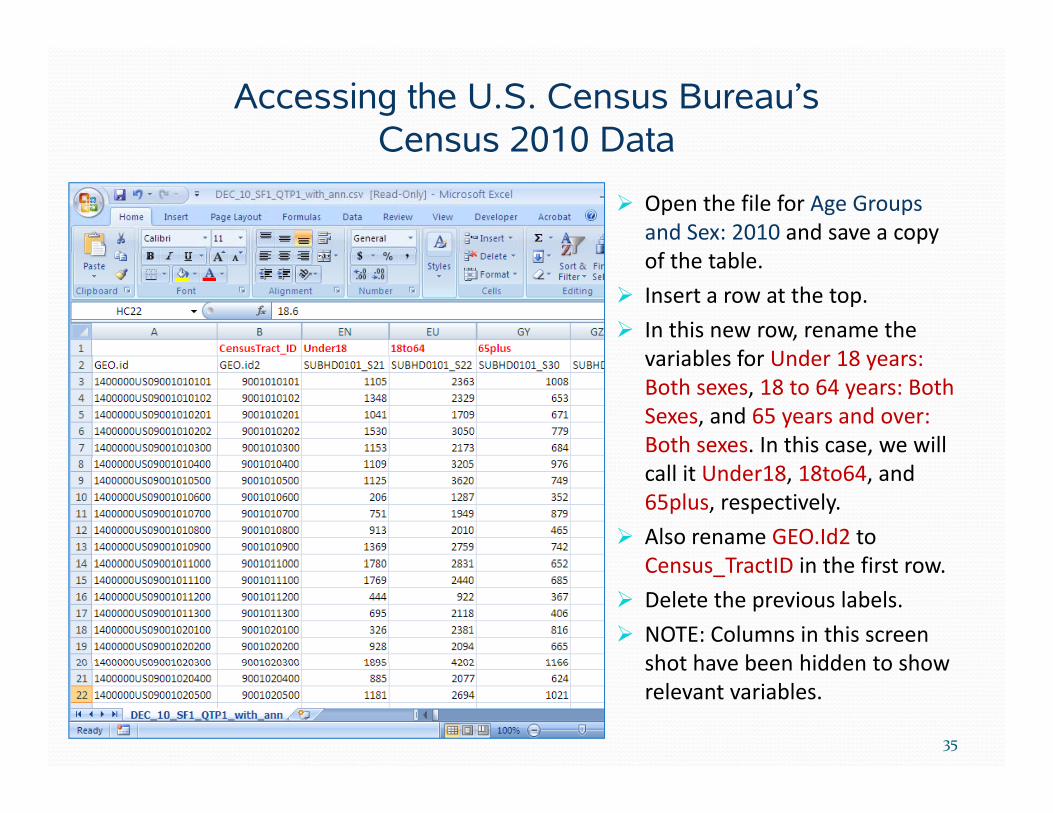
Open the file for Age Groups and Sex: 2010 and save a copy f h bl
Census 2010 Data
of the table.
Insert a row at the top.
In this new row, rename the variables for Under 18 years:variables for Under 18 years: Both sexes, 18 to 64 years: Both Sexes, and 65 years and over: Both sexes. In this case, we will call it Under18, 18to64, and 65plus, respectively.
Also rename GEO.Id2 to C T tID i th fi tCensus_TractID in the first row.
Delete the previous labels.
NOTE: Columns in this screen shot have been hidden to showshot have been hidden to show relevant variables.
35

Accessing the U.S. Census Bureau’s Census 2010 DataCensus 2010 Data
Delete the other columns, e ete t e ot e co u s,keeping only Census_TractID, Under18, 18to64, and 65plus65plus.
Save (Save As if you would like to keep an original copy for future reference). In thisfor future reference). In this case, we will call the file Census_Age.
36

OutlineOutline Linking Outcome (disease) data with 2010 census tract
Accessing the U.S. Census Bureau’s American Community Survey (ACS) 2006‐2010 data to get census tract poverty levellevel
Accessing the U.S. Census Bureau’s Census 2010 data to get the census tract level denominator dataget the census tract level denominator data
Linking cases to census tract poverty
Linking census tract poverty to denominator data
Calculating incidence/prevalence by census tract poverty level
37

Linking Cases to Census Tract PovertyLinking Cases to Census Tract Poverty
Open SAS with a new SAS editor.
l Bring in Case_List.xls and ACS_Poverty.xls. We will call the imported data Case_List and ACS Poverty.CS_ o e ty.
Sort each table by Census_TractIDthen merge the tables by Census_TractID. We will call this data Case_Poverty.
We have now created a linelist in which each observation contains case data AND census tractcase data AND census tract poverty level.
Note: May need to add/remove leading zeroes in Census_TractID.g _
See next slide to create a de‐identified linelist.
38

[Creating a Deidentified Linelist][Creating a Deidentified Linelist]
At this point, it is easy to delete the identifiers (name, address, census tract, etc.) leaving a simple linelist containing CaseID and census tract poverty level.
We will do this in SAS by creating a new dataset called Case_Poverty_No_ID, but it could also be done in Excel or another software program of your choice. We will NOT use the de identified dataset again in this examplewill NOT use the de‐identified dataset again in this example.
39
Linking Cases to Census Tract PovertyLinking Cases to Census Tract Poverty
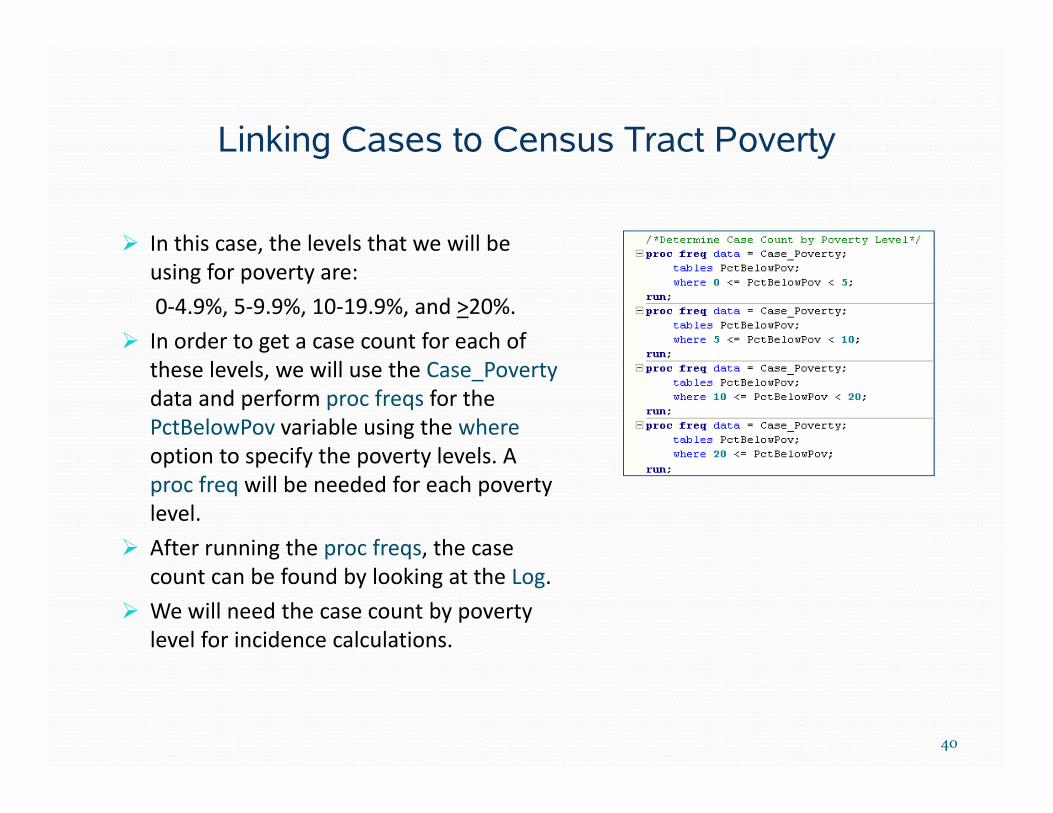
In this case, the levels that we will be ,using for poverty are:
0‐4.9%, 5‐9.9%, 10‐19.9%, and >20%.
In order to get a case count for each of these levels, we will use the Case_Povertydata and perform proc freqs for the PctBelowPov variable using the whereoption to specify the poverty levels Aoption to specify the poverty levels. A proc freq will be needed for each poverty level.
After running the proc freqs, the case count can be found by looking at the Log.
We will need the case count by poverty level for incidence calculations.
40

Linking Cases to Census Tract PovertyLinking Cases to Census Tract Poverty
After running the proc freqs the case
0‐4.9%proc freqs, the case counts by poverty level can be found by looking at the Log.5‐9.9%
10‐19.9%
>20%
41

Linking Cases to Census Tract PovertyLinking Cases to Census Tract Poverty
You will also need to determine the case counts for each race by poverty level. This can be done using Excel or SAS Ultimately you will need to determine the casecan be done using Excel or SAS. Ultimately, you will need to determine the case counts as follows
PctBelowPov White Black AmIndian Asian PacIsl Other Multirace0‐4.9%%5‐9.9%10‐19.9%>20%
The same is true for age category.
Age Category Under18 18to64 65plus0‐4.9%5‐9.9%10‐19.9%>20%
42
OutlineOutline Linking Outcome (disease) data with 2010 census tract
Accessing the U.S. Census Bureau’s American Community Survey (ACS) 2006‐2010 data to get census tract poverty levellevel
Accessing the U.S. Census Bureau’s Census 2010 data to get the census tract level denominator dataget the census tract level denominator data
Linking cases to census tract poverty
Linking census tract poverty to denominator data
Calculating incidence/prevalence by census tract poverty level
43
Linking Census Tract Poverty to Denominator DataLinking Census Tract Poverty to Denominator Data
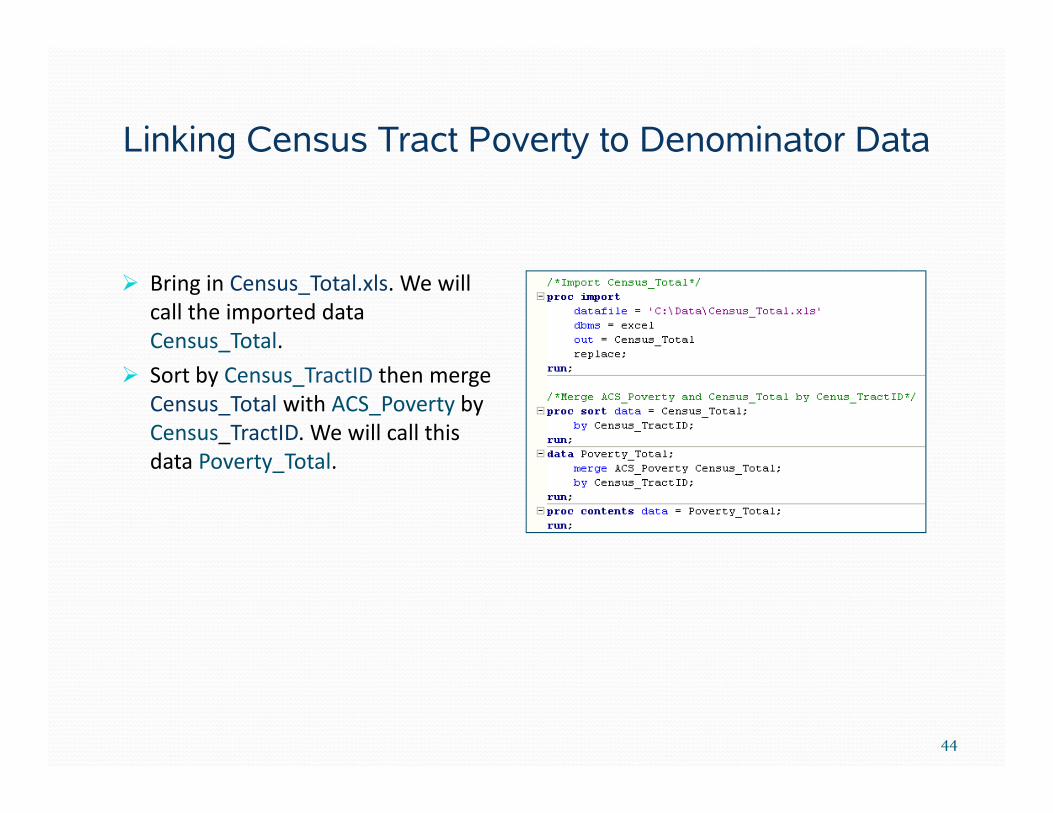
Bring in Census_Total.xls. We will call the imported data Census_Total.
Sort by Census_TractID then merge Census_Total with ACS_Poverty by Census_TractID. We will call this data Poverty Totaldata Poverty_Total.
44

Linking Census Tract Poverty to Denominator DataLinking Census Tract Poverty to Denominator Data In order to get a population count for each
poverty level, we will use the Poverty Total data and perform procPoverty_Total data and perform proc prints for the sum of the Total variable using the where option to specify the poverty levels. A proc print will be needed f h l lfor each poverty level.
After running the proc prints, the After running the proc prints, the population counts can be found by looking at the Output.
These will become the denominators for our incidence calculations.
45

Linking Census Tract Poverty to Denominator DataLinking Census Tract Poverty to Denominator Data
The same can be done to determine the population for each race by poverty level.
Import the Census_Race and ACS_Poverty files.
Merge the data sets by Census_TractID.
Run proc prints using the sum option for each race by poverty level.
46

Linking Census Tract Poverty to Denominator DataLinking Census Tract Poverty to Denominator Data
The same can be done to determine the population for each age category by poverty level.
Import the Census_Age and ACS_Povertyfiles.
Merge the data sets by Census_TractID.
Run proc prints using the sum option for each age category by poverty level.
47

Linking Census Tract Poverty to Denominator Data
You will also need to determine the denominator for each race by poverty level. This can be done using Excel or SAS Ultimately you will need to determine the
Linking Census Tract Poverty to Denominator Data
This can be done using Excel or SAS. Ultimately, you will need to determine the denominators as follows
PctBelowPov White Black AmIndian Asian PacIsl Other Multirace0‐4.9%%5‐9.9%10‐19.9%>20%
The same is true for age category.
Age Category Under18 18to64 65plus0‐4.9%5‐9.9%10‐19.9%>20%
48

OutlineOutline Linking Outcome (disease) data with 2010 census tract
Accessing the U.S. Census Bureau’s American Community Survey (ACS) 2006‐2010 data to get census tract poverty levellevel
Accessing the U.S. Census Bureau’s Census 2010 data to get the census tract level denominator dataget the census tract level denominator data
Linking cases to census tract poverty
Linking census tract poverty to denominator data
Calculating incidence/prevalence by census tract poverty level
49

Calculating Incidence/Prevalence byCensus Tract Poverty LevelCensus Tract Poverty Level
The incidence for each poverty level is determined as the case count for that t l l di id d b th l ti f th t l lpoverty level divided by the population for the poverty level.
Incidence (0‐4.9% Level) = (Case Count for 0‐4.9% Level)/(Population for 0‐4.9% Level)
Incidence (5‐9 9% Level) = (Case Count for 5‐9 9% Level)/(Population for 5‐9 9% Level)Incidence (5‐9.9% Level) = (Case Count for 5‐9.9% Level)/(Population for 5‐9.9% Level)
Incidence (10‐19.9% Level) = (Case Count for 10‐19.9% Level)/(Population for 10‐19.9% Level)
Incidence (>20% Level) = (Case Count for >20% Level)/(Population for >20% Level)
50

EXAMPLE
Influenza-Associated Hospitalization Incidence by Census Tract Poverty Level
EXAMPLE
by Census Tract Poverty Levelp.
) 50
60
70
Inci
denc
e pe
r 100
,000
po
20
30
40
(p
0
10
Low (0‐4.9%) Medium‐low (5‐9.9%)
Medium‐high (10‐19.9%)
High (>20%)
51