GTY Corporate Deck 4Q19 vF - static.seekingalpha.com
22
Investor Presentation
Transcript of GTY Corporate Deck 4Q19 vF - static.seekingalpha.com

Investor Presentation

Safe Harbor Statement
1
Certain statements in this Presentation constitute “forward‐looking statements” within the meaning of the federal securities laws. Forward‐looking statements arestatements that relate to management’s expectations or beliefs, future plans and strategies, future financial performance and similar expressions concerning mattersthat are not historical facts. In some cases, forward‐looking statements can be identified by the use of forward‐looking terminology such as “may,” “will,” “should,”“expects,” “intends,” “plans,” “anticipates,” “believes,” “estimates,” “predicts,” or “potential.” Such forward‐looking statements reflect current views with respect tothe matters referred to and are based on certain assumptions and involve known and unknown risks, uncertainties and other important factors, many of which arebeyond the Company’s control, that could cause the actual results, performance, or achievements of the Company to differ materially from any future results,performance, or achievement implied by such forward‐looking statements.
While forward‐looking statements reflect the Company’s good faith beliefs, assumptions and expectations, they are not guarantees of future performance. Except asrequired under the federal securities laws and the rules and regulations of the SEC, the Company does not undertake any obligation to release publicly any revisions tothe forward‐looking statements to reflect events or circumstances after the date of this Presentation or to reflect the occurrence of unanticipated events. Examples offorward‐looking statements in this Presentation include, but are not limited to, statement(s) relating to (a) the Company’s Portfolio, Net Lease Portfolio, Long‐TermLeases and Rent Escalators, Tenant Base, Growth Platform, Market Opportunity, and Redevelopment Projects, (b) Industry Fundamentals, (c) the Company’s BalanceSheet, Dividend Growth and Investment Highlights; and (d) the Company’s expected quarterly dividends and growth. Other unknown or unpredictable factors couldalso have material adverse effects on our business, financial condition, liquidity, results of operations and prospects. For a further discussion of these and other factorsthat could cause the Company’s future results to differ materially from any forward‐looking statements, see the Company’s Annual Report on Form 10‐K for the yearended December 31, 2019, and the Company’s other filings with the SEC, including, in particular, the section entitled “Risk Factors” contained therein. In light of theserisks, uncertainties, assumptions and factors, there can be no assurance that the results and events contemplated by the forward‐looking statements contained in thisPresentation will, in fact, transpire. Moreover, because the Company operates in a very competitive and rapidly changing environment, new risks are likely to emergefrom time to time. Given these risks and uncertainties, potential investors are cautioned not to place undue reliance on these forward‐looking statements as aprediction of future results.
Unless otherwise noted in this Presentation, all reported financial data is presented as of the period ended December 31, 2019, and all portfolio data is as ofDecember 31, 2019.
This Presentation presents certain non‐GAAP financial measures, including the Company’s Funds From Operations (“FFO”) and Adjusted Funds From Operations(“AFFO”). Please refer to the Appendix of this Presentation for complete reconciliations between each of these non‐GAAP financial measures to the most directlycomparable GAAP financial measure. The Company believes that FFO and AFFO are helpful to investors in measuring its performance because both FFO and AFFOexclude various items included in GAAP net earnings that do not relate to, or are not indicative of, the Company’s core operating performance. The Company paysparticular attention to AFFO, a supplemental non‐GAAP performance measure, as the Company believes it best represents its core operating performance and allowsanalysts and investors to better assess the Company’s core operating performance. Further, the Company believes that AFFO is useful in comparing the sustainability ofthe Company’s core operating performance with the sustainability of the core operating performance of other real estate companies.
The information contained herein has been prepared from public and non‐public sources believed to be reliable. However, the Company has not independently verifiedcertain of the information contained herein, and does not make any representation or warranty as to the accuracy or completeness of the information contained in thisPresentation.

Getty Realty at a GlanceNet Lease REIT Specializing in Convenience & Gas and Other Automotive Properties ⁽¹⁾1
Track Record of Partnering with Tenants in Healthy and Consolidating Retail Sectors
Multiple Growth Channels
Flexible / Low Leverage Balance Sheet Supports Growth
$1.8bnEnterprise Value
GTYNYSE Ticker Symbol
4.7%Dividend Yield
2
3
4
Established &High Growth Markets
28 Unitary / 118 IndividualLeases
Alternative Use Opportunities
1.6% Rent Escalations⁽²⁾Organic
255 Properties / $606 million⁽³⁾ Acquisitions
13 Completed/14 In‐Progress⁽⁴⁾Redevelopments
4.4xNet Debt to EBITDA
BBB‐ / StableFitch Rated
3.3xFixed Charge Coverage
21) Market data as of February 26, 2019.2) Please see page seven for additional information.3) Acquisitions completed 2015 to 2019.4) Please see page 14 for additional information.

National Net Lease Portfolio
945 Properties Across 33 States
9%+$31mm
Mortgage Portfolio
$124mmABR ⁽¹⁾
99%Occupancy ⁽³⁾
5%AFFO / Share
CAGR ⁽²⁾
57%ABR in
Top 25 MSAs
~10 yearsWeighted Avg. Lease Term ⁽⁴⁾
2.3xUnit Level
Rent Coverage ⁽⁴⁾
72%On Corner Locations
31) Based on GAAP annualized base rent (ABR) as of December 31, 2019.2) Adjusted Fund From Operations Per Share Compound Annual Growth Rate is 2015 to 2019.3) Occupancy calculation excludes five properties classified as redevelopment.4) Please see page seven for additional information.
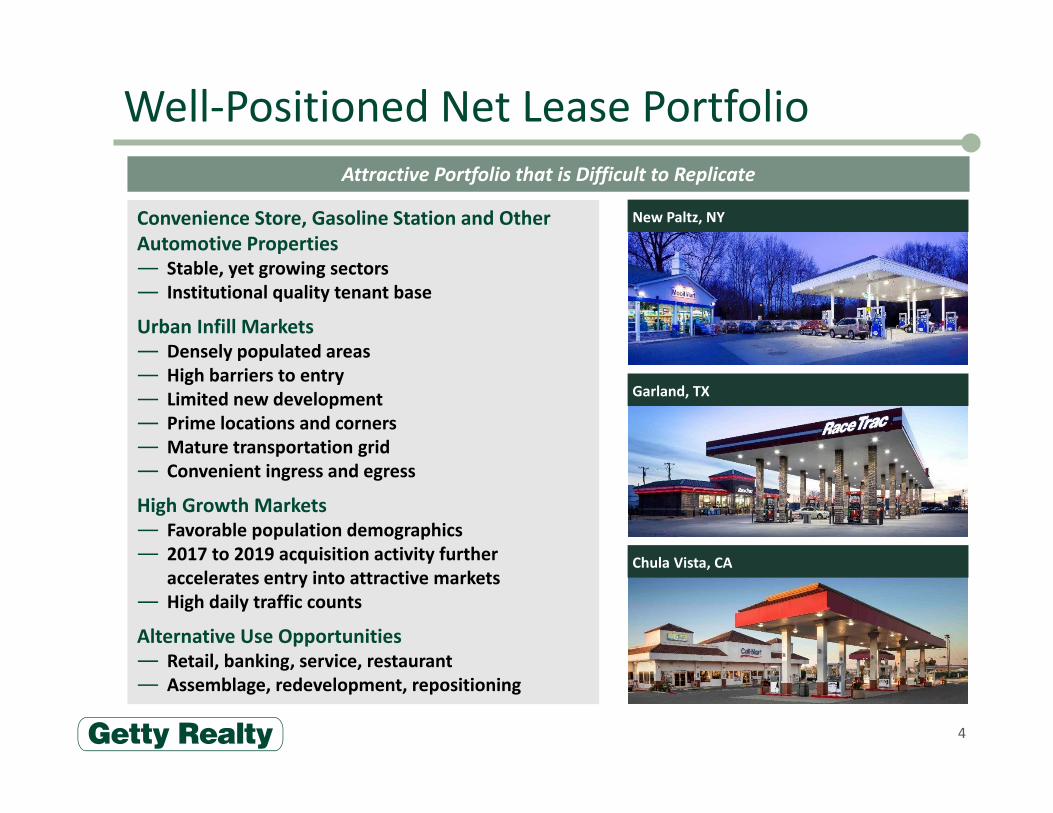
Convenience Store, Gasoline Station and Other Automotive Properties— Stable, yet growing sectors— Institutional quality tenant base
Urban Infill Markets— Densely populated areas— High barriers to entry — Limited new development— Prime locations and corners— Mature transportation grid— Convenient ingress and egress
High Growth Markets— Favorable population demographics — 2017 to 2019 acquisition activity further
accelerates entry into attractive markets — High daily traffic counts
Alternative Use Opportunities— Retail, banking, service, restaurant— Assemblage, redevelopment, repositioning
4
Garland, TX
Chula Vista, CA
New Paltz, NY
Well‐Positioned Net Lease PortfolioAttractive Portfolio that is Difficult to Replicate

Rank Market % of ABR
Public Company
1 Global 16% 2 United Oil 14%
3 Chestnut Petroleum 9%
4 GPM Investments 8%
5 Empire Petroleum 8%
6 Applegreen 7% 7 Nouria Energy 7%
8 Cross America 6%
Diversified Tenant Base with High Quality Brands
5
Getty’s Top 15 Tenants (1)
Nationally Recognized Fuel Brands (2)
1) Based on GAAP annualized base rent (ABR) as of December 31, 2019.2) All trademarks, service marks, trade names, brands and logos are the property of their respective owners.
Rank Market % of ABR
Public Company
9 Capitol Petroleum 4%
10 BP 2% 11 Aloha 2% 12 Division St. 2%
13 Reid 1%
14 Circle K 1% 15 7‐Eleven 1%
Other Tenants 12%

Rank Market % of ABR
Top 25Market (2)
9 Phoenix 3% 10 Dallas‐Fort Worth 2% 11 Hartford, CT 2%
12 Honolulu 2%
13 Riverside‐San Bernardino 2% 14 Richmond, VA 2%
15 Manchester, NH 2%
Other 29%
Located in High Density Metropolitan Markets
61) Based on cash annualized base rent (ABR), as of December 31, 2019.2) Core Based Statistical Areas as defined by United States Office of Management and Budget.
Getty’s Top 15 Markets (1) (2)
Rank Market % of ABR
Top 25Market (2)
1 New York 23% 2 Washington D.C. 9% 3 Boston 6% 4 Columbia, SC 5%
5 Denver 4% 6 Worcester, MA 3%
7 Poughkeepsie, NY 3%
8 Los Angeles 3%
Top 25 Metropolitan Markets Represent 57% of ABR

Stable Long‐Term Lease Structure
Sustainable cash flows supported by long‐term triple‐net leases— Typical annual rent escalations of 1.0% ‐ 2.0% and rent coverage ratios of 1.5x – 2.0x— Unitary lease portfolio weighted average rent escalations of 1.6% and rental coverage of 2.3x ⁽¹⁾— Tenant credit visibility via site and tenant financial statements
Majority of triple‐net leases have 15‐year initial terms— Leases are typically 15 or 20 years with extension options— Weighted average current lease term of approximately 10 years
42.3% of contractual annualized base rent attributable to leases with initial terms expiring in 2030 or beyond
Stable Long‐Term Leases with Rent Escalators
71) Unitary lease portfolio rental coverage is calculated one quarter in arrears on a trailing twelve‐month basis at quarter end based on site level
financial information where provided by tenants. Getty does not independently verify financial information provided by its tenants.
1.9% 2.0% 2.5% 2.9% 2.9% 5.1%10.4%
15.4%
5.8%8.8%
42.3%
2020 2021 2022 2023 2024 2025 2026 2027 2028 2029 2030+

Quality Assets With Key Differentiation
81) Includes branded QSRs and convenience stores with unbranded fresh food offerings.2) Includes free‐standing QSRs and regional retailers.
Portfolio of well‐positioned properties at prominent corner locations
Key Attributes Driving Site Traffic
— 74% of properties have a convenience store
— 10% of sites have branded QSRs, including several nationally recognized retail brands
— 72% of properties located at corner locations
— 14% of properties include car washes
Asset Highlights Portfolio Detail (945 Properties)
Nationally Branded Quick Service Restaurants

9
Optimizing Portfolio to Meet Industry Demand Property Attributes of Recently Acquired Assets Reflect Evolving Consumer Preferences
Legacy Assets1(499 properties)
Lot S
ize
Acquired Assets1(446 properties)
Total Portfolio(945 properties)
Build
ing Size
0.5 – 1.0 acres
< 0.5 acres
1.0 – 1.5 acres
> 1.5 acres
1,501 –3,000 sf
< 1,500 sf
> 3,000 sf
1) Legacy assets are those properties acquired prior to 2009. Acquired assets refers to those properties acquired since 2009; excludes acquisitions of leasehold positions in legacy assets.
42%
34%
13%
11%
57%26%
9%8%
33%
49%
18%
25%
43%
18%
14%
17%
54%
29% 25%
52%
23%
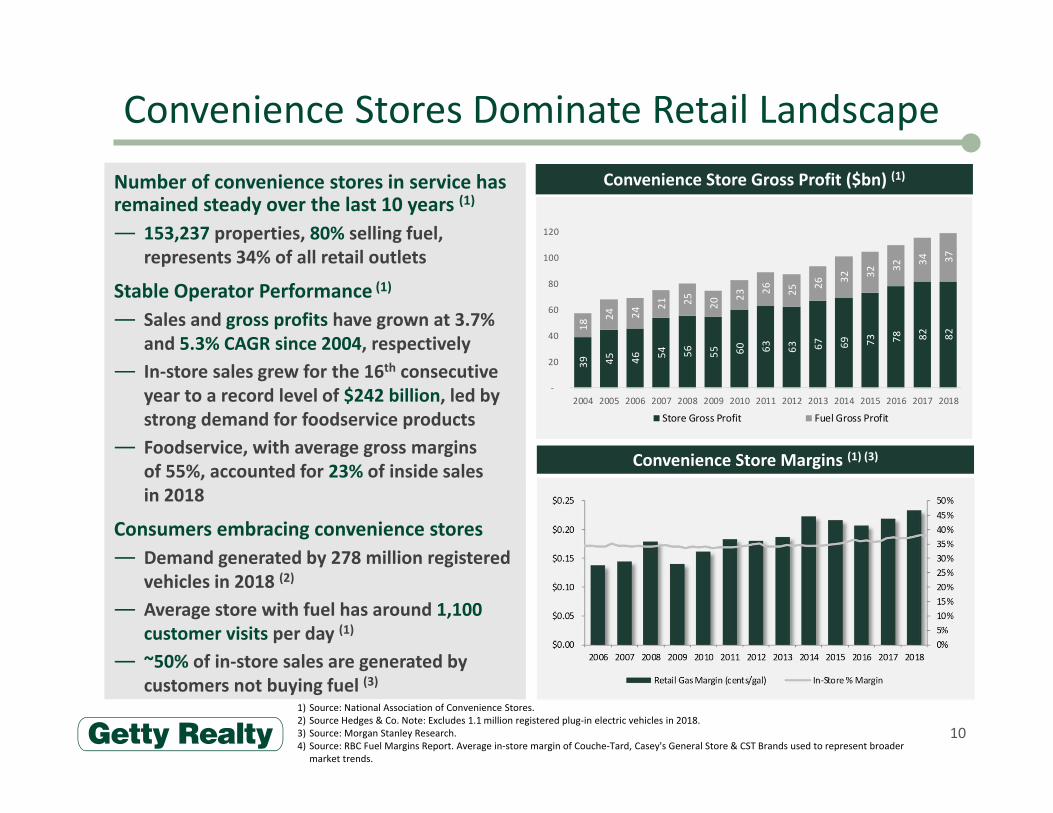
Number of convenience stores in service has remained steady over the last 10 years (1)
— 153,237 properties, 80% selling fuel, represents 34% of all retail outlets
Stable Operator Performance (1)
— Sales and gross profits have grown at 3.7% and 5.3% CAGR since 2004, respectively
— In‐store sales grew for the 16th consecutive year to a record level of $242 billion, led by strong demand for foodservice products
— Foodservice, with average gross margins of 55%, accounted for 23% of inside sales in 2018
Consumers embracing convenience stores— Demand generated by 278 million registered
vehicles in 2018 (2)
— Average store with fuel has around 1,100 customer visits per day (1)
— ~50% of in‐store sales are generated by customers not buying fuel (3)
Convenience Stores Dominate Retail Landscape
10
Convenience Store Margins (1) (3)
Convenience Store Gross Profit ($bn) (1)
1) Source: National Association of Convenience Stores.2) Source Hedges & Co. Note: Excludes 1.1 million registered plug‐in electric vehicles in 2018. 3) Source: Morgan Stanley Research.4) Source: RBC Fuel Margins Report. Average in‐store margin of Couche‐Tard, Casey's General Store & CST Brands used to represent broader
market trends.
39
45
46 54
56
55
60
63
63
67
69
73
78
82
82 18 24
24 21
25
20 23 26
25 26 32 32 32 34
37
‐
20
40
60
80
100
120
2004 2005 2006 2007 2008 2009 2010 2011 2012 2013 2014 2015 2016 2017 2018
Store Gross Profit Fuel Gross Profit
11
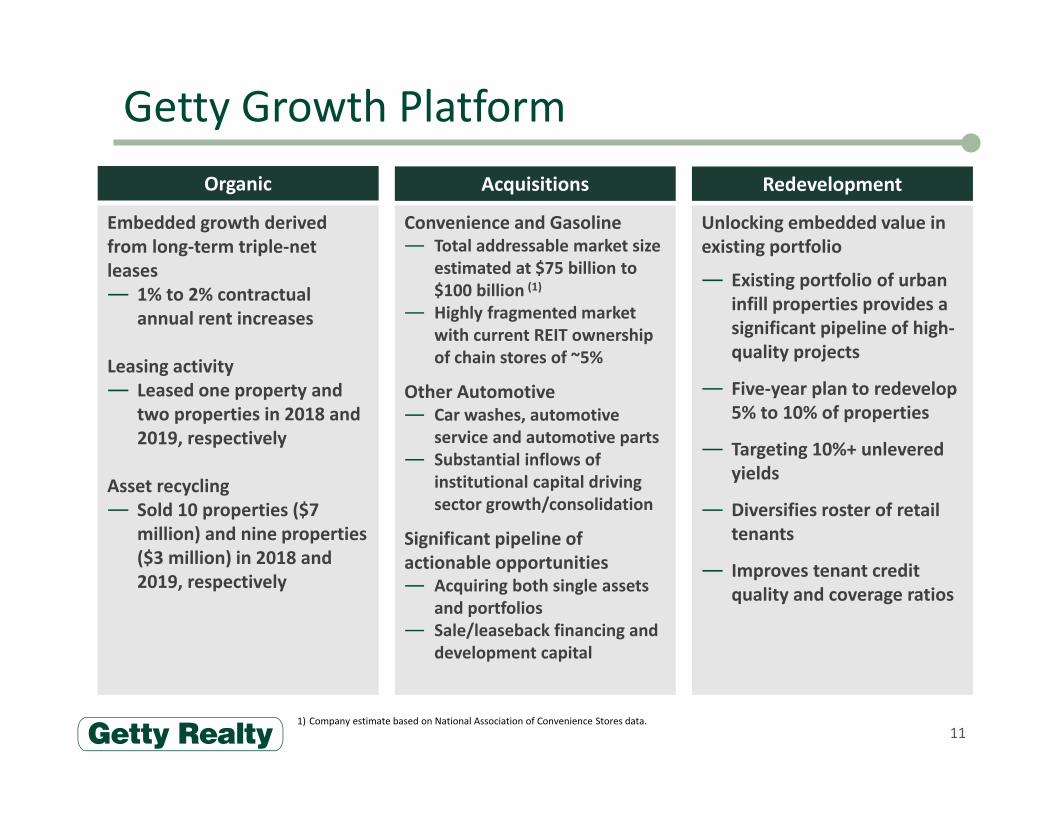
Getty Growth Platform
Embedded growth derived from long‐term triple‐net leases— 1% to 2% contractual
annual rent increases
Leasing activity— Leased one property and
two properties in 2018 and 2019, respectively
Asset recycling— Sold 10 properties ($7
million) and nine properties ($3 million) in 2018 and 2019, respectively
Unlocking embedded value in existing portfolio
— Existing portfolio of urban infill properties provides a significant pipeline of high‐quality projects
— Five‐year plan to redevelop 5% to 10% of properties
— Targeting 10%+ unlevered yields
— Diversifies roster of retail tenants
— Improves tenant credit quality and coverage ratios
Convenience and Gasoline— Total addressable market size
estimated at $75 billion to $100 billion (1)
— Highly fragmented market with current REIT ownership of chain stores of ~5%
Other Automotive— Car washes, automotive
service and automotive parts— Substantial inflows of
institutional capital driving sector growth/consolidation
Significant pipeline of actionable opportunities— Acquiring both single assets
and portfolios— Sale/leaseback financing and
development capital
Organic Acquisitions Redevelopment
1) Company estimate based on National Association of Convenience Stores data.

$68 38
$123 49
$17 6
$52 30
Acquisitions
12
Ten‐Year Track Record— Acquired 427 properties for $906 million— Added 14 new states and 21 new tenants
2019 Acquisitions— Acquired 27 properties for $87 million— Average cash return of 7.20% and average
initial remaining lease term of 13 years— Added three new states (AL, KY and MN)
2018 Acquisitions— Acquired 41 properties for $78 million— Average cash return of 7.26% and average
initial remaining lease term of 14 years— Added two new states (IL and OK)
2017 Acquisitions— Acquired 103 properties for $214 million— Average cash return of 7.31% and average
initial remaining lease term of 14 years— Added five new states (AZ, GA, LA, NM and
SC)
Overview Portfolio Transactions
2009
2018
2017
2013
2015
2011
Number of Properties
TransactionValue ($mm)
$111 59
$87 66
$73 36
$215 77
$49 36

2019 Acquisitions
13
Purchase price – $49 millionProperties – 16Lot & building size – 0.9 acres and 2,519 sq. ft.Geography – AL, CA, FL, GA, IL, NC, NY, MA, OK and VA
Purchase price – $38 millionProperties – 11Lot & building size – 1.1 acres and 5,614 sq. ft.Geography – AR, GA, KY, MN, NC and NV
Convenience & Gas Other Automotive
Irving Oil – Bellingham, MA Zips Car Wash – Rockingham, NC
Sale/Leaseback Financing – NNN Acquisitions – Development Takeout Capital

Market Asset Type
AnticipatedTotal
Investment (1)
InvestmentAs Of
12/31/19Expected
Completion (2)
Active ProjectsBronx, NY Quick Service Restaurant 1,540 1,475 2020Philadelphia, PA Retail 315 151 2020Brooklyn, NY Retail 386 274 2020Lewisville, TX Convenience & Gas 632 53 2021Brooklyn, NY Retail 1,045 256 2021
Active Projects Total 3,918 2,209PipelineNine sites (3) Various 6,424 594 2020 ‐ 2023
Total $10,342 $2,803
14
Redevelopment ProjectsInvested $10.8 million in 13 completed redevelopments with aggregate yield of 15%
In‐Progress Redevelopment Activity ($ thousands)
1) Anticipated total investment includes development costs, termination/recapture fees and leasing commissions.2) No assurance can be given that any of these redevelopment projects will be completed in the time expected, or at all. At completion
redevelopment projects are reclassified as operating real estate on Getty’s balance sheet.3) Includes two properties which are currently vacant and seven properties that are currently part of the Getty’s net lease portfolio.
Completed Redevelopments

Redevelopment Case Studies
15
Property type – Convenience and GasDevelopment type – Ground leaseLot & building size – 3.0 acres and 6,520 sq. ft. Total investment – $0.3 millionIncremental yield – 67%Rent commencement – January 26, 2019Tenant – Sheetz is one of America's fastest‐growing convenience store chains with over 580 store locations
Property type – Urgent CareDevelopment type – Build to suitLot & building size – 0.7 acres and 5,099 sq. ft. Total investment – $2.1 millionIncremental yield – 10% Rent commencement – November 6, 2018Tenant – ConvenientMD operates a network of 15 urgent care facilities across New England
Sheetz, Inc. – 2019 ConvenientMD – 2018
Falmouth, MALancaster, PA
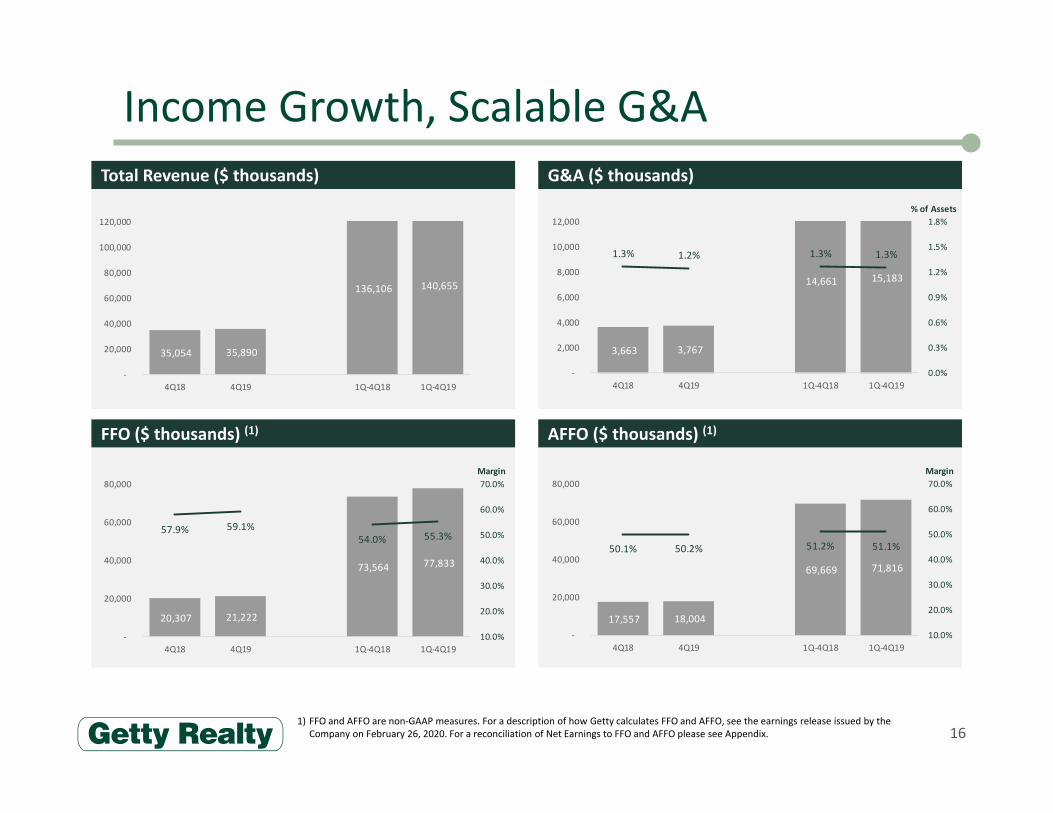
Income Growth, Scalable G&A
16
G&A ($ thousands)
AFFO ($ thousands) (1)
Total Revenue ($ thousands)
FFO ($ thousands) (1)
1) FFO and AFFO are non‐GAAP measures. For a description of how Getty calculates FFO and AFFO, see the earnings release issued by the Company on February 26, 2020. For a reconciliation of Net Earnings to FFO and AFFO please see Appendix.
20,307 21,222
73,564 77,833
57.9% 59.1%54.0% 55.3%
10.0%
20.0%
30.0%
40.0%
50.0%
60.0%
70.0%
‐
20,000
40,000
60,000
80,000
4Q18 4Q19 1Q‐4Q18 1Q‐4Q19
Margin
17,557 18,004
69,669 71,816
50.1% 50.2% 51.2% 51.1%
10.0%
20.0%
30.0%
40.0%
50.0%
60.0%
70.0%
‐
20,000
40,000
60,000
80,000
4Q18 4Q19 1Q‐4Q18 1Q‐4Q19
Margin
35,054 35,890
136,106 140,655
‐
20,000
40,000
60,000
80,000
100,000
120,000
4Q18 4Q19 1Q‐4Q18 1Q‐4Q19
3,663 3,767
14,661 15,183
1.3% 1.2% 1.3% 1.3%
0.0%
0.3%
0.6%
0.9%
1.2%
1.5%
1.8%
‐
2,000
4,000
6,000
8,000
10,000
12,000
4Q18 4Q19 1Q‐4Q18 1Q‐4Q19
% of Assets
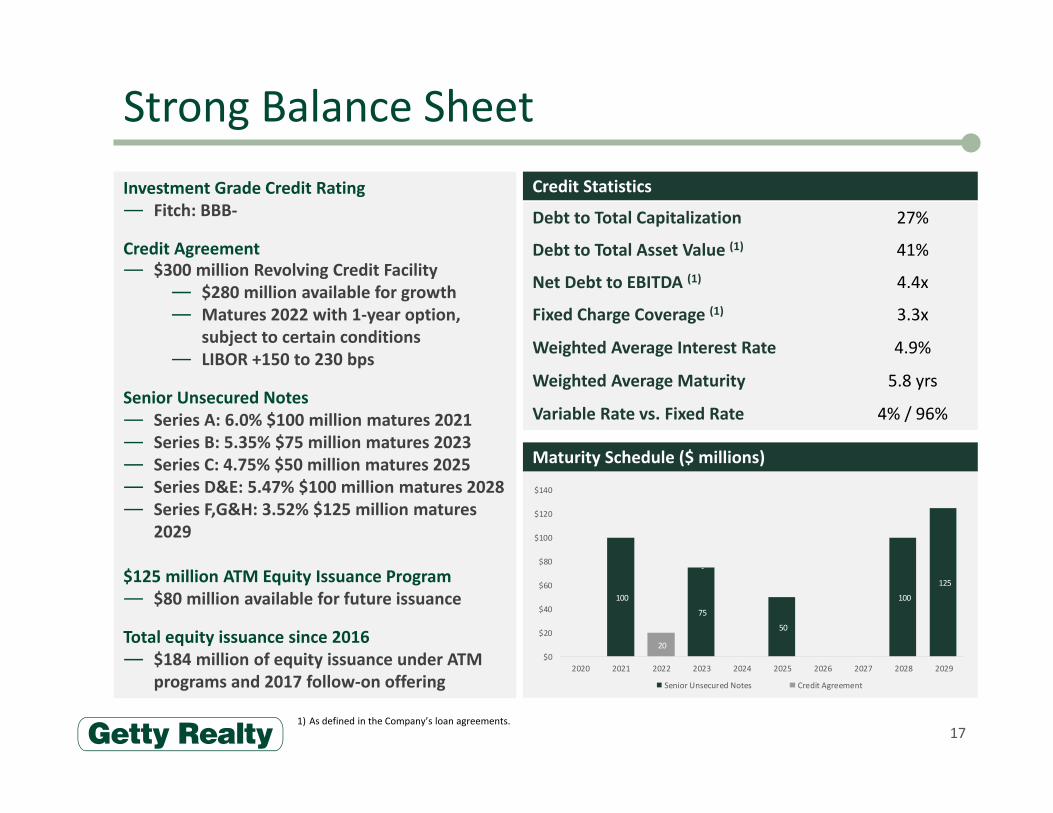
Strong Balance Sheet
17
Investment Grade Credit Rating— Fitch: BBB‐
Credit Agreement— $300 million Revolving Credit Facility
— $280 million available for growth— Matures 2022 with 1‐year option,
subject to certain conditions— LIBOR +150 to 230 bps
Senior Unsecured Notes— Series A: 6.0% $100 million matures 2021— Series B: 5.35% $75 million matures 2023— Series C: 4.75% $50 million matures 2025— Series D&E: 5.47% $100 million matures 2028— Series F,G&H: 3.52% $125 million matures
2029
$125 million ATM Equity Issuance Program— $80 million available for future issuance
Total equity issuance since 2016— $184 million of equity issuance under ATM
programs and 2017 follow‐on offering
Credit Statistics
Maturity Schedule ($ millions)
Debt to Total Capitalization 27%
Debt to Total Asset Value (1) 41%
Net Debt to EBITDA (1) 4.4x
Fixed Charge Coverage (1) 3.3x
Weighted Average Interest Rate 4.9%
Weighted Average Maturity 5.8 yrs
Variable Rate vs. Fixed Rate 4% / 96%
1) As defined in the Company’s loan agreements.
100
‐
75
‐
50
‐ ‐
100
125
20
‐
$0
$20
$40
$60
$80
$100
$120
$140
2020 2021 2022 2023 2024 2025 2026 2027 2028 2029
Senior Unsecured Notes Credit Agreement
18
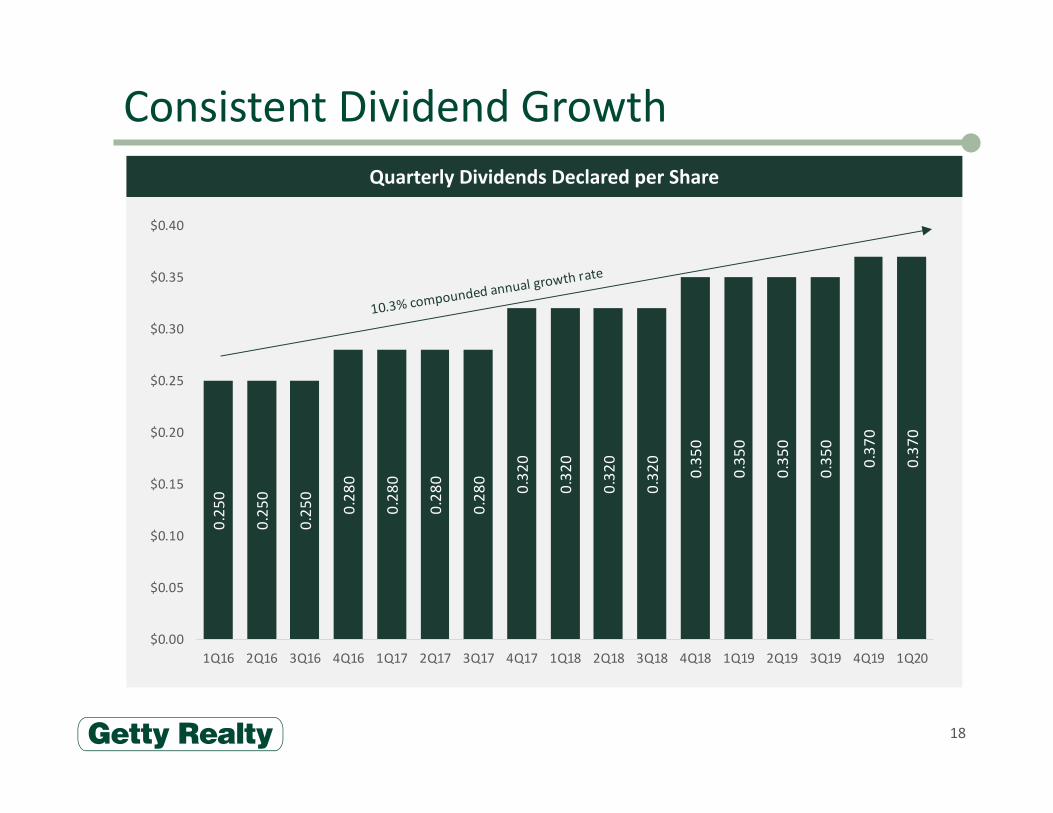
Quarterly Dividends Declared per Share
Consistent Dividend Growth
10.3% compounded a
nnual growth rate
0.25
0
0.25
0
0.25
0
0.28
0
0.28
0
0.28
0
0.28
0 0.32
0
0.32
0
0.32
0
0.32
0
0.35
0
0.35
0
0.35
0
0.35
0
0.37
0
0.37
0
$0.00
$0.05
$0.10
$0.15
$0.20
$0.25
$0.30
$0.35
$0.40
1Q16 2Q16 3Q16 4Q16 1Q17 2Q17 3Q17 4Q17 1Q18 2Q18 3Q18 4Q18 1Q19 2Q19 3Q19 4Q19 1Q20

Key Takeaways
1 National Net Lease Portfolio of Convenience Stores and Gasoline Stations
2 Well Located Retail Real Estate in both Established and High Growth Markets
3Convenience and Gas Sector Continues to Grow and Remains One of the Healthiest Segments of the Retail Landscape
5 Cash Flow and Dividends Supported by Long‐Term Triple‐Net Leases
6Proven Growth Track Record of Completing Acquisitions and Redevelopment Projects
19
7 Strong Balance Sheet to Support Future Growth
4Entering Other Automotive Market – including Car Washes, Automotive Service and Automotive Parts

Appendix

Reconciliation of Net Earnings to FFO and AFFO
211) FFO and AFFO are non‐GAAP measures. For a description of how Getty calculates FFO and AFFO, see the earnings release issued by the
Company on February 26, 2020.
Three months ended Dec. 31, Year ended Dec. 31,$ in thousands, except per share amounts (1) 2019 2018 2019 2018
Net earnings $13,708 $13,190 $49,723 $47,706 Depreciation and amortization of real estate assets 6,590 6,067 25,161 23,636 (Gain) loss on dispositions of real estate (687) (311) (1,063) (3,948) Impairments 1,611 1,361 4,012 6,170 Funds from operations 21,222 20,307 77,833 73,564
Revenue recognition adjustments (161) (355) (960) (2,223) Changes in environmental estimates (4,531) (639) (5,386) (1,319) Accretion expense 499 572 2,006 2,409 Environmental litigation accruals 1,220 (71) 5,896 (45) Insurance reimbursements (106) (2,257) (4,866) (2,570) Legal settlements and judgments (139) ‐ (2,707) (147) Adjusted funds from operations $18,004 $17,557 $71,816 $69,669
Diluted per share amounts:Earnings per share $0.33 $0.32 $1.19 $1.17Funds from operations per share 0.51 0.49 1.86 1.80Adjusted funds from operations per share 0.43 0.43 1.72 1.71
Weighted average common shares outstanding:Basic 41,246 40,631 41,072 40,171 Diluted 41,302 40,663 41,110 40,191