GTE/13 INTERNATIONAL CIVIL AVIATION ORGANIZATION Report.pdfgte/13 international civil aviation...
57
GTE/13 INTERNATIONAL CIVIL AVIATION ORGANIZATION FINAL REPORT THIRTEENTH MEETING OF THE GREPECAS SCRUTINY WORKING GROUP (GTE/13) Lima, Peru, 09 to 13 September 2013
Transcript of GTE/13 INTERNATIONAL CIVIL AVIATION ORGANIZATION Report.pdfgte/13 international civil aviation...
GTE/13
INTERNATIONAL CIVIL AVIATION ORGANIZATION
FINAL REPORT
THIRTEENTH MEETING OF THE GREPECAS
SCRUTINY WORKING GROUP
(GTE/13)
Lima, Peru, 09 to 13 September 2013

The designations employed and the
presentation of material in this
publication do not imply the
expression of any opinion whatsoever
on the part of ICAO concerning the
legal status of any country, territory,
city or area or of its authorities, or
concerning the delimitation of its
frontiers or boundaries.
GTE/13 i - Index i-1
INDEX i - Index .............................................................................................................................................. i-1 ii - History of the Meeting .................................................................................................................. ii-1 Place and duration of the Meeting ................................................................................................ ii-1 Opening ceremony and other matters ........................................................................................... ii-1 Schedule, Organization, Working Methods, Officers and Secretariat .......................................... ii-1 Working languages ....................................................................................................................... ii-1 Agenda .......................................................................................................................................... ii-2 Attendance .................................................................................................................................... ii-2 List of Conclusions ....................................................................................................................... ii-3
iii - List of participants .......................................................................................................................iii-1 Report on Agenda Item 1: ...................................................................................................................... 1-1
Safety assessment of RVSM airspace in the CAR/SAM FIRs. Report on Agenda Item 2: ...................................................................................................................... 2-1 Activities carried out by CARSAMMA.
- Review of analytical parameters for LHD validation.
Report on Agenda Item 3: ...................................................................................................................... 3-1
Quantitative Vertical Collision Risk Calculation (CRM). Report on Agenda Item 4: ...................................................................................................................... 4-1
Analysis of Large Height Deviations (LHDs).
- Evolution of M and N-coded LHDs in RVSM airspace of CAR/SAM FIRs.
Report on Agenda Item 5: ………………………………………………………………………………5-1
Other business.


GTE/13 ii- History of the Meeting ii-1
HISTORY OF THE MEETING
ii-1 PLACE AND DURATION OF THE MEETING
The Thirteenth Meeting of the GREPECAS Scrutiny Working Group (GTE/13) was held
in Lima, Peru, from 09 to 13 September 2013.
ii-2 OPENING CEREMONY AND OTHER MATTERS
Mr. Franklin Hoyer, Regional Director of the ICAO South American Office, opened the
Meeting after welcoming the participants, and highlighting the importance of reviewing the topics at the
regional level, focusing on the need to reduce M- N-coded LHD reports mainly related to ATC to ATC
transfer procedures, in order to enhance safety in the two Regions.
In addition, Mr. Johann Estrada of the Dominican Republic, Rapporteur of the GTE
Group, CARSAMMA experts Messrs. Ricardo Dantas Rocha, Reinaldo Brandão Taveira and Gilmar
Bento Machado, Mr. Víctor Hernández, RO/ATM/SAR of the ICAO NACC Office and Mr. Roberto
Arca, RO/ATM/SAR of the ICAO SAM Office, acted as the Secretariat for the Meeting.
ii-3 SCHEDULE, ORGANIZATION, WORKING METHODS, OFFICERS AND
SECRETARIAT 1.1.
The Meeting agreed to hold its sessions from 0830 to 1545 hours, with appropriate
breaks. The work was done with the Meeting as a Single Committee.
Mr. Johann Estrada, delegate from Dominican Republic, served as Chairman of the
Meeting and Rapporteur of the Scrutiny Working Group.
Mr. Roberto Arca, RO/ATM/SAR/AIM of the ICAO South American Regional Office,
Lima, acted as Secretary. He was assisted by Mr. Víctor Hernández, RO/ATM/SAR of the ICAO North
American, Central American & Caribbean Regional Office, Mexico.
ii-4 WORKING LANGUAGES
The working languages of the Meeting were Spanish and English, and its relevant
documentation was presented in both languages.

ii-2 ii – History of the Meeting GTE/13
ii-5 AGENDA
The following Agenda was adopted:
Agenda Item 1: Safety assessment of RVSM airspace in the CAR/SAM FIRs
Agenda Item 2: Activities carried out by CARSAMMA.
- Review of analytical parameters for LHD validation.
Agenda Item 3: Quantitative Vertical Collision Risk Calculation (CRM).
Agenda Item 4: Analysis of Large Height Deviations (LHDs).
- Evolution of M and N-coded LHDs in RVSM airspace of CAR/SAM FIRs.
Agenda Item 5: Other business.
ii-6 ATTENDANCE
The meeting was attended by a total of 27 participants, from 4 States of the NACC
Region (Cuba, Dominican Republic, Haiti and Mexico) and 6 States of the SAM Region (Argentina,
Bolivia, Colombia, Chile, Paraguay and Peru), as well as 3 International Organizations (ARINC,
CARSAMMA and COCESNA). The list of participants is shown in page iii-1.

GTE/13 ii- History of the Meeting ii-3
ii-7 LIST OF CONCLUSIONS
NO. TITLE OF THE CONCLUSION PAGE
CONCLUSION
GTE/13-1
DOCUMENT ON SAFETY ASSESSMENT IN RVSM AIRSPACE
OF THE CAR/SAM FIRs 1-10
CONCLUSION
GTE/13-2 NEW LHD CODES TABLE 2-1
CONCLUSION
GTE/13-3
COLLECTION OF DATA ON AIRCRAFT MOVEMENT IN
RVSM AIRSPACE OF THE CAR/SAM REGIONS 3-19

GTE/13 iii – Lista de Participantes / List of Participants iii-1
LISTA DE PARTICIPANTES / LIST OF PARTICIPANTS
GTE/13
ARGENTINA
1. José Luis Oreglia
2. Daniel Marcos Cozzi
3. Luis Augusto Demierre
4. Héctor Luis Sánchez
5. Christian A. Buchanan
BOLIVIA
6. Reynaldo Cusi Mita
COLOMBIA
7. Alfredo Santiago Iguarán
8. Fernando Moreno Penagos
CUBA
9. Jorge Centella Artola
10. Ricardo Martínez González
CHILE
11. Héctor Ibarra
HAITI
12. Mario Eric Legagneur
MEXICO
13. Oscar Vargas Antonio
14. Juan Carlos Sánchez Rivero
PARAGUAY
15. Delia Cristina Giménez Aranda
16. Margarita Cabrera Ibarrola
PERÚ
17. Norma Nava
18. Renzo Gallegos
REPÚBLICA DOMINICANA /
DOMINICAN REPUBLIC
19. Johan Estrada Pelletier
20. Julio Alexis Lewis
21. Doris Merán Lugo
CARSAMMA
22. Gilmar Bento Machado
23. Reinaldo Brandão Taveira
24. Ricardo Dantas Rocha
ARINC
25. Manuel Góngora
COCESNA
26. Carlos Carbajal Perdomo
27. Héctor Nery López
OACI / ICAO
28. Roberto Arca
29. Victor Hernández

iii-2 iii – Lista de Participantes / List of Participants GTE/13
ARGENTINA
José Luis Oreglia Tel: +5411 5317 6000 Int. 68321
Jefe Departamento Calidad ATS E-mail: [email protected]
Dirección General de Control de
Tránsito Aéreo - DGCTA
Com. Pedro Zanni 250
Buenos Aires, República Argentina
Daniel Marcos Cozzi Tel: +5411 6628 5024
Jefe de División Calidad ATS E-mail: [email protected]
Dirección General de Control de
Tránsito Aéreo - DGCTA
Com. Pedro Zanni 250
Buenos Aires, República Argentina
Luis Augusto Demierre Tel: + 5411 153163 1843
Jefe División Incidentes ATS E-mail: [email protected]
Dirección de Servicios de Navegación Aérea
Buenos Aires, Argentina
Héctor Luis Sánchez Tel: +5411 5941 3000 Int. 69773
Jefe Departamento E-mail: [email protected]
Administración Nacional de Aviación Civil
ANAC
Buenos Aires, República Argentina
Christian Alejandro Buchanan Tel: +5411 5941 3000 Int. 69378
Especialista en Normas ATM E-mail: [email protected]
Administración Nacional de Aviación Civil
ANAC
Buenos Aires, República Argentina
BOLIVIA
Reynaldo Cusi Mita Tel: +5912 2211 4465
Inspector ATM/SAR E-mail: [email protected]
Dirección General de Aeronáutica Civil
DGAC
Av. Arce 2631, Edificio Multicine piso 3
La Paz, Estado Plurinacional de Bolivia
COLOMBIA
Alfredo Santiago Iguarán Iguarán Tel. +571 296 2213
Controlador Tránsito Aéreo Radar E-mail: [email protected]
Unidad Administrativa Especial de
Aeronáutica Civil - UAEAC
Av. El Dorado 112-09, Edificio CNA
Bogotá, Colombia

GTE/13 iii – Lista de Participantes / List of Participants iii-3
Fernando Moreno Penagos Tel. +571 296 2213
Controlador Tránsito Aéreo Radar E-mail: [email protected]
Unidad Administrativa Especial de
Aeronáutica Civil - UAEAC
Av. El Dorado 112-09, Edificio CNA
Bogotá, Colombia
CUBA
Jorge Centella Artola Tel. +537 838 1121
Dirección de Aeronavegación E-mail: [email protected]
Instituto de Aeronáutica Civil de Cuba
IACC
Calle 23 # 64, Vedado
La Habana, Cuba
Ricardo Martínez González Tel. +537 649 5029
Especialista Grupo Calidad y Gestión +537 649 7284
de la Seguridad ACC Habana, ATCO E-mail: [email protected]
Empresa Cubana de Aeropuertos y
Servicios Aeronáuticos (ECASA S.A.)
La Habana, Cuba
CHILE
Héctor Patricio Ibarra Martínez Tel.: +562 2836 4020
Controlador de Tránsito Aéreo E-mail: [email protected]
Dirección General de Aeronáutica Civil [email protected]
DGAC
Santa Aurora 2441, La Florida
Santiago, Chile
HAITÍ
Mario Eric Legagneur Tel. +509 4494 0024
Jefe Servicios Tránsito Aéreo E-mail: [email protected]
Office National de l’Aviation Civile [email protected]
OFNAC
Haiti
MÉXICO
Oscar Vargas Antonio Tel. +5255 5723 9300 Ext. 18279
Jefe Departamento Control Tránsito Aéreo E-mail: [email protected]
Dirección General de Aeronáutica Civil
DGAC
Blvd. Adolfo López Mateos #1990
Col. Los Alpes Tlacopac
Delegación Álvaro Obregón
México DF, México
iii-4 iii – Lista de Participantes / List of Participants GTE/13
Juan Carlos Sánchez Rivero Tel. +5255 5723 9300 Ext. 18071
Inspector Verificador Aeronáutico E-mail: [email protected]
Dirección General de Aeronáutica Civil
DGAC
Blvd. Adolfo López Mateos #1990
Col. Los Alpes Tlacopac
Delegación Álvaro Obregón
México DF, México
PARAGUAY
Delia Cristina Giménez Aranda Tel: +59521 205 365
Jefe Departamento Evaluación E-mail: [email protected]
Dirección Nacional de Aeronáutica Civil
DINAC
Av. Mariscal López y 22 de Septiembre
Asunción, Paraguay
Margarita Cabrera Ibarrola Tel: +59521 761 503
Supervisora ATS E-mail: [email protected]
Dirección Nacional de Aeronáutica Civil
DINAC
Av. Mariscal López y 22 de Septiembre
Asunción, Paraguay
PERÚ
Norma Nava Hernández Tel: +511 575 0886
Controlador de Tránsito Aéreo E-mail: [email protected]
Corporación Peruana de Aeropuertos y [email protected]
Aviación Comercial S. A. (CORPAC) Web: www.corpac.gob.pe
Aeropuerto Internacional Jorge Chávez
Av. Elmer Faucett s/n, Callao, Perú
Apartado 680 - Lima 100, Perú
Renzo Gallegos Begazo Tel: +511 575 0886
Controlador de Tránsito Aéreo E-mail: [email protected]
Equipo SMS [email protected]
Corporación Peruana de Aeropuertos y Web: www.corpac.gob.pe
Aviación Comercial S. A. (CORPAC)
Aeropuerto Internacional Jorge Chávez
Av. Elmer Faucett s/n, Callao, Perú
Apartado 680 - Lima 100, Perú
GTE/13 iii – Lista de Participantes / List of Participants iii-5
REPÚBLICA DOMINICANA /
DOMINICAN REPUBLIC
Johann Estrada Pelletier Tel. +1809 274 4322 ext. 2304
Director de la Dirección de E-mail [email protected]
Vigilancia de la Seguridad Operacional
Instituto Dominicano de Aviación Civil
IDAC
Edificio Sede de Navegación Aérea
Santo Domingo, República Dominicana
Julio Alexis Lewis Tel: +1809 274 4322 Ext. 2290
Encargado de la División de Gestión de E-mail: [email protected]
Riesgo de la Seguridad Operacional
Instituto Dominicano de Aviación Civil
IDAC
Edificio Sede de Navegación Aérea
Santo Domingo, República Dominicana
Doris Meran Lugo Tel: +1809 274 4322 Ext. 2123
Técnico en Investigación de Incidentes ATS E-mail: [email protected]
Instituto Dominicano de Aviación Civil
IDAC
Edificio Sede de Navegación Aérea
Santo Domingo, República Dominicana
ARINC
Manuel Góngora Tel: +1305 263 5772
Director, Latin America & Caribbean E-mail: [email protected]
5200 Blue Lagoon Drive, Suite 840
Miami, FL 33126, U.S.A.
CARSAMMA
Gilmar Bento Machado Tel: +5521 2101 6358
Especialista Regional en Control de Tráfico Aéreo E-mail: [email protected]
Agencia de Monitoreo de las Regiones del Web: http://www.carsamma.decea.gov.br/es/
Caribe y Sudamérica – CARSAMMA
Plaza Senador Salgado Filho, s/n – Centro
Rio de Janeiro, Brasil
Ricardo Dantas Rocha Tel: +5521 2101 6358
Especialista Regional en Errores del E-mail: [email protected]
Sistema de Altimetría Web: http://www.carsamma.decea.gov.br/es/
Agencia de Monitoreo de las Regiones del
Caribe y Sudamérica – CARSAMMA
Plaza Senador Salgado Filho, s/n – Centro
Rio de Janeiro, Brasil

iii-6 iii – Lista de Participantes / List of Participants GTE/13
Reinaldo Brandão Taveira Tel: +5521 2101 6358
Especialista Regional en Grandes E-mail: [email protected]
Desviaciones de Altitud Web: http://www.carsamma.decea.gov.br/es/
Agencia de Monitoreo de las Regiones del
Caribe y Sudamérica – CARSAMMA
Plaza Senador Salgado Filho, s/n – Centro
Rio de Janeiro, Brasil
COCESNA
Carlos Antonio Carbajal Perdomo Tel: +504 2234 3360 Ext. 1325
Coordinador ATM E-mail: [email protected]
COCESNA
150 mts al Sur Aeropuerto Toncontín
Tegucigalpa, Honduras
Héctor Nery López Irías Tel: +504 2234 3360 Ext. 1317
Coordinador Investigación de Incidentes ATS E-mail: [email protected]
COCESNA
150 mts al Sur Aeropuerto Toncontín
Tegucigalpa, Honduras
OACI / ICAO
Roberto Arca Jaurena Tel: +511 611 8686 Anexo 106
RO/ATM/SAR/AIM Fax: +511 611 8689
Oficina Regional Sudamericana E-mail: [email protected]
Av. Víctor Andrés Belaúnde No.147 Web: www.icao.int/SAM
Centro Empresarial Real, Vía Principal No.102
Edificio Real 4, Piso 4, San Isidro
Lima 15073 – Perú
Víctor Hernández Tel: +5255 5250 3211
RO/ATM/SAR Fax: +5255 5203 2757
Oficina para Norteamérica, Centroamérica E-mail: [email protected]
y Caribe (NACC) Web: www.mexico.icao.int
Av. Presidente Masaryk 29 - 3er piso
Col. Chapultepec Morales
México D.F., 11570, México

GTE/13 Report on Agenda Item 1 1-1
Agenda Item 1: Safety assessment of RVSM airspace in the CAR/SAM FIRs
1.1. Under this item, the Scrutiny Group analysed LHD reports between January and
December 2012, which were used for this safety assessment. According to Doc 9859 table of risks which
was adapted for the LHD risk value calculation, colour codes are the following:
risks from 1 to 20 - green;
risks from 21 to 74 - yellow;
risks from 75 to 100 - red.
1.2. Table 1 and Graph 1 summarise LHD occurrences validated by the Scrutiny Working
Group (GTE) and the duration (in minutes) associated to the LHD, by month.
YEAR 2012
MONTH NUMBER
of LHDs
DURATION
Total (min.)
DURATION
Mean (min.) Mean RISK
Highest
RISK
JANUARY 107 194,47 0,55 20,38 55
FEBRUARY 93 362,53 0,26 19,56 46
MARCH 95 141,48 0,67 19,35 55
APRIL 78 141,25 0,55 19,26 46
MAY 78 141,57 0,55 19,83 40
JUNE 77 203,40 0,38 25,56 46
JULY 71 126,55 0,56 21,89 46
AUGUST 72 94,88 0,76 22,14 55
SEPTEMBER 89 338,97 0,26 15,72 46
OCTOBER 92 147,33 0,62 20,77 46
NOVEMBER 119 157,45 0,76 21,05 46
DECEMBER 94 144,27 0,76 23,13 60
TOTAL 1065 2194,15 0,49 20,72
Table 1: LHD occurrences, with total duration, mean duration, mean risk and highest risk, by month

1-2 Report on Agenda Item 1 GTE/13
Graph 1: LDH occurrences/duration, by month
1.3. Table 2 and Graph 2 summarise the number of LHD occurrences, the duration (in
minutes) associated to the LHD, and the number of flight level crossings without clearance, by LHD
code, from 1 January to 31 December 2012, inclusive.
LHD
category Description of LHD code
N° of LHD
occurrences
Duration
of LHD
(min)
Levels
crossings
without
clearance
A Failure to climb/descend as cleared. 9 20,17 4
B Climb/descent without ATC clearance. 18 25,50 33
C Entry into airspace at an incorrect flight level. 2 3,50 1
D Deviation due to turbulence or other weather-related cause. 4 3,50 5
E Deviation due to equipment failure. 5 3,25 1
F Deviation due to collision avoidance system (ACAS/TCAS)
advisory. 1 1,00 1
G Deviation due to unexpected event - contingency (engine failure,
pressurisation failure). 0 0,00 0
H Aircraft not approved for operation in RVSM restricted airspace. 2 37,00 0
I ATC system loop error. 2 3,30 3
J Equipment control error, encompassing incorrect operation of fully
functional FMS or navigation system. 4 5,00 4
K Incorrect transcription of ATC clearance or re-clearance into the
FMS. 2 2,00 3
L Wrong information faithfully transcribed into the FMS. 1 0,30 1
M Error in ATC-unit-to-ATC-unit transition message (coordination
error). 613 1002,77 1007
N Negative transfer received from transitioning ATC unit (lack of
coordination) 402 1086,87 52
O Other 0 0,00 0
P Unknown 0 0,00 0
Total (Jan 12 – Dec 12) 1065 2194,15 1115
Table 2: Summary of LHD occurrences and duration, by LHD category

GTE/13 Report on Agenda Item 1 1-3
1.4. M-coded LHDs (error in ATC-unit-to-ATC-unit transition message) were the most
frequent in 2012, with 613 events, followed by Code N (402), B (18) and A (9). The high number of M-
coded LHDs points to the need to improve coordination between adjacent air traffic control centres,
which might be achieved by sensitising and providing controllers with training in coordination.
1.5. Likewise, Graph 2 shows that, regarding duration, N-coded LHDs ranked first in this
analysis, with a total duration of 1086,87 minutes. This is one of the worst air traffic incidents, since the
aircraft involved were not expected in that position, at that level, or at the time of occurrence.
Graph 2: Summary of the duration of LHD occurrences, by category
1.6. Graph 3 shows LHDs with level crossings without air traffic control clearance. In this
case, M-coded occurrences were most frequent, with 1007 level crossings. It may also be noted that, in
the case of N-coded LHDs, the controller is not aware of the traffic and consequently, of the level cleared
by the adjacent sector.
Graph 3: Summary of LHD occurrences by level crossing

1-4 Report on Agenda Item 1 GTE/13
Risk Value (RV) assessment
1.7. This section updates the results of the RVSM airspace safety assessment in CAR/SAM
FIRs. Accordingly, the risk value assessment methodology (SMS) was applied to the internationally
accepted safety assessment of this airspace.
1.8. RV parameter estimates – The amount and initial material for estimating the value of
each parameter inherent to the internationally-accepted Risk Value (VR) that were used to conduct the
RVSM airspace safety assessment are summarised in the following formula and described in Table 3.
Parameter Description Value
VR Risk value To be calculated
P Position probability Varies from 1 to 5
D Duration of event Varies from 1 to 3
S Severity of event Varies from 1 to 5
R With or without radar/ADS With=5 or without=10
W Weather conditions VMC=0 or IMC=5 if there is another aircraft
T Other traffic (if any) Ranges from 1 to 10 (of separation)
TOTAL Maximum 100
Table 3: Calculation of Risk Value parameters
1.9. Safety assessment – The results of the monthly assessment of airspace safety in the
CAR/SAM FIRs are detailed in Table 4 and Graph 4 (FIRs with LHDs with a RV greater than 20).
TLS SPIM SBAO SVZM SEGU SCFZ TTZP SKED
JAN 20 55
FEB 20 46 46
MAR 20 55
APR 20 46 46
MAY 20 40 40 40
JUN 20 46
JUL 20 46 42 46
AUG 20 55
SEP 20 46
OCT 20 46 46
NOV 20 46
DEC 20 60
Table 4: Highest risk value estimates for LHDs
VR=(PxDxS)+R+W+T, where:

GTE/13 Report on Agenda Item 1 1-5
1.10. Graph 4 shows the major risk value estimates for all months, based on LHD reports, from
1 January to 31 December 2012.
Graph 4: Highest Risk Value for FIRs in CAR/SAM RVSM airspace. The red line is TLS RV (20)
1.11. The safety Risk Value in the Lima FIR during 2012 was above the target level of safety
(TLS – red line in Graph 4), that is, more than 20 points on six occasions. The Bogota FIR had the highest
RV (60) in December, exceeding the TLS. The TLS was established at the Eleventh Meeting of the
Scrutiny Working Group (ICAO GTE/11), held in 2011 (Lima, Peru).
1.12. CARSAMMA has assessed LHD occurrences (specific operational error) in the
CAR/SAM RVSM airspace from the point of view of the contribution of the individual LHD occurrence
to total risk in the FIR. Furthermore, a monthly Risk Value was defined in an attempt to provide real-
time information on risk.
1.13. Graph 5 shows LHDs with the highest individual RV in 2012.
Graph 5: Highest individual LHD Risk Value, by month in 2012

1-6 Report on Agenda Item 1 GTE/13
LHD safety analysis (SMS)
1.14. Table 5 details LHDs or operational errors assessed by the GTE as those having the
highest Risk Value (RV> 46) in 2012.
1.15. LHD 1158, which occurred in December 2012, accounted for 2.592% of the risk assessed
for that month, and had an RV = 60, the highest for the sample.
1.16. The Lima FIR appears 11 times with LHD reports from adjacent FIRs, since it
contributed to the generation of risk in their RVSM airspace.
1.17. In turn, the Guayaquil FIR appears 8 times in terms of risk generation.
Sequence FIR subject to risk FIR generating the
risk
GTE
code
Risk
Value
7 ATLANTICO MONTEVIDEO N 46
59 ATLANTICO ABIDJAN N 46
150 ATLANTICO MONTEVIDEO N 46
408 ATLANTICO MONTEVIDEO N 46
592 ATLANTICO DAKAR N 46
657 ATLANTICO MONTEVIDEO N 46
839 ATLANTICO ABIDJAN N 46
884 ATLANTICO MONTEVIDEO N 46
1054 ATLANTICO DAKAR N 46
933 BOGOTA GUAYAQUIL N 46
1125 BOGOTA AMAZONICA N 51
1158 BOGOTA GUAYAQUIL N 60
3 LIMA GUAYAQUIL N 46
27 LIMA GUAYAQUIL N 55
64 LIMA GUAYAQUIL N 46
91 LIMA LA PAZ N 46
232 LIMA LA PAZ N 46
275 LIMA AMAZONICA N 46
281 LIMA GUAYAQUIL N 55
419 LIMA AMAZONICA N 46
534 LIMA BOGOTA N 46
694 LIMA GUAYAQUIL N 46
714 LIMA GUAYAQUIL N 55
188 MAIQUETIA AMAZONICA N 46
291 PIARCO ROCHAMBEAU N 46
602 PIARCO DAKAR N 46
1156 ROCHAMBEAU PIARCO N 46
Table 5: LHDs assessed as having the highest risk value in 2012
1.18. The analysis includes a detailed review of certain operating errors in order to identify
contributing factors and make sure that procedures and processes are executed by the safety authorities of
the CAR/SAM FIRs with a view to reducing the possibility of recurrence of the same errors.

GTE/13 Report on Agenda Item 1 1-7
1.19. In the case of RVSM airspace, CARSAMMA assessed the individual operational errors
identified in LHD reports submitted by the 34 FIRs within its geographical coverage are, grouping them
by FIR and then by State, using the following statistical tools:
Mean risk value M = ∑VR / n; and
Standard deviations
1.20. Graph 6 identifies the results of this analysis, showing the Risk Value assigned by the
State to operational errors involved in large height deviations in the 2012 data analysis.
Graph 6: Contribution to risk value, by State
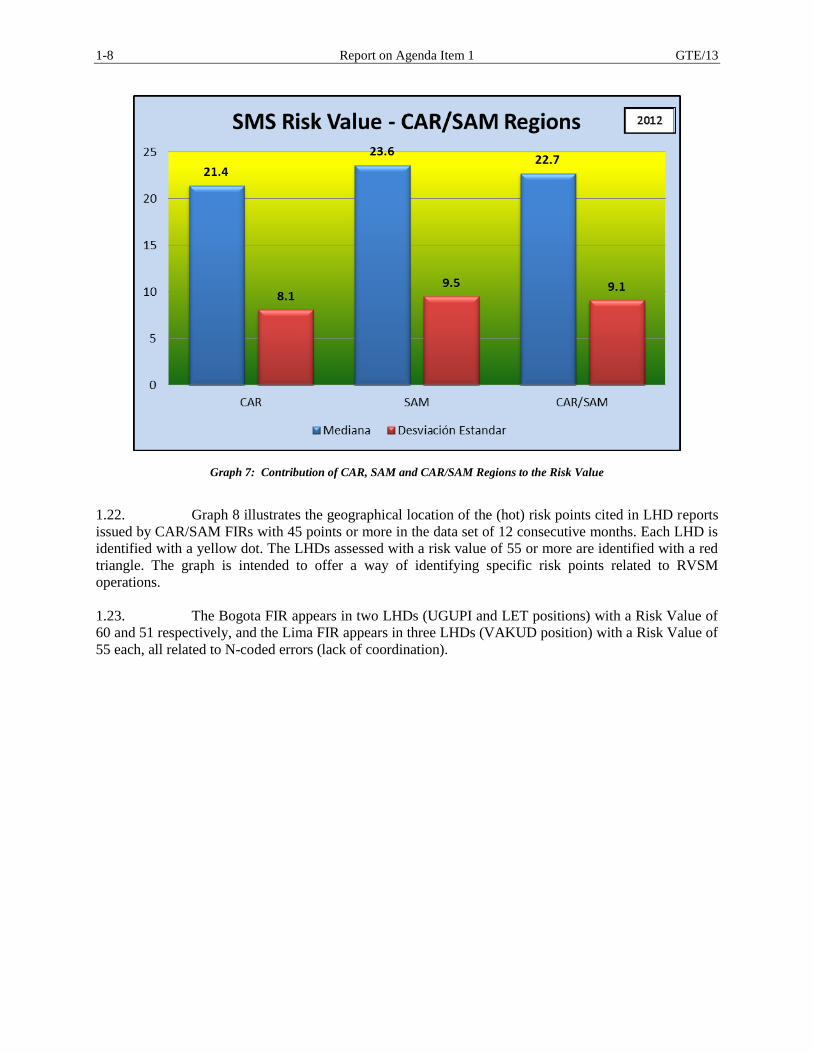
1.21. Graph 7 shows the results of the analysis conducted in the CAR, SAM and CAR/SAM
Regions. It should be recalled that M-coded LHDs are the most frequent, accounting for 57.55% (613
LHDs) of the total number of LHDs, followed by Code N, with 37.74% (402 LHDs).
1-8 Report on Agenda Item 1 GTE/13
Graph 7: Contribution of CAR, SAM and CAR/SAM Regions to the Risk Value
1.22. Graph 8 illustrates the geographical location of the (hot) risk points cited in LHD reports
issued by CAR/SAM FIRs with 45 points or more in the data set of 12 consecutive months. Each LHD is
identified with a yellow dot. The LHDs assessed with a risk value of 55 or more are identified with a red
triangle. The graph is intended to offer a way of identifying specific risk points related to RVSM
operations.
1.23. The Bogota FIR appears in two LHDs (UGUPI and LET positions) with a Risk Value of
60 and 51 respectively, and the Lima FIR appears in three LHDs (VAKUD position) with a Risk Value of
55 each, all related to N-coded errors (lack of coordination).

GTE/13 Report on Agenda Item 1 1-9
Graph 8: CAR/SAM FIRs - RVSM risk points in Large Height Deviations (LHDs)
January – December 2012
1.24. The Meeting considered that the analytical data presented by CARSAMMA was of great
value and they should be used by the States for the identification of occurrences to which the SMS
methodology should be applied for reducing risk.
1.25. Finally, taking into account that the new coding used by Monitoring Agencies involves
changes to be taken into account for the quantitative assessment, it was felt advisable to adjust the
Document on safety assessment in RVSM airspace of the CAR/SAM FIRs in order to assess the
qualitative risk applying the methodology used in the CAR/SAM Regions.

1-10 Report on Agenda Item 1 GTE/13
1.26. In this sense, CARSAMMA is charged with drafting a proposal to be circulated to the
States and International Organisations through the respective Regional Offices for their feedback on the
modifications to the Document on safety assessment in RVSM airspace of the CAR/SAM FIRs, effective
on 1 January 2014. In view of the foregoing, the Meeting agreed to formulate the following conclusion:
CONCLUSION GTE 13/1 DOCUMENT ON SAFETY ASSESSMENT IN RVSM AIRSPACE
OF THE CAR/SAM FIRs
That CAR/SAM States and International Organisations apply the methodology described
in the Document on safety assessment in RVSM airspace of the CAR/SAM FIRs starting
on 1 January 2014 for the LHDs generated within the FIRs under their responsibility.
Methodology for calculating LHD’s level of risk in the Dominican Republic
1.27. The Meeting took note of the analyses conducted by the Dominican Republic applying
the SMS system approved by GTE/11 for the analysis of height deviations (LHDs), which creates a
parameter to calculate the Risk Value resulting from the reports and thus obtain their Level of Risk.
1.28. After using this methodology for the analysis of the reports sent to CARSAMMA in
2011, the Dominican Republic proposed a modification to the formula for calculating the level of risk of
LHDs, with the aim of increasing the number of reports that require documentation and management by
the States, which was approved during the GTE/12 Meeting.
1.29. After analyzing LHD reports for 2011 based on the methodology approved at that time,
the Dominican Republican found out that the resulting level of risk for 95.07% of LHDs in the
CAR/SAM Region did not require management but only that they be documented by the States, which
does not solve the need to create specific plans for reducing these events.
1.30. In the specific case of the Dominican Republic, the total of LHDs reported and validated
by CARSAMMA in 2011 (47) were within the range that required no management, only documentation.
1.31. After modifying the formula for calculating the level of risk as approved in the GTE/12,
it was noted that the number of LHDs that required management by States increased (49%), which allows
States to take concrete actions to reduce occurrences, and gives ICAO Regional Offices a valuable tool to
require the implementation of specific plans for these purposes.
1.32. In the specific case of the Dominican Republic, after modifying the formula for
calculating the level of risk, it was noted that, out of 74 LHD reports validated by CARSAMMA for
2012, 72 reports (97.3%) required management and documentation, and only two reports (2.7%) required
documentation alone.
1.33. This information has been very valuable for the Dominican Republic in making decisions
on improvements needed to reduce the number of occurrences in the Santo Domingo FIR. Likewise, the
Meeting took note that the Dominican Republic had plans to implement a new Control Center, which will
be operational by January 2014. This center will have the necessary tools to streamline coordination,
resulting in a reduction of LHDs within Santo Domingo FIR.

GTE/13 Report on Agenda Item 1 1-11
1.34. The Meeting was also informed that a meeting had been coordinated with adjacent FIRs
to be held in October in the Dominican Republic, with the purpose of reviewing the Letters of Operational
Agreements and introducing new coordination procedures based on the technology that will be available.
1.35. The Meeting encouraged the other States to follow the example of the Dominican
Republic in the treatment of LHDs based on the SMS.

GTE/13 Report on Agenda Item 2 2-1
Agenda Item 2: Activities carried out by CARSAMMA
2.1 Under this agenda item, CARSAMMA presented the results of the last two Special
Regional Meetings of Monitoring Agencies held in Beijing, China, on 28 May to 1 June 2012 (Seventh)
and in Canberra, Australia, on 2 to 6 November 2012 (Eighth).
2.2 The Meeting took note that those meetings agreed that any Regional Monitoring Agency
(RMA) could modify the LHD form for use in its region only for ease of understanding and thus
optimising the number of large height deviations reported.
2.3 Accordingly, CARSAMMA has started to analyse the advantages and disadvantages of
changing the title of the cited form in the CAR/SAM Regions. It should be noted that this Agency has
already modified some fields in the form to facilitate the investigation of large height deviations; for
example, additional information on the registration of aircraft involved in the report is required in Field 4,
and Field 6, on Mode C display, now requires information on whether or not it was displayed on the
ADS, and indication of level/altitude.
2.4 CARSAMMA noted that more intensive training was needed for the States, since some of
them continued sending data with errors in the same columns of the template, which had to be corrected
again by the Agency, consuming human resources and software, to achieve consistency in the data to be
used in mathematical risk calculation.
2.5 CARSAMMA presented the GTE/13 with an analysis of the advantages and
disadvantages of changing the name of the LHD form in the CAR/SAM Regions, with a view to arriving
at a decision regarding this modification.
2.6 CARSAMMA presented the GTE/13 with a more harmonised LHD coding table (shown
in Appendix A to this part of the report), emphasising that its adoption by the CAR/SAM Regions will
further contribute to the standardisation of methods used by the RMAs. It should be noted that this
standardisation was one of the objectives most highly emphasised at the most recent Special Meetings of
Monitoring Agencies, and shall be applied in all Regions for harmonising quantitative calculations.
2.7 Based on the above, the Meeting formulated the following conclusion:
CONCLUSION GTE/13-2 NEW LHD CODES TABLE
That CARSAMMA adopt the new Codes Table agreed worldwide for the Regional
Monitoring Agencies that appears in Appendix A to this part of the report and apply it for
quantitative assessment (CRM) as of 1 January 2014.
Review of analytical parameters for LHD validation
2.8 The Meeting analysed some LHDs reported in 2012 that were finally coded NON LHD
since they occurred in the same air traffic control sector.
2.9 Table 1 shows all LHD reports that meet this condition: traffic is coordinated at one
position but the aircraft calls from a different position.

2-2 Report on Agenda Item 2 GTE/13
Report Description Radar/ADS coverage
286
TAE507 - MPTO/SEGU – reported on 18/03/12 by the GUAYAQUIL ACC.
Aircraft is transferred by the BOGOTA ACC at ENSOL (UG426), but calls
from UGUPI (UL780).
NO
413
PPCRC - SPIM/SEGU – reported on 27/04/12 by the GUAYAQUIL ACC.
Aircraft is transferred by the LIMA ACC at PAGUR (UB696), but calls from
VAKUD (UL780).
NO
465
CWC4853 - EHAM/SBGR – reported on 15/05/12 by the ATLANTICO
ACC.
Aircraft is transferred by the DAKAR ACC at KODOS (UL206), but calls
from coordinates 0423N 03035W, close to TASIL (UN873).
NO
512
N133VP - SVMG/KIMB – reported on 04/06/12 by the SAN JUAN ACC.
Aircraft is transferred by the MAIQUETIA ACC at ARMUR (UG432), but
calls from KIKER (UA300).
YES
921
AAL967 - KJFK/SBGR – reported on 15/10/12 by the AMAZONICO ACC.
Aircraft is transferred by the MAIQUETIA ACC at UGAGA (UL793), but
calls from VUMPI (UL795).
YES
1001
ROI1220 - SVBC/KMIA – reported on 08/11/12 by the STO. DOMINGO
ACC.
Aircraft is transferred by the CURAZAO ACC at VESKA (UA315), but calls
from IRGUT (UL304).
YES
1035
TAE505 - MPTO/SEGU – reported on 14/11/12 by the GUAYAQUIL ACC.
Aircraft is transferred by the BOGOTA ACC at UGUPI (UL780), but calls
from ENSOL (UG426).
NO
Table 1: LHD reports where aircraft were transferred at one point but called from another point
2.10 In Report 286, the controller was aware that an aircraft would call and was ready to
receive it at ENSOL. Since the aircraft called from UGUPI, he might have been not as ready to receive it,
and the risk was greater because there is no radar coverage in either position. Consequently,
CARSAMMA assigned an M code (error in ATC-unit-to-ATC-unit transition message) to this report.
2.11 In Report 413, the controller was aware that an aircraft would call and was ready to
receive it at PAGUR. Since the aircraft called from VAKUD, he might have been not as ready to receive
it, and the risk was greater because there is no radar coverage in either position. Consequently,
CARSAMMA assigned an M code (error in ATC-unit-to-ATC-unit transition message) to this report.
2.12 In Report 465, the controller was aware that an aircraft would call and was ready to
receive it at KODOS. Since the aircraft called from a coordinate close to TASIL, he might have been not
as ready to receive it, and the risk was greater because there is no radar coverage -and sometimes, no
ADS, which was not the case, in either position. Consequently, CARSAMMA assigned an M code (error
in ATC-unit-to-ATC-unit transition message) to this report.

GTE/13 Report on Agenda Item 2 2-3
2.13 In Report 512, the controller was aware that an aircraft would call and was ready to
receive it at ARMUR. Since the aircraft called from KIKER, he might have been not as ready to receive
it, but the risk was lesser because there is radar coverage in these two positions. Consequently,
CARSAMMA decided to keep a NON LHD code for this report.
2.14 In Report 921, the controller was aware that an aircraft would call and was ready to
receive it at UGAGA. Since the aircraft called from VUMPI, he might have been not as ready to receive
it, but the risk was lesser because there is radar coverage in both positions. Consequently, CARSAMMA
decided to keep a NON LHD code in this report.
2.15 In Report 1001, the controller was aware that an aircraft would call and was ready to
receive it at VESKA. Since the aircraft called from IRGUT, he might have been not as ready to receive it,
but the risk was lower because there is radar coverage in both positions. Consequently, CARSAMMA
decided to keep a NON LHD code in this report.
2.16 In Report 1035, the controller was aware that an aircraft would call and was ready to
receive it at UGUPI. Since the aircraft called from ENSOL, he might have been not as ready to receive it,
and the risk was greater because there is no radar coverage in either position. Consequently,
CARSAMMA assigned an M code (error in ATC-unit-to-ATC-unit transition message) to this report.
2.17 The Meeting approved the categories suggested by CARSAMMA for the aforementioned
LHDs.

GTE/13 Appendix A to the Report on Agenda Item 2 2A-1
APPENDIX A
CODES FOR LARGE HEIGHT DEVIATIONS
Code Cause of Large Height Deviations
A Flight crew failing to climb/descend the aircraft as cleared.
B Flight crew climbing/descending without ATC clearance.
C
Incorrect operation or interpretation of airborne equipment (e.g. incorrect operation of fully
functional FMS, incorrect transcription of ATC clearance or re-clearance, flight plan
followed rather than ATC clearance, original clearance followed instead of re-clearance,
etc.).
D ATC system loop error (e.g. ATC issues incorrect clearance or flight crew misunderstands
clearance message).
E
Coordination errors in the ATC-to-ATC transfer or control responsibility as a result of
Human Factors (e.g. late or non-existent coordination; incorrect time estimate/actual; flight
level, ATS route, etc. not in accordance with agreed parameters).
F Coordination errors in the ATC-to-ATC transfer or control responsibility as a result of
equipment outage or technical issues.
Aircraft contingency event
G Deviation due to aircraft contingency event leading to sudden inability to maintain assigned
flight level (e.g. pressurization failure, engine failure).
H Deviation due to airborne equipment failure leading to unintentional or undetected change
of flight level.
Deviation due to meteorological conditions
I Deviation due to turbulence or other weather-related cause.
Deviation due to TCAS RA
J Deviation due to TCAS RA; flight crew correctly following the RA.
K Deviation due to TCAS RA; flight crew incorrectly following the RA.
Other
L
An aircraft that is not RVSM approved being provided with RVSM separation (e.g. flight
plan indicating RVSM approval but aircraft not approved; ATC misinterpretation of flight
plan).
M
Other – this includes flights operating (including climbing/descending) in airspace where
flight crews are unable to establish normal air-ground communications with the responsible
ATS unit.
-END-

GTE/13 Report on Agenda Item 3 3-1
Agenda Item 3: Quantitative Vertical Collision Risk Calculation (CRM)
Calculation of vertical collision risk in RVSM airspace in CAR/SAM FIRs
3.1 The Meeting took note of the quantitative assessment, in which CARSAMMA uses the
REICH Vertical Collision Model recommended by ICAO. This is a math-intensive model whereby, after
processing the data on aircraft movement in the FIRs (spreadsheets containing data on flights conducted
in RVSM airspace), the target level of safety (TLS) for the flight region concerned is calculated. Several
calculation tools and databases are used for conducting various calculations during the process,
employing many expert hours in the analysis.
3.2 The RVSM safety assessment was carried out continuously over a period of twelve
months, between 1 January 2012 and 31 December 2012.
3.3 The following was taken into account:
All aircraft operating in airspace with reduced vertical separation minima are RVSM-
certified;
The aircraft certification is still valid;
The target level of safety (TLS) of 5x10⁻⁹
fatal accidents per flight hour (to monitor
height-keeping in a representative sample of aircraft) is being met;
The use of RVSM does not increase the level of risk due to operational errors and
contingency procedures;
There is evidence of aircraft altimetry system stability (ASE);
The introduction of RVSM does not increase risk factors due to operational errors and
flight contingencies, in accordance with a predetermined level of statistical confidence;
Possible additional effective safety measures are adopted to reduce the risk of collision
and to meet safety objectives;
There is evidence of altimetry system error stability (ASE);
Air traffic control procedures continue to be effective.
3.4 It was noted that the methodological procedures used are based on standards
recommended by ICAO and internationally accepted as the most appropriate for assessing RVSM
airspace. The assessment of data, the conclusions and resulting recommendations are shown in paragraph
3.55.

3-2 Report on Agenda Item 3 GTE/13
CAR/SAM RVSM airspace
3.5 CAR/SAM RVSM airspace is made up by 34 Flight Information Regions (FIRs) that
cover the following States: Antigua, Argentina, Barbados, Belize, Bolivia, Brazil, Chile, Colombia, Costa
Rica, Cuba, Dominican Republic, Ecuador, El Salvador, French Guiana, Grenada, Guadeloupe,
Guatemala, Guyana, Haiti, Honduras, Jamaica, Martinique, Netherlands Antilles, Nicaragua, Panama,
Paraguay, Peru, Saint Barthélemy, Saint Kitts and Nevis, Saint Lucia, Saint Vincent, Suriname, Trinidad
and Tobago, Uruguay and Venezuela.
3.6 Each part of the airspace was treated as an isolated system, with its own statistical
parameters.
3.7 Data from 4,276,427.20 flight hours were analysed, corresponding to in-transit aircraft
that used segments of 506 airways of the 34 (thirty four) CAR/SAM FIRs, between flight levels 290 and
410.
3.8 Regarding vertical deviations (LHDs) reported in the CAR/SAM Regions, CARSAMMA
received a total of 1,204 LHDs in 2012. Following the analysis and validation via teleconference with the
participation of representatives of the ICAO Lima and Mexico Offices, the FIRs involved, IATA, and
CARSAMMA, 1,065 LHDs were considered valid for use in vertical collision risk model (CRM)
calculations.
DATA FLOW FOR CALCULATING VERTICAL COLLISION RISK
Aircraft movement data collection
3.9 Sample data for estimating passing frequency, and the physical parameters and dynamics
of a typical aircraft in a vertical collision risk assessment were collected between 1 and 31 December
2012.
3.10 Aircraft movement data received from the 35 CAR/SAM FIRs were processed and used
for assessing RVSM airspace safety, as recommended by ICAO. The number of flight hours in each FIR
is shown in Table 1.
Collision risk calculation
LHDs reported
Traffic moveme
nt

GTE/13 Report on Agenda Item 3 3-3
State FIR Flight hours %
Netherlands Antilles Curaçao - TNCF 261887,4 6,1%
COCESNA Central America - MHTG 381303,7 8,9%
Cuba Havana – MUFH* 239056,4 5,6%
Haiti Port-au-Prince – MTEG 54972,3 1,3%
Jamaica Kingston – MKJK* 109622,2 2,6%
Dominican Republic Santo Domingo – MDCS* 15742,1 0,4%
Trinidad and Tobago Piarco – TTZP* 26268,5 0,6%
Subtotal CAR 1.088.852,6 25,5%
Argentina
Cordoba – SACU* 44678,0 1,0%
Ezeiza – SAEU* 10370,4 0,2%
Mendoza – SAME* 24462,6 0,6%
Resistencia – SARU* 10687,4 0,2%
Comodoro Rivadavia – SAVU* 2122,0 0,0%
Bolivia La Paz - SLLF 53421,5 1,2%
Brazil
Atlantico - SBAO 125775,4 2,9%
Amazonica - SBAZ 465886,9 10,9%
Brasilia – SBBS* 267551,1 6,3%
Curitiba - SBCW 226002,5 5,3%
Recife - SBRE 468795,4 11,0%
Chile
Punta Arenas - SCCZ 6188,4 0,1%
Santiago - SCEZ 54272,6 1,3%
Antofagasta - SCFZ 77660,7 1,8%
Isla de Pascua - SCIZ 57523,5 1,3%
Puerto Montt - SCTZ 626,.3 0,0%
Colombia Barranquilla - SKEC 85131,5 2,0%
Bogota - SKED 243719,5 5,7%
Ecuador Guayaquil – SEGU* 57693,1 1,3%
Guyana Georgetown – SYGC* 8154,4 0,2%
French Guiana Rochambeau – SOOO* 15798,1 0,4%
Panama Panama Oceanic – MPZL* 125547,9 2,9%
Paraguay Asuncion - SGFA 32733,3 0,8%
Peru Lima - SPIM 521339,4 12,2%
Suriname Paramaribo – SMPM* 7531,5 0,2%
Uruguay Montevideo - SUEO 59945,4 1,4%
Venezuela Maiquetía – SVZM* 134582,1 3,1%
Subtotal SAM 3.187.574,6 74,3%
Total CAR/SAM Regions
4.276.427,2 99,8%
Table 1 - Total flight hours in the CAR/SAM Regions
In the FIRs marked with an *(asterisk), data from previous collection exercises were used, updated at a rate of 4.5% per year.
Aircraft fleet
3.11 It is critical that 100% of the RVSM-approved aircraft fleet meet RVSM requirements.
However, during this safety assessment, CARSAMMA identified some aircraft that were not included in
its RVSM database and that had used this airspace in 2012.

3-4 Report on Agenda Item 3 GTE/13
3.12 This led to a global research conducted with the support of monitoring agencies from
other ICAO Regions, crossing information contained in their databases. This study revealed that some of
these aircraft had not been RVSM certified by any State.
3.13 The reports containing the list of non-approved aircraft were sent to the ICAO Lima and
Mexico Offices and to civil aviation authorities responsible for aircraft registration for making the
respective corrections, and were also presented at international meetings attended by CARSAMMA. This
parameter was taken into account in the Vertical Risk Calculation Model.
3.14 After receiving aircraft movement data, CARSAMMA refined and processed the data.
Table 2 shows the aircraft fleet that flew in the CAR/SAM FIRs, with their dimensions and the percentage
of flight hours, including a typical aircraft used as a dimension based on the Vertical Risk Calculation
Model.
Type of ACFT Length Width Height Flight hours Number of flights % of ACFT
B737 0.018898
0.018521 0.006749 9271.1 79648 29.06% A320 0.020286
0.018413 0.000635 8036.3 69040 25.19% B767 0.033153
0.028024 0.009071 3452.0 26910 9.82% E190 0.019568
0.015507 0.057073 3067.5 26353 9.62% B777 0.034395
0.034989 0.010043 2159.3 18551 6.77% A330 0.034341
0.032559 0.090874 1388.5 11929 4.35% A340 0.040659
0.03426 0.009341 1042.1 8953 3.27% B757 0.029428
0.020545 0.007343 970.3 8336 3.04% B747 0.038153
0.034795 0.010481 258.8 2223 0.81% MD11 0.033261
0.028077 0.009465 256.1 2200 0.80% B727 0.02521
0.017765 0.005562 129.0 1108 0.40% F100 0.019184
0.015161 0.045896 125.4 1077 0.39% E135 0.014217
0.01082 0.036501 104.6 899 0.33% H25B 0.084233
0.089632 0.029697 100.0 859 0.31%
Other 0.031785
0.028505 0.023481 1540 15840 5.83%
Typical 0.024699 0.022407 0.015605
Total 31901 273926 100.00%
Table 2 – Aircraft flying at RVSM levels in the CAR/SAM FIRs, which include levels between 290 and 410
(measured in nautical miles)
3.15 The data used for calculating risk show the number of LHD occurrences and the
characteristics of the aircraft fleet that uses the RVSM airways.
Segments most frequently flown in the CAR/SAM FIRs
3.16 Graph 1 shows an index obtained by dividing the number of LHDs occurred in a segment
of the airway by the total movement of aircraft on the same route.
3.17 The graph only shows an index estimated for the 40 airway segments flown in the
CAR/SAM Regions, but calculations were based on all airway segments flown. The airway segments
with the highest rates are the following:

GTE/13 Report on Agenda Item 3 3-5
VESKA / REPIS - UA315 - CURAÇAO FIR (TNCF) ANTILLES
BUSMO / ASIKO - UA321 - BOGOTA FIR (SKED) COLOMBIA
ITAKI / DORKA - UL550 - ANTOFAGASTA FIR (SCFZ) CHILE
UGUPI / BUXOS - UL780 - BOGOTA FIR (SKED) COLOMBIA
3.18 The indices reveal a higher occurrence of LHDs in these segments, not necessarily caused
by the FIR where the event occurred.
Graph 1: LHDs by most frequently flown segment in the CAR/SAM FIRs in 2012.
Times of the day with more LHDs in the CAR/SAM FIRs
3.19 Two graphs are shown in this regard. The first is Graph 2a, showing the distribution of
aircraft movement throughout the day.
Graph 2a – LHDs by time of day (UTC)
0.00000%
0.02000%
0.04000%
0.06000%
0.08000%
0.10000%
0.12000%
0.14000%
UG
UP
I/B
UX
OS
VTN
/IR
EMI
SOR
TA/V
TN
AC
AR
I/B
OM
AL
CG
O/N
IBG
A
SAIP
A/C
AR
SOR
TA/E
MB
AL
SELE
K/B
ON
OS
CU
RSE
/ISA
LA
CU
RSE
/NA
FIL
REB
OL/
EM
BA
L
VTN
/BR
AD
A
SCB
/SID
AK
NED
UL/
TOK
UT
PA
BEL
/GA
BIX
ESEN
O/I
MB
EK
RA
DO
N/S
ELEK
VES
KA
/REP
IS
AN
SON
/LIB
IS
ISER
U/U
GA
DI
UT
PA
M/N
AB
OL
JUIC
E/O
SAM
U
SCB
/TO
MB
O
ELA
SA/A
TED
A
MA
GN
O/S
AK
SI
SAK
SI/O
BK
UT
PIN
DO
/TA
P
IMO
LA/P
IND
O
BIT
AK
/ISA
LA
REG
IS/A
RU
NU
INTO
L/SA
LPU
SALP
U/O
RA
RO
ILG
ER
/EK
ALO
OR
AR
O/T
ASI
L
AR
ENA
/PEN
SO
EDO
PO
/EJA
LIB
IS/A
SOK
U
DA
GA
N/B
AQ
BU
SMO
/ASI
KO
ITA
KI/
DO
RK
A
0.0
25
43
%
0.0
10
92
%
0.0
09
02
%
0.0
00
00
%
0.0
00
00
%
0.0
00
00
%
0.0
09
68
%
0.0
00
00
%
0.0
06
47
%
0.0
00
00
%
0.0
00
00
%
0.0
00
00
%
0.0
08
02
%
0.0
00
00
%
0.0
08
50
%
0.0
00
00
%
0.0
00
00
%
0.1
30
11
%
0.0
00
00
%
0.0
00
00
%
0.0
00
00
%
0.0
00
00
%
0.0
00
00
%
0.0
00
00
%
0.0
00
00
%
0.0
00
00
%
0.0
10
85
%
0.0
00
00
%
0.0
11
20
%
0.0
00
00
%
0.0
00
00
%
0.0
00
00
%
0.0
11
36
%
0.0
11
61
%
0.0
00
00
%
0.0
00
00
%
0.0
00
00
%
0.0
00
00
%
0.0
37
59
%
0.0
38
11
%
LHDs by most flown segment - CAR/SAM FIRs
0
5000
10000
15000
00
:00
01
:00
02
:00
03
:00
04
:00
05
:00
06
:00
07
:00
08
:00
09
:00
10
:00
11
:00
12
:00
13
:00
14
:00
15
:00
16
:00
17
:00
18
:00
19
:00
20
:00
21
:00
22
:00
23
:00
11
74
4
12
56
7
12
16
4
96
42
99
37
10
58
5
Aircraft movement by time of day

3-6 Report on Agenda Item 3 GTE/13
3.20 The second one is Graph 2b, containing a table that compares the number of LHDs
occurred at a given point in time and the number of aircraft movements during that same period of time.
3.21 The higher the index, the higher the number of LHDs occurred at that time of the day.
The times of the day with more LHDs were:
16:00-17:00 ... 0.9030
14:00-15:00 ... 0.8455
18:00-19:00 ... 0.7951
15:00-16:00 ... 0.7491
3.22 In order to reduce these rates, attention must be paid to traffic coordination handover and
timely communication.
Graph 2b – Index of LHDs by time of day
Days of the week with more LHDs in the CAR/SAM FIRs
3.23 Aircraft movement data submitted to CARSAMMA shows that the highest volume of
traffic occurs on weekends, starting to drop on Sundays and reaching a trough on Wednesdays, when it
starts increasing again until Saturdays, as shown in Graph 3a.
Graph 3a – Traffic movement, by day of week
0.0000
0.5000
1.0000
00
:00
01
:00
02
:00
03
:00
04
:00
05
:00
06
:00
07
:00
08
:00
09
:00
10
:00
11
:00
12
:00
13
:00
14
:00
15
:00
16
:00
17
:00
18
:00
19
:00
20
:00
21
:00
22
:00
23
:00
0.2
69
7
0.4
97
8
0.3
72
1
0.3
94
3
0.4
41
1
0.1
97
1
0.3
10
3
0.2
89
5
0.2
51
1
0.2
55
4
0.3
34
8
0.6
06
7
0.6
83
3
0.5
68
2
0.8
45
5
0.7
49
1
0.9
03
0
0.6
75
9
0.7
95
1
0.7
23
4
0.6
47
0
0.4
67
5
0.4
48
1
0.0
36
6
LHDs by time of day / traffic movement by time of day
0:00:00
2400:00:00
4800:00:00
7200:00:00
9600:00:00
Dom Lun Mar Mie Jue Vie Sab
Traffic movement, by day of week

GTE/13 Report on Agenda Item 3 3-7
3.24 The distribution of LHD events by weekday does not follow the expected aircraft
movement flow reflected in Graph 3b, which shows less number of LHDs on weekends.
Graph 3b – LHD indices by weekday
Indices of aircraft types with higher number of LHDs in CAR/SAM FIRs
3.25 The types of aircraft that flew most over the CAR/SAM FIRs are the following families:
B737, A320, B767, E190, B777, A330, A340, B757, B747 and MD11.
Graph 4a – Percentage of LHDs by type of aircraft
3.26 As shown in Graph 4b below, the LHD index by aircraft movement and type of aircraft
does not follow the expected distribution. The higher the index, the higher the number of LHDs by type
of aircraft.
0.0000
0.1000
0.2000
0.3000
0.4000
0.5000
Dom Lun Mar Mie Jue Vie Sab
0.3
91
3
0.4
82
6
0.4
30
0
0.3
98
6
0.4
96
6
0.4
65
2
0.4
00
6
LHDs-Day of week / Movements-Day of week
0%
5%
10%
15%
20%
25%
30%
B737 A320 B767 E190 B777 A330 A340 B757 B747 MD11
Percentage by type of aircraft
Movimiento
LHD

3-8 Report on Agenda Item 3 GTE/13
Graph 4b – LHD index by type of aircraft
LHD index by most frequently flown airways in the CAR/SAM FIRs
3.27 In the aircraft movement sample, the ten (10) airways most frequently flown in the
CAR/SAM FIRs are: UA301, UA317, UG439, UL780, UW33, UW24, UL302, UA321, UM782 and
UZ37.
3.28 After identifying the LHDs that occurred in these airways, LHDs were segregated by
aircraft movement, resulting in the index shown in Graph 5.
Graph 5 – LHD index by airway
3.29 It should be recalled that the higher the index, the higher the number of occurrences.
Noteworthy is the 0,0683 index attributed to airway UL780, where special attention to traffic movement
is advised.
3.30 This is illustrated in Table 3, with reflects the figures obtained in the analysis.
0.000
0.500
1.000
1.500
2.000
2.500
B7
37
A3
20
B7
67
E19
0
B7
77
A3
30
A3
40
B7
57
B7
47
MD
11
0.7
02
0.6
63
1.1
55
0.7
07
1.3
39
0.6
93
1.2
81
2.0
90
0.4
91
1.8
21
LHD by aircraft type / Movements by aircraft type
0.0000
0.0200
0.0400
0.0600
0.0800
UA
30
1
UA
31
7
UG
43
9
UL7
80
UW
33
UW
24
UL3
02
UA
32
1
UM
78
2
UZ3
7
0.0
06
5
0.0
02
9
0.0
07
9
0.0
68
3
0.0
02
3
0.0
00
0
0.0
24
0
0.0
13
3
0.0
00
0
0.0
00
0
LHD by airway / Movements by airway

GTE/13 Report on Agenda Item 3 3-9
Airway Mov LHD
UA301 1689 11
UA317 1383 4
UG439 1018 8
UL780 952 65
UW33 877 2
UW24 832 0
UL302 832 20
UA321 825 11
UM782 749 0
UZ37 725 0
Table 3 – Movement on airways and number of LHDs
LHD index by flight level, and flight levels most frequently flown in RVSM airspace
3.31 Based on the distribution of flight levels in the sample, Graph 6a shows flight level 360 as
the one most frequently flown in RVSM airspace.
Graph 6a – Use of RVSM flight levels
3.32 Taking into account the number of LHDs by flight level of occurrence, divided by the
number of aircraft movements in their respective levels, the indices shown in Graph 6b are derived.
Graph 6b - LHD index by RVSM flight level
0
200
400
290 300 310 320 330 340 350 360 370 380 390 400 410
Flight levels in RVSM airspace
0.000
0.020
0.040
41
0
40
0
39
0
38
0
37
0
36
0
35
0
34
0
33
0
32
0
31
0
30
0
29
0
0.0
27
0.0
20
0.0
22
0.0
20
0.0
26
0.0
18
0.0
23
0.0
19
0.0
26
0.0
18
0.0
21
0.0
11
0.0
11
LHD index / Aircraft movements

3-10 Report on Agenda Item 3 GTE/13
3.33 For various reasons, most aircraft are built calculating an optimal cruise level between
FL350 and FL370.
3.34 However, it should be noted that this implies occupancy rates and passing frequencies at
these levels that are to the detriment of other levels available in RVSM airspace.
3.35 It is recommended that aircraft manufacturers understand and analyse the problem and, if
possible, find an alternative, since traffic build-up around these levels has a direct effect on collision risk
and air traffic flow management.
Collision risk safety assessment (CRM)
3.36 This section shows the results of the RVSM airspace safety assessment in the CAR/SAM
FIRs.
3.37 Accordingly, the internationally accepted collision risk methodology (CRM) has been
used for assessing RVSM airspace safety in the Caribbean and South America.
3.38 In the data analysis phase, information technologies are intensively used for obtaining the
final results from the collision risk model. A brief description follows of how the data derived from the
aircraft movement sample and the validated LHD data are used and combined.
3.39 The processed aircraft movement data were combined with 2012 data on Large Height
Deviations (LHDs) in the FIR in question, and then analysed by experts from the FIR, officials from the
ICAO Lima and Mexico Regional Offices, and CARSAMMA at monthly teleconferences. IATA also
participates in these teleconferences as guest consultant.
3.40 At the conference, LHDs are validated, and parameter values are merged and fed into the
REICH collision risk model formula shown in the following chapter.
3.41 Figure1 provides a geometric description of RVSM airspace where two aircraft fly with a
separation of 1000 ft within their safety envelope.
Figure 1 – Geometric representation of the Collision Risk Model (CRM)

GTE/13 Report on Agenda Item 3 3-11
CRM parameter estimates
Figure 2 – REICH collision risk model formula
3.42 Table 4 summarises the amounts and basic material used for estimating each parameter of
the internationally accepted collision risk model (CRM) that is used for RVSM airspace safety
assessment.
Parameter Description Value
The mean length of aircraft sample. 0.024699 nm
The mean width of aircraft sample. 0.022407 nm
The mean height of aircraft sample. 0.015605 nm
The average ground speed of aircraft sample. 441.92 kt/h
The average velocity in the same direction of aircraft sample.
36.96 kt/h
The average velocity relative to cross-track approach in aircraft sample.
13 kts
The average vertical velocity during loss of relative vertical separation in aircraft sample.
1,5 kts
The probability of vertical overlap of two aircraft flying on the same level in aircraft sample.
0,398840
Table 4: CRM parameter estimates

3-12 Report on Agenda Item 3 GTE/13
Demonstration of technical feasibility of RVSM in the CAR/SAM Regions
3.43 The following REICH collision risk model parameters are assessed:
Passing frequency (Nx);
Probability of vertical overlap P (SZ); and
Probability of lateral overlap Py (0).
The demonstration had the following objectives:
Ensure compliance with the technical TLS; and
Verify the stability of the ASE.
Total system performance specifications
Passing frequency, Nx
3.44 This is a parameter related to aircraft exposure to vertical collision risk in the airspace.
Passing frequency was estimated taking into account equivalent aircraft flying in the same direction and
in opposite direction, as shown in Table 5.

GTE/13 Report on Agenda Item 3 3-13
FIR Passing frequency Flight time Hours Region Same direction Opposite direction Equivalent
CAR Region
Curaçao - TNCF 0,024044 0,011425 0,004336 261887,4
Central America - MHTG 0,038108 0,002754 0,039457 381303,7
Havana - MUFH 0,110520 0,029532 0,057007 239056,4
Port au Prince - MTEG 0,018274 0,000922 0,117081 54972,3
Kingston - MKJK 0,020314 0,004873 0,049474 109622,2
Santo Domingo - MDCS 0,039699 0,001619 0,082836 15742,1
Piarco - TTZP 0,117636 0,026668 0,024274 26268,5
SAM Region
Córdoba - SACU 0,017626 0,001630 0,029310 44678,0
Ezeiza - SAEU 0,008824 0,012425 0,097932 10370,4
Mendoza - SAME 0,079313 0,004619 0,008839 24462,6
Resistencia - SARU 0,029489 0,024363 0,030814 10687,4
Comodoro Rivadavia - SAVU 0,061578 0,030721 0,042071 2122,0
La Paz - SLLF 0,044173 0,006366 0,064891 53421,5
Atlántico - SBAO 0,040483 0,037007 0,054395 125775,4
Amazónica - SBAZ 0,021164 0,004075 0,032771 465886,9
Brasilia - SBBS 0,065161 0,008970 0,043621 267551,1
Curitiba - SBCW 0,040441 0,008619 0,031262 226002,5
Recife - SBRE 0,038304 0,001341 0,019926 468795,4
Punta Arenas - SCCZ 0,006334 0,001730 0,047845 6188,4
Santiago - SCEZ 0,042159 0,039532 0,017739 54272,6
Antofagasta - SCFZ 0,051411 0,005873 0,028543 77660,7
Isla de Pascua - SCIZ 0,000381 0,002320 0,005336 57523,5
Puerto Montt - SCTZ 0,088626 0,050821 0,016696 626,3
SAM Region
Barranquilla - SKEC 0,031446 0,001564 0,048437 85131,5
Bogota - SKED 0,027635 0,001619 0,039079 243719,5
Guayaquil - SEGU 0,036594 0,023206 0,055791 57693,1
Georgetown - SYGC 0,032933 0,028708 0,031749 8154,4
Rochambeau - SOOO 0,037253 0,009715 0,061991 15798,1
Panama Oceanic - MPZL 0,034550 0,029543 0,051922 125547,9
Asunción - SGFA 0,019023 0,004873 0,014106 32733,3
Lima - SPIM 0,020871 0,001491 0,046225 521339,4
Paramaribo - SMPM 0,042259 0,035079 0,010640 7531,5
Montevideo - SUEO 0,024592 0,015808 0,027409 59945,4
Maiquetia - SVZM 0,057762 0,032294 0,042071 134582,1
Total 4.276.427,2
Table 5 – Passing frequency in the CAR/SAM FIRs
3.45 Values are related to the CAR/SAM airspace, where 34 FIRs have been considered. The
maximum passing frequency indicates places with a higher potential collision risk. It should be noted that
passing frequencies shown in Table 5 were calculated based on total flight hours in the CAR/SAM
Regions. Some observations follow:

3-14 Report on Agenda Item 3 GTE/13
The equivalent passing frequency peak, which represents the highest exposure to vertical
collision risk, occurs in the Port-au-Prince FIR - MTEG, which ranks 18th with a total
flight time of 54,972.3h;
The Lima FIR - SPIM has the highest number of flight hours (521,339.4h), but only ranks
13th in terms of passing frequency;
The Curaçao FIR - TNCF has the lowest passing frequency, and ranks 6th in terms of
total number of flight hours (261,887.4 h); and
The Puerto Montt FIR - SCTZ has the lowest number of flight hours (626.3h), and ranks
29th in terms of passing frequency.
Probability of vertical overlap, Pz (1000)
3.46 The software used by CARSAMMA for the follow up of total vertical errors (TVE) was
kindly provided by the RMA of Australia (AAMA). The FAA (United States) originally developed the
software used.
3.47 The estimated value of Pz (1000) used in CARSAMMA calculations was 2.46 x 10⁻⁸
,
according to the aforementioned software.
Probability of lateral overlay, Py (0)
3.48 According to Doc 9574, the probability of lateral overlay must be periodically assessed.
3.49 In order to assess the operational collision risk, it was assumed that Py (0) would not
exceed a value of 0.058, in accordance with Doc 9574.
Total collision risk estimates
3.50 Table 6 contains the set of physical and dynamic parameters estimated using the REICH
Collision Risk Model, as well as key monitoring parameters, by FIR.
3.51 All parameters are defined based on the airspace of each Region, as an isolated system.

GTE/13 Report on Agenda Item 3 3-15
FIR Ez(same) ΔV(same) Ez(op) ΔV(op) Ez(cross) V
TNCF 0,024044 32,7920784 0,011425 745,8876 0,004336 446,4603
SACU 0,038108 20,3980840 0,002754 773,2106 0,039457 457,9589
SAEU 0,11052 18,7151208 0,029532 720,7874 0,057007 424,4376
SAMV 0,018274 32,0485215 0,000922 0 0,117081 449,2757
SARU 0,020314 32,2620879 0,004873 727,6941 0,049474 437,2073
SAVU 0,039699 30,3197728 0,001619 0 0,082836 427,6777
SLLF 0,117636 44,0907429 0,026668 740,3905 0,024274 445,9972
SBAO 0,017626 43,5924565 0,00163 766,4929 0,02931 452,1522
SBAZ 0,008824 36,1706131 0,012425 730,3422 0,097932 436,8739
SBBS 0,079313 34,9274625 0,004619 715,5527 0,008839 421,2162
SBCW 0,029489 40,5096000 0,024363 694,6865 0,030814 374,3227
SBRE 0,061578 24,0313240 0,030721 748,4618 0,042071 435,0341
SCCZ 0,044173 34,4827580 0,006366 744,8582 0,064891 435,6851
SCEZ 0,040483 59,5626021 0,037007 0 0,054395 408,8836
SCFZ 0,021164 19,2924965 0,004075 808,6304 0,032771 433,6195
SCIZ 0,065161 38,1231600 0,00897 823,1373 0,043621 473,1188
SCTZ 0,040441 33,9622640 0,008619 0 0,031262 572,7655
MHTG 0,038304 10,0791209 0,001341 789,1645 0,019926 460,9762
SKEC 0,006334 20,6620171 0,00173 768,2203 0,047845 466,8695
SKED 0,042159 26,5693414 0,039532 787,2296 0,017739 458,388
MUFH 0,051411 12,2695355 0,005873 757,4365 0,028543 447,1952
SEGU 0,000381 72,5207544 0,00232 797,4456 0,005336 456,2195
SYGC 0,088626 40,2439020 0,050821 783,2017 0,016696 457,3999
SOOO 0,031446 34,1296920 0,001564 837,4134 0,048437 485,221
MTEG 0,027635 1,6309600 0,001619 631,8305 0,039079 383,6303
MKJK 0,036594 9,8873674 0,023206 761,8324 0,055791 452,8507
MPZL 0,032933 28,0766388 0,028708 725,2353 0,031749 431,3895
SGFA 0,037253 38,6951724 0,009715 606,8332 0,061991 383,7195
SPIM 0,03455 28,5799246 0,029543 781,7613 0,051922 457,1201
MDCS 0,019023 30,7812320 0,004873 691,0607 0,014106 433,7309
SMPM 0,020871 24,7667801 0,001491 816,9272 0,046225 455,6119
TTZP 0,042259 31,0312619 0,035079 797,8035 0,01064 433,0915
SUEO 0,024592 28,3135467 0,015808 823,1415 0,027409 449,854
SVZM 0,057762 47,5936158 0,032294 812,1153 0,042071 469,7325
Table 6: Physical and dynamic parameters used in the REICH collision risk model
Graphical illustration of vertical collision risk in the CAR/SAM FIRs
3.52 Graph 4a illustrates the vertical collision risk, by month, in the CAR/SAM FIRs, for
2012. In February, the risk was 1,159E-08, much above the TLS.

3-16 Report on Agenda Item 3 GTE/13
Graph 4a: Vertical collision risk – 2012
3.53 In Graph 4b, this same table was expanded to show which FIR had its highest risk in
February. This increase in risk was due to LHDs reported by the Piarco, Maiquetia, Guayaquil, and
Resistencia FIRs. It should be noted that the FIR that submitted the LHD reports was exposed to a higher
risk, but the risk was caused by failures in the adjacent FIRs.
Graph 4b: Vertical collision risk in February 2012
3.54 Figures 3abcd below summarise some LHD reports for February 2012 that contributed to
an increased operational risk that exceeded the TLS.
0.00E+00
2.00E-09
4.00E-09
6.00E-09
8.00E-09
1.00E-08
1.20E-08
en
e -
12
feb
- 1
2
mar
- 1
2
abr
- 1
2
may
- 1
2
jun
- 1
2
jul -
12
ago
- 1
2
sep
- 1
2
oct
- 1
2
no
v -
12
dic
- 1
2
Vertical collision risk, by month in the CAR/SAM FIRs - 2012
TLS TLS Técnico Riesgo Total Riesgo Técnico Riesgo Operativo
0.00E+00
5.00E-08
1.00E-07
1.50E-07
2.00E-07
2.50E-07
TNC
F
SAR
U
SLLF
SBA
O
SBA
Z
SBC
W
SBR
E
SCFZ
MH
TG
SKED
MU
FH
SEG
U
SOO
O
MTE
G
SPIM
MD
CS
TTZP
SVZM
TLS TLS Técnico Riesgo Total Riesgo Técnico Riesgo Operativo
Vertical collision risk - February 2012

GTE/13 Report on Agenda Item 3 3-17
LHD submitted by the Piarco FIR reporting an error by the Georgetown FIR. The flight level was different for 3 minutes
LHD submitted by the Maiquetía FIR reporting total lack of coordination by the Amazonica FIR. Duration: 41 minutes
Self-report submitted by the CENAMER FIR. The flight level was different from the coordinated level
LHD submitted by the Resistencia FIR; the Asunción FIR coordinated a different flight level. Duration: 3 minutes
Figures 3abcd: LHDs in February 2012
Conclusions of the safety assessment (CRM)
3.55 The operational risk was estimated by FIR, and the values shown in Table 7 were
obtained after processing all the data received, compiled and processed using the specific CRM software.

3-18 Report on Agenda Item 3 GTE/13
FIR Total risk Technical risk Operational risk TNCF 7,71E-09 8,31E-12 7,7011E-09
SACU 7,55E-10 6,80E-13 7,5435E-10
SAEU 3,79E-12 6,80E-13 3,1053E-12
SAME 6,34E-10 3,21E-11 6,0170E-10
SARU 1,90E-07 6,80E-13 1,9043E-07
SAVU 2,53E-10 2,53E-10 0,0000E+00
SLLF 1,11E-09 5,56E-12 1,1092E-09
SBAO 2,24E-09 1,34E-11 2,2249E-09
SBAZ 2,04E-10 1,24E-11 1,9145E-10
SBBS 1,42E-11 6,80E-13 1,3522E-11
SBCW 6,74E-10 1,06E-11 6,6379E-10
SBRE 2,34E-10 1,58E-11 2,1835E-10
SCCZ 6,80E-13 6,80E-13 0,0000E+00
SCEZ 2,93E-10 2,15E-11 2,7189E-10
SCFZ 3,29E-09 3,84E-11 3,2542E-09
SCIZ 3,95E-12 6,80E-13 3,2736E-12
SCTZ 2,18E-09 1,05E-11 2,1706E-09
MHTG 6,77E-10 1,26E-11 6,6412E-10
SKEC 4,03E-10 6,80E-13 4,0222E-10
SKED 4,14E-10 6,80E-13 4,1355E-10
MUFH 1,65E-09 6,80E-13 1,6536E-09
SEGU 3,22E-08 6,80E-13 3,2202E-08
SYGC 1,69E-08 6,80E-13 1,6936E-08
SOOO 7,61E-09 6,80E-13 7,6099E-09
MTEG 3,23E-10 6,80E-13 3,2264E-10
MKJK 3,98E-11 6,80E-13 3,9074E-11
MPZL 3,79E-11 6,80E-13 3,7178E-11
SGFA 1,44E-09 6,80E-13 1,4367E-09
SPIM 6,56E-10 6,80E-13 6,5516E-10
MDCS 2,06E-09 6,80E-13 2,0587E-09
SMPM 4,19E-11 6,80E-13 4,1248E-11
TTZP 6,19E-08 6,80E-13 6,1935E-08
SUEO 1,60E-08 6,80E-13 1,5949E-08
SVZM 3,02E-08 6,80E-13 3,0210E-08
Weighted total
3,39E-09 7,48E-12 3,378E-09
Table 7: Estimated operational risk, by FIR
* The apparently repeated sequence of values in the technical risk column is due, inter alia, to a small incidence of two-way
airways or intersections in the FIR concerned.
3.56 The technical risk meets the TLS of no more than 2.5 x 10⁻⁹
fatal accidents per flight hour
due to loss of 1,000-ft vertical separation and all other causes.
3.57 The operational risk has no predetermined limit value, in accordance with Doc 9574.

GTE/13 Report on Agenda Item 3 3-19
3.58 For the FIRs under consideration, total risk is 3.39 x 10⁻⁹
fatal accidents per flight hour,
which is below the accepted TLS of 5.0 x 10⁻⁹
fatal accidents per flight hour.
CAR/SAM RVSM Airspace
Estimated annual flight hours = 4,276,427.2 hours
(Note: Time estimated based on December 2012 sample)
Source of risk Estimated risk TLS Observation
Technical risk 7,48 x 10⁻¹² 2,5 x 10⁻⁹ Below
Operational risk 3,38 x 10⁻⁹ - -
Total risk 3,39 x 10⁻⁹ 5,0 x 10⁻⁹ Below
Table 8: Annual risk estimates for CAR/SAM RVSM airspace
3.59 The Meeting concluded that the estimated annual vertical collision risk for 2012 in
CAR/SAM RVSM airspace had been below the TLS recommended by ICAO (TLS = 5 x 10⁻⁹ fatal
accidents per flight hours), based on the CRM methodology. Accordingly, it could be said that it had
been a safe airspace during 2012 (Table 8).
New collection of data on aircraft movement in RVSM airspace of the CAR/SAM
Regions
3.60 The Meeting took note that the worldwide meeting of Monitoring Agencies had agreed
that the collection of data on aircraft movement in RVSM airspace of the regions should be carried out on
dates that were feasible for data collection.
3.61 In this regard, the Scrutiny Group formulated the following conclusion:
CONCLUSION GTE/13-3 COLLECTION OF DATA ON AIRCRAFT MOVEMENT IN
RVSM AIRSPACE OF THE CAR/SAM REGIONS
That CAR/SAM States and International Organisations collect data on aircraft movement
in RVSM airspace between 1 and 30 November 2013 and send the corresponding data in
CARSAMMA Form F0 to that body with copy to ICAO NACC and SAM Regional
Offices before 31 January 2014.

GTE/13 Report on Agenda Item 4 4-1
Agenda Item 4: Analysis of Large Height Deviations (LHDs)
- Evolution of M and N-coded LHDs in RVSM airspace of CAR/SAM
FIRs
4.1 The Meeting recalled that the CAR/SAM Regional Planning and Implementation Group
(GREPECAS) had delegated the implementation of the SMS methodology for LHD analysis to the
Caribbean and South American Monitoring Agency (CARSAMMA). CARSAMMA is an administrative
agency of the Departamento de Controle do Espaço Aéreo (DECEA), an entity that belongs to the
Brazilian Airspace Control System (SISCEAB).
4.2 Under this item, CARSAMMA presented a summary of the evolution of RVSM airspace
safety in the CAR/SAM FIRs.
4.3 A set of LHD reports collected over a period of three years between 2010 and 2012 was
used in this safety evolution analysis.
4.4 Table 1 and Graph 1 summarise LHD reports at the most risky positions for the 2010-
2012 period.
Point M N
VESKA 113 42
VAKUD 33 26
PALAS 44 14
UGUPI 35 20
IREMI 46 8
OROSA 30 17
BEROX 52 5
PIGBI 32 17
POKAK 24 6
REPAM 22 4
SBAO-SUEO 54 25
PLG 21 8
SBAO-DIII 27 29
TERAS 20 8
AVELO 3 3
Table 1: Report of M- and N-coded LHDs at the points of most frequent occurrence

4-2 Report on Agenda Item 4 GTE/13
Graph 1: M- and N-coded LHD occurrences
4.5 The Meeting noted that M-coded LHDs (error in ATC-unit-to-ATC-unit transfer
message) were the most frequent during the 2010-2012 period, with 486 events, followed by N-coded
LHDs (lack of coordination) with 232 events.
4.6 It also noted that M-coded LHDs were the most frequent in almost all positions, except in
the SBAO-SUEO and SBAO-DIII boundaries, where N-coded LHDs prevailed because of traffic
management between the Falkland Islands and the Ascension Islands in the South Atlantic.
4.7 The Meeting recalled that N-coded LHDs constituted one of the worst incidents in air
traffic, since the aircraft concerned are not expected in that position, at that level, or at the time of
occurrence. In summary, situational awareness of traffic is significantly impaired.
4.8 The high number of M- and N-coded LHDs showed the need for better coordination
between adjacent air traffic control centres, which could be achieved by sensitising and training
controllers in coordination aspects.
4.9 Graph 2 provides a geographical distribution of cumulative points of M- and N-coded
LHDs between 2010 and 2012.
4.10 During the Meeting, 122 LHD were analysed and 116 LHD were validated.
113
33 44 35
46 30
52 32 24 22
54
21 27 20 3
42
26 14 20 8
17
5
17
6 4
25
8
29
8
3
LHD Reports 2010 - 2012 M N

GTE/13 Report on Agenda Item 4 4-3
Graph 2: Image of M- and N-coded LHDs between 2010 and 2012

4-4 Report on Agenda Item 4 GTE/13
LHDs in the South Atlantic
4.11 The Meeting took note of the efforts being made by Uruguay to complete the coverage of
the Montevideo FIR with ADS-C information. It was estimated that the provider, SITA, would
implement this functionality before the end of 2013.
4.12 Likewise, the Meeting took note of the lack of flight plans or communication with aircraft
flying this route, making it difficult to estimate traffic or, at least, to be aware of it.
4.13 The Meeting urges the Administrations of Argentina and Uruguay to strengthen their
efforts to substantially reduce LHD reports in the South Atlantic, in the Comodoro Rivadavia, Ezeiza, and
Montevideo FIRs, and thus reduce safety risk.
Measures to reduce M- and N-coded LHDs in RVSM airspace
4.14 The Secretariat pointed out that throughout the period following RVSM implementation,
many bilateral meetings have been held in an attempt to minimize or eliminate operational errors that fall
within the M and N LHD categories. However, there were some very important transfer points that still
lacked reliable handover procedures.
4.15 Some FIRs have implemented automated transfers -with the associated costs- but there
was still a coordination issue that is not reflected in the Letters of Operational Agreement between
adjacent FIRs, especially with respect to the reception of flight plans, duplication of flight plans, or lack
of aircraft attitude specifications (climb/descent) for transfer purposes.
4.16 Furthermore, the absence of handover had increased significantly, resulting in severe loss
of situational awareness, seriously affecting safety.
Review of Letters of Operational Agreement to improve coordination procedures
4.17 The Meeting considered it necessary for the States of both Regions to modify their
Letters of Operational Agreement in order to include the necessary procedures to make sure that traffic is
transferred with no errors, thus minimizing M- and N- coded LHD reports. It also recognized that the
application of the SMS methodology for LHD analysis revealed the weak points in the transfer of traffic
between ATS units, and that these data could be used to enhance coordination procedures established in
the Letters of Operational Agreement.

GTE/13 Report on Agenda Item 5 5-1
Agenda Item 5: Other business
Study for cleaning aircraft movement data sent to CARSAMMA during the data
collection, preparation and analysis phases
5.1 The Meeting took note of the shortcomings of aircraft movement data sent to
CARSAMMA in 2012, and reviewed a summary of the study on the need to clean these data during the
collection, preparation, and analysis phases.
5.2 The Meeting also noted that, given the large amount of incorrect data, CARSAMMA had
to use resources that could be employed in other safety processes. It was emphasised that the letter
requesting the delivery of these data contains detailed instructions for each specific case.
5.3 Examples are given in alphabetical order by name of State, and by title or heading:
FIR IDENTIFICATION:
DATE CALL SIGN TYPE AD AD POINT OF ENTRY TIME AT FL AT THE AIRWAY POINT OF EXIT TIME AT FL AT THE
OF OF OF INTO POINT OF ENTRY POINT OF AT OF RVSM POINT OF POINT OF
ACFT ORIGIN DESTINATION RVSM AIRSPACE ENTRY POINT OF AIRSPACE EXIT EXIT
ENTRY
Examples of spreadsheets received by CARSAMMA
- Netherlands Antilles
One spreadsheet was received from the TNCF FIR. The following example is a record.
TNCF
02/12/12 N275HZ N275HZ LJ60 KBCT SVMI VESKA 23:57 390 A315 REPIS 0:38 230 Note that the airway and the level are not RVSM. Must be reviewed.
- Argentina
5 spreadsheets were received from the SACU, SAEU, SAMV, SARU, and SAVU FIRs.
They were all sent past the deadline. Some examples follow:
SACU
Dic 1 2012 12:00 DSM4135 LVCKV A320 SASA SABE PONPI 2322 222 ROKER 0016 370 Date, level and time other than requested. Must be reviewed.
SAEU
01-12-12 01:52:00 GLO7681 B738 SABE SBGR 390 0358 SID13 14 0152 WYDFIKLORX
Date, time, and fix other than requested. Must be reviewed.
SAMV
29-12-12 LAN480 A320 SABE SCEL TOSOR 00:42 380 UA306 UMKAL 01:26 260
Date and level other than requested. Must be reviewed.

5-2 Report on Agenda Item 5 GTE/13
SARU
01/12/12 LAN756 A320 SCEL SBGR SIKOB 0021 370 UM400 ARULA 0051 370 Only time is not as requested. Requires little revision.
SAVU
01-Dec ARG 1845 S/D B737 SAWE SABE ERUPO 00:24 390 UT662 PUGLI 01:48 390 Only date is not as requested. Requires little revision.
- Bolivia
One spreadsheet from the SLLF FIR was received. The following example is a record.
SLLF
The file was sent as PDF. An Excel software converter is required.
- Brazil
5 spreadsheets were received from the SBAO, SBAZ, SBBS, SBCW, and SBRE FIRs.
Some examples follow:
SBAO
01/12/12 TAP074 NULL A332 SBGL LPPT MAGNO 7 390 UN866 DEKON 106 390 S01 Record, time, and fix other than requested. Must be reviewed.
SBAZ
01/12/12 AAL954 B772 SAEZ KJFK UDIDI 04:14 380 UL793 UGAGA 05:04:00 380
Only the record is missing. Requires little revision.
SBBS
1 12
2012
S09
0001
0023
GLO1634
SBGL
SBEG
B737
MONBI
1602S04706W
380
380
UM409
Issued after the deadline. Date, time, and fix other than requested. Must be reviewed.
SBCW
12/01/12 PTSKW E135 W SBKP SEGU OROKA 1:12 380 UZ21/UL655/UL655 EGIMO 2:30 380 No revision was required. The data were immediately processed.
SBRE
12/01/12 TAM3316 NULL A320 SBGR SBNT BSREK 23:52 370 1339S04040W 0:14 370 The record is other than requested. Requires little revision.
- Chile
5 spreadsheets were received from the SCCZ, SCEZ, SCFZ, SCIZ, and SCTZ FIRs. They
were all sent after the deadline. Some examples follow:
SCCZ
04/05/13 LXP283 A320 SCTE SCCI SATIN 19:56 19:56 270 UT100 PNT 20:44 20:44 270
Record and level other than requested. Must be reviewed.

GTE/13 Report on Agenda Item 5 5-3
SCEZ
01/08/12 SKU162 A320 SCEL SCCF DILOK 0:00 250 UL309 CEPAM 1:16 250
Record and level other than requested. Must be reviewed.
SCFZ
This spreadsheet was delivered as SCEZ /SCFZ, with mixed data. Requires significant
review.
SCIZ
01/08/12 AMX010 B762 MMMX SCEL ESDIN 11:17 F370 UL401 2732S075W 12:31 F370
Record other than requested. Requires little revision.
SCTZ
01/05/13 LXP271 A319 SCEL SCBA LENOS 13:28 370 UT106 ARGOS 13:20
290
Record other than requested. Requires little revision.
- COCESNA
One spreadsheet was received from the MHTG FIR. The following example is a record.
MHTG
12/01/12 CMP796 HP1531 B737 MROC MPTO CACHI 0:11 163 TIO UG440 ISEBA DCT PUDOS ISEBA 0:19 365 Airway and level other than requested. Must be reviewed.
- Colombia
One spreadsheet was received from the SKEC and SKED FIRs. The model follows:
SKEC
1/12/2012 00:00:00.00
CMP-1534 B738 MDSD MPTO OROSA 0005 400.0 AGUJA 0044 400.0 UA319 0005 400.0
Level, record, and date other than requested. Must be reviewed.
SKED
This spreadsheet was delivered as SKEC/SKED, with combined data. Must be reviewed.
- Ecuador
No spreadsheet was received from the SEGU FIR.
- Guyana
One spreadsheet was received from the SYGC FIR. The model follows:
SYGC
03/07/09 UAL843 B763 KORD SBGR MINDA 8:55 330 UA324/UA312 KOXAM 9:29 330
Issued after the deadline. Record other than requested. Requires little revision.
- French Guiana
No spreadsheet was sent from the SOOO FIR.

5-4 Report on Agenda Item 5 GTE/13
- Haiti
One spreadsheet was received from the MTEG FIR. The model follows:
MTEG
01/12/12 INC907 MD82 TNCB KMIA PIGBI 16:57 320 A315 JOSES 17:19 320 Record other than requested. Requires little revision.
- Jamaica
No spreadsheet was sent from the MKJK FIR.
- Panama One spreadsheet was received from the MPZL FIR. The model follows:
MPZL
12/01/12 AAL2142 N698AN B752 SPIM KMIA BUXOS 15:58 360 UL780 ARNAL 17:52 360 Issued after the deadline.
- Paraguay
One spreadsheet was received from the SGFA FIR. The model follows:
SGFA
12/01/12 LAN704 A343 SCEL LEMD 1:30 310 UR554 VAS UM403 1:53 Record other than requested. Requires little revision.
- Peru
One spreadsheet was received from the SPIM FIR. The model follows:
SPIM
01.12.12
CMP175
B738
MPTO
SCEL
VAKUD
01:25
350
UL780
SORTA
03:13
370
TRU
01:52
370
Record and date other than requested. Requires little revision.
- Dominican Republic No spreadsheet was submitted from the MDCS FIR.
- Suriname
No spreadsheet was submitted for the SMPM FIR.
- Trinidad and Tobago
One spreadsheet was received from the TTZP FIR. The model follows:
TTZP
01:12:12 AJT855 N741AX B762 KMIA TTPP ANADA 0:03 370 UG449 PERGA 0:34 290 Issued after the deadline. Requires little revision.
- Uruguay
One spreadsheet was received from the SUEO FIR. The model follows:

GTE/13 Report on Agenda Item 5 5-5
SUEO
12/01/12 DLH510 B744 EDDF SAEZ ELAMO 10:23 380 UL324 ENSAS 10:39 340 Record other than requested. Requires little revision.
- Venezuela
No spreadsheet was submitted for the SVZM FIR.
5.4 The Meeting concluded that the effort involved (approximately one month) in cleaning
the aircraft movement data sent to CARSAMMA by our flight information regions (FIRs) could be
avoided if the procedures described in the instructions for completing the CARSAMMA F0 form were
followed.
5.5 Concern was expressed for the absence of data collection in some FIRs, since the
quantitative safety assessment (CRM) would not be complete if an FIR failed to send its aircraft
movement data.
5.6 Based on the above, the Meeting considered that States should be requested to properly
follow the procedures for completing the air traffic data collection templates in their respective FIRs, and
to submit such data to CARSAMMA in a timely fashion.
Activities carried out by Colombia
5.7 Colombia made a presentation of the activities it is carrying out with respect to the
dissemination and sensitisation of the importance of reporting LHDs, which appears in GTE/13-IP/4
posted on the website of the Meeting.
Activities carried out by Cuba
5.8 The Meeting took note of the measures implemented by Cuba to mitigate the occurrence
of LHD events.
5.9 During the research of events in the Havana FIR, PABEL and SELEK positions were
identified as those with the largest number of LHDs. The statistical information on operations and ATS
capacity reflected that the demand in Giron sector required of an increased capacity during traffic peak
schedules, thus bringing difficulties for coordination with CENAMER ACC.
5.10 In such sense, technical conditions were created and measures were adopted immediately
to implement an additional ATCO, as well as communication facilities on increased traffic. Moreover,
ACC Havana controllers were instructed on LHD events and the ATC simulator training plan was duly
revised and adapted in order to mitigate effects of this gap in the system.
5.11 The Automatic Data Exchange (ADE) with ARTCC Miami, which had been previously
implemented, released Giron sector assistant of a large workload, avoiding undertaking an average of 230
daily estimates coordination to and from ARTCC Miami. This allows having more time for other
activities and coordination with dependencies without automated systems implemented. In a third phase,
it is expected to implement ADE system with the remaining ACC and use for the coordination with
ARTCC Miami, revised FL and ETO automated messages. The results are the following:

5-6 Report on Agenda Item 5 GTE/13
2012: Until July 21 LHD events were recorded.
2013: Until July 7 LHD events were recorded.
Practical training in CARSAMMA
5.12 Taking into account that its new facilities have more space for conducting its work,
CARSAMMA has offered CAR/SAM States the possibility of providing 90-day training in its facilities to
1 expert from each region. This training would have no cost. Travel and lodging expenses of these
experts would be covered by the State. Coordination would be through the ICAO Regional Offices.
Administrative issues
5.13 The Meeting was informed that Mr. Johan Estrada, rapporteur of the GREPECAS
Scrutiny Group, had taken on new commitments in the management of major projects in his States and
therefore could not continue discharging his duties as rapporteur of the GTE.
5.14 In this regard, the Meeting regretted his resignation, since Mr. Johan Estrada had done an
extraordinary job as rapporteur of the Scrutiny Group and his extensive experience had facilitated the
work of this Group. Accordingly, it expressed its unanimous recognition.
5.15 Furthermore, the Meeting deemed it advisable to give continuity to the task and
unanimously elected Mr. Julio Alexis Lewis, of the Dominican Republic, as new rapporteur of the
Scrutiny Group, who would be supported by Mr. Estrada as required.