GSSI UtilityScan HS Quick Start Guide - GSSI Inc. | …. New Project Mode and Last Project Mode ......
56
Copyright © 2013-2015 Geophysical Survey Systems, Inc. MN28-559 Rev A All Rights Reserved UtilityScan® HS Quick Start Guide Section 1: Getting Started............................................................................................................ 1 Section 2: 2D Data Collection and Playback .......................................................................... 7 New Project Mode and Last Project Mode .................................................................................................... 7 Configuring the Main Menu Options (Right Pane of the Screen) ........................................................ 9 Collecting 2D Data ............................................................................................................................................... 19 2D Data Playback Mode .................................................................................................................................... 23 Section 3: 3D Data Collection and Playback ................................................................................................ 27 Setting up 3D Collection .................................................................................................................................... 28 Collecting 3D Data ............................................................................................................................................... 30 Options during 3D Data Collection................................................................................................................ 32 Playback 3D Data ................................................................................................................................................. 36 Main Menu Options (Right Pane of the Screen) ........................................................................................ 37 Sub Menu Options (Bottom Pane of the Setup Screen) ......................................................................... 39 Playback File(s) Options ..................................................................................................................................... 40 Appendix A: Dielectrics of Common Materials (Soil Conditions) ......................................................... 42 Appendix B: Examples of Some Common Objects ................................................................................... 43 Appendix C: Glossary of Terms ........................................................................................................................ 48 Appendix D: Connect and Configure GPS.................................................................................................... 52
Transcript of GSSI UtilityScan HS Quick Start Guide - GSSI Inc. | …. New Project Mode and Last Project Mode ......

Copyright © 2013-2015 Geophysical Survey Systems, Inc. MN28-559 Rev A All Rights Reserved
UtilityScan® HS Quick Start Guide
Section 1: Getting Started............................................................................................................ 1 Section 2: 2D Data Collection and Playback .......................................................................... 7
New Project Mode and Last Project Mode .................................................................................................... 7 Configuring the Main Menu Options (Right Pane of the Screen) ........................................................ 9 Collecting 2D Data ............................................................................................................................................... 19 2D Data Playback Mode .................................................................................................................................... 23
Section 3: 3D Data Collection and Playback ................................................................................................ 27 Setting up 3D Collection .................................................................................................................................... 28 Collecting 3D Data ............................................................................................................................................... 30 Options during 3D Data Collection ................................................................................................................ 32
Playback 3D Data ................................................................................................................................................. 36 Main Menu Options (Right Pane of the Screen) ........................................................................................ 37 Sub Menu Options (Bottom Pane of the Setup Screen) ......................................................................... 39 Playback File(s) Options ..................................................................................................................................... 40
Appendix A: Dielectrics of Common Materials (Soil Conditions) ......................................................... 42 Appendix B: Examples of Some Common Objects ................................................................................... 43 Appendix C: Glossary of Terms ........................................................................................................................ 48 Appendix D: Connect and Configure GPS .................................................................................................... 52

Limited Warranty, Limitations Of Liability And Restrictions Geophysical Survey Systems, Inc. hereinafter referred to as GSSI, warrants that for a period of 24 months from the delivery date to the original purchaser this product will be free from defects in materials and workmanship. EXCEPT FOR THE FOREGOING LIMITED WARRANTY, GSSI DISCLAIMS ALL WARRANTIES, EXPRESS OR IMPLIED, INCLUDING ANY WARRANTY OF MERCHANTABILITY OR FITNESS FOR A PARTICULAR PURPOSE. GSSI's obligation is limited to repairing or replacing parts or equipment which are returned to GSSI, transportation and insurance pre-paid, without alteration or further damage, and which in GSSI's judgment, were defective or became defective during normal use. GSSI ASSUMES NO LIABILITY FOR ANY DIRECT, INDIRECT, SPECIAL, INCIDENTAL OR CONSEQUENTIAL DAMAGES OR INJURIES CAUSED BY PROPER OR IMPROPER OPERATION OF ITS EQUIPMENT, WHETHER OR NOT DEFECTIVE. Before returning any equipment to GSSI, a Return Material Authorization (RMA) number must be obtained. Please call the GSSI Customer Service Manager who will assign an RMA number. Be sure to have the serial number of the unit available
Regulatory Information Please see the GSSI Manual CD or our website, www.geophysical.com/regulatoryinformation.htm, for current information and FCC Registration Form, including:
• FCC Notice for U.S. Customer • Canadian Requirements for RSS-220 • Declaration of CE Conformance
Quick Start Guide UtilityScan® HS
Copyright © 2016 Geophysical Survey Systems, Inc. All Rights Reserved
UtilityScan® HS
2
1
3
4 5
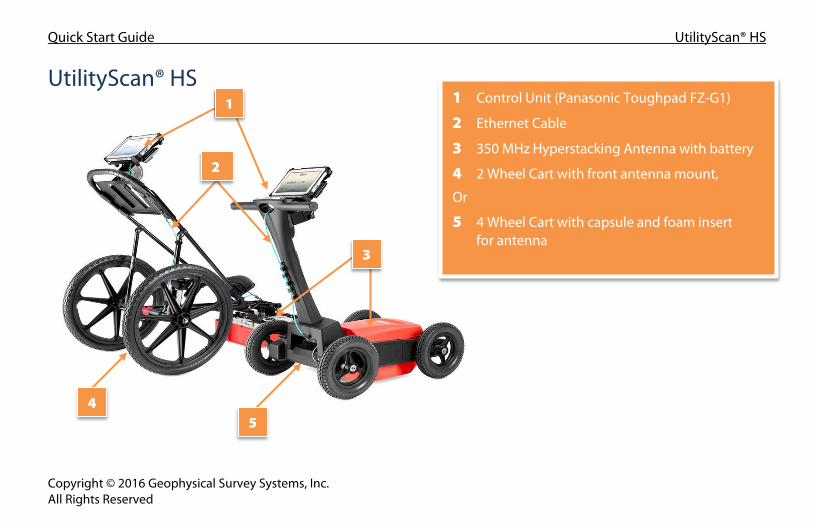
1 Control Unit (Panasonic Toughpad FZ-G1)
2 Ethernet Cable
3 350 MHz Hyperstacking Antenna with battery
4 2 Wheel Cart with front antenna mount,
Or
5 4 Wheel Cart with capsule and foam insert for antenna

Quick Start Guide UtilityScan® HS
Copyright © 2016 Geophysical Survey Systems, Inc. 1 All Rights Reserved
Section 1: Getting Started Thank you for purchasing a UtilityScan HS from GSSI! The UtilityScan HS incorporates GSSI’s 350 MHz digital HyperStacking antenna which has vastly improved performance over traditional mid-frequency antenna. You’ll image deeper and clearer with this new technology. You can also take advantage of GSSI’s world-renowned versatility and use our excellent 300/800 MHz Dual Frequency antenna with the same control tablet and cart. GSSI application support and training services are also at your disposal. Simply call (603) 893-1109 or email [email protected] with questions. We’d love to hear from you!
Keyboard and Snipping Capability The Panasonic FZ-G1 Toughpad® is designed to be used as a touch screen. You may use your fingers to tap on an icon or menu option, or you may use the attached stylus pen. Snipping Tool: Press the A2 button once to open the Windows® Snipping Tool. Keyboard: There is keyboard capability on the Toughpad. To access the keyboard press and hold the A2 button until the keyboard appear. You may exit the keyboard by tapping on the “X” located on the upper right hand corner of the keyboard.
Quick Start Guide UtilityScan® HS
Copyright © 2016 Geophysical Survey Systems, Inc. 2 All Rights Reserved
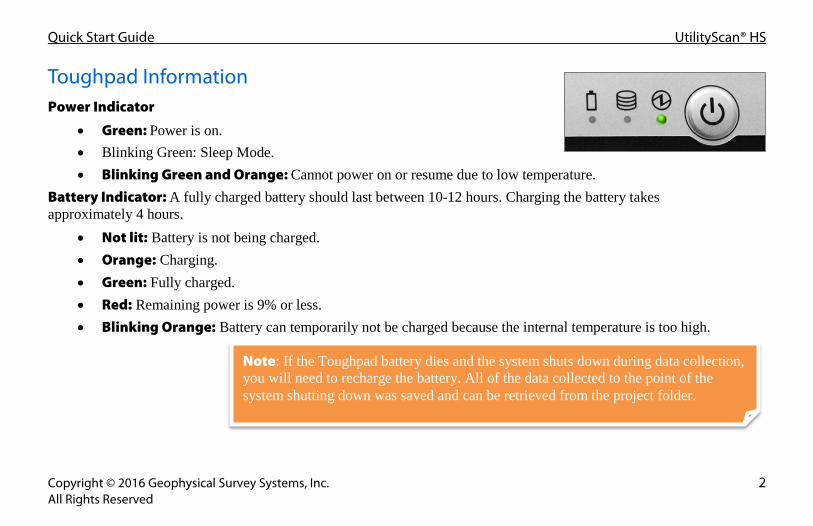
Toughpad Information Power Indicator
• Green: Power is on. • Blinking Green: Sleep Mode. • Blinking Green and Orange: Cannot power on or resume due to low temperature.
Battery Indicator: A fully charged battery should last between 10-12 hours. Charging the battery takes approximately 4 hours.
• Not lit: Battery is not being charged. • Orange: Charging. • Green: Fully charged. • Red: Remaining power is 9% or less. • Blinking Orange: Battery can temporarily not be charged because the internal temperature is too high.
Note: If the Toughpad battery dies and the system shuts down during data collection, you will need to recharge the battery. All of the data collected to the point of the system shutting down was saved and can be retrieved from the project folder.
Quick Start Guide UtilityScan® HS
Copyright © 2016 Geophysical Survey Systems, Inc. 3 All Rights Reserved
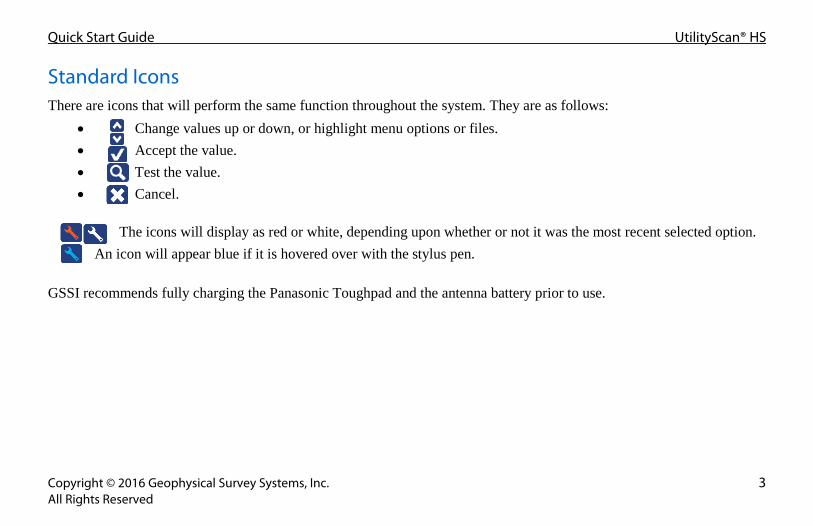
Standard Icons There are icons that will perform the same function throughout the system. They are as follows:
• Change values up or down, or highlight menu options or files. • Accept the value. • Test the value. • Cancel.
The icons will display as red or white, depending upon whether or not it was the most recent selected option.
An icon will appear blue if it is hovered over with the stylus pen. GSSI recommends fully charging the Panasonic Toughpad and the antenna battery prior to use.
Quick Start Guide UtilityScan® HS
Copyright © 2016 Geophysical Survey Systems, Inc. 4 All Rights Reserved
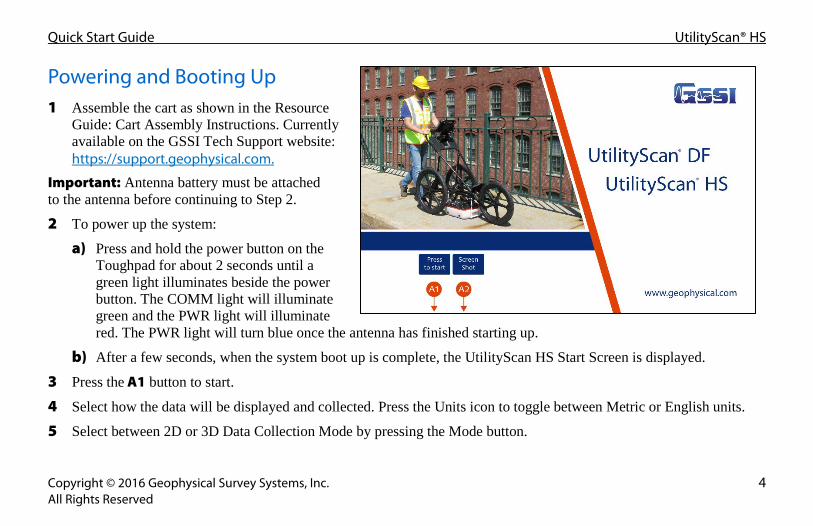
Powering and Booting Up 1 Assemble the cart as shown in the Resource
Guide: Cart Assembly Instructions. Currently available on the GSSI Tech Support website: https://support.geophysical.com.
Important: Antenna battery must be attached to the antenna before continuing to Step 2.
2 To power up the system:
a) Press and hold the power button on the Toughpad for about 2 seconds until a green light illuminates beside the power button. The COMM light will illuminate green and the PWR light will illuminate red. The PWR light will turn blue once the antenna has finished starting up.
b) After a few seconds, when the system boot up is complete, the UtilityScan HS Start Screen is displayed.
3 Press the A1 button to start.
4 Select how the data will be displayed and collected. Press the Units icon to toggle between Metric or English units.
5 Select between 2D or 3D Data Collection Mode by pressing the Mode button.
Quick Start Guide UtilityScan® HS
Copyright © 2016 Geophysical Survey Systems, Inc. 5 All Rights Reserved
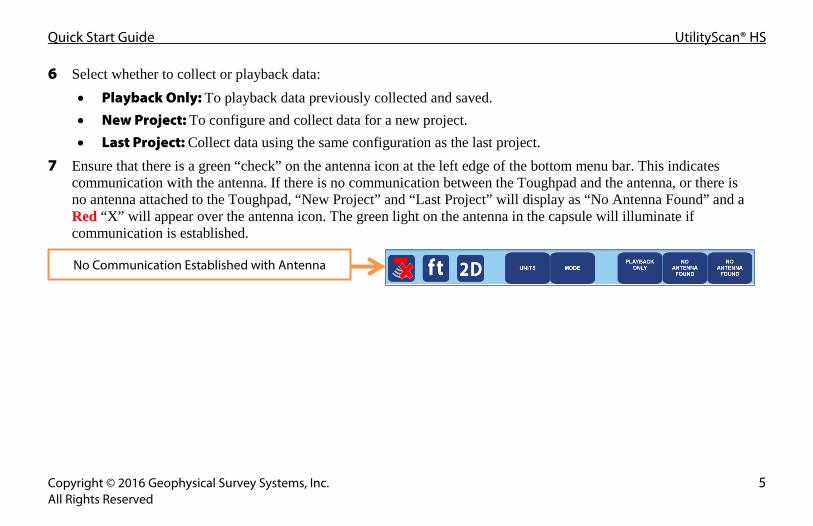
6 Select whether to collect or playback data: • Playback Only: To playback data previously collected and saved. • New Project: To configure and collect data for a new project. • Last Project: Collect data using the same configuration as the last project.
7 Ensure that there is a green “check” on the antenna icon at the left edge of the bottom menu bar. This indicates communication with the antenna. If there is no communication between the Toughpad and the antenna, or there is no antenna attached to the Toughpad, “New Project” and “Last Project” will display as “No Antenna Found” and a Red “X” will appear over the antenna icon. The green light on the antenna in the capsule will illuminate if communication is established.
No Communication Established with Antenna
Quick Start Guide UtilityScan® HS
Copyright © 2016 Geophysical Survey Systems, Inc. 6 All Rights Reserved
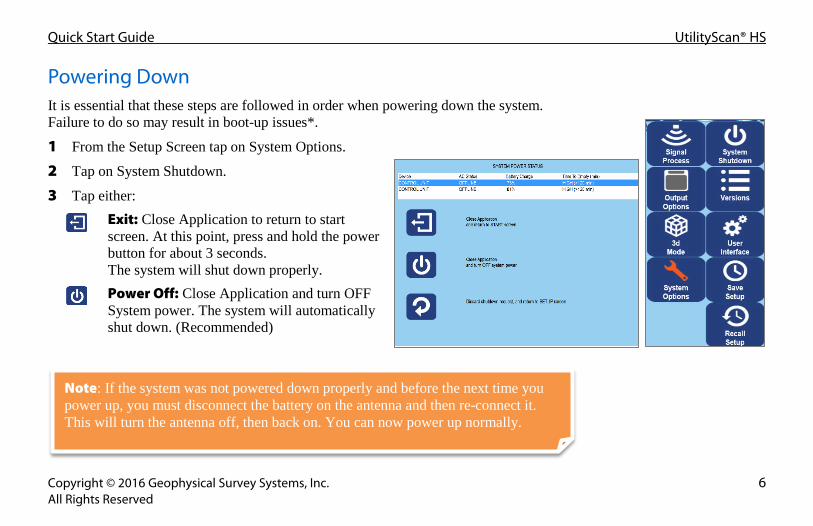
Powering Down It is essential that these steps are followed in order when powering down the system. Failure to do so may result in boot-up issues*.
1 From the Setup Screen tap on System Options.
2 Tap on System Shutdown.
3 Tap either: Exit: Close Application to return to start screen. At this point, press and hold the power button for about 3 seconds. The system will shut down properly. Power Off: Close Application and turn OFF System power. The system will automatically shut down. (Recommended)
Note: If the system was not powered down properly and before the next time you power up, you must disconnect the battery on the antenna and then re-connect it. This will turn the antenna off, then back on. You can now power up normally.

Quick Start Guide UtilityScan® HS
Copyright © 2016 Geophysical Survey Systems, Inc. 7 All Rights Reserved
Section 2: 2D Data Collection and Playback New Project Mode and Last Project Mode New Project Mode: Configure the system as desired. This opens the Change Data Path screen and allows for the selection or creation of a project folder. After selecting New Project, select which folder you would like to save your data to, or create a new folder for a new project. 1 Tap on the arrows and select a folder (project). All files will be saved to
this folder and the name of the files will be folder name + a sequential number. Tap on Accept to continue.
2 Tap on New Data Path to create a new folder (project). • Enter and save the new folder (project) name. • Highlight the new folder (project) by tapping on the arrows. • Tap on Accept to continue.
3 Tap on Cancel. The files will be saved to the last folder that was used.
Last Project Mode: Bypass the Change Data Path screen and continue with the last project and all of its settings. In either mode, the Setup options are the same. The following screen is displayed once a folder is created or Last Project Mode is selected:

Quick Start Guide UtilityScan® HS
Copyright © 2016 Geophysical Survey Systems, Inc. 8 All Rights Reserved
The Screen is divided into three sections: Data View (Linescan and O-Scope), Main Menu located at the right pane of the screen, and the Sub-Menu located at the bottom of the screen. Status screen located at the lower left corner of the screen.
• GPS Status: Indicates if the Utilityscan HS detects a signal from the GPS receiver and the quality of that signal. • Disk Space Used (storage space) The percentage shown is
the used space, not the available space. • Battery Power remaining for the antenna. • Battery Power remaining for the Toughpad

Quick Start Guide UtilityScan® HS
Copyright © 2016 Geophysical Survey Systems, Inc. 9 All Rights Reserved
Configuring the Main Menu Options (Right Pane of the Screen) Signal Process Menu
Scan
• Depth Range: Choose an investigation depth. The accuracy of this is based on assuming a correct dielectric.
• Dielectric Constant: Enter the Dielectric of the soil if known (See Appendix C for more Dielectric information).
• Soil Type: Choose a basic soil type from a menu of preset types. Each of these has an associated dielectric value. • Scan Density: Possible choices are: Normal (18/ft or 50/m) and High (36/ft or 100/m). • Autosave: The system will automatically save each file if this is turned on. When off, the system will prompt you to
save/discard.

Quick Start Guide UtilityScan® HS
Copyright © 2016 Geophysical Survey Systems, Inc. 10 All Rights Reserved
Gain Settings
• Gain Mode • Auto: Allows the system to adjust the Gain Curve (red line seen in the
O-Scope view) automatically based on the quality of the GPR signal. • Manual: Allows you to adjust the Gain Curve.
• Number of Points • Number of Gain Points or “Individual Sections” to adjust the Gain Curve. • Ranges for 1 point to 8 points.
• GP 1-8 (dB) • If Manual Gain Mode is selection, adjust each Gain Point accordingly. • Values range from -42 to 126.
Note: Tap on the double arrows (up or down) to display the appropriate gain points.

Quick Start Guide UtilityScan® HS
Copyright © 2016 Geophysical Survey Systems, Inc. 11 All Rights Reserved
Filters (See Appendix C for more information) • Stacking (scans): To reduce random or high frequency noise (static or fuzz) in your data. This value should be set
low (3-5). The system will average together that number of scans and output the average value. • Background Removal (scans): Remove horizontal banding in your data. This value should be set very high. The
system will remove flat bands in the data of that many scans or higher. • Signal Floor: Shows a visual indicator of noise levels. The shaded green area indicates an area of degraded signal in
which some target types (weak reflectors) may not be readily visible.
• Migration: Allows the computer to estimate a dielectric constant by examining the shape of the hyperbolas. • Hilbert Transformation: Change all migrated targets from having a negative and positive polarity to just positive
polarity. Good for giving an idea of the strength of the reflection.
Horizontal Banding Example Signal Floor Example

Quick Start Guide UtilityScan® HS
Copyright © 2016 Geophysical Survey Systems, Inc. 12 All Rights Reserved
LineTrac (Optional Accessory) LineTrac employs a three-axis 50/60 Hz magnetometer that is used to locate powered and non-powered utilities. LineTrac can be run in two ways:
• Power Mode: This sensor detection the electromagnetic field generated by flowing AC current. You will need to set LineTrac to detect either 50 Hz or 60 Hz. Note that Power mode will only detect flowing current, so make sure that the device attached to the line you are tracking is switched on and drawing current. The Power mode signal will be displayed in blue. The peak of the curve indicates the utility’s position.
• Frequency Mode: This mode detects a lines with a given radio frequency signal “piggybacked” on them. It is designed to work with common, widely available transmitters (not included). Clip the transmitter to the metallic utility, the utility’s tracer wire, or non-contact induce the signal as you would with a standard line locator. Select the matching frequency from the LineTrace menu. The Frequency mode will be displayed in yellow. The detected target’s position will be in the valley between the two peaks (see images on the following page).
Note that the LineTrac sensor is positioned slightly forward of the GPR antenna’s center position so the target’s signal in LineTrac will be slightly offset with the GPR’s detected location.

Quick Start Guide UtilityScan® HS
Copyright © 2016 Geophysical Survey Systems, Inc. 13 All Rights Reserved
Power Mode: Frequency Mode
Data illustrates two power lines entering a large Data illustrates a small electrical conduit buried among commercial building. multiple tree roots. Crosshairs indicates conduit position

Quick Start Guide UtilityScan® HS
Copyright © 2016 Geophysical Survey Systems, Inc. 14 All Rights Reserved
Maintenance
• Calibrate Survey Wheel (SW): Selecting this option will bring up the survey wheel calibration window. GSSI recommend calibrating the survey wheel before performing a survey.
1 Select calibration distance using the up/down arrow buttons.
2 Position Antenna on the Start Mark.
3 Click START button
4 Move Antenna to Stop Mark. Take care to ensure that the portion of the antenna which began at the start mark is the same portion which ends at the stop mark. Press the Stop button.
5 You will see the new calibration value displayed at the bottom of the screen. It will be negative for the 3-wheeled cart and positive for the 4-wheeled cart. Tap on Accept.
• Configure GPS: Select this option to configure this system with your GPS. See Appendix D for GPS configuration instructions.
• Set Time: Select this option to set the system Date and Time.
Output Options Menu Display:
• Color Table: Select from one of ten available color schemes. • Color Stretch: This feature changes the distribution of the color values along the amplitude scale, yet still preserves
the color of zero amplitude in the middle of the color bar. Positive values are good for accentuating weaker targets while negative values will accentuate strong targets.
Quick Start Guide UtilityScan® HS
Copyright © 2016 Geophysical Survey Systems, Inc. 15 All Rights Reserved
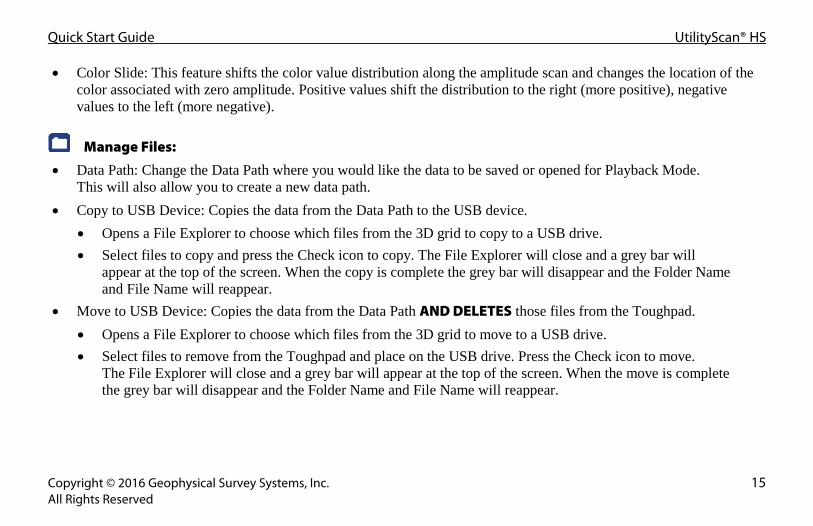
• Color Slide: This feature shifts the color value distribution along the amplitude scan and changes the location of the color associated with zero amplitude. Positive values shift the distribution to the right (more positive), negative values to the left (more negative).
Manage Files:
• Data Path: Change the Data Path where you would like the data to be saved or opened for Playback Mode. This will also allow you to create a new data path.
• Copy to USB Device: Copies the data from the Data Path to the USB device. • Opens a File Explorer to choose which files from the 3D grid to copy to a USB drive. • Select files to copy and press the Check icon to copy. The File Explorer will close and a grey bar will
appear at the top of the screen. When the copy is complete the grey bar will disappear and the Folder Name and File Name will reappear.
• Move to USB Device: Copies the data from the Data Path AND DELETES those files from the Toughpad. • Opens a File Explorer to choose which files from the 3D grid to move to a USB drive. • Select files to remove from the Toughpad and place on the USB drive. Press the Check icon to move.
The File Explorer will close and a grey bar will appear at the top of the screen. When the move is complete the grey bar will disappear and the Folder Name and File Name will reappear.

Quick Start Guide UtilityScan® HS
Copyright © 2016 Geophysical Survey Systems, Inc. 16 All Rights Reserved
• Delete Files: Delete files from the ToughPad. • Opens a File Explorer to choose which files to delete from the Toughpad. • Select files to remove from the Toughpad and press the Check icon. The
File Explorer will close and a grey bar will appear at the top of the screen. When finished deleting the files the grey bar will disappear and the Folder Name and File Name will reappear.
• Once a file is deleted from the grid folder it can no longer be sliced.
Units/Scale:
• Depth Scale • Depth: Display the vertical scale in distance units. • Time: Display the vertical scale in time units.
• Depth Units: Select the unit of measurement for Depth or the vertical scale. • H-Scale Density: Select whether to display the horizontal scale during data collection with either Low, Medium,
or High density of minor ticks.
System Options Menu System Shut Down
• Exit: Close Application and Return to Start Screen. • Power Off: Close Application and Shut Down the System (power off). This will power off the antenna as well.
Note: Choose Select All Files to ensure that all files in the 3D grid are copied, moved, or deleted.

Quick Start Guide UtilityScan® HS
Copyright © 2016 Geophysical Survey Systems, Inc. 17 All Rights Reserved
• Return to Application: Discard Shutdown Request and Return to Setup Screen. Versions: Displays Version information for the software and firmware. User Interface
• Language: Set Language. • Button Design: Label, Symbol, or Combo • Brightness Up or Down: Set contrast up or down.
Save/Recall Setup: Allows you to save specific settings and recall them later.

Quick Start Guide UtilityScan® HS
Copyright © 2016 Geophysical Survey Systems, Inc. 18 All Rights Reserved
Sub Menu Options (Bottom Pane of the Screen) Stop/Preview Scan: This will turn the antenna off and on. When on, test data will continuously scroll across the screen.
Reset Gain: Reset the display gain for optimal viewing. Start Scan: Begin to collect data. Playback Mode: This will take you to playback mode if you wish to view saved data. File Info: Information about the file. This is also called the File Header. File names can be changed here as well. All file will have a sequential number added to the end of the name.
File Information Window

Quick Start Guide UtilityScan® HS
Copyright © 2016 Geophysical Survey Systems, Inc. 19 All Rights Reserved
Collecting 2D Data 1 Begin data collection by pressing Start Scan and moving the cart forward. Data gets collected only when
the cart is moving forward.
2 Data will fill the screen from left to right and begin scrolling.
3 After a feature is visible on the screen, pull the system straight back along your survey line. A vertical line (the backup cursor) will appear on the screen that corresponds with the center of the antenna. When the vertical line is over the top of a feature, the center of the antenna is also over the feature.
4 Using the two marks on the side of the cart or the antenna as reference points, mark the ground at each side of your cart. Then move the cart out of the way and place an “X” between the two marks.
5 After backing up new data will not be collected until the cart is moved pass the spot where you began to reverse.
Hyperbola which represents a target
Vertical Line (Backup Cursor)

Quick Start Guide UtilityScan® HS
Copyright © 2016 Geophysical Survey Systems, Inc. 20 All Rights Reserved
While the cart is moving forward and adding new data, the bottom menu bar will appear as:
• Stop: Stops collecting the current file • Mark: Adds a user mark (vertical, dashed line) at the current location • Gain Up/Down: Changes the display gain (screen contrast).
Set Depth, Focus Data, and Add Target Enter a known depth or perform a velocity test on the data to estimate a dielectric value and get more accurate depth estimates. Also, add a color coded icon to a hyperbola to identify a known target. The icons for Set Depth, Focus On, and Add Target appear at the bottom when the system is backed up.
Set Depth: Can be used with Migration turned on or off from the Scan Process – Filters Menu.
1 Using the stylus pen, place the horizontal line at the top of a feature at a known depth.
2 Tap Set Depth.
3 Input the correct depth and accept. This will change the dielectric value and update the vertical scale.

Quick Start Guide UtilityScan® HS
Copyright © 2016 Geophysical Survey Systems, Inc. 21 All Rights Reserved
Focus On: Only available when Migration is turned off. 1 Using the stylus pen, place the cross-hair on a hyperbola.
2 Tap Focus On. A vertical slider will appear to the right of the data.
3 Using the stylus pen and the vertical slider, match the Focus On hyperbola with a hyperbola on the screen.
4 Select either Set Focus or Focus Off: Set Focus to accept the hyperbola. This will change the dielectric value. Focus Off to cancel this process.
Add Target: Only available when both horizontal and vertical cursors are visible. 1 Using the stylus pen, place the cross-hair on a hyperbola.
2 Tap Add Target. A vertical color tablet will appear.
3 Select the desired color that matches the known or potential use of the target

Quick Start Guide UtilityScan® HS
Copyright © 2016 Geophysical Survey Systems, Inc. 22 All Rights Reserved
Migration & Hilbert Transform (Focus) Use Migration during Collect or Playback Mode to estimate a dielectric value. When Migration is turned on two sliders appear on the right and top of the screen and a Migration window is placed over the data. Turning on Hilbert Transform will change the migrated data so that all of the reflections have a positive polarity and may be easier to identify. Migration can still be performed without turning Hilbert Transform on. 1 Turn Migration or Hilbert Transform On from the Scan Process –
Filters Menu.
2 Start Scan to begin collecting data.
3 Once hyperbolic reflections appear on the screen, pull the system straight back along your survey line.
4 When the system is backed up two sliders appear on the screen. • Move the top slider to the left or right to change where real time migration window appears on the screen. • Move the right cursor up or down to adjust the dielectric value.
5 Begin pushing the system forward again to collect data with the new dielectric value and migration view.
Sliders Migrated Hyperbola
Migration and Hilbert Transform turned on (left side of image)

Quick Start Guide UtilityScan® HS
Copyright © 2016 Geophysical Survey Systems, Inc. 23 All Rights Reserved
2D Data Playback Mode You can access the Playback Mode by selecting Playback from the bottom menu bar or selecting Playback Only from the intro screen. The Playback Only Mode allows you to view and edit data previously collected and saved. The antenna does not need to be connected to run this mode. After selecting Playback Only, choose which file to review.
• Tap on the arrows and select a file or files. • Tap on Accept to continue to the Playback Setup
screen. During playback you can perform all of the following functions:
• Pause, move Backward, move Forward, select Next File (if multiple files were originally selected), or Stop Playback.
• Add vertical User Marks. • Set Depth or turn Focus On to estimate the dielectric
value. • Adjust Display Gain. • Select Active Channel or which frequency to display.

Quick Start Guide UtilityScan® HS
Copyright © 2016 Geophysical Survey Systems, Inc. 24 All Rights Reserved
Sub Menu Options (Bottom Pane of the Setup Screen) Preview File/Stop: Preview file. This will toggle between Preview File and Stop. Reset Gain: Reset the display gain for optimal viewing. Select File: Select another file to playback. Playback File(s): Displays the data in whichever display is currently selected (High, Low, Split, or Blend). See next section for options during Playback. Collect Mode: This will take you to collect mode if you wish to collect data. File Info: Information about the file.
Quick Start Guide UtilityScan® HS
Copyright © 2016 Geophysical Survey Systems, Inc. 25 All Rights Reserved
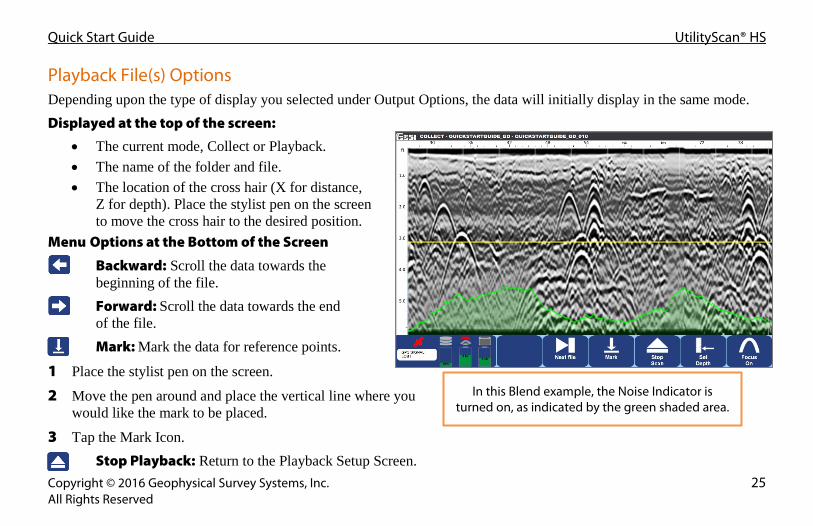
Playback File(s) Options Depending upon the type of display you selected under Output Options, the data will initially display in the same mode. Displayed at the top of the screen:
• The current mode, Collect or Playback. • The name of the folder and file. • The location of the cross hair (X for distance,
Z for depth). Place the stylist pen on the screen to move the cross hair to the desired position.
Menu Options at the Bottom of the Screen
Backward: Scroll the data towards the beginning of the file. Forward: Scroll the data towards the end of the file. Mark: Mark the data for reference points.
1 Place the stylist pen on the screen.
2 Move the pen around and place the vertical line where you would like the mark to be placed.
3 Tap the Mark Icon. Stop Playback: Return to the Playback Setup Screen.
In this Blend example, the Noise Indicator is turned on, as indicated by the green shaded area.

Quick Start Guide UtilityScan® HS
Copyright © 2016 Geophysical Survey Systems, Inc. 26 All Rights Reserved
Set Depth: Input a known depth to the data. This will update the dielectric value accordingly. 1 Place the stylist pen on the screen.
2 Move the pen around and place the horizontal line at the known depth.
3 Tap the Set Depth Icon.
4 Enter and accept the known depth. Focus On: Turns on Focus Mode to adjust the Dielectric Constant and get more accurate depth estimates. Pause: Pauses playback. Next File: If multiple files were selected for playback this will advance through them in sequence. Gain Up/Down: Adjusts the Display Gain.

Quick Start Guide UtilityScan® HS
Copyright © 2016 Geophysical Survey Systems, Inc. 27 All Rights Reserved
Section 3: 3D Data Collection and Playback Select 3D Mode from the Introduction Screen. You can do this by clicking the Mode button. New Project Mode will allow you to configure the system as desired for a new project or continue with an old project. Last Project Mode will bypass the Folder selection screen and continue with the last project with all its settings from the last project. In this mode, you still can make changes to the settings. In either mode, the options are the same. After selecting New Project, select which folder you would like to save your data to, or create a new folder for a new project.

Quick Start Guide UtilityScan® HS
Copyright © 2016 Geophysical Survey Systems, Inc. 28 All Rights Reserved
Setting up 3D Collection Signal Process, Output Options, and System Options Go through the regular steps for 2D data collection as described in the previous section. 3D Mode - Config Grid Begin by configuring the size of the grid and separation of transects. X – Start: Grid coordinate where data collection will begin in the X-Axis. X – End: Grid coordinate where data collection will end in the X-Axis. Y – Start: Grid coordinate where data collection will begin in the Y-Axis. Y – End: Grid coordinate where data collection will end in the Y-Axis. X – Line Spacing: Separation between transects collected in the X – Direction. Y – Line Spacing: Separation between transects collected in the Y – Direction. Collection Method (Bottom Pane) Toggle between Normal and Zig-Zag data collection for the X – and Y – Directions.

Quick Start Guide UtilityScan® HS
Copyright © 2016 Geophysical Survey Systems, Inc. 29 All Rights Reserved

Quick Start Guide UtilityScan® HS
Copyright © 2016 Geophysical Survey Systems, Inc. 30 All Rights Reserved
Collecting 3D Data 1 Once finished setting up the 3D grid press
Start Scan. This opens the 3D collection screen.
2 Ensure that the cart is located so that the center of the antenna is over the starting corner and headed in the direction of the yellow arrow shown on the 3D collection screen. • The center of the antenna corresponds
with the raised marks on the sides of the 4-wheeled cart or the location of the control cable connector on the 3-wheeled cart.
3 By default the system starts in the X – Direction when collecting data in both the X – and Y – Directions.
4 With the cart in position Press the Run button.
5 Move the cart forward to the other end of the grid. The bottom pane will change offering different options.

Quick Start Guide UtilityScan® HS
Copyright © 2016 Geophysical Survey Systems, Inc. 31 All Rights Reserved
6 When the cart travels the distance of the line specified during setup collection will automatically end.
7 Position the cart at the start of the next line. Press the Run button and move the cart to the end of the line where it will again end data collection automatically.
8 Continue Steps 3-5 until you’ve finished collecting in the first direction.
9 If collecting in two directions then position the cart back at the starting corner and pointed up the Y-Axis. Repeat Steps 4-7.
10 Once finished collecting both directions of data press 3D Playback Mode. This will process the current data and return to the Playback Setup Screen.
Quick Start Guide UtilityScan® HS
Copyright © 2016 Geophysical Survey Systems, Inc. 32 All Rights Reserved
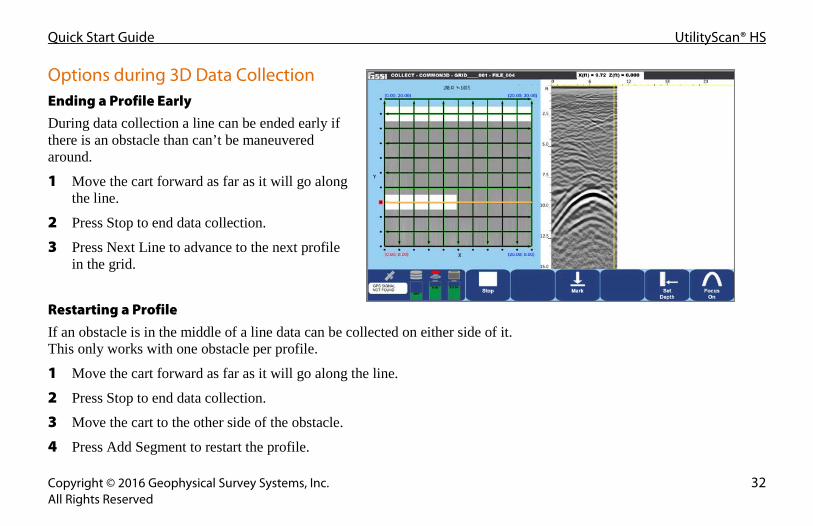
Options during 3D Data Collection Ending a Profile Early During data collection a line can be ended early if there is an obstacle than can’t be maneuvered around.
1 Move the cart forward as far as it will go along the line.
2 Press Stop to end data collection.
3 Press Next Line to advance to the next profile in the grid.
Restarting a Profile If an obstacle is in the middle of a line data can be collected on either side of it. This only works with one obstacle per profile.
1 Move the cart forward as far as it will go along the line.
2 Press Stop to end data collection.
3 Move the cart to the other side of the obstacle.
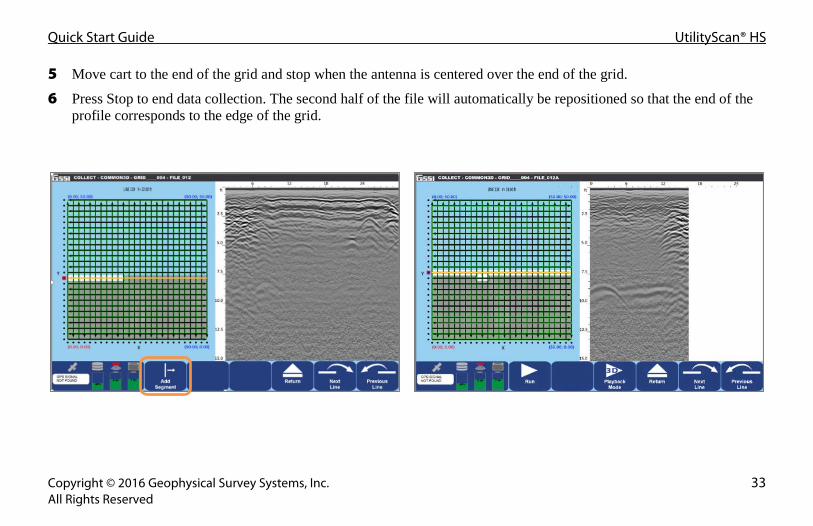
4 Press Add Segment to restart the profile.
Quick Start Guide UtilityScan® HS
Copyright © 2016 Geophysical Survey Systems, Inc. 33 All Rights Reserved
5 Move cart to the end of the grid and stop when the antenna is centered over the end of the grid.
6 Press Stop to end data collection. The second half of the file will automatically be repositioned so that the end of the profile corresponds to the edge of the grid.

Quick Start Guide UtilityScan® HS
Copyright © 2016 Geophysical Survey Systems, Inc. 34 All Rights Reserved
Skipping a Profile(s) An entire profile, or profiles, can be skipped during data collection by pressing Next Line once or repeatedly. Adding a User Mark A User Mark can be added to the data during data collection.
• Begin collecting a profile. • Back up the cart to position the vertical cursor over
a hyperbola you want to mark. Drag the horizontal cursor to form a cross-hair over the hyperbola.
Adding a Target A color coded target can be added to the data during data collection.
• Begin collecting a profile. • Back up the cart to position the vertical cursor over a
hyperbola of known quantity. Drag the horizontal cursor to form a cross-hair over the hyperbola.
• Press Add Target and select the color of the target you would like to add to your data.

Quick Start Guide UtilityScan® HS
Copyright © 2016 Geophysical Survey Systems, Inc. 35 All Rights Reserved
Recollecting a Profile(s) If an error was made during data collection and you know where it occurred that data can be recollected.
• Use Next Line or Previous Line to move around the 3D grid until located at the profile(s) to be recollected.
• Line up the antenna and press Run to recollect the profile.
• The new profile will replace the earlier profile automatically.

Quick Start Guide UtilityScan® HS
Copyright © 2016 Geophysical Survey Systems, Inc. 36 All Rights Reserved
Playback 3D Data Selecting Playback from the bottom menu bar or selecting Playback Only from the Introduction Screen allows you to view and edit data previously collected and saved. The antenna does not need to be connected to run in Playback only mode.
1 After selecting Playback Only from the intro screen, choose which 3D Grid from the last selected project to review. • Tap on the Arrows and select a grid. • Tap on the Check to select the grid and continue to
the Playback Setup screen. 2 During playback you can perform all of the following
functions: • Slice in the X, Y, or Z (depth) axis and adjust
thickness. • Perform a Migration and Hilbert Transform. • Change the Dielectric Constant, Soil Type, and
Display Gain. • Set Depth or turn Focus On to estimate the dielectric value. • Select Active Channel or which frequency to display. • Add vertical user Marks. • Pause, move Backward, move Forward, select Next File (if multiple files were originally selected), or
Stop Playback.

Quick Start Guide UtilityScan® HS
Copyright © 2016 Geophysical Survey Systems, Inc. 37 All Rights Reserved
Main Menu Options (Right Pane of the Screen) The Signal Process, Output Options, and System Options work the same way in 3D mode as in 2D mode. Please review Section 2 for details.
3D Mode Menu
Z – Slice: Processes the current grid and displays a top down view of the area surveyed.
• Start and End Position: This is the range between which the slices will scroll automatically when Animate is turned on from the bottom pane.
When Z-Slice is selected two sliders appear above and to the right of the data.
• Slice Thickness: Slider to the right of the data. By moving the slider up and down the slice thickness changes. This will show you a greater thickness of the data in one image and may result in targets of different depths showing on the same image.
• Slice Position: This is the depth of the current slice and corresponds with the slider at the top of the data. Move the slider from left to right to look for deeper features.
• Animate: When turned On this will automatically move through the Z-slices starting from the current location and moving shallower.
Quick Start Guide UtilityScan® HS
Copyright © 2016 Geophysical Survey Systems, Inc. 38 All Rights Reserved
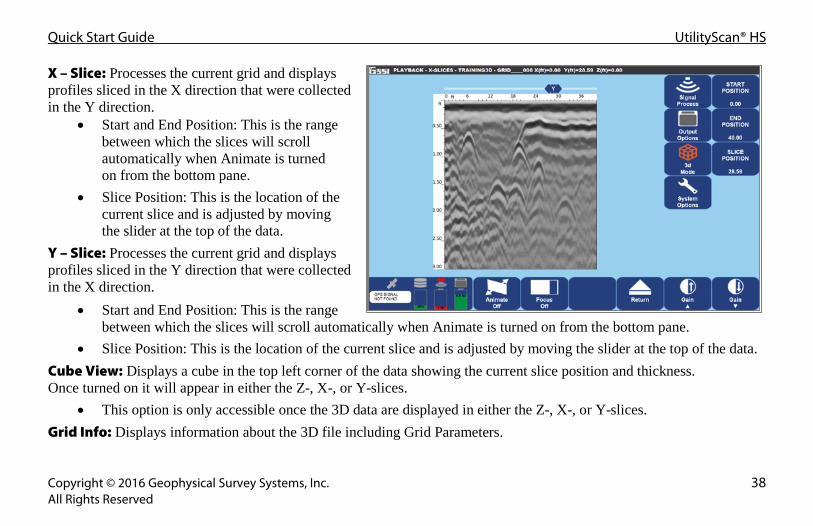
X – Slice: Processes the current grid and displays profiles sliced in the X direction that were collected in the Y direction.
• Start and End Position: This is the range between which the slices will scroll automatically when Animate is turned on from the bottom pane.
• Slice Position: This is the location of the current slice and is adjusted by moving the slider at the top of the data.
Y – Slice: Processes the current grid and displays profiles sliced in the Y direction that were collected in the X direction.
• Start and End Position: This is the range between which the slices will scroll automatically when Animate is turned on from the bottom pane.
• Slice Position: This is the location of the current slice and is adjusted by moving the slider at the top of the data. Cube View: Displays a cube in the top left corner of the data showing the current slice position and thickness. Once turned on it will appear in either the Z-, X-, or Y-slices.
• This option is only accessible once the 3D data are displayed in either the Z-, X-, or Y-slices. Grid Info: Displays information about the 3D file including Grid Parameters.

Quick Start Guide UtilityScan® HS
Copyright © 2016 Geophysical Survey Systems, Inc. 39 All Rights Reserved
Sub Menu Options (Bottom Pane of the Setup Screen) Preview File/Stop: Preview individual profiles. Data will begin scrolling through of each profile collected in the 3D grid. Use Stop to end the current scroll and begin back at the first profile. Reset Gain: Reset the display gain for optimal viewing. Select Grid: Select another grid from the current project file to playback. Playback File(s): Displays the data in whichever display is currently selected (High, Low, Split, or Blend). See next section for options during Playback. Collect Mode: This will take you to collect mode if you wish to collect data. File Info: Information about the file.

Quick Start Guide UtilityScan® HS
Copyright © 2016 Geophysical Survey Systems, Inc. 40 All Rights Reserved
Playback File(s) Options Displayed at the top of the screen:
• The current mode, Collect or Playback. • The name of the folder and file. • The location of the cross hair (X for distance,
Z for depth). Place the stylist pen on the screen to move the cross hair to the desired position.
Menu Options at the Bottom of the Screen
Backward: Scroll the data towards the beginning of the file. Forward: Scroll the data towards the end of the file. Mark: Mark the data for reference points.
1 Place the stylist pen on the screen.
2 Move the pen around and place the vertical line where you would like the mark to be placed.
3 Tap the Mark Icon. Focus: Use Focus during Playback Mode to estimate a dielectric value. This option is only available when displaying the X- or Y-slices. This turns on the Migration and Hilbert Filters from the Signal Process menu.

Quick Start Guide UtilityScan® HS
Copyright © 2016 Geophysical Survey Systems, Inc. 41 All Rights Reserved
1 Turn Focus On and adjust the percent of coverage. You can either Focus 24%, 50%, 75%, or 100% of the X- or Y-slices.
2 Move the Dielectric slider to the right of the data up or down to adjust the Dielectric Constant. You will see the value change at the very top of the screen.
3 Obtaining a better Dielectric Constant is done by moving the vertical slider until the hyperbolic reflections become dots or vertical bars. See Appendix C for more information.
4 The new Dielectric Constant is automatically applied to all of the profiles in the 3D grid. Stop Playback: Return to the Playback Setup Screen. Set Depth: Input a known depth to the data. This will update the dielectric value accordingly.
1 Place the stylist pen on the screen.
2 Move the pen around and place the horizontal line at the known depth.
3 Tap the Set Depth Icon.
4 Enter and accept the known depth. Focus On: Turns on Focus Mode to adjust the Dielectric Constant and get more accurate depth estimates. Pause: Pauses playback. Next File: If multiple files were selected for playback this will advance through them in sequence. Gain Up/Down: Adjusts the Display Gain.

Quick Start Guide UtilityScan® HS
Copyright © 2016 Geophysical Survey Systems, Inc. 42 All Rights Reserved
Appendix A: Dielectrics of Common Materials (Soil Conditions) Material Dielectric Constant Material Dielectric Constant Air 1 Wet Granite 6.5 Snow Firn 1.5 Travertine 8 Dry Loamy/Clayey Soils 2.5 Wet Limestone 8 Dry Clay 4 Wet Basalt 8.5 Dry Sands 4 Tills 11 Ice 4 Wet Concrete 12.5 Coal 4.5 Volcanic Ash 13 Asphalt 5 Wet Sands 15 Dry Granite 5 Wet Sandy Soils 23.5 Frozen Sand & Gravel 5 Dry Bauxite 25 Dry Concrete 5.5 Saturated Sands 25 Dry Limestone 5.5 Wet Clay 27 Dry Sand & Gravel 5.5 Peats (saturated) 61.5 Potash Ore 5.5 Organic Soils (saturated) 64 Dry Mineral/Sandy Soils 6 Sea Water 81 Dry Salt 6 Water 81 Frozen Soil/Permafrost 6 Syenite Porphyry 6 Wet Sandstone 6
Quick Start Guide UtilityScan® HS
Copyright © 2016 Geophysical Survey Systems, Inc. 43 All Rights Reserved
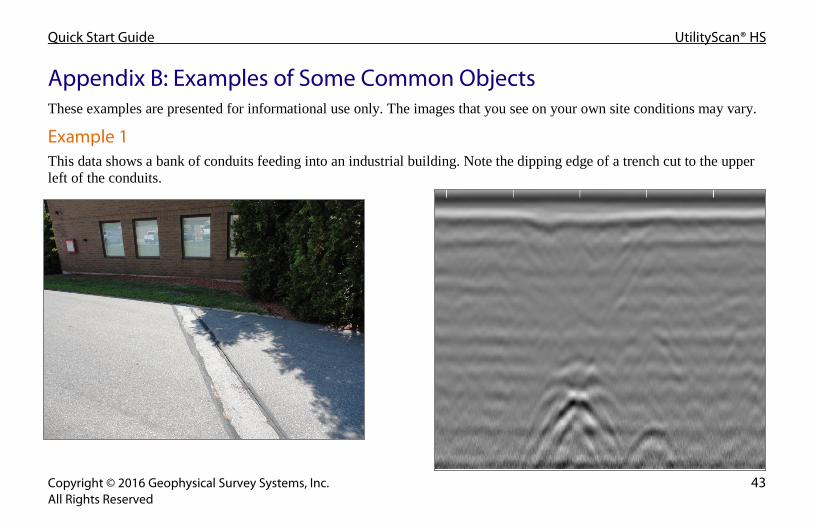
Appendix B: Examples of Some Common Objects These examples are presented for informational use only. The images that you see on your own site conditions may vary.
Example 1 This data shows a bank of conduits feeding into an industrial building. Note the dipping edge of a trench cut to the upper left of the conduits.

Quick Start Guide UtilityScan® HS
Copyright © 2016 Geophysical Survey Systems, Inc. 44 All Rights Reserved
Example 2 This image shows a drain line coming out of a restroom. Also note the mesh at the top of the screen.
Quick Start Guide UtilityScan® HS
Copyright © 2016 Geophysical Survey Systems, Inc. 45 All Rights Reserved
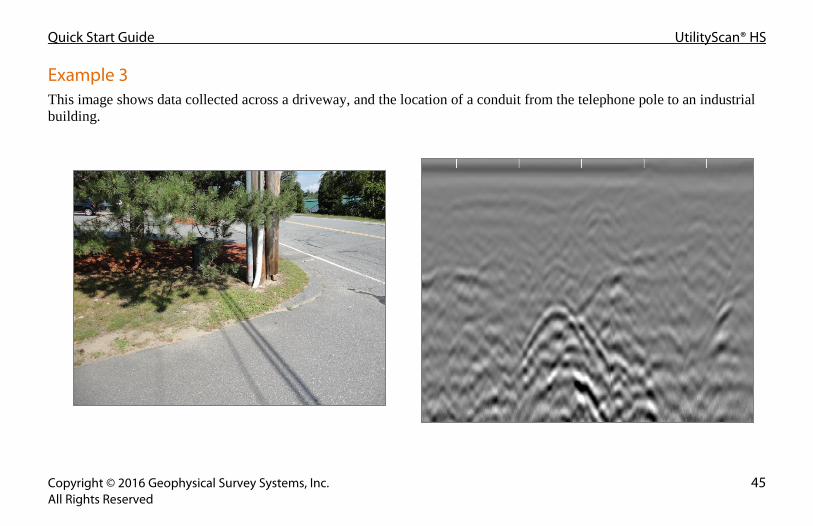
Example 3 This image shows data collected across a driveway, and the location of a conduit from the telephone pole to an industrial building.

Quick Start Guide UtilityScan® HS
Copyright © 2016 Geophysical Survey Systems, Inc. 46 All Rights Reserved
Example 4 This image shows data collected along a driveway next to a business. This shows a concrete culvert with a cable running through it.

Quick Start Guide UtilityScan® HS
Copyright © 2016 Geophysical Survey Systems, Inc. 47 All Rights Reserved
Example 5 This image shows a gas line and communication cables (Fiber Optic) going across a driveway.

Quick Start Guide UtilityScan® HS
Copyright © 2016 Geophysical Survey Systems, Inc. 48 All Rights Reserved
Appendix C: Glossary of Terms Dielectric: A value assigned to materials and is used to calculate the velocity of RADAR in that material. RADAR will travel at different speeds depending upon the material and/or soil condition. RADAR travels fastest in air (dielectric = 1) and slowest in water (dielectric = 81). Everything else falls somewhere in between. It is important to know the dielectric value of a material so that the depth of a target can be calculated. Since determining dielectric is a best guess estimate, the depth of a target will never be an exact measurement. As a safety feature, you will always give about a 1 foot (or about 1/3 meter) margin of error when estimating the depth of a target. Filter: A process to remove unwanted noise in the data so that targets can be seen more clearly. Filtering is a trial and error process, therefore trial runs are necessary using different filtering values to determine the best configuration for a job site. There are two types of filtering: • Background Removal: This filter will
remove unwanted noise that looks like horizontal banding across your data. Using this process, this will remove data that is consistent throughout your data. To avoid removing horizontal features of interest this filter should be set higher than the target feature length times the number of scans/unit.
No Background Removal Background Removal
Quick Start Guide UtilityScan® HS
Copyright © 2016 Geophysical Survey Systems, Inc. 49 All Rights Reserved
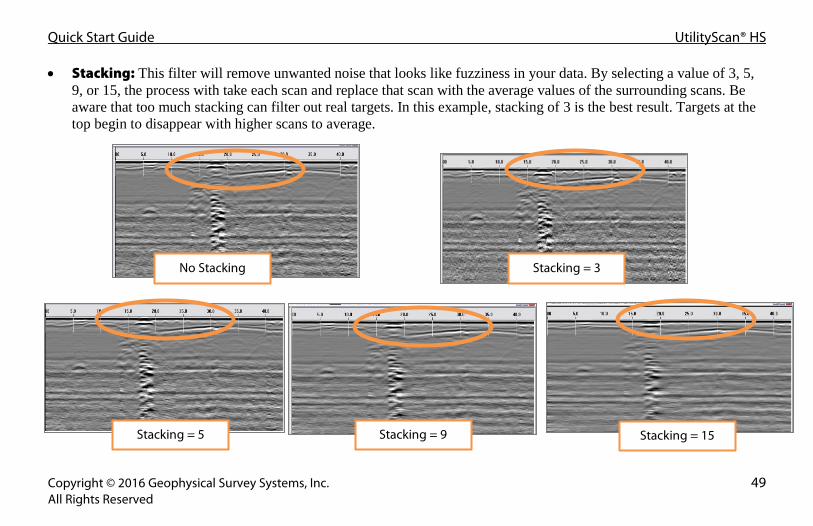
• Stacking: This filter will remove unwanted noise that looks like fuzziness in your data. By selecting a value of 3, 5, 9, or 15, the process with take each scan and replace that scan with the average values of the surrounding scans. Be aware that too much stacking can filter out real targets. In this example, stacking of 3 is the best result. Targets at the top begin to disappear with higher scans to average.
No Stacking Stacking = 3
Stacking = 15 Stacking = 9 Stacking = 5

Quick Start Guide UtilityScan® HS
Copyright © 2016 Geophysical Survey Systems, Inc. 50 All Rights Reserved
Gain: Adding or subtracting Gain from data will amplify or lower the image of the RADAR signals. It is advised that you use the lowest gain that will show targets.
Gain too low Correct Gain Gain too high
Quick Start Guide UtilityScan® HS
Copyright © 2016 Geophysical Survey Systems, Inc. 51 All Rights Reserved
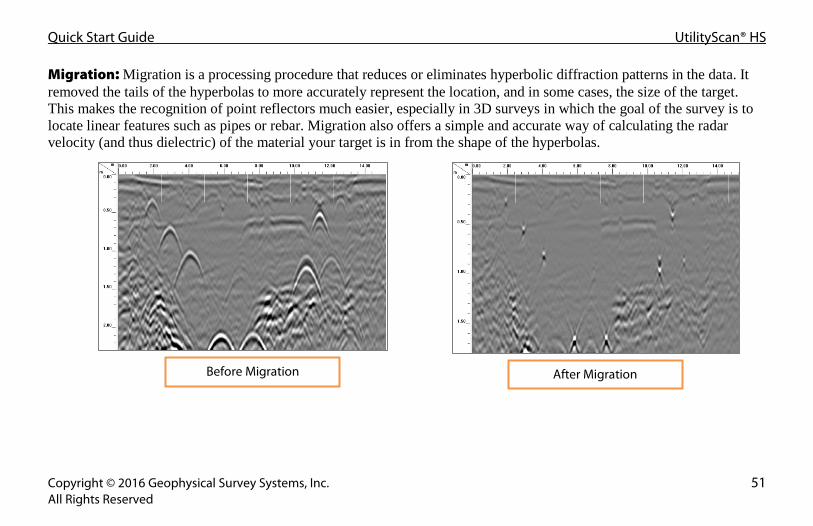
Migration: Migration is a processing procedure that reduces or eliminates hyperbolic diffraction patterns in the data. It removed the tails of the hyperbolas to more accurately represent the location, and in some cases, the size of the target. This makes the recognition of point reflectors much easier, especially in 3D surveys in which the goal of the survey is to locate linear features such as pipes or rebar. Migration also offers a simple and accurate way of calculating the radar velocity (and thus dielectric) of the material your target is in from the shape of the hyperbolas.
Before Migration After Migration

Quick Start Guide UtilityScan® HS
Copyright © 2016 Geophysical Survey Systems, Inc. 52 All Rights Reserved
Appendix D: Connect and Configure GPS The UtilityScan HS is designed to work with a wide variety of GPS units. In order to operate with the UtilityScan DF, your GPS must be able to output the NMEA GGA string through a 9-pin serial port. The GPS data are saved in a separate file with the same root name as your GPR data file. A profile collected with GPS will thus have three files associated with it: FILE_001.DZT (RADAR data), FILE_001.DZW (filter and gain settings for the raw data), and FILE_001.DZG (GPS location info).
Hardware Setup 1 Attach the GPS receiver securely to the UtilityScan HS system.
2 Measure and make note of the offset of the GPS receiver from the GPR antenna.
3 Plug the serial port from your GPS into the GPS port on the top of the dual frequency antenna.
Configure GPS 1 Select Scan Process – Maintenance. 2 Select Configure GPS. Five options will appear on the screen.
Change these settings to match the settings on your GPS. 3 Click Accept or check.

Quick Start Guide UtilityScan® HS
Copyright © 2016 Geophysical Survey Systems, Inc. 53 All Rights Reserved
Check GPS Data Integrity The UtilityScan HS performs a constant quality check on the incoming GPS stream. This is visible at the lower left-hand corner of the screen. The UtilityScan HS checks the HDOP once per second. A high quality HDOP, 2 or less, is required for the system to record GPS data.
HDOP ≤ 2
• Latitude and Longitude are displayed. • Data is being collected.
HDOP > 2 • Data is being collected, but the accuracy is low.
Lost connection.
Connection was never established.
Transferring GPS files A third file type (File_001.dzg) will be collected with each GPR data file. All of the files will be stored in the same project folder. Transferring the GPS files is automatically done at the same time as transferring the GPR data files.