Air Navigation Order (ANO) For Radio Navigation Aids ANO - Caab
8/10/2019 Gsp Vol i Radio Aids
http://slidepdf.com/reader/full/gsp-vol-i-radio-aids 1/232
Chapter 1 – Basic Radio
The word 'radio' means the radiation of electromagnetic waves conveying
information, and detection of such waves. Within this meaning, such applications
as telegraphy, telephony, television and a host of navigation aids are all classified
as radio. This volume is primarily concerned with the air navigation aidscommonly used worldwide.
The existence of electromagnetic waves was suspected long before Heinrich
Hertz conducted his famous experiment in 1887 and demonstrated their presence.
As early as 1865 James Clerk Maxwell of King's College, London University
produced a paper in which he predicted the existence of these waves. Later, in
1886, a year before Hertz' experiment, Professor Hughes, a scientist in London
came very close to the discovery.
However, Hertz not only verified Maxwell's prediction but also established
the speed of the radio waves and other properties. He showed that they can
propagate in a vacuum, and that they are stopped by a metallic screen (the
foundation of our present day radar). He calculated wavelengths for various
frequencies and determined the relationship between the two.
Propagation of radio waves
If a source of alternating voltage is connected to a wire (i.e. an aerial) an
oscillating current will be set up in the wire, the electrons of which move about a
mean position. The electric field present in the wire is accompanied by a magnetic
field and at a suitable frequency (in relation to the length of the aerial) both fields
radiate efficiently outward from the wire in the form of electromagnetic or radio
waves. In the earth environment these disturbances travel approximately at the
speed of light, that is,186000 statute miles per second or
162000 nautical miles per second or
300000000 metres per second or
300000 kilometres per second.
As the waves are alternating fields, the terminology involved with alternating
currents will be looked into first, extending this to radio terminology. An a.c.
voltage in a wire reverses its direction a number of times every second.
Consequently, if a graph of the current in the wire is plotted against time, it will be
found that it is a sine curve (see Fig. 1.1).

8/10/2019 Gsp Vol i Radio Aids
http://slidepdf.com/reader/full/gsp-vol-i-radio-aids 2/232
Cycle. A cycle is one complete series of values, or one complete process.Hertz. One hertz is one cycle per second. The number of cycles per second is
expressed in hertz. (This term is a relatively recent adoption in honour of the
above-mentioned eminent scientist).
Amplitude. Amplitude of a wave is the maximum displacement, or the
maximum value it attains from its mean position during a cycle. It is both positive
and negative. (That part of the curve in Fig. 1.1. above the mean or time axis is
called positive and that part which is below the line is negative.)
Frequency (f). Frequency of an alternating current or a radio wave is the
number of cycles occurring in one second, expressed in hertz (Hz). For example,
500 Hz means 500 cycles per second. Since the number of cycles per second of
normal radio waves is very high it is usual to refer to them in terms of kilohertz,megahertz and giga-hertz as follows:
1 cycle per second = 1 Hz
1000 Hz = 1 kHz (kilohertz)
1000 kHz = 1 MHz (megahertz)
1000 MHz = 1 GHz (giga hertz)
Wavelength (l). This is the physical distance travelled by the radio wave
during one complete cycle of transmission. It is defined as the distance between
successive crests or the distance between two consecutive points at which the
moving particles of the medium have the same displacement from the mean value
and are moving in the same direction.
Wavelength -Frequency RelationshipA radio wave travels at a speed of 186000 statute miles per. second, or
162000 nautical miles per second or 300000000 m/sec. The relationship between
the frequency and its wavelength is established when it is considered that if a
transmission of one hertz is made, the wave will cover a geographical distance of
300000000 metres. If two hertz were transmitted (that is, two cycles in one
second), two complete cycles will occupy a space of 300000000 metres between
them. This means that one cycle will occupy 150000000 metres, which is also its
wavelength. Thus, as frequency is increased, the wavelength is decreased in the
same proportion and vice versa; putting this in, a formula:
Wavelength = speed of radio waves (or λ = c )

8/10/2019 Gsp Vol i Radio Aids
http://slidepdf.com/reader/full/gsp-vol-i-radio-aids 3/232
frequency f
and
speed of radio waves cFrequency = wavelength (or f =
λ )
By use of the above formula it is possible to convert frequency into
wavelength and wavelength into frequency. To avoid any errors, at least at the
beginning, basic units should be used in the formula. The use of hertz for
frequency gives metres for wavelength; the use of metres for wavelength gives
hertz for frequency, which may then be expressed as kHz or MHz as appropriatefor the answer.
Examples
1) If the wavelength is 1.5 km, what is the frequency?
speed in m/secFrequency in hertz =
wavelength in m
300000000=
1500
= 200000 Hz
= 200 kHz
2) If the transmission frequency is 75 MHz, what is the wavelength?
speed in m/secWavelength in hertz =
frequency in m
300000000=
75000000
= 4 m
3) If the wavelength is 3 cm, what is the frequency?
3 cm = 0.03 m
300000000Frequency =
0.03= 10000000000 Hz
= 10000 MHz or 10 GHz
4) If the frequency is 13500 MHz, what is the wavelength?
300000000Wavelength =
13500000000
3=
135
= 0.0222 m
= 2.22 cm

8/10/2019 Gsp Vol i Radio Aids
http://slidepdf.com/reader/full/gsp-vol-i-radio-aids 4/232
5) How many wavelengths, to the nearest whole number, of frequency 150 MHz
are equivalent to 52 ft?
300000000Wavelength =
150000000
= 2 m= 2 × 3.28 ft
= 6.56 ft
52The number of times 6.56 ft will go into 52 ft =
6.56
= 8 (approx)
Now try these.
1) Wavelength is 3 m, what is the frequency?
Answer: 100 MHz2) Express 100 kHz in m.
Answer: 3000 m
3) Wavelength is 3520m, what is the frequency?
Answer: 85.23 kHz
4) Frequency 325 kHz, what is the wavelength?
Answer: 923.08m
5) Frequency 117,000 kHz, what is the wavelength?
Answer: 2.56 m
6) Wavelength 3.41 cm, what is the frequency?
Answer: 8797.6 MHz
7) How many wavelengths to the nearest whole number is equivalent to 60 ft if
the transmission frequency is 100 MHz? (1 m = 3.28 ft)
Answer: 6 wavelengths
8) If wavelength is 2.739 m, what is the frequency?
Answer: 109.53 MHz
9) Give the frequency appropriate to a wavelength of 2222 m.
Answer: 135.01 kHz
10) If the frequency is 1439 kHz what is its wavelength?
Answer: 208.48 m.
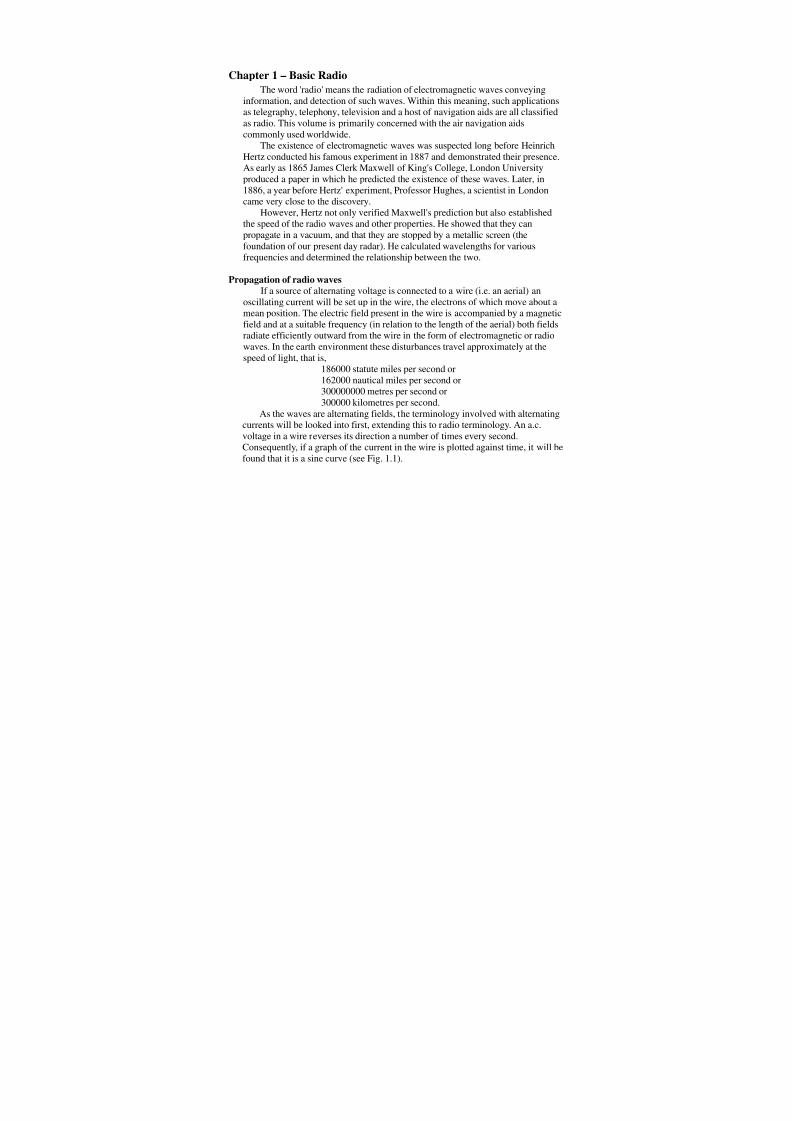
Phase and Phase DifferenceConsider a vector, rotating about central axis O and producing an AC
waveform. As the vector OR, starting from its position of rest, R, completes one
revolution, it will produce one complete cycle of AC. This cycle may be plotted
on a horizontal axis, representing 360° (Fig. 1.2).
8/10/2019 Gsp Vol i Radio Aids
http://slidepdf.com/reader/full/gsp-vol-i-radio-aids 5/232
If the vector is stopped at some stage of its revolution, say at point E (30°
anticlockwise from OR position), it will have traced the cycle from zero position
on the horizontal axis up to point E'. E' is then the instantaneous phase of that
cycle. In other words, any stage in the cycle of an alternating current is referred to
as its phase.
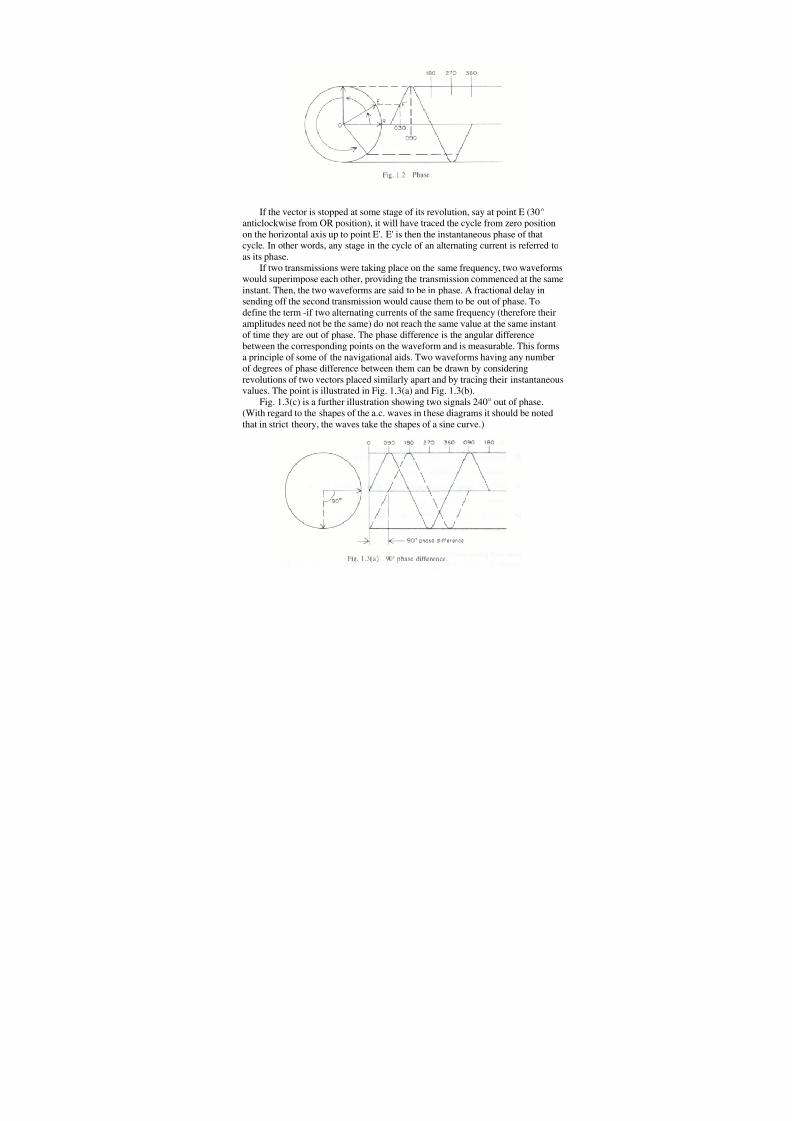
If two transmissions were taking place on the same frequency, two waveforms
would superimpose each other, providing the transmission commenced at the same
instant. Then, the two waveforms are said to be in phase. A fractional delay in
sending off the second transmission would cause them to be out of phase. To
define the term -if two alternating currents of the same frequency (therefore their
amplitudes need not be the same) do not reach the same value at the same instant
of time they are out of phase. The phase difference is the angular difference
between the corresponding points on the waveform and is measurable. This forms
a principle of some of the navigational aids. Two waveforms having any numberof degrees of phase difference between them can be drawn by considering
revolutions of two vectors placed similarly apart and by tracing their instantaneous
values. The point is illustrated in Fig. 1.3(a) and Fig. 1.3(b).
Fig. 1.3(c) is a further illustration showing two signals 240° out of phase.
(With regard to the shapes of the a.c. waves in these diagrams it should be noted
that in strict theory, the waves take the shapes of a sine curve.)

8/10/2019 Gsp Vol i Radio Aids
http://slidepdf.com/reader/full/gsp-vol-i-radio-aids 6/232
Polarisation
As mentioned earlier, when a suitable a.c. is applied to an aerial,
electromagnetic waves are radiated from the aerial. These waves alternate with the
same frequency as that of the a.c. applied to the aerial. The two components,electric and magnetic, thus radiated travel together at the speed of light. Both
travel at right angles to each other (see Fig. 1.4) and also at right angles to the
direction of propagation.
When the transmission is being made from a vertical aerial the electrical
component, E, travels in the vertical plane and its associated magnetic component,
H, in the horizontal plane and the emission is called vertically polarised. Similarly,
for a horizontal aerial the electrical component travels in the horizontal plane, the
magnetic component in the vertical plane and the emission is horizontally
polarised. Where the electrical and magnetic components spin about the axis of
advance, the signal is circularly polarised. This technique is used in reducing rainclutter in radar.

8/10/2019 Gsp Vol i Radio Aids
http://slidepdf.com/reader/full/gsp-vol-i-radio-aids 7/232
The importance of knowledge of polarisation lies in the orientation of the
receiver aerial. A vertical aerial will efficiently receive the electrical component of
a vertically polarised signal. If the receiver aerial, on the other hand, was perfectly
horizontal it would receive no electrical component. Similarly a horizontal aerial
will efficiently receive a horizontally polarised signal.
The vector lengths in Fig. 1.4 represent the field intensity of the signal at agiven instant. As the signal travels further the energy spreads out in an ever-
increasing volume of space. This is one form of attenuation of the signals-
attenuation due to spread out. The reduction in field strength is governed by the
inverse square law in experimental conditions in vacuum. Thus, if the field
strength of a point at a given distance from the transmitter measures, say 80 micro
volts, then the reading at another point twice the distance from the transmitter will
be a quarter of the value, that is, 20 micro volts
Polar Diagram
A polar diagram can be drawn up for any aerial or aerial system to represent
the relative values of either field strength or power radiated at various points inboth horizontal and vertical planes. For example, the polar diagram of a simple
vertical aerial, radiating equally in all directions, is a circle. The polar diagram of
two such aerials placed half a wavelength apart would be a figure of eight.
Directional aerials radiate most strongly in the required direction and
consequently, in any other direction the energy transmitted will be less than the
maximum value (see Fig. 1.5).
The strength of transmission in the predetermined direction is shown by
vector OB. On the same scale, vector OA represents the transmission strength in
the direction of X.
The polar diagram of a receiver (Rx) aerial similarly gives indication ofreception from various directions. An aerial with a circular polar diagram would
receive signals equally from all directions whereas an aerial with a polar diagram
of a figure of eight (ADF loop aerial) would receive maximum signals from one
direction and no signals if the aerial were turned 90° from the original position. In
Fig. 1.5, if the receiving aerial was at 0, it would receive maximum signals from a
transmitter (Tx) in the direction of Y and reduced signals from direction x.
Modulation
A page left blank in a newspaper conveys no information. To convey
information it must be impressed with print. A plain radio wave may be likened to
the blank newsprint. It can neither be heard nor can it convey information. If it ismade audible by use of special components (which will be considered in a later
8/10/2019 Gsp Vol i Radio Aids
http://slidepdf.com/reader/full/gsp-vol-i-radio-aids 8/232
chapter) the only signal heard is a constant audio tone but still nothing is 'read'.
Therefore, some form of intelligence must be impressed upon such a wave if it is
to convey information. The process of impressing such intelligence is called
modulation. It is done in a variety of ways, but since in all cases the radio waves
simply act as a vehicle for the information, they are commonly called carrier
waves (CW). The waveform of information, which is being impressed on thiscarrier, is called a modulating wave. Some of the ways in which the carrier wave
may be changed to transmit information are given below.
Keying. This is radiotelegraphy. It consists of starting and stopping the
continuous carrier so as to break it up into the form of dots and dashes. The
communication is by a code, groups of dots and dashes having been assigned
particular meanings. The technique is primarily used for long-distance
communication; a radio navigation facility may break its carrier to identify itself
by dots and dashes. The receiver requires beat frequency oscillator (BFO) facility
to make the signals audible.
Amplitude Modulation. This method may be used in one of two ways: totransmit coded messages at audio frequencies (AF) or to radiate speech, music,
etc.
As the name suggests, in this method, the amplitude of the carrier is varied in
conformation with the amplitude of the audio modulating signal, keeping the
carrier's frequency constant. To transmit coded information, e.g. identity of a
navigation facility, breaks must be caused in the audio. This is done either by
keying on/off just the audio tone, or both audio and the carrier.
In Fig. 1.6, audio signal B is impressed on radio frequency (RF) A. Suppose
the amplitude of both A and B is one unit. It will be noted that the resultant
envelope of the carrier wave is the picture of the modulating audio wave and that
its amplitude has increased to 2 units, now varying between values 0 and 2.

8/10/2019 Gsp Vol i Radio Aids
http://slidepdf.com/reader/full/gsp-vol-i-radio-aids 9/232
When a signal is amplitude-modulated, its resultant amplitude varies between
the sum and difference of the amplitudes of the two waves. In Fig. 1.6 the sum of
the amplitudes of A and B is 2 and the difference is 0 and the amplitude of the
audio being carried varies between values 2 and 0. This is a measure of the
modulation depth. Modulation depth is the extent to which the carrier is modulated
and is expressed as a percentage. It is the ratio
amplitude of B
amplitude of A× 100
In Fig. 1.6 the modulation depth is 100%. If the carrier's amplitude was 2
units and the audio's 1 unit, the resultant audio would vary between 3 and 1 andthe modulation depth would be 50%.
The degree of modulation is an important design consideration. Here we are
concerned with two factors: the strength of the outgoing audio and the power
required to produce it. The variation in the amplitude of the outgoing modulated
signal controls the strength of the audio being carried. Thus, a signal with 100%
modulation depth will be stronger compared to a 50% modulated signal. High
modulation depth would appeal to broadcasters whose speech and music would be
heard loudest when 100% modulated. In practice they keep their modulation depth
to slightly below 100%. Over-modulation causes distortion in the reception.
As for the power considerations, extra power must be supplied to amplitude-
modulate a carrier. The power requirement increases by half for a 100%modulated signal but it falls rapidly when the modulation depth is decreased.
8/10/2019 Gsp Vol i Radio Aids
http://slidepdf.com/reader/full/gsp-vol-i-radio-aids 10/232
Thus, for a given power output and the other conditions being equal, an un-
modulated signal will travel further than an amplitude-modulated signal.
Broadcasters in low frequency (LF) and medium frequency (MF) bands
employ amplitude modulation, so does civil aviation in very high frequency
radiotelephony (VHF RTF).
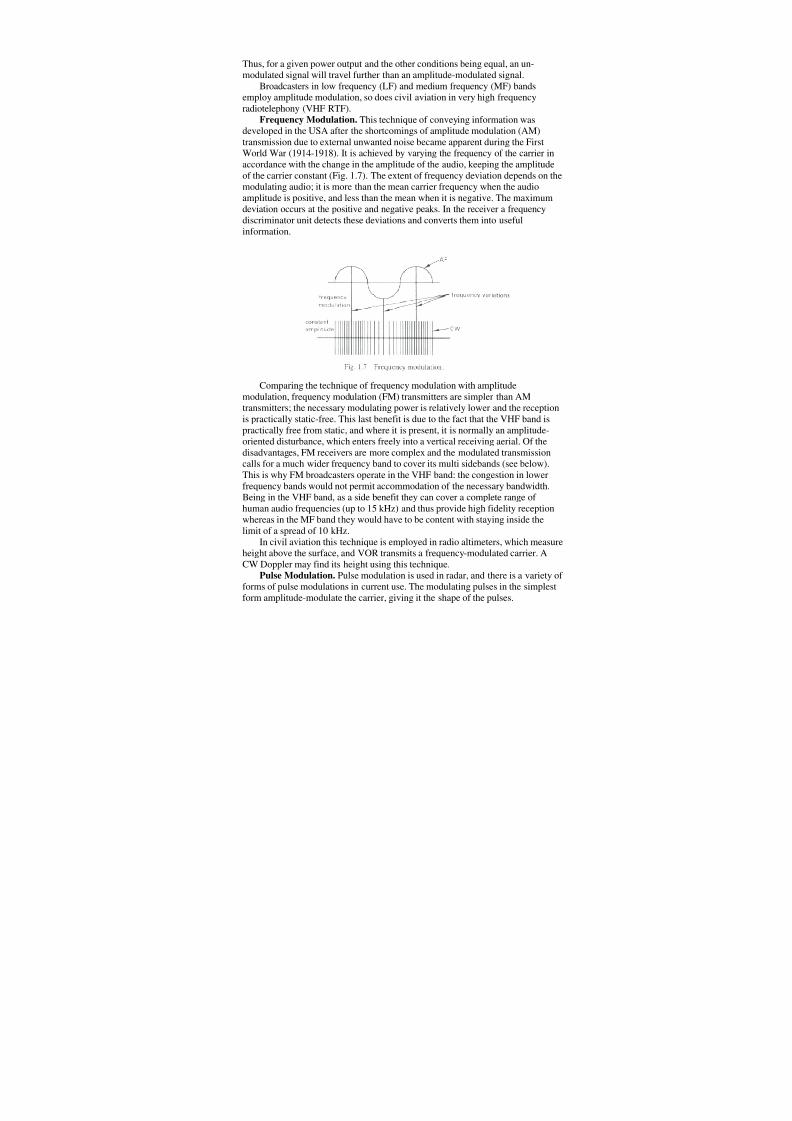
Frequency Modulation. This technique of conveying information wasdeveloped in the USA after the shortcomings of amplitude modulation (AM)
transmission due to external unwanted noise became apparent during the First
World War (1914-1918). It is achieved by varying the frequency of the carrier in
accordance with the change in the amplitude of the audio, keeping the amplitude
of the carrier constant (Fig. 1.7). The extent of frequency deviation depends on the
modulating audio; it is more than the mean carrier frequency when the audio
amplitude is positive, and less than the mean when it is negative. The maximum
deviation occurs at the positive and negative peaks. In the receiver a frequency
discriminator unit detects these deviations and converts them into useful
information.
Comparing the technique of frequency modulation with amplitude
modulation, frequency modulation (FM) transmitters are simpler than AM
transmitters; the necessary modulating power is relatively lower and the reception
is practically static-free. This last benefit is due to the fact that the VHF band is
practically free from static, and where it is present, it is normally an amplitude-
oriented disturbance, which enters freely into a vertical receiving aerial. Of the
disadvantages, FM receivers are more complex and the modulated transmission
calls for a much wider frequency band to cover its multi sidebands (see below).
This is why FM broadcasters operate in the VHF band: the congestion in lower
frequency bands would not permit accommodation of the necessary bandwidth.
Being in the VHF band, as a side benefit they can cover a complete range of
human audio frequencies (up to 15 kHz) and thus provide high fidelity reception
whereas in the MF band they would have to be content with staying inside the
limit of a spread of 10 kHz.
In civil aviation this technique is employed in radio altimeters, which measure
height above the surface, and VOR transmits a frequency-modulated carrier. A
CW Doppler may find its height using this technique.
Pulse Modulation. Pulse modulation is used in radar, and there is a variety of
forms of pulse modulations in current use. The modulating pulses in the simplest
form amplitude-modulate the carrier, giving it the shape of the pulses.
8/10/2019 Gsp Vol i Radio Aids
http://slidepdf.com/reader/full/gsp-vol-i-radio-aids 11/232
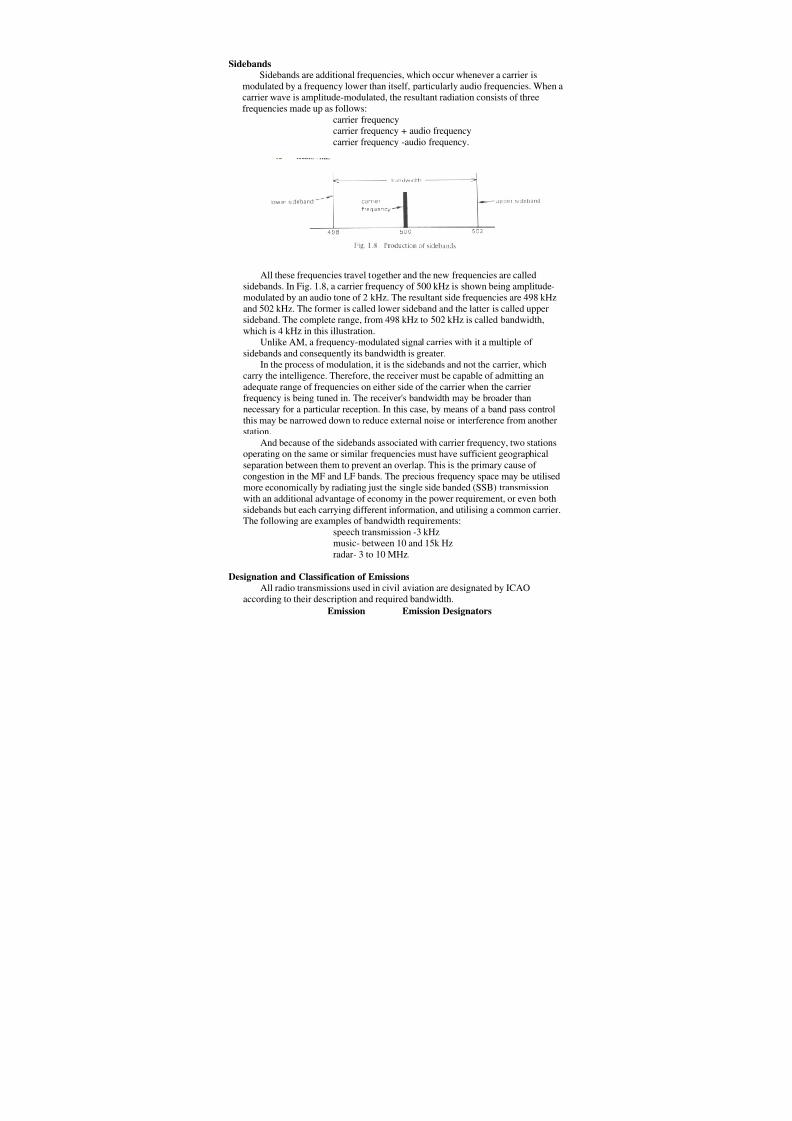
Sidebands
Sidebands are additional frequencies, which occur whenever a carrier is
modulated by a frequency lower than itself, particularly audio frequencies. When a
carrier wave is amplitude-modulated, the resultant radiation consists of three
frequencies made up as follows:
carrier frequencycarrier frequency + audio frequency
carrier frequency -audio frequency.
All these frequencies travel together and the new frequencies are called
sidebands. In Fig. 1.8, a carrier frequency of 500 kHz is shown being amplitude-
modulated by an audio tone of 2 kHz. The resultant side frequencies are 498 kHz
and 502 kHz. The former is called lower sideband and the latter is called upper
sideband. The complete range, from 498 kHz to 502 kHz is called bandwidth,
which is 4 kHz in this illustration.
Unlike AM, a frequency-modulated signal carries with it a multiple of
sidebands and consequently its bandwidth is greater.
In the process of modulation, it is the sidebands and not the carrier, which
carry the intelligence. Therefore, the receiver must be capable of admitting an
adequate range of frequencies on either side of the carrier when the carrier
frequency is being tuned in. The receiver's bandwidth may be broader than
necessary for a particular reception. In this case, by means of a band pass control
this may be narrowed down to reduce external noise or interference from another
station.
And because of the sidebands associated with carrier frequency, two stations
operating on the same or similar frequencies must have sufficient geographical
separation between them to prevent an overlap. This is the primary cause of
congestion in the MF and LF bands. The precious frequency space may be utilisedmore economically by radiating just the single side banded (SSB) transmission
with an additional advantage of economy in the power requirement, or even both
sidebands but each carrying different information, and utilising a common carrier.The following are examples of bandwidth requirements:
speech transmission -3 kHz
music- between 10 and 15k Hz
radar- 3 to 10 MHz.
Designation and Classification of Emissions
All radio transmissions used in civil aviation are designated by ICAO
according to their description and required bandwidth.Emission Emission Designators

8/10/2019 Gsp Vol i Radio Aids
http://slidepdf.com/reader/full/gsp-vol-i-radio-aids 12/232
NDBNON AlA
NON A2A
HF (Communication) J3E
VHF (Communication) A3E
VDF A3E
ILS A8W
VOR A9W
DME PON
First Symbol. Type of modulation of the main carrier. This includes:
N – Emission of an un-modulated carrier
and, for emissions in which the main carrier is amplitude-modulated
(including cases where sub-carriers are angle-modulated):
A – Double sideband
H – Single sideband
J – Single sideband, suppressed carrierand, for emissions in which the main carrier is angle-modulated:
F – Frequency modulation
G – Phase modulation
together with, for emission of pulses:
P – Un-modulated sequence of pulses
K – Sequence of pulses modulated in amplitude.
Second Symbol. Nature of signal(s) modulating the main carrier:
0 – No modulating symbol
1 – Single channel containing quantised or digital information without the
use of a modulating sub-carrier2 – Single channel containing quantised or digital information with the use
of a modulating sub-carrier
3 – Single channel containing analogue information
7 – Two or more channels containing quantised or digital information
8 – Two or more channels containing analogue information
9 – Composite system comprising 1, 2 or 7 above, with 3 or 8 above
X – Cases not otherwise covered.
Third Symbol. Type of information to be transmitted:
N – No information transmitted
A – Telegraphy -for aural reception
B – Telegraphy -for automatic reception
C – Facsimile
D – Data transmission, telemetry, telecommand
E – Telephony (including sound broadcasting)
F – Television (video)
W – Combination of the above
X – Cases not otherwise covered.
Information in this context does not include information of a constant,
unvarying nature such as provided by standard frequency emissions, continuous
wave and pulse radars, etc.

8/10/2019 Gsp Vol i Radio Aids
http://slidepdf.com/reader/full/gsp-vol-i-radio-aids 13/232
Test Questions
1) Describe an A3E emission and give one-radio facility, which you associate
with it.
2) Show by means of a diagram two radio signals of the same frequency and
wavelength but one 330° out of phase and twice the amplitude of the other.
3) In what plane does the magnetic field of a radio wave lie if it is:a. vertically polarised?
b. horizontally polarised?
4) By means of suitable diagrams show the following radio emissions:
a. a frequency-modulated wave
b. an amplitude-modulated wave.
5) What do you understand by the terms (indicating type of emission) NON
A1A, PON, NON A2A? Suggest one facility to which each might refer.
6) Show by means of a diagram a radio wave, which has NON, A1A emission.
7) What is a J3E emission?
8) What do you understand by the term frequency modulation? State one facility,
which might use this type of emission.9) What do you understand by 'sideband'?
10) Explain briefly the terms phase and phase difference.
11) A Hertz is:
a. the frequency in cycles per second
b. a frequency of one cycle per second
c. the wavelength corresponding to 1 cycle per second.
12) If wavelength is 8 mm, the radio frequency is:
a. 37.5 GHz
b. 375 GHz
c. 3750 GHz.
13) For a frequency of 200 kHz, the wavelength is:
a. 1500 m
b. 150 m
c. 1500 km.
14) In the diagram time the two radio
waves represented are out of phase by:
a. 45°
b. 180°
c. 90°,
15) AM at frequency fm carried on a transmitted frequency f c produces:
a. a sideband of transmission at f c + 2 f m
b. two sidebands of transmission at ( f c + f m) and ( f c - f m)
c. a sideband of transmission at f c - 2 f m
8/10/2019 Gsp Vol i Radio Aids
http://slidepdf.com/reader/full/gsp-vol-i-radio-aids 14/232
Chapter 2 Radio Wave
Propagation
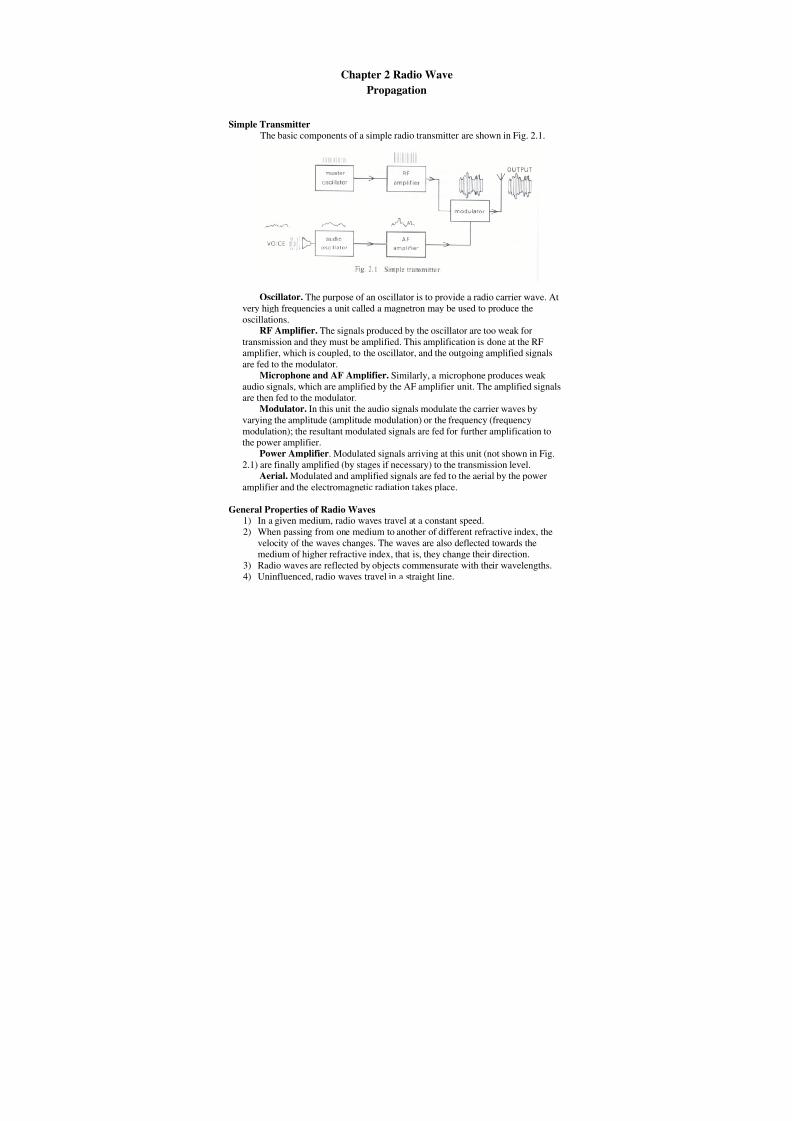
Simple Transmitter
The basic components of a simple radio transmitter are shown in Fig. 2.1.
Oscillator. The purpose of an oscillator is to provide a radio carrier wave. At
very high frequencies a unit called a magnetron may be used to produce the
oscillations.RF Amplifier. The signals produced by the oscillator are too weak for
transmission and they must be amplified. This amplification is done at the RF
amplifier, which is coupled, to the oscillator, and the outgoing amplified signals
are fed to the modulator.Microphone and AF Amplifier. Similarly, a microphone produces weak
audio signals, which are amplified by the AF amplifier unit. The amplified signals
are then fed to the modulator.Modulator. In this unit the audio signals modulate the carrier waves by
varying the amplitude (amplitude modulation) or the frequency (frequency
modulation); the resultant modulated signals are fed for further amplification to
the power amplifier.
Power Amplifier. Modulated signals arriving at this unit (not shown in Fig.
2.1) are finally amplified (by stages if necessary) to the transmission level.
Aerial. Modulated and amplified signals are fed to the aerial by the poweramplifier and the electromagnetic radiation takes place.
General Properties of Radio Waves
1) In a given medium, radio waves travel at a constant speed.
2) When passing from one medium to another of different refractive index, the
velocity of the waves changes. The waves are also deflected towards the
medium of higher refractive index, that is, they change their direction.
3) Radio waves are reflected by objects commensurate with their wavelengths.
4) Uninfluenced, radio waves travel in a straight line.

8/10/2019 Gsp Vol i Radio Aids
http://slidepdf.com/reader/full/gsp-vol-i-radio-aids 15/232
Radio Spectrum
The electromagnetic spectrum starts at the lower end of the radio frequencies,
that is 30 Hz, and stretches to over ten million, million giga hertz where the
radiation takes the form of gamma radiation. In this vast spectrum, radio
frequencies occupy only a very small part. Different frequencies are found to have
different characteristics and in order to identify frequencies having similarcharacteristics the full range of the radio spectrum is divided into various groups
called frequency bands. The frequency bands shown in Table 2.1 are
internationally recognised.
Table 2.1
Frequency band Abbreviation Frequencies Wavelength
extremely low
frequency
ELF 30-300 Hz 10000-1000 km
voice frequency VF 300-3000 Hz 1000-100 km
very low frequency VLF 3-30 kHz 100-10 km
low frequency LF 30-300 kHz 10000-1000 mmedium frequency MF 300-3000 kHz 1000-100m
high frequency HF 3-30 MHz 100-10m
very high frequency VHF 30-300 MHz 10-1 m
ultra high frequency UHF 300-3000 MHz 100-10 cm
super high frequency SHF 3000-30000 MHz 10-1 cm
extremely high
frequency
EHF 30000- 300 000
MHz
1-0.1 cm
Radar L band 1000-2000 MHz
Radar S band. 2000-4000 MHz
Radar C band 4000-8000 MHz
Radar X band 8000-12500 MHz
It will, however, be appreciated that these divisions are not 'watertight'
divisions and the characteristics of a particular band may overlap above and below
the demarcation frequency limit in the table.
The earth and its surround
Before we set out to discuss the type of propagation, the properties and the
ranges available in the above frequency bands, let us take a quick look at the
physical elements present on and around the earth.
First of all, the shape of the earth: it is approximately a sphere. This meansthat the horizon curves away with distance from the transmission point, and if the
radio waves travelled only in straight lines (as they would, by their basic property)
the reception ranges would be limited to 'optical' distance only. This distance is
given by the formula D = 1.0 SVH, where D is the range in nautical miles and H is
the height in it. Fortunately, we will soon see that radio waves do curve to a
greater or lesser extent with the surface of the earth and in the atmosphere, which
means that the above formula is seldom used.
The conductivity of the earth's surface itself varies: seawater provides a
medium of high conductivity whereas the conductivity of the land surface depends
on its composition. It is fairly high where the soil is rich loam, and very poor in
the sands of a desert or the polar ice caps. The terrain itself varies from flat plainsto tall mountains, from deserts to dense jungles.

8/10/2019 Gsp Vol i Radio Aids
http://slidepdf.com/reader/full/gsp-vol-i-radio-aids 16/232
Surrounding the earth, our atmosphere is rich in water vapour right up to the
height of the tropopause. Water vapour is the major cause of the weather and the
weather means precipitation, thunderstorms, lightning and so forth. Electrical
activity may be expected in any of these attributes of the weather. The other
characteristics of the atmosphere, pressure, density, temperature, all vary
continually, both horizontally along the surface and with height.And finally, well above the earth's surface we have electrically conducting
belts of ionised layers caused by the ultraviolet rays of the sun.
Radio waves travel best in the free space. On and around the surface of the
earth they are influenced to a varying degree by the factors discussed in the
preceding paragraphs. We will now study these influences in detail.
Propagation: Surface Waves
When electromagnetic waves are radiated from an omni directional aerial,
some of the energy will travel along the surface of the earth. These waves, gliding
along the surface are called surface waves or ground waves. As we learnt earlier,
it is the nature of radio waves to travel in a straight line. However, in appropriateconditions they tend to follow the earth's surface giving us increased ranges. But,
what causes them to curve with the surface?
Primarily there are two factors. One, the phenomenon of diffraction and
scattering causes the radio waves to bend and go over and around any obstacles in
their path (see Fig. 2.2). As the earth's surface is full of large and small obstacles,
the waveform is assisted almost continually to curve round the surface. The extent
of diffraction depends on the radio wave's frequency (see Fig. 2.3). The diffraction
is maximum at the lowest end of the spectrum and it decreases as the frequency is
increased. At centimetric wavelengths (SHF) an upstanding obstacle stops the
wave front, causing a shadow behind it. It is because of this effect that LF
broadcasts give good field strength behind a range of hills but there is no reception
on your car radio when going under a railway bridge.

8/10/2019 Gsp Vol i Radio Aids
http://slidepdf.com/reader/full/gsp-vol-i-radio-aids 17/232
This bending downward is further assisted (the other factor) by the fact that as
a part of the wave-form comes in contact with the surface it induces currents in it,
thereby losing some of its energy and slowing down. This is called surface
attenuation. This slowing down of the bottom gives the wave forms a forward and
downward tilt encouraging it to follow the earth's curvature (see Fig. 2.4).
Thus, bending due to diffraction and tilting due to attenuation (imperfect
conductivity of the surface) cause the waves to curve with the surface. Waves
continue until they are finally attenuated, that is, become undetectable.
Attenuation, in its turn, depends on three factors:
1) The type of the surface. As mentioned earlier, different surfaces have different
conductivities. For a given transmission power a radio wave will travel a longer
distance over the sea than over dry soil. For example an MF transmitter's range
over the sea is nearly double that over the land.
2) Frequency in use. The higher the frequency, the greater the attenuation (see Fig.
2.5).
3) Polarisation of radio waves. Vertically polarised waves are normally used withminimum attenuation.
In combating attenuation, we have no control over the surface over which the
propagation is to be made. The primary consideration therefore, is the choice of
frequency. We are now ready to summarise the ground ranges expected from
frequencies in various frequency bands.
VLF. Attenuation is least, maximum bending is due to diffraction. Given
sufficient power, ranges of several thousand miles may be obtained.
LF. Attenuation is less and the signals will bend with the earth's surface;
ranges to a distance of 1500 nm may be expected.
MF. Attenuation is now increasing, signals still bend with the surface and the
ranges are approximately 300 to 500 nm, maximum is 1000 nm over the sea.
HF. Severe attenuation, bending is least. The maximum range obtainable is
around 70 to 100 nm.
VHF and above. The signals do not bend and the radio waves travel in a
straight line, giving line-of-sight ranges.
8/10/2019 Gsp Vol i Radio Aids
http://slidepdf.com/reader/full/gsp-vol-i-radio-aids 18/232
Disadvantages at low frequencies.
Although low frequencies produce very long ranges there are considerable
drawbacks, which prohibit their inconsiderate employment.
1) Low efficiency aerials. Ideally the length of the transmitter and receiver aerials
should each be equal to the wavelength. An aerial approximately half the size of
the wavelength is also considered to be suitable for satisfactory operation. Anyfurther reduction in the aerial size would result in a loss of efficiency. The
largest aerials are found in the lowest frequency band -VLF.
2) Static is severe at lower frequencies and additional power must be supplied to
combat its effect. The effect of static decreases as the frequency is increased:
VHF is considered to be practically free from static.
3) Installation and power. The cost of initial installation is high and subsequent
power requirement to maintain the desired range giving satisfactory reception is
very large.
It should be noted that the range of a surface wave varies as the square root of
its power which may be written in the form of the equation:
Range (nm) = 3 ×√Power (watts)
Sky Waves
We have seen how surface waves may be transmitted to varying distances in
VLF to HF bands. In these bands, signals may also be received having first been
reflected from a huge reflecting layer surrounding the earth known as the
ionosphere. These reflected signals are referred to as sky waves and they form the
principal mechanism for long range communication.
The Ionosphere
The ionosphere is an electrically conducting sphere, completely surrounding
the earth. The ultra-violet rays from the sun impinging upon the upper atmosphere
cause electrons to be emitted from gas molecules. These free electrons are
believed to form a reflecting layer (positive ions would be too heavy to influence
electromagnetic waves). Because the absorption of the solar radiation is uneven at
different levels in the upper atmosphere, several distinct and separate layers, rather
than one continuous zone, are formed. They are given code names D, E and F (see
Fig. 2.6). During the period 1901-1930, the E layer was more commonly known as
the Kennelly-Heaviside layer, named after its discoverers. The presence of the F
layer was established simultaneously by E. V. Appleton in England and A. F.
Barnett in the USA and direct measurements were made in 1925, when the name F
layer was coined. At present, these belts may be identified either by the code letteror the layer names. Average heights of these layers are as follows, and there are
diurnal and seasonal variations.
D layer: 50-100 km, average 75 km
E layer:100-150 km, average 125 km
F layer:150-350km, average 225km.

8/10/2019 Gsp Vol i Radio Aids
http://slidepdf.com/reader/full/gsp-vol-i-radio-aids 19/232
The maximum daylight density of the E region is around 105 free
electrons/cm3. During the daytime the F layer may exist in two separate regions,
when the layers are called Fl and F2. The maximum value of the electron density in
the F layer is around 106/cm3. When they are separate, F2 is more persistent than
Fl. The electron density in the D, E and F layers varies with time of the day,
season of the year and geographical location, as explained below. The overall
variation in the E layer is relatively small, but abnormal, sporadic fluctuations may
occur all year round, but are more pronounced in summer months. Fluctuations in
the F layer are relatively large and irregular, more so during magnetic storms, sun-
spot activities and flares. Ionisation in these layers causes refraction, reflection and
attenuation of the radio waves, which we will now discuss.
Refraction
Since atmosphere and ionosphere constitute different media, a signaltravelling upward will be refracted. If the conditions are suitable it may bend
sufficiently to return to the earth. By the accepted usage, the process is called
ionospheric refraction. It should be noted that the waves may be refracted by the
lower layer and then further refracted by an upper layer. The wave may then return
or escape.
Density
The degree of refraction varies directly as the intensity of the ionisation. The
higher the altitude, the thinner the atmosphere. At a height of 60 km the
atmospheric pressure is about 0.35 millibars. At such altitudes the solar radiation
has a greater effect in breaking down the gas molecules than at lower altitudeswhere the atmosphere is denser. Electron density in the E layer is higher than in
the D layer; the density in the F layer is higher than in the E layer. Variations in
the density occur as follows.
Diurnal activity. In the daytime the solar radiation increases ionic density in
all layers and the reflective height moves down. As the sun crosses the meridian
the maximum density will be reached. At night as the sun goes below the horizon
the process of recombination begins. The D layer, being nearest to the earth and
having a relatively denser atmosphere, completely disappears. In the E layer the
intensity decreases and the reflecting height rises. The F layer similarly decreases
in intensity and finds an intermediate level as one single layer (Fig. 2.7). Sunriseand sunset produce unstable conditions, as the layers start falling or rising. These

8/10/2019 Gsp Vol i Radio Aids
http://slidepdf.com/reader/full/gsp-vol-i-radio-aids 20/232
are critical periods for the operation of the automatic direction finding equipment
(ADF).
Seasonal Activity. The amount of intensity depends on where the sun is with
regard to the position under consideration. There is maximum activity when the
sun is closest. Sporadic ionisation occurs in the E layer in summer.
11-Year Sun-Spot Cycle. Very marked changes in ionisation occur during
this sunspot activity period. This is due to enhanced ultraviolet and X-radiation
from the sun. At this time, ionisation in D and E layers causes an increase in
absorption disrupting communication, and signals at VHF frequencies may return.
Attenuation
As mentioned earlier, radio energy is absorbed in the ionosphere. The extent
of attenuation depends on various factors.1) Density of the Layer. The greater the density, "the greater the attenuation.
Maximum attenuation occurs around midday.
2) Penetration Depth. The deeper the signal penetrates into the layer, the more
loss of energy due to attenuation will occur.
3) Frequency in use. The lower the frequency, the greater the attenuation. This is
one of the reasons why a higher frequency is used for communication in the HF
band during the day.
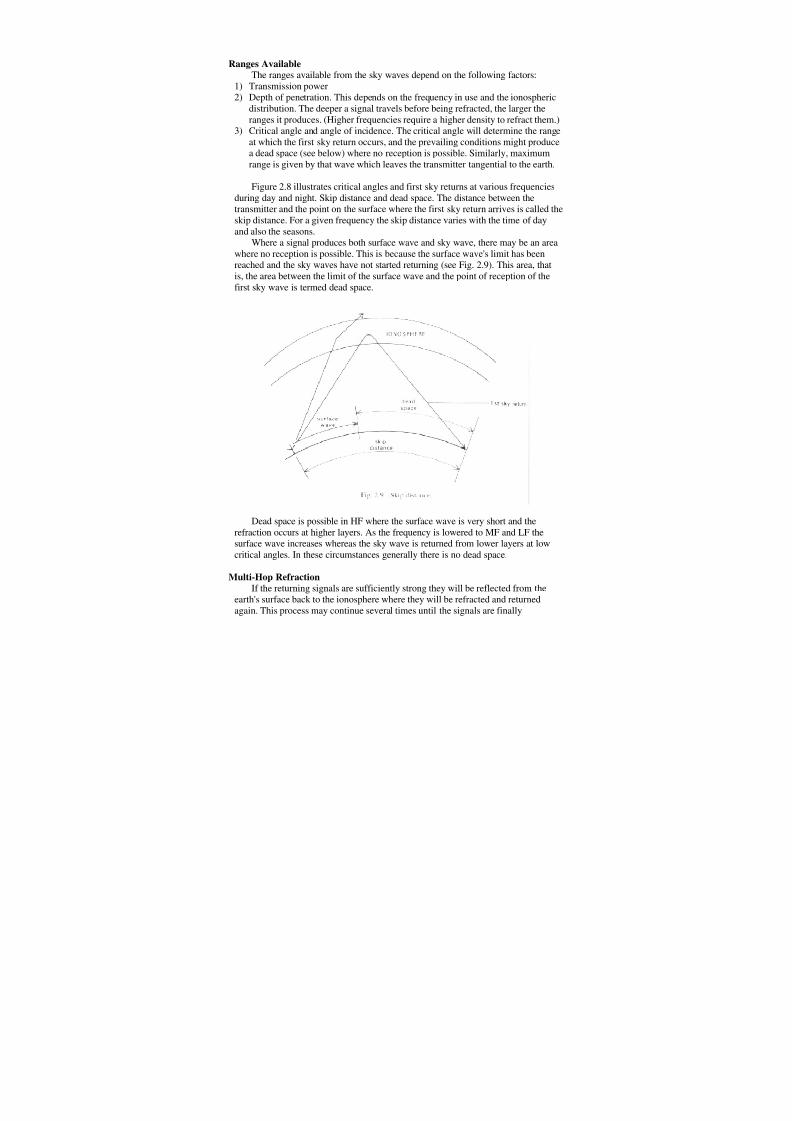
Conditions of Refraction
Critical angle. The angle at which the signal strikes the layer decides, among
other factors, whether the signal will return or not. If it strikes the layer at a small
angle to the perpendicular, it will not be refracted sufficiently to return. As this angle
of incidence is progressively increased, the signals will bend progressively more
until an angle is reached for a given frequency and ionospheric distribution when the
first reflection will occur. The angle this wave makes with the normal at the
transmission point is called the critical angle (see Fig. 2.8) and the returned wave is
called the critical ray or first sky return. At this angle, and higher than this, there will
be an uninterrupted flow of sky waves.

8/10/2019 Gsp Vol i Radio Aids
http://slidepdf.com/reader/full/gsp-vol-i-radio-aids 21/232
Frequency in use. A higher frequency requires a higher electron density to
refract it. As ionic density increases with height, higher frequencies will penetrate
more deeply into the layer than lower frequencies before returning.
The D layer is not heavily ionised and it will reflect only low frequencies - up to
around 500 kHz. For any planned usage of sky waves in this frequency band it
should be remembered that the attenuation is predominant.The E layer is relatively more heavily ionised and will reflect frequencies
up to around 2 MHz.
F layer. Frequencies higher than 2 MHz will not be sufficiently refracted in the
E layer to return. They will travel to the F layer before returning, thus giving very
long ranges. Above 30 MHz, that is VHF and above, the refraction in the layers is
insufficient and the signals escape into free space. (The UHF band is used for
communication with astronauts in the outer space.) An exception arises in the cases
of VHF and UHF during the high solar activity period when the ionisation is
extremely dense.
8/10/2019 Gsp Vol i Radio Aids
http://slidepdf.com/reader/full/gsp-vol-i-radio-aids 22/232
8/10/2019 Gsp Vol i Radio Aids
http://slidepdf.com/reader/full/gsp-vol-i-radio-aids 23/232
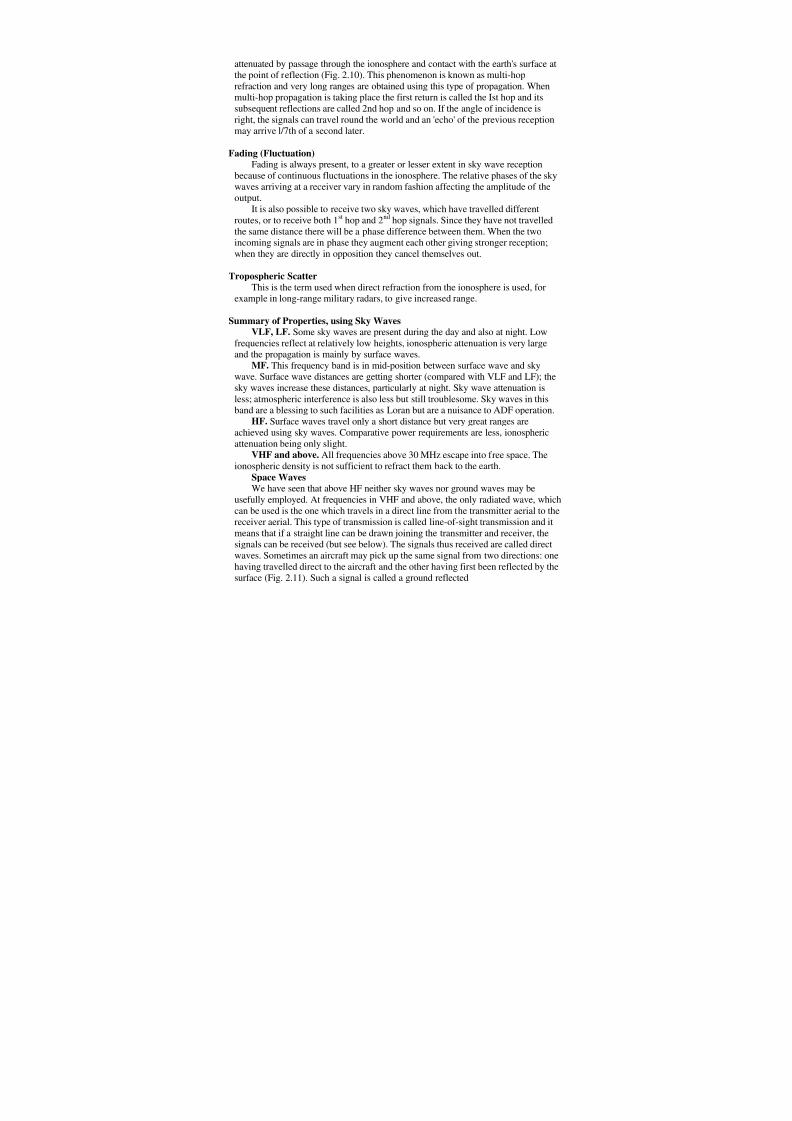
attenuated by passage through the ionosphere and contact with the earth's surface at
the point of reflection (Fig. 2.10). This phenomenon is known as multi-hop
refraction and very long ranges are obtained using this type of propagation. When
multi-hop propagation is taking place the first return is called the Ist hop and its
subsequent reflections are called 2nd hop and so on. If the angle of incidence is
right, the signals can travel round the world and an 'echo' of the previous receptionmay arrive l/7th of a second later.
Fading (Fluctuation)
Fading is always present, to a greater or lesser extent in sky wave reception
because of continuous fluctuations in the ionosphere. The relative phases of the sky
waves arriving at a receiver vary in random fashion affecting the amplitude of the
output.
It is also possible to receive two sky waves, which have travelled different
routes, or to receive both 1st hop and 2
nd hop signals. Since they have not travelled
the same distance there will be a phase difference between them. When the two
incoming signals are in phase they augment each other giving stronger reception;when they are directly in opposition they cancel themselves out.
Tropospheric Scatter
This is the term used when direct refraction from the ionosphere is used, for
example in long-range military radars, to give increased range.
Summary of Properties, using Sky WavesVLF, LF. Some sky waves are present during the day and also at night. Low
frequencies reflect at relatively low heights, ionospheric attenuation is very large
and the propagation is mainly by surface waves.
MF. This frequency band is in mid-position between surface wave and sky
wave. Surface wave distances are getting shorter (compared with VLF and LF); the
sky waves increase these distances, particularly at night. Sky wave attenuation is
less; atmospheric interference is also less but still troublesome. Sky waves in this
band are a blessing to such facilities as Loran but are a nuisance to ADF operation.
HF. Surface waves travel only a short distance but very great ranges are
achieved using sky waves. Comparative power requirements are less, ionospheric
attenuation being only slight.
VHF and above. All frequencies above 30 MHz escape into free space. The
ionospheric density is not sufficient to refract them back to the earth.
Space WavesWe have seen that above HF neither sky waves nor ground waves may be
usefully employed. At frequencies in VHF and above, the only radiated wave, which
can be used is the one which travels in a direct line from the transmitter aerial to the
receiver aerial. This type of transmission is called line-of-sight transmission and it
means that if a straight line can be drawn joining the transmitter and receiver, the
signals can be received (but see below). The signals thus received are called direct
waves. Sometimes an aircraft may pick up the same signal from two directions: one
having travelled direct to the aircraft and the other having first been reflected by the
surface (Fig. 2.11). Such a signal is called a ground reflected

8/10/2019 Gsp Vol i Radio Aids
http://slidepdf.com/reader/full/gsp-vol-i-radio-aids 24/232
Long-range communication -choice of frequency band
To achieve communication on the basis of global distances, the choice must
lie in the bands between VLP and HP, the frequency bands above HP being
'line-of-sight' propagation.
Starting at the lowest end, we could obtain very long ranges in the VLP
and LP bands and settle for one of them without further ado, but there are
some inherent disadvantages in the employment of these bands. Just two
requirements, of aerial and power alone are sufficiently forbidding to spur the
researchers to investigate alternative possibilities.
These possibilities are MP and HP. Of these two, HP is considered to be
far superior:
.aerials are shorter and less expensive to instal
.static noise is less than in MP and tolerable
.by using sky waves day and night, very long ranges are obtained for
relatively less power
.higher frequencies suffer less attenuation in the ionosphere
.efficiency is further increased by beaming the radiation in the direction of
the receiver.
In the early days of radio, experiments were made on the utilisation of long
waves for communication purposes, but the benefits of the short waves soon
became apparent and by the late 1920s he rush was on for short waves.
HF communication
The principle of HP communication relies on choosing a frequency appro-
priate for a given set of ionospheric conditions that will produce the first
return at the required skip distance from the transmitter. If the height of the
refracting layer is known, the ray's path from the transmitter to the receiver
via the ionosphere can be plotted and, from this, the angle of incidence the
ray makes at the ionosphere can be ascertained. The frequency to use, so that
the ray travels along this path, is derived from the knowledge of the angle of
incidence, 8, and the critical frequency, fc. The critical frequency is that
frequency which just starts to escape at vertical incidence to the ionosphere.
The mathematical'relationship between the two, fc x secant 8, gives us what
is called maximum usable frequency (MUP). This is the highest frequency

8/10/2019 Gsp Vol i Radio Aids
http://slidepdf.com/reader/full/gsp-vol-i-radio-aids 25/232
Communications
37
available for that predetennined distance, prevailing density and hei~t of
penetration. If it is increased any further, the signal will escape. If it is
lowered considerably, excessive attenuation will cause unacceptable power
loss. When this limit is reached, it is called the lowest usable high frequency
(LUHF).
In practice, graphs and nomograms are made available to the radio stations
from which this value is directly extracted. The graphs take into consideration
such factors as the station's position in latitude and longitude, time of the
day, season of the year, density of the ionosphere and any abnormal con-
dition prevailing and the distance at which the first sky return is required.
It will be appreciated that because of the diurnal variation in the ionospheric
density, if transmission is continued at night on daytime frequency, a wider
skip distance will result, leaving the target receiver in the 'dead space'. This is
because at night
(1) the reflection height increases, and the wave is returned from a higher
level, giving a greater skip distance
(2) the density of the layer decreases which requires the same wave to travel
still higher in denser density layers before being returned, giving the
same consequence as (1).
For these reasons, the working frequency is lowered at night. This lowering
of the frequency adjusts the skip distance because
.lower frequencies reflect from lower levels
.lower frequencies require a smaller critical angle.
It may be pointed out here that in lowering the frequency at night the signal
is not being subjected to an increased attenuation since the density is less at
night. In practice, the night frequencies are approximately half of the daytime
values.
On the matter of the choice of frequency, if you are calling a station
without success, but you are hearing another station which is at a greater
distance in the same direction, you are operating on a frequency which is too
high. The station you wish to contact is in the zone of skip distance. Lower
the frequency.
The frequency band allotted to commercial aviation ranges from 2 MHz to
22 MHz -in practical use it is limited to around 18 MHz. The ground stations
publish a number of frequencies for use, and the communication is generally
addressed to the A TCC or ACC. The service range depends on the require-
ment (around 1000nm). The transmission is amplitude-modulated and an
SSB emission is used to economise in power and channel space.
In the early days when MF/HF WT was in the forefront, aircraft were
equipped with a trailing aerial. It consisted of a coil of wire which was wound
out and held downward by a weight. Normally it disappeared at the first sight
of thunder or lightning. In another system a permanently fixed wire was used,
stretching the length of the fuselage. These aerials have now been replaced
by recessed aerials conveniently located to give an all-round reception.
8/10/2019 Gsp Vol i Radio Aids
http://slidepdf.com/reader/full/gsp-vol-i-radio-aids 26/232
38
Radio Aids
Because of the expense of the initial installation, use of HF RTF is limited
at present to the airlines and other large aircraft. Power-wise, a mere 100-
watt transmitter would provide transatlantic communication.
Factors affecting HF range
.Transmission power
.Time of the day; this governs the density and height of refraction
.Season of the year; this has bearing on the density
.Any disturbances in the ionosphere
.Geographicallocation
.Frequency in use; this determines the critical angle and the penetration
depth.
Short-range communication -choice of frequency band
The requirement here is to provide communication at 80 nm range at 5000 t
and 200nm at 20000ft. As these are very short ranges, frequency bands trom
VLF to HF may be ruled out.
Up the spectrum from VHF, it is best to choose the lowest frequency band
from the aerial consideration. The aerial requirement gets more complicated
as higher frequency bands are reached. Even in VHF, VOR employs a
special aerial whereas VDF is a ground installation. For a simple aerial as
used in RTF , the signal strength received at a given range is proportional to
the wavelength. Thus, a larger wavelength (i.e. lower frequency) would
provide a better field strength.
VHF communication
The VHF band is chosen for RTF communication at short ranges, the oper-
ative frequencies being kept at the lower end of the band, i.e., 117.975MHz
to 137.000MHz. Within this band, 760 communication channels are or will
soon be available at 25 kHz separation. The transmission is amplitude-
modulated, the type of emission being A3E. A transmitter producing 20 watt
power would be considered quite adequate for maximum ranges. In the early
1990s, the former upper limit of 136.000MHz was extended to 137.000MHz
and in the European region (EUR) it was agreed that to relieve acute
channel availability problems, the extra 40 channels thus available would be
used as follows:
(1) the first 32 channels (136.025-136.775MHz inclusive) for national and
international A TC purposes
(2) the next four channels (136.800-136.875 MHz inclusive) for international
operational control
(3) the top four channels (136.900-136.975MHz inclusive) reserved for
datalink purposes (see chapter 11).
VHF is practically free from static, but being vertically polarised, the
signals do pick up some background noise. If absolute clarity of reception is

8/10/2019 Gsp Vol i Radio Aids
http://slidepdf.com/reader/full/gsp-vol-i-radio-aids 27/232
39
required, the choice should be shifted to UHF where room may be available
to accommodate FM sidebands.
Factors affecting VHF range
(1) Transmission power both at aircraft and ground station.
(2) Height of the transmitter .
(3) Height of the receiver .
(4) Obstacles at or near the transmission site will block the signals or scatter
them with inevitable attenuation.
(5) Any upstanding obstruction in the line of sight between the aircraft and
the ground station will have an effect similar to (4) above.
(6) In certain circumstances the aircraft may receive both direct and ground
reflected waves which may cause fading or even short term loss of
communication .
Selective calling system (SELCAL)
This system of communication relieves a pilot from the tiresome task of
maintaining a continuous listening watch on the RTF while in flight. It is most
beneficial when an aircraft is flying in peaceful areas, e.g. on a long ocean
crossing, where the only need for the RTF is to make its periodic position
reports. The advantage of the facility is taken by installing a SELCAL
receiver in the aircraft. The Air Navigation Order prescribes rules with
regard to its use.
(1) The ground station is informed that you intend to use SELCAL
(2) the ground station must not raise any objection, and
(3) the particular ground station is notified as capable of transmitting
SELCAL codes.
For its use outside of the UK ensure that the ground station concerned is
designated as transmitting a signal suitable for the purpose.
A TC must be informed of the codes carried in the aircraft and a preflight
functional check must be carried out. If at this stage or at any stage en
route it is thought that either the ground or the airborne equipment is
unserviceable, listening watch must be resumed.
When on SELCAL, if the ground station wishes to contact you, it will
transmit a group of two coded tone pulses. The decoder circuit will accept the
signal if it is meant for it, and activate the cockpit call system by flashing a
lamp or by ringing a bell or a combination of both.
Secondary surveillence radar (SSR)
Secondary surveillance radar is another method of communication from A TC
to the aircraft. With the use of SSR, A TC derives an aircraft's identity, flight
level and follows its track. For fuller information on SSR see chapter 11.

8/10/2019 Gsp Vol i Radio Aids
http://slidepdf.com/reader/full/gsp-vol-i-radio-aids 28/232
40
Radio Aids
Aircraft communications addressing and reporting system (ACARS)
Usually operating in conjunction with an aircraft's flight management system
(FMS) (see Ground Studies for Pilots Volume 3), ACARS is a communi-
cations datalink system between the airline's ground operations base and its
aeroplanes. It uses the aircraft's VHF communication system to send and
receive information. Usually this will be the No.3 VHF and dedicated just to
the ACARS. However some systems have the No.3 VHF with an additional
VOICE/DATA selector switch. When switched to VOICE the system is used
just as any other VHF communication channel. When switched to DATA,
the ACARS handles the downlink from the aircraft and the uplink from the
ground station to the aircraft.
For the student pilot, air/ground/air messages usually relate just to ATC
matters but on a commercial flight with several hundred passengers on
board, messageson the 'company channel' are common concerning passenger
services, maintenance services, fuel state and so on. With ACARS, the
spoken messageswhich would have had to be made by the crew are replaced
by a compressed format which is transmitted in about a second in the
downlink. The message can be an automatically compiled report or one
prepared by the pilots on the control and display unit (CDU) of the FMS.
Very basic ACARS messages for example are the routine Out Off On In
(0001) times, generated and transmitted:
Out -at the time the aircraft leaves the stand, with doors shut and the
parking brake released
Off -at take-off when the main gear moves to the retracted position
On -on touchdown when the aircraft's weight is on the wheels
In -at the terminal unloading bay, parking brake on and a door opened.
Depending upon the company policy some ACARS equipment can auto-
matically transmit routine reports (without involving the flight crew at all)
as frequently as the operator needs. Typical routine reports include aircraft
and crew identification, flight plan and current flight conditions, engine per-
formance, fuel state, systems performance, maintenance items and passenger
services.
When the operator uses the ACARS uplink, it may well be able to obtain
the required information from the FMS computer. If it does require an input
from the flight crew, the SELCAL link alerts the crew. The pilots then read
the message displayed on the FMS CDU and respond via the downlink.
Aircraft may have a printer to print out messages o pilots.
With the congestion that occurs on VHF, even transmitting a one-second
formatted ACARS message may coincide with another transmission on the
dedicated ACARS frequency. A management unit (MU) in the aircraft
ACARS will check that the channel is free before starting its transmission,
but if two aircraft do transmit simultaneously the messages received will be
garbled. If this occurs repeatedly, the FMS will display NO COMM to
the crew. Otherwise both downlink and uplink messages are automatically
acknowledged within both ACARS airborne and ground units.

8/10/2019 Gsp Vol i Radio Aids
http://slidepdf.com/reader/full/gsp-vol-i-radio-aids 29/232
c ommunications
Communication via satellite (SATCOM)
Although once it was a novelty we now regularly see on our televisions,
programmes beamed to our homes via satellites. Aviation is also a satellite
user for communication, primarily through INMARSAT. There is a con-
stellation of geostationary satellites provided by the International Maritime
Satellite Organisation for the relaying worldwide of telecommunications for
aviation, shipping, and land mobile users. In fact, with the geostationary
satellites over the equator, worldwide effectively means in all longitudes,
between BOoNand BOoS Fig. 3.1).
Legislation on the use of radio
The provisions (paraphrased) below, are prescribed in the Air Navigation
Order:

8/10/2019 Gsp Vol i Radio Aids
http://slidepdf.com/reader/full/gsp-vol-i-radio-aids 30/232
42
Radio Aids
(1) An aircraft radio may not be operated either on the ground or in flight
unless it is licensed and only by a licensed or permitted person and only
in accordance with the terms of the licences/permission.
(2) In flight a continuous radio watch must be kept on the radio communi-
cations apparatus by a crew member or by SELCAL (subject to the
conditions for SELCAL already listed).
(3) Radio or radio-navigation equipment must be operated by flight crew as
instructed by ATC or as the notified procedure.
(4) Aircraft radio must not be operated so as to cause interference with
communication or navigation services and emissions must not be made
except as follows:
(a) emission class and frequency must be appropriate to the airspace in
which the aircraft is flying
(b) distress, urgency and safety messages
( c) messagesand signals relating to the flight of the aircraft
(c) such public correspondence messages as are permitted under the
aircraft radio station licence.
(5) A telecommunications log book must be kept if radio communications
are made by WT .
(6) In a public transport aircraft registered in the UK, the flight crew may
not use a hand-held microphone for RTF (or intercom in the aircraft)
whilst flying in controlled airspace below FL 150 or while the aircraft is
taking off or landing.
Test questions
(1) Give the main factors which affect the range of ground-to-air com-
munication in:
(a) HF band (b) VHF band.
(2) Explain why day and night frequencies are different in HF.
(3) Radio ducting is of most significance on the frequency bands:
(a) VLF to MF (b) VHF and above (c) MF and HF.
(4) The MUF between two specified places at a particular time is:
(a) the frequency which gives the least radio interference
(b) the maximum frequency which can be used
(c) the maximum frequency which is reflected by the ionosphere.
(5) Heading 27O"T around dawn with a choice of two frequencies of 9 MHz
and 5 MHz for HF communications, to contact a station it would be
better to use:
(a) 9 MHz for the station ahead
(b) 5 MHz for the station behind
(c) 5MHz for the station ahead.
(6) For a given HF frequency, skip distance will normally:
(a) have no diurnal variation

8/10/2019 Gsp Vol i Radio Aids
http://slidepdf.com/reader/full/gsp-vol-i-radio-aids 31/232
c ommunications
43
(b) be greater by night than by day
(c) be greater by day than by night.
(7) Which of the following bands of radio frequencies is known as MF:
(a) 30-300MHz (b) 10-30kHz (c) 300-3000kHz.
(8) ACARS stands for:
(a) Atlantic crossing automatic reporting system
(b) Aircraft communication addressing and reporting system
(c) Air crew automatic reporting system.
(9) When the aircraft's No.3 VHF is fitted with a VOICE/DATA switch,
to use ACARS the switch position to select is:
(a) DATA (b) ON (c) VOICE.
(10) SATCOM uses INMARSAT satellites which are:
(a) polar orbiting (b) geostationary ( c equatorial orbiting.
8/10/2019 Gsp Vol i Radio Aids
http://slidepdf.com/reader/full/gsp-vol-i-radio-aids 32/232
A ground station can be equipped for taking a bearing of an aircraft on that
aircraft's transmission. In earlier days such a service operated in MF, HF and
VHF bands. In the UK this service now only operates in the VHF band, that
is, the normal communication band of 118 to 137MHz. Service in other
bands still exists in certain parts of the world and, where applicable, relevant
information such as frequency in use, range and accuracy is found in the
Aerad Flight Guide.
When the service is required, the procedure is to call up the station on the
appropriate RTF channel. Frequencies are given in the COM section of the
UK aeronautical information publication (Air Pilot) (UKAIP).
Services
A ground DF station can give true or magnetic bearings as follows:
QTE -aircraft's true bearing from the station
QUJ -aircraft's true track to the station
QDR -aircraft's magnetic bearing from the station
QDM -aircraft's magnetic heading to steer in zero wind to reach the
station.
QTEs and QDRs are normally used in en route navigation as position
lines. QDMs are requested when. the pilot wishes to home to the station.
QUJ is generally only known to academics.
In addition to the above, if you want a series of bearings or headings to
steer (as for example you are homing to a station), the service you request is
QDL. Where a three-station triangulation service exists (none in the UK at
present, except on your MA YDA Y or PAN calls), you may request a QTF.
The station will take a fix on you and pass it to you in latitude and longitude
co-ordinates or bearing and distance from a recognisable landmark, town,
facility, etc.
Direction finding (DF) stations can refuse to give bearings if the conditions
are poor or the bearings do not fall within the classified limits of the station.
In this case, the controller will give his reason for the refusal.

8/10/2019 Gsp Vol i Radio Aids
http://slidepdf.com/reader/full/gsp-vol-i-radio-aids 33/232
Ground Direction Finding (VDF)
45
Classification of bearings
According to the judgment of the operator the bearings are classified as
follows. When the controller passes the bearing to the pilot he adds this
classification to it, e.g. 'your true bearing 247°, class alpha'.
Class A -accurate to within :t 2°.
Class B -accurate to within :t 5°.
Class C -accurate to within :t 10°.
Class D -accuracy less than Class C.
Scope of the service
There are many automatic VDF stations whose purpose is purely to assist in
radar identification for ATC purposes. These stations are not listed in the
AlP for the obvious reason that they do not provide a normal DF service to
the aircraft. The stations that are listed in the AlP provide normal 'homer'
service and they are listed as such. Generally the class of bearing is not better
than class B. Automatic VDF stations are not to be used as en-route navi-
gation aids but their service is available to the fullest extent in case of
emergency or where other essential navigation aids have failed.
Automatic stations (homers as well as those established for radar ident
purposes) utilise a cathode ray tube for bearing measurements. With this type
of equipment, the aerial is rotated in response to the incoming transmission
and the direction of the received wave is displayed on the tube instantaneously.
On the tube, the transmission appears as a trace and the bearing is read
off against a scale. The main advantage here is that only a very short
transmission is required -just long enough to read off the bearing.
Ranges available
Being VHF transmission, the range will primarily depend on the height of the
transmitter and the receiver, that is, the line-of-sight range. Other factors,
e.g. power of the ground and airborne transmitters, intervening high ground,
etc. , will also affect the range. Further, as explained in an earlier chapter, the
aircraft may receive both the direct wave and the ground reflected wave in
which case fading might be experienced or even the signals may be lost
completely. But this situation would not linger too long and a satisfactory
two-way communication would soon be restored.
Factors affecting accuracy
If an aircraft's transmission for a true bearing has been reflected by either
uneven terrain or obstacles through its travel to the receiver or by objects on
the site, the aerial will read a wrong direction. Thus, propagation error and
site error will affect the accuracy. Poor accuracy is also obtained when nearly
overhead the station, as there is a cone of no bearing.
The aircraft's attitude when transmitting signals may also affect the results.
As you will remember, in general aviation, VHF communication transmission

8/10/2019 Gsp Vol i Radio Aids
http://slidepdf.com/reader/full/gsp-vol-i-radio-aids 34/232
46
Radio Aidl\'
is vertically polarised. Best results are obtained when the transmission arriv-
ing at the ground DF aerial is vertically polarised. When an aircraft is in an
attitude such that its transmission aerial is in the horizontal plane, the trans-
mitted signals will be horizontally polarised and no signals will be received. In
between the two extremes, poor reception on the ground may give poor
results.
The effect due to coastal refraction on VHF is negligible.
VHF let-down service
The VHF let-down service, available throughout the world, has the primary
advantage that the aircraft does not require any specialist equipment to carry
out a let-down. The stations which provide this service are listed in the COM
section of the UKAIP where you also extract frequency and the callsign.
Details of the procedures are published by Aeradio and other aviation pub-
lishers. These details are also found in the RAC section of the AlP and it
should be consulted whenever any details on terminal approach procedures
(TAP) are not clear.
Two types of procedure are in current use: the VDF procedure and the
QGH procedure. Generally, the VDF procedure is available and the UKAIP
annotates in the remarks column against the station where QGH may be
carried out. Where both procedures are available at the same station, the let-
down pattern is usually the same.
For a VDF let-down, the pilot calls the station and requests VDF. The
pilot is subsequently given a series of QDMs which he uses to achieve the
approach pattern for landing, as published in the aerodrome landing chart.
With the QGH procedure the pilot is given headings to steer instead of
QDMs. Based on the pilot's frequent transmission, the aircraft is first homed
to the overhead (aerial) position at correct height. This height is the lowest
available flight level or the safety altitude. When overhead the pilot will be
given instructions for descent on the timed outbound leg. The aircraft will
turn inbound on completion of this leg and further instructions to decision
height will follow. Heading corrections will be given on the inbound leg until
the pilot is in visual contact.
Test questions
(1) On a VHF let-down, the controller passes a true bearing of 127° class
Bravo. The class Bravo means that the bearing is accurate to within:
(a) ::t2° (b) ::t5° (c) ::tl0°.
(2) VHF range for a VDF let-down is:
(a) 3 x vHeight (ft) (b) 1.5 x vHeight (ft) (c) line-of-sight.
(3) QTE means:
(a) aircraft's true track to the station
(b) aircraft's true bearing from the station
(c) aircraft's magnetic bearing from the station.

8/10/2019 Gsp Vol i Radio Aids
http://slidepdf.com/reader/full/gsp-vol-i-radio-aids 35/232
Ground Direction Finding (VDF)
47
(4) When using VDF, errors:
(a) are primarily due to coastal refraction
(b) are nil because VHF transmissions are line-of-sight
(c) occur mainly due to the homer siting.
(5) The Q-code for an aircraft's magnetic heading to steer to reach the
station in zero wind is:
(a) QDM (b) QDR (c) QTE.

8/10/2019 Gsp Vol i Radio Aids
http://slidepdf.com/reader/full/gsp-vol-i-radio-aids 36/232
In navigation, when plotting radio bearings, care is required in deciding who
does the work; the pilot in the aircraft or the operator on the ground. Here
we deal with the aircraft getting a bearing on a ground-based radio station.
Ground radio stations providing such a facility are known as nondirectional
beacons (NDBs).
NDBs transmit vertically polarised signals in the MF/LF band. They radiate
equally in all directions, hence their name. An aircraft carrying associated
ADF equipment can tune in to a station on its published frequency and can
measure the direction of the incoming ground waves. The datum for the
direction measurement is taken from the nose of the aircraft and therefore,
the ADF indications are relative bearings. On modern equipment these bear-
ings are displayed automatically (ADF) and when fed to a radio magnetic
indicator (RMI), QDMs are indicated. Additionally, on some automatic
equipment, a facility is provided to obtain bearings manually and to check the
sense.
A loop aerial is used in the aircraft to determine the direction of the
ground transmitter. In an aerodynamically smooth aerial unit, it is made up
of a number of strands of wire (to give them an ideal aerial length) wound
round a frame, and is mounted in the most suitable position on the fuselage.
The aerial itself may be rotatable or fixed, depending on the type of equip-
ment, but modern installations usually have integrated ADF loop/sense an-
tennae with a single cable coupled to the flight deck. Such models have a
fixed cross loop system with a motor-driven goniometer in the receiver. These
have the advantages of allowing an almost flush aerial mounting and all of the
moving parts within the receiver .
Loop theory -rotatable loop
The vertical members of the loop are designed to pick up the signals. When
the plane of the loop is parallel to the direction of the vertically polarised
NDB radiation, signals will be picked up by the two vertical arms. There will
be a phase difference between the signals arriving in the two arms because of
the distance between them. This will cause a current to flow in both arms.
These signals in the two arms are in opposition round the loop and therefore,

8/10/2019 Gsp Vol i Radio Aids
http://slidepdf.com/reader/full/gsp-vol-i-radio-aids 37/232
ADF and NDBs
49
Side elevation
Plan
A B
'I
/
/
.~~~~-1~'
~ A (a) (b) (c)
I -E --maximum loop turned zero current
-resultant to the current reduced current ('null')
receiver (max)
Fig.5
Loop aerial.
the signals (or voltage) finally passed to the receiver will be the difference
between the two, see Fig. 5.1. Notice that with the loop in position (a)
the distance between the two arms is at a maximum. Therefore the phase
difference and the resultant current flow to the receiver is also at a maximum.
If the aerial is now rotated through 90°, both arms will face the transmitter
together and the incoming wave will reach them at the same instant, that is,
at the same phase (Fig. 5.1 position (c)) and the resultant current flow is nil.
Thus, as the loop is rotated from position (a) to position (c) the current
flow is reduced from maximum to nil. Therefore at any intermediate angle
(b) the current flow is a function of the cosine of the angle the aerial makes
with the incoming wave.
If the loop is further rotated beyond 90°, current will start flowing again,
but in the reverse direction. If a polar diagram is traced out showing the
signal strength produced by the loop at different angles through 360°, the
result is a figure of eight, see Fig. 5.2.
D
--+
x
\
,c
7'-
""
A'
A
"
~
C'
x
-
~+---
D'
Fig.5.2 Polar diagral

8/10/2019 Gsp Vol i Radio Aids
http://slidepdf.com/reader/full/gsp-vol-i-radio-aids 38/232
50
Radio Aids
In Fig. 5.2, xy is the loop, with its centre at 0, and A to F and A' to F'
are various positions of an NDB at 30° intervals. With the transmitter in
position A, the loop is lying parallel to the incoming wave, X end leading, the
current produced is at a maximum. Plot this as a vector, one unit in length,
distance Oxl in Fig. 5.2.
In position B, the current induced is shown by vector Ox2 and its value is
0.86 vector units. In position D, cosine of 90° is 0, and when the transmitter is
at E, cosine of 120° is -0.5. As you go through 360° you will have traced out
a figure of eight, half of it will be positive and the other half, negative.
The polar diagram has two positions where maximum signals are being
received (A and A ') and two positions where no signals are being received
(D and D'). The zero strength positions are known as null positions.
When establishing the direction of the ground station, the loop can be
aligned so that the plane of the loop is parallel to the incoming signal, that is,
the loop-transmitter relationship as in position A. This is done by turning the
loop until maximum signal strength is heard, and calling that the direction
of the station. The disadvantage of ascertaining the station direction from
maximum signal is that the field strength on either side of the maximum falls
very slowly and consequently the determined direction can be in error .
For this reason the null position is used to determine the transmitter
direction. Nearer 90°, (loop-transmitter relationship as at D) the value of
cosine falls rapidly and a total null is more easy to recognise than a total
maximum. However, it should be noted that just as a total maximum may
occur at A or A " the null may occur when the transmitter is in the D or D'
position. In other words, there is a 180° ambiguity in the bearing indication.
This is resolved by the use of a sense aerial. It is an omni-directional aerial
and its polar diagram is a circle, the radius of which is electronically adjusted
to fit on top of the figure-of-eight polar diagram. To resolve the ambiguity
these two fields are mixed together. The resultant polar diagram is a heart-
shaped figure, called a cardioid (Fig. 5.3). It will be noticed that a cardioid
has only one null position, even though it is somewhat 'blunter' than the null
positions appropriate to D and D' of Fig. 5.2.
loop aerial
alone
~
loop and omnidirectional
aerials
"
"
"
,
vertlcB BerlB
alone
Fig.5.3 Cardioid polar diagram.
/
Resultant Cardioid
polar diagram from
combined aerial system
/
~
~
\
+
--"I

8/10/2019 Gsp Vol i Radio Aids
http://slidepdf.com/reader/full/gsp-vol-i-radio-aids 39/232
ADF and NDBs
51
Loop theory -fixed loop
In the Bellini- Tosi method of direction finding, the system uses an omni-
directional sense aerial and a pair of fixed loops at right angles to each other:
one loop with its axis in the fore and aft plane, the other in the athwartships.
These loops are connected to the field coils (stator) of a goniometer and the
current in these coils sets up a field about a rotor. The direction of the field is
related to the direction of the incoming signal.
If the rotor coil lies at 90° (null position) to the resultant magnetic field in
the stator, the system is in balance. When the rotor is not at the null position,
a current is induced in the rotor. This activates a motor which drives the rotor
the shortest way to the null position.
Resolution of ambiguity
When the equipment is functioning on ADF, 180° ambiguity is automatically
resolved for you. In one system a pattern of 'switched' cardioids is produced
by combining the output of an omni-directional sense aerial and alternating
the connections rapidly.
The signal output from the cardioids governs the voltage applied to two
uni-directional motors geared to the loop. The left-hand cardioid influences
one motor, the right-hand cardioid the other. The motors turn in opposite
directions and by means of the differential gear they rotate the loop in the
appropriate direction.
When the loop is in the equi-signal position, the differential output is zero
and the pointer is steadily indicating correct direction. This steady indication
has a slight hunt about its mean position. This has two benefits. It ensures
that the ambiguity cannot exist; if the pointer was indicating 180° out, as the
needle departed from its mean position a voltage would be induced in one of
the motors and would drive the needle through 180° to the correct null. The
other benefit is that the steady movement of the needle about a mean
position is an indication that the ADF is working and a good bearing is being
displayed. Excessive hunt would develop when the incoming field strength is
Rei Brg increase
-:§Z he station
is to stbd
;(f) Rei Brg decrease
Ihe slalian
is la parI
*
initial ~
Rei Brg .+
~initial
~ Rei erg
Fig.5.4 Resolution of ambiguity.

8/10/2019 Gsp Vol i Radio Aids
http://slidepdf.com/reader/full/gsp-vol-i-radio-aids 40/232
52
Radio Aids
weak or the signal/noise ratio is low. With experience the operator is able to
assess he degree of accuracy of the indications.
Occasionally, in conditions of heavy static or interference from a powerful
transmitter on a nearby frequency it might be advantageous to operate on
manual loop if this facility is available on the equipment. The loop aerial is
turned manually until it arrives at the null position, but the indication must
then be checked for sense.
Ambiguity may be resolved from knowledge of the OR position. You can
also resolve it by observing changes in bearing with time. Unless you are
homing directly to a station (or away from it) the bearings increase or
decrease as the flight progresses. Study Fig. 5.4 which is self-explanatory .
Coverage of NDB transmissions
The rated coverage of NBDs in the UK is noted in the COM section of the
UKAIP. Within this area the field strength of the wanted signals to unwanted
signals exceeds the minimum value specified. ICAO recommends this value
to be 15 dB but no less than 10 dB, a 3: 1 protection ratio. This protection
takes into consideration the average atmospheric noise in the geographical
area concerned but not the presence of sky waves at night.
The rated coverage of an NDB depends on the frequency, transmission
power and the conductivity of the path to the coverage boundary .These
three factors, being measurable, enable the planners to establish the facilities
by controlling the output power and allocating frequencies. The lowest field
strength (ICAO recommendation is 70 microvolts/metre in Europe) will be
received at the boundary .
Types of NDBs
Locators. These are low powered NDBs in the LF/MF band, usually installed
as a supplement to ILS and located at the sites of the outer and middle
markers. A locator has an average radius of rated coverage of between 10
and 25 nm. The type of emission is NON A2A and they identify by a two or
three-Ietter morse group at seven words per minute once every ten seconds.
During the ident period the carrier remains uninterrupted to ensure that the
pointer does not wander away. The ident is effected by on/off keying of the
amplitude-modulating tone.
Homing and holding NDBs. These are intended primarily as approach and
holding aids in the vicinity of aerodromes, with rated coverage of around
SOnm. The class of emission and method of ident are similar to the locators.
En-route and long-range NDBs. These provide en-route coverage along the
airways and a long-range bearing facility for ocean trackin~ and similar
8/10/2019 Gsp Vol i Radio Aids
http://slidepdf.com/reader/full/gsp-vol-i-radio-aids 41/232
ADF and NDBs
53
operations. The NDB at Cocos Island may be heard from several hundred
miles.
The recommended type of emission is NON A2A unless the required rated
coverage is not practicable because of interference from other radio stations
or high atmospheric noise or other local conditions, in which case NON AlA
emission may be used. With this type of emission the identification is effected
by on/off keying of the carrier (during which period the pointer may wander
away), and the NDB identifies at least once every minute.
The amplitude-modulating signal causing identification for NON A2A
emission is either a 1020Hz or a 400 Hz tone.
The choice of frequency band
The requirement is to produce surface ranges of intermediate order .
Frequency bands from VHF and above, being line-of-sight propagation,
may be ruled out from consideration. HF would produce a very short ground
wave, and the sky waves would interfere with the ADF operation day and
night. VLF installation and running costs are high and require large aerials.
Static noise is excessive.
The frequency bands chosen are upper LF and lower MF. In these ranges,
aerial requirements are acceptable, static is less severe than VLF, there is no
interference due to sky waves during the day time and the bands are ideally
placed to produce the required ranges.
Frequencies
Although the frequencies are allotted from LF/MF, by convention an NDB is
an MF aid. Frequencies assigned by ICAO are from 200kHz to 1750kHz. In
the UK and Europe, NDB frequencies are normally found between 255 kHz
and 455 kHz.
Functional checks
ICAO provides for monitoring of NDBs for radiated carrier power (not
allowed to fall below 50% ), failure of identification signals, failure of the
monitor itself or other malfunctioning. In the UK the NDBs are not regularly
monitored but functional checks of NDB and locators are carried out at eight
hour intervals during the period of service.
Automatic direction finder (ADF)
The ADF is a radio receiver that is able to identify the direction from which a
signal is being received. It uses a loop aerial to determine the direction and a
sense aerial to resolve the 180° ambiguity. An aircraft equipped with ADF
may 'home' to the transmitter or use it as an aid to navigation. The relative
bearings are displayed on the relative bearing indicator (RBI) and QDMs are
indicated on an RMI.
Although there are many varieties of ADF, which used to be called 'radio

8/10/2019 Gsp Vol i Radio Aids
http://slidepdf.com/reader/full/gsp-vol-i-radio-aids 42/232
54
Radio Aids
compass', on the market they are all basically the same. The main com-
ponents of the system are:
.a radio receiver operating in the LF and MF bands
.a control box
.a shielded fixed or rotatable loop aerial
.a non-directional aerial
.one or more indicators.
Typical control units are shown in Figs. 5.5 and 5.6.
Fig. 5.5 ADF control unit.
Controls
The ADF control units illustrated in Figs. 5.5 and 5.6 cover just about every
type of control on ADF equipment. Not all ADFs have all the same facilities.
Function switch. The number of positions for a function switch varies with
the equipment. The purposes of the various positions are as follows:
(1) Off position. This is the normal position when the ADF is not in use.
(2) ANT. In this position the sense aerial is in the circuit and tuning of the
station is carried out in association with the frequency band selector
and the selectivity switch(es). This switch is variously named as REC
(receiver), ANT (antenna), OMNI or SENSE.
(3) ADF. In this position both sense and loop aerials are in operation and
the ADF gives a continuous indication of the bearing of the station to
which the receiver is tuned. This position is also known by other names,
e.g. COMP .
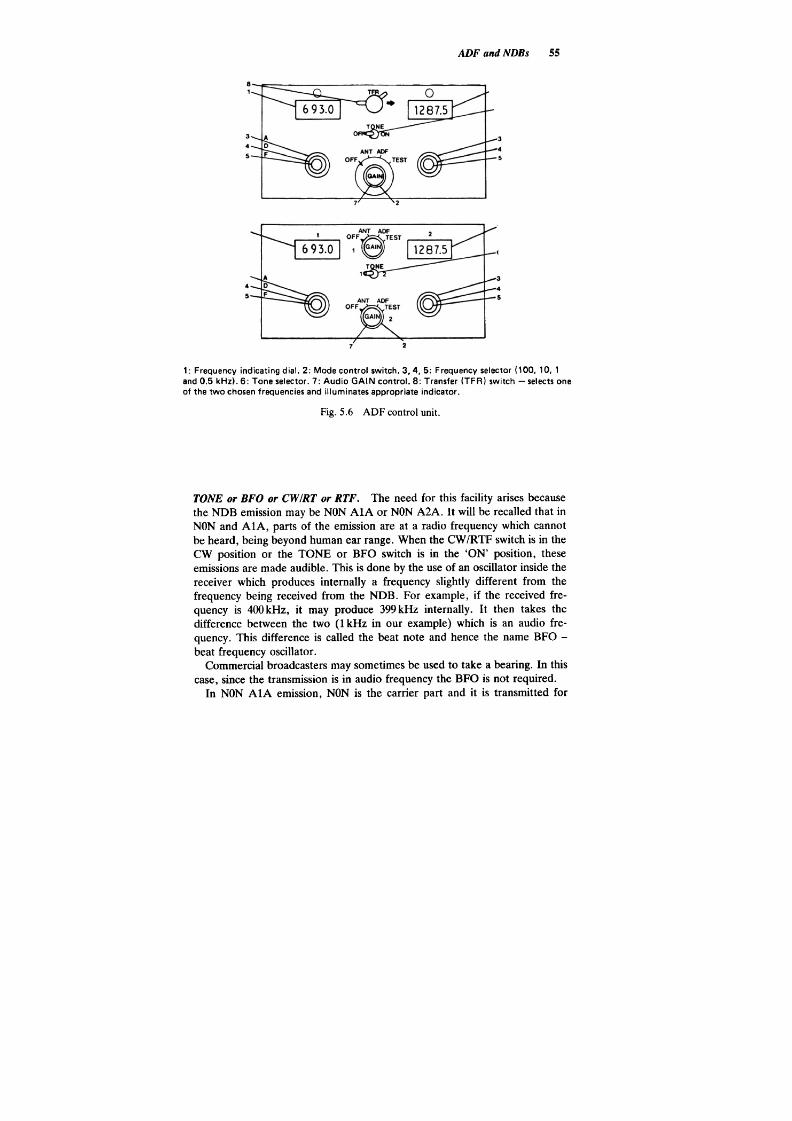
8/10/2019 Gsp Vol i Radio Aids
http://slidepdf.com/reader/full/gsp-vol-i-radio-aids 43/232
55
DF and NDBs
1: Frequency indicating dial. 2: Mode control switch. 3, 4, 5: Frequency selector (100, 10, 1
and 0.5 kHz) .6 : Tone selector. 7: Audio GAIN control. 8: Transfer (TFR) switch -selects one
of the two chosen frequencies and illuminates appropriate indicator .
Fig. 5.6 ADF control unit.
TONE or BFO or CW RT or RTF. The need for this facility arises because
the NDB emission may be NON AlA or NON A2A. It will be recalled that in
NON and AlA, parts of the emission are at a radio frequency which cannot
be heard, being beyond human ear range. When the CW /RTF switch is in the
CW position or the TONE or BFO switch is in the 'ON' position, these
emissions are made audible. This is done by the use of an oscillator inside the
receiver which produces internally a frequency slightly different from the
frequency being received from the NDB. For example, if the received fre-
quency is 400 kHz, it may produce 399 kHz internally. It then takes the
difference between the two (1 kHz in our example) which is an audio fre-
quency. This difference is called the beat note and hence the name BFO -
beat frequency oscillator .
Commercial broadcasters may sometimes be used to take a bearing. In this
case, since the transmission is in audio frequency the BFO is not required.
In NON AlA emission, NON is the carrier part and it is transmitted for

8/10/2019 Gsp Vol i Radio Aids
http://slidepdf.com/reader/full/gsp-vol-i-radio-aids 44/232
56
Radio Aids
about 10 seconds; it is then interrupted to give the AlA part, which is the
ident and may last for around 5 seconds. During the ident breaks the pointer
may wander away. For this reason NON AlA emission is not in favour with
ICAO and the long range NDBs generally give idents at longer intervals to
minimise breaks.
Similarly NON A2A emission is again an unmodulated carrier for about ten
seconds but the ident part, A2A, is an amplitude-modulated carrier. The
ident lasts a few seconds and generally the carrier is not broken during ident
period.
Filter. If fitted, this position is used to reduce the amount of spurious
background noise.
Uses of ADF
(1) As an en-route navigation aid, position lines may be obtained. Ey taking
two or three bearings on the same or different NDEs, fixes are obtained.
(2) Flying airways -there are many airways in the world still marked by
NDEs.
(3) A fix is obtained when overhead an NDE -useful on airways for
position reporting.
(4) An NDE can be used for holding at an en route point or at the
destination aerodrome, for homing to the station and carrying out a let-
down.
Procedures for obtaining bearings
(1) Check that the aircraft is within the promulgated range of the station to
be used
(2) Check the frequency and callsign
(3) If available, use the pre-select facility
(4) Tune the station
(5) Identify the station
(6) Function switch to ADF
(7) Note the bearing being indicated, and take the time; this is the time of
your position line, and the bearing obtained is a relative bearing
(8) If the bearing is required on an RMI, select NDB on red (thin) needle
and the bearing indicated is a QDM
(9) Unless planning to take a further bearing in a short space of time, return
function switch to ANT or even switch the ADF off.
Manual determination of bearings
On occasions when excessive interference is present, the pilot may find it
advantageous to obtain a bearing aurally by manual operation of the loop
aerial. Not many modern aircraft ADFs will have this facility but where the
facility exists, the procedure is as follows:

8/10/2019 Gsp Vol i Radio Aids
http://slidepdf.com/reader/full/gsp-vol-i-radio-aids 45/232
ADF and NDBs
57
(1) Steps (1) to (5) as above
(2) Select LOOP position on function switch
(3) By operation of the loop L/R control, rotate the loop until the signal
strength heard in the earphones is at a minimum (you are trying to
locate the 'null' position)
(4) The bearing is being indicated at this stage, but it is necessary to check
the sense unless it can be resolved by one of the other methods; press
SENSE button and rotate the loop clockwise by holding the loop control
to the right
(5) If the signal strength in the earphones decreases, the bearing is correct
(cardioid's null is approaching you)
(6) If the signal strength increases, swing the loop through 180° and repeat
the sequence.
An illustration of relative bearings and indications on an RBI is shown in Fig.
5.7.
N
j
6"
u
I')
.C>-
~
..5
,,~
"
'\I.
~
N
\
~~
-,;,~~
a/c's fore-
and-aft axis
s
/
/
~':-:
~-:'
/ dir. of ground
statiol"\
/
a/c's fore-
, and-aft axis
Rei Brg a
310 ~
Fig. 5.7 RBI indications
Homing to a station
When homing to a station on the ADF, the point to bear in mind is that the
station is directly ahead of you (if not, you want it to be so) and therefore,
the ADF indication is 360° or around 360°, Similarly, if you are leaving a

8/10/2019 Gsp Vol i Radio Aids
http://slidepdf.com/reader/full/gsp-vol-i-radio-aids 46/232
58
Radio Aids
station on the ADF, the station is directly behind you and the indication you
are looking for is 180° or around 180°.
Theoretically, a station may be reached by maintaining 360° on the ADF,
but if there is any wind blowing (and when doesn't it blow?) you will fly a
curved path to the station. Further, consequent upon wind, you will be
continually altering heading to combat displacement caused by the wind and
ultimately you will arrive overhead from a direction facing into the wind. See
Fig. 5.8.
Fig. 5.8 Maintaining ADF 000°,
The above method of homing, apart from being time-wasting, may not be
possible due to track maintenance requirements. In congested areas and on
airways, when homing from beacon to beacon you are required to fly notified
tracks. This may be done by simply making allowance for the wind velocity
right at the start, adjusting as the flight progresses f a wind change is noticed.
Suppose the drift is 10°S at the start (Fig. 5.9). Steer 350° to allow for
the drift. The ADF will then read 010° (take away from the nose, add to the
indication). As long as 010° remains indicating, you are maintaining the
track, and you will arrive overhead. If the indication starts a gradual decrease,
you are drifting to starboard, and you must allow for more than 10°S drift.
For the same reasons, if the reading starts to increase, you have allowed
for too much drift and should alter the heading accordingly. After one or two
such alterations you will hit on a heading which is right.
If while juggling with headings you managed to get off the track, or if you
wish to join a given track, the technique employed is to intercept the desired
track at a convenient angle, generally 30°- that is, at an angle of 30° between
interception heading and the desired track. To calculate what bearing the
ADF will indicate when you arrive at the track, the rule is:
Add on the nose (i.e. heading), take away from 360;
Take away from the nose, add on 360.

8/10/2019 Gsp Vol i Radio Aids
http://slidepdf.com/reader/full/gsp-vol-i-radio-aids 47/232
ADF and NDBs
59
/
\.
/
"'
/
/
,
Fig.5.9 Tracking directly to beacon.
Thus, if you intercept at an angle of 30° and your heading is smaller than your
track (that is, you have taken away 30° from the nose) ADF indication of 030
will tell you that you are crossing the track.
An aircraft in position 1 in Fig. 5.10 wishes to intercept and follow a track
of 070°; drift 5°P. Follow stages 1,2 and 3.
Tracking away from the station
As the station approaches, a rapid buildup in volume is noticed; when passing
the station, signals will momentarily fade, followed by another rapid increase
in volume indicating station passage. The station passage is also indicated
by increasing oscillations of the needle, subsequently settling down to an
indication near 180°. When tracking away, the relative bearing indicated will
be greater than 180° if starboard drift is being experienced (Fig. 5.11), and
less than 180° if port drift is being experienced. The procedure is to fly out
with the drift applied to maintain the track. Then you know what ideal
bearing you are looking for. As the flight progresses if the aircraft is not
tracking correctly, the pointer will start drifting slowly to one direction or
the other. If the readings are increasing, you are experiencing starboard drift;
port drift if they are decreasing -the same rule as stated earlier .
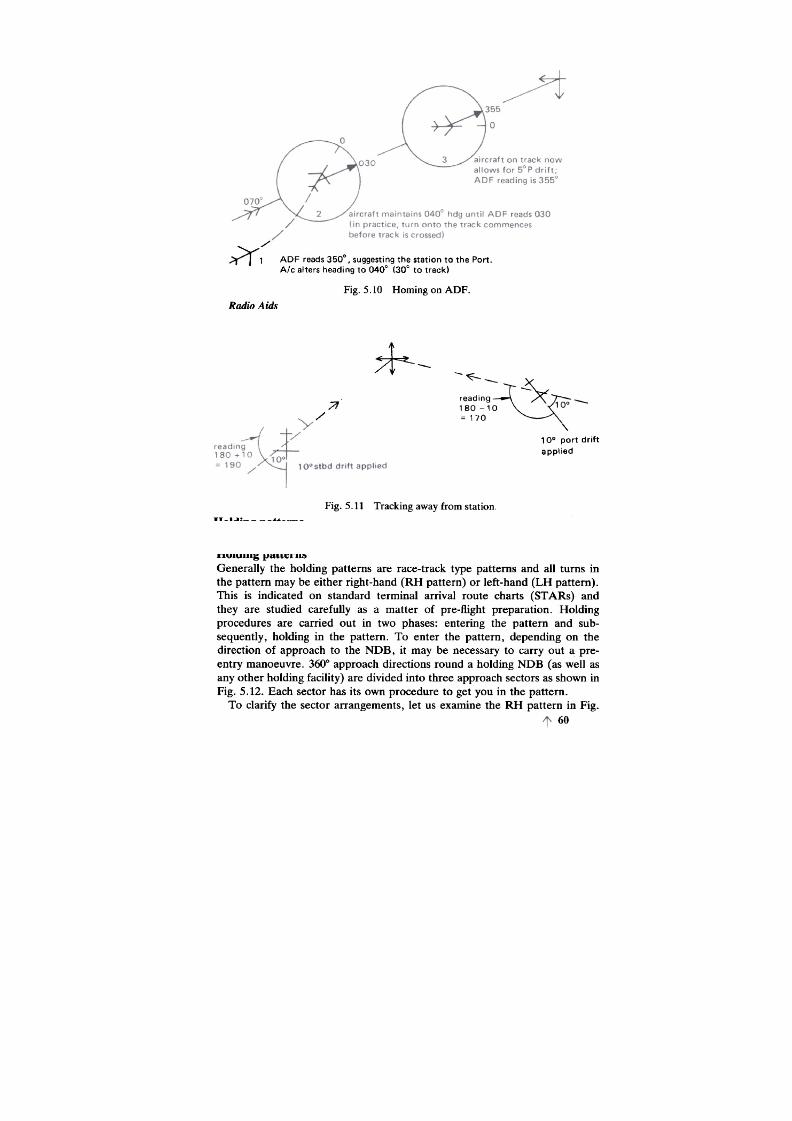
8/10/2019 Gsp Vol i Radio Aids
http://slidepdf.com/reader/full/gsp-vol-i-radio-aids 48/232
Radio Aids
0
ADF reads 350" , suggesting the station to the Port.
A/c alters heading to 040" (30° to track)
Fig.5.10 Homing on ADF.
~
-
?1
/
'\
10° port drift
applied
Fig.5.11
Tracking away from station.
Holding patterns
Generally the holding patterns are race-track type patterns and all turns in
the pattern may be either right-hand (RH pattern) or left-hand (LH pattern).
This is indicated on standard terminal arrival route charts (STARs) and
they are studied carefully as a matter of pre-flight preparation. Holding
procedures are carried out in two phases: entering the pattern and sub-
sequently, holding in the pattern. To enter the pattern, depending on the
direction of approach to the NDB, it may be necessary to carry out a pre-
entry manoeuvre. 360° approach directions round a holding NDB (as well as
any other holding facility) are divided into three approach sectors as shown in
Fig. 5.12. Each sector has its own procedure to get you in the pattern.
To clarify the sector arrangements, let us examine the RH pattern in Fig.

8/10/2019 Gsp Vol i Radio Aids
http://slidepdf.com/reader/full/gsp-vol-i-radio-aids 49/232
ADF and NDBs
61
-
.,
..~270i.
sector-2
procedure
ec
4 ° ".0 ~
..v 0"")
$.\' /'>
£,
AH pattern
.,
"'
LH pattern procedure
sector-'
procedure
Fig.5.12 Holding patterns.
5.12. The inbound track is 270° (M). The sector divisions based on this track
are as follows:
Sector 1 when approaching NDB between 090° (M) and 200° (M).
Sector 2 when approaching NDB between 090° (M) and 020° (M).
Sector 3 when approaching NDB between 020° (M) and 200° (M).
If your approach track is one of the dividing lines you may choose either
sector. Procedures to be adopted in individual sectors in an RH pattern, are
as follows:
Sector 1
(I) On arrival overhead, fly parallel to the reciprocal of the inbound leg for
the appropriate time.
(2) Then turn left and home back to the NDB.
(3) On second arrival over the facility turn right and commence the pattern.
Sector 2
(1) On arrival overhead, make good a track 30° to the reciprocal of the
inbound leg towards the inside of the pattern.
(2) At the appropriate time, turn right and join the pattern on the inbound
leg, and home to the facility.
Sector 3
On arrival overhead, join the pattern directly.
Actual holding at the facility commences now. Turn right through 180° rate
one and start timing when abeam the NDB. How do we know when we are
abeam? Well, in zero wind conditions, an RBI pointer indicating 090°R
indicates abeam position. To this figure add the amount of drift if it is
starboard, subtract from it if it is port. In Fig. 5.13 the aircraft having a 10°S
drift would wait for its ADF to indicate 100°R.
The outbound track is parallel to the inbound track. Apply drift and adjust

8/10/2019 Gsp Vol i Radio Aids
http://slidepdf.com/reader/full/gsp-vol-i-radio-aids 50/232
62
Radio Aids
Fig.5.13 Race track.
the leg timing for your ground speed to maintain the track. At end of the leg,
turn right through 180°, rate one and fly inbound track by ADF.
NDB let-down
On a terminal approach procedures chart, a typical let-down looks something
like Fig. 5.14. The let-down pattern is given in both plan and elevation and at
NDB
I
issed approach
"
"""Y
I -285
~ ~
05~ 7~ procedure
I ? ~;n .vo~ turn
2 min
k:.
"'.
","'
PLAN
Fig.5.14 NDB let-down
the bottom of the chart there is usually a scale showing distances in nautical
miles from the NDB position. All bearings shown on STARs are magnetic. A
procedure turn may be a level turn or a descending turn. The outbound track
may not be the reciprocal of the inbound track. In this case, a rate one turn
through 180° generally brings the aircraft on to the inbound track. This turn,
again, may be a level turn or a descending turn. Rate of descent on all
approaches, unless otherwise shown on the STAR, is 650:t150ft/min. At
certain aerodromes 'shuttle' procedures are available permitting an aircraft to
descend to the altitude from where a let-down may commence. Heights given
on a STAR are related to aerodrome elevation with QFE equivalents in
brackets.

8/10/2019 Gsp Vol i Radio Aids
http://slidepdf.com/reader/full/gsp-vol-i-radio-aids 51/232
ADF and NDBs
63
During a let-down, maintain tracks by applying drift and flying with refer-
ence to ADF. Where a leg is time-controlled, adjust that time to compensate
for your ground speed. A procedure turn is a 45 second leg followed by a
turn on to the inbound track.
A careful study of all possible destination and alternate let-down procedures
should be made as part of the pre-flight preparation. As many details as
possible are extracted in advance and arranged in a convenient form so
that you are ready to commence the procedures at your destination with
a minimum of work at that end. In case of any doubt in interpretation
of information in T AP , the UKAIP should be consulted. The following
information is needed for an NDB let-down:
Ideal Brg
on ADF
True airspeed
(TAS)
as
Dist.
Time
Rate of
descent
(ROD)
Finally, a pilot must not descend below his decision height (DH) unless the
conditions are equal to or better than those specified in the operations
manual.
Angle of lead
A turn on to the track must be commenced before the track is reached,
otherwise the track will be overshot and a further alteration of heading in the
opposite direction will be necessary. This angular allowance that you will
make for the turn is known as the 'angle of lead'. It is dependent upon
various factors, e.g. aircraft's TAS which governs its radius of turn, its
distance out from the station, wind velocity and the aircraft's rate of turn.
Two points must be noted:
(1) For a given airspeed, the angle of lead decreases as the distance from
the station increases (Fig. 5.15).
I
min out
1 min out
Fig.5.15 Angle of lead -fixed TAS
(2) For a given time out from a station, the angle of lead is constant
irrespective of aircraft speed (Fig. 5.16).

8/10/2019 Gsp Vol i Radio Aids
http://slidepdf.com/reader/full/gsp-vol-i-radio-aids 52/232
64
Radio Aids
~
1 min Out.
airspeed lOO kt
1 min Out
airspeed 200 kt
Fig.5.16 Angle of lead -fixed time out
Factors affecting range of NDBs
The undermentioned factors affect the useful ranges available from an NDB.
(1) Transmission power. The range at which an NDB may be successfully
used depends on its power output. Being an MF transmission, an increase
in power means an increase in the range available. The power require-
ments are, however, such that to double the range, the power must be
increased fourfold ( or, the range is proportional to the square root of
the power output). It must also be remembered that the power output
of a station is strictly limited to the value that will produce acceptable
field strength at the rated coverage boundary .Associated with the power
output, the radiation efficiency of the transmitter aerial (e.g. height and
other characteristics of the radiating system) governs the field strength
of the signals received from an NDB.
(2) Frequency. The operating radio frequency is a factor which also governs
the field strength of a signal being received. As we learnt earlier, for
a given transmission power, the lower the frequency, the lesser the
attenuation and the greater the ground wave range.
(3) Type of terrain. This factor reduces the useful ranges in two ways:
by affecting the field strength of the signal and by giving inaccurate
information.
(a) Type of surface. The conductivity of the path between the NDB
and the receiver determines the attenuation of the signals, and the
field strength. Longer ranges are always obtained over water than
over dry soil.
(b) Mountains and other obstructions. Mountains and other obstruc-
tions may block the signals, or more likely the signals will be
received after having been reflected from peaks and valleys or due
to diffraction and scattering effect. These signals, not necessarily
arriving from the direction of the station, will give erroneous
indications. The effect is more pronounced at low levels; a gain in
altitude is required to minimise the effect.
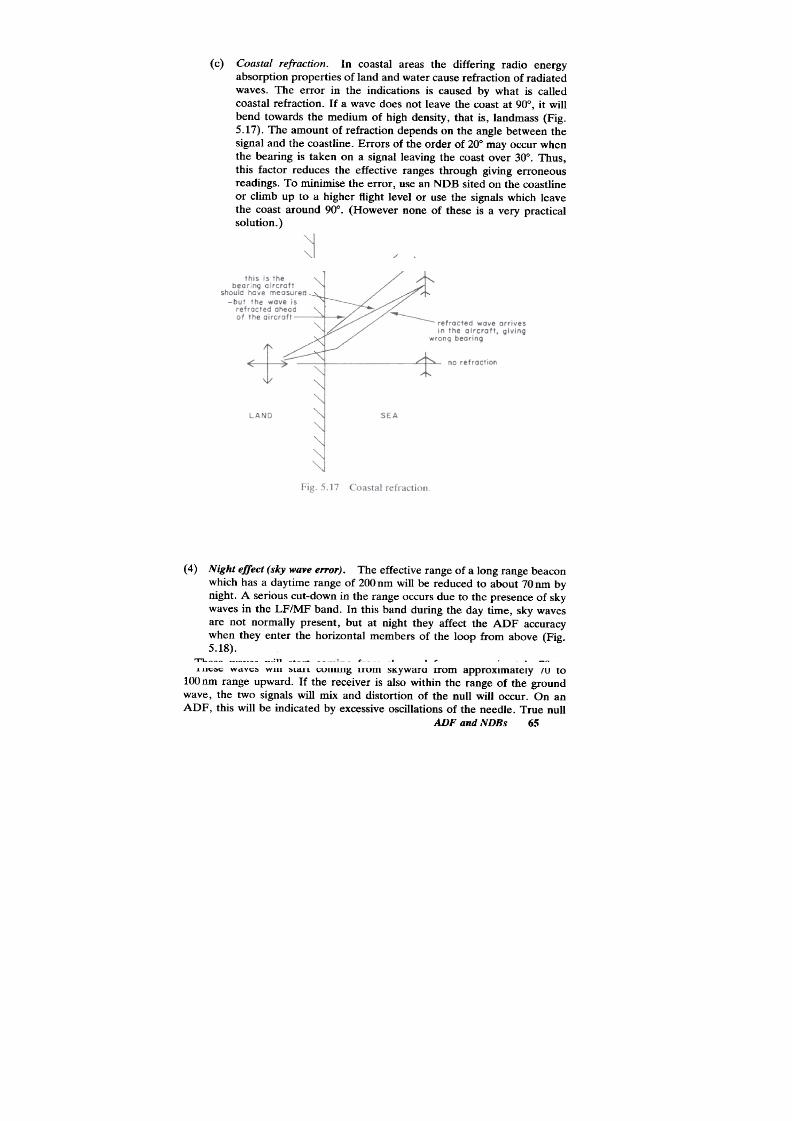
8/10/2019 Gsp Vol i Radio Aids
http://slidepdf.com/reader/full/gsp-vol-i-radio-aids 53/232
ADF and NDBs
65
(c)
Coastal refraction. In coastal areas the differing radio energy
absorption properties of land and water cause refraction of radiated
waves. The error in the indications is caused by what is called
coastal refraction. If a wave does not leave the coast at 90°, it will
bend towards the medium of high density, that is, landmass (Fig.
5.17). The amount of refraction depends on the angle between the
signal and the coastline. Errors of the order of 20° may occur when
the bearing is taken on a signal leaving the coast over 30°. Thus,
this factor reduces the effective ranges through giving erroneous
readings. To minimise the error, use an NDB sited on the coastline
or climb up to a higher flight level or use the signals which leave
the coast around 90°. (However none of these is a very practical
solution. )
(4) Night effect (sky wave e"or). The effective range of a long range beacon
which has a daytime range of 200 nm will be reduced to about 70 nm by
night. A serious cut-down in the range occurs due to the presence of sky
waves in the LF/MF band. In this band during the day time, sky waves
are not normally present, but at night they affect the ADF accuracy
when they enter the horizontal members of the loop from above (Fig.
5.18).
These waves will start coming from skyward from approximately 70 to
100 nm range upward. If the receiver is also within the range of the ground
wave, the two signals will mix and distortion of the null will occur. On an
ADF, this will be indicated by excessive oscillations of the needle. True null

8/10/2019 Gsp Vol i Radio Aids
http://slidepdf.com/reader/full/gsp-vol-i-radio-aids 54/232
66 Radio Aids
ground wave
Fig.5.18 Night effect
is masked and efforts to find a mean over a wavering area can lead to error
since the mean is not necessarily the centre of a wavering needle. If the
aircraft is only receiving sky waves, there will be a good null but that
indication can again be erroneous since there is no guarantee that the reflect-
ing plane is parallel to the earth's surface. In other words, the signal may not
arrive from the station direction.
This effect on the ADF is called night effect. It is minimised when using
a station in the lower section of the frequency band, thus reducing the
incidence of the sky wave. Dusk and dawn are critical periods for ADF
operation -extreme care must be exercised. Also, use a more powerful
beacon if you have a choice. Lastly, choose the station nearest to you.
The presence of sky waves is indicated to the operator in two ways:
excessive oscillation of the needle, and fading of the signals.
(5) Protection range. Irrespective of the range that an NDB is capable
of producing, the use of an NDB in the UK is restricted to ranges
promulgated in the UKAIP. This is known as protection range and this
restriction is necessary in order to provide reception, free from inter-
ference from other NDBs transmitting on the same or similar frequencies.
The main reason for the interference is congestion in the MF band. In
Europe (and in America) there is always a heavy demand for channel space
in this band, which is already overcrowded with NDBs and broadcasters. In
LF and MF (lower end of the frequency spectrum) interference between two
similar frequencies can take place quite easily (a common experience while
tuning radio stations at night) and the protection is afforded by the Civil
Aviation Authority (CAA) controlling the allocation of power and frequency
to the stations. Protection ranges are based on providing a minimum protec-
tion ratio of 3. That is, the ratio of the field strength of the wanted signal to
unwanted signal will be at least 3 to 1. Or, when translated in terms of noise,
the level of wanted signal will be at least 10dB higher than that of unwanted
signal within the promulgated range. In the UK the protection ensures that
the errors in the service area will not exceed :t5°. But this protection is
guaranteed only during day time. At night:
(a) Sky waves seriously affect the operation of the ADF due to night effect.

8/10/2019 Gsp Vol i Radio Aids
http://slidepdf.com/reader/full/gsp-vol-i-radio-aids 55/232
ADF and NDBs
67
Further, the E layer gains height at night, increasing the ranges where
sky waves could be received. In other words, the sky wave from a
distant NDB operating on a similar frequency will extend its range and
produce interference within the protection range of your NDB.
(b) Broadcasters and other high-powered radio beacons will gain field
strength at night. This means that at a given place, where during the day
time you would receive wanted signals at a level of at least lOdB higher
than the unwanted signals, the unwanted signals now increased in field
strength will produce higher noise, and the protection minimum will
fall.
(c) A forecast of interference-free ranges could not be made for night
periods since the height of the ionospheric layer is variable and its
density is also variable. Among others, these two factors decide the
range of the return of the sky waves.
Therefore, the principle of protection ranges breaks down at night and the
useful ranges are greatly reduced. Extreme caution should be exercised when
using the ADF at night and it is most important to ensure that correct tuning
is done to the exclusion of any unwanted signals.
(6) Static. All kinds of precipitation (including falling snow) and thunder-
storms, together with solid particles such as dust in the atmosphere
can cause static interference of varying intensity to ADF systems. Pre-
cipitation static reduces the effective range and accuracy of bearing
information. Thunderstorms can give rise to bearing errors of consider-
able magnitude, even to the extent of indicating false station passage.
It is not at all unusual for the pointer to point in the direction of a
thundering cumulonimbus cloud.
The extent to which a receiver will admit the noise depends on:
(a) the bandwidth of the receiver
(b) the level of the atmospheric noise
(c) the level of noise produced by other interference (e.g. other radio
stations, industrial noise) .
(7) Type of emission. For a given transmission power, the ranges produced
by an A2A emission are shorter than a AlA emission.
Factors affecting accuracy of ADF
Some of the factors mentioned above also affect the accuracy of the indi-
cations. There are other factors which affect accuracy without affecting range
directly. Factors affecting accuracy are:
(1) Night effect. (Already discussed.)
(2) Type of te"ain. Mountains, physical obstructions, refraction on leaving
the coast.
(3) Static interference. The cause of static has already been discussed.

8/10/2019 Gsp Vol i Radio Aids
http://slidepdf.com/reader/full/gsp-vol-i-radio-aids 56/232
68
Radio Aids
Static can affect the accuracy of ADF at all ranges. At a comparatively
short range, e.g. less than 50 nm, static and other noise is considered to
be potentially dangerous and in these conditions the indications should
be monitored on a VHF aid if available.
(4) Station interference. This is another potentially dangerous situation at
short ranges. When two stations at different locations are transmitting
.on the same or similar frequency, the bearing needle will take up
the position which is the resultant of the field strengths of the two
transmissions. The indications may give large errors. To avoid this, use
the facility when you are inside its promulgated service area.
(5) Quadrantal error (QE). This error occurs because the fuselage reflects
and re-radiates the signals hitting it. These signals mix with the signals
entering the loop, giving an error in the indication. Signals arriving at
the loop from the aircraft's relative cardinal points are not affected.
Signals hitting the fuselage at any other angles are affected, the maximum
effect is noticed when the signals arrive from the direction of the air-
craft's relative quadrantal points. Hence the name quadrantal error .
These signals are bent towards the aircraft's major electrical axis, which
is normally its fore-and-aft axis.
An ADF is regularly calibrated and corrected and any remaining errors are
recorded on a QE card. With modern equipment and improved techniques
this error is of academic interest only.
(6) Loop misalignment. If the loop aerial is not exactly aligned with the
fore-and-aft axis of the aircraft all bearings subsequently measured by
the equipment will be in error by the amount of misalignment. This
error is eliminated by careful fitting and aligning of the loop.
(7) Lack of failure warning device. Because there may be no cockpit indi-
cation of a ground or airborne equipment failure, a serious situation can
arise if the pilot continues to follow a steady indication when in fact no
information is being fed to the pointer. This can occur for a variety
of reasons: the pilot throwing the function switch to standby position
through habit or absentmindedness, the ground transmitter stopping
radiation, airborne receiver going unserviceable and so forth. The only
way to prevent such an incident, in the absence of a warning flag
or other built-in indication, is to constantly monitor the identification
signals.
Effect of aircraft height on range
NDBs transmit in the LF and MF bands. In these bands the radio waves
curve with the surface of the earth. Because of this, an aircraft will receive
signals, if otherwise within the range, no matter how low the aircraft is flying.
Since these waves also propagate in space, aircraft at higher altitudes will
also receive the signals. Thus, the height of an aircraft has no significance as
far as the range is concerned. Height, however, may become significant as
pointed out earlier, when flying in mountainous areas or using coastal NDBs.

8/10/2019 Gsp Vol i Radio Aids
http://slidepdf.com/reader/full/gsp-vol-i-radio-aids 57/232
ADF andNDBs
69
Signals/noise ratio
To improve signals/noise ratio:
(1) narrow down receiver bandwidth ensuring that you do not cut out your
own signals.
(2) tune the wanted station carefully, and
(3) if it is thought that the unwanted signal is the result of a more powerful
beacon encroaching on your bandwidth, see if you can exclude it by off-
tuning your own station.
Some interesting facts about ADF
(1) If there are two NDBs, one on the coast and the other fairly inland, and
if the coastal refraction for both propagations is the same when the
bearings are taken, then when you plot the position lines, you will find
that the NDB which is further inland gives greater error.
(2) When flying over the water if you take two/three bearings to make a fix,
and if errors due to coastal refraction are present, then the fix you make
will put you coastward from your true position. Do a little plotting
exercise and check it. First plot a fix from three position lines unaffected
by coastal refraction; then plot another fix from the position lines in
error .
(3) In Fig. 5.19 an aircraft is flying a track of 060° (T) in no wind conditions.
When in position A it obtains a relative bearing of 050°R from NDB, C.
Now if it waits until the bearing has changed to twice the original value,
i.e. l00oR, its position at that time is at B. In this situation, we have a
triangle ABC in which side AB equals side BC. This enables the pilot to
calculate his distance from NDB, C, when at B. This distance is equal to
distance AB which he can calculate from knowledge of his ground
speed. (Our mariner forefathers who used this technique for navigation
B
/800
~00
y/
-E-'-,
c
Fig.5.19 Distance from station.

8/10/2019 Gsp Vol i Radio Aids
http://slidepdf.com/reader/full/gsp-vol-i-radio-aids 58/232
70
Radio Aids
with visual bearings of headlands, knew it as 'doubling the angle on the
bow'.)
When there is wind, allowance must be made for the drift applied in the
ADF reading.
(4) If an aircraft flies from one beacon to another and the relative bearing
remains fairly steady, the wind velocity may be found on arrival over the
second beacon. The time between the two beacons should not be too
short. For example, an aircraft passes over beacon A at 10.00hrs, TAS
180kt, Hdg(M) 157°. Later the ADF tuned to the NDB, A, gives a
steady relative bearing of 186° and the aircraft passes over beacon B,
49nm from A at 10.20hrs. Var 8°W.
Aircraft's ground speed: 49 in 20 = 147kt. Hdg(M) 157, Var 8°W; Hdg(T)
149, Drift 6°S, Tr(T) 155. Now the values ofTR, HDG, TAS and GS are put
on the computer to give wind velocity (WV) which is 123°/37kt in our
illustration.
Test questions
(1) List the factors that affect the accuracy of ADF indications.
(2) Explain briefly 'night effect'.
(3) List the factors that contribute to restricting useful NDB ranges.
(4) List the factors that affect the field strength of the NDB radiation.
(5) Explain briefly how station interference may affect ADF performance.
(6) What minimum protection is provided when flying within protection
range in the UK?
(7) The emission of an NDB is listed as NON A2A. Explain how you
would use BFO before you are ready to take a bearing on it.
(8) Describe the procedure to follow to obtain a QDM from an NDB.
(9) Why is the promulgated range for an NDB valid only during the day
time?
(10) What is the guide line to be followed when deciding whether an NDB
should have NON AlA or NON A2A emission?
(11) NDBs transmit:
(a) vertically polarised signals in the MF band
(b) horizontally polarised signals in the HF band
(c) phase comparable signals in the MF/HF band.
(12) The frequency band(s) chosen for NDBs is/are:
(a) upper LF and lower MF (b) VHF and above (c) HF.

8/10/2019 Gsp Vol i Radio Aids
http://slidepdf.com/reader/full/gsp-vol-i-radio-aids 59/232
ADF and NDBs 71
(13) The rated coverage of homing and holding NDBs is a range of
approximately:
(a) 25nm (b) 10nm (c) 50nm.
(14) When using ADF for en-route navigation, the bearing obtained is:
(a) magnetic bearing (b) true bearing (c) relative bearing.
(15) The promulgated protection range for an NDB is applicable:
(a) during daytime only (b) during night-time only
(c) throughout the 24 hours, but it is most prone to error around dusk
and dawn.
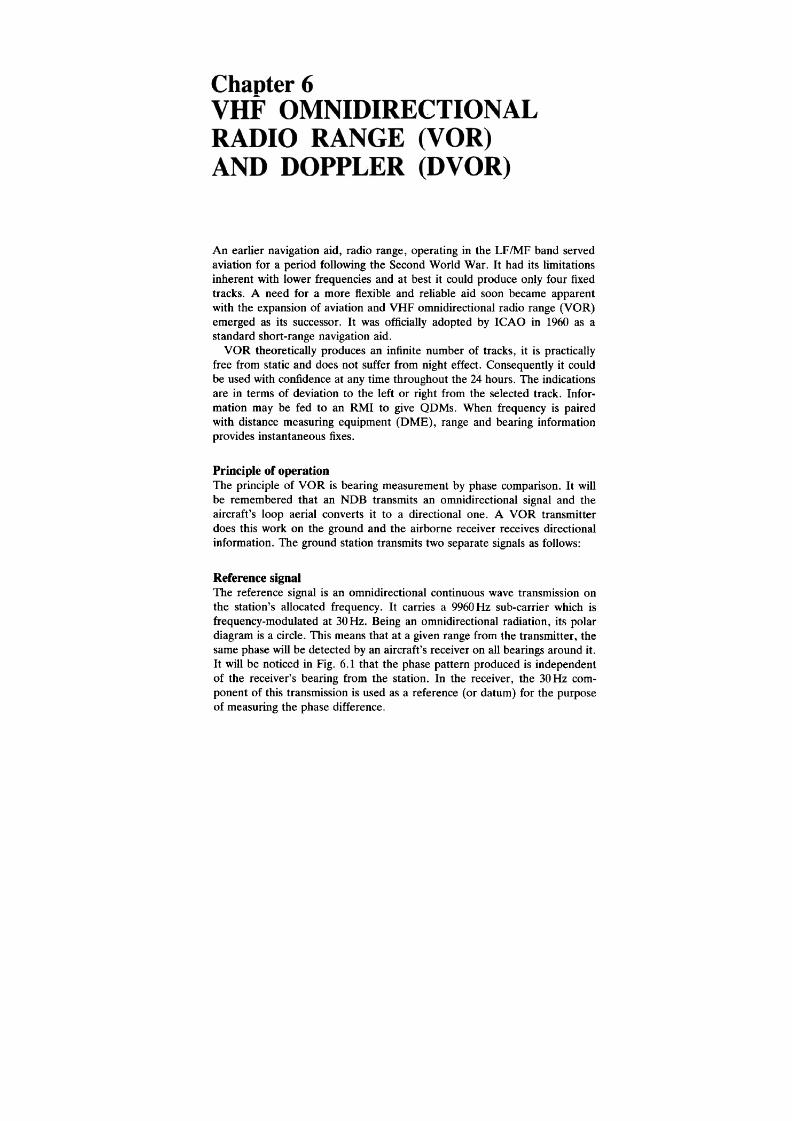
8/10/2019 Gsp Vol i Radio Aids
http://slidepdf.com/reader/full/gsp-vol-i-radio-aids 60/232
An earlier navigation aid, radio range, operating in the LF/MF band served
aviation for a period following the Second World War. It had its limitations
inherent with lower frequencies and at best it could produce only four fixed
tracks. A need for a more flexible and reliable aid soon became apparent
with the expansion of aviation and VHF omnidirectional radio range (VOR)
emerged as its successor. It was officially adopted by ICAO in 1960 as a
standard short-range navigation aid.
VOR theoretically produces an infinite number of tracks, it is practically
free from static and does not suffer from night effect. Consequently it could
be used with confidence at any time throughout the 24 hours. The indications
are in terms of deviation to the left or right from the selected track. Infor-
mation may be fed to an RMI to give QDMs. When frequency is paired
with distance measuring equipment (DME), range and bearing information
provides instantaneous fixes.
Principle of operation
The principle of VOR is bearing measurement by phase comparison. It will
be remembered that an NDB transmits an omnidirectional signal and the
aircraft's loop aerial converts it to a directional one. A VOR transmitter
does this work on the ground and the airborne receiver receives directional
information. The ground station transmits two separate signals as follows:
Reference signal
The reference signal is an omnidirectional continuous wave transmission on
the station's allocated frequency. It carries a 9960 Hz sub-carrier which is
frequency-modulated at 30 Hz. Being an omnidirectional radiation, its polar
diagram is a circle. This means that at a given range from the transmitter, the
same phase will be detected by an aircraft's receiver on all bearings around it.
It will be noticed in Fig. 6.1 that the phase pattern produced is independent
of the receiver's bearing from the station. In the receiver, the 30 Hz com-
ponent of this transmission is used as a reference (or datum) for the purpose
of measuring the phase difference.

8/10/2019 Gsp Vol i Radio Aids
http://slidepdf.com/reader/full/gsp-vol-i-radio-aids 61/232
VOR and DVOR
73
Rx
o
/
Ii
I
~ RXO(
~
Rx
\
"'
o
R~
Fig.6
Reference signal -same phase in all directions
Variable or directional signal
This is again transmitted on the station frequency and the radiated pattern
produces a polar diagram of a rotating figure of eight. And by rotating it 30
times per second the signal is given the character of a 30 Hz amplitude
modulation. This simply means that the received signal will rise to a maximum
and fall to zero value 30 times a second.
Derivation of the phase difference
When the reference signal is combined with the directional signal, a rotating
cardioid results. Unlike the cardioid of an ADF loop aerial, the VOR cardioid
does not have a null position and in strict terms, a VOR cardioid is called a
limacon (see Fig. 6.2). This absence of null is arranged at the transmitter by
adjusting the power relationship between the reference and variable signals.
The resulting field strength is in the ratios 4: 1 : 4: 7 on four cardinal points. In
Fig. 6.3 the receivers are shown on four cardinal points, receiving signals of
field strength in above ratios, and in Fig. 6.4, when the amplitudes of the
incoming signals are plotted on a time axis for the same four positions of the
receiver, the signals' directional characteristic is revealed.
Now we have two signals in the receiver; the reference signal producing a

8/10/2019 Gsp Vol i Radio Aids
http://slidepdf.com/reader/full/gsp-vol-i-radio-aids 62/232
74
Radio Aids
30 Hz
~
30 Hz
~
,.'
"'
"'
/
/
\
/
I
+
+
=
x
)
/
"'---"
\
""
""
/
,
Derivation of limacon.
Rx here receives strength 4
X
~
/
""
\
Rx here receives
strength 7
Rx here receives
strength 1
\
,
/
~
x
Rx here receives strength 4
Varying field strengths.
constant phase as shown in Fig. 6.1 and the variable signal giving a bearing-
dependent phase, as shown in Fig. 6.4. It will be seen in Fig. 6.5 how the
comparison between the two can yield the direction of the receiver. It will
also be noted that the receiver north of the station receives both the signals at
the same phase, that is, the phase difference between the two is zero. It is
deliberately arranged that this zero difference should occur on the station's
magnetic north to provide a measuring datum.
It will be observed from Fig. 6.5 that an aircraft on a magnetic bearing of
090 receives a phase difference of 90° and when on 270, it receives a phase
difference of 270°. Therefore, when on a bearing of 045, it will receive a
phase difference of 45° and when on 227, it will receive a phase difference of
227° and so on. Conversely, when it receives a phase difference of 329°, its
magnetic bearing from the station (QDR) is 329, and when it receives a phase
difference of 063°, its QDR is 063.

8/10/2019 Gsp Vol i Radio Aids
http://slidepdf.com/reader/full/gsp-vol-i-radio-aids 63/232
VOR and DVOR
75
:1
I ~
r-f+
f\
Fig. 6.4 Variable signal phase dependent upon heading.
Thus, a VOR transmitter continuously sends out 360 individual tracks.
These tracks are oriented from the station's magnetic north (that is, the
station's magnetic variation is applied) and the tracks radiating outward from
the transmitter are called 'radials'. It is important to understand the strict
meaning of this term so that it is not misused. Study Fig. 6.6.
Airborne equipment
The basic airborne equipment consists of an aerial, a receiver and an indicator.
Aerial. These are small, horizontal dipoles capable of accepting horizontally
polarised signals in the frequency band 108 to 118MHz. They should be
installed so that they offer omnidirectional cover to VOR signals but receive
no interference from the VHF aerial operating on RTF communication chan-
nels. A VOR aerial also accepts ILS localiser signals which are in the same
frequency band.
Receiver. A VOR receiver compares the phases of the reference and variable
signals and feeds the extracted phase difference in a suitable form to the

8/10/2019 Gsp Vol i Radio Aids
http://slidepdf.com/reader/full/gsp-vol-i-radio-aids 64/232
Radio Aids
6
-c;;x MN phase difference O
G
/ ---Y-
Rx 090 ( M) phase diff 90
x 270( M ) phase diff. 270
Fig. 6.5 Varying phase difference.
MN
This a/c is heading towards the station
on radial 240; it is also flying 060
to the station. VO R This a/c is tracking away from the station
(It is not on 060 radial.) on radial 060; it is also flying 060
from the station.
/
/
Fig. 6.6 Radials.
various components of the indicator. The two signals are processed through
two different channels, and their carriers are filtered out at appropriate
stages. A 30 Hz FM reference signal is converted by a discriminator to a
30 Hz AM signal (see Fig. 6.7) and it is then compared in phase with the
30 Hz AM variable signal in the phase detector unit. If the two signals are in
phase, the circuits are in balance and the indicator is indicating correct
bearing. If the two signals are not in phase an error signal is produced in
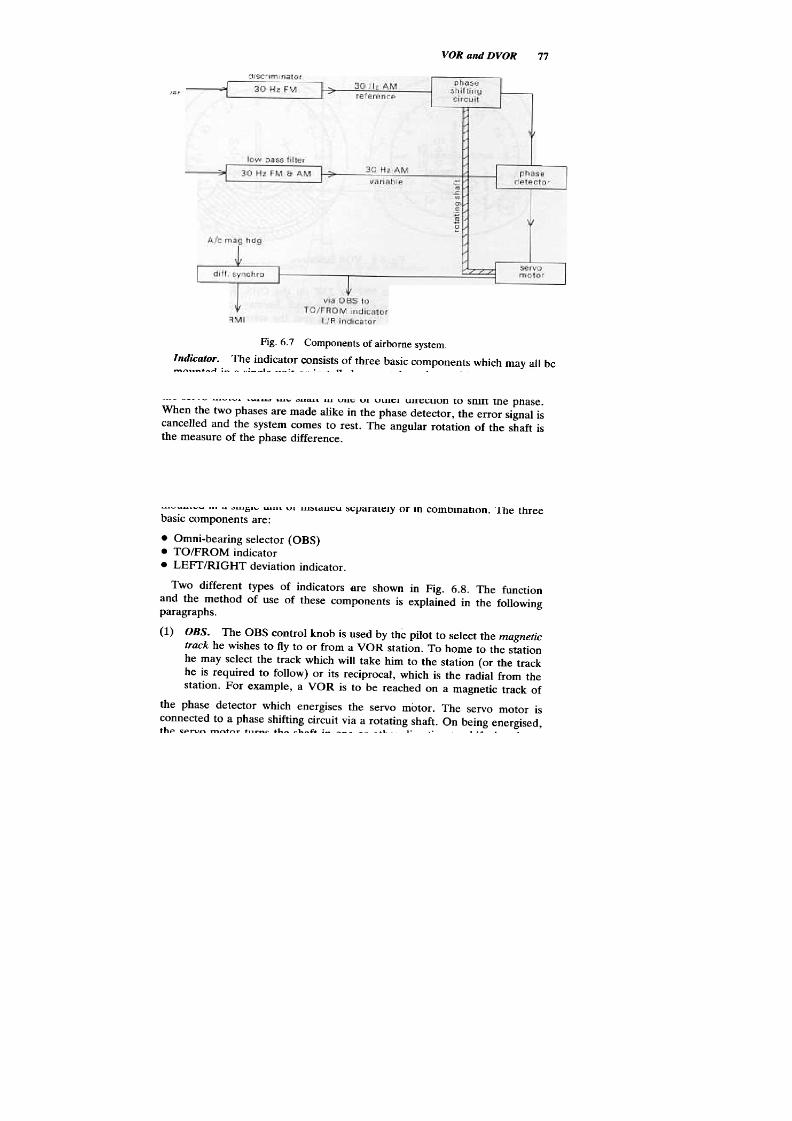
8/10/2019 Gsp Vol i Radio Aids
http://slidepdf.com/reader/full/gsp-vol-i-radio-aids 65/232
VOR and DVOR
77
Fig. 6.7 Components of airborne system.
the phase detector which energises the servo motor. The servo motor is
connected to a phase shifting circuit via a rotating shaft. On being energised,
the servo motor turns the shaft in one or other direction to shift the phase.
When the two phases are made alike in the phase detector, the error signal is
cancelled and the system comes to rest. The angular rotation of the shaft is
the measure of the phase difference.
Indicator. The indicator consists of three basic components which may all be
mounted in a single unit or installed separately or in combination. The three
basic components are:
.Omni-bearing selector (OBS)
.TO/FROM indicator
.LEFT/RIGHT deviation indicator.
Two different types of indicators 6re shown in Fig. 6.8. The function
and the method of use of these components is explained in the following
paragraphs.
(1) OBS. The OBS control knob is used by the pilot to select the magnetic
track he wishes to fly to or from a VOR station. To home to the station
he may select the track which will take him to the station (or the track
he is required to follow) or its reciprocal, which is the radial from the
station. For example, a VOR is to be reached on a magnetic track of

8/10/2019 Gsp Vol i Radio Aids
http://slidepdf.com/reader/full/gsp-vol-i-radio-aids 66/232
78
Radio Aids
~o J
~
\
I
~ ..~~
TO
~
~m.
oS 'FROM
c" ~ "' '
~~
-./
Fig. 6.8 VOR indicators.
050°. The pilot may select 050° or 230° on the OBS. Similarly when
flying away from the station on the same track, he may again use either
of the above settings. As we will soon see, the selected track affects
TO/FROM and L/R indications and so he chooses the best setting.
When the track is selected, the vertical left/right needle is displaced from
its central position either to the left or to the right, unless the aircraft is on
that selected radial at that time. Alternatively, a pilot may use his VOR just
to obtain a bearing, in which case he centralises the needle by use of the
OBS control.
(2) TO/FROM indicator. When the required magnetic track has been
selected, the TO/FROM display will indicate either TO or FROM,
according to whether the selected radial or its reciprocal is nearer to the
aircraft's position. This indication will change when the aircraft crosses a
line 90° to the selected track. The rate of change will depend upon the
range of the aircraft from the ground station (when not flying overhead).
In the following illustration, Fig. 6.9, all aircraft have selected 010 on
the OBS.
Aircraft A, B and E will have TO displayed on the indicator since in all
three cases f they wish to reach the station on magnetic track of either 010 or
190, then 010 is the nearer. For similar reasoning, aircraft C and D will
indicate FROM suggesting that not the selected bearing 010 but its reciprocal
190 is the nearer radial to take him to the station.
There is another way of looking at it. In position A, B or E and having
selected 010, ask yourself 'Does this setting take me to the station?' If the
answer is yes, TO is indicated. In position C or D the answer is no and
FROM is indicated.
(3) L/R deviation indicator. The indicator consists of a vertical needle which
moves left/right across the face from its central position to indicate

8/10/2019 Gsp Vol i Radio Aids
http://slidepdf.com/reader/full/gsp-vol-i-radio-aids 67/232
VOR and DVOR
79
changeover
sector
Fig. 6.9 TO/FROM indications.
deviations. The movement is against an angular scale shown by a num-
ber of dots. When the aircraft is on the radial the needle stays in its
central position. When the aircraft is not on the selected radial, the
needle indicates the difference between the selected radial and the radial
the aircraft is actually on by moving out to left or right. The amount of
deflection is the measure of the angular distance to the selected radial
and is estimated from the dots scale.
A full-scale deflection occurs when the aircraft is 10° or more away from
the selected radial. This means that no movement of the needle takes place
from its maximum-deflection position until the aircraft is within 10° of the
selected radial. The instrument may have either a four-dot scale or a five-dot
scale. If it is a four-dot instrument then one dot deflection indicates a
deviation of 2 0; similarly, on a five-dot instrument it will equal 2°.
Whether you would follow the needle by steering in the direction of
the displaced needle or you would go against the needle depends on your
physical position with regard to the selected radial, and is independent of the
aircraft heading. However, since we must steer the aircraft to gain the radial
we must translate this indication in terms of our present heading. The rule is:
follow the needle to regain the radial if your heading and the selected bearing
are in general agreement.
This rule immediately makes it clear that when homing to/from a station if
8/10/2019 Gsp Vol i Radio Aids
http://slidepdf.com/reader/full/gsp-vol-i-radio-aids 68/232

8/10/2019 Gsp Vol i Radio Aids
http://slidepdf.com/reader/full/gsp-vol-i-radio-aids 69/232
VOR and DVOR
81
~~
r~16. ~o.
left turn indicated
~
~
left turn
indicated
~?~?
on track
I radial010
~
010 \from
...0\. ..)
t~
right turn
indicated
~
t
on track
4-
to \
I track
+w
left turn indicated
~t
right turn
indicated
QOM 010
QDR 190
Fig.6.10 Indicator readings.
tracks from beacon to beacon, as on an airway. If your route does not take
you over VOR stations, you may still make use of them in your navigation.
You may carry out holding procedures and make an approach to let-down at
your destination.
8/10/2019 Gsp Vol i Radio Aids
http://slidepdf.com/reader/full/gsp-vol-i-radio-aids 70/232
82
Radio Aids
Before you actually use the VOR in the air for any of the above purposes it
is important that you go through the following routine.
(1) First check that you are within the designated operational coverage
(DOC) of that station. This information is given in the communications
section of the UKAIP. Outside the UK you may find this information
listed under 'range and altitude' or 'protection range and altitude'. If
you are not within the quoted DOC of the station which applies both
day and night, you must not attempt to obtain the information even if
the display units seem to give reliable indications. This is because the
signals are not protected from interference from other beacons.
(2) Having satisfied yourself that you are within the coverage, switch on the
equipment. It may take a couple of minutes to warm up.
(3) Select the station frequency, and if the indications are required on RMI,
select VOR on the green pointer.
(4) Check that the warning flag clears out of the window.
(5) Identify the station.
You are now ready to use your VOR. Let us discuss the procedures.
Homing on VOR
It is possible that you may be able to home to a station from any direction,
that is, on any radial. In that case, as soon as you are receiving satisfactory
signals you are on a VOR radial and ready to proceed.
But it is more likely that your approach direction is restricted for one
reason or the other, e.g. a danger area in the way or presence of high ground
and so forth. A TC imposes movement restriction to ensure a smooth traffic
flow by prescribing inbound and outbound routes. These routes are defined
by VOR radials and to home to the station you must use one of the routes
most conveniently placed. Well, how do we get on this radial? With VOR it
is relatively simple. In Fig. 6.11, the aircraft in position 1 wishes to join radial
090 from VOR A. The inbound track is 270°(M). The pilot has some idea of
his position in relation to the required radial. If he is not sure, his QDM to
the station is quickly checked by turning the OBS control until the needle is
central and TO is indicated. The following procedure is adopted.
Set your track, 270 on the OBS counters. TO/FROM display will indicate
TO (as this is your track to the station) and the L/R needle will swing to
maximum deflection, indicating a right turn in our illustration. The indication
of right turn is ignored as your own heading is not near 270°. With the
knowledge of your position with regard to the selected radial, set a heading
that will give you a comfortable angle of interception.
When in position 2, you are 10° away from the selected radial and the L/R
needle will show an inward movement. Assess your angle of lead, taking into
account your radius of turn, the angle through which you have to turn and
the distance from the station. The movement of the L/R needle may give you
an indication of how fast or slow you are approaching your radial. The
further the distance from the station, the slower its inward movement.
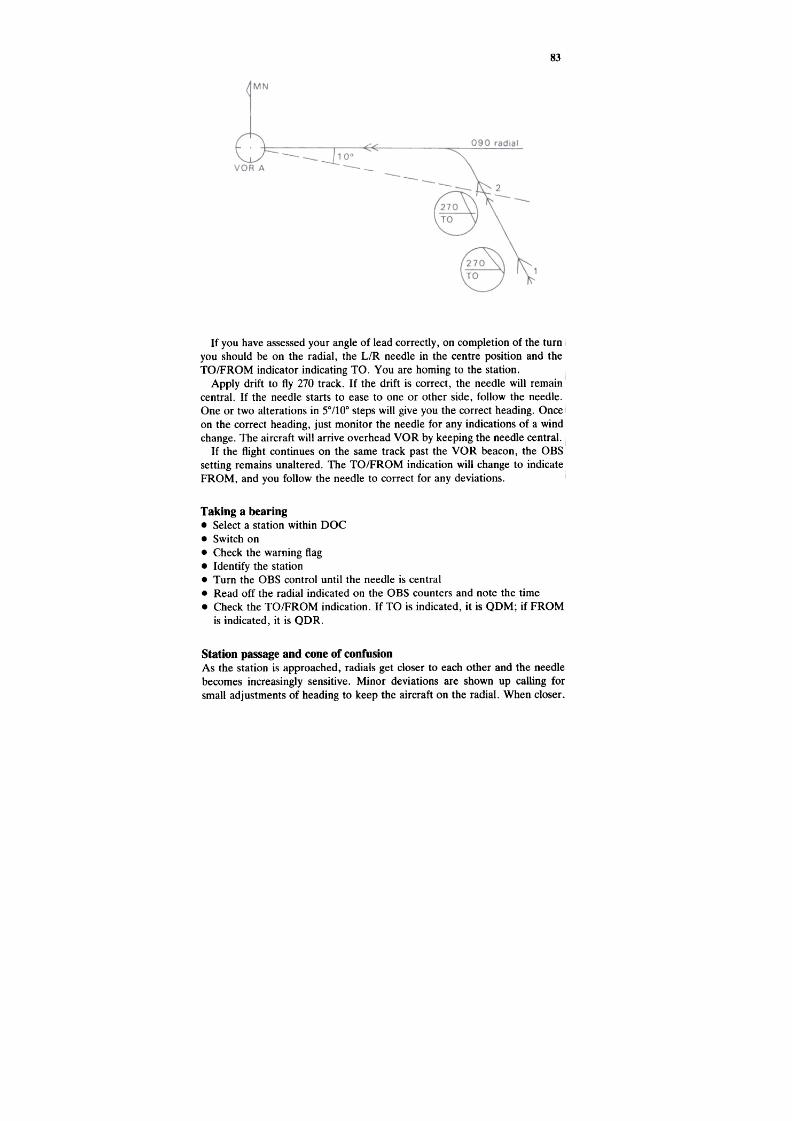
8/10/2019 Gsp Vol i Radio Aids
http://slidepdf.com/reader/full/gsp-vol-i-radio-aids 71/232

8/10/2019 Gsp Vol i Radio Aids
http://slidepdf.com/reader/full/gsp-vol-i-radio-aids 72/232
Radio Aids
4
the needle oscillates hard from side to side, the OFF flag may momentarily
appear and TO/FROM display swings between TO and FROM, not being
sure whether it is coming or going
The cause of these erratic indications is the presence of what is called the
'cone of confusion' overhead the beacon.
The propagation specifications, as recommended by ICAO, require the
signals to be transmitted up to 40° in elevation. In practice, the modern
equipment is capable of radiating signals of up to 60° to 80° above the
horizon. But it still leaves a gap overhead, in the form of a cone where no
planned radiation takes place. While passing through this zone the receiver
comes under influence of weak overspill, causing confusion to the indicators.
Once through the cone all indications settle down to indicate correctly,
TOIFROM indication changing over to FROM. The time you will remain in
the cone depends on your height and the ground speed.
Identification
In the UK, VORs transmit a 3-letter aural morse group at a rate of approxi-
mately seven words per minute, at least once every ten seconds. This is the
ICAO recommendation. Ident may also be given in speech form, e.g. 'This is
Miami Omni Range', immediately followed by ident in morse. The voice
channel may also be used to pass significant weather information to the
aircraft.
Monitoring
All VOR ground stations' transmissions are monitored by an automatic
monitor located in the radiation field near the station. The monitor will warn
the control point and either remove the identification and navigation com-
ponents from the carrier or switch off the radiation altogether in the event of
any of the following circumstances:
(1) a change in bearing information at the monitor site in excess of 1°
(2) a reduction of more than 15% in the signal strength of the two 30 Hz
modulation components (or either one of them) or the RF carrier itself
(3) failure of the monitor itself.
When the main transmitter is switched off a standby transmitter is brought
into operation. This takes a certain amount of time before its radiation
stabilises. During this period the bearing information radiated can be incor-
rect, and as a warning to the users, no ident signals are transmitted until the
changeover is complete.
When an approach to an airfield is being made using a short-range TVOR,
it is vital that the pilot continuously monitors the ident signals in order
to ensure that the bearing information being received is correct and the
approach being made is safe.

8/10/2019 Gsp Vol i Radio Aids
http://slidepdf.com/reader/full/gsp-vol-i-radio-aids 73/232
VOR and DVOR
85
Factors affecting VOR ranges
1) Transmission power. The higher the power, the greater the range sub-
ject to altitude. En-route VORs with a power output of 200 watts
achieve ranges of around 200 nm. TVORs normally transmit at 50 watts.
(2) Transmitter and aircraft height. Because VOR transmissions are in the
VHF frequency band, the theoretical maximum range depends on
line-of-sight distance (in practice, slightly better due to atmospheric
refraction). For calculating theoretical ranges for various heights, the
VHF formula given earlier is used. This is repeated here for convenience.
Max range (in nm) = 1.25 v'HT + 1.25v'HR
where HT is the height of the transmitter amsi, and HR is the height
of the receiver amsi.
The three factors involved in VHF formula are range, transmitter
height (am si) and the aircraft height (am si). Knowing any two of these,
the value of the third factor can be found.
Examples
(a) If the transmitter's altitude is 100 ft and the aircraft's altitude 12500 ft,
at what maximum range would the aircraft receive the VOR signals?
Range = 1.25VHT + 1.25VHR
= 1.25V(100) + 1.25V(12500)
= (1.25 x 10) + (1.25 x 112)
= 12.5 + 140
= 152nm (near enough)
(b) At what altitude should an aircraft be to receive VOR signals at a range
of 130 nm if the VOR transmitter is 500 ft am si?
Range = 1.25VHT + 1.25VHR
130 = 1.25V(500) + 1.25VHR
130 = 1.25(V(500) + VHR)
130
= \1(500) + VHR
1.25
104 = 22 + \lHR
\lHR = 104 -22 = 82
HR = 822
HR = 6725ft
(3) DOC: Protection range and altitude. At present there are only 20 channels
in the 108-112MHz band and a further 60 channels in 112-117.95MHz
band. Thus, the VOR band is very limited in channel space and like
NDBs it is necessary to protect the wanted signals from interference due

8/10/2019 Gsp Vol i Radio Aids
http://slidepdf.com/reader/full/gsp-vol-i-radio-aids 74/232
86 Radio Aids
to unwanted signals. The protection is given not only in range but in
altitude as well. Protection in altitude is possible because the signals
travel in straight lines.
This need for protection becomes apparent when one looks at the problem
from the planner's point of view. Suppose it is required to establish a VOR to
give interference-free reception at 25000 ft. First the distance the wave must
travel to gain that altitude due to the earth's curvature is calculated; the Tx is
at sea level (Fig. 6.12).
Range = 1.25\ (25000)
= 1.25 x 158
= 198 nm
Based on this calculation, another station, operating on the same frequency
channel must be at least another 198nm further away so as not to produce
interfering radiation. This gives a geographical separation distance of 396 nm.
--.:::
-
TXV
VB
Fig.6.12 Separating VORs
But this figure is derived from consideration of only one factor, that is,
the line-of-sight propagation. There are other calculable factors which must
be considered, e.g. the relative radiation strength of the two transmitters,
attenuation of the signals due to range and altitude and the degree of
protection required. The planners normally work on providing a protection of
20dB. At a fair estimate these factors would add another 100nm. Thus, to
establish this VOR, the planners must ensure that no other VOR within a
radius of 500 nm transmits on the same channel.
In a practical approach, a transmission is protected only to the extent
necessary, in range and altitude, and not necessarily to the maximum line-of-
sight range. Further, by increasing the radiation power of one transmitter,
the separation distance from other co-channel transmitters may be reduced.
Fig. 6.13 illustrates the practical scheme of providing protection. In the UK
these values are published under the term designated operational coverage
(DOC).
In Fig. 6.13 let us say that the protection range and altitude for VOR 1 is

8/10/2019 Gsp Vol i Radio Aids
http://slidepdf.com/reader/full/gsp-vol-i-radio-aids 75/232
87
OR and DVOR
given as 50/25000. An aircraft at a range of 50 nm from the transmitter is
protected from interference to an altitude of 25000 ft. Another aircraft, say at
30000ft will pass over the protected volume of airspace, at less than 50nm
(observe the diagram) and it has a fair chance of receiving interference-free
signals. These should not be used. Both altitude and range limits must be
observed.
(4) Nature ofte"ain. Uneven terrain, intervening high ground, mountains,
valleys, man-made obstacles: all these features affect VOR propagation.
The signals are screened, shadowed, reflected, bent, split and so forth,
giving erroneous information. Where such effects have been known to
exist, sectors giving errors are marked out and noted in the UKAIP .
Typical information reads: 'errors up to 5 0 may be experienced in
sector radials 315° to 345°. You may also find VORs in respect of which
more than one protection altitude and range are prescribed.
Factors affecting accuracy
(1) Site e"or. Irregular or uneven terrain, physical obstacles, etc. in the
vicinity of a VOR transmitter also affect its directional propagation.
Stringent requirements are laid down by ICAO regarding site contours,
presence of structures, trees, wire fences, etc. Even the overgrowth of
grass affects the signals. Error introduced in radiated directions by these
features is called VOR course displacement error. As we learnt earlier ,
VORs are ground-monitored to an accuracy of ::tl°.
(2) Propagation e"or. The signals having left the transmitter giving an
accuracy of ::tl°, suffer further inaccuracies as they travel forward.
Uneven terrain and other features which affect the signals at the site,
continue to affect them throughout their passage to the receiver .
(3) Airborne equipment e"or. Airborne equipment is required to translate
one degree of phase difference to one degree of change of direction.
Inaccuracy is introduced in the process to which the indicator makes its
contribution when the signals finally arrive for the display.
The above three errors in combination are called VOR aggregate errors;
errors listed under (1) and (2) being due to ground propagation and those
under (3) due to airborne equipment.
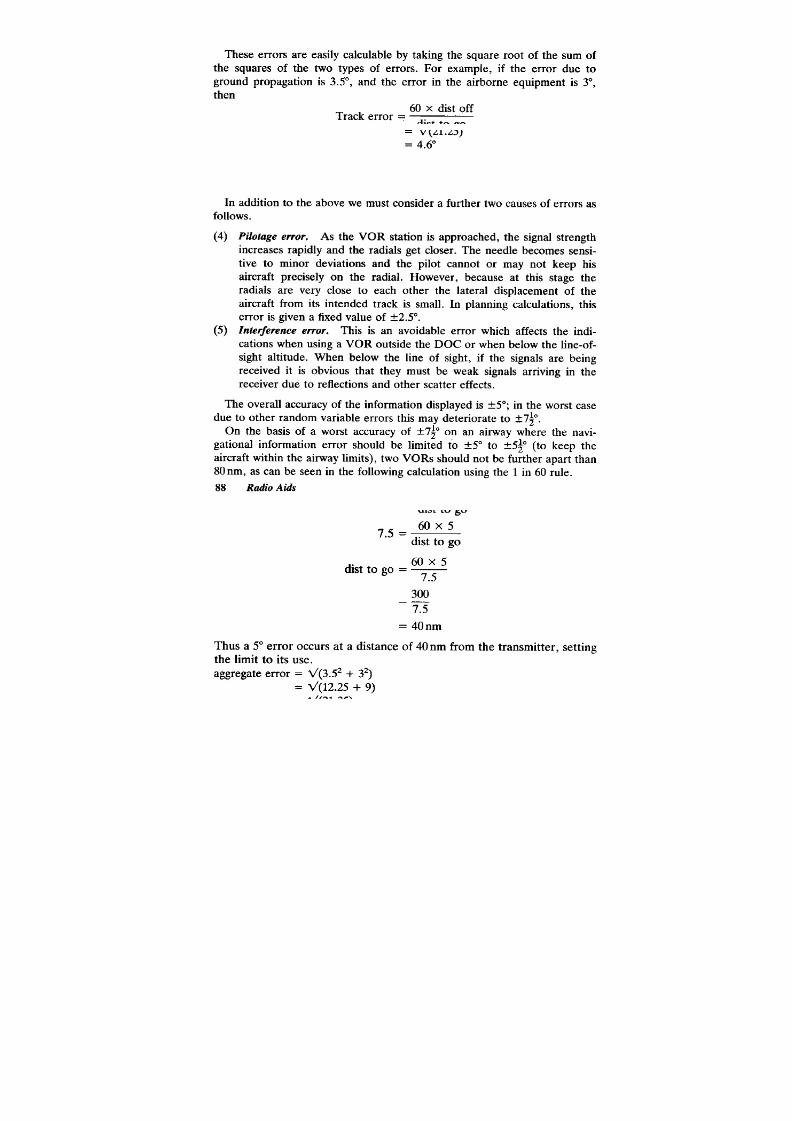
8/10/2019 Gsp Vol i Radio Aids
http://slidepdf.com/reader/full/gsp-vol-i-radio-aids 76/232
88 Radio Aids
These errors are easily calculable by taking the square root of the sum of
the squares of the two types of errors. For example, if the error due to
ground propagation is 3.5°, and the error in the airborne equipment is 3°,
then
aggregate error = V(3.52 + 32)
= V(12.25 + 9)
= V(21.25)
= 4.6°
In addition to the above we must consider a further two causes of errors as
follows.
(4) Pilotage e"or. As the VOR station is approached, the signal strength
increases rapidly and the radials get closer. The needle becomes sensi-
tive to minor deviations and the pilot cannot or may not keep his
aircraft precisely on the radial. However, because at this stage the
radials are very close to each other the lateral displacement of the
aircraft from its intended track is small. In planning calculations, this
error is given a fixed value of :t2.5°.
(5) Interference e"or. This is an avoidable error which affects the indi-
cations when using a VOR outside the DOC or when below the line-of-
sight altitude. When below the line of sight, if the signals are being
received it is obvious that they must be weak signals arriving in the
receiver due to reflections and other scatter effects.
The overall accuracy of the information displayed is :t5°; in the worst case
due to other random variable errors this may deteriorate to :t7 o.
On the basis of a worst accuracy of :t7 o on an airway where the navi-
gational information error should be limited to :t5° to :t5 o (to keep the
aircraft within the airway limits), two VORs should not be further apart than
80nm, as can be seen in the following calculation using the 1 in 60 rule.
60 x dist off
dist to go
6Ox5
dist to go
60 x 5
7.5
300
Track error =
7.5 =
dist to go =
7.5
= 40nm
Thus a 5° error occurs at a distance of 40 nm from the transmitter, setting
the limit to its use.
8/10/2019 Gsp Vol i Radio Aids
http://slidepdf.com/reader/full/gsp-vol-i-radio-aids 77/232
VOR and DVOR 89
Test VORs
These are installed at certain aerodromes to enable the pilots to test the
airborne VOR equipment during preflight checks. The transmitters are called
VOTs and the frequencies are published in the States' AlPs. To test the
airborne equipment from any position on the aerodrome, just tune in to the
channel and centralise the needle. OBS counters should indicate 000 FROM
or 180 TO. If they do not indicate within :t4°, the equipment requires
servicing.
Advantages of VOR as a navigational aid
.In comparison with the system it replaced, VOR gives its indications in a
form which is easy to see and follow
.In theory it provides an infinite number of tracks
.It is free from night effect and practically free from static
.Being a VHF aid its ranges can be accurately forecast before the beacons
are sited, thus avoiding interference
.Its left/right deviation indicator can also display ILS signals
.It can be frequency-paired with DME to give fixes
.It incorporates an equipment-failure warning device
.Its channel spacing is much better than NDBs
.Being in the VHF band, its aerials are smaller .
Disadvantages of VOR as a navigational aid
.Its left/right indications do not point to the beacon; thus, for a continuous
indication of QDMs an RMI must be used
.Only position lines are available
.High ground and man-made obstructions can cut off, reflect and attenuate
the signals
.Numerous beacons are required to give a large area coverage
.It gives line-of-sight ranges only.
Doppler VORs
Doppler VORs (DVORs) are the second generation VORs, the main aim
being to improve the accuracy of the signals.
Conventional transmitters suffer from reflections from objects in the vicinity
of the site. It was found that the errors due to this could be reduced if the
horizontal dimensions of the aerial system were increased. However, this
could not be achieved with the conventional method of transmission and a
new approach was necessary.
In the DVOR system the reference (or constant phase) signal is transmitted
from a central aerial and it is amplitude-modulated. The variable signal is
transmitted from a system of about 50 aerials encircling the central aerial and
it is frequency-modulated (Fig. 6.14). Thus the modulations are employed in
reverse roles. The circle of aerials is 44 ft in diameter to give the necessary
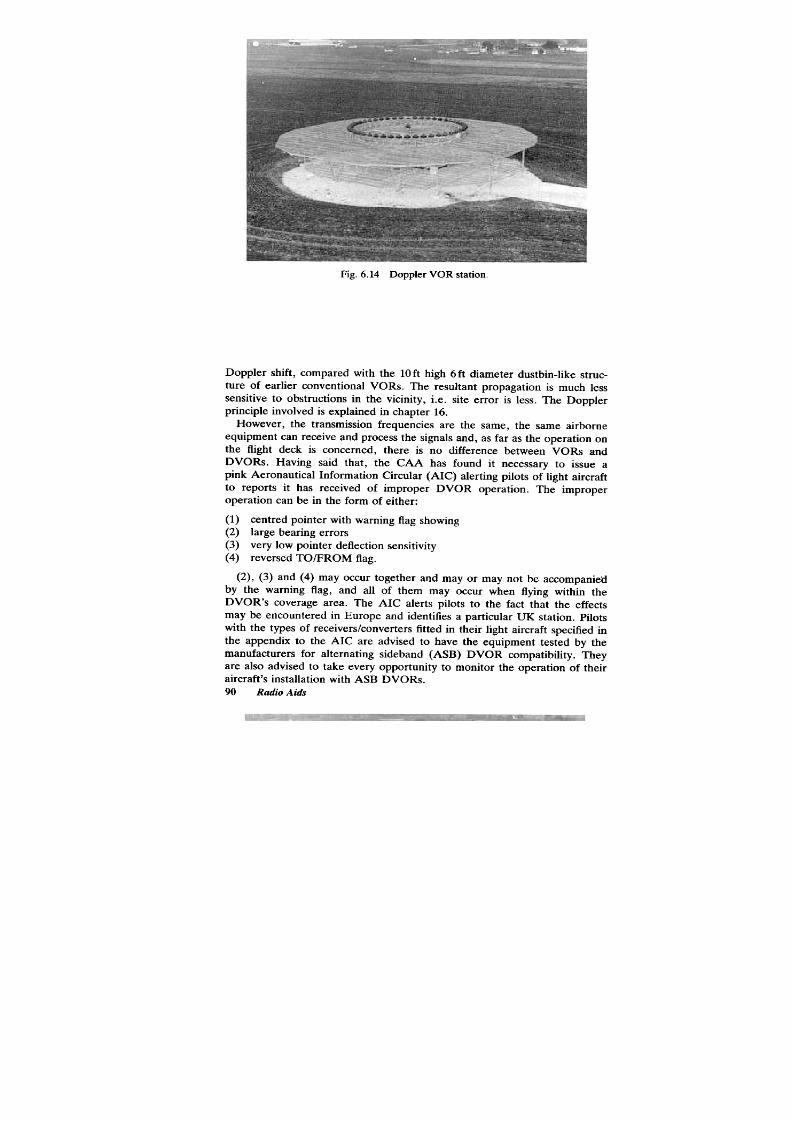
8/10/2019 Gsp Vol i Radio Aids
http://slidepdf.com/reader/full/gsp-vol-i-radio-aids 78/232
90
Radio Aids
Fig.6.14 Doppler VOR station.
Doppler shift, compared with the lOft high 6ft diameter dustbin-Iike struc-
ture of earlier conventional VORs. The resultant propagation is much less
sensitive to obstructions in the vicinity, i.e. site error is less. The Doppler
principle involved is explained in chapter 16.
However, the transmission frequencies are the same, the same airborne
equipment can receive and process the signals and, as far as the operation on
the flight deck is concerned, there is no difference between VORs and
DVORs. Having said that, the CAA has found it necessary to issue a
pink Aeronautical Information Circular (AIC) alerting pilots of light aircraft
to reports it has received of improper DVOR operation. The improper
operation can be in the form of either:
(1) centred pointer with warning flag showing
(2) large bearing errors
(3) very low pointer deflection sensitivity
(4) reversed TO/PROM flag.
(2), (3) and (4) may occur together and mayor may not be accompanietl
by the warning flag, and all of them may occur when flying within the
DVOR's coverage area. The AIC alerts pilots to the fact that the effects
may be encountered in Europe and identifies a particular UK station. Pilots
with the types of receivers/converters fitted in their light aircraft specified in
the appendix to the AIC are advised to have the equipment tested by the
manufacturers for alternating sideband (ASH) DVOR compatibility. They
are also advised to take every opportunity to monitor the operation of their
aircraft's installation with ASH DVORs.

8/10/2019 Gsp Vol i Radio Aids
http://slidepdf.com/reader/full/gsp-vol-i-radio-aids 79/232
VOR and DVOR
91
Exercises on use of VOR indicators and RBI
(1) An aircraft's VOR is tuned to station A. When 075 is selected on OBS
the needle becomes central and the TOIFROM indicator indicates TO.
At the same time, an NDB located on the VOR site gives a reading of
012° on ADF. What is the aircraft's heading, and what drift is being
experienced?
Answer: The aircraft's magnetic track is 075, and as the ADF indicates
012, the aircraft's nose is offset by 12° to the left. Thus, its heading is
(075 -12) = 063 and the drift is 12° starboard.
(2) An aircraft's heading is 050°(T), and is tracking on a VOR radial,
with 068 set on the OBS and TO/FROM indicator indicating TO. The
variation is 10°W. What should the aircraft's ADF read from an NDB
sited at the VOR station?
Answer: 008°.
(3) An aircraft bears 230O'f distance 15 nm from a VOR station. Local
variation is 10°W.
(a) What selected bearing should make the L/R needle central?
Answer: The aircraft's magnetic bearing from the station is (230 +
lOW) = 240. Thus, the needle will be central when 240 is selected; it
will also be central when its reciprocal, 060 is selected. Thus, the answer
is: 240 FROM or 060 TO.
(b) Would the L/R needle indicate left or right, if the bearing selected
is 055?
Answer: Turn right (if you draw a simple sketch you will notice that
the radial 055 is to the right of the radial 060 when extended to the
opposite side of the transmitter).
(4) If an aircraft is on a true bearing of 216° from a VOR station, what is
the phase difference between the reference and variable signals arriving
in the aircraft's receiver? The variation is 10°E.
Answer: 206°.
(5) An aircraft on a heading of 150°(M) tunes a VOR station, and selects
170 on the OBS. At that time the TO/FROM indicator reads TO
and the L/R needle is displaced very close to the maximum deflection
position, indicating a right-hand turn. What is the aircraft's approximate
position in relation to the transmitter?
Answer: Approximately to the magnetic north of the transmitter .
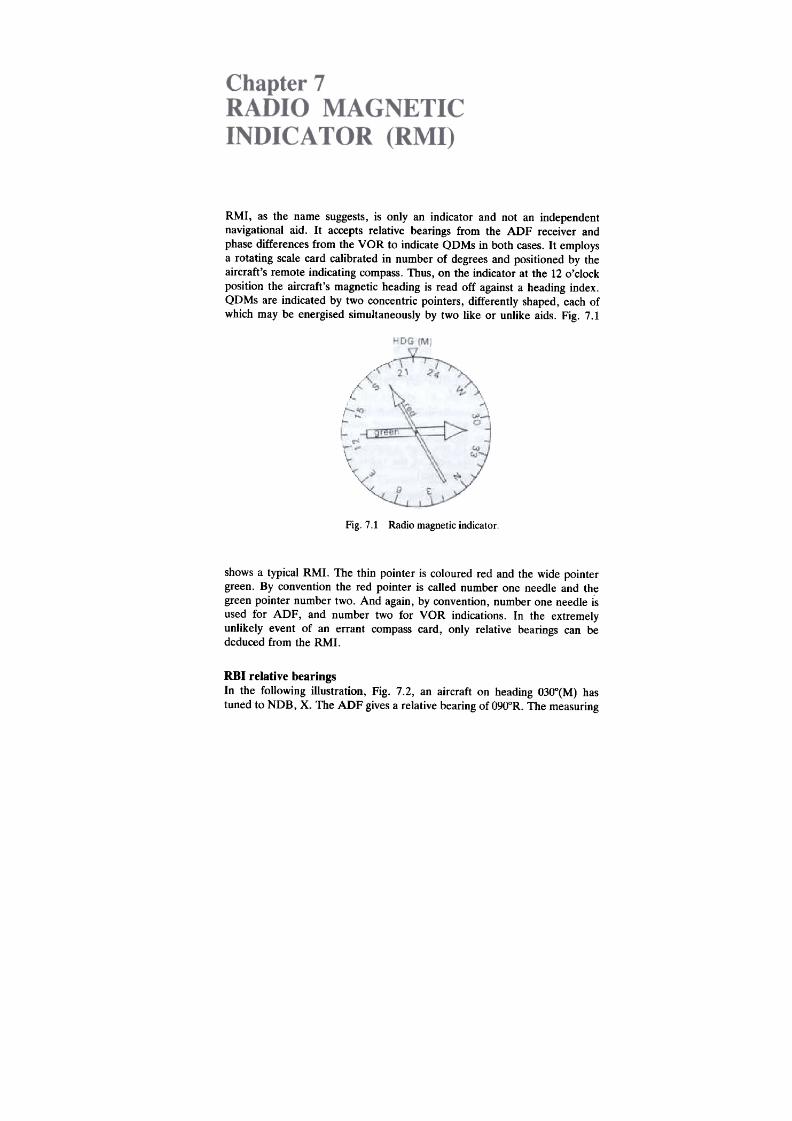
8/10/2019 Gsp Vol i Radio Aids
http://slidepdf.com/reader/full/gsp-vol-i-radio-aids 80/232
RMI, as the name suggests, is only an indicator and not an independent
navigational aid. It accepts relative bearings from the ADF receiver and
phase differences from the VOR to indicate QDMs in both cases. It employs
a rotating scale card calibrated in number of degrees and positioned by the
aircraft's remote indicating compass. Thus, on the indicator at the 12 o'clock
position the aircraft's magnetic heading is read off against a heading index.
QDMs are indicated by two concentric pointers, differently shaped, each of
which may be energised simultaneously by two like or unlike aids. Fig. 7.1
Fig. 7.1 Radio magnetic indicator .
shows a typical RMI. The thin pointer is coloured red and the wide pointer
green. By convention the red pointer is called number one needle and th~
green pointer number two. And again, by convention, number one needle is
used for ADF, and number two for VOR indications. In the extremely
unlikely event of an errant compass card, only relative bearings can be
deduced from the RMI.
RBI relative bearings
In the following illustration, Fig. 7.2, an aircraft on heading 0300(M) has
tuned to NDB, X. The ADF gives a relative bearing of 090oR. The measuring

8/10/2019 Gsp Vol i Radio Aids
http://slidepdf.com/reader/full/gsp-vol-i-radio-aids 81/232
Radio Magnetic Indicator
93
,
"
,
~ NDBX
,
Fig, 7 ,2 Relative bearing 090°,
datum on the indicator is 000, that is, the fore-and-aft axis of the aircraft.
From Fig. 7.2 we can see that the QDM to the NDB is 120° and thus, the
relationship between a relative bearing and a QDM is the aircraft's heading.
Or,
ReI Brg 090
+ Hdg(M) Q.;?:Q
QDM 120
In an RMI, this addition of the heading to the relative bearing is automati-
cally carried out by adjusting the measuring datum. By measuring the
pointer's indications from the aircraft's magnetic heading for datum (Fig.
7.3), the aircraft's QDM is read off. It will be noted that as the aircraft
1)'(1?
/
"
,
,
,
~ NDB X
Fig. 7.3 QDM assessment.
measures ADF relative directions with reference to its magnetic heading,
when this QDM is converted to a true bearing for plotting from the station,
the aircraft's magnetic variation (not the station's) must be applied.

8/10/2019 Gsp Vol i Radio Aids
http://slidepdf.com/reader/full/gsp-vol-i-radio-aids 82/232
94
Radio Aids
VOR phases
VOR airborne equipment receives phases of two different signals (reference
and variable) and derives QDR by taking the difference between the two. Its
reciprocal is QDM. An RMI accepts relative bearings and not QDMs. There-
fore the VOR phase difference giving QDM is first converted to give relative
bearing. This is achieved by use of a differential synchro in the VOR navi-
gation unit which subtracts the aircraft's magnetic heading to give relative
bearing before the information is fed to the RMI. The RMI subsequently
adds the aircraft's heading to give the QDM. In the illustration Fig. 7.4, the
aircraft is heading 030°(M) and the RMI indicates 120° QDM from VOR, Y.
The magnetic variations at the VOR station and the aircraft position are
different. The process of indication is as follows.
Var 1O0W
\\1
tH(M) 030
Var 15°W
t
~
~
\~
1--
radial 300 (QOM 120)
Il)easured here
'rl--
~ 5OR y
Fig. 7.4 VOR QDM
QDM received from VOR
-Aircraft H(M)
Rei Brg
+ Aircraft H(M)
Indicated QDM
120
030 aircraft variation
090
.Q.;?:QRMI card, aircraft variatiol
120 Station variation
Thus, first the magnetic heading is subtracted, and then the same value is
added. These two operations mutually cancel each other out and the resultant
indication is affected only by the variation at the VOR station. Therefore,
when converting QDM to true values for plotting, variation at the station
position is applied.
For reasons of mutual cancellation, the use of the aircraft's heading in-
troduces no error in the indication of VOR QDM. What would be in error is
the calculation as above to the stage where the relative bearing is found. This
is because the aircraft is using a variation which is different from the station
variation. We will look into this in detail.

8/10/2019 Gsp Vol i Radio Aids
http://slidepdf.com/reader/full/gsp-vol-i-radio-aids 83/232
Radio Magnetic Indicator
I)~
Discrepancies in indications
(1) If the aircraft's variation is different from the station's variation, the
indication of the relative bearing is incorrect but the QDM indicated is
still correct .
In Fig. 7.5, aircraft A and B are on a magnetic heading of 030°. The
variation at A's position is 20°W, the variation at both B's and the station's
position is 10°W. Both aircraft are on a QDM of 100° from VOR, X. From
the figure it will be apparent that the relative bearing of the VOR transmitter
from aircraft A is 080°R and from aircraft B, 070°R. Both aircraft calculate a
QDM of 100° as follows.
~ow ~ow ~ow
\ HIM) 030 H(M) 030
'\1
: ',AB OBO
280
-
/
a/c B
VOR X
/c A
Fig. 7.5 Variation effect
Aircraft A
Aircraft B:
+ Hdg(M) Q:?Q
QDM 100
QDM 100
-Hdg(M) Q:?Q
Rei Brg 070
+Hdg(M) Q:?Q Indicates correct relative bearing (same
QDM 100 variation)
(2) If an NDB is located on the VOR site, QDMs from the VOR and the
NDB as displayed by an RMI will be different, if the variation between
the aircraft and the station positions is different.
In Fig. 7.5, the VOR gives a QDM of 100°. This is measured at the VOR
site. An NDB on the same site would give a relative bearing of 080°R to the
aircraft, using local variation. An RMI adds relative bearing to the heading to
give the QDM. Thus the QDM displayed is (0800 + 030°) = 110°. simultane-
ously, the VOR pointer will indicate a QDM of 100°.
Similar discrepancies in the indications will be observed due to conver-
gency between aircraft and the station positions. This is because, like variation

8/10/2019 Gsp Vol i Radio Aids
http://slidepdf.com/reader/full/gsp-vol-i-radio-aids 84/232
96
Radio Aids
effect, the aircraft's true north (from which it derives its magnetic heading) is
different from the true north direction of the station. When QDM from a
VOR is displayed, the relative bearing indication will be approximate and
when QDMs from VOR/NDB are displayed, the two QDMs will show a
difference. The discrepancy will be the value of convergency.
Thus, variation and convergency affect the indications as explained above.
However, these considerations are more of academic nature than practical. In
practical use of the equipment, an aircraft not too far from the transmitters
will experience only minor discrepancies and these may be disregarded. And
the QDMs from VORs are always shown correct.
However, if these two QDMs are required to be reduced to plotting values,
the procedure should be as follows:
QDM derived from an NDB: apply variation at the aircraft and plot the
reciprocal; QDM derived from a VOR, apply station variation and plot the
reciprocal. For fuller explanations on plotting techniques, the student should
consult Ground Studies for Pilots volume 2.
Advantages or RMI
.QDM/QDR are indicated continuously and read off directly. The tail end
of the pointers indicate QDRs
.Using two beacons, instantaneous fixes are obtained
.RMI indications provide a very useful guide when initially joining a radial
for VOR homing
.The indicator itself can be used for homing
.Magnetic headings can be read off together with QDMs
.Approximate relative bearings may be read off against a fixed RBI scale
or assessedvisually.
Homing to/from a station
Fig. 7.6 shows the indications on RMI and RBI and Fig. 7.7 shows indi-
cations on the VOR L/R deviation indicator and RMI when homing to/from
a station.
VOR -NDB -RMI exercises
(1) An aircraft bears 220°(T) distance 20nm from a VOR beacon. Its
heading is 055°(M) and variation is 20°W.
(a) What selected bearing should make the L/R needle central?
(b) Would the L/R needle indicate turn to left or right if the selected
radial was 055?
(a) Brg Mag = 220°(T) + 20°W (Var)
= 240
...QDM = 240 -180
= 060 which, when selected will make L/R needle
central.
Also, its reciprocal, 240 will make the needle centra .
:. 060 TO and 240 FROM

8/10/2019 Gsp Vol i Radio Aids
http://slidepdf.com/reader/full/gsp-vol-i-radio-aids 85/232
Radio Magnetic Indicator
97
000
AMI
Fig. 7.6 Homing procedures using RBI and RMI.
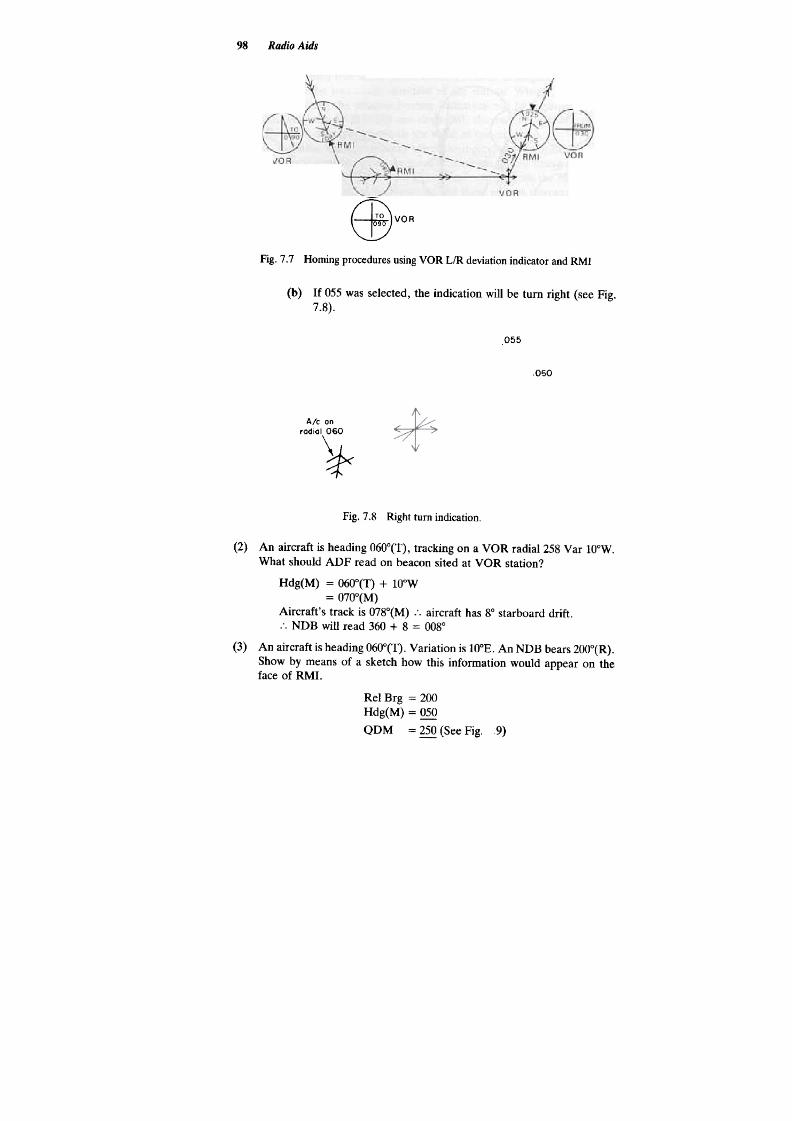
8/10/2019 Gsp Vol i Radio Aids
http://slidepdf.com/reader/full/gsp-vol-i-radio-aids 86/232
98
Radio Aids
~VOR
Fig. 7.7 Homing procedures using VOR L/R deviation indicator and RMI
(b) If 055 was selected, the indication will be turn right (see Fig.
7.8).
055
060
A/c an
radial 060
~
Fig. 7.8 Right turn indication.
(2) An aircraft is heading 060°(T), tracking on a VOR radial 258 Var 10°W.
What should ADF read on beacon sited at VOR station?
Hdg(M) = 060°(T) + 10°W
= 070°(M)
Aircraft's track is 078°(M) .'. aircraft has 8° starboard drift-
:, NDB will read 360 + 8 = 008°
(3) An aircraft is heading 060°(T). Variation is 10°£. An NDB bears 200°(R).
Show by means of a sketch how this information would appear on the
face of RMI.
ReI Brg = 200
Hdg(M) = 050
QDM =
9)
(See Fig.
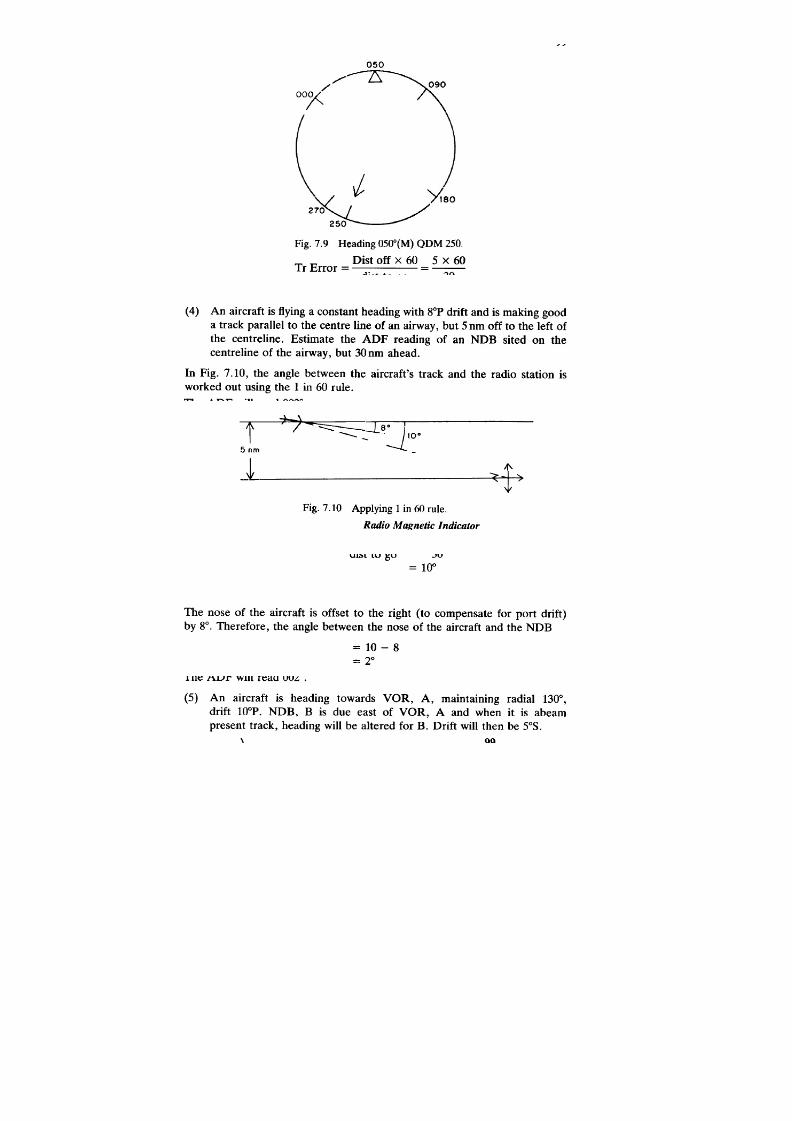
8/10/2019 Gsp Vol i Radio Aids
http://slidepdf.com/reader/full/gsp-vol-i-radio-aids 87/232
Radio Magnetic Indicator
99
050
--zsX 0
/
O°'<
\
,';-0<r /
'V~
')'{80
Fig. 7.9 Heading 050°(M) QDM 250.
(4) An aircraft is flying a constant heading with soP drift and is making good
a track parallel to the centre line of an airway, but 5 nm off to the left of
the centreline. Estimate the ADF reading of an NDB sited on the
centreline of the airway, but 30 nm ahead.
In Fig. 7.10, the angle between the aircraft's track and the radio station is
worked out using the 1 in 60 rule.
i ~ --=-:::::-:
5nm
-t
.JI~.
11'
Fig.7.10 Applying 1 in 60 rule.
Dist off x 60
dist to go
5 x 60
Tr Error =
=
30
= 10°
The nose of the aircraft is offset to the right (to compensate for port drift)
by 8°0 Therefore, the angle between the nose of the aircraft and the NDB
= 10 -8
= 2°
The ADF will read 002°.
(5) An aircraft is heading towards VOR, A, maintaining radial 130°,
drift 10°P. NDB, B is due east of VOR, A and when it is abeam
present track, heading will be altered for B. Drift will then be 5°S.
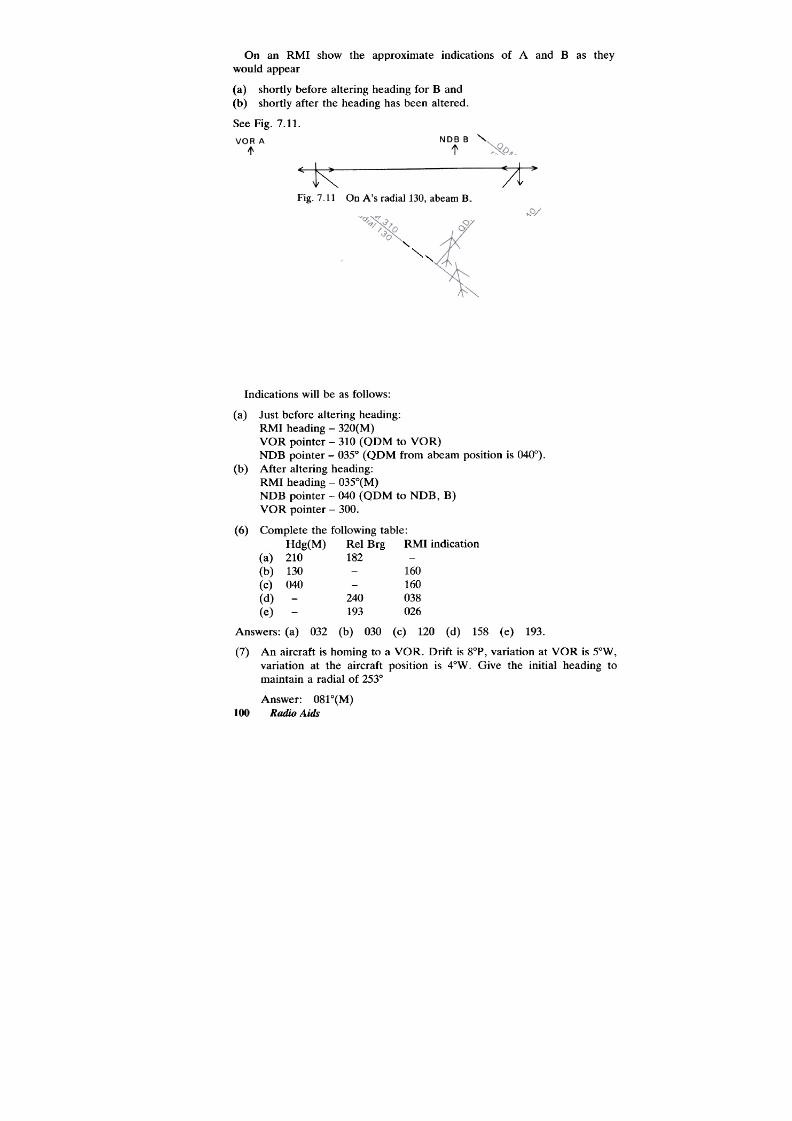
8/10/2019 Gsp Vol i Radio Aids
http://slidepdf.com/reader/full/gsp-vol-i-radio-aids 88/232
100
Radio Aids
On an RMI show the approximate indications of A and B as they
would appear
(a) shortly before altering heading for B and
(b) shortly after the heading has been altered.
See Fig. 7.11.
"
"
"'
,
Fig.7.11 On A's radial 130, abeam B.
Indications will be as follows:
(a) Just before altering heading:
RMI heading -320(M)
VOR pointer -310 (QDM to VOR)
NDB pointer- 035° (QDM from abeam position is 040°).
(b) After altering heading:
RMI heading -035°(M)
NDB pointer- 040 (QDM to NDB, B)
VOR pointer -300.
(6) Complete the following table:
Hdg(M) Rei Brg RMI indication
(a) 210 182
(b) 130 160
(c) 040 160
(d) 240 038
(e) 193 026
Answers: (a) 032 (b) 030 (c) 120 (d) 158 (e) 193.
(7) An aircraft is homing to a VOR. Drift is 8°P, variation at VOR is 5°W,
variation at the aircraft position is 4°W. Give the initial heading to
maintain a radial of 253°
Answer: 081°(M)
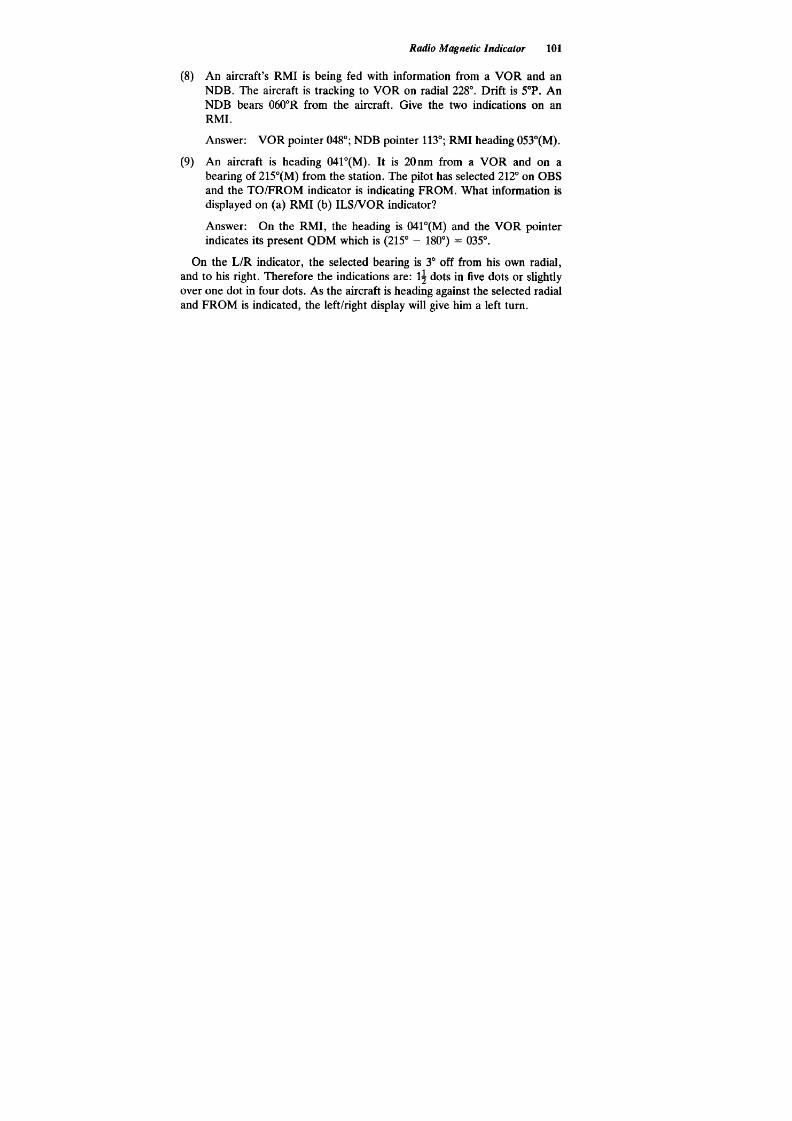
8/10/2019 Gsp Vol i Radio Aids
http://slidepdf.com/reader/full/gsp-vol-i-radio-aids 89/232
Radio Magnetic Indicator
101
(8) An aircraft's RMI is being fed with information from a VOR and an
NDB. The aircraft is tracking to VOR on radial 228°. Drift is sop. An
NDB bears 060oR from the aircraft. Give the two indications on an
RMI.
Answer: VOR pointer 048°; NDB pointer 113°; RMI heading 053°(M).
(9) An aircraft is heading 041°(M). It is 20nm from a VOR and on a
bearing of 215°(M) from the station. The pilot has selected 212° on OBS
and the TO/FROM indicator is indicating FROM. What information is
displayed on (a) RMI (b) ILSNOR indicator?
Answer: On the RMI, the heading is 041°(M) and the VOR pointer
indicates its present QDM which is (215° -180°) = 035°.
On the L/R indicator, the selected bearing is 3° off from his own radial,
and to his right. Therefore the indications are: 1 dots in five dots or slightly
over one dot in four dots. As the aircraft is heading against the selected radial
and FROM is indicated, the left/right display will give him a left turn.

8/10/2019 Gsp Vol i Radio Aids
http://slidepdf.com/reader/full/gsp-vol-i-radio-aids 90/232
ILS is a pilot-interpreted runway approach aid, developed during the Second
World War and now in world-wide use. The system provides the pilot with
visual instructions enabling the aircraft to be flown along a predetermined
flight path to the threshold of the runway being served by the system. In
practice, the pilot descends to his decision/critical height and then by visual
reference makes his final decision to land or overshoot. With this system the
ground transmissions are continuous and no assistance from the ground
control is required.
The runway being served by the ILS or precision approach radar (PAR) is
called a precision instrument runway.
The ILS ground installation consists of the following three components:
(1) Localiser transmitter, together with its aerial system; this transmitter
supplies approach guidance in azimuth along the extended runway
centreline
(2) Glidepath transmitter, together with its aerial system; this transmitter
provides approach guidance in the vertical plane
(3) Two or three marker beacons, each with its own aerial; they provide
range check points
A layout of the ground system is shown in Fig. 8.1.
The localiser transmitter
The radio signals transmitted by the localiser antenna produce a composite
field pattern along the approach direction, consisting of two overlapping
lobes. The transmitter aerial is located in line with the runway centreline,
approximately 300 m from the upwind end of the runway. The two lobes are
transmitted on a single ILS frequency in VHF and in order that the receiver
can distinguish between them, they are differently modulated. That lobe on
the right-hand side of the runway as seen by the pilot making an approach is
modulated by a 150Hz signal and the sector it forms is called the blue sector
(see Fig. 8.2). The lobe on the left-hand side is modulated by a 90Hz
note and the sector formed by it is called the yellow sector. An aircraft
approaching the runway in the landing direction will detect more of the 90 Hz

8/10/2019 Gsp Vol i Radio Aids
http://slidepdf.com/reader/full/gsp-vol-i-radio-aids 91/232
ILS and MLS
103
localiser TX
glide
~
Fig.8.
ILS ground system layout.
~~
Fig. 8.2 Blue and yellow sectors
modulation note and relatively less of the 150Hz modulation note if it is to
the left of the centre line. This excess of 90Hz modulation (difference in
depth of modulation (DDM) ) will energise the vertical needle of the ILS
meter (or VOR/ILS indicator) to indicate a right-hand turn. Similarly, an
aircraft flying to the right-hand side of the centreline will have an excess of
the 150 Hz modulation note and the needle will indicate a left-hand turn. The
line along which the DDM is 0 defines the runway centreline. When flying
along this line there will be no deflection of the needle, indicating that the
aircraft is on the centreline.
Localiser coverage -category 1
The localiser coverage extends from the transmitter to 25 nm, 10° either side
of the centreline. However, it widens to 35° from the centreline to a range
of 17nm (see Fig. 8.3). These dimensions may be reduced where it is nec-
essary for topographical reasons. The vertical coverage in the areas already
described is 7°. In this volume of airspace the radiation field strength is
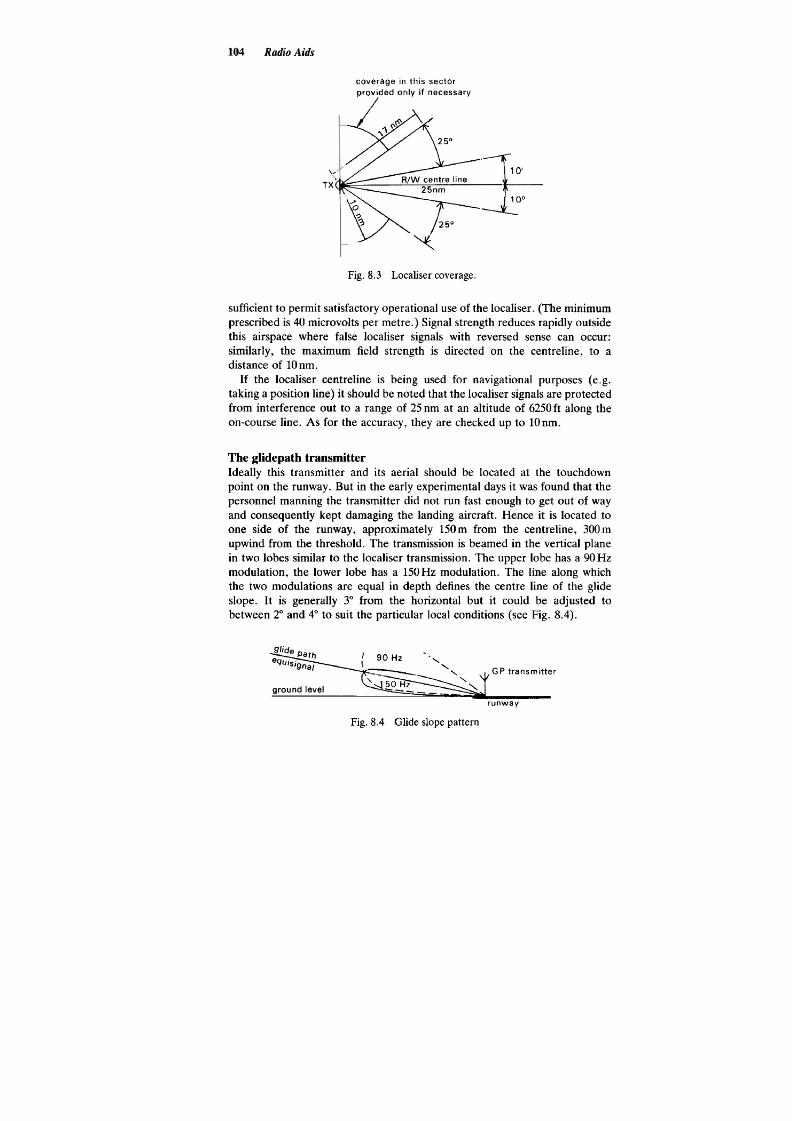
8/10/2019 Gsp Vol i Radio Aids
http://slidepdf.com/reader/full/gsp-vol-i-radio-aids 92/232
104
Radio Aids
coverage in this sector
provided orl y if necessary
/
TX
--f"
10'
~oo
~
Fig. 8.3 Localiser coverage.
sufficient to permit satisfactory operational use of the localiser. (The minimum
prescribed is 40 microvolts per metre.) Signal strength reduces rapidly outside
this airspace where false localiser signals with reversed sense can occur:
similarly, the maximum field strength is directed on the centreline, to a
distance of 10 nm.
If the localiser centreline is being used for navigational purposes ( e.g.
taking a position line) it should be noted that the localiser signals are protected
from interference out to a range of 25 nm at an altitude of 6250 t along the
on-course line. As for the accuracy, they are checked up to 10 nm.
The glidepath transmitter
Ideally this transmitter and its aerial should be located at the touchdown
point on the runway. But in the early experimental days it was found that the
personnel manning the transmitter did not run fast enough to get out of way
and consequently kept damaging the landing aircraft. Hence it is located to
one side of the runway, approximately 150 m from the centreline, 300 m
upwind from the threshold. The transmission is beamed in the vertical plane
in two lobes similar to the localiser transmission. The upper lobe has a 90 Hz
modulation, the lower lobe has a 150 Hz modulation. The line along which
the two modulations are equal in depth defines the centre line of the glide
slope. It is generally 3° from the horizontal but it could be adjusted to
between 2° and 4° to suit the particular local conditions (see Fig. 8.4).
~
ground level G p transmitter
runway
90Hz
~
Fig. 8.4 Glide slope pattern

8/10/2019 Gsp Vol i Radio Aids
http://slidepdf.com/reader/full/gsp-vol-i-radio-aids 93/232
ILS and MLS 105
The glidepath (GP) coverage -category 1
The coverage in azimuth extends 8° on either side of the GP centreline, to a
distance of 10nm (see Fig. 8.5). In the vertical plane the coverage begins
from 0.45 x GP angle (8) above the surface to 1.75 x GP angle (8) above
the surface. This means that for a 3°GP angle the coverage is from 1.35° to
5.25° above the surface. (Note: The coverage and field strength data given
above for localiser and glide path transmissions are appropriate for category
1, ILS.)
azimuth coverage
~
elevation coverage
Fig. 8.5 Glidepath (GP) coverage.
ILS indicator
ILS uses the VOR's L/R deviation indicator (OBS being inoperative), incor-
porating an additional horizontal needle. This needle is inoperative when the
indicator is displaying VOR information. The indicator is also described as
the VOR/ILS meter (Fig. 8.6). The indicator illustrated in Fig. 8.6 is a five-
dot indicator, dot 1 being the outer edge of the centre circle.
1
12 dots
fly left -
Fig.8.6 ILS indicator.

8/10/2019 Gsp Vol i Radio Aids
http://slidepdf.com/reader/full/gsp-vol-i-radio-aids 94/232
106
Radio Aids
When used with ILS, the vertical pointer indicates the aircraft's deviations
in azimuth, and the horizontal needle indicates its position with regard to the
glide slope centreline. Both needles remain in the central position when
.the receiver is switched off or no signals are being received, or
.the aircraft is on the centre line of the localiser and the glide path.
The bottom of the dial is coloured blue to the left and yellow to the right.
This indicates to the pilot the localiser sector he is in, e.g. if the vertical
needle has swung to the left, the aircraft is in the blue sector.
All ILS indicators employ two failure warning flags; one operating in
association with localiser signals (this flag also operates in association with
VOR), the other with the glidepath signals. They fall into view in the
windows and the needles return to the central position when:
.ground or airborne equipment has failed or is switched off, and
.out of the service area or the signals being received are too weak. (The
signal strength falls off quickly once outside the service area. )
Monitoring of ILS transmissions
Both localiser and glidepath transmitters are automatically monitored by
monitoring equipment located in an area of guaranteed reception within the
normal service sector. It will act in one of the following circumstances:
(1) a localiser shift of more than 35ft from the centreline
(2) a glide slope angle change of more than 0.075 x basic glidepath angle,
e.g. 3 x 0.075° = 0.225°
(3) a reduction in power output of 50% or more of any of the transmitters.
In any of the above circumstances, the monitoring unit will provide warning
to a designated control point and cause any of the following to occur before a
standby transmitter is brought into use:
(1) the cessation of all radiations
(2) the removal of the ident signal and/or the navigational component (i.e.
localiser and glide path)
(3) if the ILS is category 2 or 3, the monitor may permit operation to a
lower category , i.e. 1 or 2. (See later reference to ILS categories. )
Localiser indications
The vertical pointer is used for localiser indications. The needle tells you
which way to turn and the horizontal deflection scale gives you an estimate of
the angular displacement from the centreline. The coloured sectors at the
bottom tell you which sector you are in. Follow the illustration in Fig. 8.7.
Aircraft A is in the blue sector, and the needle indicates left turn. Aircraft
B is in the blue sector, and the needle indicates left turn. Thus, the indication
is given according to the sector the aircraft is in, not according to its heading.
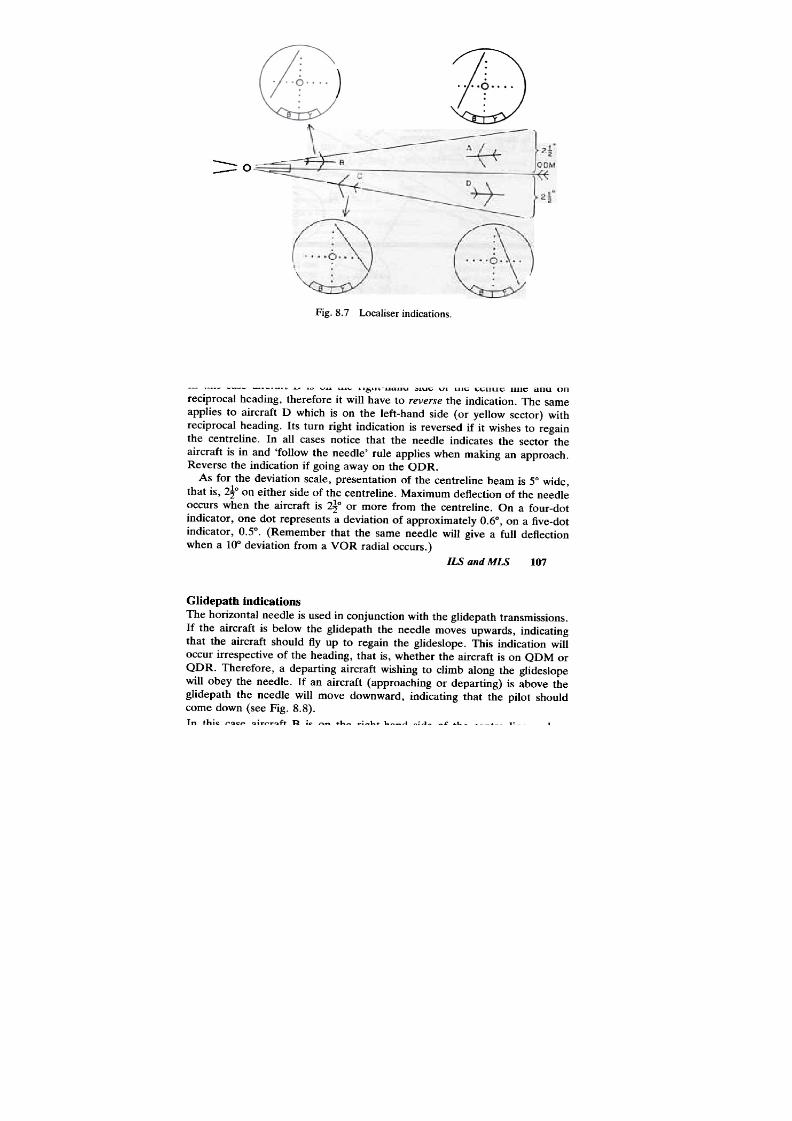
8/10/2019 Gsp Vol i Radio Aids
http://slidepdf.com/reader/full/gsp-vol-i-radio-aids 95/232
ILS and MLS
107
--0
-
Fig. 8.7 Localiser indications.
In this case aircraft B is on the right-hand side of the centre line and on
reciprocal heading, therefore it will have to reverse the indication. The same
applies to aircraft D which is on the left-hand side (or yellow sector) with
reciprocal heading. Its turn right indication is reversed if it wishes to regain
the centreline. In all cases notice that the needle indicates the sector the
aircraft is in and 'follow the needle' rule applies when making an approach.
Reverse the indication if going away on the QDR.
As for the deviation scale, presentation of the centreline beam is 5° wide,
that is, 2~oon either side of the centreline. Maximum deflection of the needle
occurs when the aircraft is 2~o or more from the centreline. On a four-dot
indicator, one dot represents a deviation of approximately 0.6°, on a five-dot
indicator, 0.5°. (Remember that the same needle will give a full deflection
when a 10° deviation from a VOR radial occurs.)
Glidepath indications
The horizontal needle is used in conjunction with the glidepath transmissions.
If the aircraft is below the glidepath the needle moves upwards, indicating
that the aircraft should fly up to regain the glideslope. This indication will
occur irrespective of the heading, that is, whether the aircraft is on QDM or
QDR. Therefore, a departing aircraft wishing to climb along the glideslope
will obey the needle. If an aircraft (approaching or departing) is above the
glidepath the needle will move downward, indicating that the pilot should
come down (see Fig. 8.8).

8/10/2019 Gsp Vol i Radio Aids
http://slidepdf.com/reader/full/gsp-vol-i-radio-aids 96/232
108 Radio Aids
Fig. 8.8 Glidepath indications.
Full deflection of the needle occurs when the aircraft is 0.7° or more above
or below the glidepath (1 dot = 0.14°). A two-dot fly-up indication out of
four dots or 2 dots out of five dots (in other words, half full deflection) is to
be regarded as the maximum safe deviation below the glidepath. On seeing
any indications below this, an immediate climb must be instituted: remember
this at all costs.
In Fig. 8.6, the indicator gives the combined indications of localiser and
glidepath deviations. The interpretation depends on whether you are ap-
proaching the runway (on QDM) or going away from the runway (QDR):
.if on QDM, the indications in Fig. 8.6 instruct you to turn left and climb
.if on QDR, the instructions are to turn right and climb.
Marker beacons
Usually two, some times three marker beacons are installed along the
extended centreline to give range indications on approach. This enables the
pilot to check his height as he passes each marker. All markers transmit on a
single frequency of 75 MHz and radiate a fan pattern upward to a calibrated
height of approximately 3000 t. The marker farthest from the touchdown
point is placed approximately 3 to 6 nm, average 4 nm, from the touchdown
point and is known as the outer marker (OM). It transmits a low-pitched
400 Hz modulation signal and identifies itself in morse as well as visually.
When crossing the beacon, a series of dashes is heard in the earphone, the

8/10/2019 Gsp Vol i Radio Aids
http://slidepdf.com/reader/full/gsp-vol-i-radio-aids 97/232
ILS and MLS
109
rate being two dashes per second. Simultaneously the blue marker light will
flash dashes at the same rate.
The next marker on the approach path is called the middle marker (MM),
placed approximately 3500ft (5000 ::t 500ft in the UK) from the touchdown
point. It transmits a series of alternate dots and dashes at a higher pitch,
1300Hz, which are heard in the earphones and also seen flashing on the
amber marker light.
The marker nearest to the beginning of the runway is called the inner
marker (IM). It transmits six high-pitched (3000Hz) dots per second and the
white light flashes. When installed, it is located between 250 and 1500 t.
Summary of the markers associated with ILS
Designation
Distance from the RW touchdown
Signal characteristics
Outer marker
3-6 nm, average 4 nm
Middle marker
3500ft (5000 :t 500ft in the UK)
Inner marker
250-1500 ft
Transmission modulated by
400 Hz, 2 low-pitched
dashes per second -blue
light flashes
1300Hz signal keyed to form
alternate dots and dashes
-amber light flashes
3000 Hz signal, 6 high-
pitched dots per second -
white light flashes
Thus the markers are identified in three ways: by audio signals, visual
signals and the transmission pitch.
One or two locators may be used to supplement the ILS. These locators
are low-powered NDBs and share the sites of the OMs and MMs. If only one
locator is used, it is usually installed on the site of the OM. The transmission
frequencies of these locators (where two are being used) should not be closer
than 15 kHz, otherwise mutual interference may result. Also, they should not
be further apart than 25 kHz to permit a quick tuning shift when operating on
a single indicator. These locators serve a three-fold purpose:
.they assist the pilot to home to the station and subsequently join the ILS
pattern
.they may be used for holding purposes
.they provide a double check when passing over the markers.
On approach charts they are indicated by a standard abbreviation LOM
(locator, outer marker) and LMM (locator, middle marker).
DME is used as an alternative to the markers. Its radiation is then so
adjusted as to give zero range at or near the touchdown point. It may be
frequency-paired with the ILS localiser so that when the ILS is switched
on, the DME automatically starts functioning. One DME may serve both
approaches to a runway.
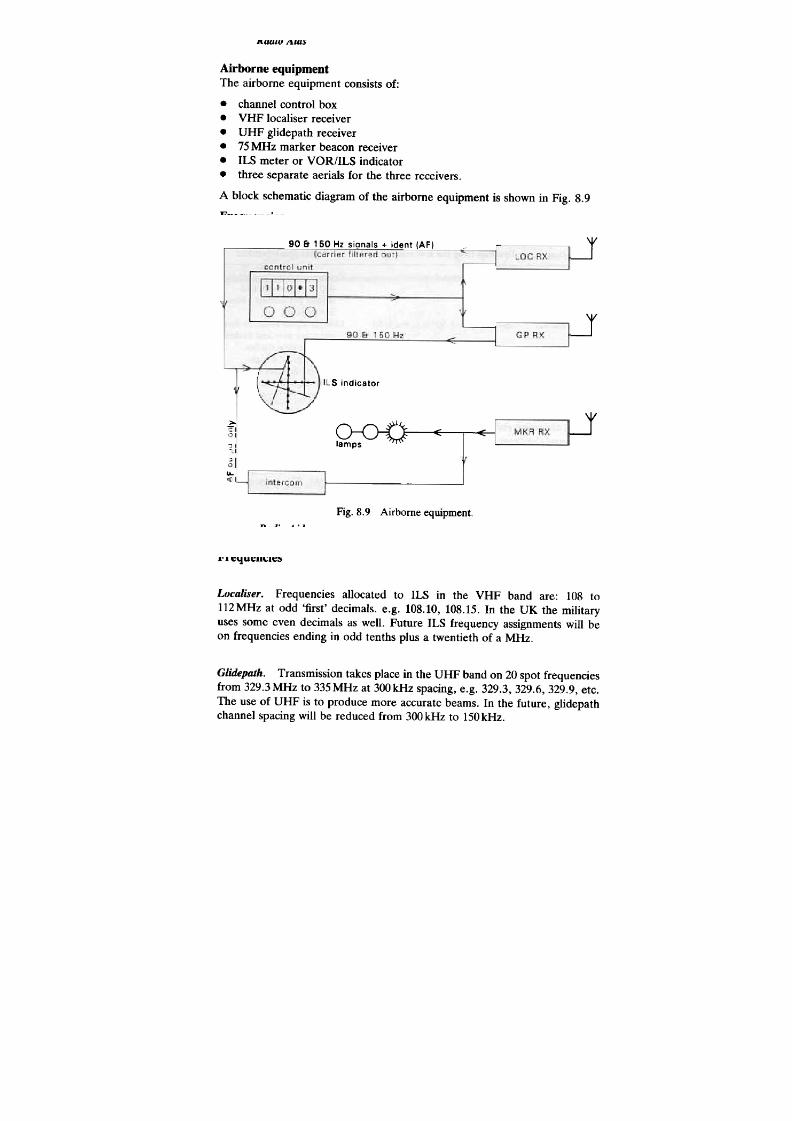
8/10/2019 Gsp Vol i Radio Aids
http://slidepdf.com/reader/full/gsp-vol-i-radio-aids 98/232
Radio Aids
Airborne equipment
The airborne equipment consists of:
.channel control box
.VHF localiser receiver
.UHF glidepath receiver
.75 MHz marker beacon receiver
.ILS meter or VOR/ILS indicator
.three separate aerials for the three receivers.
A block schematic diagram of the airborne equipment is shown in Fig. 8.9
-1
0 & 150Hz si~nals + ide~
(carrier filtered out)
LOC AX
control unit
~
000
~
90 & 150Hl GP AX
s indicator
,
:-1
::.
Q:OO oE: I oE:
lamps
u,1
intercom
Fig. 8.9 Airborne equipment
Frequencies
Localiser. Frequencies allocated to ILS in the VHF band are: 108 to
112MHz at odd 'first' decimals. e.g. 108.10, 108.15. In the UK the military
uses some even decimals as well. Future ILS frequency assignments will be
on frequencies ending in odd tenths plus a twentieth of a MHz.
Glidepath. Transmission takes place in the UHF band on 20 spot frequencies
from 329.3MHz to 335MHz at 300kHz spacing, e.g. 329.3,329.6,329.9, etc.
The use of UHF is to produce more accurate beams. In the future, glidepath
channel spacing will be reduced from 300 kHz to 150 kHz.
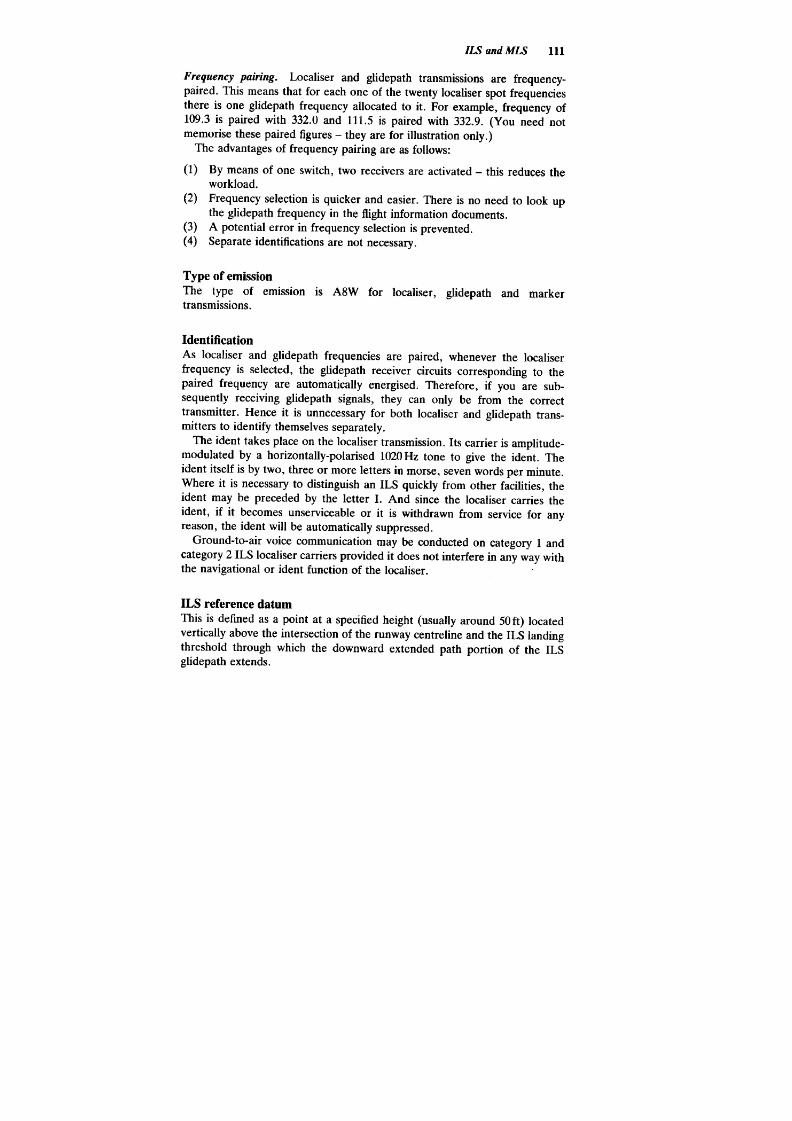
8/10/2019 Gsp Vol i Radio Aids
http://slidepdf.com/reader/full/gsp-vol-i-radio-aids 99/232
lLS and MLS
III
Frequency pairing. Localiser and glidepath transmissions are frequency-
paired. This means that for each one of the twenty localiser spot frequencies
there is one glidepath frequency allocated to it. For example, frequency of
109.3 is paired with 332.0 and 111.5 is paired with 332.9. (You need not
memorise these paired figures -they are for illustration only.)
The advantages of frequency pairing are as follows:
(I) By means of one switch, two receivers are activated- this reduces the
workload.
(2) Frequency selection is quicker and easier. There is no need to look up
the glidepath frequency in the flight information documents.
(3) A potential error in frequency selection is prevented.
(4) Separate identifications are not necessary.
Type of emission
The type of emission is A8W for localiser, glidepath and marker
transmissions .
Identification
As localiser and glidepath frequencies are paired, whenever the localiser
frequency is selected, the glidepath receiver circuits corresponding to the
paired frequency are automatically energised. Therefore, if you are sub-
sequently receiving glidepath signals, they can only be from the correct
transmitter. Hence it is unnecessary for both localiser and glidepath trans-
mitters to identify themselves separately.
The ident takes place on the localiser transmission. Its carrier is amplitude-
modulated by a horizontally-polarised 1020Hz tone to give the ident. The
ident itself is by two, three or more letters in morse, seven words per minute.
Where it is necessary to distinguish an ILS quickly from other facilities, the
ident may be preceded by the letter I. And since the localiser carries the
ident, if it becomes unserviceable or it is withdrawn from service for any
reason, the ident will be automatically suppressed.
Ground-to-air voice communication may be conducted on category 1 and
category 2 ILS localiser carriers provided it does not interfere in any way with
the navigational or ident function of the localiser .
ILS reference datum
This is defined as a point at a specified height (usually around SOft) located
vertically above the intersection of the runway centreline and the ILS landing
threshold through which the downward extended path portion of the ILS
glidepath extends.

8/10/2019 Gsp Vol i Radio Aids
http://slidepdf.com/reader/full/gsp-vol-i-radio-aids 100/232
112
Radio Aids
ILS categories
Background. The ILS project, originally conceived to develop a blind
landing system, did not quite reach its objective and turned out to be an
instrument 'approach to landing' aid. But still it was a great step forward in
those days: its faults were forgiven by the operators and it received ICAO's
blessing in 1946.
As civil aviation developed, the operators became increasingly more
weather-conscious. They disliked the thought of delaying a flight or wasting
time and fuel while holding overhead an aerodrome waiting for the weather
to clear. The ILS had its faults, the main one being production of bends in
the beam. These were produced by reflections from obstacles on and around
the aerodrome, e.g. airport structures, vehicles, aircraft flying overhead the
localiser aerial, and so forth. The airborne equipment, similarly, was just
adequate to handle the existing system.
In 1958 British Airways (then BOAC) announced its intention to go for all-
weather-operation and a positive move in that direction began. Improvement
had to come to both the ground and the airborne equipment. As for the
ground equipment, it was decided to develop an entirely new landing system
based on modern technology, but in the meantime to retain and improve
the system. For an improvement, new transmission data were prescribed,
course structures and course bends were tightly defined, the forward beam
was narrowed down to reduce the reflections and, to assist in the overall
advancement, the airport and environment needed to be 'cleaned up' from
interference. As the improvement progressed, a system of categories was
established to define the capability of a particular ILS. As a matter of interest
in the UK, ILS serving runway 10L (now 09L) at London Heathrow was the
first one to be upgraded to category 2. These categories are called ILS facility
performance categories, and they are defined as follows.
ILS facility performance categories
Category 1 -an ILS capable of providing accurate guidance from the coverage
limit down to a height of 200 ft above the ILS reference point
Category 2- an ILS capable of providing accurate guidance from the coverage
lil;nit down to a height of 50 ft above the ILS reference point
Category 3 -an ILS capable of providing accurate guidance from the coverage
limit down to the surface of the runway.
Operational performance categories
We saw from the above that with an improved ground equipment, guidance
down to the surface became possible. The operational objective of estab-
lishing the above categories is defined by ICAO in terms of operational
performance categories (also known as operational approach categories or
weather categories). The criterion here is the corresponding improvement in
the airborne equipment.

8/10/2019 Gsp Vol i Radio Aids
http://slidepdf.com/reader/full/gsp-vol-i-radio-aids 101/232
ILS and MLS
113
Although the transmitted signals might be absolutely correct, a receiver
with out-of-balance components can produce an indication of false centreline,
both in elevation and in the azimuth. Consequently, a pilot descending
with his ILS needles perfectly centralised, on being visual, may find himself
displaced to one side or the other or too high/too low. The improvement had
to start from here; the search for the components that would reproduce
information faithfully and reliably was on. In fact, the improvement in
airborne equipment went ahead side by side with ground equipment and full
'hands off' landing tests were being carried out as far back as 1961. Now with
super, complex, computer-controlled equipment on board, an aircraft may be
certificated to an appropriate category from the following classification.
Category 1 -A precision instrument approach and landing with a DH not
lower than 60m (200ft) with RVR 550m
Category 2 -A precision instrument approach and landing with a DH lower
than 60m (200ft) but not lower than 30m (100ft) with RVR
300m
Category 3 -A precision instrument approach and landing with a DH, if any,
lower than 30m (100ft) and an appropriate RVR.
where RVR is Runway Visual Range and a Precision Approach is an Instru-
ment Approach to landing using ILS, microwave landing system (MLS) or
PAR for guidance in both azimuth and elevation.
Back beam
The localiser transmission is normally directed in the direction of the ap-
proach area to provide azimuth guidance to the approaching aircraft. But
usually there is a certain amount of overspill of radiation behind the localiser
aerial and the signals would be received when flying in this area. This beam
is not to be used. Some transmitters are, however, designed to radiate a
back beam. Where this facility exists, it can be used when overshooting
the precision runway. It can also provide a back course approach to the
reciprocal runway. It must be noted that when using a back course there is no
benefit of a glidepath. Usually, they are less accurate than the front beams,
there are no range-check markers and they are not checked for accuracy. The
needle sense is reversed.
ILS offset localiser signals
Occasionally for technical reasons a localiser aerial has to be temporarily
offset to one side of the centreline. On these occasions the relevant infor-
mation is published in NOTAMS. If the need for an offset aerial is to extend
over a period, the information is published in the RAC section of the
UKAIP .
Under the early system, with an offset localiser the OH occurred at that
height at which an aircraft on the glide path would transit the middle marker .
Under the present system, when the offset does not exceed 2°, the OH is

8/10/2019 Gsp Vol i Radio Aids
http://slidepdf.com/reader/full/gsp-vol-i-radio-aids 102/232
114
Radio Aids
calculated from the published obstacle clearance limit (OCL) or 200ft above
the runway threshold, whichever is higher .
False glidepaths
These are defined as those loci of points in the vertical plane containing the
runway centreline at which the DDM is zero, other than that locus of points
forming the ILS glidepath.
What all this means is that, in the process of producing the glidepath,
due to the inherent metallic structures at the point of transmission, and
the aerial's propagation characteristics, the radiated twin lobes are repeated
several times above the true centreline. These produce several other equi-
signals (see Fig. 8.10). The number of such false glidepaths produced at any
ILS site depends on several factors such as the design of the transmitting
aerials, obstructions around the transmitter, transmission power and such
like. These false glidepaths, however, are not a danger to the pilot for the
following reasons:
Fig. 8.10 False glidepath.
(1) The first false glidepath does not occur until above 6°. Thus, if you
caught it, you would soon appreciate the mistake.
(2) False glidepaths always occur above the true glidepath, and therefore
cannot bring the aircraft dangerously low.
(3) It is a normal practice, when intending to carry out an ILS approach, to
establish on the localiser first and then to meet the glideslope from
underneath. It is most unlikely that a pilot would miss the true glideslope
and continue flying level until the next equisignal is reached.
(4) With the recommended localiser coverage in elevation of 7° and the
glidepath coverage of 1.75 x GP angle, the signals being received on the
false glidepath will be weak and the warning flags may operate.
(5) It is a recommended practice that establishment on the promulgated
glidepath be confirmed by the relationship between aircraft height and
the distance to the runway threshold.
~
Pilot's serviceability checks
During an approach the localiser and glidepath serviceability may be checked
by the pilot in two ways:
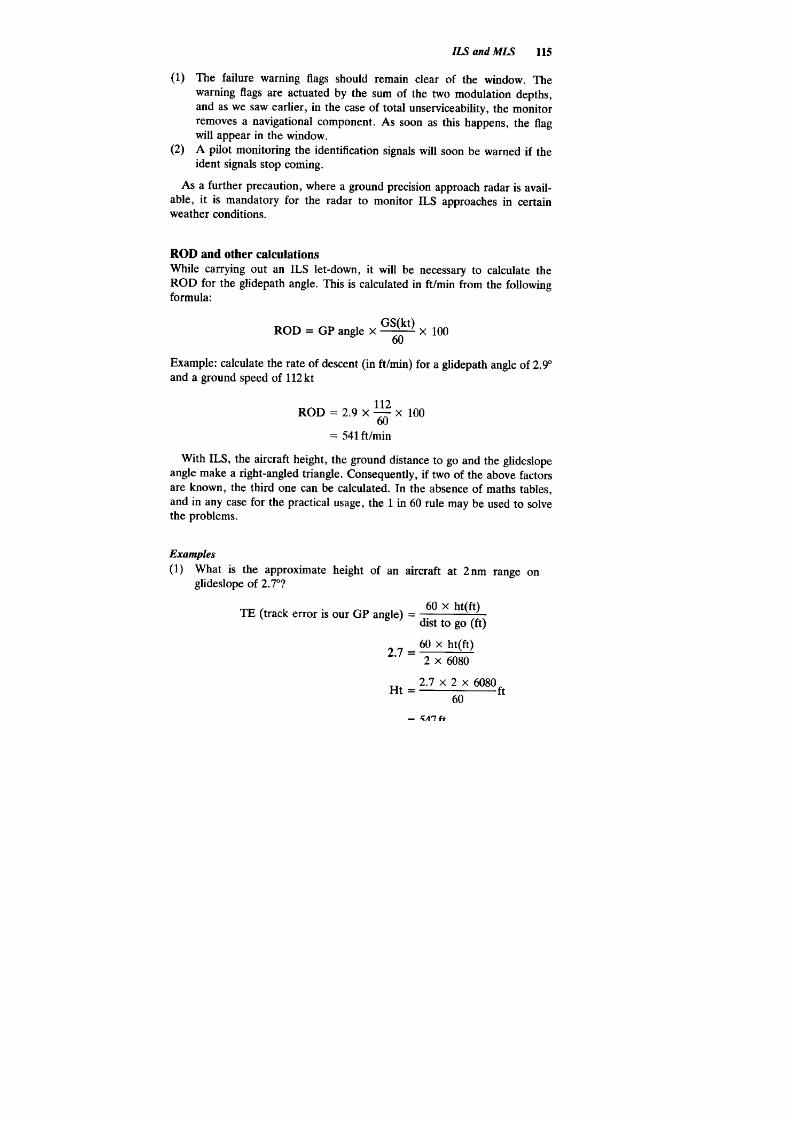
8/10/2019 Gsp Vol i Radio Aids
http://slidepdf.com/reader/full/gsp-vol-i-radio-aids 103/232
ILS and MLS
115
(1) The failure warning flags should remain clear of the window. The
warning flags are actuated by the sum of the two modulation depths,
and as we saw earlier, in the case of total unserviceability, the monitor
removes a navigational component. As soon as this happens, the flag
will appear in the window.
(2) A pilot monitoring the identification signals will soon be warned if the
ident signals stop coming.
As a further precaution, where a ground precision approach radar is avail-
able, it is mandatory for the radar to monitor ILS approaches in certain
weather conditions.
ROD and other calculations
While carrying out an ILS let-down, it will be necessary to calculate the
ROD for the glidepath angle. This is calculated in ft/min from the following
formula:
~
60
ROD = GP angle x
x 100
Example: calculate the rate of descent (in ft/min) for a glidepath angle of 2.9°
and a ground speed of 112kt
112
ROD = 2.9 x
x 100
60
= 541 ft/min
With ILS, the aircraft height, the ground distance to go and the glideslope
angle make a right-angled triangle. Consequently, if two of the above factors
are known, the third one can be calculated. In the absence of maths tables,
and in any case for the practical usage, the 1 in 60 rule may be used to solve
the problems.
Examples
(1) What is the approximate height of an aircraft at 2nm range on
glideslope of 2.7°?
60 x ht(it)
dist to go (it)
60 x ht(it)
2 x 6080
2.7 x 2 x 6080
60
TE (track error is our GP angle) =
2.7 =
Ht =
ft
= ",17 ft

8/10/2019 Gsp Vol i Radio Aids
http://slidepdf.com/reader/full/gsp-vol-i-radio-aids 104/232
116
Radio Aids
(2) At a distance of 3 nm from the threshold a pilot receives a full deflection
on the glidepath pointer, indicating fly up. Approximately how many
feet below the glidepath is the aircraft at this time?
The maximum deflection occurs when the pilot is 0.7° below the
glidepath. Therefore,
0.7 x 6080 x 3
vertical distance from the centreline = I
60
= 213 ft
(3) An aircraft on an ILS approach indicates half full-scale deflection on the
glideslope pointer, giving fly-up indication. At 2.2 nm range from the
threshold there is an obstruction, 285 ft above threshold level. What will
be the vertical clearance from the obstacle when the aircraft passes over
it on a 3° glideslope?
Half full-scale deflection occurs when the aircraft is 0.35° below the
glidepath. Thus, the aircraft is (3° -0.35°) = 2.65° above the surface at
2.2 nm range. At this point
The vertical clearance of the aircraft from the obstacle = (590.8 -285) ft
= 305.8 ft
Limitations of ILS
ILS has the following limitations:
(I) Signal corruption causes unpredictable bends in localiser and glideslope
beams. The pilot must always remain on the alert and particularly so when
making a fully automatic landing.
(2) Ground effects restrict its use particularly in mountainous and other
difficult areas.
(3) It entails too large permanent fiXtures for each runway.
(4) For reasons of minimising interference, the landing rate is kept low, and
there may also be restrictions of vehicle movement on the ground.
(5) Only a limited number of channels (40) are available and the effectiveness
of even these may be reduced in future by interference from FM broadcasts.
The CAA normally has a pink AIC current on the use of ILS in the UK.
Microwave landing systems
Becauseof the limitations above, and also becausehelicopters and short take-off
and landing (STOL) aircraft using ILS have to conform to the patterns flown by
large fixed-wing aircraft, a more readily usable system has been developed.
Originally a world-wide standard MLS was planned to be progressively
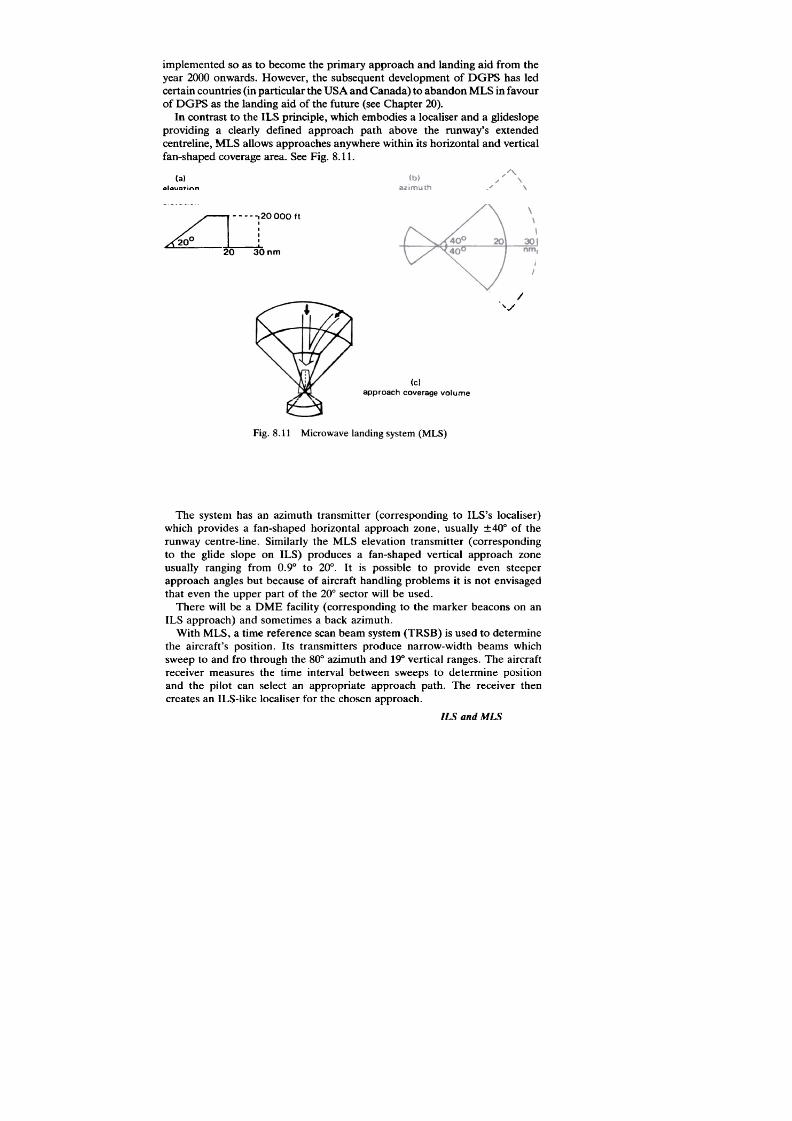
8/10/2019 Gsp Vol i Radio Aids
http://slidepdf.com/reader/full/gsp-vol-i-radio-aids 105/232
lLS and MLS
implemented so as to become the primary approach and landing aid from the
year 2000 onwards. However, the subsequent development of DGPS has led
certain countries (in particular the USA and Canada) to abandon MLS in favour
of DGPS as the landing aid of the future (see Chapter 20).
In contrast to the ILS principle, which embodies a localiser and a glideslope
providing a clearly defined approach path above the runway's extended
centreline, MLS allows approaches anywhere within its horizontal and vertical
fan-shaped coverage area. See Fig. B.II.
(a)
elevation
/1- .--l20000 ft
Aoo Ll
20 30 nm
I
.,./
(c)
approach coverage volume
B
Fig. 8.11 Microwave landing system (MLS)
The system has an azimuth transmitter (corresponding to ILS's localiser)
which provides a fan-shaped horizQntal approach zone, usually : :40° of the
runway centre-Iine. Similarly the MLS elevation transmitter (corresponding
to the glide slope on ILS) produces a fan-shaped vertical approach zone
usually ranging from 0.9° to 20°. It is possible to provide even steeper
approach angles but because of aircraft handling problems it is not envisaged
that even the upper part of the 20° sector will be used.
There will be a DME facility (corresponding to the marker beacons on an
ILS approach) and sometimes a back azimuth.
With MLS, a time reference scan beam system (TRSB) is used to determine
the aircraft's position. Its transmitters produce narrow-width beams which
sweep to and fro through the 80° azimuth and 19° vertical ranges. The aircraft
receiver measures the time interval between sweeps to determine position
and the pilot can select an appropriate approach path. The receiver then
creates an ILS-Iike localiser for the chosen approach.

8/10/2019 Gsp Vol i Radio Aids
http://slidepdf.com/reader/full/gsp-vol-i-radio-aids 106/232
118 Radio Aids
By this means a helicopter can make an approach from, say, 35° to the
runway on a 6° elevation immediately after a conventional big jet has ap-
proached along a standard 00 azimuth 3° elevation approach.
MLS also requires less space for the ground equipment, has 200 channels
available and does not suffer from ground effects, as it operates in the
gigahertz (or radar) frequency.
Advantages
Compared to ILS, MLS have the advantages of:
.Greater accuracy and reliability due to less signal corruption from
interference
.Extremely good guidance capacity
.Insensitivity to geographical site, which enables t to be established where an
ILS installation cannot be accommodated
.More channels available (200)
.Very wide three-dimensional coverage, allowing curved flight path captures
and final approaches on different glide slopes
.Better means of controlling and expediting aircraft movements in terminal
areas.
Fan markers
Fan markers transmit a narrow vertical fan-shaped beam of horizontally
polarised radiation. All markers operate on a single frequency, 75 MHz.
Because of the shape of the transmission, they cannot be heard unless the
aircraft is in the fan, and therefore, they cannot be used as directional aids.
Fan markers have two main uses: they are used to mark reporting points
and they are also used in conjunction with ILS to provide a precision approach
facility.
At a reporting point, a fan marker is identified by a high-pitched (3000 Hz)
audio signal giving out identification in morse, 6 to 10 words per minute
A2A emission. Further, the white light in the airborne installation flashes to
identify visually. The vertical coverage of the fan is limited to the operational
requirements: there are low power fan marker beacons and high power
beacons. Because in the horizontal plane the area of coverage increases with
height, if accurate navigation is required, the time of entering and leaving the
fan should be noted and the mean time taken for the fix. On some equipment
a high/low switch is fitted which may be used to reduce the coverage area
inside the fan.

8/10/2019 Gsp Vol i Radio Aids
http://slidepdf.com/reader/full/gsp-vol-i-radio-aids 107/232
When the word 'radar' was coined, it expressed precisely the function it
performed, that is, rudio Qetection . nd anging. The use of the pulse tech-
nique clearly distinguished it from 'radio' which used continuous waves. With
the subsequent advance in the technology, what we would have originally
described as radio (a continuous wave) can now perform the tasks of radar -
detecting and ranging (for example, a radio altimeter). Radar, in its turn,
now performs a variety of tasks not included in its original definition. These
tasks include turbulence indication by weather radar, navigational assistance
from hyperbolic systems such as Loran, and ground speed and drift from
Doppler. Radar may now perhaps be described as radio systems performing
particular functions inside the range of the radio spectrum.
Radar frequencies
Radar occupies frequencies from VHF upwards. The reasons for the choice
of higher frequencies are as follows:
(1) It gives freedom from external noise and ionospheric scatter
(2) Radar using the beam technique operates efficiently with narrow beams;
these can be produced at shorter wavelengths
(3) Similarly, shorter pulses can be produced with shorter wavelengths
(4) The efficiency of reflection from an object depends on the size of the
object in relation to the wavelength. At shorter wavelengths the signals
will be reflected more efficiently by the reflecting objects.
Timing in radar
It will be appreciated that where timing is required to be carried out for radar
operation, these times must be essentially very small, considering that a radio
wave travels 300000 km sec. Fortunately, radar can measure these small
time intervals very accurately. The times are measured in microseconds,
occasionally in milliseconds.
1 second = 1000 milliseconds or 1 000 000 microseconds (1 8)

8/10/2019 Gsp Vol i Radio Aids
http://slidepdf.com/reader/full/gsp-vol-i-radio-aids 108/232
120
Radio Aids
these two, the pulse technique is far more widely used and we will discuss this
first.
Pulse technique
Primary radar, secondary radar and Doppler radar all employ the pulse
technique although performing vastly different tasks. The technique involves
transmission of energy not in the form of a continuous wave but in very short
bursts. Each tiny burst of this CW is given a predetermined shape and
radiates in the form of a pulse. The mechanism of pulse transmission is shown
in Fig. 9.1. The duration or size of the pulse is called the pulse width or pulse
length. Although the pulse width is very small it can contain many radio
frequency cycles. For example, suppose a radar pulse is transmitted on a
carrier frequency of 1000MHz (DME). If the pulse length is 3.5 ~, the
number of cycles of the carrier frequency that occur in each transmitted pulse
may be calculated as follows:
number of cycles occurring in 1 second = 1 000000000
number of cycles occurring in 1 ~s = 1000
and number of cycles occurring in 3.5 ~s = 1000 x 3.5 = 3500.
Thus, each burst contains 3500 complete cycles and if the transmission was at
10000MHz, each pulse would contain 35000 cycles. These figures give us
some idea of the dimensions and magnitudes we are talking about.
Fig.9.1 Pulse ransmission.
The distance between two pulses in time is called pulse recurrence period
(PRP) or interval (PRI) and the number of pulses transmitted in one second
is called pulse recurrence frequency (PRF) or rate (PRR). The relationship
between these two terms is
PRP = ~ seconds
PRF

8/10/2019 Gsp Vol i Radio Aids
http://slidepdf.com/reader/full/gsp-vol-i-radio-aids 109/232
Basic Radar
121
Example ;
Pulse shape. A pulse is given its shape by the process of pulse modulation
and it is a design consideration. Although rectangular pulses can be produced
by applying an instantaneous rise in the voltage, followed by an instantaneous
collapse to zero, a practical pulse has a finite buildup time and decay time.
The amplitude, pulse width, rise and decay times (all these factors defining a
pulse) are subject to ICAO approval in respect of individual systems. A
typical ICAO approved pulse as used in DME is shown in Fig. 9.2.
We are now ready to discuss the various systems operating on pulse
technique.
Primary radar
This is the original radar and uses the principle of pulse technique to deter-
mine range and bearing of an object. Working on echo and search'iight
principle, a transmitter transmits a train of beamed pulses either in a fixed
direction or omnidirectionally by a rotating scan in azimuth (surveillance
radar). The beam may also scan in elevation according to the purpose of the
equipment. All objects in the path of the pulses which are of a size com-
mensurate with the wavelength, will reflect and scatter the energy. Some of
this reflected energy will reach the receiver, but it will be greatly weakened.
The strength of these echoes depends on several factors:

8/10/2019 Gsp Vol i Radio Aids
http://slidepdf.com/reader/full/gsp-vol-i-radio-aids 110/232
Radio Aids
22
.power of the transmitter
.range of the reflecting object
.shape, material and attitude of the reflecting object
.size of the object in relation to the wavelength.
This reflected energy will be processed through the receiver and fed to the
indicator in an appropriate form to give the information. In this process the
object's co-operation is not required.
Distance measurement- echo principle. Radar finds the distance of an object
by timing the interval between the pulse's despatch and its return as an echo.
This timing is done electronically (we will see later in this chapter how a
cathode ray tube (CRT) could be utilised to do this) and knowing the speed
of the electromagnetic waves, the formula, distance = speed x time, can be
solved. It will be noticed that the distance found in this formula is the one-
way distance to an object. As the pulse has travelled out and back, the
range of the object is half the distance so found, or, range = (speed x
time)/2.
Example: An echo registers a time of 500 microseconds. What is the dis-
tance in kilometres of the object reflecting it?
Range = 300000000 x 1 ~~~ ~~~ .." m
00
= 75 OO(Jill
= 75 kill
An alternative way of expressing the formula for the speed of radio waves
in terms of a nautical mile is:
1 nm in 6 microseconds or
i nm per ~sec.
In implementing the above principle, two assumptions are made: that the
speed of the electromagnetic waves is constant and that the waves travel
in straight lines. Neither assumption is valid in the earth environment but
the variations are so small that they can be ignored without incurring
sizeable penalty.
Determination of direction. The search light principle utilises transmission of
radio pulses concentrated into a very narrow beam. The beam width should
be kept as narrow as possible for accurate bearing discrimination. Narrow
beams can be produced either by shortening the wavelength or by increasing
the aerial size. With advanced techniques an aerial can be adjusted electroni-
cally to give a beam of the required width. The beam is made to scan through
azimuth or elevation, starting from a fixed datum point. The direction of the
object then is the direction in which the beam is pointing at the time when

8/10/2019 Gsp Vol i Radio Aids
http://slidepdf.com/reader/full/gsp-vol-i-radio-aids 111/232
Basic Radar
123
the echo is received. It is read from a scale, calibrated from the starting
point.
Ranges ofprimary radar. The ranges available depend on numerous factors;
of particular interest to us are the following:
(1) Transmission power. It is obvious that an increase in power will in-
crease the range subject to altitude. However, with radar, the signal not
only has to travel to its destination (reflecting object) but must travel
an equal distance back to the receiver with sufficient strength to pre-
dominate the internal receiver noise. Thus, the power/range relationship
for primary radar is given in the expression, max. range = 4y'(power).
This means that the power must be increased 16 times to double the
range.
(2) Characteristics of the reflecting object. The size and shape of the object,
the reflecting material (metal will reflect more efficiently than wood),
aspect of the target: these factors determine the strength of the echoes
coming back. An aircraft reflecting from the length of the fuselage will
give a better echo than when its nose and tail are in line with the
incoming wave. Further, an aircraft in an unusual attitude may shift
polarisation of the waves, causing polarisation fading at the receiver .
'Stealth' bombers are designed specifically to be poor reflectors.
(3) Pulse recurrence frequency (PRF)/Pulse recurrence rate (PRR). This
determines the maximum unambiguous range of the equipment. Each
pulse must be given time to travel out to the most distant reflecting
object as planned, and return, before the next pulse goes out. Otherwise
it will not be possible to relate a particular echo to a particular pulse.
Suppose we wish to have the equipment capable of measuring distances up
to 185 nm. The pulse must travel 185 nm x 2 = 370 nm before the next pulse
can be sent out. (PRP of time 'x'.)
PRP = Range x 2
Speed
185 x 2
= 1
6
= 2220 ~s
The second pulse can only go out 2220 ~s after the first pulse.
number of pulses that can be transmitted in one second is given by
The
PRF = 1 000 000
2220 pulses
= 455 pulses.
Taking the problem in reverse, let us say that the PRF of the equip-
ment is 1000 and it is required to find the maximum unambiguous range.

8/10/2019 Gsp Vol i Radio Aids
http://slidepdf.com/reader/full/gsp-vol-i-radio-aids 112/232
124
Radio Aids
1
RP = ~ = lOOOOOO
= 1000 )lS
PRF 1000
Now we need to calculate distance covered by 1000 lS.
PRP X Speed
Range = 2
1000 x ~
= .'nm
2
= 83nm
In the above problems, 455 pulses gave us the range of 185 nm whereas
a PRF of 1000 reduced ihe unambiguous range to 83 nm. Thus, an
jncrease in PRF results in a decrease in the operational range.
(4) Pulse width. The pulse width decides the minimum range of the equip-
ment. Radio waves travel 300 m in one microsecond. Therefore, for an
example, a pulse one microsecond wide would extend that distance
along the line of propagation. If an object at a distance of 150m was
reflecting the pulse, it would arrive in the receiver at the instant that the
tail end of the same pulse was leaving the transmitter. Any object closer
than 150 m reflecting the pulse will not be received as the transmitter
would still be transmitting. Further, two objects in line and 150 m or less
apart will appear as a single echo. Thus, if short range operation is
required, for resolution and accuracy short pulses are employed, e.g. 0.1
microsecond. Larger pulses are generally employed on long range work
as they carry relatively more energy in them. In practice, lor 2 micro-
second pulses are used in medium range radar and about 5 microsecond
ones for long range work.
(5) Aircraft height. Radar waves in the frequency bands we are discussing
travel in straight lines. Because of the curvature of the earth, a consider-
able proportion of the surface will remain in the shadow no matter what
maximum range is possible at height. The VHF formula given earlier
gives an approximation of the expected ranges for given heights.
(6) Elevation of radar head. As you will recall, this is another factor in the
VHF formula.
(7) Precipitation and cloud returns. At wavelengths of 3cm and below one
cannot neglect the absorption and scattering of radiation by droplets of
water in clouds and falling precipitation. Cloud returns can have a most
damaging effect on the performance of 10 cm and 3 cm radars and the
scatter from raindrops and other weather can clutter up the display
areas. Various suppression devices (e.g. circular polarisation having a
rotating field) are now available to reduce rain clutter, but most work at
the expense of power or range.
(8) Intervening high ground. If there is no clear line of sight between
the transmitter and the target, radar signals will be stopped by the
intervening object and that will limit the effective range in that par-
ticular direction.

8/10/2019 Gsp Vol i Radio Aids
http://slidepdf.com/reader/full/gsp-vol-i-radio-aids 113/232
Basic Radar
125
Other factors, such as receiver sensitivity, bandwidth used, aerial gain in
the direction of propagation, also affect the range but these are mainly
equipment design considerations.
Basic elements of primary radar
Of the main components of basic radar, the master timer or trigger unit is the
brain of the equipment. Its function is to trigger off a series of short electrical
pulses at regular intervals. These pulses are delivered to the modulator (Fig.
9.3) and at the same time, the time base unit is advised to start timing.
~
JL.JL
.JI
n n
Fig. 9.3 Components of a primary radar.
The modulator's task is to generate pulses of predetermined width and
sharpness. The very high voltage content of these pulses triggers off the
oscillator working at the radar frequency. It is so arranged that the beginning
of each pulse switches on the oscillator and the end of each pulse switches it
off. Thus, the modulator acts as an on/off switch for the oscillator. The
oscillator, in its turn, generates pulses of high power but short duration. The
output of the oscillator is fed to the aerial.
Normally a single aerial is employed to act as transmitter and receiver
aerial. A TR (transmit-receive) switch isolates the aerial from the receiver
when transmission is taking place; and when the transmission is complete it
switches on to the receiver to receive the pulses. Thus when the echoes are

8/10/2019 Gsp Vol i Radio Aids
http://slidepdf.com/reader/full/gsp-vol-i-radio-aids 114/232
126 Radio Aids
received in the aerial they are delivered to the receiver unit which, after
appropriate treatment presents them to the display unit. Here they are
displayed on a trace which commenced at the start of the operation under
instruction from the master timer .
Advantages of primary radar
.It is a self-contained system, requiring no external assistance
.Peak power of the transmitter can be made very high owing to the
relatively short time of actual transmission, but more power is required
.A common aerial may be used for both the transmission and the reception
.For a ground installation, sharp accurate narrow beams can be produced
by increasing the aerial size
Secondary radar
In this system, a transmitter (called interrogator) transmits a group of pulses
on a given carrier frequency. The transmission is either omnidirectional
(DME) or directed towards an object (scanner sweep of SSR). An aerial in
the path of these pulses receives the signals and passes them on to the
receiver. If the signals are recognised at the receiver, it instructs its trans-
mitter (called transponder) to give a reply. The reply then goes out on a
different carrier frequency.
The differences between primary and secondary radar are as follows:
.Unlike primary radar, the operation of secondary radar depends on the
active co-operation of the other object
.In secondary radar the information is exchanged in the form of groups of
pulses and not by individual pulses
.A secondary radar system requires a transmitter and a receiver on dif-
ferent frequencies, both in the aircraft and on the ground.
Advantages of secondary radar
There are various advantages of using a secondary radar over primary radar .
(1) An important advantage is the power requirement. With this type of
radar it is possible to work with much lower power. There are two
reasons: (a) the signals are only doing a one-way journey, and (b)
there is no double scattering to combat, as with primary radar .
(2) Because of the use of different frequencies, the ground transmitter will
not pick up ground reflections on transmission frequency. Similarly, the
airborne transmitter will not pick up its own ground reflection.
(3) Interference through weather is reduced (see chapter 10).
(4) The system is independent of such considerations as reflecting area,
shape, material, etc.
(5) In addition to range and bearing, additional information can be trans-
mitted in the form of coded Dulses.
8/10/2019 Gsp Vol i Radio Aids
http://slidepdf.com/reader/full/gsp-vol-i-radio-aids 115/232
Basic Radar
127
Uses of secondary radar
DME works on the secondary radar principle. A TC uses SSR in a variety of
ways. Both these systems are covered in other chapters.
Doppler radar
This topic is fully dealt with in a separate chapter .
Continuous wave radar
As the title suggests, in this type of radar, both the transmission and the
reception take place continuously. Consequently, two aerials are used: one
for transmission and one for reception. These aerials must be suitably screened
from each other, otherwise the receiving aerial will receive signals direct from
the neighbouring transmitting aerial.
Unmodulated CW may be used in the Doppler role. In this case, the
transmitted and reflected signals will differ in frequency due to Doppler effect
and will produce the airborne transmitter's velocity. For range measurement,
the transmitted carrier is progressively frequency-modulated. The received
frequency is then compared with the frequency actually being transmitted at
the instant of reception, and knowing the rate of change of frequency, the
range is worked out. The radio altimeter uses this principle.
The CW technique is eminently suitable for short range work. Unlike pulse
radar where the minimum range is controlled by the pulse width, CW radar
can work from zero range upwards. Speed-detecting radar used by the police
works on CW.
Advantages of CW radar
.Because in modulated or unmodulated form, the receiver operates on a
frequency different from the transmission frequency, it is fairly free from
ground clutter and other permanent echoes
.It has no minimum range limitations, in altitude or azimuth
.The system is less complex than pulse radar systems.
Cathode ray tube (CRT)
The purpose of the CRT is to display visually the radar signals that are
reflected by the objects. Further, by incorporating a time base, distance and
bearing (or other data for which the CRT is being used) can be determined.
The CRTs are classified according to the way in which focussing and deflec-
tion are achieved. There are three such classes: electrostatic CRT having
electrostatic focussing and deflection devices, electromagnetic CRT having
electromagnetic focussing and deflection, and lastly a combined CRT which
has electrostatic focussing and electromagnetic deflection. For the purpose of
the present study the electrostatic CRT is described below.
The main components of a CRT are: a cathode, a grid, three anodes and
two pairs of deflecting plates (Fig. 9.4).

8/10/2019 Gsp Vol i Radio Aids
http://slidepdf.com/reader/full/gsp-vol-i-radio-aids 116/232
128
Radio Aids
Fig. 9.4 Components of the CRT
Cathode
The cathode consists of a small cylinder, one end of which is coated with a
small quantity of barium or other similar oxide. The cylinder covers a low
voltage heater which heats the barium oxide. Barium oxide when heated
emits electrons.
Grid
The grid is a metal cylinder and surrounds the cathode. Its purpose is to catch
as many electrons as possible emitting from the cathode and direct them in a
narrow beam towards the anodes. This is done by applying a potential (called
grid bias) which is negative with respect to the potential of the cathode.
Electrons are negative charges and when they find that the walls of the grid
are more negative than they are, they tend to be repelled from the wall and
pass through the grid in a narrow beam at the centre. By varying the grid bias
we can control the number of electrons passing through the grid. This is the
brilliance control.
Anode system
As soon as the electrons are emitted from the cathode, the cathode becomes
positive relative to the electrons and the most natural thing would be for the
electrons to return to the cathode. This must be prevented; the electrons are
in fact encouraged to travel forward to the screen by means of three anodes.
First and third anodes have the shapes of plates while the second anode has
the shape of a cylinder (Fig. 9.5).
The first and third anodes are positive, the second anode is negative. The
first anode attracts the electrons which pass through its centre and then start
diverging. This tendency to diverge is checked at the second anode (being

8/10/2019 Gsp Vol i Radio Aids
http://slidepdf.com/reader/full/gsp-vol-i-radio-aids 117/232
Basic Radar
29
Fig.9.5 Electron beam and anodes.
negative) and the electrons deflect back and pass through the third anode
under the attraction of positive potential. When they hit the fluorescent-
coated screen they show up as a glow. How sharp the glow is depends on how
much divergence took place at the second anode. The potential of the second
central anode can be varied to give different sharpness -this is the focussing
control. As to where on the screen the electrons will hit depends on the
potential of the X and y plates.
x and y plates
The set of plates nearest to the third anode is called the y plates. As the
electrons pass through the pair of y plates, if, say, the top plate is positive
and the bottom plate is negative, the beam will be deflected upward towards
the top of the plates. This means that the beam will hit at the top of the tube,
the Y axis. If we had the bottom plate positive initially and varied the
potential gradually until the top plate became positive, the beam hitting the
screen during this time would appear to move from the bottom of the tube
towards the top. If the potential was varied quickly enough we would only be
able to see a continuous vertical trace.
'y' plate
'x' plate
12331 $
185Km
---
'y' plate
Fig.9.6 CRT time base.

8/10/2019 Gsp Vol i Radio Aids
http://slidepdf.com/reader/full/gsp-vol-i-radio-aids 118/232
130 Radio Aids
Similarly, X plates produce a trace in the X axis or horizontally. These
traces are the basis for forming time bases to measure distances. For example,
earlier in the chapter we calculated that a radio wave will travel 370 km in
1233~s. If we move the spot on the CRT so that it takes 1233~s to travel
from one side of the tube to the other, what we have done is to produce a
scale along which the distance of the echo could be measured (Fig. 9.6).
In Fig. 9.6 the time base is produced by the X plates, and the echo is
presented through the y plates. The time base so produced may be calibrated
to read in terms of microseconds or distance, knowing that the distance from
one side of the tube to another in this case s 185 km. The time base may then
be calibrated by pips at convenient distances. Further, for more accurate
reading, a small portion of the time base where the signal appears may be
exploded to a larger scale. This is done by what is called 'strobing' the signal.
It will be appreciated that in order to produce a linear time base, the
voltage (that is, potential) to the plates must be varied progressively and
systematically. The voltage that has this effect is called saw-tooth voltage or
waveform. This is shown in Fig. 9.7.
IoE-
Fig. 9.7 Sawtooth voltage
In Fig. 9.7, the voltage starting at A is increased progressively and steadily
to the value of B in time T. In this example, the value of T is 1233 ~s. The
voltage AB is called the sweep voltage and the trace is visible. Once the
beam reaches the opposite end, it must be brought back to the other end to
start a new cycle. Certain time is lost as the voltage falls back to the original
value. This part of the voltage change is called the flyback voltage, and it is,
in general, not visible.
In practice, radar transmitters incorporate a master circuit. As the master
instructs the transmitter to transmit, it simultaneously triggers the time base
and the cycle commences. So the time base and echo remain in synchronism.
Another method of displaying the reflected signal (echo ) is to apply it as a
positive voltage to the grid, to produce a 'bright-up' on the time base.
Gain control
Atmospherics and noises set up by electrical disturbances within the receiver
or caused by nearby equipment manage to get on to the radar screen. These

8/10/2019 Gsp Vol i Radio Aids
http://slidepdf.com/reader/full/gsp-vol-i-radio-aids 119/232
Basic Radar
131
tiny signals travel on to the CRT via the y plates and show up on the screen
as multitudes of small blips in the vertical axis. These blips are known as
'grass' because of their appearance. Their presence is an essential check that
the CRT is serviceable to a stage beyond producing the time base. The size of
the required signal (i.e. echo) and grass is controlled by the gain control.
Cockpit displays in colour
With the rapid advances for both domestic and commercial uses of colour
televisions during the 19705, it was not surprising that by the end of the
decade flight-decks would also be enjoying the facility. Now in the 19905, for
both large, wide-body commercial aircraft and much smaller, executive class
aircraft, there are available -often in a single-box presentation -bright,
sharp colour displays of radar information on which can be superimposed
additional data, readily-interpretable symbolic displays, cautions and warn-
ings. Many of the equipments described in the following chapters are thus
available on the flight-deck with either a black and white or a colour pre-
sentation, e.g. weather radar.
Problems
(1) What is the maximum unambiguous range of a radar having a PRR
(PRF) of 380 pulses per second?
Answer: 219 nm.
(2) What is the maximum PRR which can be used in a radar operating up to
a range of 200nm?
Answer: 417 pulses per second.
(3) Calculate the maximum PRF which can be used in a radar with a
maximum range of 180 nm.
Answer: 463 pulses per second.

8/10/2019 Gsp Vol i Radio Aids
http://slidepdf.com/reader/full/gsp-vol-i-radio-aids 120/232
DME is a secondary radar system which provides accurate and continuous
indications in the cockpit of the slant distance between an aircraft and
the ground transmitter. The use of primary radar is unsuitable for DME
operation for a variety of reasons. The power requirements for a secondary
radar are relatively low. For example, in order to cover a range of 200nm
(present limit of our DMEs) 1.5 kilowatt power output of pulses would be
considered adequate (peak power output of modern equipment varies from
1 kW to 2.5 kW) using secondary radar. With primary radar, a power output
of the order 1.5 megawatt would be necessary to cover a similar area.
A primary radar scanner sweeping through 360° produces a picture of
the whole surface beneath the aircraft, rather than giving a range from a
designated reporting point. With this radar it is impossible to create a system
of positive reference points on the ground, say along an airway. Further when
flying over certain types of territory (e.g. flat lands, mountainous territory),
primary radar echoes may not be identified whereas with secondary radar ,
the ground stations can and do identify themselves.
The basic airborne system consists of:
.an interrogator (a combined receiver and transmitter)
.an indicator and
.an omnidirectional blade aerial, able to pick up vertically polarised signals.
Principle of operation
The system on the ground is called the transponder, a concocted name to
describe that it is a transmitter which responds. It consists of a receiver and a
transmitter. The aircraft interrogator interrogates the transponder on a given
carrier frequency by sending out a continuous series of pulses in pairs. The
distance between two pulses of a pair is 12 ~s and the time interval between
the pairs is varied at random -a technique called transmission at random
PRF. At the same time that the interrogation goes out, the aircraft's receiver
starts timing and commences a search for the transponder's replies.
The transponder replies to the interrogation by sending out pairs of pulses
on a carrier frequency 63 MHz removed from the interrogation frequency.
The receiver receives all the responses that the transponder is sending out to
different aircraft but only accepts those responses which match its own PRF .

8/10/2019 Gsp Vol i Radio Aids
http://slidepdf.com/reader/full/gsp-vol-i-radio-aids 121/232
133
ME: Area Navigation
The receiver searches the responses through the maximum range of 200 nm
in a matter of a few seconds (four or five seconds in newer models, 25-30
seconds with older models). During this time the pointer or counters on the
indicator revolve rapidly. If no response is achieved by the time the search
reaches the maximum range, the pointer (or counters) swiftly return to zero
range and the search starts again. Once the response is found the receiver
locks on to it and tracking commences. This is the condition which exists
when the interrogator has acquired replies in response to its own inter-
rogations and is continually displaying the slant range distance to the ground
station. This distance is computed from the knowledge of the speed of the
radio waves and the time taken for the pulses to travel out and back.
During the search period, the interrogator transmits at a high rate (150
pulses per second, (pps) ) to achieve a quick lock-on condition. But if the
lock-on is not acquired after 15000 pairs of pulses have been transmitted, the
PRF is lowered to 60 pps and maintained at this rate until the search is
successfully completed. The system then operates on a random PRF between
25 and 30pps.
Illustration of random PRF technique
Random PRF was mentioned above. This random variation in time between
successive pairs of interrogation pulses prevents locking on to responses
meant for some other aircraft. We will now take a closer look and see how it
is done.
To keep the arithmetic simple, let us say that our equipment's PRF is
25 pps. This gives us the pulse recurrence period of
1 000 000
25
= 40000~s
This means that if this was the PRF of a primary radar, one pulse after
another would be despatched exactly at 40000 microsecond intervals. With
the DME, this time interval is intentionally varied, and it is a random
variation. A pulse may be sent out 39956 J.1Sehind the previous one, and it
may be followed by another pulse at 40115J.1sdistance. The transmission
pattern would look like Fig. 10.1. In the meantime the transponder is reply-
n
n
J~
Fig.10.
Interrogation pattern
ing to all aircraft triggering it. Since all these responses are on the same
carrier frequency, they all arrive in the receiver. The transponder's trans-
missions arriving in the receiver would look as in Fig. 10.2. Some of these
responses must belong to us and they are the ones which arrive with a regular

8/10/2019 Gsp Vol i Radio Aids
http://slidepdf.com/reader/full/gsp-vol-i-radio-aids 122/232
134
Radio Aids
I\../V'-NVUV\-~J\AJV\AJ\-AJV\-
Fig. 10.2 Transponder responses
delay from the interrogation pulses. A narrow gate in the receiver admits
only those pulses which fall inside it, and the delay or the distance between
the two pulses is the measure of the aircraft's range from the transponder.
This arrangement is shown in Fig. 10.3. It will be seen in the figure how
the pulses arriving after a regular time interval t (shaded dark for easy
recognition) enter through the gate whereas the other responses are excluded.
Of course it will be appreciated that this regular distance t is only momentary
because unless the aircraft is circling round the beacon at a constant range, its
range relationship with the station is changing all the time. However, on the
microsecond timing scale this change is only minute but progressive. The gate
is wide enough to accommodate these changes and it in fact moves along with
the progressively changing time delays so as to keep its own responses in the
lock. This technique is called the lock-follow technique. This movement is
shown in Fig. 10.3, the last pulse arriving at t time delay.
Fig. 10.3 Acceptance of own responses.
Indicators
The varieties are legion; presentation of information is either by pointer or by
digital counters (Fig. 10.4). In most installations the DME is channelled
by the VOR navigation frequency selection and both pieces of equipment
become active together. Alternatively a separate frequency selector may be
available which enables the pilot to select VOR and DME (or TACAN) as
required.
The basic information is slant range from the selected station up to a
distance of 199 nm. To this, an additional small computer can add the luxury
of rate of change of distance display, indicate instantaneous GS, give time
in minutes to the station and so forth. The advent of the course-line computer

8/10/2019 Gsp Vol i Radio Aids
http://slidepdf.com/reader/full/gsp-vol-i-radio-aids 123/232
DME: Area Navigation
135
Fig. 10.4 Typical DME indicators.
opened up the prospect of area navigation. The indications are in the form of
L/R deviation from your track and distance to your destination. This is in
spite of the fact that your destination is not the VOR/DME station you are
tuned to.
Failure indications
If the transponder reply detected by the aircraft is below a pre-set value the
equipment will go on 'memory mode' for a period of around eight to ten
seconds (depending on the equipment) and continue to indicate the ranges
based on the last known change of range. If no signals of acceptable strength
are received after this, the equipment will unlock and commence a fresh
search. It will only lock on when correct signals of sufficient strength are
again detected.
The unlock condition will be indicated to the pilot by an OFF warning flag
on the rotary types of indicators and a bar falling across the face of the digital
types. In addition the needle of the rotary indicator will rotate continuously
and the numbers on the digital indicator will run up to the maximum value.
Failure indication will be displayed when the equipment is switched on and:
(1) no signal is being received
(2) the received signals are below the minimum strength (just entering the
DME coverage), or
(3) the aircraft is out of range of the transponder .
And of course the flag is in view when the equipment is not switched on.
Frequency and channel spacing
As we noted earlier, DME using secondary radar technique transmits and
receives on different frequencies. This is a matter of necessity, because if
both transmitters operated on the same frequency, assuming that this was

8/10/2019 Gsp Vol i Radio Aids
http://slidepdf.com/reader/full/gsp-vol-i-radio-aids 124/232
136
Radio Aids
possible and that all aircraft radiated individually coded transmissions, we
would have confusion and chaos in our hands, since:
(1) the transponder's response, while arriving at the aircraft receiver, will
be swamped by the ground reflections of the original transmission.
(2) the transponder's transmission will be reflected by the objects and ob-
stacles in the vicinity of the transmitter and some of these will arrive
back at the transponder. The transponder, not being able to discern
between these ground reflections and the aircraft interrogations (being
the same frequency), will start dishing out ranges to the reflecting
objects as well. This process is called self-triggering.
With the use of different frequencies, the airborne receiver will not accept
its own reflections and the ground transponder will not be activated by its
transmission frequency.
DME operates in the UHF (1000MHz) band in the frequency range of
962 MHz to 1212MHz. The frequency allocation is divided into two bands,
low and high, as follows:
Low: Aircraft transmits from 1025 to 1087MHz; ground replies from 962 to
1024MHz (at -63MHz difference).
High: Aircraft transmits from 1088 to 1150MHz; ground replies from 1151
to 1213MHz (at +63MHz difference).
For example, for an interrogation frequency of 1100MHz, the response
will come on 1163MHz. Under this arrangement 63 channels are formed in
each band. Channels in the low band are numbered from 1 to 63 and those in
the high band from 64 to 126. These 126 channels are collectively called X
channels. There is a provision for expansion into another 126 channels, to be
called Y channels. We will then have, for example, a 22X channel and a
22Y channel. The channels 1 to 16 are reserved for national allocation and
channels 17 to 56 are paired with VOR/ILS frequencies, as shown in the
following illustration:
20X frequency paired with 108.3; 21X frequency paired with 108.4.
20Y frequency paired with 108.35; 21Y frequency paired with 108.45.
Range and coverage
DME is a short-range navigation aid providing a maximum coverage of
200nm at 30000ft. The ranges indicated are slant ranges and the conversion
to ground distances is by use of Pythagoras.
Example I: An aircraft at 40000ft reads a DME distance of 80nm to the
station. What is its ground distance from the station?
As the distance required is in nautical miles, we must convert 40000ft into
nautical miles before applying it to the Pythagoras formula.

8/10/2019 Gsp Vol i Radio Aids
http://slidepdf.com/reader/full/gsp-vol-i-radio-aids 125/232
137
ME: Area Navigation
(Ground distancef = (slant rangef -hf
= 802 - (~ )2
6080
= 802 -6.582 (approx)
= 6400 -43 (approx)
= 6357
ground distance = V(6357)
=79.7nm
Example 2: An aircraft at 24320ft is 30nm ground range from the station
What is its indicated range? See Fig. 10.5.
30nm
Fig. 10.5 Ground range from slant range and height.
42 + 302 = (slant range)2
916 = (slant rangef
.
d . d ( I )
= V916
ID Icate s ant range
= 30.26nm
From the above two examples it will be noticed that the slant range errors
at long distances are practically negligible. But the inaccuracy does exist
which is revealed at closer range and higher altitudes.
When directly overhead the beacon, the DME will indicate the aircraft
height in nm above the beacon and not zero range. For example an aircraft
overflying a beacon at a height of 30400 ft will indicate
30400
~=5nm
(When overhead, there is a small cone of silence but the range indications
will continue to operate on memory. )
The actual ranges available depend on
.the aircraft height
.the transmitter height
.any intervening high ground; this will cut off the signals and reduce the
range in that direction. I
The ranges for various heights are worked out using the VHF formula.
Range = 1.2Sv'HR + 1.2Sv'HT
8/10/2019 Gsp Vol i Radio Aids
http://slidepdf.com/reader/full/gsp-vol-i-radio-aids 126/232
138
Radio Aids
We are familiar with this formula but we will give you one more example
of its employment.
Example: Give the approximate theoretical maximum range that an aircraft
at 26000 ft may expect if the DME transponder is 81 ft amsI.
Range = 1.25\ (26000) + 1.25\ (81)nm
= (1.25 x 161) + (1.25 x 9) nm
= 200 + 11.25 nm
= 211.25nm
Accuracy of the equipment
The receiver computes the elapsed time between transmission of the inter-
rogating signals and the receipt of the reply signals, and determines the
distance. The accuracy is of very high order. Between a slant range of 0 and
200nm the total system error is designed to be no greater than :t nm or
:t3% of the distance measured, whichever is greater. Thus, the worst case is
6nm at a range of 200nm. In practice a modem DME system is considered to
be inherently capable of providing an indicated range accuracy equal to
:to.2nm or 0.25% of the slant range measured, whichever is greater. This is
nm in the worst case and the figures are valid on 95% of the occasions.
Uses ofDME
(1) It provides a circular position line when a single DME is used: fixes are
obtained when it is used in conjunction with VOR or other DME
stations
(2) Its range indication is very useful when carrying out an instrument
approach
(3) It eases the task of the A TC in identifying for radar when an aircraft
reports its position in terms of range and bearing from a VOR/DME
station
(4) When two aircraft are using DME and flying on the same track, the
positive ranges from these aircraft enables the A TC to maintain accurate
separation
(5) Accurate ranges to touchdown are read off when a transponder is
operating in conjunction with ILS
(6) It provides a basis for more accurate holding patterns
(7) With an additional computer, area navigation may be carried out with
accuracy.
Advantages of DME as secondary radar
It will be appreciated from the earlier chapter on radar that DME uses the
principle of secondary radar. The advantages of secondary radar are as
follows:

8/10/2019 Gsp Vol i Radio Aids
http://slidepdf.com/reader/full/gsp-vol-i-radio-aids 127/232
DME: Area Navigation
139
(1) Interference due to weather is reduced, as seen in Fig. 10.6 below
Fig. 10.6 Weather avoidance.
It will be seen in Fig. 10.6 that an active cloud not directly in line
between the aircraft and the ground beacon will have little effect in
causing interference or clutter .
(2) Transmission power required is only that which is sufficient to carry the
signal up to the station. In other words, the signals need not be strong
enough to survive a two-way journey.
(3) The ground beacon uses a different frequency from that used by the
aircraft and therefore self-triggering will not occur .
Beacon saturation
Like a shopkeeper who opens the doors of his shop in the morning and
makes available any and all of his wares to the customers, once he is sold out,
he puts the shutters down; the ground equipment, when switched on, does
likewise. The transponder transmits 2700pps at random whether or not it is
being triggered for information. These pulses are available to its customers.
When an aircraft interrogates the transponder it replies by using some of
these random pulses. Now, unless an aircraft is in search mode, its normal
operating PRF is 25-30pps, average 27. One aircraft triggering a trans-
ponder and in lock-on condition replaces 27 transmitter random pulses.
At this rate if 100 aircraft are simultaneously triggering a station, the trans-
ponder's capacity will be exhausted and the beacon would become saturated.
In arriving at this figure we did not consider those aircraft which are operat-
ing on higher PRF in the search mode. They would put excessive loading on
the transponder's capability. However, the search mode at higher PRF runs

8/10/2019 Gsp Vol i Radio Aids
http://slidepdf.com/reader/full/gsp-vol-i-radio-aids 128/232
140
Radio Aids
for such a short time that it can be discarded for practical purposes, and the
search at 60 PRF is not normally continued for a long time because if it is not
locking, it is very likely that you are still out of range.
When the beacon becomes saturated it adjusts itself to cope with the
situation by reducing receiver gain, Fig. 10.7. If you are receiving strong
level when saturated
Fig. 10.7 Beacon saturatior
music on your transistor radio which is accompanied by weak background
noise, you turn the volume down. In doing so, you aim to exclude the
weaker, unwanted noise. The transponder, by reducing its receiver gain
excludes interrogations from aircraft whose pulses reaching the transponder
are relatively weaker. In Fig. 10.7, in normal operation all aircraft from A to
G would be receiving ranges from the transponder (aircraft B is just entering
the coverage and might start receiving soon). When the beacon gets saturated
and the receiver gain is reduced, aircrafts A, B, D, and possibly F will be
excluded from service and an unlock will occur in the airborne equipment.
The purpose of the system is to give preference to the nearest aircraft but this is
not necessarily achieved as it responds to the 100 strongest signals. The UK is
commissioning a new generation of DME transponders with higher power
(ranges much greater than 200 nm) and greater capacity (considerably more than
100 aircraft).
VOR/DME planning
A VOR provides magnetic bearing information. A DME provides slant
ranges from the station. When these two equipments are used together, we
can have instantaneous fixes in the form of a bearing position line and a
circular range position line. Further, if the two transmitters are co-located,
these two position lines may be plotted from a single point.
To achieve speed in selecting the facilities in the cockpit and to reduce the
workload on the flight crew, VORs may be frequency paired with DME
or TACAN (military installations) stations. This means that when a VOR
frequency is selected, the DME circuits would be activated automatically.
Ideally, VOR and DME meant for use in conjunction with each other should
be co-located, that is, both the transmissions made from the same geo-
graphical point. However, this is not always possible and where VOR and
DME stations are not widely separated they may still be used in conjunction
with each other. The pilot will know the relationship between the two stations
8/10/2019 Gsp Vol i Radio Aids
http://slidepdf.com/reader/full/gsp-vol-i-radio-aids 129/232
DME: Area Navigation
141
by noting the ident signals and frequency pairing arrangements as explained
below.
(1) Where both VOR and DMEfTACAN transmit the same callsign and in
synchronism, the stations are called associated and they are always
frequency paired. The term 'associated' means that
(a) the two transmitters are co-located (i.e. the two antennae are co-
axial)
(b) they are a maximum distance of 100ft apart where the facilities are
used in the terminal areas for approach purposes, or
(c) they are at a maximum distance of 2000ft apart where their pur-
pose is other than (b) above but where the highest position fixing
accuracy is required.
Synchronised idents are transmitted every 7 seconds, that is, each 30-
second period is divided into four equal parts. The DME transponder trans-
mits its ident during one of these four periods, and the VOR in the other
three.
(2) Those VOR and DME stations which are not associated but serve the
same area (approx 7nm) and which may be used in conjunction with
each other are also frequency paired. But in this case, both VOR and
DME will identify separately and one of the two will have a letter Z in
the callsign, e.g. STN-STZ.
(3) Where VOR and DME stations are at entirely different locations, they
mayor may not be frequency paired. Both facilities will have indepen-
dent idents. Note that when a VOR is frequency paired with military
TACAN the system is called VORTAC.
DME ident is made up of a series of paired pulses at PRF of 1350pps.
A decoder in the receiver converts the information and feeds it into the
earphone as morse letters.
Miscellaneous
The type of emission is 'PON'. A typical UKAIP entry records transmission
and reception frequencies, e.g. transmit 1174, receive 1111. These apply at
the station and mean that the aircraft transmits at 1111 and receives at 1174.
In any case you select a channel number which in this case is 87X.
Area navigation (RNA V)
In the CAA (ECAC) airline transport pilot licence syllabus, immediately
following the entry DME comes VOR/DME Area Navigation (RNA V).
Although navigation and planning appear in their own right as syllabus
subjects (and also separately in Ground Studies for Pilots volume 2), it is
also appropriate that RNA V principles and operations should appear in the
sequence of radio aids topics, it being so dependent on VOR and DME.
8/10/2019 Gsp Vol i Radio Aids
http://slidepdf.com/reader/full/gsp-vol-i-radio-aids 130/232
142
Radio Aids
Principle of operation
The present route Air Traffic Service (A TS) structure, which is particularly
complex in the European/Mediterranean region, evolved from 'point-source'
aids between which aircraft are required to fly. Initially there were radio
ranges then NDBs followed by VORs and DMEs. This structure offers little
scope for expanding traffic capacity, the options open to pilots or to improve-
ment on present levels of efficiency which already impose high workloads on
air traffic controllers and pilots, especially in terminal airport areas. It is
believed that development of RNA V throughout the 1990s will overcome the
present deficiencies and enable A TS systems to accommodate the increasing
need for operators to enjoy a greater route flexibility and traffic capacity,
handled safely and efficiently.
In ICAO Annex 11, RNA V is defined as a method of navigation which
permits aircraft operation on any desired flight path within station-referenced
navigation aids, or within the limits of the capability of self-contained aids, or
a combination of these. Thus, in general terms, RNA V may be considered as
any system of navigation which is capable maintaining track and time to a
specified degree of accuracy without having to overfly a point-source aid.
This can be done by simultaneously fixing position with VOR/DME or
DME/DME etc.
Advantages and disadvantages
Unfortunately RNA V cannot be immediately implemented because aircraft
using airways vary considerably in their age, their performance and the
degree of sophistication of their on-board equipment. This leads to vary-
ing standards of navigation even though the flight crews are meeting the
internationally-agreed mandatory minimum requirements for airways flying.
Even the national A TS systems in adjoining countries may differ in operating
concepts and procedures, although they are within the international para-
meters. The advantages of adopting the RNA V principle over the current
fixed-route system stem from the introduction which will then be possible of
more direct routeing of aircraft so reducing flight distances, times and fuel
required. It could also lead to increasing existing, or new, route capacities by
enabling the use of dual or parallel routes, reduced separation horizontally
and vertically between routes and of the basic volume of protected airspace.
It will allow pilots and operators to exercise greater freedom of choice while
also giving A TC greater flexibility.
Accuracy, reliability and coverage
There must inevitably be a transitional stage with the introduction of RNA V
because there will still be aircraft operating wholly dependently on overflying
point-source aids. In Europe, time scales are being established through the
19905and initially RNA V will be used within the existing A TS route system.
Then it is envisaged that as most aircraft come to meet the minimum equip-
ment standards, there will be the following types of RNA V routes:

8/10/2019 Gsp Vol i Radio Aids
http://slidepdf.com/reader/full/gsp-vol-i-radio-aids 131/232
DME: Area Navigation
143
Fixed RNA V routes: These will be published permanent A TS routes which
can only be flight-planned by aircraft with the approved RNA V capability.
Contingency RNA V routes: These will be published A TS routes usable by
aircraft with RNA V capability during specific time-Iimited periods.
Random RNA V routes: These will be unpublished routes which can be flight-
planned within certain designated RNA V areas.
Within the RNA V concept itself, there are two recognised levels of accuracy
of operation: B-RNAV and P-RNAV. Basic RNAV (B-RNAV) has an
accuracy comparable with that of aircraft currently operating the present sys-
tem on routes defined by VOR/DME. Precision RNA V (P-RNA V) requires
a track-keeping of O.5nm standard deviation or better.
Presentation, interpretation, FMS
Already many UK-registered aircraft are fitted with RNA V capability equip-
ment and as the phases of introduction are implemented so, in the UK, the
Air Navigation Order will be amended to lay down the rules for the approval
of RNA V equipment. It will also lay down the installation and maintenance
rules for equipment together with the operational procedures to be used. The
current position is laid down in Articles 39, 39A, 39B of the ANO and
expanded in a yellow (Ops/ATS) AIC. The intention is that carriage of
RNA V equipment will be mandatory from 1 January 1998 within the airspace
of ECAC member states.
The interpretation of the individual instruments, VOR, DME, ADF, etc.,
has been described earlier when considering the basic systems. In companion
volume 3, the FMS to be found on the flight deck of modern airliners
is described together with its use. With the availability of the on-board
computer and predetermined waypoints, pilots will be able to fly any fixed,
contingency or random RNA V route stored in the FMS memory in the same
way as the airways are currently flown between the fixed-point aids.
Test questions
(1) Describe the basic principles of DME operation.
(2) Explain why for DME the ground transmitter operates on a different
frequency from that transmitted from the aircraft.
(3) Explain how it is possible for a number of aircraft to use the same
DME beacon simultaneously without mutual interference.
(4) The type of emission used for DME is:
(a) A8W (b) PON (c) A9W.
(5) The maximum number of aircraft that a DME beacon can handle
before becoming saturated is:
(a) 63 (b) 126 (c) 100.

8/10/2019 Gsp Vol i Radio Aids
http://slidepdf.com/reader/full/gsp-vol-i-radio-aids 132/232
144
Radio Aids
(6) On a DME with digital presentation, failure indication is given by:
(a) the DISTANCE TO GO returning to 0
(b) a drop-down bar falling across the face of the figures
(c) the DISTANCE TO GO oscillating at figures in excess of200nm.
(7) DME operates in the frequency band:
(a) YLF (b) MF (c) UHF.
(8) The range from the beacon indicated by DME is:
(a) slant range (b) ground range
(c) ground range only if the beacon is co-located with YOR.
(9) If YOR and DME stations have separate identifications of 'YON' and
'YOZ' for YOR and DME respectively, this means:
(a) the YOR and DME beacons are co-located
(b) the YOR and DME beacons are not co-located, but are serving
the same location and may be used in conjunction with each other
(c) the YOR and DME beacons are at entirely different locations.
(10) If a DME beacon becomes saturated, it adjusts itself to:
(a) give preference to the strongest aircraft signals
(b) give preference to the most distant aircraft
(c) give service to a maximum of seven aircraft, irrespective of
distance.

8/10/2019 Gsp Vol i Radio Aids
http://slidepdf.com/reader/full/gsp-vol-i-radio-aids 133/232
The variety of aircraft types with wide differences of speed and altitude in a
crowded airspace demands positive identification of each aircraft for adequate
safe control by ATC. Primary radar is insufficiently informative, and has the
added disadvantages of clutter on the screen and a necessarily high power
output for the two-way journey of the wave. Secondary radar, when used
in conjunction with the primary radar, does away with these drawbacks,
but does demand the co-operation of the aircraft in that the appropriate
equipment must be aboard. When such equipment must be carried in desig-
nated UK airspace is firmly and legally laid down.
A ground based transmitter/receiver triggers off a reply from.an aircraft's
receiver/transmitter when the correct operating procedures are followed: the
reply is on a different frequency from the interrogator. The interrogator is
the name for the ground equipment, the transponder for that in the aircraft.
The aircraft not only identifies itself positively without manoeuvres, but gives
its height. On the ground, range and bearing are displayed on the screen,
nice and clear, while the aircraft's height, destination or point of leaving
airspace and callsign are also shown on the screen as computer-generated
symbols on a synthetic clutter-free display. All signals are coded; the code of
the interrogation signal is called the mode.
Frequency (UHF)
Ground transmits on 1030MHz, receives on 1090MHz;
Aircraft transmits on 1090MHz, receives on 1030MHz.
The ground interrogator aerial is directional while the aircraft transponder
aerial is non-directional.
Process
The method used is the transmission and reception of pulses, and it is
essential to eliminate weak or spurious signals, since the coding system
depends on the 'presence' or 'non-presence' of pulses. The interrogator
transmits two pulses with a known spacing, and there are four modes, each
mode having a different spacing.
Mode A has pulses (always O.85~s wide) 8~s apart
Mode B 17~s apart

8/10/2019 Gsp Vol i Radio Aids
http://slidepdf.com/reader/full/gsp-vol-i-radio-aids 134/232
146
Radio Aids
Mode C 211 s apart
Mode D 251 s apart.
Modes A and B are used for identification, Mode C for automatic height
information, while Mode D is experimental. The aircraft transponder will
reply to an interrogation signal provided the pilot has selected the cor-
responding mode. The transponder transmits a code in reply to a correct
interrogation (correct in that the aircraft equipment recognises the mode by
the time spacing between each pair of interrogation pulses),'a code which is
obtained by the inclusion or omission of any of up to 12 pulses. The train of
12 pulses is contained between two framing pulses, 20.31 s apart, and these
are always sent. Between them, the information is sent by transmitting or
leaving out any of the 12. The codes available in a twelve-pulse train then are
212 = 4096, and the codes are numbered 0000 to 7777, using all numbers
except those containing an 8 or 9. Pulses in the transponder are 0.451 s wide.
A further pulse, the special identification pulse, can be transmitted when the
ident button is pressed on the aircraft unit, usually at A TC's request; this
pulse is after the second frame pulse, and will be automatically and con-
tinuously transmitted for about 20 seconds after pushing the button.
The modes and codes are selected by switches on the aircraft control box: a
function switch for mode, a window for code, a button for ident, and a switch
for automatic height reporting. The mode and code are pre-allotted before
departure usually, or requested by A TC in flight; there are various special
selections such as Mode A, code 7600 to be used in the event of radio failure,
7700 for distress, 7500 for hijack, to quote examples. Others are 0000 to
indicate a transponder malfunction, 2000 for entering airspace from an area
where SSR operation has not been required, 7000 for conspicuity code. 7007
is allocated to aircraft engaged on airborne observation flights under the
terms of the Treaty on Open Skies (which are published in NOTAMs).
When selecting a code, this should be done on the STBY (standby) switch
position. Then when flicking over the counter in the window (or on the LCD
display) to the required code, there will not be any risk of inadvertingly
transmitting a whole string of codes until you reach the required four-figure
number. Particularly it is important not to squawk accidentally any of the
emergency settings. If any emergency setting is transmitted, it immediately
activates an alarm system at the ground station and automatically initiates the
emergency procedures. Having made the required setting, the function switch
is then set at ON, or at ALT if requested to SQUAWK CHARLIE. ...
Automatic altitude telemetering
On getting Mode C interrogations, the transponder will produce one of 4096
codes, no matter what code is selected in the window. This code is determined
by the output of an altitude digitiser mechanically linked to the altimeter; the
sequence of pulses transmitted is thus entirely determined by the aircraft's
height. This height is always referenced to 1013.2 mb, quite independent of
altimeter setting; the equipment will provide automatic altitude telemetering
8/10/2019 Gsp Vol i Radio Aids
http://slidepdf.com/reader/full/gsp-vol-i-radio-aids 135/232
Secondary Surveillance Radar
147
up to 128000 ft, with a change of output every 100 t. The controller is thus
automatically provided with the aircraft's flight level. If your allocated flight
level is 65 and you let the aircraft wander below the cleared level, then as
soon as you pass from 6450 t to 6445 t the controller's 'blip' coding will
immediately show you flying at 6400 t rather than your cleared 6500 t.
Unwanted echoes
The interrogator aerial sends out a wide vertical beam and a narrow one in
azimuth: the azimuth beam, though, has side lobes which could produce a
transponder response, spreading the echo on the indicator tube and denying
the required accuracy of range and bearing. To correct this, an omnidirec-
tional radiation transmission is introduced, whose signal strength is greater
than the strongest side lobe but less than the main beam. By fitting a circuit
in the transponder for comparing the amplitude of pulses, it can be arranged
not to reply to side lobe interrogations; for example, the first pulse of the
mode can be transmitted in the omnidirectional pattern, and the second in
the interrogator pattern; the transponder will only reply if the interrogator
pulse is equal to, or greater than, the amplitude of the omnidirectional pulse.
Or, by a normal transmission of interrogator pulses with an omnidirectional
pulse intervening 2 J.lSafter the first: the transponder will not reply if the
omnidirectional pulse is greater in amplitude than the interrogator .
Despite the circuitry , some 'fruiting' and 'garbling' may occur. If aircraft
are within the range of two or more SSR stations they may cause non-
synchronous interference to one of the stations by responding synchronously
to another station, which is called fruiting. Also if two or more aircraft are
close enough together, such as when in a holding pattern or overtaking, so
that they are in the aerial beam at the same time and produce overlapping
replies, this is known as synchronous garbling.
General
The aircraft equipment is kept on Standby until required; this keeps the
display on the ground clean. The range of SSR is of the order of 200 nm, and
the PRF is about 250 per second. Several aircraft in an area with similar flight
plans may have been allotted the same code; identification of one would be
demanded by A TC, and the resultant echo on the ground display would show
as a 'filling-in' of one of the echoes already showing; or ATC might of course
order an aircraft to turn to another code.
Advantages
.Longish range
.No clutter, no unwanted echoes from cloud, high buildings, high ground,
and so on
.Reply signals give range, bearing, height, aircraft identity, destination or
point of leaving airspace positively and automatically

8/10/2019 Gsp Vol i Radio Aids
http://slidepdf.com/reader/full/gsp-vol-i-radio-aids 136/232
148
Radio Aids
.No effort required by the pilot -well, very little anyway
.All other communication channels are left free
.Information of A TC is instantaneous and unambiguous
.No aircraft manoeuvres required
.Little power needed.
Disadvantage
Disadvantage is that the aircraft must carry the necessary equipment.
In UK airspace, stringent regulations for the carriage of SSR transponders
apply.
It is compulsory when flying in the Upper Airspace and whole of the UK
controlled airspace under instrument flight rules (IFR) to carry Mode A 4096
codes and also Mode C.
Gliders are exempt from the above requirement, as are aircraft below FL
100 in controlled airspace receiving an approved crossing service.
Most ICAO States have now published some form of mandatory require-
ments for carriage of SSR, the details of which are generally available from
the State's AlP as well as from the Aerad Supplements.
There is a standard RTF phraseology for SSR, the operative word being
'Squawk'. For example: 'Squawk Alpha Code 7600' means 'Select Mode A
Code 7600 on your control box, and switch on transponder'. 'Squawk Ident'
means 'Stay on present mode and code, but press the Identification button'.
Mode S data link
In chapter 3, reference was made to ground/air two-way communications
by means of VHF or Satcom. A further datalink is now being introduced
through what is known as SSR with selective addressing- Mode S, specified
in ICAO Annex 10. Whereas the SSR modes and codes so far described
handle only 4096 identities with altitudes in 100ft increments, Mode S has
enormously greater capacity, while the equipment will still be compatible with
the current Modes A and C units. It will handle over 5 x 1033different uplink
and downlink messages and have a capacity for over-the-horizon service
because it will also have a widely-distributed ground data network. The
uplink message will be specifically addressed to a particular aircraft and the
system permits for over 16000000 discrete aircraft addresses far in excess of
the number of aircraft of all types in existence world-wide (see Fig. 11.1.)
Mode S is designed to serve two main functions -communications and
surveillance. It is foreseen that the great bulk of RTF messages will be
eventually be exchanged by datalink, whether air-initiated or ground-initiated.
With FMSs becoming commonplace, messages to and from the flight crew
can be managed via the CDU. From the small aircraft aspect, the proposed
Mode Sierra transponder kit will, compared to the panel of the current Modes
A and C transponders, also have a CDU format on which messages on
weather, destination, A TC, etc. , can be displayed to the pilot in flight. As
regards surveillance, the encoding altimeters will have a capability to report

8/10/2019 Gsp Vol i Radio Aids
http://slidepdf.com/reader/full/gsp-vol-i-radio-aids 137/232
Secondary Surveillance Radar 149
Private
Ground
Network
ATS
Ground
Network
Fig.
3 'carriers' giving ground-air-ground communicatioru
in 25 ft increments rather than the 100 t increments of Mode C. Enhanced
data in the form of the aircraft's bank angle, accelerations, heading, ground
speed, etc. , will all pass automatically to A TC. The feeding of the bank angle
for example, will in turn enhance the radar tracking on the screen in front of
the controller. Currently there is a slight delay in displaying a turn initiated
by an aircraft because the A TC system computer checks that it is indeed a
genuine turn on to a new heading and not just a transient 'jink' in the
response. Because in normal flight the pilot applies bank when initiating a
turn, the bank information can supplement the radar plot report, so telling
the computer immediately the turn starts. All of the finer detail arriving from
the enhanced actual data from the aircraft and the flight intentions with the
ATS I/Weather
~tabase~ ~ Dat~

8/10/2019 Gsp Vol i Radio Aids
http://slidepdf.com/reader/full/gsp-vol-i-radio-aids 138/232
150 Radio Aids
completely unambiguous aircraft identity will enable better conflicting traffic
information and its resolution. Airborne collision avoidance systems (ACAS)
and traffic conflict alert system (TCAS) themselves are discussed in a later
chapter .

8/10/2019 Gsp Vol i Radio Aids
http://slidepdf.com/reader/full/gsp-vol-i-radio-aids 139/232
Ground radars are used extensively in civil aviation, particularly by the ATC
services, for which they now form an essential part of their equipment. The
main types of ground radars may be summarised as:
(1) Long range surveillance radar. Used for airway surveillance, etc., up to
200-300nm. Primary radar provides range and bearing, i.e. positional
information, which in some areas may be supplemented by a height-
finding surveillance radar. Additional information is also provided by
SSR.
(2) TMA surveillance radars. Medium range radars, up to 75 nm, used
for controlling traffic in terminal areas, etc. Primary radar provides
positional information which is normally supplemented by SSR.
(3) Aerodrome surveillance (approach) radar. A short range, approximately
25 nm, primary radar providing positional information. Used for the
control of aircraft in the vicinity of an aerodrome and for limited
approaches.
(4) Precision approach radar (PAR). Gives very accurate azimuth and
elevation guidance relative to the approach path to an aerodrome
runway. Used originally by a ground controller to 'talk down' a pilot to
the runway; in the UK this procedure has now been withdrawn from
most civil aerodromes.
(5) Surface movement radar. Installed at major airports to provide a very
precise radar picture of the aerodrome surface. It is used in poor
visibility to control the movement of traffic on the aprons, taxiways and
runways. Maximum range approximately 2.5 nm.
(6) Weather radar. A primary radar used by the meteorological service to
supplement their knowledge of current weather conditions, varying from
thunderstorm location to finding upper winds.
Note: Short-range radars, e.g. surface movement radar, employ very short
wavelengths ( e.g. 1 to 3 cm) to achieve short rectangular pulses which give
superior resolution and accuracy. Long-wave radars, e.g. surveillance radars,
employ longer wavelengths (e.g. 10cm) with larger pulses to achieve greater
ranges with less attenuation.
To enlarge upon (3) and (4) above, an approach surveillance radar (RAD)
and PAR may be utilised for approach and landing down to zero conditions.

8/10/2019 Gsp Vol i Radio Aids
http://slidepdf.com/reader/full/gsp-vol-i-radio-aids 140/232
152 Radio Aids
RAD
It may be necessary to ensure firm identification, to call on the aircraft to
perform a simple manoeuvre (e.g. a procedure turn) and follow its blip on
the radar screen. Other methods of identification acceptable are a VOR/
DME fix, a response from the aircraft's SSR transponder or a direct handover
from one radar unit to another. Once identified, the aircraft is guided verbally
to the approach path at 1500 t and is handed over to the precision controller .
ICAO lays down a minimum specification of being able to identify a small
single-engined aircraft at a distance of 20 nm at 8000 t. The equipment must
give a position accuracy of :: :2° of the true position and be able to see two
aircraft separately when 4° apart from each other in azimuth. This is achieved
by radiating a beam 2° in azimuth to an elevation of 30°. The scanner rotates
at 10, 15 or 20 rpm and the system is duplicated. The display face is switchable
to scales of 10, 20, 40 or 60 nm range.
The use of a relatively long wave produces only weaker rain echoes and
when working on a 50cm (600MHz) band it is completely clear of the rain
clutter and therefore no suppression device is necessary ASR is essentially
an instrument approach system where the air traffic controlofficer (ATCO)
issues instructions so the pilot can bring his aircraft on to the final approach
path on the extended runway centreline. It is an azimuth and range facility
but has no elevational data.
PAR
Precise information must be readily visible for immediate instructions to
the aircraft, so two discriminators of 3 cm wavelength are available. The
beam sweeps both in azimuth and in elevation along the approach line.
The antennae are sited to one side of the runway near the touchdown point.
The system requiremenrs are that it should be capable of detecting and
indicating the position of an aircraft of 15 m2 (165 ff) echoing area (or larger)
which is within a space bounded by a 20° azimuth sector and a 7° elevation
sector to a distance of at least 9 nm. The maximum permissible error from
on-course indication is 0.6% of the distance from antenna plus 10% of
deviation from the on-course line or 30 ft whichever is greater. Similarly,
elevation accuracy is 0.4% of the distance from the antenna plus 10% of the
actual linear displacement or 20 ft, whichever is greater .
The information is displayed on two screens mounted one on top of the
other and the controller is able to pass instructions to the pilot by watching
two blips in relation to the centre lines on the screens.
General notes
It is important that when p AR is on a location also served by ILS that
glidepath and azimuth indications are coincident inbound from the outer
marker. Two pilots in CA VOK will practise the two approaches, one moni-
toring the other. In certain weather conditions it is mandatory for ILS
approaches to be monitored. In this case the precision controller will advise
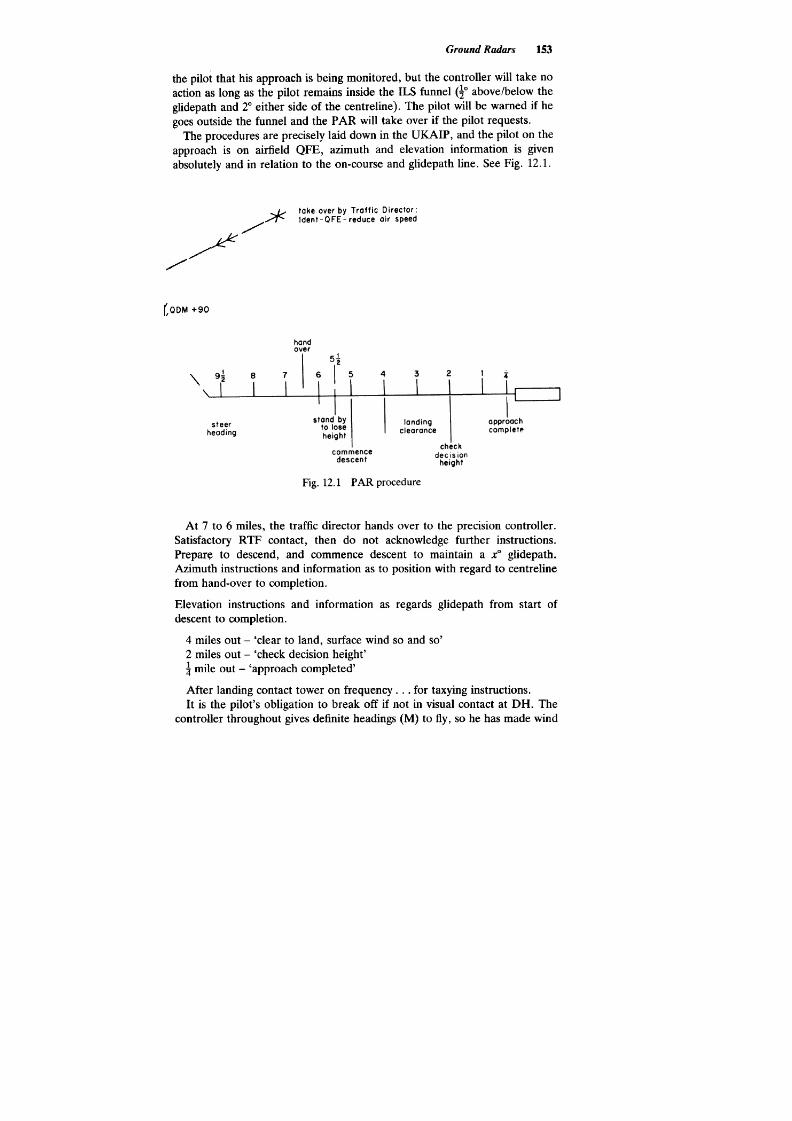
8/10/2019 Gsp Vol i Radio Aids
http://slidepdf.com/reader/full/gsp-vol-i-radio-aids 141/232
Ground Radars
153
the pilot that his approach is being monitored, but the controller will take no
action as long as the pilot remains inside the ILS funnel < 0 above/below the
glidepath and 2° either side of the centreline). The pilot will be warned if he
goes outside the funnel and the PAR will take over if the pilot requests.
The procedures are precisely laid down in the UKAIP, and the pilot on the
approach is on airfield QFE, azimuth and elevation information is given
absolutely and in relation to the on-course and glidepath line. See Fig. 12.1.
take aver by Traffic Directar
Ident -QFE -reduce air speed
/
~
/
/
COOM+90
"
Fig.12.1 PAR procedure
At 7 to 6 miles, the traffic director hands over to the precision controller .
Satisfactory RTF contact, then do not acknowledge further instructions.
Prepar~ to descend, and commence descent to maintain a XO glidepath.
Azimuth instructions and information as to position with regard to centreline
from hand-over to completion.
Elevation instructions and information as regards glidepath from start of
descent to completion.
4 miles out -'clear to land, surface wind so and so'
2 miles out -'check decision height'
mile out -'approach completed'
After landing contact tower on frequency. ..for taxying instructions.
It is the pilot's obligation to break off if not in visual contact at DH. The
controller throughout gives definite headings (M) to fly, so he has made wind
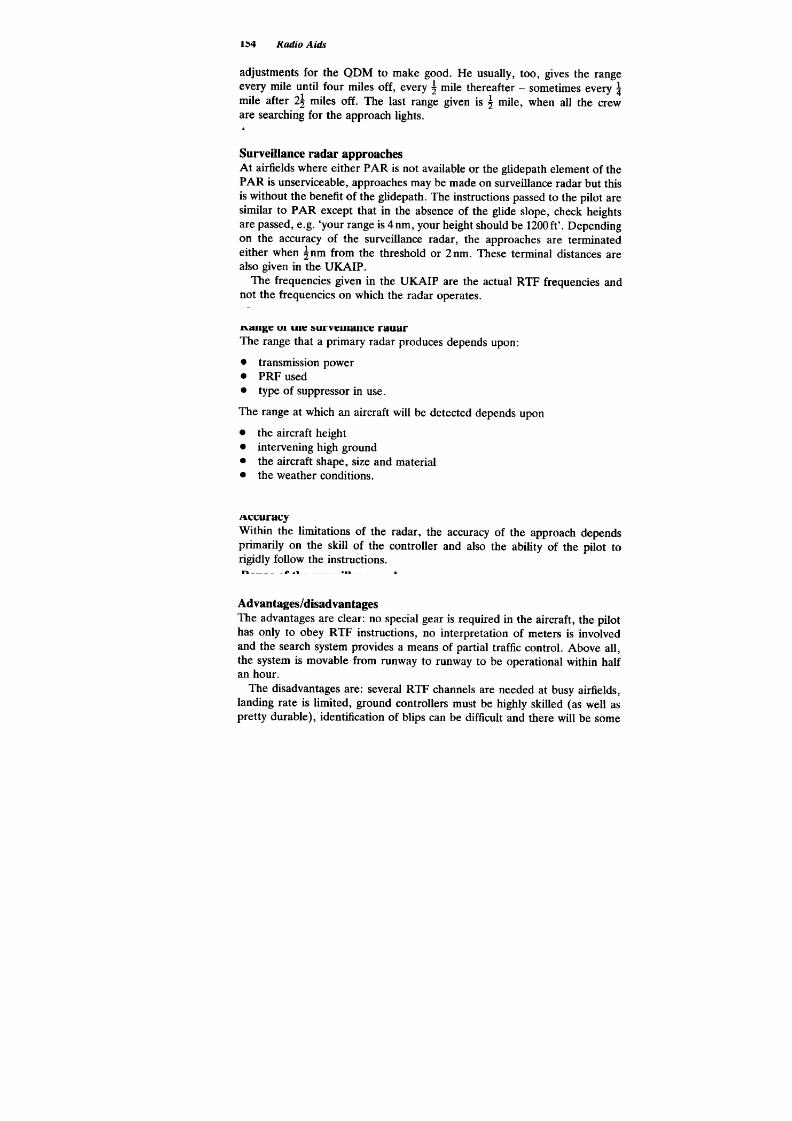
8/10/2019 Gsp Vol i Radio Aids
http://slidepdf.com/reader/full/gsp-vol-i-radio-aids 142/232
154
Radio Aids
adjustments for the QDM to make good. He usually, too, gives the range
every mile until four miles off, every mile thereafter -sometimes every i
mile after 2 miles off. The last range given is mile, when all the crew
are searching for the approach lights.
Surveillance radar approaches
At airfields where either PAR is not available or the glidepath element of the
PAR is unserviceable, approaches may be made on surveillance radar but this
is without the benefit of the glidepath. The instructions passed to the pilot are
similar to PAR except that in the absence of the glide slope, check heights
are passed, e.g. 'your range is 4nm, your height should be 1200ft'. Depending
on the accuracy of the surveillance radar, the approaches are terminated
either when nm from the threshold or 2nm. These terminal distances are
also given in the UKAIP .
The frequencies given in the UKAIP are the actual RTF frequencies and
not the frequencies on which the radar operates.
Range or the surveillance radar
The range that a primary radar produces depends upon:
.transmission power
.PRF used
.type of suppressor in use.
The range at which an aircraft will be detected depends upon
.the aircraft height
.intervening high ground
.the aircraft shape, size and material
.the weather conditions.
Accuracy
Within the limitations of the radar, the accuracy of the approach depends
primarily on the skill of the controller and also the ability of the pilot to
rigidly follow the instructions.
Advantages/disadvantages
The advantages are clear: no special gear is required in the aircraft, the pilot
has only to obey RTF instructions, no interpretation of meters is involved
and the search system provides a means of partial traffic control. Above all,
the system is movable from runway to runway to be operational within half
an hour .
The disadvantages are: several RTF channels are needed at busy airfields,
landing rate is limited, ground controllers must be highly skilled (as well as
pretty durable), identification of blips can be difficult and there will be some

8/10/2019 Gsp Vol i Radio Aids
http://slidepdf.com/reader/full/gsp-vol-i-radio-aids 143/232
Ground Radars
155
clutter in rain or snow (remember that a pulse is reflected from objects of
comparable wavelength -PAR is 3cm).
Break off
The pilot must break off the approach at the DH unless a visual landing can
be made. The controller has authority to order an overshoot.

8/10/2019 Gsp Vol i Radio Aids
http://slidepdf.com/reader/full/gsp-vol-i-radio-aids 144/232
A WR primarily provides a pictorial representation of turbulent and dangerous
clouds located along the flight path and warns the pilot well in advance. The
information is displayed on a CRT and the picture can indicate the best route
of penetration through bad weather. As a secondary function the equipment
also provides the pilot with the facility of map-painting radar for the purpose
of navigation and avoidance of high ground. On EFIS-equipped aircraft, the
display appears on the navigation display either on its own or integrated with
navigation information, TCAS etc.
Principle
A WR is a primary radar. In both mapping and cloud detecting roles, the
requirements are to find the range and bearing of the objects. The range
is found by the echo principle and the direction is found by use of the
searchlight principle. Both these techniques are discussed in the chapter on
radar .
Weather radar
The requirement is to detect turbulent cloud, provide information on weather
severity and indicate safe routes round, if any. The efficiency of the equip-
ment in discharging the above functions depends on the following two
factors:
(1) Wavelength (or frequency). As noted earlier, the efficiency of the
reflection depends on the wavelength in relation to the reflecting object.
For A WR, the wavelengths considered appropriate for satisfactory
operation lie between 10cm and 3cm in the SHF band. At these
wavelengths fine mist, haze, clouds of tiny water droplets do not reflect
energy whereas water droplets in a cumulonimbus will have reached
sufficient dimensions to give an echo. In this way, harmless stratus is
prevented from cluttering up the screen.
If the wavelength is increased above 10 cm the waves will be too large and
no reflections will occur. On the other hand if it is reduced too much below
3cm, a relatively large amount of energy will be absorbed instead of being
reflected, although some radar does work on a 2 cm wavelength.
Thus, the choice being limited between 10 cm and 3 cm, for a given power

8/10/2019 Gsp Vol i Radio Aids
http://slidepdf.com/reader/full/gsp-vol-i-radio-aids 145/232
Airborne Weather Radar
157
output, the energy on a 3 cm wavelength will give a better range and a more
comprehensive picture of the situation. On the other hand, at a shorter
wavelength it will possibly not look behind a reflecting cloud. A 3.2cm radar
is quite popular with commercial transport aircraft.
(2) Beamwidth. The beamwidth must be kept as narrow as possible for
good target resolution. Two targets less than a beamwidth distance apart
will appear as one single target, see Fig. 13.1. The beam widens with
range. Therefore, for example, two objects at 100nm distance may
appear as a single target, but as the range is closed and the beam
narrowed, each will establish a separate identity. To an operator this
may give a false impression of fresh activity being developed at a close
range. Therefore, the narrower the beam, the better the resolution; and
for airborne equipment this again means the use of shorter wavelengths.
:::-:::-=-
-0
.-Q
-beamwidth
giving single echo
--direction of the beam rotation
~ =:- ~
--
,I
echoes now separate
3.1 Effect of beam width.
From the above study we can conclude that the factors which determine
whether or not a cloud within the equipment's range will be detected or not
are:
(1) the size of the water drops and
(2) the wavelength or frequency in use.
The accuracy of resolution will depend on the beamwidth. A conical pencil
beam is considered to be the most suitable for use with A WR giving a good
range for power rating.
It is because A WR is dependent upon returns from water drops, hailstones,
etc. , to indicate the associated turbulence that it is not a system which will
display clear air turbulence such as associated with jet streams.
Map-painting radar
Mapping, again, should be done on a narrow beam in the interest of resol-
ution (the beamwidth used is around 3 0). It should be broad enough to cover
a maximum possible horizontal distance. Such a beam would be a fan-shaped
beam, see Fig. 13.2.
It will be appreciated that with this type of beam the surface illuminated
below and closer to the aircraft will give stronger (and thus brighter) reflec-

8/10/2019 Gsp Vol i Radio Aids
http://slidepdf.com/reader/full/gsp-vol-i-radio-aids 146/232
158
Radio Aids
Fig. 13.2 Cosecant (mapping) beam
tions than the ground further away. The picture on the CRT will appear
progressively fading away with distance. This in itself may not be an incon-
venience but radar maps are essentially read from the differing brightness of
the dissimilar objects. Some objects come up very bright, others not so much,
and yet others which do not reflect at all. For a reliable interpretation we
would like all similar objects to produce similar brilliance. This difficulty is
overcome by adjusting the power spread so that maximum power is directed
to the farthest point to be covered. The power ill progressively reduced
as distances decrease so that the power directed to the closest object is
minimum. This reduction in power with decreasing range is the function of
cosecant of the depression angle and the beam so produced is called a
coseca lt (or mapping) beam.
Theoretically, for the maximum range the upper edge of the fan should
radiate horizontally ahead of the aircraft, that is, at a depression angle of
00. This cannot be achieved in practice as the cosecant, of 0 is infinity. A
practical beam is tilted down by about 5°. In flight the aerial tilt angle can be
adjusted to give a most advantageous display.
As the cosecant beam is more widely spread out than the pencil beam used
for weather detecting, and as the power available to both is the same, the
distance of coverage available using a cosecant beam will tend to be more
restricted. The actual range available depends on the power, the aircraft's
altitude, the reflecting property of the surface and the angle of depression
in use. With older equipment 70 nm is just about the limit. Use a pencil
beam where distances beyond the cosecant beam's range are required to be
scanned.
The shapes that you will see on the CRT, such as a coastline, or the
contours of a hill or the outline of a town, will not be identical to what you
would see with your naked eye. Figure 13.3 shows a straight coastline across
track 6nm ahead, Fig. 13.4 how the beamwidth affects the size of the echo
displayed.
Little or no energy will come back from a calm sea. This makes a coastline
easily separable from the landmass. Similarly fine sand or flat terrain will not
give reflections. Brighter echoes will occur in built-up areas, taller buildings
showing up brighter still. Hills and man-made structures cast shadows behind
them, Fig. 13.5, sometimes giving a false impression of water or a lake. If you
~

8/10/2019 Gsp Vol i Radio Aids
http://slidepdf.com/reader/full/gsp-vol-i-radio-aids 147/232
Airborne Weather Radar
159
1---
~--r'\-~
Fig. 13.3 Effect of slant range
--
-:;;;;;;::: starts the image when C/L here -the
---~ forward edge is in contact with the object
---beam --o \
\
forWard edge
r~ar-ed-ge
I duration of the image
recorded on PPI
:::::==:=~contact end when
C/L here
---
Fig. 13.4 Beamwidth and echo.
Fig. 13.5 Hill shadow
are used to a route and seeing the same picture, it is worth bearing in mind
that the picture can change substantially with seasons in the middle and
higher latitudes. For example, rivers and lakes show up nicely in normal
circumstances and also when iced up (ice has jagged edges which reflect), but
,"\~r
k15
t

8/10/2019 Gsp Vol i Radio Aids
http://slidepdf.com/reader/full/gsp-vol-i-radio-aids 148/232
160
Radio Aids
will not show at all when covered with snow. The same is true for landmasses.
Snow reduces the detection range of the equipment and the responses from
the features are toned down, irregularities being removed by the snow
deposits.
When using the equipment for weather detection, falling rain, wet hail or
snow -in fact any liquid concentration -will show up. The three stages of a
thunderstorm can be observed. The first appearance of the echoes indicates
the beginning. The echoes grow in size and when the fuzzy edge is replaced
by a well-defined edge the mature stage is reached. At this stage in mono-
chrome a black hole will be seen when operating on contour function (see
later). The dissipating stage is the process in reverse. The black hole gets
smaller, ultimately disappearing, the cloud echo becoming ill-defined and
weaker .
If a cloud shows up at a very long distance, say a hundred mile range, it
indicates a presence of high liquid concentration -a cloud that must be
watched.
Airborne equipment
The airborne equipment consists of the following units:
.transmitter/receiver
.an aerial scanning unit
.an indicator, and
.a control unit.
Transmitter /receiver
Transmission frequency varies with equipment within the range stated earlier .
A typical A WR used by commercial airliners operates on a frequency of
9375MHz (SHF or X-band). This gives a wavelength of 3.2cm. The range
covered is 320 nm. The mapping beam is 85° deep and scans a sector of 90°
either side of the aircraft's centre line, ahead of the aircraft. With some
equipment, a scan extending to 120° is available. The beamwidth of the
conical pencil beams (weather beam) depends on the size of the scanner
employed. An 18-inch scanner produces a beamwidth of 5° and a 24-inch
scanner, 3.5°.
Aerial scanning unit
The scanner unit consists of a paraboloid dish with a centre dipole and the
system is gyro stabilised in pitch and roll.
Indicator
A typical indicator is shown in Fig. 13.3. Bearings are marked on the face of
the CRT with bearing lines at 15° intervals and the range markers are
electronically produced. The intervals between range markers vary according
to the selected range.

8/10/2019 Gsp Vol i Radio Aids
http://slidepdf.com/reader/full/gsp-vol-i-radio-aids 149/232
Airborne Weather Radar
161
On a 150 nm range indicator:
.on 20 nm scale, range markers appear at 5 nm intervals
.on 50nm scale, range markers appear at 10nm intervals and
.on 150 nm scale, range markers appear at 50 nm intervals.
Similarly on a 120 nm equipment:
.on 20 nm scale, range markers appear at 5 nm intervals
.on 60nm scale, range markers appear at 10nm intervals and
.on 120 nm scale, range markers appear at 20 nm intervals.
If it is a colour CRT as in an EFIS multi-function display, typical ranges
are 10,25,50, 100,200 and 300nm. Annunciator range markers are shown at
20% , 40% , 60% and 80% of the selected range. It is probable that the range
and azimuth markers will be green on mapping and cyan (pale blue) on
weather .
Control unit
A typical control unit is shown in Fig. 13.6 of a basic, stand-alone, mono-
chrome weather radar .
The controls are usually:
Fig. 13.6 Typical monochrome control unit.
Power switch. A three-position switch, it controls the power supply. In ON
position the aerial is automatically stabilised, in STAB OFF position it is
locked to the pitch and roll axes of the aircraft.
Time base range switch. This is a four-position rotary switch; in STBY
position it maintains the equipment in readiness for instant use. Use this
position when A WR is not required during short intervals.
Tilt control. Permits an aerial tilt from 00 to 15° UP or 15° DOWN .The
aerial is normally tilted downward when ground mapping or it is raised up to
estimate the heights of cloud base/top.
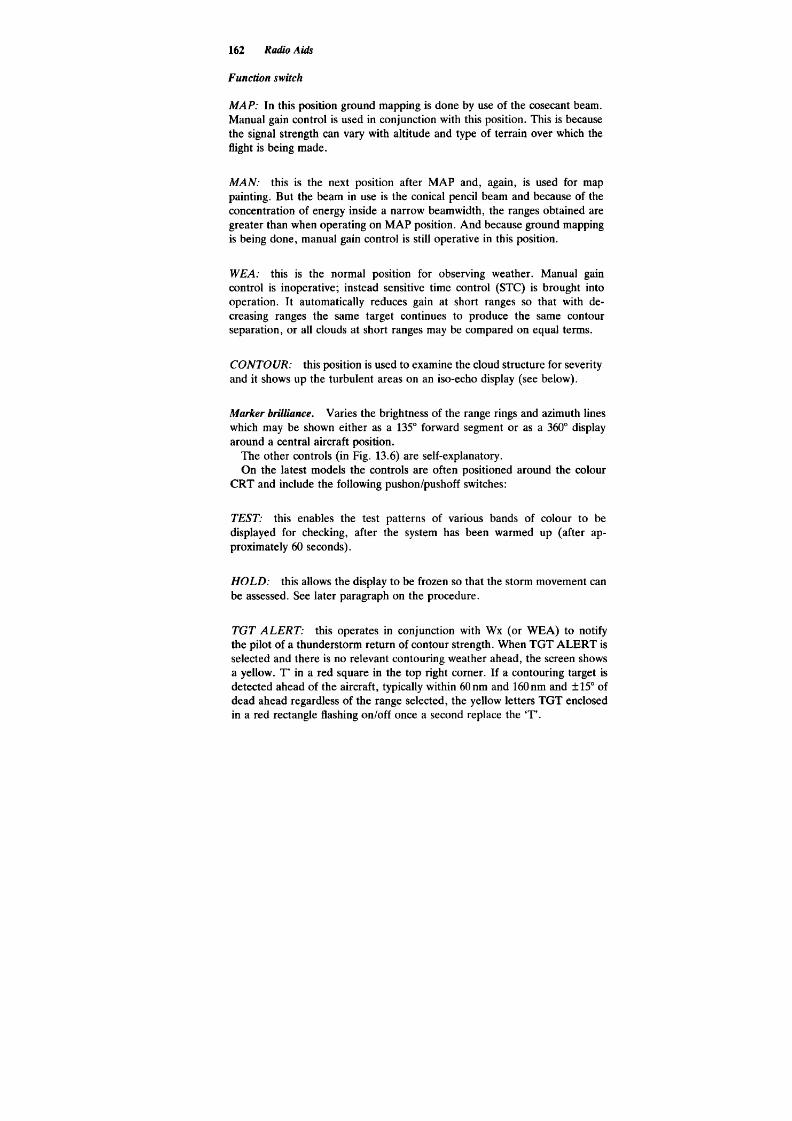
8/10/2019 Gsp Vol i Radio Aids
http://slidepdf.com/reader/full/gsp-vol-i-radio-aids 150/232
162
Radio Aids
Function switch
MAP: In this position ground mapping is done by use of the cosecant beam.
Manual gain control is used in conjunction with this position. This is because
the signal strength can vary with altitude and type of terrain over which the
flight is being made.
MAN: this is the next position after MAP and, again, is used for map
painting. But the beam in use is the conical pencil beam and because of the
concentration of energy inside a narrow beamwidth, the ranges obtained are
greater than when operating on MAP position. And because ground mapping
is being done, manual gain control is still operative in this position.
WEA: this is the normal position for observing weather. Manual gain
control is inoperative; instead sensitive time control (STC) is brought into
operation. It automatically reduces gain at short ranges so that with de-
creasing ranges the same target continues to produce the same contour
separation, or all clouds at short ranges may be compared on equal terms.
CONTOUR: this position is used to examine the cloud structure for severity,
and it shows up the turbulent areas on an iso-echo display (see below).
Marker brilliance. Varies the brightness of the range rings and azimuth lines
which may be shown either as a 135° forward segment or as a 360° display
around a central aircraft position.
The other controls (in Fig. 13.6) are self-explanatory.
On the latest models the controls are often positioned around the colour
CRT and include the following pushon/pushoff switches:
TEST: this enables the test patterns of various bands of colour to be
displayed for checking, after the system has been warmed up ( after ap-
proximately 60 seconds).
HOLD: this allows the display to be frozen so that the storm movement can
be assessed. See later paragraph on the procedure.
TGT ALERT: this operates in conjunction with Wx (or WEA) to notify
the pilot of a thunderstorm return of contour strength. When TGT ALERT is
selected and there is no relevant contouring weather ahead, the screen shows
a yellow. T' in a red square in the top right corner. If a contouring target is
detected ahead of the aircraft, typically within 60nm and 160nm and ::t15° of
dead ahead regardless of the range selected, the yellow letters TGT enclosed
in a red rectangle flashing on/off once a second replace the 'T'.

8/10/2019 Gsp Vol i Radio Aids
http://slidepdf.com/reader/full/gsp-vol-i-radio-aids 151/232
Airborne Weather Radar
163
AZ: this switch selects whether or not the five azimuth (or bearing) lines are
displayed.
STAB: this is to stabilise the antenna in pitch and roll, and is usually kept
on the ON position.
There will be a fault-monitoring circuit with a priority over any mode that
has been selected. If there is a power interruption or the transmitter fails, the
word FAULT flashes on the screen. The system is reset by momentarily
selecting STBY and then the required mode.
Iso-echodisplay
Although the operator can see on the screen the complete cloud distribution
ahead of him, without sufficient experience he would find it difficult to pick
out dangerous clouds from among the less dangerous ones on a black/white
display. The iso-echo type of display simplifies this distinction. It is known
that strong turbulent clouds produce strong echoes compared with weak,
inactive clouds, and this fact is utilised in the production of iso-echo display.
All reflections above a predetermined echo level are cut off from reaching the
screen. About the turbulent centre there is usually the remainder of the cloud
whose activity is below the predetermined level. This will be seen on the
screen. This signifies that a cloud on the screen with a hole in the centre is
dangerous. The hole or the blacked out portion of the cloud is particularly
dangerous, containing the highest concentration of large drops; the degree of
the danger from the turbulence in the cloud depends mainly on the steepness
of the contour (Fig. 13.7). On some screens, the hole may be drawn to the
pilot's attention by being flashed cyclically.
very steep gradient-avoid
~--~
"'
"
/
~ght
rInQ
"
=--
v -,r/ ,
II
-, "
ij -,\
II \\
\
I'
normal display iso-echo display
Fig. 13.7 Iso-echo.
Similarly on colour CRTs with a three or four colour presentation, in-
creasing severity is shown by echo colours ranging from green to yellow to
red and/or magenta for the areas of strongest echoes and heaviest rainfall.

8/10/2019 Gsp Vol i Radio Aids
http://slidepdf.com/reader/full/gsp-vol-i-radio-aids 152/232
164
Radio Aids
The area of greatest turbulence occurs where the colour zones are closest
together on the screen (i.e. the steepest contour gradient or paint).
Operation on ground
If the equipment is required to be switched on while on the ground take
precautions, e.g. , first check that there are no large hangar or other reflectin~
objects in the vicinity. The radiation can damage the health of personnel and
the reflections can damage the equipment. And for the same reasons do no1
select mapping beam on the ground.
The usual pre-flight start-up check for a colour airborne weather radar is as
follows:
(1) Check that the antenna is not pointed towards ground personnel,
hangars or other large metal buildings, towards other aircraft or towards
containers holding flammable material.
(2) Check that no fuelling or de-fuelling operations are being carried out.
(3) Check that the radar busbar circuit breaker is in.
(4) Select TEST mode.
(5) Select 25 nm range.
(6) Select GAIN control to MAX.
(7) Select TILT control to +5°.
(8) Leave the TARGET ALERT switch at OFF.
(9) Select AZ switch to ON .
(10) Select STAB switch to ON.
(11) Within approximately 20 seconds, the azimuth and range lines should
appear together with the word TEST on the display. On a 25 nm Tange
display, the range markers 5, 10, 15,20 and 25 also appear.
(12) Within approximately 60 seconds, the test pattern will appear showing
the colours in bands.
(13) Recheck that the antenna is not pointing towards personnel, hangars,
large buildings, other aircraft or containers of flammable materials,
THEN momentarily select WX ( or WEA) mode, reselect TEST, select
HOLD. The signs HOLD and TEST then alternate on the CRT ,
superimposed on the frozen test pattern.
(14) Select Wx (or WEA) when that will appear on the screen.
(15) Select 10 nm range and note the new range rings and their annunciators.
(16) Adjust the tilt control over the whole range noting ground returns

8/10/2019 Gsp Vol i Radio Aids
http://slidepdf.com/reader/full/gsp-vol-i-radio-aids 153/232
Airborne Weather Radar 165
at the low settings and any thundery weather returns at the higher
settings.
(17) Select STBY mode until airborne.
Operating on weather
Select maximum range to detect presence of clouds in good time. When the
clouds close up to around 50-60nm, select lower scale and operate on
CONTOUR function. Ensure from the beginning that no ground returns are
being received -the aerial tilt may be adjusted to exclude them. Any storms
detected at very long ranges are potentially dangerous. Take avoiding action
when the range gets below 20 nm. If possible avoid all response areas; if
this cannot be done, then at least avoid responses with black holes or
red/magenta areas.
Apart from the points already made under iso-echo display, there are other
characteristics of the returns of which pilots should be aware. Hail associated
with thunderstorms may well produce 'fingers' or stubs out from the main
echo up to 5 nm long. Other shapes can be in the form of hooks, scalloped
edges and U-shapes which even if there is no hail can usually be relied upon
as good indicators of areas of severe turbulence. The extreme case of a
thunderstorm is a tornado associated with cumulonimbus-mammatus. In the
same way as the actual tornado cloud has a writhing funnel cloud beneath it,
the tornado cloud echo often shows a narrow, finger-Iike extension from its
main outline, which quickly curls into a hook and then closes on itself.
Fortunately, tornadoes are infrequent in Europe and indeed most of the
world but they are common in the USA.
Storm movement
From basic meteorological principles, cumulonimbus clouds and thunder-
storms move in the direction of the 700mb flow (approximately the 10000ft
winds). Self-propagating storms usually generate on the forward side of the
storm. When fitted, the HOLD facility enables the storm movement to be
assessedby th.e flight crew. The procedure when, say, a storm is detected on
the 100 mile range, is to select the push/push HOLD switch while maintaining
constant heading. HOLD and Wx then appear alternately on the screen.
After a couple of minutes, select the push/push HOLD switch again. This
brings back the current display and the storm echo moves from its previously
held position to the current position so showing its movement relative to the
aircraft.
Operating on mapping
Cosecant beam is used for short range mapping (up to 70nm). To obtain
optimum ranges use pencil beam for reasons given earlier. Give the aerial a
large downward tilt initially and then reduce the tilt angle very slowly,

8/10/2019 Gsp Vol i Radio Aids
http://slidepdf.com/reader/full/gsp-vol-i-radio-aids 154/232
}66
Radio Aids
keeping a watch on the changing coverage. When no further forward coverage
is observed, you have the right tilt for maximum ranges.
Operating in conjunction with RNA V systems
The capacity of the modern EFIS computers can also be used in conjunction
with A WR displays. The output from the navigation management system can
be superimposed on the colour display as the track between waypoints, as a
pale blue line on the multi-function display.
Calculating approximate height of the cloud
This is done by tilting the beam upward or downward as necessary until the
cloud just disappears from the screen. At this time, the base of the cone is
directly on top of the cloud. This gives the angular measure of the cloud
height above or below the aircraft's level. We also know the range of the
cloud. Thus, we have sufficient information to apply the 1 in 60 rule to
calculate the height above/below the aircraft level (Fig. 13.8).
For example, it is required to estimate the height of the top of an active
cloud, 30nm range.
The first step is to tilt the aerial (Fig. 13.8) until the cloud top just
disappears. Say, at this time the tilt angle is 3 0. This 3io defines the centre
line of the beam. Therefore, assuming 5° beam width, the base of the
beam is 1° above the aircraft's horizontal plane. Now the data are put on
computer as follows:
ht x 60
--
30
1° =
x 30
60
ht = ::-
.e
= nm or 3040 t
This is the height above the aircraft height. Alternatively, the makers
provide pre-computed graphs from which the height is read off against tilt
angle.
A rough estimate of the height may be made mentally from the
formula: relative height = 100 x range in nm x elevation in degrees. In
our illustration it is 100 x 30 x 1 = 3000 t.
Height ring
With conical radiation there is an overspill of radiation vertically downwards
(Fig. 13.8). This is reflected back to the aircraft and the echo appears like a
ring. This ring indicates the aircraft's height and therefore it is called the

8/10/2019 Gsp Vol i Radio Aids
http://slidepdf.com/reader/full/gsp-vol-i-radio-aids 155/232
Airborne Weather Radar
167
Fig. 13.8 Finding cloud height using 1 in 60 rule
height ring. The presence of the height ring indicates that the equipment is
serviceable. Its absence normally means that the receiver requires retuning. It
may be possible to retune the receiver in flight -follow the manufacturer's
drill and if the height ring is still not visible, the equipment may be considered
unserviceable. It should, however, be remembered that there are few re-
flections when flying over calm water or fine sand particularly when flying
above 30000ft. Also, as 4.93nm equals 30000ft, if you are flying at that
height, the height ring may merge with the 5 nm range marker. To ensure its
presence, turn the marker brilliance down. Finally, it is also possible to see a
second height ring, at twice the aircraft height. If it is present, it will be faint
because it is due to double reflections.
Other uses of A WR
The equipment may be used to ensure a safe terrain clearance over high
ground. By tilting the aerial slightly downward, keep a watch as the high
ground gets closer. If it does not disappear from the picture at a reasonable
range, a climb must be initiated immediately.
Test questions
(1) How does the use of the iso-echo function on an airborne weather
radar enable a pilot to detect areas of severe turbulence?
(2) What are the main factors which determine the most suitable wave-
length to be used in airborne weather radar? Say why.
(3) Using A WR, the conical beam should be used for map painting in
preference to the fan-shaped beam when:
(a) there are thunderstorms in the vicinity
(b) maximum range is required to be scanned
(c) approaching a coastline.
(4) A WR equipment operation on the ground is:
(a) totally prohibited
(b) unrestrictedly permitted in aerodrome maintenance areas
(c) only permitted with certain precautions, to safeguard the health
of personnel and to protect equipment.

8/10/2019 Gsp Vol i Radio Aids
http://slidepdf.com/reader/full/gsp-vol-i-radio-aids 156/232
168 Radio Aids
(5) A WR operates in the SHF band because:
(a) large water droplets, hailstones, etc., give good reflections at a
3 cm wavelength, while small droplets of fog, mist, or stratus do
not
(b) it enables equipment to be powerful but light enough to be
installed in the aircraft nosecone
(c) it enables a narrow width beam to be used to obtain the required
degree of definition.
(6) The main purpose of selecting HOLD on an A WR is:
(a) the storm movement can be assessed
(b) the storm potential development can be assessed
(c) the storm's potential rate of decay can be assessed.
(7) Hail associated with thunderstorms will often be shown on an A WR as:
(a) an extremely straight edge to the echo
(b) a finger extending out from the echo
(c) a distinct concave edge to the echo.
(8) On an A WR the heaviest precipitation is shown by:
(a) green echoes (b) yellowechoes (c) red echoes.
(9) The principle of weather radar is that turbulence is always greatest
where:
(a) there is the strongest contour gradient
(b) hail and the largest size raindrops are detected
(c) lightning is most frequent.
(10) To measure the movement of a thunderstorm when using an A WR,
select:
(a) the MOTION switch (b) the HOLD switch (c) the TRACK
switch.
8/10/2019 Gsp Vol i Radio Aids
http://slidepdf.com/reader/full/gsp-vol-i-radio-aids 157/232
FM altimeters
Radio altimeters are designed to give indication of actual height above the
surface. Those operating on the principle of PM are mostly used for low level
flying where a high degree of accuracy is required. They are otherwise
unsuitable for level flight since they indicate the contour of the ground below
instead of a constant level. When installed, however, they may be used to
check the accuracy of a pressure altimeter if the elevation of the ground
below is known. In the past much use was made of them in flying 'pressure
pattern'. In the latest development, they can be used to feed 'height' infor-
mation to an automatic landing system.
Principle
The principle of FM is utilised to measure time (and thereby, height) taken
by a radio wave to travel to the surface directly beneath, and to return. They
operate in the band 4200 to 4400 MHz.
The aircraft transmits radio signals vertically downward. The transmission
frequency, however, is not constant but it is varied progressively and at a
known rate from its start frequency to 'start + 60' MHz, and then back to the
start frequency. This constitutes one complete cycle of modulation.
Some of these transmitted signals will be reflected and return to the
aircraft. The frequency of these returning signals, however, will be different
from the frequency actually being transmitted at that instant. Further, the
higher the aircraft, the greater the difference between the two. Since the rate
of change of frequency is fixed this difference must be proportional to the
time taken, that is, the height of the aircraft, as the speed of the radio
propagation is known.
Difference in frequency = rate of change of frequency x time taken
This frequency difference is measured and the time obtained is registered on
the indicator as height.
Equipment
Transmitter/receiver. These generally work in conjunction with separate
transmitter/receiver aerials.

8/10/2019 Gsp Vol i Radio Aids
http://slidepdf.com/reader/full/gsp-vol-i-radio-aids 158/232
170
Radio Aids
Indicator. Several different types of indicators are available. One of them,
shown in Fig. 14.1, has a pointer on the face of the dial calibrated in
hundreds of feet. Thousands of feet indication is given on a counter in the
window at the 6 o'clock position. The instrument shown reads 1360 t.
Fig. 14.1 Simple radio altimeter dial.
The indication is not limited to one single indicator in one position. As
many repeater indicators as necessary may be installed to cater for various
crew positions.
Although most indicators have a pointer and dial calibrated on a linear
scale, many displays have a special arrangement for the scale at the lowest
altitudes. For example, from O to 500 ft may be shown on an expanded scale
Fig. 14.2. Other displays have not only an expanded scale to 500ft, but also a

8/10/2019 Gsp Vol i Radio Aids
http://slidepdf.com/reader/full/gsp-vol-i-radio-aids 159/232
Radio Altimeters
171
RADIO ALTITUDE
COMPARATOR
Fig. 14.3
logarithmic scale from 500 to 2500 t. Digital displays are available, while with
an EFIS (volume 3), a comparative display of radio altitude and decision
height are shown on the EArn (Fig. 14.3).
Decision height indicator
Many indicators are equipped with a DH selection/control knob (see Fig.
14.2). The DH control knob may incorporate a press-to-test facility. Either
pre-flight or in-flight, the DH knob is used to position the DH bug at the
required DH setting. When the aircraft descends below the set decision
height, the DH lamp comes on, and in some systems an audio tone is also
produced.
Uses
Mainly when flying at low level. Most instruments cater for height up to 2000
or 2500ft and are compatible with GPWS (Chapter 15).
Accuracy
Fixed e"or. This error arises in the method of transforming frequency
difference into height and feeding the current to the indicator. The indicator
pointer moves in steps of 5 ft, which means an error up to 2 ft may be
present any time. Overall accuracy is of the order of 5 ft ::t 3% of the
indicated height.
In some installations, the radio altimeter may indicate less than zero altitude
when the aircraft is parked on the ramp. This is because the altimeter reads

8/10/2019 Gsp Vol i Radio Aids
http://slidepdf.com/reader/full/gsp-vol-i-radio-aids 160/232
172
Radio Aids
zero ft on the point of touchdown and where the antenna is nearer the
ground when parked.
Pulse modulation altimeters
These altimeters operate in the frequency band of 1600MHz. Originally
height was indicated by a blip on a circular time base, and was read off in
terms of its distance from the start of the time base which also appears as a
blip. On current equipments the flight-deck display is of the pointer and dial
type already described for the frequency modulation altimeter (Fig. 14.2).
Principle
The principle utilised is the echo. The time taken by a radio pulse to travel
out and back is the direct measure of the distance (height in this case) on the
assumption that the speed of the radio wave is constant. This assumption is
not an unfair one, since the speed of a radio wave is known to a considerable
degree of accuracy. The timing, of course, must be done electronically by the
process of leading edge tracking.
The master circuit instructs the transmitter to transmit, and at the same
instant, starts the timing process. The transmission takes place vertically
downward in the form of a series of pulses in a wide conical beam from the
antenna. Signals reflected from the ground underneath will be picked up by
the receiver aerial, provided that the aircraft is not banking excessively
(usually of the order of 400).
Limitations
The maximum range of modem equipments (Fig. 14.2) depends upon the
surface reflectivity. The best surface reflector is water, whilst the worst is
dry , fine, loose soil. Hard-packed earth gives better reflection than snow.
Nevertheless the manufacturers claim that the height is measured from the
top of the snow cover. Such indicators may have a loss of lock due to lack of
reflectivity at altitude (say 2000 to 2500 t) , either due to a steep bank
or to the nature of the terrain beneath the aircraft. Under the impetus
of developments required for military purposes, there has been a steady
improvement in the accuracy of radio/radar altimeters. Most have a capability
of reading down to 20 ft and an accuracy of :: :2 t or 2% up to 500 ft.
Advantages of radio/radar altimeters
The radio/radar altimeter has the following advantages:
(1) It gives actual height above the ground -a very useful piece of infor-
mation when flying low level.
(2) It provides a cross check capability with the pressure altimeter for
terrain clearance purposes.
(3) Models working in the SHF frequency band of 4200-4400 MHz produce

8/10/2019 Gsp Vol i Radio Aids
http://slidepdf.com/reader/full/gsp-vol-i-radio-aids 161/232
Radio Altimeters 173
very high accuracy (2ft or 2% from 500ft to touchdown). Developed for
operation with categories 2 and 3 ILS, they provide a tie-in with flight
director/autopilot to initiate initial flare during approach and landing.
(4) A warning signal at DH is usually given. As will be described in chapter
15, some models of GPWS provide a warning MINIMUMS when the
aircraft descends through the DH setting that has been made by the
pilot.
Test questions
(1) Radio altimeters operate in the:
(a) VHF band (b) SHF band (c) VLF band.
(2) Radio altimeters operate up to:
(a) 2500ft (b) 1500ft (c) 500ft.
(3) The mean frequency on which radio altimeters operate is:
(a) 4200MHz (b) 4300MHz (c) 4400MHz.
(4) A DH setting knob and 'DH set' indicator:
(a) can only be integrated in a radio altimeter if it is part of an EFIS
(b) is usually incorporated in modem radio altimeters
( c has to be a separate installation to the radio altimeter itself.
(5) The formula used to determine the height displayed on the radio
altimeter is that the difference in frequency equals the rate of change of
frequency:
(a) times half the time taken
(b) times the time taken
(c) times twice the time taken.

8/10/2019 Gsp Vol i Radio Aids
http://slidepdf.com/reader/full/gsp-vol-i-radio-aids 162/232
This highly desirable piece of flight-deck equipment came into general use in
the 1970s with the development of microprocessors and sophisticated voice
synthesisers. It has been estimated from the GPWS statistics that possibly as
many as 60 accidents have been averted in the first decade of its installation.
Mandatory carriage of ground proximity warning systems has been introduced
in many countries. In the UK the CAA has published CAP 516 Guidance
materialon GPWS.
The purpose of the system is to give visual and audible warning signals
to the pilot when the aircraft is entering a potentially dangerous ground
proximity situation. Such situations as inadvertent sinking after take-off,
inadequate terrain clearance, excessive rate of terrain closure, and dropping
below the couect glidepath when using ILS, would all activate the GPWS to
alert the pilot to the potential danger. It is a system to enhance safety and not
a foolproof means of preventing collision with the ground.
Terminology
Alert:
a caution generated by the GPWS equipment
Warning: a command generated by the GPWS equipment,
variously described as genuine, nuisance or false.
Genuine warning .
specifications .
one generated by GPWS in accordance with its technical
Nuisance warning: one generated by the GPWS in accordance with its
technical specifications but the pilot is actually flying an accepted safe
procedure.
False warning: one generated by the GPWS not in accordance with its
technical specifications due to a fault or failure in the system.
The term 'unwanted' may be used to describe both nuisance and false

8/10/2019 Gsp Vol i Radio Aids
http://slidepdf.com/reader/full/gsp-vol-i-radio-aids 163/232
Ground Proximity Warning System
175
warnings. The limits of protection provided by the aircraft's GPWS and other
relevant details are included in the Operations Manual, Training Manual and
checklists.
Equipment
Input. The basic equipment comprises a small digital computer or central
processing unit (CPU) which accepts inputs from:
.the radio altimeter with failure signal
.vertical speed sensor or a barometric altitude rate computer with failure
signal
.the ILS glide path receiver
.switch activated when the landing gear is down or is selected down
.switch activated by any crew selection uniquely associated with final
approach to landing (usually flaps selection to, or are in, the landing
position).
Output. If, after assessment, a potential danger of colliding with terrain is
found to exist, the CPU will put out warning signals to the pilot in both visual
and audible forms. The CPU will also put out indications of computer failure
and any failures which may occur in the five input signals, to a monitor
indicator. A block schematic diagram of how the system works is shown in
Fig. 15.1.
Inputs
Outputs
Fig.15.
Elements of Ground proximity warning system
Integrity testing. GPWS should be serviceable at take-off and the Operations
Manual should detail the pre-flight checks verifying that the system is func-
tioning correctly. Minimum equipment or allowable deficiencies lists should
indicate when flights can be made with an unserviceable GPWS although
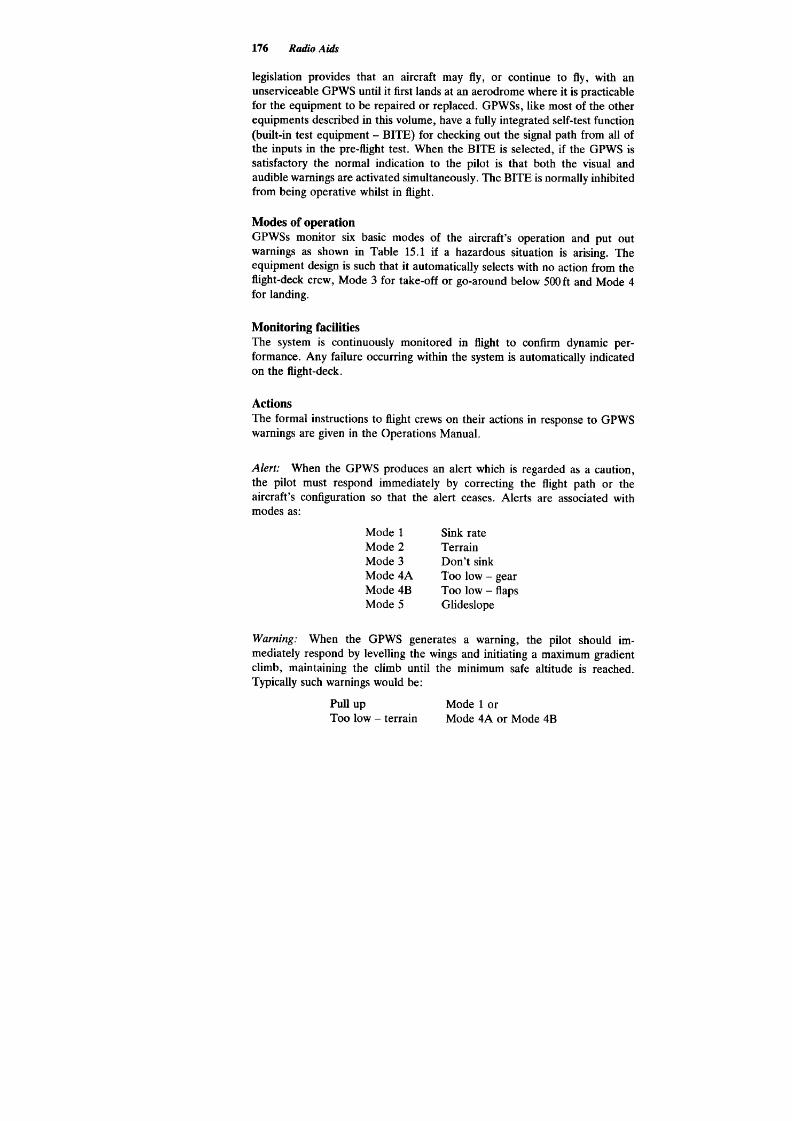
8/10/2019 Gsp Vol i Radio Aids
http://slidepdf.com/reader/full/gsp-vol-i-radio-aids 164/232
176
Radio Aids
legislation provides that an aircraft may fly, or continue to fly, with an
unserviceable GPWS until it first lands at an aerodrome where it is practicable
for the equipment to be repaired or replaced. GPWSs, like most of the other
equipments described in this volume, have a fully integrated self-test function
(built-in test equipment -BITE) for checking out the signal path from all of
the inputs in the pre-flight test. When the BITE is selected, if the GPWS is
satisfactory the normal indication to the pilot is that both the visual and
audible warnings are activated simultaneously. The BITE is normally inhibited
from being operative whilst in flight.
Modes of operation
GPWSs monitor six basic modes of the aircraft's operation and put out
warnings as shown in Table 15.1 if a hazardous situation is arising. The
equipment design is such that it automatically selects with no action from the
flight-deck crew, Mode 3 for take-off or go-around below 500ft and Mode 4
for landing.
Monitoring facilities
The system is continuously monitored in flight to confirm dynamic per-
formance. Any failure occurring within the system is automatically indicated
on the flight-deck.
Actions
The formal instructions to flight crews on their actions in response to GPWS
warnings are given in the Operations Manual.
Alert: When the GPWS produces an alert which is regarded as a caution,
the pilot must respond immediately by correcting the flight path or the
aircraft's configuration so that the alert ceases. Alerts are associated with
modes as:
Mode 1
Mode 2
Mode 3
Mode 4A
Mode 4B
Mode 5
Sink rate
Terrain
Don't sink
Too low -gear
Too low -flaps
Glideslope
Warning: When the GPWS generates a warning, the pilot should im-
mediately respond by levelling the wings and initiating a maximum gradient
climb, maintaining the climb until the minimum safe altitude is reached.
Typically such warnings would be:
Pull up Mode lor
Too low -terrain Mode 4A or Mode 4B

8/10/2019 Gsp Vol i Radio Aids
http://slidepdf.com/reader/full/gsp-vol-i-radio-aids 165/232
...
~
~
o
<
0
~
=
)
=
'
a
~
'
8
~
'
E
~
~
~
q
N
~
)
~
~
~
n
=
O
1
I
-
=
~
-
I
~
~0
n
~
<
~
0
8
~
n
~
~
J
~~
I
~
~
J
~
0
~
,
~
.
~
O
"
"
O
~
b
)
~
~
~
~
,
"
.
"
~
.
~
-
t
.
0
Q
~
.
=
:
°
°
e
0
.
a
O
~
~
O
"
'
-
'
-
,
.
Q
Q
~
~
~
.
Q
e
~
"
0
"
9
"
~
.
=
"
.
~
~
"
~
~
;
.
~
°
O
~
"
.
~
0
t
,
~
Q
.
J
Q
.
J
~
u
~
,
-
"
~
~
~
"
Q
1
Q
~
0
e
Q
.
~
.
~
.
~
~
u
I
U
I
Q
~
U
"
~
~
c
~
~
'
0
"
~
9
"
~
~
e
Q
~
;
Q
"
.
O
.
O
~
.
~
'
0
~
"
"
~
~
~
u
Q
Q
"
.
~
'
0
'
O
E
'
O
O
u
u
~
e
Q
Q
O
Q
~
~
~
~
~
u
~
Q
.
~
~
.
~
~
O
O
"
"
b
)
O
e
-
~
u
.
~
~
Q
Q
Q
~
Q
b
Q
8
Q
8
Q
Q
.
c
;
>
;
>
0
;
>
Q
;
>
.
~
.
~
~
.
~
~
;
>
-
~
"
~
.
~
O
~
"
~
"
~
~
~
-
~
"
~
0
~
~
~
Q
Q
"
Q
Q
~
"
;
"
.
~
"
.
~
Q
Q
u
u
u
u
b
o
~
2
~
2
u
O
~
~
~
~
Q
~
~
~
~
5
~
z
;
J
;
J
~
b
J
O

8/10/2019 Gsp Vol i Radio Aids
http://slidepdf.com/reader/full/gsp-vol-i-radio-aids 166/232
178 Radio Aids
Fig. 15.2 Block diagram: windshear detection and recovery guidance system.
There may be an exceptional circumstance such as when on a curved
approach or on a missed approach procedure involving a turn to avoid terrain
when the requirement to level the wings would be inappropriate.
General
(1) All alerts and warnings should be responded to by pilots immediately.
However in the case of a warning in the following circumstances only, a
pilot can limit his response to that of an alert when:
(a) the aircraft is operating by day in meteorological conditions which
will enable the aircraft to remain 1 nm horizontally and 1000 t
vertically away from cloud and in a flight visibility of at least 8 km ;
and
(b) it is immediately obvious to the aircraft commander that the aircraft
is not in a dangerous situation with regard to terrain, aircraft
configuration or the present manoeuvre of the aircraft.
(2) It must be remembered that GPWS is not a forward-looking equipment.
Any warning that the aircraft is flying towards high ground will be
minimal and dependent upon the steepness of the rising ground. Hence
a sheer cliff, escarpment or mountainside will not generate any warning
at all.
(3) Unwanted warnings still occur under normal and safe operating con-
ditions such as when aircraft are carrying out standard terminal approach
procedures or radar vectoring approaches at aerodromes surrounded by
hilly terrain.
(4) The Operations Manual specifies conditions when the flight crew may
inhibit the GPWS. Typically these would cover when gear or flap position
inputs are known to be non-standard or if the aircraft is being flown

8/10/2019 Gsp Vol i Radio Aids
http://slidepdf.com/reader/full/gsp-vol-i-radio-aids 167/232
179
round Proximity Warning System
without reference to the glideslope such as when it breaks off an
approach to an ILS runway so as to land on another runway.
(5) GPWS warnings are normally reportable occurrences. GPWS alerts are
only reportable occurrences when a hazard arises or when there is
undue repetition.
Windshear detection
The serious hazards associated with low-Ievel windshear and microbursts (see
Ground Studies for Pilots volume 4) have been extensively explored in recent
years. Equipment has been developed to provide a specific windshear detec-
tion and recovery guidance system (WDGS) operating through the flight
director system.
Typically the windshear is detected from a comparison between the rate of
change of groundspeed (measured by accelerometer) and the rate of change
of airspeed (measured by pitot and static sensors). A shear adversely affecting
performance illuminates a red warning light on the panel and gives an aural
warning WINDSHEAR WINDSHEAR. The system has a WINDSHEAR
FAIL annunciator which illuminates in the event of a power loss.
The recovery guidance for an adverse effect on aircraft performance is
based on angle of attack, modified by radio altitude and pitch attitude and is
displayed via the flight director, through the pilot's attitude director indicator
(Am) or the EFIS primary flight display (PFD).
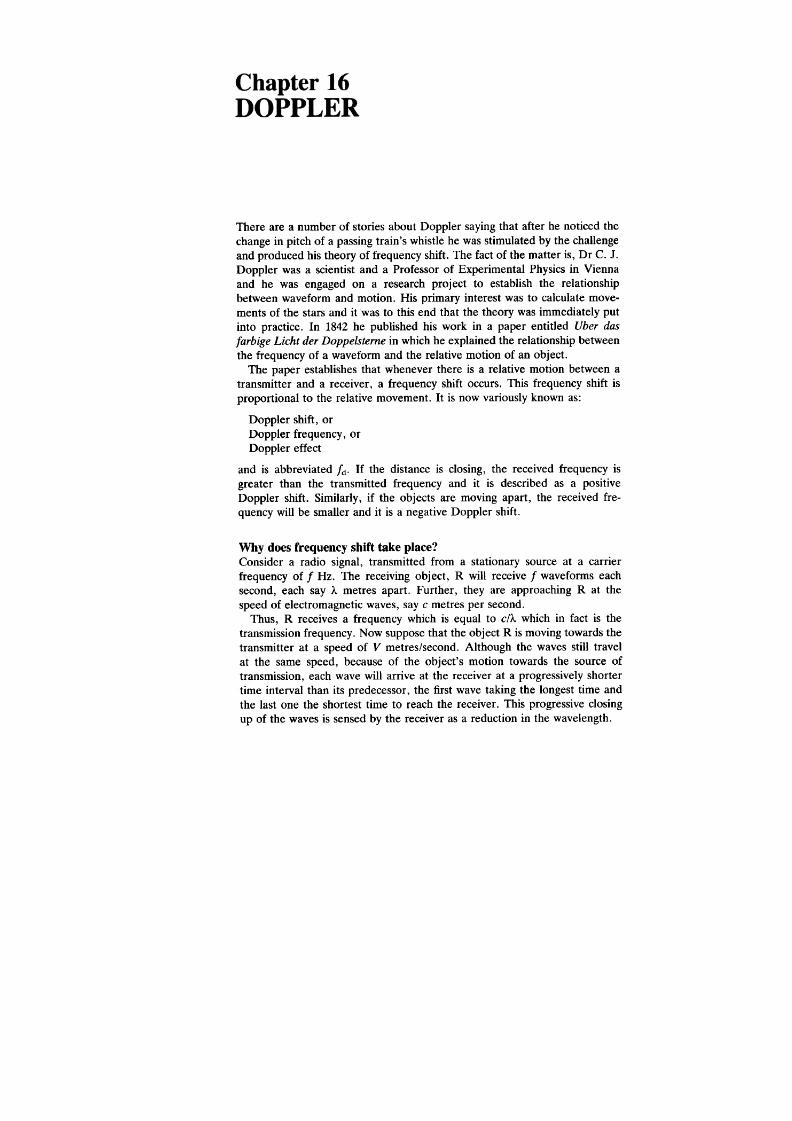
8/10/2019 Gsp Vol i Radio Aids
http://slidepdf.com/reader/full/gsp-vol-i-radio-aids 168/232
There are a number of stories about Doppler saying that after he noticed the
change in pitch of a passing train's whistle he was stimulated by the challenge
and produced his theory of frequency shift. The fact of the matter is, Dr C. J .
Doppler was a scientist and a Professor of Experimental Physics in Vienna
and he was engaged on a research project to establish the relationship
between waveform and motion. His primary interest was to calculate move-
ments of the stars and it was to this end that the theory was immediately put
into practice. In 1842 he published his work in a paper entitled Uber das
larbige Licht der Doppelsterne in which he explained the relationship between
the frequency of a waveform and the relative motion of an object.
The paper establishes that whenever there is a relative motion between a
transmitter and a receiver, a frequency shift occurs. This frequency shift is
proportional to the relative movement. It is now variously known as:
Doppler shift, or
Doppler frequency, or
Doppler effect
and is abbreviated Id. If the distance is closing, the received frequency is
greater than the transmitted frequency and it is described as a positive
Doppler shift. Similarly, if the objects are moving apart, the received fre-
quency will be smaller and it is a negative Doppler shift.
Why does frequency shift take place?
Consider a radio signal, transmitted from a stationary source at a carrier
frequency of f Hz. The receiving object, R will receive f waveforms each
second, each say A metres apart. Further, they are approaching R at the
speed of electromagnetic waves, say c metres per second.
Thus, R receives a frequency which is equal to c/A which in fact is the
transmission frequency. Now suppose that the object R is moving towards the
transmitter at a speed of V metres/second. Although the waves still travel
at the same speed, because of the object's motion towards the source of
transmission, each wave will arrive at the receiver at a progressively shorter
time interval than its predecessor, the first wave taking the longest time and
the last one the shortest time to reach the receiver. This progressive closing
up of the waves is sensed by the receiver as a reduction in the wavelength.

8/10/2019 Gsp Vol i Radio Aids
http://slidepdf.com/reader/full/gsp-vol-i-radio-aids 169/232
181
Doppler
Now, the relationship between speed of electromagnetic waves, frequency
and wavelength is expressed in the formula c = f X A (see chapter 1) where c
is constant. Therefore, if A decreases (as it does when the objects are closing)
the value of f must increase to keep the value of c constant. This frequency
shift is entirely due to the relative motion between the transmitter and the
receiver.
The transmission frequency is ciA.
The received frequency =
c+v
1..
c v
=-+-
1.. 1..
v
=1+-
1..
f being the original transmission frequency, V A is the component due to the
relative motion between the transmitter and the receiver and is the Doppler
shift, which is proportional to the ground speed of R. We express this in the
formula
(1)
v
fR =f+ i
where fR is the received frequency, Note that because
c 1 f
A. = -and -= -
f A. c
this formula may be rewritten as fR = f + Yl,
c
(2) The above formula is applicable only when the transmission is directly
ahead and the reflection occurs from a reflecting object, also directly
ahead. Although such transmission and reception would in theory give a
maximum frequency shift in, practice a pilot will not be operating with
Doppler with a solid reflecting object directly in front of him. Therefore,
Doppler equipment must beam its signals towards the earth's surface for
reflections. The formula now becomes

8/10/2019 Gsp Vol i Radio Aids
http://slidepdf.com/reader/full/gsp-vol-i-radio-aids 170/232
182
Radio Aids
fR = f + 2V cose
A
(3)
where e is the angle through which the beam is depressed
Depression angle
As pointed out above, ideally the signals should be beamed straight ahead
for maximum frequency shift. This is, however, impossible. Therefore, the
signals must be beamed downward towards the surface at an angle from the
horizontal.
The angle of depression may be kept small, for example, to achieve a good
measure of the frequency shift. However a signal striking the surface at a
shallow angle loses quite a lot of energy by way of scatter away from the
aircraft (see Fig. 16.1). If the depression angle is made too large on the other
hand, strong reflections will be obtained but the value of id, that is, 2Vi
cos 8/c becomes too small for accurate measurement. The value of cosine
decreases as the angle is increased and if the transmission was vertically
downward, the cosine of 90° is 0 and there will be no frequency shift.
Therefore, the depression angle of Doppler equipment is a compromise
between strength and frequency shift. Or, it must be an angle which would
ideally give the best of both. Most Dopplers operate between a depression
angle of 60° and 70°.
Principle of ground speed measurement
Electromagnetic waves are transmitted from an aircraft at a given depression
angle either in the form of a series of pulses (pulse radar) or continuous wave
(CW radar). On striking the surface these will be reflected. Some of these
reflected signals will be received in the aircraft receiver but the frequency of
these signals will be different from the original transmission frequency. It will
be higher if the signals are reflected from forward of the aircraft, and lower if
reflected from the rear of the aircraft. This change in the frequency is due to

8/10/2019 Gsp Vol i Radio Aids
http://slidepdf.com/reader/full/gsp-vol-i-radio-aids 171/232
Doppler
183
the Doppler shift and because it occurs due to the relative movement it
expresses the aircraft's GS. This is continuously indicated on the indicator.
The GS displayed is 'spot' GS, that is, correct only at that instant.
Doppler aerials
Single beam systems. These represent the earliest thoughts on aerial deploy-
ment with Doppler equipment and are no longer in use. A beam is trans-
mitted to the fore of the aircraft to the surface. When the reflected signals are
received and id is available, the aerial is rotated until the value of id is
maximum. The angle through which the beam is thus displaced is the measure
of drift and the id is the direct measure of the aircraft's ground speed.
Twin beam systems. These may be fixed or rotatable beams.
(1) Fixed aerials. One beam is directed forward, the other abeam of the
aircraft. The Id produced by the two beams thus disposed represents the
aircraft's speed along its heading and at right angles to it. The two
values are compounded to give drift and as.
(2) Rotating aerials. The two beams at a fixed angular distance are rotated
about the fore-and-aft axis of the aircraft until the Id produced by both
the beams is of equal value. Then the bisector of the angle between the
two beams is the aircraft's track and the ground speed is calculated from
the extension of formula 3
2Vf
Id =
case cascj>
(4)
where <I>s half angle between azimuth beams, i.e. skew angle, a known
fixed value.
Three-beam systems. Where three beams are employed, two beams are
directed to right and left forward and the third beam almost vertically down-
wards, as shown in Fig. 16.2. Printed antennae for transmission and reception
are mounted under fibreglass radomes on the underside of the fuselage. A
single transmitter is switched sequentially into each of the three beams in the
Janus configuration, the sequence being repeated approximately ten times a
second.
Modem three-beam systems have the advantages of:
.reduction of number of components
.economies of weight
.economies of cost
.greater reliability
.improved presentation of information on the flight-deck.

8/10/2019 Gsp Vol i Radio Aids
http://slidepdf.com/reader/full/gsp-vol-i-radio-aids 172/232
184
Radio Aids
,~
Hyperbolic line of constant
Doppler frequency
Angles shown are approximate
Fig. 16.2 Three-beam system
Separate versions apply to rot8ry-wing aircraft (typically for speeds up to
350 kt, altitudes up to 25000 ft) and fixed-wing aircraft (typically for speeds
up to 1000kt, altitudes up to 60000ft), the system enabling the calculation
not only of the horizontal velocity components but of the vertical velocity
components as well.
F our-beam systems
(1) Fixed aerials. Four beams are transmitted from two transmitters. One
transmitter transmits beams 1 and 3 (see Fig. 16.3) simultaneously.
Beam 1 is directed to forward port and beam 3 to rearward starboard.
Half a second later the second transmitter transmits beams 2 and 4
to forward starboard and rearward port. Beams 1 and 3 produce a
component of ground speed in direction forward port and beams 2 and 4

8/10/2019 Gsp Vol i Radio Aids
http://slidepdf.com/reader/full/gsp-vol-i-radio-aids 173/232
Doppler
185
Fig. 16.3 Switching pattern
in direction forward starboard. Since the angle between the beams is
known, drift and ground speed can be computed.
(2) Rotating aerials. This is perhaps the most popular system. The trans-
mission pattern is similar to the four-beam fixed aerial system. One
aerial sends a beam forward and to the right while the other aerial of the
pair sends the beam rearward and to the left. A few seconds later the
other pair of aerials sends forward left and rearward right. The returning
signals from each pair are mixed together to produce a Doppler beat
frequency.
When the centre line of the aerial system is along the fore-and-aft axis of
the aircraft, and there is no drift, the speed of the aircraft towards both
forward reflections is the same. The Doppler frequencies produced by each
pair will be identical.
If it has drift, the beat frequency extracted from 1 and 3 aerials and 2 and 4
aerials are explained with reference to Figs. 16.4 and 16.5.
-8
~.~
-:;--- ~~ --
~+8
Fig. 16.4 Aerials aligned fore and aft
In Fig. 16.4, suppose the aircraft is experiencing port drift and the aerial is
aligned with the fore-and-aft axis of the aircraft. The frequencies received
will be something like this: From beam 1: it is forward transmission and
the return frequency will be higher than the transmission frequency, say
+ 10 kHz. From beam 2, it will still be higher than the transmission fre-
quency, but not as high as the return from beam 1, since the aircraft is
drifting away from beam 2 to beam 1. Say, the frequency received is +8kHz.
Beam 3 will produce -10 kHz and beam 4-8 kHz. Beat note from beams 1
and 3 = + 10 -( -10) = + 20. Beat note from 2 and 4 = + 16. This difference
between the two is entirely due to the direction of the aircraft aerial and the
aircraft's track not being the same. As soon as such a difference arises

8/10/2019 Gsp Vol i Radio Aids
http://slidepdf.com/reader/full/gsp-vol-i-radio-aids 174/232
186
Radio Aids
between the two beat notes, a signal is raised which actuates a motor. The
motor turns in the direction of the track, turning the aerials with it and will
continue to turn until the difference between the two pairs of aerials is
reduced to zero. At this time the aerial is aligned with the aircraft's track
(Fig. 16.5) and the motor switches off.
Hd9
Fig. 16.5 Aerials aligned with track
The angular move of the aerial from the fore-and-aft axis of the aircraft is
the drift which is indicated on a suitable indicator. (It will be noticed in Fig.
16.5 that the aerial is aligned with the track and the Doppler spectrum is
symmetrical about the track axis. ) This is a condition for the ground speed
measurement to be correct.
Thus, drift is measured directly and the ground speed is computed from the
formula
4V
( 4vi )
d = T cos6 coslj> or, 7 cos6 coslj>
using only one pair of Janus aerials i.e. 1 and 3 (or 2 and 4).
Notice that in the above formula, 2V of formula 4 has increased to 4V. This
is because a four-beam system is being used and the responses from the front
(F) and rear (R) beams of one of these pairs are compared directly and not
with the transmitter frequency. Mathematically:
2V cos 6
A
2V cos6
A
front response: fR,F
=f+
rear response: fR,R
=1-
4V rose
A
difference fR,F -fR,R =
Note: while a lanDs four-beam system obtains ground speed by measuring the
Doppler beat frequency from a single pair (front/rear) of lanDs aerials, i.e.
utilises only two aerials, drift is obtained by comparing the beat frequencies
from both pairs of lanDs aerials, i.e. utilises all four aerials.
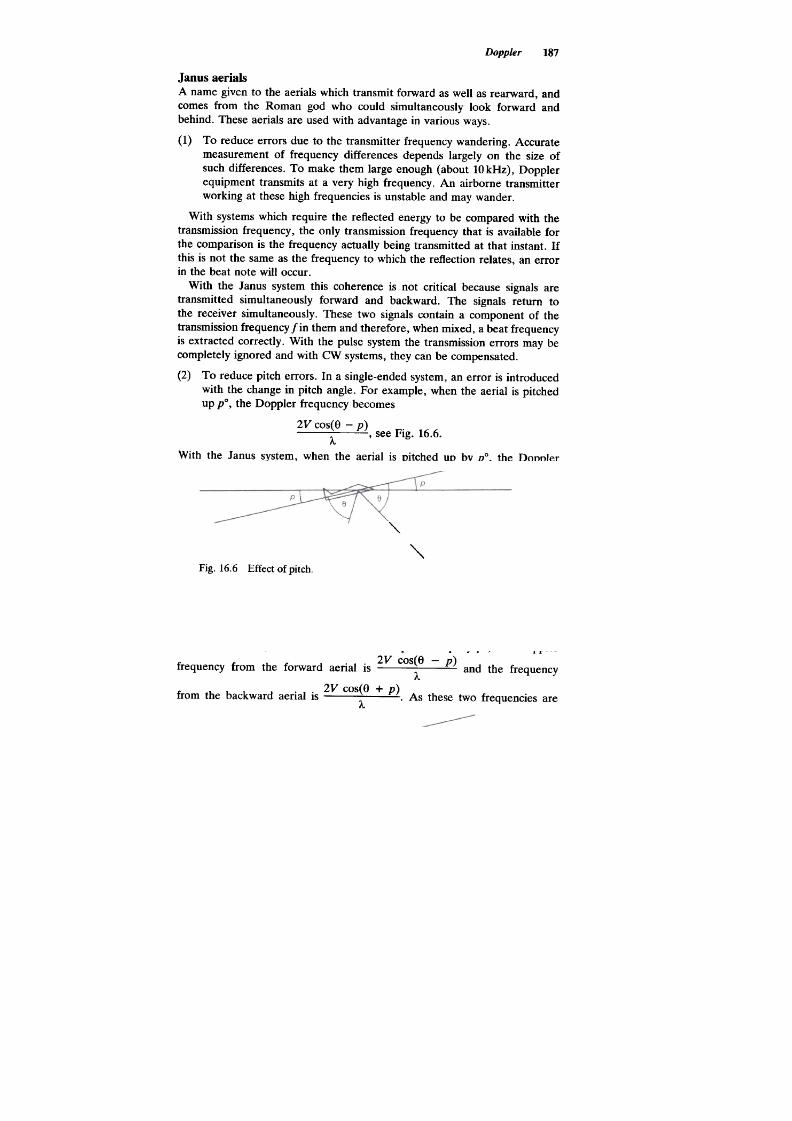
8/10/2019 Gsp Vol i Radio Aids
http://slidepdf.com/reader/full/gsp-vol-i-radio-aids 175/232
Doppler
187
Janus aerials
A name given to the aerials which transmit forward as well as rearward, and
comes from the Roman god who could simultaneously look forward and
behind. These aerials are used with advantage in various ways.
(1) To reduce errors due to the transmitter frequency wandering. Accurate
measurement of frequency differences depends largely on the size of
such differences. To make them large enough (about 10kHz), Doppler
equipment transmits at a very high frequency. An airborne transmitter
working at these high frequencies is unstable and may wander .
With systems which require the reflected energy to be compared with the
transmission frequency, the only transmission frequency that is available for
the comparison is the frequency actually being transmitted at that instant. If
this is not the same as the frequency to which the reflection relates, an error
in the beat note will occur .
With the Janus system this coherence is not critical because signals are
transmitted simultaneously forward and backward. The signals return to
the receiver simultaneously. These two signals contain a component of the
transmission frequency fin them and therefore, when mixed, a beat frequency
is extracted correctly. With the pulse system the transmission errors may be
completely ignored and with CW systems, they can be compensated.
(2) To reduce pitch errors. In a single-ended system, an error is introduced
with the change in pitch angle. For example, when the aerial is pitched
up pO, the Doppler frequency becomes
2V cos(e -p) .
A ' see Fig. 16.6.
'\.
"'
Fig. 16.6 Effect of pitch
With the Janus system, when the aerial is pitched up by pO, the Doppler
..2V cos(e -p)
frequency from the forward aenal IS and the frequency
I..
.2V cos(e + p)
from the backward aenal is .As these two frequencies are
I..
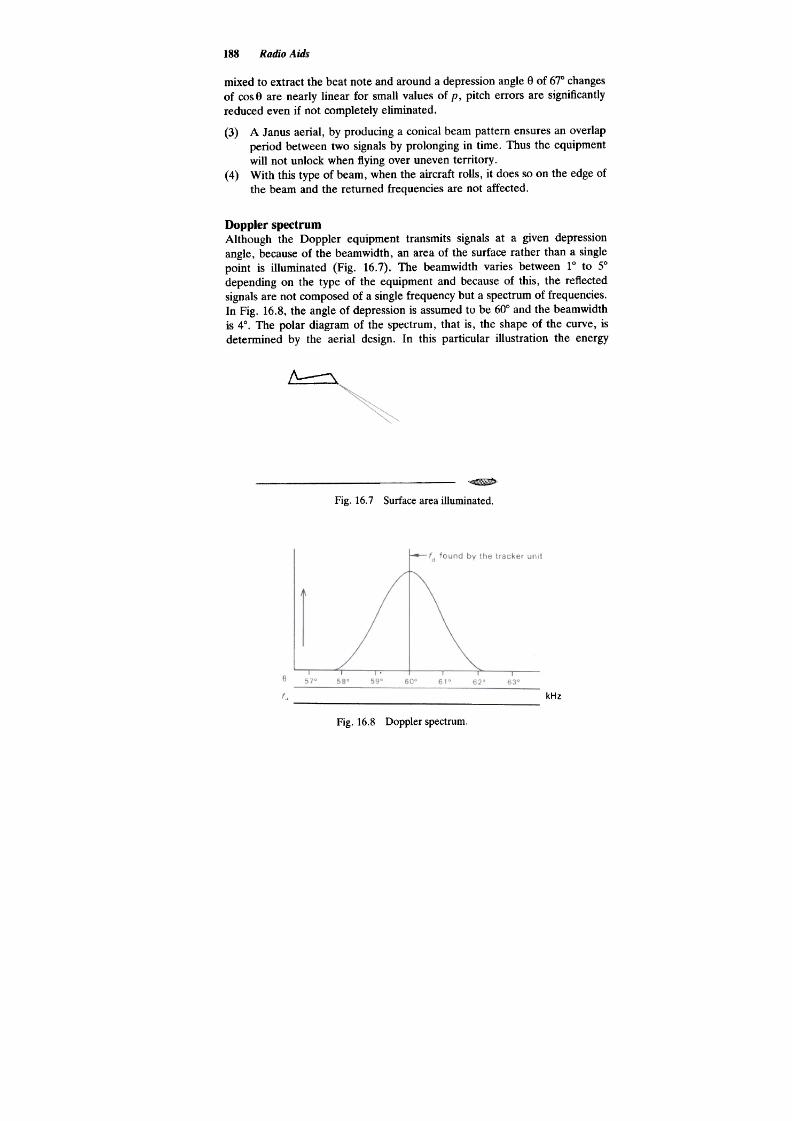
8/10/2019 Gsp Vol i Radio Aids
http://slidepdf.com/reader/full/gsp-vol-i-radio-aids 176/232
188
Radio Aids
mixed to extract the beat note and around a depression angle 8 of 67° changes
of cos 8 are nearly linear for small values of p, pitch errors are significantly
reduced even if not completely eliminated.
(3) A Janus aerial, by producing a conical beam pattern ensures an overlap
period between two signals by prolonging in time. Thus the equipment
will not unlock when flying over uneven territory .
(4) With this type of beam, when the aircraft rolls, it does so on the edge of
the beam and the returned frequencies are not affected.
Doppler spectrum
Although the Doppler equipment transmits signals at a given depression
angle, because of the beamwidth, an area of the surface rather than a single
point is illuminated (Fig. 16.7). The beamwidth varies between 1° to 5°
depending on the type of the equipment and because of this, the reflected
signals are not composed of a single frequency but a spectrum of frequencies.
In Fig. 16.8, the angle of depression is assumed to be 60° and the beamwidth
is 4°. The polar diagram of the spectrum, that is, the shape of the curve, is
determined by the aerial design. In this particular illustration the energy
~~
Fig. 16.7 Surface area illuminated.
kHz
Fig. 16.8 Doppler spectrum

8/10/2019 Gsp Vol i Radio Aids
http://slidepdf.com/reader/full/gsp-vol-i-radio-aids 177/232
Doppler
189
Airborne Doppler
Transmitter / receiver
The Doppler transmission takes place on two frequency bands: 8800 MHz
and 13500 MHz. The use of such high frequencies is necessary for two
reasons:
(1) The transmission beamwidth must be as narrow as possible in order to
give a narrow Doppler spectrum. A narrow beam can only be radiated
at micro wavelengths.
(2) The higher the frequency shift arriving at the receiver, the greater
the accuracy of the measurements and the result. Higher transmission
frequencies produce higher frequency shifts. The use of higher fre-
quencies is, however, accompanied by the inherent disadvantage of
being subject to increasing atmospheric attenuation. Therefore, the
ultimate operating frequency is decided from the consideration of the
power output available and the operational height required.
The receiver, having carried out a search for the returning signals and
having accepted them, locks on to them. It delivers the signals to the tracking
unit in the form of a Doppler beat frequency spectrum.
Tracking unit
The tracking unit accepts the frequency spectrum from the receiver and finds
the mean frequency. It uses this to measure the aircraft's ground speed. It
also controls the rotational movement of the aerial. The operation of the
tracking unit is shown in block schematic form in Fig. 16.9.
Where the aircraft is fitted with a compact navigation computer unit, this
will process the inputs from the four-beam or three-beam system within the
single unit and output the data to the indicator unit.
]ndicators
Drift and GS indicators. These indications may be either by pointer-type
indicators, digital or CRT displays or a combination of them. Indicators used
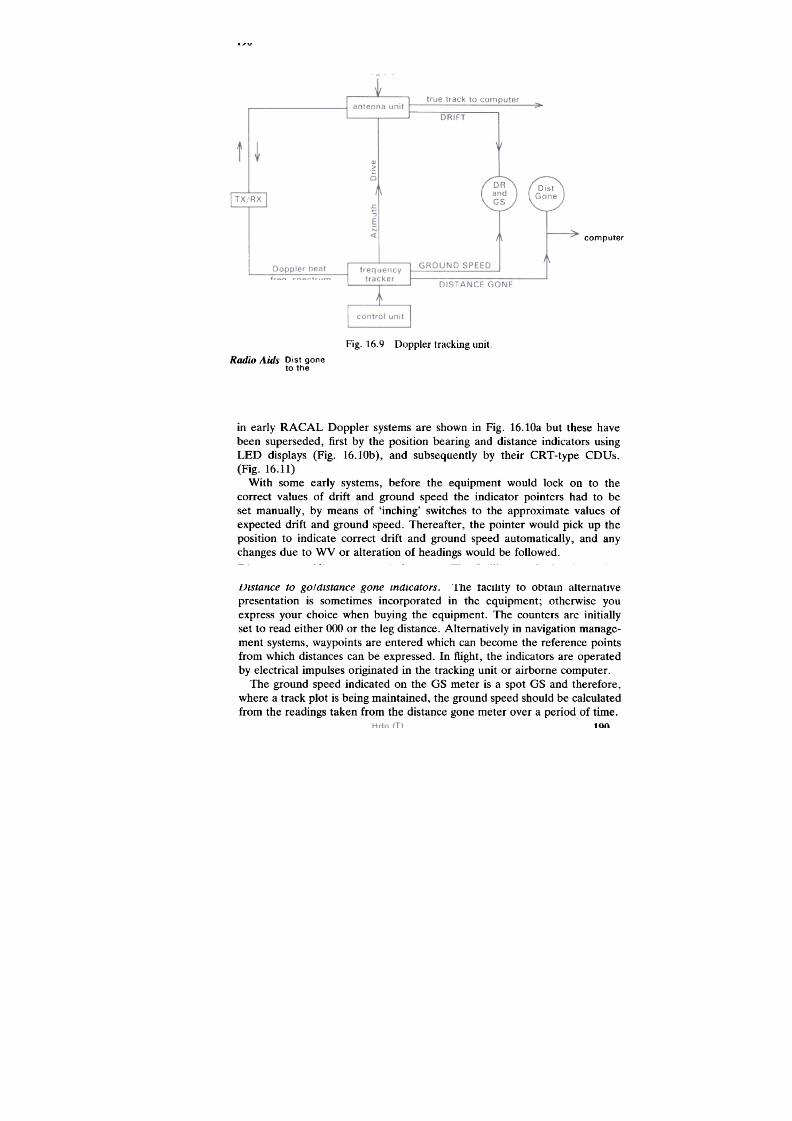
8/10/2019 Gsp Vol i Radio Aids
http://slidepdf.com/reader/full/gsp-vol-i-radio-aids 178/232
190
Radio Aids
Dist gone
to the
computer
Fig. 16.9 Doppler tracking unit.
in early RACAL Doppler systems are shown in Fig. 16.10a but these have
been superseded, first by the position bearing and distance indicators using
LED displays (Fig. 16.10b), and subsequently by their CRT-type CDOs.
(Fig. 16.11)
With some early systems, before the equipment would lock on to the
correct values of drift and ground speed the indicator pointers had to be
set manually, by means of 'inching' switches to the approximate values of
expected drift and ground speed. Thereafter, the pointer would pick up the
position to indicate correct drift and ground speed automatically, and any
changes due to WV or alteration of headings would be followed.
Distance to go/distance gone indicators. The facility to obtain alternative
presentation is sometimes incorporated in the equipment; otherwise you
express your choice when buying the equipment. The counters are initially
set to read either 000 or the leg distance. Alternatively in navigation manage-
ment systems, waypoints are entered which can become the reference points
from which distances can be expressed. In flight, the indicators are operated
by electrical impulses originated in the tracking unit or airborne computer .
The ground speed indicated on the GS meter is a spot GS and therefore,
where a track plot is being maintained, the ground speed should be calculated
from the readings taken from the distance gone meter over a period of time.

8/10/2019 Gsp Vol i Radio Aids
http://slidepdf.com/reader/full/gsp-vol-i-radio-aids 179/232
Doppler
191
f
'10 0 10
IZ2] 20 20 Drift Deg
p
@
~
(a) early indicators
G-
A: Display switch. B: Lat/long selection switch. C: Slew switches (centre-biased and used to
update data). D: Light bars to indicate EIW variation, N/S lat, EIW long, etc. E: Track error
indicator. The more bars on the right the more the heading must be altered to the right to regain
the required track. F: Warning bars (flash to draw pilot's attention) .G: Power supply test bars
(used with J) .H: Numeric displays. J: Function switch. K: Display illumination brilliance con-
trol. L: Waypoint selection switch.
(b) position bearing and distance indicator
Fig. 16.10 Doppler displays.
Memory facility
Most equipment incorporates a memory circuit which takes over when the
received signals are weak, that is, below a predetermined value and the
receiver unlocks. In these circumstances, the drift and ground speed pointers
remain locked to the last strongly measured signals. When strong signals
are received again the pointers are released. If drift and ground speed
information is being used to give position indications, the resultant position

8/10/2019 Gsp Vol i Radio Aids
http://slidepdf.com/reader/full/gsp-vol-i-radio-aids 180/232
192
Radio Aids
Fig. 16.11 Navigation computer presentation of Doppler position ground speed and
drift .
information is only as accurate as the 'frozen' drift and GS shown on the
meters. Under these circumstances the position information is only equivalent
to the dead reckoning (DR) plot and when the strong signals return, it must
be updated if you have been running it on memory for a long time or
substantial changes in the WV are suspected.
Doppler limitations
As mentioned above, Doppler will unlock when the signals being received
are weak. It will also unlock and go to memory mode in the following
circumstances
(1) When flying over calm sea. Calm sea reflections are not sufficiently
scattered to give strong echoes back. It needs at least a 5 kt wind to
produce sufficient sea surface irregularities for satisfactory operation.
(2) Atmospheric conditions .The receiver will unlock if severe thunder-
storms are present around the aircraft. The outgoing signals will be
reflected by the water drops and admit radio noise whereas the reflected
signals will be weakened due to attenutaion.
(3) When flying very low. The Doppler receiver is short-circuited when
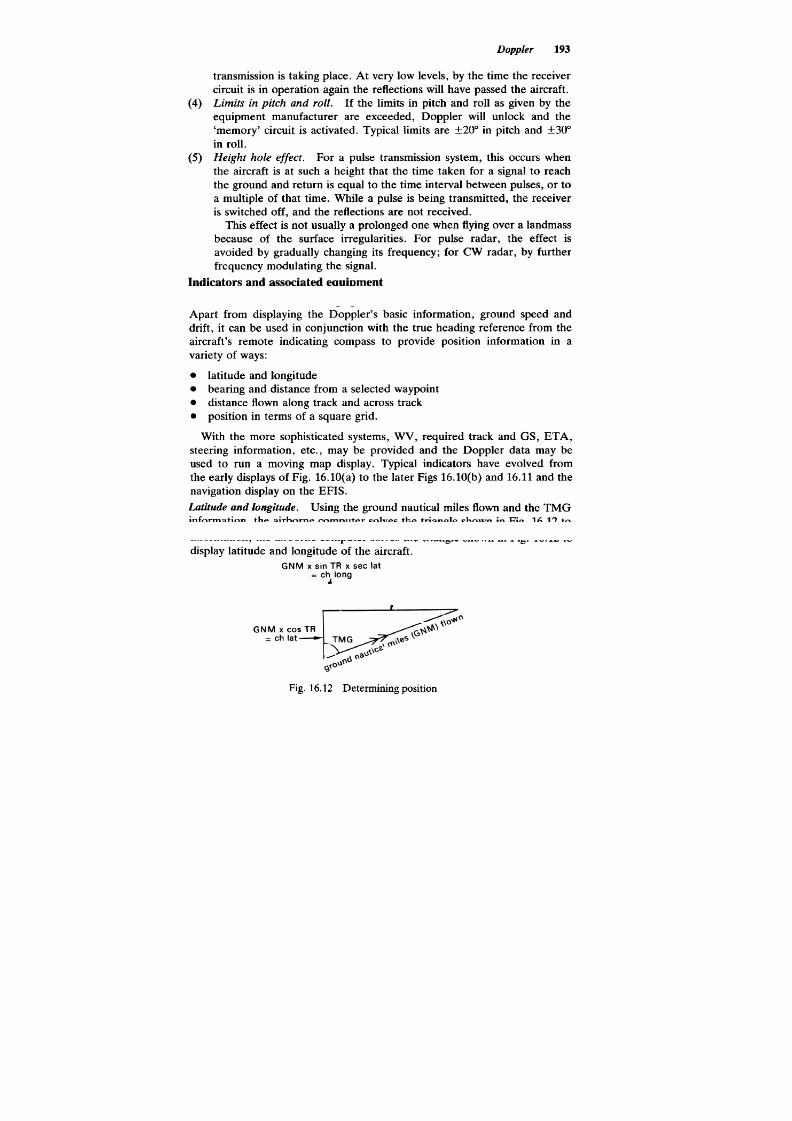
8/10/2019 Gsp Vol i Radio Aids
http://slidepdf.com/reader/full/gsp-vol-i-radio-aids 181/232
Doppler
193
transmission is taking place. At very low levels, by the time the receiver
circuit is in operation again the reflections will have passed the aircraft.
(4) Limits in pitch and Toll. If the limits in pitch and roll as given by the
equipment manufacturer are exceeded, Doppler will unlock and the
'memory' circuit is activated. Typical limits are ::t20° in pitch and ::t30°
in roll.
(5) Height hole effect. For a pulse transmission system, this occurs when
the aircraft is at such a height that the time taken for a signal to reach
the ground and return is equal to the time interval between pulses, or to
a multiple of that time. While a pulse is being transmitted, the receiver
is switched off, and the reflections are not received.
This effect is not usually a prolonged one when flying over a landmass
because of the surface irregularities. For pulse radar, the effect is
avoided by gradually changing its frequency; for CW radar, by further
frequency modulating the signal.
Indicators and associated equipment
Apart from displaying the Doppler's basic information, ground speed and
drift, it can be used in conjunction with the true heading reference from the
aircraft's remote indicating compass to provide position information in a
variety of ways:
.latitude and longitude
.bearing and distance from a selected waypoint
.distance flown along track and across track
.position in terms of a square grid.
With the more sophisticated systems, WV, required track and GS, ETA,
steering information, etc. , may be provided and the Doppler data may be
used to run a moving map display. Typical indicators have evolved from
the early displays of Fig. 16.10(a) to the later Figs 16. 10(b) and 16.11 and the
navigation display on the EFIS.
Latitude and longitude. Using the ground nautical miles flown and the TMG
information, the airborne computer solves the triangle shown in Fig. 16.12 to
display latitude and longitude of the aircraft.
GNM x sin TR x sec lat
= ch long
GNM x CQS TR
= ch lat
Fig. 16.12 Determining position
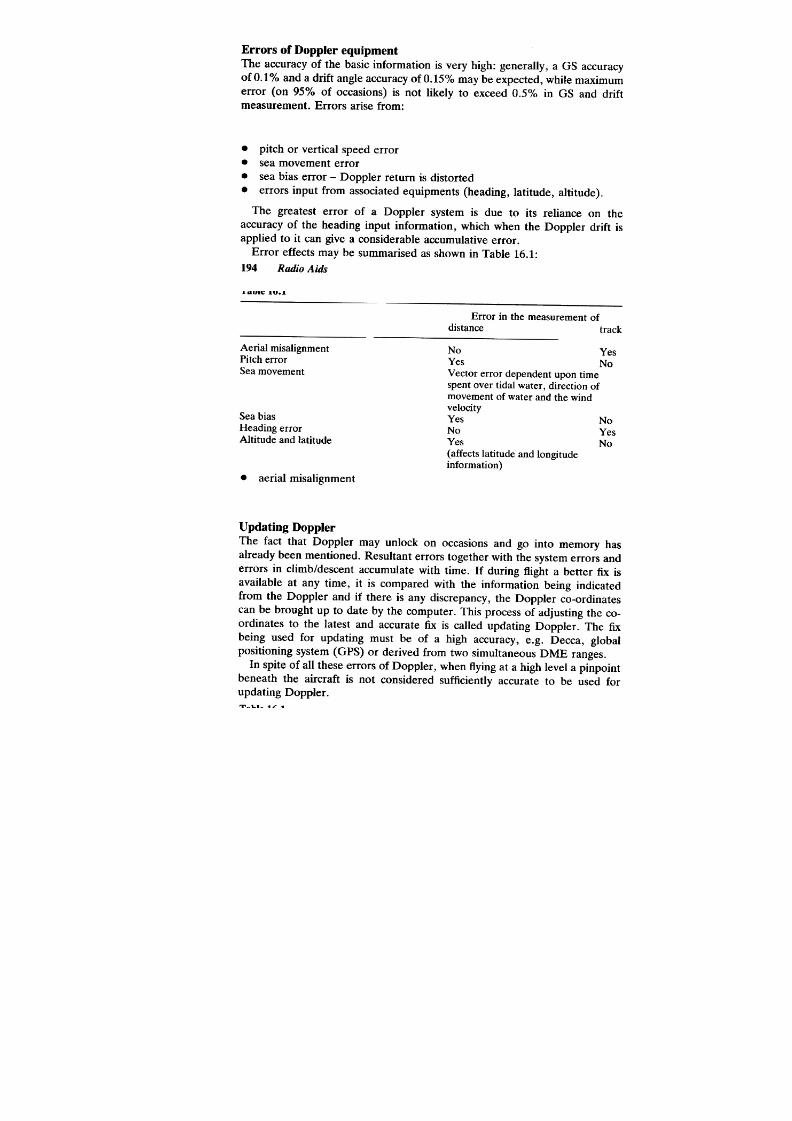
8/10/2019 Gsp Vol i Radio Aids
http://slidepdf.com/reader/full/gsp-vol-i-radio-aids 182/232
8/10/2019 Gsp Vol i Radio Aids
http://slidepdf.com/reader/full/gsp-vol-i-radio-aids 183/232
Doppler
195
Advantages of Doppler
.It is an independent aid
.It has no range limitations
.It can be used world-wide
.It is of high accuracy
.It has area navigation capability
Other aviation uses of the Doppler principle
(1) DopplerDF. If a ground station's vertical aerial receiving an aircraft's
transmission is moved rapidly, this will also produce a Doppler effect. If
the aerial is moved towards the aircraft there is a rise in frequency and if
it is moved away from the aircraft, there is a received frequency fall.
If the DF station aerial is mounted on a long radial arm and the aerial
is moved around a circular path, the frequency of the incoming signal at
an aircraft will vary sinusoidally. For a constant rate of aerial travel, the
incoming signal will be frequency modulated (at the frequency of the aerial
rotation) and the phase dependent on the aircraft's bearing from the ground
DF station. The phase can be measured against a fixed reference signal.
Unfortunately however, the radial arm on which the DF station aerial would
have to be mounted would in practice have to be some 5 m in length and
rotating around its hub at up to 20 times per second, which is not particularly
practical Nevertheless, the same rotating aerial effect can be produced by an
alternative means. This is by using a ring of vertical static aerials from which
the received frequency is sampled in turn, getting the same result as would be
obtained by the moving aerial. The phase comparison is then made and the
direction of the incoming Doppler-affected signal displayed (to an accuracy of
:tl°) on a CRT, LCD or mechanical meter.
(2) Doppler VOR. Although already described in general terms in chapter
6, it is appropriate to refer here to the Doppler principle involved. In
fact the procedure employed is very similar to that just described under
Doppler DF except that in this case it is the ground transmitter aerial
which is moving instead of the ground receiver aerial.
The central DVOR aerial generates an omnidirectional signal amplitude-
modulated at 30Hz. The circular pattern of DVOR aerials is energised in
turn 30 times a second, with a separate continuous wave transmission 9960 Hz
displaced from that energising the central aerial, by means of either a solid
state switching device or by a commutator, to simulate the rotation of a single
aerial. When the antenna appears to move towards the aircraft the frequency
increases and as it appears to move away the frequency decreases. The
combination of a circle of a diameter of 44 ft and a rotational speed of 30
revolutions per second gives a radial velocity of about 4150ft/sec. This in
turn will cause a maximum Doppler shift of 480 Hz which matches the

8/10/2019 Gsp Vol i Radio Aids
http://slidepdf.com/reader/full/gsp-vol-i-radio-aids 184/232
196
Radio Aids
VOR requirements. The 9960 Hz frequency difference is therefore varied by
: :480 Hz at 30 Hz rate with the phase dependent upon the bearing of the
aircraft. The aircraft receiver is therefore receiving from the DVOR the same
information as from a conventional VOR.

8/10/2019 Gsp Vol i Radio Aids
http://slidepdf.com/reader/full/gsp-vol-i-radio-aids 185/232
Principle of hyperbolic aids
Hyperbolic navigation aids have been available to aviators for over 50 years,
from the days of the Gee radar chains used by the RAF in the Second World
War. A hyperbola is defined as the locus of a point having a fixed difference
in range from two other fixed points. In the earlier types of navigation aids,
hyperbolae were pre-printed on special charts for that aid and position lines
obtained from the aid were plotted by interpolation between the hyperbolae.
Nowadays our flight-deck equipment enables simultaneous position lines to
be obtained, the fix determined and the position displayed on the pilot's
instrument panel without recourse to the hyperbolic chart at all. Irrespective
of the type of radio navigation aid, consider the principle illustrated in Fig.
17.1. Here M and S are the two fixed points, representing in this case a
master station and slave station.
Fig. 17.1 Perpendicular bisector/hyperbola.
Join M-S by a straight line. The straight line thus drawn is called the base
line between the two fixed points. BAC is the perpendicular bisector of MS.
Point A is halfway between M and S and, say, the distances A-M and
A-S are Snm respectively. The difference between the two ranges = S -S =
0.
Point B is 8nm from M. Therefore, it must be 8nm from S, BAC being the
perpendicular bisector of MS. Differential range equal to 8 -8 or 0.
If point C is 'n' nm from both M and S, its differential range is also 0.
Draw up a smooth curve (it will be a straight line in this case) BAC which

8/10/2019 Gsp Vol i Radio Aids
http://slidepdf.com/reader/full/gsp-vol-i-radio-aids 186/232
198
Radio Aids
is a hyperbola. The curve BAC may be extended in both directions and any
point on that curve will yield zero differential.
Curve BAC would not be the only hyperbola between M and S. Any
number of hyperbolae may be constructed to cover the area. Take point P, a
distance of 7nm from M and 3nm from S, along the base line (Fig. 17.2).
s
Fig. 17.2 Hyperbola QPR of d = 4.
Point Q is 8 nm from M and 4 from S, giving a differential range of 4.
Point P is 7 nm from M and 3 from S, differential range 4.
Point R is 9 nm from M and 5 from S, differential range 4.
Curve QPR is a hyperbola of differential range of 4nm.
To utilise the system we want equipment in the aircraft which measures
the differential ranges. Then, once we know that the differential is 4, for
example, we know that we are on curve QPR, a position line. But to
plot ourselves on that curve we also need printed hyperbolic charts. Such
charts are available for use in conjunction with Loran or any other existing
hyperbolic system.
As for the information, it is not necessarily needed in terms of nautical
miles as in the above illustrations. It may well be in terms of phases of
the signal received in the aerial (Omega and Decca) or in the time in
microseconds (~s) that the radio wave took to travel to the aircraft (Loran).
In either case, the principle still remains the same, that of differential range.
For example, if the information is in terms of time, at point R, signal from M

8/10/2019 Gsp Vol i Radio Aids
http://slidepdf.com/reader/full/gsp-vol-i-radio-aids 187/232
Loran-C 199
will take 55.62J.ls (6.18J.1S 1nm) and the signal from S will take 30.9J.1So
arrive at the aircraft. The differential of 24.72 J.lSwill be labelled against the
hyperbola QPR instead of 4nm as in Fig. 17.2.
However, as has already been mentioned, we have moved on from the
days when position lines were first plotted on hyperbolic lattice charts on the
flight-deck then to be plotted as a fix on a Mercator Chart and compared to
the airplot to navigate our aeroplanes. Modem technology has relieved us of
this chore and pilots now enjoy a continuous display of position derived from
the hyperbolic aid, directly on the flight-deck panel.
Loran-C
Loran is a hyperbolic navigation system, deriving its name from 'Long Range
Aid to Navigation' and was originally designed to cover the open oceans,
having a range of up to 2000nm.
Loran-C works on LF (100 kHz) on the principle of differential range by
pulse technique. Transmitting stations mainly operated by the US coastguard
are arranged in 'chains', each chain comprising a master station (M) with two
or more secondary stations or slaves (S) arranged around the master. There
are wide variations in the length of the baselines between the master and
slaves of a chain depending upon requirements and suitable locations, but the
maximum baseline length is about 1000nm. The slaves are designated Z, Y,
X and, where there are four slaves, W.
If both the master and slave in a chain transmitted synchronously it would
be impossible to determine which was which. Also, it is necessary to be able
to identify stations in different chains when within the coverage of more than
one chain. In the original Loran of the 1940s, single pulses were transmitted
and slaves operated on different frequencies with particular allocated pulse
recurrence frequencies (PRF). Now Loran-C signals are transmitted in groups
of pulses. The pulse groups recur at a fixed group repetition interval (GRI),
the value of which is different for each chain (and designated by a code). In
order to achieve the greatest efficiency, the time difference is read from the
third cycle within a group of pulses from the master and from the chosen
slave (Fig. 17.3). (This process is also known as 'indexing'.)
The master station in a chain transmits a group of pulses in all directions.
Its slave station receives this signal and the slave's transmitter is triggered but
delays transmission for a specific time interval called the coding delay. It then
transmits in all directions, the coding delay having been long enough to
ensure that the slave's signal could not arrive at the aircraft before the master
signal, whatever the aircraft's position in the chain's coverage area.
With the first Loran sets the operator, having tuned in a chain, measured
the time difference between and M and S signals on a CRT screen. This was a
complicated process requiring experience and dexterity in identifying the
master and slave signals, switching the signals to a double timebase where
they had to be balanced, reading their time difference from a superimposed
calibration scale and, if necessary making ground wave/sky wave correction

8/10/2019 Gsp Vol i Radio Aids
http://slidepdf.com/reader/full/gsp-vol-i-radio-aids 188/232
200 Radio Aids
Received signals
sampling points
/"-
slave
aster
1
1
14 measured time difference ~
time
Fig. 17.3 Indexing.
before the position line could be plotted on a Loran chart. Such a Loran
chart for a particular area usually bore the hyperbolic lattice for two or
three chains, overprinted in a different colour to avoid confusion. Often the
hyperbolae were shown at 100 ~s intervals and interpolation was necessary for
intermediate values.
The advent of the airborne computer and multi-chain receivers has enabled
the modern Loran-C system to have a direct and continuous display on the
flight-deck of the aircraft's position in latitude and longitude, derived from
the Loran signals it is receiving. It can be coupled with a navigation system
containing predetermined waypoints of a stored flight plan. On departure the
pilot turns on the equipment, selects a pre-stored route, and the system then
operates automatically without any further pilot intervention. The chains
and stations are acquired and deleted as necessary between the successive
waypoints. Some equipments are capable of tracking up to eight stations in
four different chains simultaneously and using all of these stations in the
navigation solution instead of being restricted to three stations in a single
chain.
On the modern flight-deck, Loran-C also usually offers alternative navi-
gational data to be presented against the waypoints which have been either
stored pre-flight or set up in-flight in the navigation system, e.g. as bearing
and distance, track and track error, etc.
Depending upon the CDU on the flight-deck, the pilot may be presented
with either the time difference between specific stations to a resolution of
0.1 ~s or, more usually nowadays when used in conjunction with an airborne

8/10/2019 Gsp Vol i Radio Aids
http://slidepdf.com/reader/full/gsp-vol-i-radio-aids 189/232
Loran-C
201
computer and selected on the CDU, the aircraft's position in latitude and
longitude or relative to chosen waypoints.
Normally the accuracy of Loran-C is in the order of 0.1 to 0.2 nm in areas
of good cover, decreasing to 0.5 to 1 nm at 1000nm. When the CDU is
displaying time-difference for the master and two slaves, it is desirable to get
the best angle of cut between the position lines. In these circumstances it may
be necessary to discard one of the slave signals being tracked and acquire
another slave which will give a bigger angle of cut.
Most modern Loran CDUs have 'status' indicators which enable pilots to
have a visual indication of the quality of signal reception. In the event of a
malfunction or irregularity originating at a Loran-C chain, the stations of that
chain transmit warning signals. These actuate a visual indication on the CDU ,
e.g. 'blinking' signals. Similarly, the CDU is usually provided with BITE
which enables overall system performance to be checked without external
equipment, on the ground or in-flight, whether or not Loran signals are
available.
Test questions
(1) Loran is:
(a) the name of the inventor of the system
(b) an acronym of Longwave Oceanic Radio Aid to Navigation
(c) derived from Long Range Aid to Navigation.
(2) Loran is available for use:
(a) courtesy of the US Department of Defense
(b) in N America, N Atlantic, Europe and Mediterranean where there
are chains
(c) world-wide pole to pole.
(3) Loran operates on:
(a) lOOkHz (b) lOOOkHz (c) lO6kHz.
(4) Loran position lines/fixes in the coverage area are:
(a) available both day and night
(b) are unreliable at morning and evening twilight
(c) are unreliable along the chain baseline.
(5) The time difference is measured in a Loran receiver by a process known
as:
(a) scalloping (b) indexing (c) hyperbolicking.

8/10/2019 Gsp Vol i Radio Aids
http://slidepdf.com/reader/full/gsp-vol-i-radio-aids 190/232
Decca is another hyperbolic navigation system, operating on the master-
slave basis. It differs from Loran-C in many ways. First of all, the basic
principles employed by the two systems to produce differential ranges are
different. Decca measures differential ranges by comparison of phases of
the master and slave signals arriving in the aircraft. The presentation of
information may be different -Decca originally displayed information by
means of three decometers, on the dial and pointer system, although it is now
usually presented as navigational information on a CDU. Decca operates on
yet lower frequencies, the LF band in fact, and lastly, Decca is a short range
navigation aid.
A standard Decca chain consists of a master transmitter and three slave
transmitters, the slaves being known as red, green and purple. The slaves are
placed around the master, approximately 120° apart from each other and at a
distance of between 40 and 110nm from the master. One master-slave pair
gives one position line and information from all three pairs is continuously
acquired to give the aircraft's position.
Principle
The principle of Decca is differential range by phase comparison. Let us see
first of all, how it is possible to have a knowledge of range simply by
measuring the phases of two signals and comparing them. See Fig. 18.1.
It is an M-S combination, each transmitting at two cycles per second. At
any given instant, the signals relationship is as shown in the figure. The
master's signal is shown as a continuous line from M as wave A, the slave's as
the pecked line from S as wave B. Both waves are phased locked, that is,
their crests and zero values occur at the same instant.
Let us now consider the phases produced by these two waves at different
positions in the area MW. Signal A (master) will produce phases of 045,090
and 135 respectively at positions a, b and c. At these same positions signal B
(slave) will produce phases, 315, 270 and 225. Both signals will produce 0
phases at M and 180 at W.
Now, if we had a meter sensitive to phases, at position M it would read 0
phase from both the signals. Further, if this meter was capable of displaying
the result as a difference of the two phases, it would still read 0, as shown by
a meter in the figure. If we now move to position a, the phase meter will read
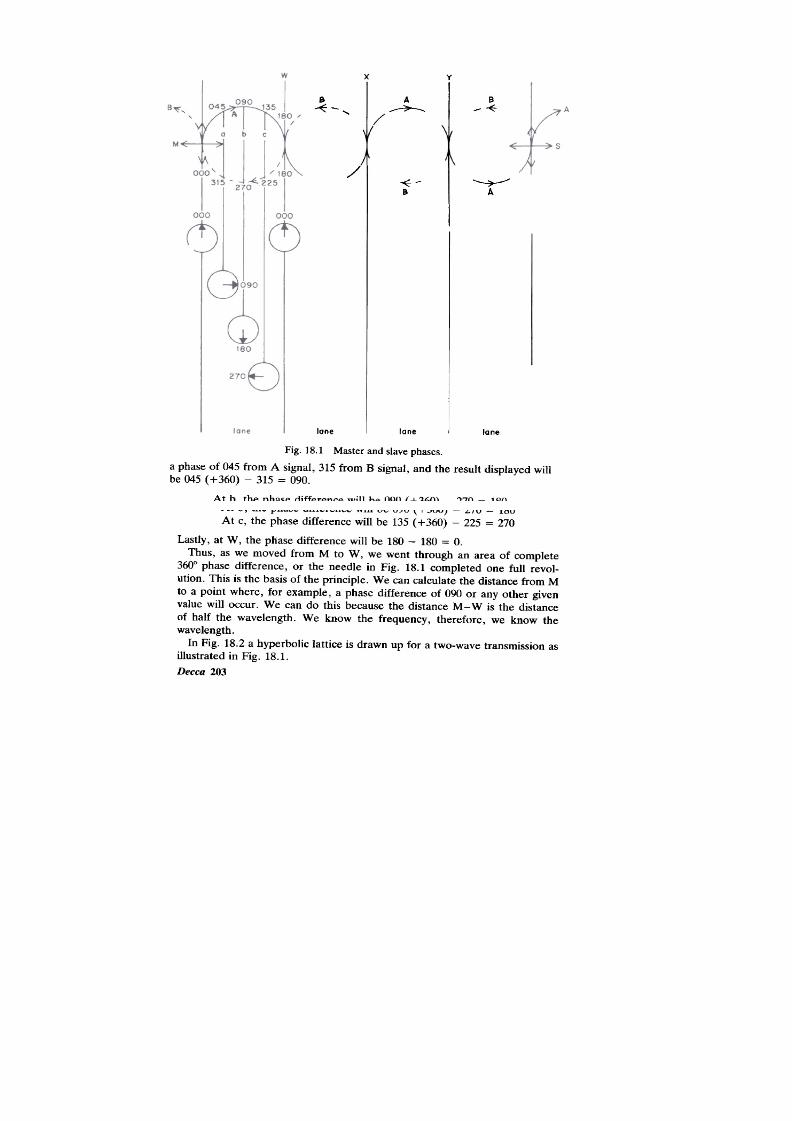
8/10/2019 Gsp Vol i Radio Aids
http://slidepdf.com/reader/full/gsp-vol-i-radio-aids 191/232
Decca
203
x
y
B
~-
B
--~
A
~
"
/
/
~-
8
-r-
A
lone
lane
lane
Fig. 18.1 Master and slave phases.
a phase of 045 from A signal, 315 from B signal, and the result displayed will
be 045 ( + 360) -315 = 090.
At b, the phase difference will be 090 ( + 360) -270 = 180
At c, the phase difference will be 135 ( + 360) -225 = 270
Lastly, at W, the phase difference will be 180 -180 = 0.
Thus, as we moved from M to W, we went through an area of complete
360° phase difference, or the needle in Fig. 18.1 completed one full revol-
ution. This is the basis of the principle. We can calculate the distance from M
to a point where, for example, a phase difference of 090 or any other given
value will occur. We can do this because the distance M- W is the distance
of half the wavelength. We know the frequency, therefore, we know the
wavelength.
In Fig. 18.2 a hyperbolic lattice is drawn up for a two-wave transmission as
illustrated in Fig. 18.1.

8/10/2019 Gsp Vol i Radio Aids
http://slidepdf.com/reader/full/gsp-vol-i-radio-aids 192/232
204
Radio Aids
,-
LANE\
PO phase differ
Fig. 18.2 Hyperbolic pattern
In this figure, master and slave waves are shown every 90°, master's
transmission being continuous curves, slave's pecked curves. Hyperbolae are
determined as follows:
Starting at M, the phase due to master signal at point V is 90, the slave
phase is 270. Difference is 090 + 360 -270 = 180.
Now we want to find all other points in the vicinity of M which will give the
same phase difference, i.e. 180. Take point w. Master's phase here is 180,

8/10/2019 Gsp Vol i Radio Aids
http://slidepdf.com/reader/full/gsp-vol-i-radio-aids 193/232
Decca
205
slave's phase 360, difference 180. Points X, Y and Z are similarly found. A
smooth curve joining these points gives a hyperbola of 180 phase difference.
This means that an aircraft anywhere along that curve will read a phase
difference of 180, and a small portion of that hyperbola in the vicinity of the
aircraft's position is its position line.
By a similar process hyperbolae at any convenient interval may be drawn
up between master and slave and then the original wave pattern erased.
Note that the perpendicular bisector is a straight line curve. Note also that
ambiguity exists behind master and slave.
We are now ready to see how this principle is implemented in practice. In
our illustration in Fig. 18.1, we have both master and slave transmitting on
the same frequency. In practice, this is not possible since two signals on the
same frequency arriving at the aerial will merge and appear as a single
voltage. Unless separate identity is maintained the phase comparison cannot
take place. Therefore, a Decca master and the three slaves transmit on
different frequencies. Each station (i.e. master and three slaves) has a basic
or fundamental frequency called f. The value of f is always in the region
of 14kHz. Master and its slaves then transmit on fixed harmonics of that
fundamental frequency. Harmonics are the multiples or divisions of a given
frequency and they are easier to produce. These fixed harmonics in respect of
the four transmitters are as follows, and they are valid for a Decca chain
anywhere in the world:
Master- 6
Red -8
Green -9
Purple -5
Just to repeat for the sake of emphasis, the multiples remain constant
throughout, the value of varies from chain to chain. A typical chain
operating on a basic frequency of 14.2kHz is shown in Fig. 18.3.
) RED
8f = 113-6 kHz
/
-
PURPLE
5 =71 kHz
Comparison frequency
By staggering the four transmission frequencies we solved the problem of
keeping the signals separate. But in doing so, we created a new problem.

8/10/2019 Gsp Vol i Radio Aids
http://slidepdf.com/reader/full/gsp-vol-i-radio-aids 194/232
206
Radio Aids
Phase comparison cannot take place between any two signals which are not
on the same frequency for the simple reason that they do not bear phase
relationship. Now we have two signals in the receiver but not on the same
frequency and we cannot compare their phases. So where do we go from
here? The obvious solution is to step them up now to a common frequency
and then take the phase difference; Decca has done just that. Each master-
slave combination is stepped up in the receiver to the value of their lowest
common multiple (LCM) and phase comparison is then taken. These stepped
up values are called comparison frequencies, and they are as follows:
Master and red
M transmits at 6 ...
R . 8 LCM = 24 whlCh IS the comparIson frequency
transmIts at
Similarly, the comparison frequency for master and green is 18 and master
and purple, 3Of.
Thus, the principle is finally implemented and the result of phase com-
parison could be displayed by a pointer on individual Decca meters called
Decometers. The only observation that remains to be made is how the
receiver converts the received frequencies into comparison frequencies. This
is shown in Fig. 18.4 which is self explanatory.
1
aster 61 X 4 = 241
}ED 81 X 3 = 241 compare -
"'
/
Master Sf X 3 = 18f
GREEN9i X 2 = 18f
compore --
-
""'
Master 61 X 5 =301
Purple 51 X 6 =30f
1
ompore
'( /
Fig. 18.4 Basic Decca information presented on decometers.
Decometers
With the information coming to the Decca receiver in the form of phase
differences it is now necessary to create a system of presenting this infor-
mation in a convenient form so that the operator can rapidly utilise it.
For a start, the very fact that a 360° phase change occurs over a known
distance can be adopted to give us a basic unit of measurement. On a
decometer (which is a Decca indicator) these 360° phase changes are indicated
on the fractional pointer- Fig. 18.4. The pointer indicates the position inside

8/10/2019 Gsp Vol i Radio Aids
http://slidepdf.com/reader/full/gsp-vol-i-radio-aids 195/232
Decca
207
anyone of the numerous 360° phase change areas that occur between a
master and a slave by taking the phase difference between the two signals.
The next step is to be able to locate the exact area we are in. To enable us
to do this, these 360° phase change areas, called Decca lanes are numbered,
the numbering system being explained below. A lane is defined as an area
enclosed by two hyperbolae of 0° phase difference. On a decometer, the lane
number is indicated by the lane pointer geared to the fractional pointer .
The physical distance that anyone lane would occupy, that is its lane
width, depends on the slave's comparison frequency, because it will be
remembered that the fractional pointer is placed by the phase difference
taking place at this frequency. Along the base line, the lane width is the
distance occupied by half the wave at comparison frequency -see Fig. 18.1.
Taking a typical Decca fundamental frequency, I, of 14.2 kHz, the lane width
for the three slaves is calculated as follows:
Red slave: compares at 241, comparison frequency = 24 x 14.2 = 340.8kHz.
.300000
ane wIdth =
340.8 x 2 = 440m
Green slave: compares at 18/, comparison frequency = 18 x 14.2 = 255.6kHz
300000
Lane width =
255.6 x 2 = 587m
Purple slave;
compares at 30 , comparison frequency = 30 X 14.2 = 426kHz
300000
T~ane width =
426X2 = 352m
From the above it will be noticed that the different slaves produce lanes of
different widths, green for example is 587 m whereas the purple is merely
352 m. It is further pointed out that no two slave transmitters can be expected
to be located at exactly the same distance from the master. In a Decca chain,
the green slave may be, for example, 160km from the master and the red
may be 180 km. These variables call for some kind of grouping of the lanes
for the sake of standardisation of the calibration of the decometers.
This standardisation is achieved by the establishment of Decca zones, so
that a zone provides a fixed distance measurement for all three slaves. A
zone is defined as an area enclosed by two 0 phase hyperbolae formed by
comparison at the basic frequency, f. The basic frequency, I, being the same
for all three slaves in a chain, the zone width for all three slaves will also be
the same. Along the base line, the width of a zone is the distance occupied by
half the wave at the fundamental frequency, f. Zone width for any slave may
be calculated as follows:
I= 14.2kHz
300000
14.2 x 2
= 10563m
zone width =
m

8/10/2019 Gsp Vol i Radio Aids
http://slidepdf.com/reader/full/gsp-vol-i-radio-aids 196/232
208
Radio Aids
Green:
Purple;
lane width = 587 m and the number of green lanes in a green zone
10563
= -= 18 and lastl
y
87 ,
lane width = 352 m and the number of purple lanes in a purple zone
=~=30
352
The original Decca equipment employed three decometers, one for each
slave and the information provided was in the form of a zone, lane and the
fraction of the lane, as below.
Zones. All the decometers read up to ten zones. These were lettered from
A to J (including I) and the indication was on moving counters. If in a
particular chain the master-slave distance exceeded ten zones, the letters
then repeated. It will be appreciated that this repetition was not likely to
cause an ambiguity because, on average the first ten zones would occupy a
distance of around lOOkm along the base line (and more elsewhere) before
the repetition would occur .
Lanes. As mentioned earlier, the number of lanes in a zone differs ac-
cording to the slave, and different calibrations for different slaves may be
expected. The lane pointer moves round the dial calibrated as follows:
Red decometer- 24 lanes to a zone, numbered 0 to 23 (incl)
Green decometer -18 lanes to a zone, numbered 30 to 47 (incl)
Purple decometer -30 lanes to a zone, numbered 50 to 79 (incl)
Fraction of lane. 360° travel of the fraction pointer round the dials was
shown in decimals, that is, from 0 to 0.99 rather than as 360 phases. This
made it easier to read and the dial required fewer calibration marks which
enhanced the accuracy of the reading.
To recap, when the fractional pointer completed one full revolution, a
flight through one lane was complete. The lane pointer which was geared to
the fractional pointer would then indicate the next lane. When the lane
pointer completed one full revolution, the aircraft would have flown through
24 red lanes or 18 ~reen lanes or 30 purple lanes. The zone indicator which

8/10/2019 Gsp Vol i Radio Aids
http://slidepdf.com/reader/full/gsp-vol-i-radio-aids 197/232
Decca
209
was geared to the lane pointer would now have moved to indicate the next
zone. An operator took the zone reading first, this being the slowest moving
counter. The number of the lane was then read, followed by the fraction
inside the lane. A typical reading D 41.75 is illustrated in Fig. 18.5. D is the
zone letter, 41 is the lane number and. 75 is the position inside that lane. Or ,
the aircraft has progressed three-quarters of the way inside lane 41 of zone D.
Fig. 18.5 Decometer reading D 41.75,
Lane identification
It will be appreciated that the length of a Decca lane is a very small distance
indeed. For example, for a purple slave, if the master-slave distance is
100nm, (and we know that there are 300 lanes in that distance) the length of
a lane is a mere 1/3rd of a nm. If you are taking off from an aerodrome and
planning to use Decca straightaway, this causes no problem, since you will
have set the base co-ordinates in terms of zone and lane (fractional pointer
will pick up correct position automatically) before the start. In that case,
Decca will continue to indicate the correct reading throughout the flight. The
problem arises in cases where temporary failure of the equipment occurs or
when entering a Decca chain from outward or when changing over from one
chain to another. In these instances accurate information on lane number is
required. On the basic Decca, this information was provided on a lane
identification (LI) meter, a single indicator calibrated in decimals just like the
fractional pointers of the three decometers and which catered for all three
slaves. The identification meter consisted of two pointers, one was wide and
was called the sector pointer. The other was a six legged one and was called
the vernier pointer (Fig. 18.6).
In the above illustration the reading is. 72. If this was a green reading (that
is, a reading taken when green light was on) and we wished to set the lane on
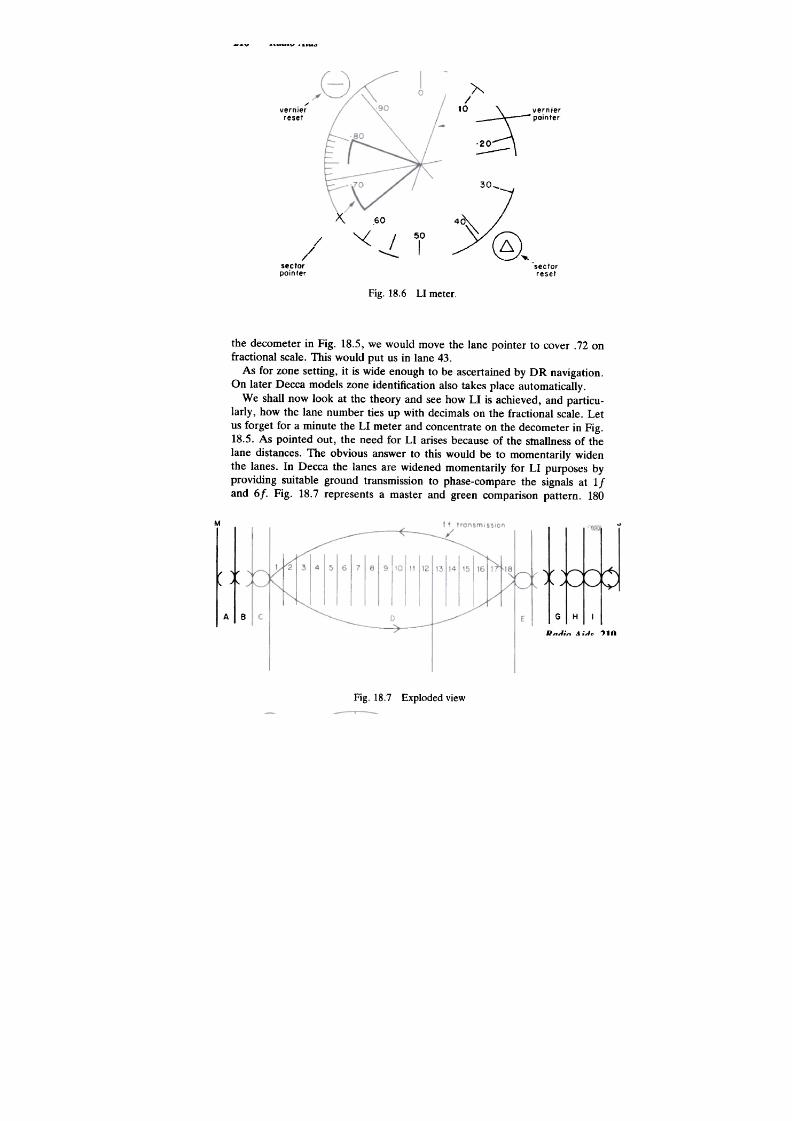
8/10/2019 Gsp Vol i Radio Aids
http://slidepdf.com/reader/full/gsp-vol-i-radio-aids 198/232
210
Radio Aids
A
I
10
vernier
reset
";;'J: vernierointer
.20
--
30-
7
K
.60
"'<
50
I
4~/
/@,
'--
/
/
/
sector
pointer
'sector
reset
Fig. 18.6 LI meter.
the decometer in Fig. 18.5, we would move the lane pointer to cover. 72 on
fractional scale. This would put us in lane 43.
As for zone setting, it is wide enough to be ascertained by DR navigation.
On later Decca models zone identification also takes place automatically.
We shall now look at the theory and see how LI is achieved, and particu-
larly, how the lane number ties up with decimals on the fractional scale. Let
us forget for a minute the LI meter and concentrate on the decometer in Fig.
18.5. As pointed out, the need for LI arises because of the shlallness of the
lane distances. The obvious answer to this would be to momentarily widen
the lanes. In Decca the lanes are widened momentarily for LI purposes by
providing suitable ground transmission to phase-compare the signals at If
and 6 . Fig. 18.7 represents a master and green comparison pattern. 180
M
A
B
G
Fig. 18.7 Exploded view

8/10/2019 Gsp Vol i Radio Aids
http://slidepdf.com/reader/full/gsp-vol-i-radio-aids 199/232
Decca
211
lanes are produced which are contained in 10 zones, each zone having 18
lanes in it. This is so during normal transmission. At If, we know from
earlier calculations, that there will be 5 waves between master and green
(distance 60nm) or 10 lanes. This If transmission forming 10 lanes between
master and green is also shown in Fig. 18.7. Distance X- y which marks the
boundary of D zone (shown exploded for clarity) is now covered by half a
wave from master and half from slave. This resembles the wave pattern
between M and W in Fig. 18.1. Thus, as the aircraft travels from X to
Y, 360° phase change will occur and the fractional pointer will complete one
revolution.
Under this arrangement the distance X- y (or original zone D) is a lane,
and the fractional pointer at any time indicates position inside this lane in
terms of decimals.
For example, when the aircraft is at Z, the fractional pointer of the
decometer will have gone round 2/3rds of the dial, say, it indicates. 72. Now,
if against position. 72 on the fractional scale, the decometer was calibrated to
give lane numbers under normal comparison frequency, the reading would be
43 (30 + 13) from Fig. 18.7. If you examine Fig. 18.5, it is calibrated just that
way. Fractional value at If indicates lane number at normal comparison
frequency. As for the fractional pointer on the decometer, it would be
most inconvenient if LI readings were fed to it. The needle would jump
periodically to indicate a lane. Hence the use of a separate LI meter. The
result of 1 is displayed on the sector pointer .
Comparison for lane identification also takes place at 6 simultaneously
with If. The reason for 61 comparison is to improve the accuracy of the LI. If
you examine the If curve above you will notice that the curve is very gentle
and the phases change very slowly. A comparison on its own would only yield
an approximate result, and this accounts for the shape of the sector pointer .
6 will produce six lanes in the original D zone ( 6 = 60 lanes in place of
original 180. Therefore, the original three lanes will equal one new lane or ,
there will be six lanes in one original zone). So there will be six positions in
distance x- y where the same phase difference will be measured -hence the
shape of vernier pointer. The leg that falls in the area covered by the sector
pointer indicates the lane in decimals.
To enable the receiver to carry out phase comparisons at If and 61 the
transmission pattern has to be modified.
Up to the late 1950s, with the early Decca system, for the purpose of lane
identification the normal transmission was interrupted every minute. Since
then, a multipulse (MP) type of LI has been in use and derives the required
If signal from each station by a method in which twice as much information
is transmitted as in the previous mode.
The complete transmission sequence of an MP chain is shown in Fig. 18.8.
Every 20 seconds the stations transmit the MP signals in the order MRGP
together with an 8.21 component (for chain control and surveillance). The
MP signals last 0.45 seconds and are spaced at 2.5-second intervals.
The interrupted and re-grouped chain transmissions enable the receiver to

8/10/2019 Gsp Vol i Radio Aids
http://slidepdf.com/reader/full/gsp-vol-i-radio-aids 200/232
212
Radio Aids
Fig. 18.8 Transmission pattern
extract a signal of frequency f from the master and from each slave. Com-
paring the phase of these signals generates a coarse hyperbolic pattern cofocal
with the fine pattern such that one cycle of phase difference embraces 18
green, 24 red and 30 purple lanes. An additional phase difference meter
responds to the coarse pattern and gives periodic readings which indicate in
turn the correct lane of each pattern within a known zone. Now, instead of
actuating a meter, the lane identification transmissions automatically resolve
the cycle ambiguity in the individual signals, thus eliminating the lane
ambiguity at its source.
Use of Decca
For ease of explanation of the principle of operation, the original equipment
of decometers and LI meter have been described. With the decision not to
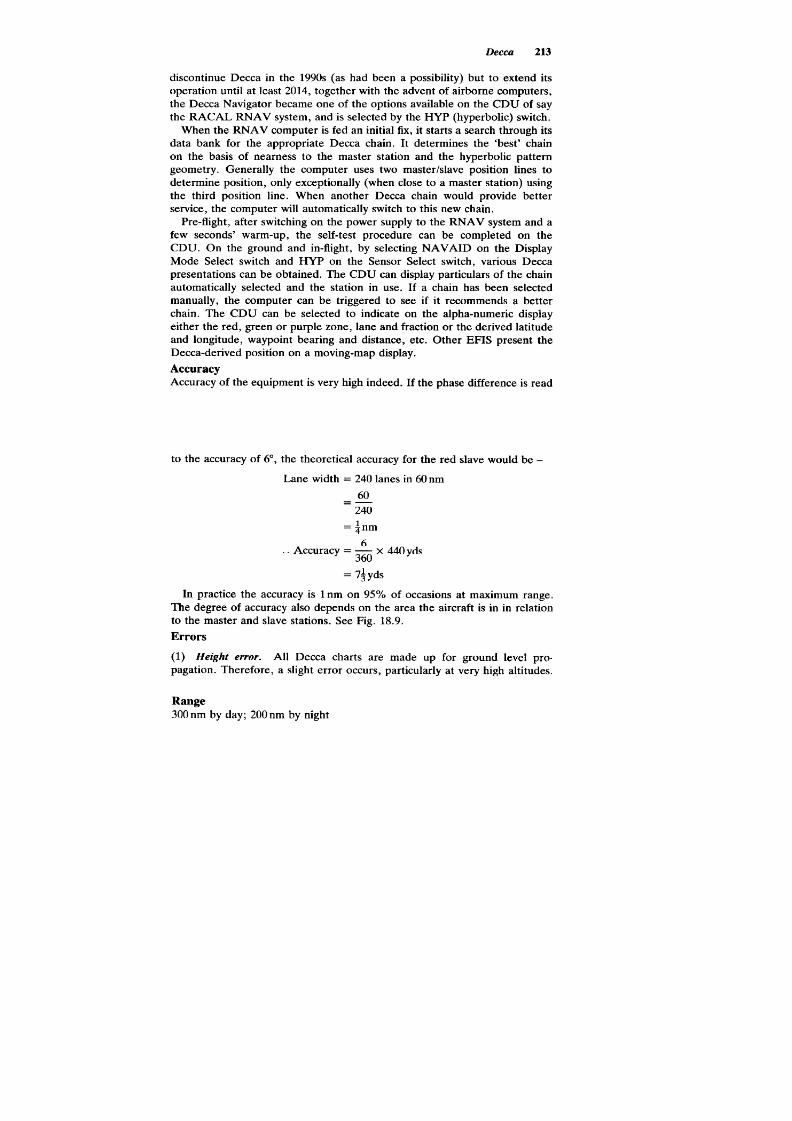
8/10/2019 Gsp Vol i Radio Aids
http://slidepdf.com/reader/full/gsp-vol-i-radio-aids 201/232
Decca 213
discontinue Decca in the 1990s (as had been a possibility) but to extend its
operation until at least 2014, together with the advent of airborne computers,
the Decca Navigator became one of the options available on the CDU of say
the RACAL RNA V system, and is selected by the HYP (hyperbolic) switch.
When the RNA V computer is fed an initial fix, it starts a search through its
data bank for the appropriate Decca chain. It determines the 'best' chain
on the basis of nearness to the master station and the hyperbolic pattern
geometry .Generally the computer uses two master slave position lines to
determine position, only exceptionally (when close to a master station) using
the third position line. When another Decca chain would provide better
service, the computer will automatically switch to this new chain.
Pre-flight, after switching on the power supply to the RNA V system and a
few seconds' warm-up, the self-test procedure can be completed on the
CDU. On the ground and in-flight, by selecting NA V AID on the Display
Mode Select switch and HYP on the Sensor Select switch, various Decca
presentations can be obtained. The CDU can display particulars of the chain
automatically selected and the station in use. If a chain has been selected
manually, the computer can be triggered to see if it recommends a better
chain. The CDU can be selected to indicate on the alpha-numeric display
either the red, green or purple zone, lane and fraction or the derived latitude
and longitude, waypoint bearing and distance, etc. Other EFIS present the
Decca-derived position on a moving-map display.
Range
300 nm by day; 200 nm by night
Accuracy
Accuracy of the equipment is very high indeed. If the phase difference is read
to the accuracy of 6°, the theoretical accuracy for the red slave would be -
Lane width = 240 lanes in 60 nm
60
240
=~nm
6
..Accurac
y
=
360 ~01-
=7iyds
In practice the accuracy is 1 nm on 95% of occasions at maximum range.
The degree of accuracy also depends on the area the aircraft is in in relation
to the master and slave stations. See Fig. 18.9.
-:- x 440 vds
Errors
(1) Height e"or. AU Decca charts are made up for ground level pro.
pagation. Therefore, a slight error occurs, particularly at very high altitudes
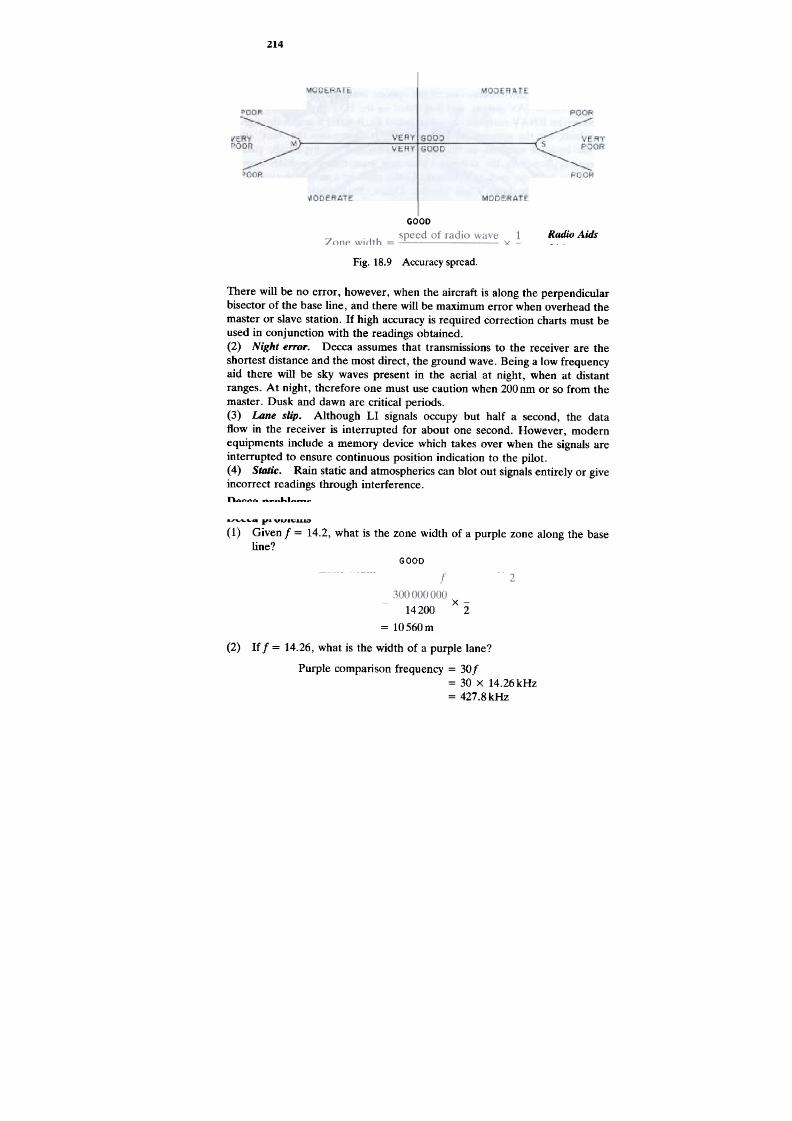
8/10/2019 Gsp Vol i Radio Aids
http://slidepdf.com/reader/full/gsp-vol-i-radio-aids 202/232
214
Radio Aids
GOOD
GOOO
Fig. 18.9 Accuracy spread.
There will be no error, however, when the aircraft is along the perpendicular
bisector of the base line, and there will be maximum error when overhead the
master or slave station. If high accuracy is required correction charts must be
used in conjunction with the readings obtained.
(2) Night e"or. Decca assumes that transmissions to the receiver are the
shortest distance and the most direct, the ground wave. Being a low frequency
aid there will be sky waves present in the aerial at night, when at distant
ranges. At night, therefore one must use caution when 200 nm or so from the
master. Dusk and dawn are critical periods.
(3) Lane slip. Although LI signals occupy but half a second, the data
flow in the receiver is interrupted for about one second. However, modern
equipments include a memory device which takes over when the signals are
interrupted to ensure continuous position indication to the pilot.
(4) Static. Rain static and atmospherics can blot out signals entirely or give
incorrect readings through interference.
Decca problems
(1) Given f = 14.2, what is the zone width of a purple zone along the base
line?
X-
14200 2
= 10560m
(2) If f = 14.26, what is the width of a purple lane?
Purple comparison frequency = 30 f
= 30 x 14.26kHz
= 427.8kHz

8/10/2019 Gsp Vol i Radio Aids
http://slidepdf.com/reader/full/gsp-vol-i-radio-aids 203/232
Decca
215
300000
Half wavelength = 427.8
= 350.6m
-
x-
2
(3) Given f = 14.2, and there are 14 red zones between the master and the
slave.
How many kilometres apart are the two stations?
300 000 1
Red zone width = x -
14.2 ?
= 10560m
For 14 such zones,
Width of 14 red zones = 10560 x 14
= 147840m or 147.840km
(4) If the width of a Decca lane along the base line is 440m, what is the
comparison frequency?
Lane width = 440m; therefore wavelength = 880m and
300 000
comparison frequency =
k
Hz
80
= 340.9kHz

8/10/2019 Gsp Vol i Radio Aids
http://slidepdf.com/reader/full/gsp-vol-i-radio-aids 204/232
VLF is the lowest frequency band in the radio spectrum and comprises the
frequencies ranging from 3 kHz to 30 kHz. In this band, the signals suffer
the least surface attenuation, and travelling between the surface and the
ionosphere by the ducting process, they produce very large ranges. Given
sufficient transmission power, ranges of the order of 6000 to 10000nm may
be obtained.
Thus, VLF is a very attractive frequency band in which to develop long
range navigation systems but it was totally neglected until around the mid-
1950s. Interest was aroused following Decca's success. The investigations
which followed revealed that such a proposition was feasible and that a
global navigation system could be produced in the VLF band. Against the
advantages of the ranges, there are two disadvantages inherent in any system
working with such a low frequency band: its variable propagation charac-
teristics must be thoroughly understood and such a system calls for colossal
ground installations.
Omega system
Ground installations. The system consists of eight ground transmitting
stations, their locations round the world carefully chosen to give a global
coverage, owned and operated by the countries in which they are located,
but are monitored (for frequency accuracy and stability and for signal trans-
mission characteristics) by the US Coast Guard. The frequencies used are
10.2kHz, 11.33kHz and 13.6kHz. Of these, 10.2kHz is the navigation fre-
quency and the other two are transmitted to provide lane identification. Of
the eight Omega stations, only three stations are on the air at anyone time.
The transmission is in the form of pulses of 0.9 to 1.2 second duration and
there is a silent period of 0.2 second between the end of one set of three
transmissions and the beginning of the next one. The whole non-repetitive
sequence takes 10 seconds. For interest, the sequence of transmission from
the eight stations is shown in the following table.

8/10/2019 Gsp Vol i Radio Aids
http://slidepdf.com/reader/full/gsp-vol-i-radio-aids 205/232
Omega
217
Norway
x
z
y
Liberia
x
z
y
Argentina
x
z y
Australia
y
x
z
Japan
z
y
x
x: 10.2kHz Y: 11.33kHz z: 13.6kHz
Thus, at the commencement of the sequence, Norway, Australia and Japan
transmit together on frequencies, 10.2kHz, 11.33kHz and 13.6kHz respec-
tively. There is a 0.2 second silence and then Norway, Liberia and Japan will
transmit, and so on.
Principle of operation. This is a hyperbolic system and the principle has
certain similarities with the Decca system. An Omega receiver, synchronised
to 10.2 kHz transmission wavelength measures the phase of the signal being
received from the selected station. This information is retained in the memory
until the phase of a second signal from a different station is received. The
difference between the phases of the two stations gives a hyperbolic position
line. With a phase measurement from a third station a three position line fix
is plotted as follows:
Phase difference between stations A and B -one position line
Phase difference between stations B and C -second position line, and
Phase difference between stations A and C -third position line.
From the above combinations it will be seen that a fourth station will give a
six-position line fix.
Airborne equipment. The airborne equipment consists of a small, flush-
mounted aerial, a receiver/computer and a CDU. At the commencement of
the flight, enter the date, time, present position and the way points in the
CDU. The date and time are necessary to make allowances for the variations
in the propagation characteristics and the system will accept the position
accurate to within 36 nm, Subsequently the present position will be continually

8/10/2019 Gsp Vol i Radio Aids
http://slidepdf.com/reader/full/gsp-vol-i-radio-aids 206/232
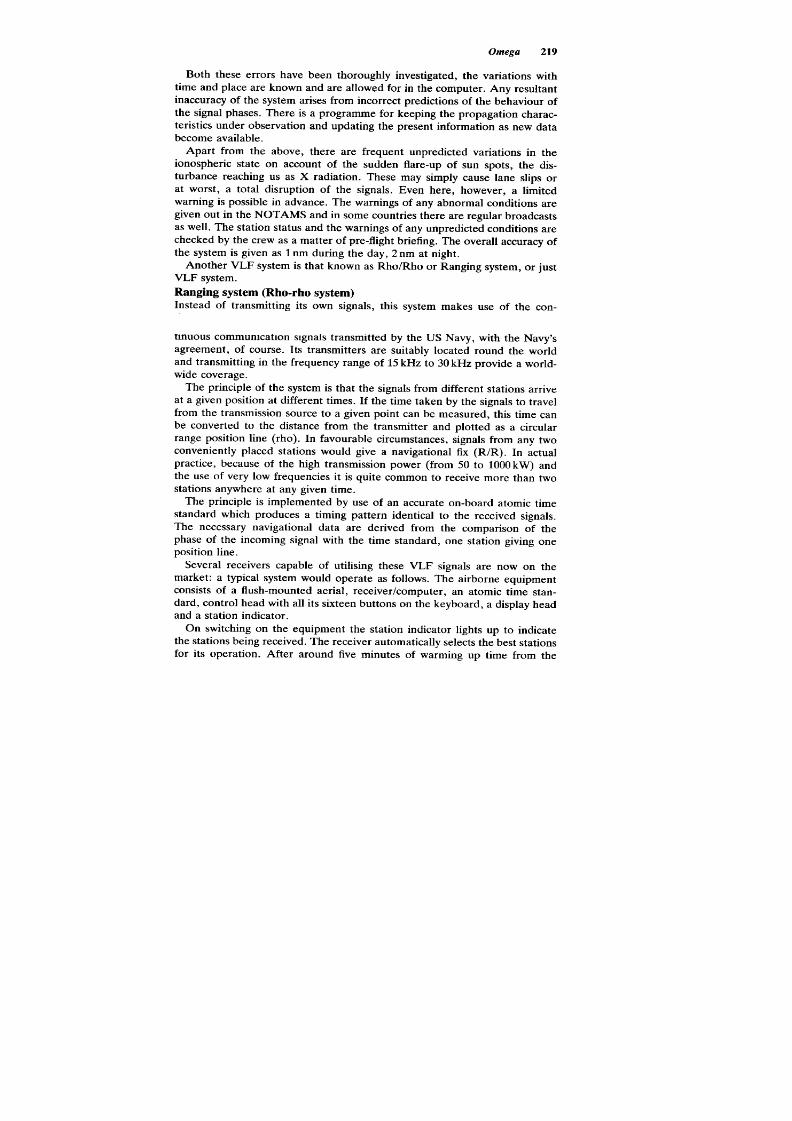
8/10/2019 Gsp Vol i Radio Aids
http://slidepdf.com/reader/full/gsp-vol-i-radio-aids 207/232
Omega
219
Both these errors have been thoroughly investigated, the variations with
time and place are known and are allowed for in the computer. Any resultant
inaccuracy of the system arises from incorrect predictions of the behaviour of
the signal phases. There is a programme for keeping the propagation charac-
teristics under observation and updating the present information as new data
become available.
Apart from the above, there are frequent unpredicted variations in the
ionospheric state on account of the sudden flare-up of sun spots, the dis-
turbance reaching us as X radiation. These may simply cause lane slips or
at worst, a total disruption of the signals. Even here, however, a limited
warning is possible in advance. The warnings of any abnormal conditions are
given out in the NOTAMS and in some countries there are regular broadcasts
as well. The station status and the warnings of any unpredicted conditions are
checked by the crew as a matter of pre-flight briefing. The overall accuracy of
the system is given as 1 nm during the day, 2 nm at night .
Another VLF system is that known as Rho/Rho or Ranging system, or just
VLF system.
Ranging system (Rho-rho system)
Instead of transmitting its own signals, this system makes use of the con-
tinuous communication signals transmitted by the US Navy, with the Navy's
agreement, of course. Its transmitters are suitably located round the world
and transmitting in the frequency range of 15 kHz to 30 kHz provide a world-
wide coverage.
The principle of the system is that the signals from different stations arrive
at a given position at different times. If the time taken by the signals to travel
from the transmission source to a given point can be measured, this time can
be converted to the distance from the transmitter and plotted as a circular
range position line (rho). In favourable circumstances, signals from any two
conveniently placed stations would give a navigational fix (R/R). In actual
practice, because of the high transmission power (from 50 to 1000kW) and
the use of very low frequencies it is quite common to receive more than two
stations anywhere at any given time.
The principle is implemented by use of an accurate on-board atomic time
standard which produces a timing pattern identical to the received signals.
The necessary navigational data are derived from the comparison of the
phase of the incoming signal with the time standard, one station giving one
position line.
Several receivers capable of utilising these VLF signals are now on the
market: a typical system would operate as follows. The airborne equipment
consists of a flush-mounted aerial, receiver/computer, an atomic time stan-
dard, control head with all its sixteen buttons on the keyboard, a display head
and a station indicator .
On switching on the equipment the station indicator lights up to indicate
the stations being received. The receiver automatically selects the best stations
for its operation. After around five minutes of warming up time from the

8/10/2019 Gsp Vol i Radio Aids
http://slidepdf.com/reader/full/gsp-vol-i-radio-aids 208/232
220
Radio Aids
initial power supply, the atomic standard will have stabilised and a light signal
will indicate that the system is ready to navigate. The computer is initially fed
with the accurate start position and a continuous display of the present
position is then maintained. Other types of display may be selected: distance
to go, distance across, heading to a way point, ground speed, time to a way
point and so forth. As the flight progresses the receiver will continue to
adjust to the best incoming signals. Basically a very reliable system, it may
lose signals when flying in cloud with high ice crystal content. Then the
system will go in the DR mode but it will pick up from where it left off when
stronger signals are received again.
Test questions
(1) The correct name for the 'Omega' fixing system is:
(a) Omega (b) Oceanic Omega (c) Omega Radar System.
(2) Omega is:
(a) a Doppler navigation system (b) a long range radar system
(c) a hyperbolic navigation system.
(3) Omega operates on:
(a) 15kHz, 30kHz, 45kHz (b) 10.2kHz, 11.33kHz, 13.6kHz
(c) 15.2kHz, 21.33kHz, 30.6kHz.
(4) Omega operates in the frequency band:
(a) VLF (b) VHF (c) L-band.
(5) In the Rho/Rho ranging system, the Rho indicates:
(a) a range position line (b) a radar position line
(c) a radio bearing position line.

8/10/2019 Gsp Vol i Radio Aids
http://slidepdf.com/reader/full/gsp-vol-i-radio-aids 209/232
Like many other radio navigation aids, satellite assisted navigation systems
were initially developed for military use but the facilities on which they are
based are now made available to civil users. Global navigation satellite
systems (GNSS) have become possible by the launching of constellations of
satellites orbiting the earth, each satellite carrying an extremely accurate
atomic clock. Basically, by timing the period that is taken for a satellite's
transmission from a known position to reach the aircraft's receiver, the
distance satellite to receiver is determined so enabling a range position line,
or strictly a section of the surface of a position sphere with centre the
satellite, to be established. Signals received simultaneously from three or
more satellites enable a fix to be obtained and simultaneous ranges from four
satellites provide a three-dimensional fix (Fig. 20.1). GNSS can therefore be
---
---~~
--
--
Fig. 20.1 Fix by GNSS.
claimed to be a navigational system independent of ground facilities and when
fully developed it will also serve as an approach aid, superseding ILS and MLS
in the 21st century. However more of this later at the end of this chapter.
Satellite constellations
The global positioning system (GPS) constellation of satellites is a military
facility under the auspices of the US Department of Defense (DoD). It will
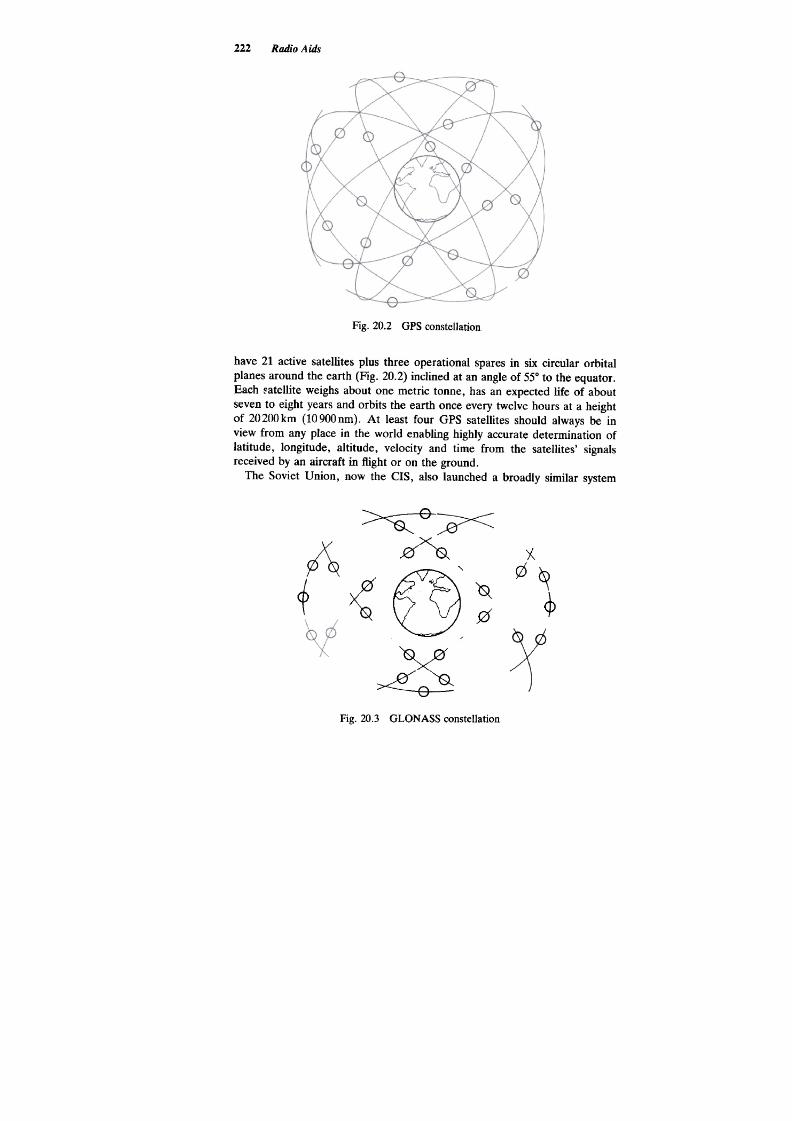
8/10/2019 Gsp Vol i Radio Aids
http://slidepdf.com/reader/full/gsp-vol-i-radio-aids 210/232
222
Radio Aids
Fig. 20.2 GPS constellation
have 21 active satellites plus three operational spares in six circular orbital
planes around the earth (Fig. 20.2) inclined at an angle of 55° to the equator .
Each ~atellite weighs about one metric tonne, has an expected life of about
seven to eight years and orbits the earth once every twelve hours at a height
of 20200km (10900nm). At least four GPS satellites should always be in
view from any place in the world enabling highly accurate determination of
latitude, longitude, altitude, velocity and time from the satellites' signals
received by an aircraft in flight or on the ground.
The Soviet Union, now the CIS, also launched a broadly similar system
~
x
.er
'0-
x
0
~
/
~
J2f
~
~
~
x
~
f2f
~
j?f
><
"&
~
Fig. 20.3 GLONASS constellation

8/10/2019 Gsp Vol i Radio Aids
http://slidepdf.com/reader/full/gsp-vol-i-radio-aids 211/232

8/10/2019 Gsp Vol i Radio Aids
http://slidepdf.com/reader/full/gsp-vol-i-radio-aids 212/232
224
Radio Aids
Satellite
generated
code
~ ,
JUuLfL-I1J~
L ~
GPS Ax internal
comparison code
Fig. 20.4 Measurement of dT.
enable the signals to be compared (Fig. 20.4) although the GPS comparison
signal is not transmitted externally. As shown diagrammatically in Fig. 20.4,
the GPS receiver matches up the code received from the satellite with the
code that the GPS receiver has been generating for its own internal timing
system to determine the time interval (dT) since it was generated.
If for example, dT is 0.1 second, then the signal was transmitted from the
satellite 0.1 seconds earlier when it was
0.1 seconds x 186000 miles/sec = 18600 miles
from the aircraft.
The satellite's transmission also includes the precise time of the trans-
mission, its orbital position, atmospheric propagation data and any satellite
'clock bias' information. While the satellites' timepieces are atomic clocks
and the GPS receiver clocks are accurate crystal oscillators there is never-
theless a timing bias error or clock bias in the measurement of the time
Satellite 2
CIf='
\ PR2
Satellite 3
CJ:D
Satellite 1
l::rO
--
PR1
---
PR3-
Pseudo-ranges (PA)
intersect in a
'cocked hat'
.,.
--~
/
"
..
PAs adjusted equally
for clock error to give fix
Fig. 20.5 Removal of clock bias.

8/10/2019 Gsp Vol i Radio Aids
http://slidepdf.com/reader/full/gsp-vol-i-radio-aids 213/232
225
ateUite-assisted N avigation
interval and hence the range, so the measured ranges are called pseudo-
ranges. However as the clock bias at the receiver will be the same for all of
the pseudo-ranges measured at a particular time it can be removed by using
three simultaneous equations (one for each pseudo-range) to solve for the
three unknowns of clock error, latitude and longitude, as illustrated in Fig.
20.5.
Other errors inherent in GNSS are
Satellite clock e"or. The integrity of the satellites is continuously monitored
and if the satellite clock becomes even a few nano-seconds in error (1 nano-
second = 0.000000001 second) it is corrected so that the stated error due to
this cause is up to 0.5 m in range.
Satellite ephemeris error. This occurs if the satellite is not precisely where it
is believed to be in its orbit. The satellite control however is so exacting that
the range error due to this cause is also quoted as kept within :to.5 m -i.e.
the width of the pilot's panel
Atmospheric propagation e"or (ionosphere e"or). The density of the charged
particles (ions) in the atmosphere changes diurnally and seasonally. The
delay due to the effect of the ionosphere on the satellite signal also depends
upon its angular path to the receiver but fortunately this error is predictable
and not expected to cause a range error of more than 4m.
Instrument/receiver error. This may arise from electrical noise, errors in
matching the pseudo-random signals and computational errors but even then
only to the order of a range error of one metre.
Satellite geometry error. This is not truly a GPS error at all but a basic
principle when using position lines to obtain a fix. If the angle of cut of two
position lines is very shallow, the effect of any error is much greater than if
the position lines intersect at a right angle or nearly so (Fig. 20.6). In the
cp
CD
q:J
~
,
\
Poor
Fig. 20.6 Satellite geometry error.

8/10/2019 Gsp Vol i Radio Aids
http://slidepdf.com/reader/full/gsp-vol-i-radio-aids 214/232
226 Radio Aids
application of GNSS, this means that if two or more satellites are close
together when being used for two-dimensional navigation, range position
lines obtained from them will intersect at a shallow angle and any signal error
effect is therefore larger. The term used in GPS is 'geometric dilution of
precision' (GDOP) which may be sub-divided into time dilution of precision
-the range equivalent of clock bias (TDOP) and position dilution of
precision- based on satellite geometry less clock bias (PDOP), which in turn
may be sub-divided into vertical and horizontal components (VDOP and
HDOP). It is in order to avoid this source of error that the GPS constellation
has its orbital planes all inclined at 55° to the equator; each orbital plane has
four satellites; each orbital satellite takes 12 hours to complete an orbit.
GNSS receivers which can use both GPS and GLONASS satellite data simul-
taneously will suffer least from the problem of satellite geometry.
GPS differential correction (dGPS)
The only significant errors in fixing position by GPS are atmospheric
(ionosphere) error and the deliberate error introduced by the DoD, called
selective availability (SA) which as already mentioned is designed to prevent
unfriendly users exploiting the extraordinarily high accuracy of GPS navi-
gation to threaten the US with offensive military actions. For civil aviation a
correction factor -called the differential correction -can be determined for
aircraft navigation which eliminates the effects of ionospheric error and SA,
which is then transmitted to the aircraft (by ACARS or similar -see chapter
3). The principle is shown diagrammatically in Fig. 20.7. GPS signals are
~
I \
,~
I
dl?
I "
I
'1
~
'"" ~/
~ / Differential correction
,,'""'<. \ /
/ " ~ :, / Differentially
/ ~"'W'. corrected
Uncorrected' GPS position
GPS position
\ 1//
\It-
Uncorrected GPST~-
\
'precisely surveyed antenna AGARS Tx
ground position / position /
+ Datalink
Differential monitor ---
Measured error
Fig. 20.7 Differential GPS.
received at a station of which the antenna position has been precisely
surveyed. The monitoring ground station computes its position based on the
incoming satellite signals. The difference between the surveyed (true) position

8/10/2019 Gsp Vol i Radio Aids
http://slidepdf.com/reader/full/gsp-vol-i-radio-aids 215/232
Satellite-assisted N avigation
227
and the computed (raw) position is the differential correction -a vector with
direction and magnitude in three dimensions. When this correction is applied
to the raw position the refined position will be accurate to 1 to 3 m. The
dGPS correction is sent by ACARS uplink to the aircraft's GPS sensor if
it is within 70 nm of the dGPS station. The dGPS correction is updated
periodically and sent via the datalink to GPS-navigating aircraft.
Airborne equipment
Externally there is a small streamlined antenna which is normally mounted on
the fuselage, while on the flight deck the receiver/CDU appears in various
models with either a CRT or more likely a LCD presentation giving various
alternative items of information such as:
Latitude, longitude, altitude Alerts when approaching pre-set
Offset range and bearing from a positions, areas, etc.
specified waypoint (WPT) Self-test facility
Parallel track navigation Range, distance, bearing
TAS, GS, TMG, desired track Vertical navigation
Heading to steer and time to WPT Estimated en-route time, ETA
Time, upper winds, magnetic Satellite status
variation Fail/warning signals
The controls range from push/push or rocker type switches for ON/OFF,
BRIGHTNESS, etc. , to an ALPHANUMERIC keyboard to enable pilots to
input/extract any of the listed information. The GNSS unit can also be
interfaced with EFIS, autopilot and moving-map displays. For the pilots of
general aviation (GA) aircraft, personal portable models are available which
can be unplugged from the panel and the aircraft's power supply, to be taken
to the office, club or home to plan the next flight or to the marina for use on
a yacht using portable batteries.
Ad vantages / disadvantages
Advantages:
(1) Capable of use worldwide at all operating speeds and altitudes
(2) Highlyaccurate
(3) Available throughout the 24 hours with no diminution of accuracy
(4) Provides three-dimensional positioning on a continuous basis
(5) Unrestricted range
(6) Entirely space-based
(7) Coupled with inertial navigation systems, can make terrestrial-based
aids such as NDBs, VORs, DMEs, etc. , redundant
(8) When GPS/GLONASS development is complete and all satellites
available, the accuracy of GNSS will enable aircraft separations to be
reduced

8/10/2019 Gsp Vol i Radio Aids
http://slidepdf.com/reader/full/gsp-vol-i-radio-aids 216/232
228
Radio Aids
(9) Similarly to (8), GNSS when perfected will be able to supplant MLS
and ILS as a precision approach aid
(10) For light aircraft, there are lightweight, relatively inexpensive and
portable models available.
Disadvantages
(I) Basically it is a military system which civil aircraft are allowed to use;
currently the US has agreed to providing GPS to civil users free of
charge until AD 2002 and similarly the CIS is providing GLONASS free
until AD 2007
(2) As a military system, the existing GNSS may conceivably be interrupted
if a serious military need develops
(3) The system, although it has evolved rapidly, is still technically under
development
(4) Not as accurate in the civil mode as it is in the military mode (by
deliberate policy)
(5) Present system cannot guarantee the pilot with immediate indication of
satellite malfunction or GNSS degradation; this makes it currently
unsuitable as an approach aid for high category landings.
Latest developments
Chapter 8 referred to international disagreement on the use of MLS and DGPS
as a future landing aid. Europe favours the continued use of MLS until DGPS
has the same CAT3 performance ability. America wishes to phase out MLS and
concentrate on the development of DGPS to the same CAT3 capabilities and
integrity. This they hope to achieve much sooner (2001) than Europe deem
possible (2015)
Undoubtedly DGPS will provide the final answer. Meanwhile ICAO is
approving both systems and a multi-mode receiver (MMR) for their reception.
Test questions
(1) Position fixing by satellite is by means of:
(a) simultaneous bearings from a number of satellites
(b) range and bearing from each known satellite's position
(c) simultaneous ranges from a number of satellites.
(2) The dGPS is:
(a) the time difference between the transmission of the satellite's
coded signal and the time that it is received at the aircraft
(b) the time difference between the satellite and the aircraft GPS unit
transmitting the same code point on the signal
(c) the correction applied to the 'raw' GPS position to obtain a more
precise position.

8/10/2019 Gsp Vol i Radio Aids
http://slidepdf.com/reader/full/gsp-vol-i-radio-aids 217/232
Satellite-assisted N avigation
229
(3) The reason that the satellites of GPS and GLONASS do not collide is:
(a) the GPS orbit is at 55° to the equator while the GLONASS is at
60°
(b) the GPS satellite orbits are 1200km higher than the GLONASS
orbits
(c) GLONASS has only three orbital planes while GPS has six orbital
planes.
(4) The GPS can:
(a) provide two-dimension and three-dimension positions
(b) only provide position in latitude and longitude
(c) indicate two-dimension positions or position lines in the horizontal
plane.
(5) The GPS transmission frequency which can be used by civil aircraft is:
(a) 1575.42MHz in the L-band
(b) 2227.5 MHz in the S-band
(c) 4454.5MHz in the C-band.
(6) The US DoD degrades GPS accuracy:
(a) to protect US national security
(b) to protect the DoD copyright
(c) to prevent 100% reliance on a system which may have to be
interrupted for military purposes at a moment's notice.
(7) The accuracy of range measurement of satellite to GPS receiver is:
(a) seriously reduced during periods of sunspot activity
(b) seriously eroded during periods of anomolous propagation in an
inversion
(c) derived from accurate timepieces in the satellite and the aircraft's
GPS receiver.
(8) Satellites used in GNSS, orbit the earth:
(a) once in twelve hours (b) once in eight hours
(c) once in 24 hours.
(9) Satellite geometry error is greatest when:
(a) satellites are closest together
(b) satellites are spaced well apart
(c) satellites are nearest the horizon.
(10) It may be claimed that GNSS has the advantage over other air navi-
gation systems in that it:
(a) is basically a military-based system made available to civil users
with solar-powered satellites which have an infinite life
(b) has no possible input by the pilot
(c) is entirely space-based.

8/10/2019 Gsp Vol i Radio Aids
http://slidepdf.com/reader/full/gsp-vol-i-radio-aids 218/232

8/10/2019 Gsp Vol i Radio Aids
http://slidepdf.com/reader/full/gsp-vol-i-radio-aids 219/232
TCAS
231
The us Congress has pressed the Federal Aviation Administration (FAA)
for the introduction of ACAS and legislation requiring aircraft built to carry
more than 30 passengers to have an approved system for flying in US air-
space. Although ICAO named the system ACAS, in fact it is usually known
as traffic collision avoidance system or as traffic alert and collision avoidance
system. Because it is an entirely airborne decision and action system, it is fair
to say that air traffic controllers have had reservations over its introduction,
which in Europe is following a more cautionary introductory programme than
in the US.
TCAS I, corresponding to ACAS I, is the simplest system and intended
just to enable pilot to visually acquire nearby traffic. It will detect and
display range and approximate relative bearing. If the other (target) aircraft
is carrying Mode C or Mode S SSR it will also display relative altitude. The
system will alert pilots visually and aurally -TRAFFIC TRAFFIC if the con-
flicting traffic comes within 40 seconds of a potential collision, i.e. a TA. It
does not indicate a course of action to follow to avoid the target aircraft.
Currently the FAA is requiring all smaller aircraft with 30 or fewer seats (i.e.
commuter or feeder airliners) to carry TCAS I in US airspace by 1995.
TCAS II, corresponding to ACAS II, now being required in US airspace
as already mentioned for larger airliners, has greater range and bearing
accuracies than TCAS I. It will offer avoidance messages as Resolution
Advisories, CLIMB, INCREASE CLIMB, DESCEND, INCREASE
DESCENT. If your aircraft and the target aircraft both have Mode S datalink
transponders, the TCAS II computers on board the two aircraft will co-
ordinate their RAs to offer complementary vertical avoidance manoeuvres to
each flight crew. The TCAS II airborne system comprises a radar transponder ,
directional antennae on the top and bottom of the fuselage, computer pro-
cessor and software with a flight-deck CDU.
The visual advisory may take one of two general forms, varying on the
equipment kit determined by the operator. As the avoidance manoeuvre is
simply to climb or descend, the simplest instrumentation is in the form of a
modified conventional vertical speed indicator (V SI) known as a RA/VSI.
When an RA is generated, on one side of the 0 vertical speed position a
green arc appears and on the other side of the 0 rate of climb/descent
position a red arc appears around the edge of the V SI dial to indicate
safe (green) and dangerous (red) vertical manoeuvre to avoid the potential
collision.
The second type of presentation is by using a radar display. This may be on
a modified airborne weather radar, on a dedicated TCAS traffic display CRT
or if EFIS is fitted, (see Ground Studies for Pilots volume 3) on the EFIS
navigation display (ND). The convention on airborne radar traffic displays is
that, shown on the approximate bearing and range from one's own aircraft,
are:
'Other' traffic not offering a threat: a hollow white or blue (cyan) diamond
outline

8/10/2019 Gsp Vol i Radio Aids
http://slidepdf.com/reader/full/gsp-vol-i-radio-aids 220/232
232
Radio Aids
'Proximate' traffic within 6nm and : :1200ft: a solid white or solid blue (cyan)
diamond
Traffic advisory (TA): a solid yellow circle
Resolution Advisory (RA): a solid red square
Each of these aircraft symbols is accompanied by a 'data tag' the same
colour as the symbol. The data shown comprises a number to show the other
aircraft's height relative to one's own in hundreds of feet, i.e. +02 indicating
200ft above. If the target is climbing or descending (at more than 500ft/min)
an up or down arrow beside the number indicates this. If the target is not
reporting altitude, although the radar will show the aircraft's relative position,
there will be no data tag. On those models of EFIS where the primary flight
display (PFD) embodies a strip type of V SI along one side, when an RA is
generated a corresponding indication may be displayed on the strip. Part will
be illuminated green as the 'fly to' area while part of the strip is illuminated
red as the forbidden manoeuvre.
TCAS III, corresponding to ACAS III, at the time of publication is still
being developed. When it is operational, as originally defined by ICAO, it
will offer manoeuvres in the vertical and horizontal planes. This will require
the target aircraft's path to be tracked accurately. In TCAS II, measurement
and presentation of the relative bearing is sufficient to indicate the risk of
conflict but with TCAS III, it must be known precisely and it is particularly
this element which is causing the longer development time.
Reservations and limitations
(1) The concern of ATCOs over the introduction of TCAS has been men-
tioned earlier. The traditional principle may be quoted of 'Navigation in
the air -Control from the ground' and the possible conflict between
A TC instructions issued to a pilot and what his TCAS is advising. For
example, in a terminal control area (TMA) in an aircraft fitted with
TCAS, before the carriage of TCAS is mandatory in that TMA. The
ATC units throughout Europe, especially those newly built, will have
equipment compatible with or technically in advance of TCAS by means
of which pilots' clearances and routeings will be monitored. Pilots should
not abandon their Ie:gal separation requirements. An ICAO Circular of
1985 warned "Manoeuvres initiated as a result of ACAS indications
must not result in unsafe reduction of separation between affected
aircraft and other non-conflicting aircraft in the same air traffic environ-
ment". A possible future development has been suggested, as well
as TCAS III, of a G-CAS for airspaces such as TMAs. This would
be a ground-based collision warning system when Mode S equipments
are commonplace, bringing controllers firmly back into the conflict-
resolution loop.
(2) It is to be hoped that by the time that TCAS is a legal requirement in
Europe, experience in the USA will have eliminated, or action taken
to combat, false alarms which accompanied TCAS introduction. The
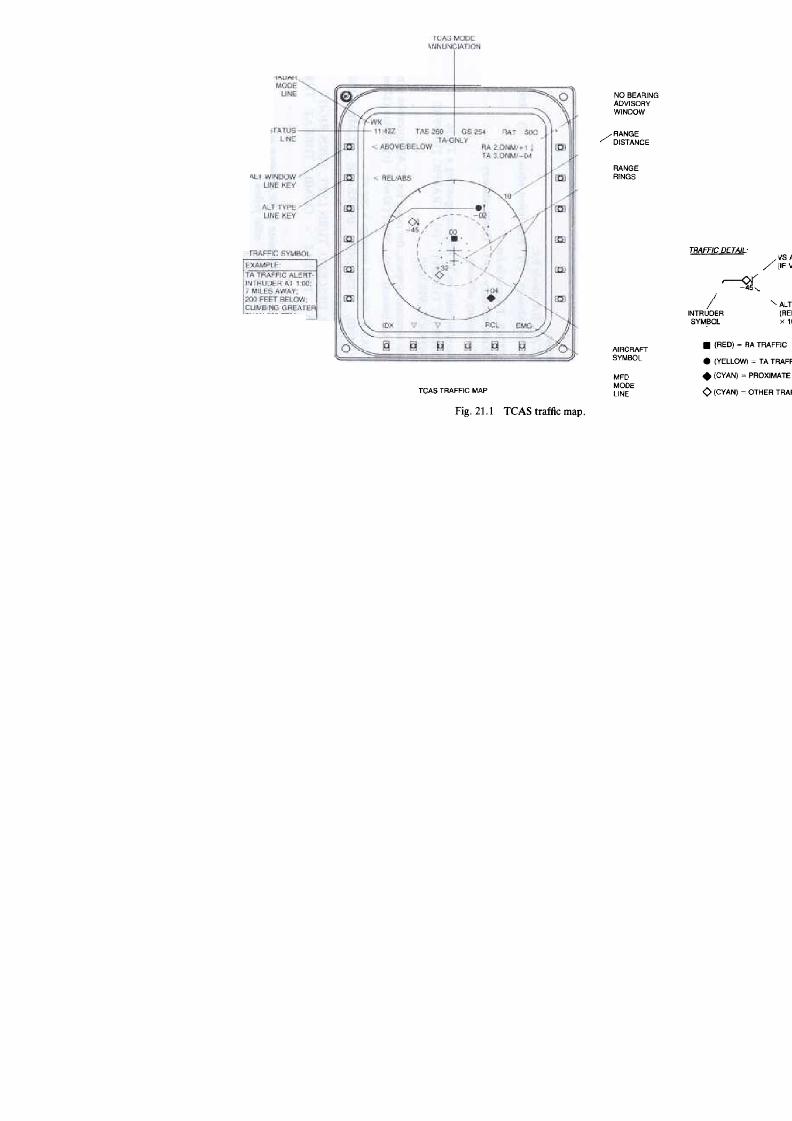
8/10/2019 Gsp Vol i Radio Aids
http://slidepdf.com/reader/full/gsp-vol-i-radio-aids 221/232
<
W
"
o
0
0
2
w
(
~
z
<a
o
\
W
<
~
Z<
a
a
<a
Q
U
a
>
<
o
O
u
O
~
J
"«
u
u
«
~
1
~
0"e
s
;
~
uN~
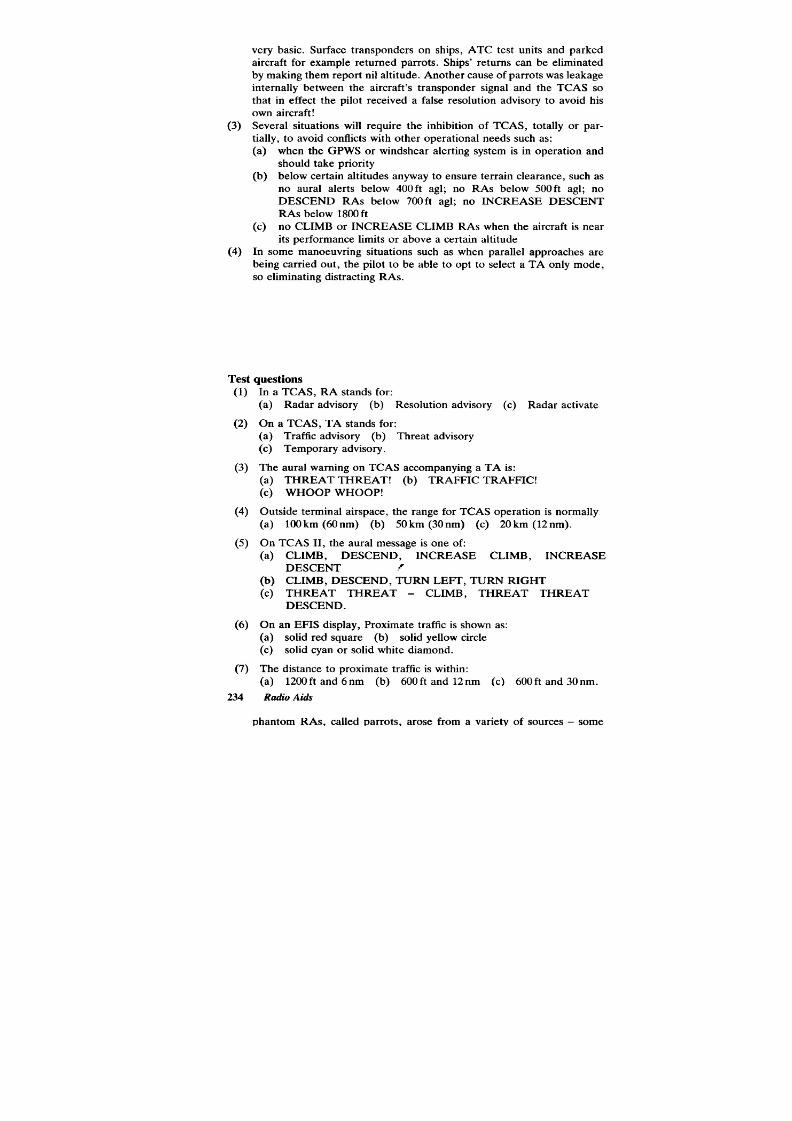
8/10/2019 Gsp Vol i Radio Aids
http://slidepdf.com/reader/full/gsp-vol-i-radio-aids 222/232
234
Radio Aids
phantom RAs, called parrots, arose from a variety of sources -some
very basic. Surface transponders on ships, A TC test units and parked
aircraft for example returned parrots. Ships' returns can be eliminated
by making them report nil altitude. Another cause of parrots was leakage
internally between the aircraft's transponder signal and the TCAS so
that in effect the pilot received a false resolution advisory to avoid his
own aircraft
(3) Several situations will require the inhibition of TCAS, totally or par-
tially, to avoid conflicts with other operational needs such as:
(a) when the GPWS or windshear alerting system is in operation and
should take priority
(b) below certain altitudes anyway to ensure terrain clearance, such as
no aural alerts below 400ft agl; no RAs below SOOft agl; no
DESCEND RAs below 700ft agl; no INCREASE DESCENT
RAs below 1800ft
(c) no CLIMB or INCREASE CLIMB RAs when the aircraft is near
its performance limits or above a certain altitude
(4) In some manoeuvring situations such as when parallel approaches are
being carried out, the pilot to be able to opt to select a TA only mode,
so eliminating distracting RAs.
Test questions
(1) In a TCAS, RA stands for:
(a) Radar advisory (b) Resolution advisory (c) Radar activate
(2) On a TCAS, TA stands for:
(a) Traffic advisory (b) Threat advisory
(c) Temporaryadvisory.
(3) The aural warning on TCAS accompanying a TA is:
(a) THREAT THREAT (b) TRAFFIC TRAFFIC
(c) WHOOP WHOOP
(4) Outside terminal airspace, the range for TCAS operation is normally
(a) lookm (60nm) (b) 50km (30nm) (c) 20km (12nm).
(5) On TCAS II, the aural message s one of:
(a) CLIMB, DESCEND, INCREASE CLIMB, INCREASE
DESCENT .'
(b) CLIMB, DESCEND, TURN LEFf, TURN RIGHT
(c) THREAT THREAT -CLIMB, THREAT THREAT
DESCEND.
(6) On an EFIS display, Proximate traffic is shown as:
(a) solid red square (b) solid yellow circle
(c) solid cyan or solid white diamond.
(7) The distance to proximate traffic is within:
(a) 1200ft and 6nm (b) 600ft and 12nm (c) 600ft and 30nm.

8/10/2019 Gsp Vol i Radio Aids
http://slidepdf.com/reader/full/gsp-vol-i-radio-aids 223/232
TCAS
235
(8) On a RA/VSI, the eyebrow FL y TO vertical speed indication is shown
in:
(a) Green (b) Gold (c) Cross-hatched white.
(9) The difference between TCAS I and TCAS II is that:
(a) TCAS II can only be fitted in large aircraft (with more than 30
seats) but TCAS I can be fitted in any size of aircraft
(b) TCAS II can generate T As and RAs while TCAS I can only
generate traffic advisories
(c) TCAS II can only be fitted to aircraft equipped with full EFIS but
TCAS I can be fitted to any aircraft with SSR.
(10) A resolution advisory is shown on the ND panel of EFIS as:
(a) a solid yellow circle (b) a solid white diamond
(c) a solid red square.

8/10/2019 Gsp Vol i Radio Aids
http://slidepdf.com/reader/full/gsp-vol-i-radio-aids 224/232
a.c.
a/c
ACARS
ACAS
ACC
ADF
ADI
AF
AFTN
agl
AIC
AlP
AM
amsl
ANO
ARINC
ASB
ASR
ATC
ATCC
ATS
AWR
alternating current
aircraft
aircraft communications addressing and reporting system
airborne collision avoidance system
Area Control Centre
automatic direction finding equipment
attitude direction indicator
audio frequency
aeronautical fixed telecommunication network
above ground level
aeronautical information circular
Aeronautical information publication
amplitude modulation
above mean sea level
Air Navigation Order
Aeronautical Radio Inc, a non-profit organisation owned
by member operators to define form, fit and function of
aviation avionics equipment
alternating sideband
approach surveillance radar
Air Traffic Control
Air Traffic Control Centre
Air Traffic Service
airborne weather radar
Bcn
BFO
brg
B-RNA V
beacon
beat frequency oscillator
bearing
basic area navigation
CAA
CAVOK
CDU
CH
CL
cm
Civil Aviation Authority
weather (in general terms) fine and clear (cfvolume 4)
control and display unit
compass heading
centreline
centimetre( s

8/10/2019 Gsp Vol i Radio Aids
http://slidepdf.com/reader/full/gsp-vol-i-radio-aids 225/232
Glossary of Abbreviations
237
CPU
CRT
cis
CW
central processing unit
cathode ray tube
callsign
carrier wave/continuous wave
DA
dB
d.c.
DDM
Dev
DF
dGPS
DH
dill
dir
dist
DME
DOC
DaD
DR
dT
DTK
duplex
DVOR
drift angle
decibels
direct current
difference in depth of modulation
deviation
direction finding
GPS differential correction
decision height
difference/ differe ntial
direction
distance
distance measuring equipment
designated operational coverage
Department of Defense (USA)
dead reckoning
time interval
desired track
separate channels for transmission and reception
Doppler VOR
°E
EFIS
EHF
ELF
ETA
degrees east
electronic flight instrument system
extremely high frequency
extremely low frequency
estimated time of arrival
FAA
Id
FM
FMS
It
It/sec
Federal Aviation Administration
Doppler shift
frequency modulation
flight management system
feet
feet per second
GCA
GDOP
GES
GHz
GLONASS
GNM
GNSS
GP
ground controlled approach
geometric dilution of precision
ground earth station
gigahertz
global orbiting navigation satellite system (CIS)
ground nautical miles
global navigation satellite system (GLONASS and GPS)
glidepath

8/10/2019 Gsp Vol i Radio Aids
http://slidepdf.com/reader/full/gsp-vol-i-radio-aids 226/232
238
Radio Aids
GPS
GPWS
GS
global positioning system (USA)
ground proximity warning system
ground speed/glideslope
Hdg
Hdg,
HF
Hz
heading
heading magnetic
high frequency
hertz
ICAO International Civil Aviation Organisation
IFR instrument flight rules
ILS instrument landing system
IM inner marker
INMARSA T International Maritime Satellite Organisation
INS inertial navigation system
ISA International Standard Atmosphere
kHz
km
kt
kilohertz
kilometre( s
knot(s)
LCD
LCZ
LED
LF
LI
LLZ
LOC
LMM
LOM
LORAN
L/R
LUHF
liquid crystal display
ILS localiser
light emitting diode
low frequency
lane identification
localiser
localiser
locator middle marker
locator outer marker
long range aid to navigation
left/right
lowest usable high frequency
m
MF
MHz
min
MKR
MLS
MM
MN
MP
mph
m/sec
MU
metre(s)
medium frequency
megahertz
minute(s)
marker
microwave landing system
middle marker
magnetic north
multipulse
miles per hour
metres per second
management unit
(M)

8/10/2019 Gsp Vol i Radio Aids
http://slidepdf.com/reader/full/gsp-vol-i-radio-aids 227/232
Glossary of Abbreviations
239
MUF
I.Ls
maximum usable frequency
microsecond(s)
NDB
nm
nondirectional radio beacon
nautical mile(s)
OBS
OCL
OM
omnibearing selector
obstacle clearance limit
outer marker
°p
PAR
PFD
PPI
pps
PRF
PRI
P-RNA V
PRP
PRR
degrees port
precision approach radar
primary flight display
plan position indicator
pulses per second
pulse recurrence frequency
pulse recurrence interval
precision area navigation
pulse recurrence period
pulse recurrence rate
QDL
QDM
QDR
QE
QGH
QTE
QTF
series of bearings
aircraft's magnetic heading to steer in zero wind to reach the
station
magnetic bearing from the station
quadrantal error
landing procedure clearance
true bearing from the station
request position fix
oR
RA
RAD
REI
rei
Rei Erg
RF
RMI
RNAV
ROD
RTF
RVR
RW/RWY
Rx
degrees relative
radio altitude/resolution advisory (in TCAS)
approach surveillance radar
relative bearing indicator
relative
relative bearing
radio frequency
radio magnetic indicator
area navigation
rate of descent
radiotelephony
runway visual range
runway
receiver
as
SATCOM
degrees starboard
satellite communication
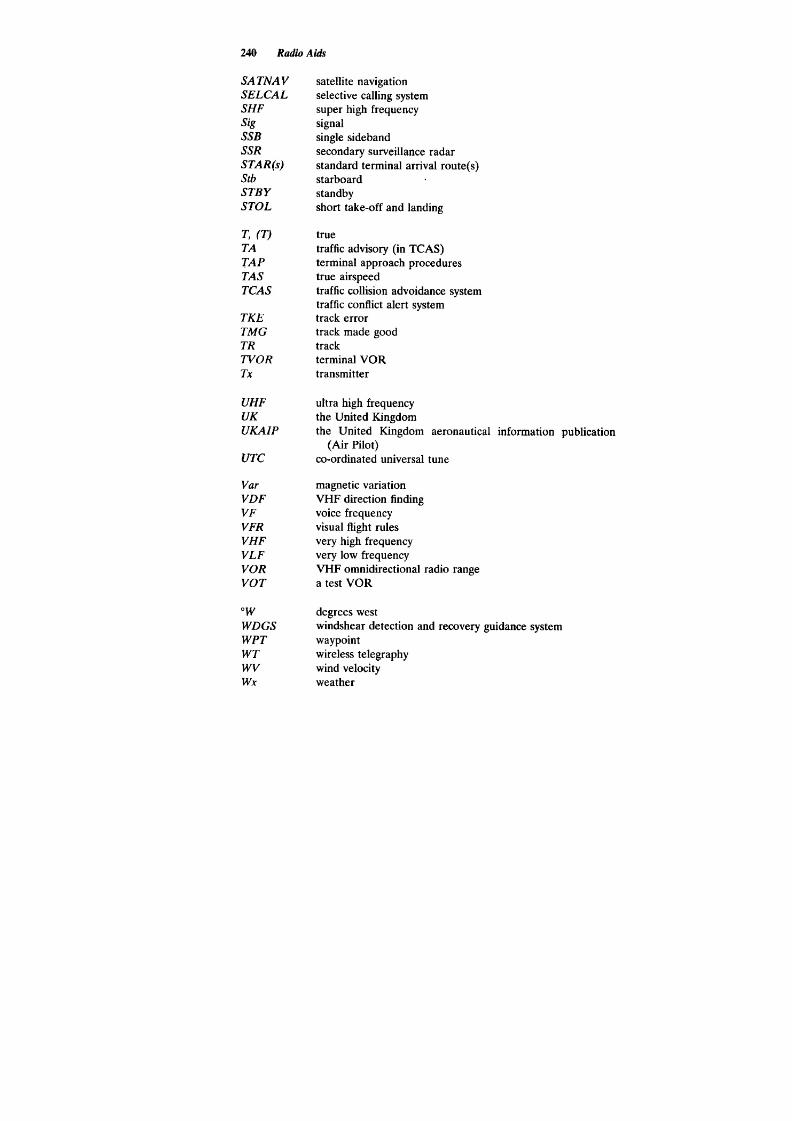
8/10/2019 Gsp Vol i Radio Aids
http://slidepdf.com/reader/full/gsp-vol-i-radio-aids 228/232
240
Radio Aids
SATNAV
SELCAL
SHF
Sig
SSB
SSR
STAR(s)
Stb
STBY
STOL
satellite navigation
selective calling system
super high frequency
signal
single sideband
secondary surveillance radar
standard terminal arrival route(s)
starboard
standby
short take-off and landing
T, (T)
TA
TAP
TAS
TCAS
TKE
TMG
TR
TVOR
Tx
true
traffic advisory (in TCAS)
terminal approach procedures
true airspeed
traffic collision advoidance system
traffic conflict alert system
track error
track made good
track
terminal VOR
transmitter
UHF
UK
UKAIP
UTC
ultra high frequency
the United Kingdom
the United Kingdom aeronautical information publication
(Air Pilot)
co-ordinated universal tune
Var
VDF
VF
VFR
VHF
VLF
VOR
VOT
magnetic variation
VHF direction finding
voice frequency
visual flight rules
very high frequency
very low frequency
VHF omnidirectional radio range
a test VOR
OW
WDGS
WPT
WT
WV
Wx
degrees west
windshear detection and recovery guidance system
waypoint
wireless telegraphy
wind velocity
weather

8/10/2019 Gsp Vol i Radio Aids
http://slidepdf.com/reader/full/gsp-vol-i-radio-aids 229/232
Chapter 1
Qll (b), Q12 (a), Q13 (a), Q14 (c), Q15 (b).
Chapter 2
Qll (c), Q12 (b), Q13 (c), Q14 (b), Q15 (c).
Chapter 3
Q3 (b), Q4 (b), Q5 (c), Q6 (b), Q7 (c), Q8 (b), Q9 (a), QI0 (b).
Chapter 4
Ql (b), Q2 (c), Q3 (b), Q4 (c), Q5 (a).
Chapter 5
Qll (a), Q12 (a), Q13 (c), Q14 (c), Q15 (a).
Chapter 10
Q4 (b), Q5 (c), Q6 (b), Q7 (c), Q8 (a), Q9 (b), QI0 (a).
Chapter 13
Q3 (b), Q4 (c), Q5 (a), Q6 (a), Q7 (b), Q8 (c), Q9 (a), QI0 (b).
Chapter 14
Ql (b), Q2 (a), Q3 (b), Q4 (b), Q5 (b).
Chapter 17
Ql (c), Q2 (b), Q3 (a), Q4 (a), Q5 (b).
Chapter 19
Ql (a), Q2 (c), Q3 (b), Q4 (a), Q5 (a).
Chapter 20
Ql (c), Q2 (c), Q3 (b), Q4 (a), Q5 (a), Q6 (a), Q7 (c), Q8 (a), Q9 (a),
QI0 (c).
Chapter 21
Ql (b), Q2 (a), Q3 (b), Q4 (b), Q5 (a), Q6 (c), Q7 (a), Q8 (a), Q9 (b),
QI0 (c).

8/10/2019 Gsp Vol i Radio Aids
http://slidepdf.com/reader/full/gsp-vol-i-radio-aids 230/232
lane identification, 209
range and accuracy, 213
decision height indicator, 171
differential correction (GPS), 226
distance measuring equipment (DME),
132-41
Doppler, 180-96
aircraft aerial systems, 183, 187
DF,195
drift measurement, 185
errors, 194
frequencies, 180
setting up, 189
up-dating, 194
VORs, 89-91, 195
duct propagation, 29
emission, types of, 12, 53
abbreviations, 236-40
ADF (see automatic direction finding)
airborne collision avoidance system
(ACAS), 230
airborne weather radar (A WR), 156-68
aircraft communications addressing and
reporting system (ACARS), 40
altimeter, radio, 169-73
amplitude, 2
amplitude modulation, 9
angle of lead, 63
anode system, 128
anomalous propagation, 29
area navigation, 141
attenuation, 19,32
automatic altitude telemetering, 146
automatic direction finding (ADF),
48-71
range and accuracy, 64-67
use of, 56
beacon saturation, 139
bearings, classification of, 45
beat frequency oscillator (BFO), 55
beat note, 55
BFO (see beat frequency oscillator)
fading,27
fan markers, 118
flight management system, 143
flyback,130
flyback voltage, 130
frequency,2
frequency modulation, 10
frequency pairing, 111
fruiting, 147ardioid, 50
categories (ILS), 112
cathode ray tube, 127
clock bias, 224
cloud warning radar, 156-68
coastal refraction, 65
coding delay, 199
colour weather radar, .63
communications, 36-43
comparison frequency, 205
cone of confusion, 83
cone of no bearing, 45
cosecant beam, 158
critical angle, 24
garbling, 147
GCA (see ground controlled approach)
global navigation satellite system
(GNSS), 221
global orbiting navigation satellite system
(GLONASS), 222
global positioning system (GPS), 221
grass, 131
ground conductivity (VLF), 218
ground DF, 44, 195
ground proximity warning system
(GPWS),174-179
ground radars, 151-5
ground waves, 18, 28
hand-held microphones, 42
harmonics, 205
height ring, 166
hertz. 2
data-Iink, 148
dead space, 25
Decca,202-215
chart, 204
comparison frequency, 205
errors,213

8/10/2019 Gsp Vol i Radio Aids
http://slidepdf.com/reader/full/gsp-vol-i-radio-aids 231/232
243
ndex
holding patterns, 60
homing, 57,81-3,96-8
hyperbolic systems, 197-201,204
OBS (see omni-bearing selector)
Omega,216-20
omni-bearing selector, 77
one in sixty rule, 88, 99
optical distance, 28, 29
oscillator, 16
ICAO operational performance
categories, 112
ILS (see nstrument landing system)
instrument landing system, 102-118
facility performance categories, 112
false glide path, 114
frequencies, 110
glide path transmitter, 104
localiser transmitter, 102
marker beacons, 108
inversion, 29
ionisation,22
ionosphere,21
iso-echo display, 163
Janus aerial, 187
pennittivity, relative (e), 29
phase, 5
polar diagram, 8
polarisation, 7
precision approach radar (PAR), 151
precision instrument runway, 102
primary radar, 121
propagation anomaly, 29,218
protection range, 66, 86, 87
protection ratio, 66
protective altitude, 66, 86, 87
proximate traffic, 232
pulse, 120
pulse modulation altimeters, 172
pulse recurrence frequency, 120
pulse recurrence period, 120
keying, 9
lane identification, 209,218
legislation (radio), 41
limacon, 74
lock-follow,134
loop, 48, 68
Loran,199-201
accuracy, 201
operation, 200
QDL, QDM, QDR, QTE, QTF, QUJ,
44
QGH, 46
q11adrantal error, 68
mapping radar, 157-60, 165
marker beacons, 108
memory, 191
microphones, hand-held, 42
microsecond, 119
microwave landing system (MLS),
116-18
millisecond, 119
modes, 142, 176
mode S, 148
modulation,8-12
modulator, 16
mu1ti-hop refraction, 26
radar
airborne weather, 156-68
anode system, 128
basic,119-31
cloud warning, 156-68
ground,151
iso-echo display, 163
primary, 121
secondary, 126
radial, 75
radio altimeter, 169-73
pulse modulation type, 172
radio magnetic indicator (RMI), 92-101
radio waves, 1-35
amplitude modulation, 9
duct propagation, 29
frequency modulation, 10
ground wave, 18, 28
modulation,8-12
phase,5
propagation, I, 16-35
skywave, 21
space wave, 28
theory of propagation, I, 16-35
reference point (ILS), III
refraction, 22, 65
NDBs (see non-directional beacons)
night effect, 65
noise, 31,52,69
non-directiona1 beacons, 48- 71
factors affecting range, 52, 64
frequency band, 53
letdown,62
rated coverage, 52
types of emission, 12

8/10/2019 Gsp Vol i Radio Aids
http://slidepdf.com/reader/full/gsp-vol-i-radio-aids 232/232
Index
44
transmitter, 16
transponder, 132, 145
tropospheric scatter, 27
retraction, multi-hop, 26
relative permittivity, 29
resolution advisory, 230
R-Nav (see area navigation)
up-dating Doppler, 194
very low frequency (VLF) systems,
219-20
VHF omni-directional radio range,
72-91
aggregate errors, 87
bearings, 83
designated operational coverage
satcom,41
satellite navigation, 221-9
saw-tooth voltage, 130
secondary radar, 126
secondary surveillance radar (SSR), 39,
145-50
selcal, 39
selective availability (SA), 223, 226