
GSeries5 Pilot's Guide - Insight Avionics
40
G SERIES PILOT’S GUIDE . INSIGHT INSTRUMENT CORPORATION BOX 122, FORT ERIE, ONTARIO, L2A 5M6 1 PILOT’S GUIDE FOR INSIGHT G SERIES SOFTWARE VERSION 284 & UP FOR G2 & G3 SOFTWARE VERSION 159 & UP FOR G4 SINGLE & G4 TWIN Instrument Corp. PLEASE READ INSTRUCTIONS COMPLETELY BEFORE PROCEEDING
Transcript of GSeries5 Pilot's Guide - Insight Avionics

G SERIES PILOT’S GUIDE .
INSIGHT INSTRUMENT CORPORATION BOX 122, FORT ERIE, ONTARIO, L2A 5M6 1
PILOT’S GUIDEFOR INSIGHT G SERIES
SOFTWARE VERSION 284 & UP FOR G2 & G3 SOFTWARE VERSION 159 & UP FOR G4 SINGLE & G4 TWIN
Instrument Corp.
PLEASE READ INSTRUCTIONSCOMPLETELY
BEFORE PROCEEDING

G SERIES PILOT’S GUIDE .
INSIGHT INSTRUMENT CORPORATION BOX 122, FORT ERIE, ONTARIO, L2A 5M6 2
Table Of Contents 1
Cover ..........................................................................................................................................................1Index .......................................................................................................................................................... 2Index .......................................................................................................................................................... 3Warranty and Service ................................................................................................................................ 4Technical Support ...................................................................................................................................... 4G3-4 Pages & Functions ............................................................................................................................ 4Guide To The G3-4 Screens ....................................................................................................................... 5G Series Comparison Chart ...................................................................................................................... 6G1 Color Graphic Engine Monitor ............................................................................................................. 7G1 Screens in Order .................................................................................................................................. 8G2 Color Graphic Engine Monitor ............................................................................................................. 7G2 Screens in Order .................................................................................................................................. 9G3 Color Graphic Engine Monitor ........................................................................................................... 10G3 Series Introduction ............................................................................................................................. 11G3 Screens in Order ................................................................................................................................ 12G4 Series Introduction ............................................................................................................................. 13First Flight With The G3-4 .............................................................................................................................. 14
Using G3-4 on the Ground .................................................................................................................. 15-16Using G3-4 on Take-Off ............................................................................................................................ 16Leaning for Take-Off ................................................................................................................................ 16A New Approach To Engine Management ............................................................................................... 17
Fundamentals Of EGT ............................................................................................................................. 17Principles Of EGT Mearsurement ............................................................................................................ 17Principles Of CHT .................................................................................................................................... 17
Configuration Screens ............................................................................................................................. 18
REGISTRATION CONFIGURATION ...................................................................................... 18 GENERAL INFORMATION.........................................................................................................18 ENGINE CONFIGURATION ....................................................................................................... 18 CLOCK / CALENDER ................................................................................................................. 18 K-FACTOR INITIALIZATION ....................................................................................................... 18 MISC CONFIGURATION ........................................................................................................... 18 Fahrenheit or Celsius ................................................................................................................. 18
G3-4 Operating Procedure ....................................................................................................................... 19Main Screen Description ........................................................................................................................ 19G3-4 Lean Screens ................................................................................................................................... 20Setting the Peak Detect Threshold .......................................................................................................... 21Restarting the Leaning Process .............................................................................................................. 21

G SERIES PILOT’S GUIDE .
INSIGHT INSTRUMENT CORPORATION BOX 122, FORT ERIE, ONTARIO, L2A 5M6 3
Table Of Contents 2
Leaning in Cruise ...................................................................................................................................... 22Leaning Normally Aspirated Engines in Climb .......................................................................................... 22Leaning the Engine in Cruise Leaning without Lean Mode ....................................................................... 22Leaning by Turbine Inlet Temperature ...................................................................................................... 22Leaning Restrictions ............................................................................................................................ 22-23Importance of Measuring Turbine Inlet Temperature ................................................................................ 23Special Considerations for Turbos ....................................................................................................... 23-24Special Considerations for Twins .............................................................................................................. 24 G3-4 Monitoring ........................................................................................................................................ 25
G3 MONITORING - Bar-Graph Display Screen .......................................................................... 25 PROBE DIAGNOSTIC - Screen .................................................................................................. 26 PERIODIC TEMPERATURE - Variation Screen .......................................................................... 27 VIBRATION SPECTRUM - Engine Vibration Screen .............................................................. 27-28 TAKE-OFF PERFORMANCE - Take-off Screen .......................................................................... 29 2-AXIS G-LOAD - Turbulence Screen ......................................................................................... 29 LIVE DYNAMIC G-Force Screen ............................................................................................... 30 THEORETICAL - Horsepower Screen ......................................................................................... 31 AUTO RANGE - Capability On The User Configuration Screen .......................................................... 32-34
Using the knobs to navigate the G3-4: .......................................................................................... 32 Setting up the G3-4 Temperature Bargraph Display: .................................................................... 32 Using the Auto Range function (Method 1): ................................................................................. 32 To save the results of auto ranging: ............................................................................................. 33 Setting up the G3-4 Temperature Bargraph display manually (Method 2): ................................... 33 AUTORANGE INFLECTION and EGT MAX TEMPERATURE explained: .................................. 33 EGT Smoothing: ............................................................................................................................34 Adjusting the bar heights from the main screen (Method 3): ....................................................... 34
FUEL FUNCTION - Screens ................................................................................................................ 35-38
ADJUST K-FACTOR - On G3-4 ................................................................................................... 36 SETUP GARMIN 400/500 For Fuel Display: ............................................................................... 36 CONFIGURING - Engine Fuel System ................................................................................... 37-38 Using the knobs to navigate the G3-4: .......................................................................................... 37 Configuring the Fuel System Type: .............................................................................................. 38
DATA-LOGGING .................................................................................................................................. 39-40
MARK AN EVENT ........................................................................................................................ 39 Introduction to Data-Logging ........................................................................................................ 40 Flight File Open In Excel .............................................................................................................. 40

G SERIES PILOT’S GUIDE .
INSIGHT INSTRUMENT CORPORATION BOX 122, FORT ERIE, ONTARIO, L2A 5M6 4
Warranty and Service
The Insight Instrument Corporation 610C Graphic Engine Monitor system (G3-4) is warranted against defects in materials and workmanship for two years from date of purchase. Insight temperature probes are warranted for one year or 1000 hours which ever comes first. Insight will at its option repair or replace without charge those products that it finds defective. Insight will not be responsible for repairs required by improper installation, unauthorized maintenance or abuse. No other warranty is expressed or implied. Insight is not liable for consequential damages.
Technical Support
If you have difficulty installing or using a GSeries system, please read the documentation. Every GSeries system is shipped with complete instructions for installation and use. The answers to many technical questions can be found in this booklet, or the GSeries Installation Manual. Insight provides customer support free of charge for as long as you own the instrument. If you have any questions concerning GSeries operation do not hesitate to call.
The Customer Service department accepts calls Monday through Friday between 9 am and 5 pm EST. Be sure to have your in-strument model number and serial number(s) ready when you call.
Insight Start Splash Screen
G Series Pages & Functions Turned On:
G1-2-3-4 YES Main ScreenG2-3-4 YES Lean of Peak ScreenG2-3-4 YES Rich of Peak ScreenG1 YES Lean Screen (Basic)G1-2-3-4 YES Probe Diagnostic ScreenG3-4 YES Temperature Variation ScreenG3-4 YES Vibration Analysis ScreenG3-4 YES Take-Off G Force ScreenG3-4 YES Two Axis Turbulance ScreenG3-4 YES Live Dynamic G-Force ScreenG3-4 YES Last Triggered Snapshot ScreenG3-4 YES Theoretical Horsepower ScreenG3-4 YES TAS-1000 Air Data ScreenG2-3-4 YES User Configuration ScreenG2-3-4 YES Fuel Onboard Screen
Insight Start Splash Screen

G SERIES PILOT’S GUIDE .
INSIGHT INSTRUMENT CORPORATION BOX 122, FORT ERIE, ONTARIO, L2A 5M6 5
Guide To The G Series Screens
The instrument has two control knobs that operate combination rotary and push button switches. The top knob in general controls screen selection while the bottom knob controls items within the given screen. Each screen assigns its own functional needs to the controls that may change depending on context. A screen may also label the controls with guidance information like “Push to exit”.
Some of the many revolutionary new features of the G3-4 system include:
Engine vibration measurement and analysis.Specific functionality for safe Lean of Peak operation with no detonationOil Temperature and PressureManifold Pressure, Fuel Flow and RPMOATCarburetor and Alternator TemperatureBuss Voltage
Specialized analysis for propeller balance, turbulence and even landing shock.Integrates and logs data from G3-4, TAS Air Data and GPS for the complete picture.SD Card stores all engine, air, winds aloft and fuel data (No more lost data).Entire aircraft life history directly on SD card in PC compatible form.
NOTE: To check brightness use incandescent light source to shine on GSeries instrument face.LED and fluorescent will not work because of the lack of infrared in beam.

G SERIES PILOT’S GUIDE .
INSIGHT INSTRUMENT CORPORATION BOX 122, FORT ERIE, ONTARIO, L2A 5M6 6
G SERIES PILOT’S GUIDE .
INSIGHT INSTRUMENT CORPORATION BOX 122, FORT ERIE, ONTARIO, L2A 5M6 7
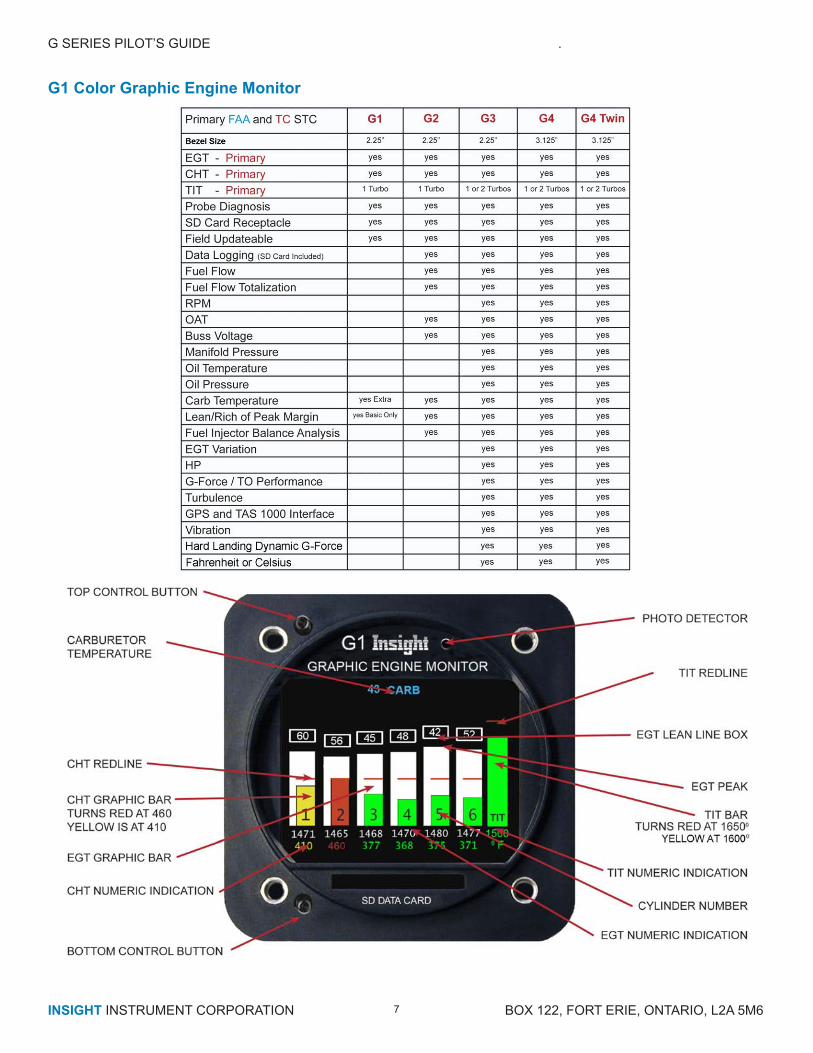
G1 Color Graphic Engine Monitor

G SERIES PILOT’S GUIDE .
INSIGHT INSTRUMENT CORPORATION BOX 122, FORT ERIE, ONTARIO, L2A 5M6 8
G1 Screens In Order
1 - Main Screen
3 - Probe Diagnostic Screen
2 - Lean Screen

G SERIES PILOT’S GUIDE .
INSIGHT INSTRUMENT CORPORATION BOX 122, FORT ERIE, ONTARIO, L2A 5M6 9
G2 Color Graphic Engine Monitor

G SERIES PILOT’S GUIDE .
INSIGHT INSTRUMENT CORPORATION BOX 122, FORT ERIE, ONTARIO, L2A 5M6 10
G2 Screens In Order
1 - Main Screen
3 - Probe Diagnostic Screen
2 - Lean Screen
4 - User Configuration Screen
5 - Enter Total Fuel Screen(Defaults to fuel function screen when total fuel is set)
6 - Fuel Function Screen

G SERIES PILOT’S GUIDE .
INSIGHT INSTRUMENT CORPORATION BOX 122, FORT ERIE, ONTARIO, L2A 5M6 11
G3 Series Introduction
Insight’s 610C Graphic Engine Monitor (G3) colour-coded bar graph and digital values may be Primary for EGT, CHT and TIT.
All other data shown in cyan at the top of display are to be supplementary.
Traditional multi-cylinder exhaust gas and cylinder head temperature systems that force the pilot to switch or scan an indica-tor from cylinder to cylinder in search of critical engine data, are long obsolete. Using the latest computer technology, the G3 presents a clear, concise, graphic picture of all engine temperatures simulta-neously for interpretation at a glance. Never before has so much engine diagnostic information been available to the pilot and never before, has the pilot been able to control mixture with such ease and precision for peak fuel efficiency.
Insight’s latest G3 automatically records flight temperature and will also interface with other data sources and report infor-mation to other instruments like MFD’s. The data-log files stored on the SD card can be easily retrieved by the pilot, in-flight or post-flight, for instant viewing or permanent record-keeping.

G SERIES PILOT’S GUIDE .
INSIGHT INSTRUMENT CORPORATION BOX 122, FORT ERIE, ONTARIO, L2A 5M6 12
G3 and G4 Screens In Order
1 - Main Screen 2 - Probe Diagnostic Screen 3 - EGT Periodic Temperature Variation Screen
4 - Engine Vibration Screen
5 - Take-Off Performance Screen 6 - Turbulence Screen 7 - Theoretical Horsepower Screen
11 - User Configuration Screen
(Defaults to fuel function screen when total fuel is set)
13 - Fuel Function Screen
9 - Dynamic G-Force Screen 10 - Dynamic Snapshot Screen
8 - Air Data Screen
12 - Enter Total Fuel Screen
A G4 single is exactly the same as a G3 only with a bigger display and different knob locations!

G SERIES PILOT’S GUIDE .
INSIGHT INSTRUMENT CORPORATION BOX 122, FORT ERIE, ONTARIO, L2A 5M6 13
Insight Instrument Corporation has developed a slightly bigger derivative of the G3 called the G4.
This derivate, P/N 1200C-001, designated as G4 model, will replace Insight’s earlier twin-engine GEMINI 1200 instruments. The G4 can be configured as a single (G4-001) or twin-engine (G4-002) instrument. Its function list matches the approved model G3 functions.
The G4 single/twin-engine display functionality is possible by using a slightly bigger LCD and housing. The G4 utilizes the same technology for housing, bezel, circuit boards, connectors, display and electronic components (including circuit protection devices) as the already approved G3. Its PCB is populated slightly more to accommodate additional temperature sensors.The G3 software was designed so that it can be configured for either single or twin-engine installations. Therefore, the G4 software is unchanged. The only minor modification was required for a different LCD driver.
The G4 environmental qualification consisted of a subset of DO-160 testing (Temperature/Altitude, Temperature Variation, Vibration), as most of the G3 test results are applicable to G4 by similarity.
G4 Series Introduction
NOTE: All pages and function on G4 are the same as G3

G SERIES PILOT’S GUIDE .
INSIGHT INSTRUMENT CORPORATION BOX 122, FORT ERIE, ONTARIO, L2A 5M6 14
First Flight With The G3-4
Now that the day is finally here for you to fire up your new G3-4 and take it for a flight you are probably eager to explore all the new functions. Before you take that first flight a few minutes should be invested to check the installation of the instru-ment. We recommend you read through this section once first before stepping into the cockpit.
With the avionics turned on, the G3-4 will power up and present its title screen. During this period the user may press and hold the top button to enter configuration mode if desired. Most of the configuration is pre-entered for you at the factory or by your installer, but you may wish to double-check or adjust these parameters. After the G3-4 is configured cycle the avi-onics to reboot the instrument into its normal operating mode. After the title screen is displayed for a few seconds the main temperature bargraph display appears.
Have a look at the voltage reading: it should show the battery voltage of your aircraft. The manifold pressure should indi-cate the ambient pressure, the OAT should be indicated and the digital numbers at the bottoms of the temperature columns should show the temperature under the cowling. All other indications should show 0.
Start the engine and allow it to idle. The RPM, fuel flow, oil pressure, and manifold pressure indications should come to life and match the ships gauges. The voltage indicator will now be showing an increase in voltage owed to the charging system. The digital temperature indications will immediately begin to increase, although it will take a little while for the CHT bars to climb due to the thermal mass of the cylinders. Likewise, EGT columns may not appear until the throttle is advanced to fast-idle.
If you want you can turn to the Fuel Onboard screen and tell the G3-4 how much fuel is onboard. After you do be sure to select Save and Exit at the bottom of the screen. This will allow you to observe the Fuel Totalizing functions. Return to the main temperature bargraph screen before proceeding.
If all looks well prepare to do your run-up. The G3-4 comes from the factory already set up and ready to go right out of the box. We have preset the EGT bar heights to accommodate a range of EGT temperatures that is appropriate for an average user’s engine. But what if you have a turbo-boosted engine that runs hotter than average, or you were forced by mechanical clearances to put the EGT probes further down the exhaust tubes than you would have liked which leads to lower reported EGT readings? The factory settings for EGT heights may then be inappropriate for your airplane.
It’s no problem for the versatile G3-4. A few quick clicks and turns of the bottom knob on your first flight will allow you to tailor the height of the EGT columns to the actual temperatures reported by the probes. The G3-4 can even do the job automati-cally by using the “Auto-range” functionality. Refer to the Section on “Adjusting EGT bar height” for details on how to adjust the columns.
After taking off and reaching cruise altitude you will get your first opportunity to try the special lean mode functions. The new lean mode is easier than ever to use and tells you exactly how far the EGT’s have dropped since they peaked, whether you are on the rich or lean side of peak, and what the fuel flow was during the peak. To reset the lean mode and start again just press and hold the bottom button. Remember to always begin well rich of peak EGT or you will not get a true indication of where peak is. A more complete description of the leaning process may be found in the “Description of Main Screen” section of this document.
Flip through the various pages of information available using the top knob. Observe your 2-Axis Turbulence measurements, your Theoretical Horsepower (which also shows your Oil Temperature and Oil Pressure), and your Fuel Totalizing screen. This will give you an idea what the G3-4 can do for you once you are more familiar with it. The Probe Diagnositics screen is always available to help keep tabs on the health of your temperature probes. Refer to the various discussions of the indi-vidual screens throughout this document for more in-depth information.
It’s easy to get overwhelmed by the wealth of information available to you, but don’t forget it is all being recorded on the SD Card for later review, so you don’t have to learn everything all at once. In addition, at any time you can press and hold the top knob to place a bookmark on your log file. These bookmarks, sorted numerically, will allow you quickly scan your log file and go directly to the point in the log you were interested in when you placed it. It’s a valuable tool that you can use as often as you like.

G SERIES PILOT’S GUIDE .
INSIGHT INSTRUMENT CORPORATION BOX 122, FORT ERIE, ONTARIO, L2A 5M6 15
After you have returned to the airport and shut down after your first G3-4 test flight, we recommend you remove the SD Card and examine the data log using your favorite spreadsheet program. If you didn’t get a chance to set your EGT bar heights as discussed earlier, you will get a good idea where it should be set for next time by looking at the EGT columns.
Using G3-4 On The Ground
The temperature range of the G3-4 extends lower than most traditional EGT systems to include temperatures normally en-countered at start-up. Under normal engine operation at 1,000 to 1,200 rpm, the G3 will produce a white bar EGT indication for each cylinder. The precise indication will vary from one installation to another, and it is not unusual to observe fairly large EGT differentials between cylinders at idle or taxi power settings.
One very useful feature of the G3-4 is its ability to detect abnormal combustion during the pre-take-off run-up. The primary purpose of the pre-take-off engine run-up is to verify the airworthiness of the engine’s ignition system, plus carburetor heat and propeller control. Pilots without extensive engine instrumentation are accustomed to detecting engine and/ or ignition problems by an rpm drop or roughness during the run-up.
With the G3-4 a much more accurate diagnosis of problems is possible.
As you run your engine up to 1,700 or 1,800 rpm (or as recommended in your aircraft’s Pilot’s Operating Handbook), you will observe a rise in EGT for all cylinders, to about one third of full scale. Normally, these indications will vary somewhat from cylinder to cylinder. The G3-4 should be carefully observed during the magneto check. Combustion is initiated by two spark plugs firing simultaneously in each cylinder. Under single mag operation, only one plug is firing, producing only one flame front in the combustion chamber, resulting in a slower, more prolonged combustion. This places the point of peak combustion pressure later in the power stroke and the tachometer will register a drop of 50 to 150 rpm. Since the exhaust gases have less time to cool before being expelled from the cylinder, the exhaust gas tempera-tures of all cylinders should rise. (50 to 100° F).Various problems can be detected easily during run-up with the aid of the G3-4. The absence of an rpm drop or EGT rise on single-mag operation indicates trouble in the form of a hot mag or defective ignition switch. A more common indication of trouble is the total disappearance of an EGT indication for one or more cylinders after switch-ing to single-mag operation, indicating a faulty ignition wire or spark plug. If the affected cylinder returns to a normal EGT indication when operating on the other magneto, you have isolated the problem to a single spark plug (or lead) in a single cylinder.
In the absence of adequate engine instrumentation, the initial diagnosis of fouled spark plugs is usually made on the basis of a greater rpm drop for one mag than the other. Manufacturers’ handbooks generally warn the pilot to regard any difference of more than 50 rpm between mags as suspicious. But it is important to note that an rpm drop will register only if more plugs are fouling on one mag than on the other. If each magneto harness harbors one bad plug or lead this would cause a uniform mag drop and the double fault would go completely undetected. On the other hand, an entirely different malfunction such as a partially plugged injector could create the same symptoms. Careful analysis of G3-4 data can help a pilot determine the precise cause of mag drop, or pinpoint problems hidden behind a uniform mag drop. In both cases cited above, the G3-4 would indicate higher EGTs for the affected cylinders.
Run-up is also a good time to check carburetor heat (if present) and mixture control. Application of carburetor heat causes a reduction in the density (and therefore oxygen content by volume) of air coming into the engine, inducing an over-rich condition. This is indicated by a noticeable drop in engine rpm and exhaust gas temperature. If the application of the carburetor heat control fails to produce these effects, it is likely that the carb heat control is mis-rigged, causing the airbox flapper valve to hang open and allowing hot air to leak into the carburetor on a full-time basis.
This should be remedied as soon as possible.

G SERIES PILOT’S GUIDE .
INSIGHT INSTRUMENT CORPORATION BOX 122, FORT ERIE, ONTARIO, L2A 5M6 16
During the mixture check, a uniform rise of EGT indications for all cylinders will confirm that the mixture control is functioning correctly. The amount of temperature rise will depend on the degree of mixture control movement. Each cylinder should show a rise in EGT upon leaning. Failure of a cylinder to show a significant rise, or an abnormally large EGT differential between cylinders in fuel injected engines, may indicate a fuel injector nozzle constriction. In many engines, a large inter-cylinder EGT spread is normal at low power settings (even with fuel injection) so a diagnosis of this type is impractical until the pilot becomes thoroughly familiar with the normal indications for his or her engine. Even so, this type of diagnosis, easily made with the G3, is virtually impossible with other EGT systems.
Using G3-4 On Take-off
The G3-4 can be used during takeoff to identify a very serious class of combustion problems that can result from poor fuel distribution at take-off power settings.
The combustion phenomenon known as pre-ignition can do extensive damage in a matter of a few seconds if left unat-tended. This combustion process produces abnormally high temperatures in the combustion chamber which results in im-mediate full-scale EGT indications followed by a rise in cylinder head temperatures. Should this type of indication occur during the takeoff roll, the takeoff should be aborted. If takeoff has proceeded beyond the point of no return, power should be reduced immediately (maintaining flight) and the mixture enriched if possible to make the temperature drop in the affected cylinder(s). A precautionary landing should be made as soon feasible. Pre-ignition can be caused by red-hot cylinder deposits or overheated exhaust valves. Regardless of cause, pre-ignition, once started, causes an extreme temperature rise in the combustion chamber and is self-sustaining until engine failure occurs (often in a few seconds). Broken connecting rods, melted pistons, and cylinder head separation are among the common pre-ignition induced failures. A second type of pre-ignition that does not fit the previous definition is magneto induced pre-ignition. It results from extreme timing errors in magneto adjustment or failure of the magneto itself.
Detonation in automobiles is commonly referred to as ping or knock. It is an unusually rapid form of combustion that follows ignition induced combustion and is caused by high compression, high temperatures and a lean mixture. The rapid combustion of detonation is significantly advanced by the time the exhaust valve opens and the temperature encountered by the EGT probe is lower than normal. Detonation results in higher peak combustion temperatures and pres-sures which translate into higher CHT’s and lower EGT’s. More importantly, detonation imposes significantly greater stress on the engine components than normal operation. It may be caused by excessively lean operation at high power settings because of fuel system malfunctions, injector nozzle constrictions, improper mixture control settings, insufficient fuel octane or avgas contaminated by jet fuel.
Leaning for Take-off
Leaning normally aspirated engines for takeoff is advisable for best performance under high density altitude conditions and this is something that can be done with confidence and accuracy with the G3-4. Remember that the full-throttle, full rich-mixture setting is designed to provide an enriched fuel flow for proper engine cooling during takeoff at sea level on a standard day. This over-richness is a FAA-mandated minimum of 12% above the worst case detonation-onset fuel flow.
With increasing density altitude, this over-richness robs your engine of power. Leaning on a high altitude takeoff can restore a significant amount of power and add measurably to aircraft performance. Consult the Pilot’s Operating Handbook for the airplane manufacturer’s recommended high altitude takeoff procedures. On some aircraft equipped with fuel flow gauges, the full-power altitude reference marks indicate acceptable fuel flows for various altitudes (typical reference marks are S.L., 3000, 5000, 7000).
Sometimes a specific temperature (eg. 150° F rich of peak EGT) is specified as the takeoff power mixture guideline.
After some experience with the G3-4 to determine the location of peak EGT, the G3 can be used to set the mixture using this guideline, or (with careful operator technique) to produce the EGT indications similar to a normal sea level takeoff.

G SERIES PILOT’S GUIDE .
INSIGHT INSTRUMENT CORPORATION BOX 122, FORT ERIE, ONTARIO, L2A 5M6 17
A New Approach to Engine Management
The G3-4 is a sophisticated tool for engine management. Its microprocessor performs many tasks that used to be handled by the pilot. One of the basic functions performed by the G3-4 is monitoring exhaust gas temperatures for all cylinders with one degree resolution. What is important is the exhaust gas temperature of a particular cylinder in relation to its peak. But peak EGT is not a constant; it changes with atmospheric conditions, altitude, power setting and engine condition and for this reason absolute exhaust gas temperatures in degrees Fahrenheit are quite meaningless.
The real objective of mixture management is finding a mixture setting which represents the correct position on the EGT/Fuel Flow Curve. As we will see later, this abstract task is easily accomplished by the G3-4’s microprocessor which samples EGT’s for all cylinders many times a second and subjects this data to a complex mathematical analysis that can identify peak. This capability allows the pilot to operate his or her aircraft engine at the most economical mixture settings.
It is generally known that EGT can be a valuable source of information for engine diagnosis and troubleshooting, but there is a great deal of confusion when it comes to interpreting this data. One of the basic principles of EGT engine analysis is that engine temperatures (EGT and CHT) achieve equilibrium in an engine operating at a constant power and mixture setting. What is often overlooked is that this equilibrium cannot be defined as a single point but rather a range of temperatures.
Fundamentals of EGT
The basic ingredients of combustion are fuel, air (oxygen), compression, ignition, and timing. The measurement of Exhaust Gas Temperature (EGT) is really an indication of the harmony of interaction of these ingre-dients. A slight change in any of these five factors will result in noticeable changes in EGT.
The measurement and dynamic analysis of these changes is a very valuable tool for engine management. The use of exhaust gas temperature for mixture control depends on certain characteristics of combustion that are common to all engines. It is generally known that the exhaust gases get hotter as the mixture is leaned. This temperature rise is a sign of increased combustion efficiency as the optimum mixture setting is approached. If the leaning progresses past a certain point, the temperature will begin to drop. This temperature drop is the result of re-duced energy output from the diminished fuel flow.
For a variety of reasons, the best operating mixture for aircraft engines is in the vicinity of this peak. Some high performance engines require slightly more fuel for cooling and run best on the rich side of peak while others are designed for operation on the lean side of peak. The shape and character of this curve is typical for all normally aspirated engines; it is, however, slightly affected by some turbocharger installations.
Principles of EGT Measurement
Exhaust Gas Temperature is measured with a temperature-sensing probe that penetrates the exhaust stack a few inches away from the cylinder. The sensing probe is made from a special alloy designed to provide long term protection for the temperature sensing elements inside. The EGT probes are designed to have a small thermal mass for fastest possible re-sponse, and the manufacturing procedures are tightly controlled to maintain probe calibration to within one degree.In fact, the G3-4 will help you monitor mixture, timing, fuel distribution, compression, oil consumption, and many other subtle engine phenomena. The G3-4 can actually resolve engine phenomena that occur in millionths of a second.
Principles of CHT
The G3-4 is designed to work with three different kinds of probes. The gasket probe replaces one of the spark plug gaskets on a cylinder and is held in contact with the cylinder by the spark plug. The spring-loaded probe screws into the temperature well in the cylinder and its tip is pressed against the cylinder by spring pressure. The third kind of CHT probe is called an adapter probe. It screws into the temperature well, but unlike the spring-loaded type, it allows the factory installed bayonet probe to remain in place.

G SERIES PILOT’S GUIDE .
INSIGHT INSTRUMENT CORPORATION BOX 122, FORT ERIE, ONTARIO, L2A 5M6 18
G3 and G4 Configuration Screens There are SIX configuration screens. The Registration Config, General Information, Engine Configuration, Set Time/Date, K-Factor Initialation and MISC Configuration screens are accessible only on the ground. Setup mode accessed by rebooting instrument with top button held in.
1) REGISTRATION CONFIG - 2) GENERAL INFORMATION - 3) ENGINE CONFIGURATION - 4) SET TIME / DATE - 5) K-FACTOR INITIALATION - 6) MISC CONFIGURATION
Registration screen is for describing aircraft accurately in data logging and also Reset the G23-4 to factory defaults.
Engine Configuration screen is for setting up the engine info so the G23-4 works correctly for that airplane.
Date and Time screen is for entering the correct time and date in data logging.
General Info screen is for raw measurement for diagnostics of the G23-4 only. (Read Only Screen)
K-Factor Initialation screen is for setting up the fuel transducer info so the G2,3-4 fuel flow works correctly for that airplane.
YOUR CONFIGURATION SCREENS MAY OR MAY NOT BE CORRECT DEPENDING HOW THE UNIT WAS PURCHASED AND INSTALLED!
ADJUSTMENT INSTRUCTIONS:Use PG knob to select screenPush SEL to highlight line to yellowTurn SEL to adjust (In red)Push PG to savePush SEL to highlight other linesTurn SEL to adjustPush PG to savePush SEL to highlight down to “SAVE CONFIG”Turn SEL to highlight YES in REDPush SEL to SAVE change
MISC Configuration screen1) Fuel flow GPS interface setting2) Dtnamic G-Force hard landing threshold trigger setting3) Fahrenheit or Celsius
If you have a G3, G4 single, or G4 twin and update to the latest version your temperature measurements will remain in Fahrenheit unless you configure your instrument for Celsius. So if you wish to keep using Fahrenheit do nothing further.

G SERIES PILOT’S GUIDE .
INSIGHT INSTRUMENT CORPORATION BOX 122, FORT ERIE, ONTARIO, L2A 5M6 19
G3-4 Operating Procedure
Since the introduction of the Graphic Engine Monitor in the early 80’s a new leaning procedure has been developed. Once frowned upon, leaning past peak to operate on the lean side in cruise is now widely used to save fuel. Since leaning with reference to temperature was first used in the early 50’s, the distance from peak has also been used to define a mixture setting. The term “75° rich” is universal and means 75 degrees lower than the peak temperature on the rich side. Leaning has always employed a relative number referenced to peak temperature. It is the only consistent metric available because the absolute temperature varies with altitude, power setting and outside air temperature.
The Graphic Engine Monitor (G3-4) is ready to operate the moment electrical power is applied. Within seconds after starting the engine, the white EGT bar graph columns will begin to appear on the G3 display. Each column corresponds to the Exhaust Gas Temperature (EGT) of a cylinder. The lowest exhaust gas temperature that can be displayed by the G3 is 800° F. In some engines, the throttle will have to be opened to the fast idle range to get an EGT indication for all cylinders. As the cylinder heads begin to warm up, the display will indicate Cylinder Head Temperature (CHT) for all cylinders as a smaller green bar in each EGT column. A horizontal red line across each column represents the maximum allowable CHT. Digital numbers below each bar graph column indicates the exact EGT and CHT for each cylinder.
The G3-4 offers a unique new function that facilitates leaning on both the rich and lean side of peak.
In previous generation instruments the peak temperature was used behind the scenes to control flashing of a column to identify peak, but it was never displayed to the user. The new instrument doesn’t display the peak temperature but goes one step further to display the distance from peak on either the rich or lean side. This matches the mind set of pilots since the 50’s so it’s what the pilot really wants to know in first place. Previously the pilot had to remember the bar position and move the mixture to drop a few bars to enrich the mixture. Now the pilot may reference the temperature difference display directly. The temperature difference information is calculated relative to peak EGT so it is only available for display during leaning after peak has been reached. After reaching peak a column width box appears on top of the EGT column containing the temperature difference from peak. The instrument incorporates fuel flow analysis to also determine which side of peak the mixture setting is on. It prefixes the temperature with an R for rich or L for lean. It further distinguishes Rich and Lean by color. The box and number are in white on the lean side and cyan on the rich side. The pilot may decide to operate at a certain temperature delta and tune the mixture until the desired number is in the box. But to make it even easier to operate at a certain predefined temperature difference a user-set threshold is provided. Reach-ing or exceeding this threshold is annunciated by the temperature box changing from hollow to solid filled. Precise leaning to a predetermined setting can be as simple as moving the mixture until all the boxes turn solid.
Main Screen Description
Each cylinder has its own display column that displays both EGT and CHT simultaneously. The columns are numbered with cylinder number. Both temperatures are displayed graphically and numerically. Numbers below the column are color keyed actual temperatures as shown on the bar. CHT is shown in green when in allowable range and then the bar and numeric indication turn red when exceeding the redline limit. A red line also indicates the CHT limit across the bar at the appropriate height. During leaning the EGT column rises pushing the peak indicator above it.
The peak indicator is just a box of column width that remains at the maximum temperature reached during leaning. Once the column drops below peak a new temperature difference numerical indication appears in the box showing the tem-perature difference of the current temperature below the peak. As each cylinder goes just past peak the fuel flow at peak is displayed in black in the top of the column. Ideally all cylinders will peak simultaneously but of course they won’t. The variation in the fuel flow numbers will identify how close they are.
The peak indications may be reset by pushing the bottom knob to re-lean the engine. The top row of indications show RPM, manifold pressure fuel flow, buss voltage, oil pressure and OAT.
NOTE: For leaning instructions always consult the Aircraft’s Operations Hand Book.

G SERIES PILOT’S GUIDE .
INSIGHT INSTRUMENT CORPORATION BOX 122, FORT ERIE, ONTARIO, L2A 5M6 20

G SERIES PILOT’S GUIDE .
INSIGHT INSTRUMENT CORPORATION BOX 122, FORT ERIE, ONTARIO, L2A 5M6 21
Setting The Peak Detect Threshold
The user may set the peak detect threshold anywhere from 0-99 degrees by pushing the lower button twice and then turn-ing the knob to set the desired number. When complete a short push of the bottom button will clear the threshold setting message.
The basic G3-4 cruise-leaning procedure is as follows:
Establish cruise altitude and cruise power. Make initial trim adjustments, etc. as needed to establish cruise.Perform a coarse leaning or preliminary leaning of the engine until the fuel flow is a couple of Gal/hr more than the normal cruise indication. Pause for two minutes to allow the engine to stabilize and cylinder head temperature to return to normal. It is advisable to allow up to five minutes for the turbocharger (if so equipped) to stabilize in output before attempting final leaning. During this time you can make final trim adjustments to the airplane, reset cowl flaps, etc.Press and hold bottom button to reset lean mode.Now slowly lean the mixture until one of the EGT lean boxes appears at the top of the EGT bars. This final leaning should take about five seconds. The first lean box to appear on top of the EGT bars column of bars identi-fies the leanest cylinder (the first to reach peak EGT). Continue leaning until the lean boxes appear on all cylinders. To operate rich of peak, move the mixture control in the rich direction until the boxes show solid cyan with an ‘R’ number inside in black. To operate lean of peak, move the mixture control in the lean direction until the boxes show solid white with an ‘L’ number inside in black.
Note: Engine manufacturers differ in their approval of operation at peak. Lycoming recommends operation at peak for power settings of 75% and less while Continental recommends operation at peak for power settings of 65% and less.
Do not lean to peak EGT power settings greater than those recommended by the manufacturer.
This procedure may not be applicable to all engines. In some aircraft the mixture may be dictated by other parameters.
Restarting The Leaning Process
The use may restart the leaning process and reset the peak indications at any time by pushing and holding the bottom knob for about 3 seconds until the indications disappear. The user should always enrichen the mixture to the rich side of peak and lean from there, for proper detection of peak EGT.
To reset lean function push bottom knob

G SERIES PILOT’S GUIDE .
INSIGHT INSTRUMENT CORPORATION BOX 122, FORT ERIE, ONTARIO, L2A 5M6 22
Leaning in Cruise
The G3-4 is ready for leaning without any user action. If necessary press and hold the bottom button to clear any peak temperature boxes. As the pilot leans the engine the bars will rise then fall leaving a peak temperature box behind. This box will show the distance in degrees from peak and whether the mixture is rich or lean of peak. Temperatures preceded by an ‘L’ eg ‘L47’ are lean of peak while those prefixed with an ‘R’ are rich. In addition to the letter lean setting are displayed in white and rich setting in cyan. The user may set a threshold which is used to trigger the box from being hollow to being solid filled.Should the user wish to operate say 25 degrees lean he/she may set the threshold and lean until all the lean boxes are displayed as filled. This is a simple and easy way to lean correctly and precisely.
Leaning Normally Aspirated Engines in Climb
Most normally aspirated aircraft benefit from mixture leaning during climb with less plug fouling, better engine performance, smoother operation and increased economy. The full throttle, full rich mixture setting is designed to provide an enriched fuel flow for proper engine cooling during takeoff at sea level on a standard day. As the aircraft climbs, the air density decreases causing an effective enrichment of the mixture, eventually robbing the engine of power. Leaning in climb is advisable for best performance and will result in a cleaner engine and easier cruise leaning later on.
After safely clearing the field, observe the location of the tops of the bars on the G3-4. As you ascend, the effective mixture enrichment that results from the decreasing air density causes the EGT reading to fall. Observe one column as a reference. When the reading drops, lean the mixture until the reading goes up, restoring the bar. Repeat this procedure each time the EGT reading drops due to ascent into less dense air to ensure that highest EGT. Aircraft equipped with fuel flow gauges may have altitude reference marks to guide leaning during climb.This procedure for leaning in climb does not apply to turbocharged engines which do not experience the same air density variations due to altitude.
Leaning the Engine in Cruise without Lean Mode
There are occasions when the pilot may wish to lean manually. It is informative on the first G3-4 training flight to lean the engine without Lean Mode to get a feel for the instrument. As you lean, the bars will rise, reach a maximum, and then fall at the onset of engine roughness. If you lean too far the engine will stop. Short flights in high traffic density Terminal Control Airspace (Class B Airspace) demand maximum pilot attention to traffic avoidance. When busy, the pilot may lean quickly by watching the bars rise and stopping when they are still below the normal average indication. This procedure will be within a gallon or two per hour of the optimum mixture setting, and can be used as a tem-porary measure until time permits using the complete leaning procedure described below.
Leaning by Turbine Inlet Temperature
Some turbocharged engines are designed to be leaned by reference to Turbine Inlet Temperature (TIT). This may imply that the TIT is the first temperature to reach redline and is the overall limiting factor in the leaning procedure. Some manufacturers may put a limit on the TIT to increase detonation margins. In general, turbochargers are very much alike and most manufacturers specify a redline of 1650° F. Some operate as high 1750° F. Because indicated temperature is largely dependent on probe placement and exhaust flow, it may not be the same as that experienced by the turbo. Aircraft manufacturers have very likely taken this into account when deciding on the official TIT redline.
Leaning Restrictions
Some aircraft have restrictions on leaning that must be observed. The recommendations of this manual are not intended to supersede any specific requirements for engine operation as stated by the aircraft or engine manufacturer. The pilot should consult the Pilot’s Operating Handbook and follow the manufacturer’s recommendations. These restrictions typically, (but not exclusively) apply to aircraft with marginal cooling airflow at high altitude or high angles of attack or turbocharged engines where concern over turbine inlet temperature, compressor discharge temperature, deto-nation margin, or cylinder head temperature must dictate mixture settings.

G SERIES PILOT’S GUIDE .
INSIGHT INSTRUMENT CORPORATION BOX 122, FORT ERIE, ONTARIO, L2A 5M6 23
There are certain times when you should not lean to peak or even attempt to find peak. In full power climb or any time the engine is operating at power settings in excess of 75%, leaning to peak could result in detonation and serious engine dam-age. This is especially true for high performance engines and turbocharged aircraft.
Importance of Measuring Turbine Inlet Temperature
The measurement of TIT has become popular in recent years with some aircraft coming so equipped right from the fac-tory. Although turbine inlet temperature is an invaluable operating parameter, a great deal of confusion still surrounds TIT indications and their meaning. Turbine inlet temperature is measured by a single probe mounted in the exhaust inlet to the turbocharger. The TIT display shows the temperature of the exhaust gases that drive the turbo. In many cases this probe is just a foot or so downstream of all the EGT probes. At first glance this measurement appears redundant. Why read the temperature again when it is just the collection of all the EGTs? TIT is not a simple function of the collective exhaust gas temperatures. It may be hotter than the hottest EGT that feeds it or cooler than the coolest EGT. The temperature measured by the EGT probe is the average of the pulse of high temperature gases that exit the cylinder when the exhaust valve opens. The TIT probe sees the collection of pulses from all cylinders that feed it and will indicate a higher temperature.
Turbo action is throttled by the wastegate valve that forces a portion of the exhaust gases to bypass the turbo. At low altitude, with little demand for turbo-charging, the wastegate will direct a large part of the exhaust past the turbo and the TIT probe will read a lower temperature. At higher altitudes the wastegate will close to direct more energy to the turbo and a higher TIT will be indicated.TIT is not just a simple function of EGT and this is very important to consider when operating a turbocharged engine. A power setting and fuel flow that may be well below peak EGT and well below the TIT redline temperature at 9000 ft may easily exceed the TIT redline at 16000 ft. The higher temperature results from more exhaust gas driving the turbo to restore the manifold pressure at the higher altitude.The TIT reading is a key factor in leaning the turbocharged engine. It also provides diagnostic information that is unavailable from other sources. A wastegate system malfunction will affect TIT readings under conditions where other indications are normal. Should the wastegate stick closed at high altitude, all indications would appear normal. Subsequent throttle power reductions for descent would show a deceptively normal decrease in manifold pressure but ab-normally high TIT readings for that situation. Other factors such as ignition, fuel distribution, induction, or compression that affect EGT will also affect TIT; sometimes with detrimental results. For example, ignition failures that cause the EGT to rise may increase the TIT past redline.
Special Considerations for Turbos
Turbocharged engines exhibit some special characteristics that result from the interaction of the turbocharger, throttle, wa-stegate controller, and other engine components. These interactions will vary in degree depending on the engine type and installation. In the normally aspirated engine, the components of combustion are essentially fixed for a given throttle and mixture setting. Any mixture control change results in a direct mixture change. The turbo has one additional complication that results from mixture changes:A change in mixture changes the exhaust gas energy that drives the turbo. This change in turbo drive energy changes the induction or manifold pressure and temperature and may or may not be compensated for by the turbo wastegate controller.
The turbo also has significant inertia which causes a lag in response to changes in drive energy. The result of this turbo bootstrapping is a change in the EGT/Fuel Flow Curve depending on the direction of mixture move-ment. This lag must be understood and taken into consideration to properly lean the engine. This change in the curve becomes evident if the pilot tries to enrich the mixture to drop the temperature one bar. In most turbocharged engines it will take considerably more fuel flow to drop the temperature one bar than it did to achieve that temperature on the way up. For example, in a normally aspirated engine, enriching for a 25 degree drop may take a 1/2 gph increase in fuel flow. The same model engine when turbocharged may require a 2-4 gph increase in fuel flow to get the same 25 degree drop. Paradoxically, the pilot may even see EGT rise when he starts enriching before it begins to fall.

G SERIES PILOT’S GUIDE .
INSIGHT INSTRUMENT CORPORATION BOX 122, FORT ERIE, ONTARIO, L2A 5M6 24
Another observable characteristic is that the required fuel flow is dependent on altitude under conditions of constant rpm and manifold pressure. It may seem reasonable that the optimum mixture for a given power setting should remain constant. However, when the turbo compresses the induction air it also increases its temperature and reduces its density.
Although the manifold pressure is restored, the oxygen content of the induction air is reduced because it is a function of air density. It should be remembered that the exact nature of this complex and confusing issue is dependent on the engine and installation. For this reason it is difficult to make generalizations about the leaning characteristics of turbocharged engines, but one thing can be said with certainty: a generous enrichment of the mixture from peak will prolong the life of exhaust valves, the wastegate and the turbocharger itself.
Special Considerations for Twins
Some twin engine aircraft exhibit an unusual mixture control reversal characteristic. We speculatively attribute this to the long flexible cable used to link the cockpit controls with the engine. The phenomenon is easily observed in aircraft with fuel flow gauges. When the pilot pulls back on the mixture controls to lean the engines, fuel flow is reduced and the EGT rises as expected. But when the mixture controls are pushed forward to enrich the mixture, the fuel flow continues to drop and the EGT drops on the lean side of peak. Even though the mixture control is moved in the rich direction, leaning continues.
It would appear that the function of the mixture control has temporarily reversed! Continued movement of the mixture control picks up the slack and normal mixture function resumes. The magnitude of this phenomenon varies from aircraft to aircraft, but we have observed transitions of up to 1.5 gph past peak before the fuel flow began to increase. Monitor the fuel flow gauge to identify this phenomenon in your G3-4

G SERIES PILOT’S GUIDE .
INSIGHT INSTRUMENT CORPORATION BOX 122, FORT ERIE, ONTARIO, L2A 5M6 25
G3-4 MONITORING
The Bar-Graph Display Screen
The Exhaust Gas Temperature is displayed in white bar graph form and is interpreted much like a conventional mercury thermometer. The higher the bar, the higher the temperature.
The cylinder head temperature is displayed in green single bar format. During normal operation it shows as a green illumi-nated bar in the lower half of the bar column. Since EGT is normally higher than CHT, the green bar which represents CHT is on top of the white illuminated EGT bar and stands out clearly. However, when the engine is shutdown, the EGT quickly drops to zero and the cylinders remain warm for sometime.
The G3-4 provides a reliable indication of cylinder head temperature even with the engine shut down. Should an EGT probe fail, the entire EGT column for that cylinder will go blank, and the numeric indication will show --- that is dashes, but the CHT bar will still remain green.
The failure of one probe will not affect the display of any other probe.
The instrument may eventually accommodate engines with 4,6,7 or 9 cylinders in which case the appropriate number of columns will be displayed and numbered.
OAT is displayed as straight numbers when temperature is positive.
A negative sign is shown for temperatures below zero.
OAT is displayed in Fahrenheit.

G SERIES PILOT’S GUIDE .
INSIGHT INSTRUMENT CORPORATION BOX 122, FORT ERIE, ONTARIO, L2A 5M6 26
PROBE DIAGNOSTIC Screen
Left is positive resistance
Right is negative resistance
EGT 6 turned red because the resistance is greater than the MAX setting of 20
CHT 4 turned red because the resistance difference between positive and negative leads is greater than the DIF setting of 10
Typical single engine 8 foot harness display setting on G3 above.
The probe diagnosis page indications are in green for normal readings and red for readings that fail the criteria set at the bottom of the screen. Each temperature probe consists of two wires, a positive lead and a negative lead. The two numbers next to each identifier show the resistance in Ohms of each lead. For example, the line EGT1 8 3 means the positive lead of the EGT1 probe has 8 Ohms resistance, and the negative lead has 3 Ohms resistance. When the probe is new, it will have relatively low resistance. As the probe ages, it’s resistance will slowly go up. Eventually, the probe will measure outside the pass/fail criteria you set at the bottom of the screen, and change from green to red, indicating that the probe should be replaced before it fails and leaves you with no temperature reading at all. One other point to consider is that the longer the wiring to the probes, the higher its resistance. Every foot of EGT wire adds 1.7 Ohms/ft for the + lead and 0.8 Ohms/ft for the - lead. Every foot of CHT wire adds 0.8 Ohms/ft for the + lead and 1.2 Ohms/ft for the 0 lead. A 24 ft harness will fail the criteria that an 8 ft harness will pass with. That is why we allow the user to modify the pass/fail criteria on the bottom of the screen.
The meaning of the pass/fail criteria is as follows:R MAX sets the maximum resistance (in Ohms) that any single lead may have. If the R MAX is set to 20 Ohms a probe with either the positive or negative leads measuring greater than 20 Ohms will be annunciated in RED, otherwise its displayed in GREEN.R DIF sets the maximum resistance (in Ohms) that the positive lead may differ from the negative lead. If R DIF is set to 10 Ohms, the positive and negative leads need to measure within 10 Ohms of each other to be annunciated in GREEN, otherwise its RED.

G SERIES PILOT’S GUIDE .
INSIGHT INSTRUMENT CORPORATION BOX 122, FORT ERIE, ONTARIO, L2A 5M6 27
VIBRATION SPECTRUMEngine Vibration Screen
Decibels (dB)
RPM (Fundamental)
Harmonics - Vibration at multiples of RPM
PERIODIC TEMPERATURE Variation Screen
Periodic Temperature Variation is a new form of engine analysis. Some valve related engine faults produce a slow periodic variation in EGT. The oscillation rate is on the order of one cycle every minute or two. This is just too slow to be identified by casual observation of the temperatures alone. Yet it is very important to discover this phenomenon because it may eventually lead to a catastrophic engine failure. It readily appears in a slow sampled spectrum analysis. A normal indication will be a flat line with a little noise, while a trouble indication will show as an obvious spectral peak.This analysis should only be performed in cruise at a constent altitude and power setting. Press and hold bottom button to reset screen. Press and release bottom button to select cylinder (1-6, all) to view.
Variation degrees
Time in minutes
While in-flight with the vibration sceen showing on G3-4.
Pressing and holding the PG button will trigger the G3-4 to save the present vibration waveform for future reference.
Hold PG button in until G3-4 screen says it is data logging vibration data.

G SERIES PILOT’S GUIDE .
INSIGHT INSTRUMENT CORPORATION BOX 122, FORT ERIE, ONTARIO, L2A 5M6 28
After the sensor is connected and the software updated, you will find a new screen has been added, which contains the vibration spectrum. The vibration analysis only takes place when the engine is running and a valid rpm signal is detected. In regards to the vibration graph, the vertical axis represents the amount of vibration energy and the horizontal axis repre-sents the frequency spectrum expressed as multiples of crankshaft rpm. When it is operating, the screen will come alive with a waveform that represents the engine motion, presented in a spectral format with the crankshaft energies appearing at the 1x mark on the bottom scale. Propeller vibration will likewise be synchronous with the crankshaft vibration. Other sources of vibration will tend to produce energies at other frequencies. For example, camshaft vibration tends to accumulate at .5x, since the cam turns at 1/2 the rate of the crankshaft. Magneto vibration will appear at 1.5x in a 6-cylinder engine. Alternator vibration may appear somewhere around 3x or 4x, depend-ing on the ratio it is driven at.
A gear-driven alternator may appear in a different axis than the crankshaft does, if it is mounted at 90deg to the engine, although ANY source of vibration will show some energy in all three axis. Complex vibration as generated by reciprocating machinery will also produce a great number of harmonic spikes, which at first glance may seem confusing. Experiment with running the engine at different power settings under different conditions to get a feel for what is a “normal” spectrum for your particular engine.
You may examine the various sub-screens by pushing the top button. There are 6 screens to examine, each of the prima-ry axis (x, y and z) and an averaged version of each. The averaged version will be much “cleaner” and contain less noise than the raw measurement and is the preferred screen to examine for each axis. The bottom knob can also be pushed to enter a zoom mode. When in zoom mode, turning the bottom knob will allow you to scroll through the waveform. The cur-sor will also “snap” to nearby vibration spikes to make it easy to examine them. Continue to press the bottom knob to set progressively higher zoom modes. A further press when at maximum zoom will return you to the overall view. Pressing and holding the top button will trigger the G3 to save the present vibration waveform for future reference. The waveform will be stored as a series of hexadecimal bytes in the log file.
It is expected that the vibration functions will be used as a “condition-monitoring tool”. Since every engine is different, everyone’s vibration spectrum will look unique and it would be impossible to generalize the interpretation of the spectrum. The user will come to recognize what a “normal” spectrum looks like for their engine and by periodically scanning the vibration screen can recognize when potential trouble is developing.
When a new spike appears or an existing spike begins to show signs of higher than normal amplitude further investigation is warranted.
If you take a step back from the EGT/CHT idea to explore engine monitoring in general, you discover that at least half the engine monitoring solution is missing. EGT analysis reveals combustion phenomenon but simply ignores mechanical prob-lems.By the time a mechanical problem shows up in EGT, if it ever does, the damage is done and it is far too late to do anything about it.
Vibration analysis is the key to pre-emptive detection of mechanical problems.

G SERIES PILOT’S GUIDE .
INSIGHT INSTRUMENT CORPORATION BOX 122, FORT ERIE, ONTARIO, L2A 5M6 29
TAKE-OFF PERFORMANCETake-off Display
2-AXIS G-LOADTurbulence Display
The G3-4 contains a 3-axis accelerometer sampled at modest rates to measure turbulence and landing shock. Knowledge of G forces will help the pilot to operate the airplane safely by slowing to maneuvering speed. Landing shock is a good training aid for smooth landings and a predictor of structural damage. Data logged G force will report unauthorized aerobatic activity or abuse of rental aircraft. It could also be useful in accident investigation.The data is also logged on the SD Card in milli G’s for future examination.
G’s of acceleration
Fore / Aft Axis
Vertical Axis
Yaw Axis
Time
Time
G’s of acceleration
G SERIES PILOT’S GUIDE .
INSIGHT INSTRUMENT CORPORATION BOX 122, FORT ERIE, ONTARIO, L2A 5M6 30
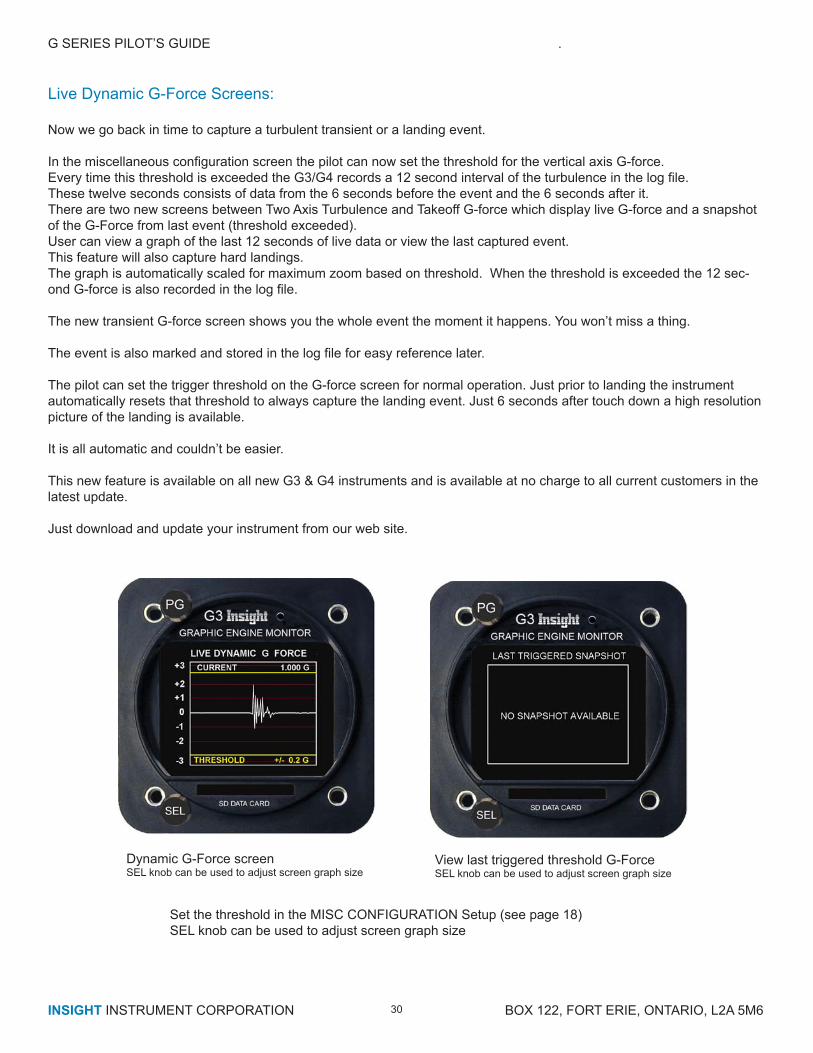
Live Dynamic G-Force Screens: Now we go back in time to capture a turbulent transient or a landing event. In the miscellaneous configuration screen the pilot can now set the threshold for the vertical axis G-force.Every time this threshold is exceeded the G3/G4 records a 12 second interval of the turbulence in the log file.These twelve seconds consists of data from the 6 seconds before the event and the 6 seconds after it. There are two new screens between Two Axis Turbulence and Takeoff G-force which display live G-force and a snapshot of the G-Force from last event (threshold exceeded).User can view a graph of the last 12 seconds of live data or view the last captured event.This feature will also capture hard landings.The graph is automatically scaled for maximum zoom based on threshold. When the threshold is exceeded the 12 sec-ond G-force is also recorded in the log file.
The new transient G-force screen shows you the whole event the moment it happens. You won’t miss a thing.
The event is also marked and stored in the log file for easy reference later.
The pilot can set the trigger threshold on the G-force screen for normal operation. Just prior to landing the instrument automatically resets that threshold to always capture the landing event. Just 6 seconds after touch down a high resolution picture of the landing is available.
It is all automatic and couldn’t be easier.
This new feature is available on all new G3 & G4 instruments and is available at no charge to all current customers in the latest update.
Just download and update your instrument from our web site.
Set the threshold in the MISC CONFIGURATION Setup (see page 18)SEL knob can be used to adjust screen graph size
Dynamic G-Force screenSEL knob can be used to adjust screen graph size
View last triggered threshold G-ForceSEL knob can be used to adjust screen graph size

G SERIES PILOT’S GUIDE .
INSIGHT INSTRUMENT CORPORATION BOX 122, FORT ERIE, ONTARIO, L2A 5M6 31
T.H.P.Theoretical Horsepower Display
The horsepower display has been improved and requires explanation. First the HP display depends on three configuration parameters and these need to be set correctly. The (1) Max RPM, (2) Engine HP and (3) turbo configuration are set to match your engine.(1) Typically max RPM is 2700.
(2) For turbo’d engines we have a new configuration identifier - a digit followed by “B”. You may choose 0, 1, 2, 1B, 2B. The B means boosted. When absent it implies turbo-normalized. If your engine manifold pressure can exceed 30 inches then choose boosted.
(3) The HP calculator has takeoff and cruise modes. Any RPM within 125 of max is considered takeoff. Anything below that is cruise mode. As we have said before this is theoretical HP not real HP. It will not identify engine faults. Without a torque sensor on the engine there is no such thing as a real HP reading.
If the Engine HP parameter is set incorrectly it will distort the percentage HP calculations.
The HP algorithms do the best they can to predict engine power even though some essential information is missing. The display now shows power in either yellow or white. When the incoming information is favorable and will yield a good result it will display the value in white.
So what are the favorable conditions?
The instrument needs fuel flow, RPM, peak EGT and all the configuration data set correctly. If it doesn’t have peak EGT because you haven’t leaned yet, like during take off and climb, then it assumes you are leaning correctly on the way up. Once you reach a good peak EGT the HP calculations will work well. Peak in this case means you have all the lean boxes displayed above the columns. Once you reach this point, leaning past peak or going back to the rich side of peak will still produce good HP indications. The value will display in white. If you operate outside of normal parameters the HP will be less accurate even though the display may still be white. When you change manifold pressure the fuel air ratio will be approximately the same but to the extent that is not the HP accuracy will compromised. The HP calculations work best during leaned for cruise operation, where they are most useful.
G3 and G4 single looks like this.
G4 twin looks like this.

G SERIES PILOT’S GUIDE .
INSIGHT INSTRUMENT CORPORATION BOX 122, FORT ERIE, ONTARIO, L2A 5M6 32
Auto Range Capability On The User Configuration Screen
Using the knobs to navigate the G3-4:
The G3-4 has two knobs: PD select page and SEL work within page. There are two functions built into each knob; the push button switch activated by pressing the knob in, and the selection is activated by turning the knob either clockwise or counter clockwise.
The PG knob is used to select the various screens. From the main temperature bargraph screen turn the PG knob coun-ter clockwise 2 clicks to get to the User Configuration screen. Once you are there you do not use the PG knob any more because turning it takes you away from the User Configuration screen.
The SEL button is pressed to select a line for adjustment. When you first enter a screen by default no line is selected. Pressing the SEL button once selects line 1. The selected line is shown in yellow. Pressing it a second time selects line 2. On any line with multiple selections the selected item will be shown in red.
Setting up the G3 Temperature Bargraph Display:
On the User Configuration screen there are some options for setting up the temperature bargraph display. There are three different ways to accomplish this. One method is to use the Auto range function to configure the display for you. Another method is to adjust the MAX EGT TEMPERATURE and AUTORANGE INFLECTION parameters manually, and a third method is to set the bar heights visually on the main screen.
On line 2 (EGT AUTORANGE) there are 3 possibilities ON OFF and SAVE. After pushing the SEL button until this line is highlighted in yellow, the SEL knob may then be turned to make a selection on this line. When on line 2 turning the SEL knob fully counter clockwise selects nothing. From there turning the SEL knob one click clockwise selects ON. The current selection is shown in red. Turning the SEL knob another click clockwise selects OFF. And one more turn clockwise selects SAVE.
Using the Auto Range function (Method 1):
To turn OFF the auto range capability on the User configuration screen:
Press the SEL button twice to select line 2 (EGT AUTORANGE).Turn the SEL knob to select OFF on line 2.Press the SEL button to select line 7 “SAVE CONFIG”Turn the SEL knob to select YES on line 7.Press the SEL knob to save the choice.We have now turned off auto ranging.
To turn ON the auto range capability on the User configuration screen:Press the SEL button to select line 2. (EGT AUTORANGE).Turn the SEL knob to select ON on line 2.Press the SEL button to select line 7 “SAVE CONFIG”Turn the SEL knob to select YES on line 7.Press the SEL knob to save the choice.We have now turned on auto ranging.

G SERIES PILOT’S GUIDE .
INSIGHT INSTRUMENT CORPORATION BOX 122, FORT ERIE, ONTARIO, L2A 5M6 33
In order to use the auto range function it must be turned on as described above. Once this function is enabled, the G3-4 will automatically adjust the EGT MAX TEMPERATURE and AUTORANGE INFLECTION to be appropriate for the highest temperature reported by the probes. You should now take the airplane and perform a typical flight. The G3-4 will analyze the EGT temperatures and scale the temperature bars as required so that the entire temperature range measured by the EGT probes is displayed on the main bargraph screen. It is important to realize that so far this adjustment is temporary. If we want it to remain permanent we must return to the User Configuration screen.
To save the results of auto ranging:
Press the SEL button to select line 2 (EGT AUTORANGE).Turn the SEL knob to select SAVE on line 2.Press the SEL button to select line 7 “SAVE CONFIG”Turn the SEL knob to select YES on line 7.Press the SEL knob to save the choice.The results are saved, and auto ranging is turned OFF. The main temperature bargraphs should now be scaled properly for this individual airplane on all subsequent flights.
Auto ranging may be turned on and the range relearned as often as desired.
Setting up the G3 Temperature Bargraph display manually (Method 2):
In some cases it may be desirable to set or refine the temperature bargraph screen manually. To do so, return to the User Configuration screen and make sure EGT AUTORANGE is turned OFF as described earlier. Adjust EGT MAX TEMPERATURE and AUTORANGE INFLECTION directly by using the following procedure:
To set an EGT MAX TEMPERATURE and AUTORANGE INFLECTION on the User configuration screen:Press the SEL button to select line 3 (AUTORANGE INFLECTION) or line 4 (EGT MAX TEMPERATURE).Turn the SEL knob to select a value as desired. Notice that adjusting the AUTORANGE INFLECTION affects the value of EGT MAX TEMPERATURE and vice versa.Press the SEL button to select line 7 “Save Config”Turn the SEL knob to select YES on line 7.Press the SEL knob to save the choice.
AUTORANGE INFLECTION and EGT MAX TEMPERATURE explained:
The Autorange Inflection point is the point along the temperature graph at which the scale of the bars change. Below the inflection point (ie, at low temperatures) readings are displayed with a coarse resolution (the bars go up/down a small amount for a relatively large change in temperature). Above the Inflection Point (at higher temperatures than the Inflection Point) the bars are displayed in a higher resolution (the bars go up/down more for a small change in temperature). The net effect is that the dynamic range of the temperature bargraph is increased. In other words, we can show tempera-tures all the way down to room temperature on the bargraph yet still show small changes in temperature at the airplane’s operating temperature range. As an example if we set our Autorange Inflection to be 1200 deg then temperatures below 1200 will be rendered with rela-tively few pixels/degree whereas temperatures above 1200 will be rendered with more pixels/degree to make temperature changes more obvious.

G SERIES PILOT’S GUIDE .
INSIGHT INSTRUMENT CORPORATION BOX 122, FORT ERIE, ONTARIO, L2A 5M6 34
The EGT Max Temperature simply defines the temperature that is represented by a bar that is full screen in height. For example if EGT Max Temperature is set to 1600 deg than a temperature of 1600 deg will be rendered as a bar that reaches the top of the screen.
The G3’s Autorange Inflection is always 400 deg below the EGT Max Temperature. Adjusting one will therefore always affect the other automatically.
EGT SmoothingThe lower the number the faster the sampling but less smooth (jumpier)Factory preset is 32
Adjusting the bar heights from the main screen (Method 3):
An alternative way to setup the scale of the temperature bargraphs can be performed from the main screen. Press the SEL button and a message appears: “TURN-ADJUST BAR HEIGHT”. By turning the SEL button the heights of the bars may be moved up and down. Pressing the SEL button twice more returns the G3-4 to its normal mode. If we return to the User Configuration screen, we will see that EGT MAX TEMPERATURE and AUTORANGE INFLECTION have been adjusted to reflect our changes to the bar height. If the adjustment is to become permanent we must select Save Config and set it to yes.

G SERIES PILOT’S GUIDE .
INSIGHT INSTRUMENT CORPORATION BOX 122, FORT ERIE, ONTARIO, L2A 5M6 35
The G2-3-4 is NOT connected to the actual fuel tanks.
However, since it is connected to a sensor that measures the volume of fuel flow consumed, it is possible to calculate the rate of fuel consumption.
If the user inputs the initial amount of fuel, the G3 can subtract the fuel used from the initial fuel to provide an estimate of the amount of fuel remaining.
Since we know the current rate of fuel consumption, we can also estimate the endurance (amount of time remaining before all the fuel is consumed).
Both fuel REMAINING and ENDURANCE depend on the correct value enterd by the pilot for INITIAL FUEL.
Fuel Function Screens
Total fuel for this aircraft is entered in configuration screen
Enter Total Fuel Screen(Defaults to fuel function screen when total fuel is set)
Fuel Function Screen
The Usable Fuel can be set in the Engine Configuration screen. You need to reboot the instrument while holding in the top button.
Make sure all your personal and aircraft information is correct and remember to save your changes.
Your G3-4 was preset at factory with your usable total fuel To reach TOTAL TOTALIZATION page Set total fuel onboard before take-off1- Push SEL button to highlight INITIIAL FUEL to yellow2- Turn SEL knob to set gallons3- Push SEL knob again to highlight SAVE & EXIT to yellow4- Turn SEL knob to highlight YES from yellow to red5- Push SEL button to save and FUEL TOTALIZATION page will appear On next take-off if no fuel was added1- Push SEL button to highlight INITIIAL FUEL to yellow2- Push SEL knob again to highlight SAVE & EXIT to yellow3- Turn SEL knob to highlight YES from yellow to red4- Push SEL button to save and FUEL TOTALIZATION page will appear If fuel was added set new total fuel1- Push SEL button to highlight INITIIAL FUEL to yellow2- Turn SEL knob to set total gallons3- Push SEL knob again to highlight SAVE & EXIT to yellow4- Turn SEL knob to highlight YES from yellow to red5- Push SEL button to save and FUEL TOTALIZATION page will appear

G SERIES PILOT’S GUIDE .
INSIGHT INSTRUMENT CORPORATION BOX 122, FORT ERIE, ONTARIO, L2A 5M6 36
Note: All Insight fuel flow transducers are factory - normalized to 30,000 pulses / gallon.
If you have a factory installed or third party transducer you may need to adjust the K- Factor of the G3 to match.
Adjust K-Factor On G2-3-4
Hold PG knob in on power up to access “Setup Mode”
You will see the “REGISTRATION CONFIG” screen
Turn PG knob to the CCW one stop
This will be the “K-FACTOR INITIALIZATION” screen
Use SEL knob to select 1) Coarse adjustment Push SEL and turn to set
2) Fine adjustment Push SEL and turn to set
3) The screen will show the new K-Factor expressed as “pulses per gallon” The next line will show how much the fuel flow rate has changed since the last time it was saved. This can be a valuable aid when tweaking your K-Factor for accurate fuel totalizing. For example, raising the K-Factor from 30,000 to 33,000 means the fuel flow indication will decrease by 10% next time you restart the G2-3-4.
4) Push SEL to select - “3) SAVE CONFIG: YES NO”. Turn SEL to highlight “YES” in RED Push SEL . The G3-4 will display “SAVING FLASH”.
Setup GARMIN 400/500 For Fuel Display:
1) To start set up mode. Press and hold “ENT” button and apply power. Hold “ENT” until the display lights up. Release “ENT” button, wait until display says OK Press “ENT” button once.2) Turn inner rotary knob until “Main RS-232 Config” appears.3) Use cursor and “ENT” button to select.4) Press curser button to select input for channel 1 INPUT OUTPUT Channel 1 Shadin - fadc Avtn no alt
5) Turn power off.

G SERIES PILOT’S GUIDE .
INSIGHT INSTRUMENT CORPORATION BOX 122, FORT ERIE, ONTARIO, L2A 5M6 37
Configuring the G3-4 For Your Engine’s Fuel System
The G3-4 is capable of interfacing with numerous fuel system configurations, and need only be told which arrangement your engine is equipped with. The selection is made on the Engine Configuration screen, item #6 “Fuel”.
There are presently three possible selections: Injected, Carb, or PCarb.
Select Injected for engines equipped with fuel injection with a single supply line.Select Carb for engines equipped with a carburetor with a single supply line.Select PCarb for pressurized carburetors equipped with a supply line and a separate return line.
The first two items are the most common arrangements used on aircraft engines, and need little additional explanation. The fuel transducer is installed along the fuel supply path to either the fuel distributor or the carburetor, and measures the total amount of fuel supplied to the engine. This transducer is connected to the FF1 input of the G3-4.
Engine fuel systems equipped with a return line require some additional hardware to configure. In this case a fuel transducer is still used to measure the amount of fuel supplied to the carburetor, but a second fuel transducer must be used to measure the amount of fuel returned to the fuel tanks by way of the return line. The amount of fuel measured by the return sensor is then subtracted from the fuel measured by the supply sensor, with the result yielding the fuel consumed by the engine, which is the quantity we wish to display on the G3. The supply sensor must be connected to FF1 of the G3-4 and the return sensor to FF2.
Using the knobs to navigate the G3-4:
The G3-4 has two knobs: one PG and SEL. There are two functions built into each knob: the push button switch activated by pressing the knob in, and the selection is activated by turning the knob either clockwise or counter clockwise.The PG knob, labeled PG for page, is used to select the various pages or screens. The SEL knob, labeled SEL for select, is used to make a selection on the current page.There are two sets of screens or pages. The main screens are automatically used by default. In order to enter the configuration screens turn off the avionics power to the G3-4, wait several seconds, then press and hold the PG button, and finally turn on the avionics without releasing the PG button. This will take you to the Registration Config screen.
From this screen turn the PG knob clockwise two clicks to get to the Engine Configuration screen. Once you are there you do not use the top knob any more because turning it takes you away from the current screen.The SEL button is pressed to select a line. When you first enter a screen by default no line is selected. Pressing the SEL button once selects line 1. The selected line is shown in yellow. Pressing it a second time selects line 2, etc. On lines that allow you to select from multiple items the selected item is shown in red.

G SERIES PILOT’S GUIDE .
INSIGHT INSTRUMENT CORPORATION BOX 122, FORT ERIE, ONTARIO, L2A 5M6 38
Configuring the Fuel System Type:
Line 6 of the Engine Configuration screen is the Fuel parameter that defines the fuel system configuration. There are three choices INJECTED, CARB or PCARB. The bottom knob is turned to make a selection on this line.
For example to set the G2-3-4 up for a pressurized carburetor with a separate return line perform the following procedure:
When on line 6 turn the SEL knob clockwise or counter clockwise to select PCARB. The current selection is shown in red. Use the SEL pushbutton to select Line 9. On line 9 turn the SEL knob clockwise or counter clockwise to set the Save Config parameter to select YES.
Press the SEL button to save your changes into permanent memory.

G SERIES PILOT’S GUIDE .
INSIGHT INSTRUMENT CORPORATION BOX 122, FORT ERIE, ONTARIO, L2A 5M6 39
DATA-LOGGING
Mark Event In Log File
If during a flight the pilot notices something unusual, maybe a drop in one of the readings, he or she may want to closely examine the log file later. In order to make it easy to find the entry in the file the pilot need only press and hold the top button.
Implementation: In order to mark the event the user simply presses and holds the top button. The screen momentarily pauses and increments and displays a number assigned to this event.
The first press generates a ‘1’, the fifteenth press generates a ‘15’ etc. This tag is saved in the data log in the “marked column”.
Sample log file showing 4 markers

G SERIES PILOT’S GUIDE .
INSIGHT INSTRUMENT CORPORATION BOX 122, FORT ERIE, ONTARIO, L2A 5M6 40
Flight File Open In Excel
Introduction to Data-Logging
Files are created directly in CSV format (comma separated values) for direct importation in Excel.Logging of engine temperature data on a routine basis allows the creation of a complete engine-operation history, a detailed record documenting each hour of an engine’s life.
Data-logging with the G3 provides the benefits of long-term trend monitoring through a standardized personal computer interface. The G3 data-log system makes it easy to retrieve log data from all flights.
The G3 automatically records parameters during every flight. Each flight’s data is stored in an individual log file on the SD Card. Every file has an identification header containing the date, time, aircraft- registration and data log configuration. All data is sampled and recorded every one second of flight with essentially no limit as to size.Data acquired with the G3 can be viewed directly in raw form, or imported into spreadsheet and database programs for graphical analysis.