GRUPO PRISA 1H 2001 RESULTS July 2001. The Environment 1H 2001 Results Businesses Conclusions...
27
GRUPO PRISA GRUPO PRISA 1H 2001 RESULTS 1H 2001 RESULTS July 2001 July 2001
-
Upload
howard-wilcox -
Category
Documents
-
view
221 -
download
0
Transcript of GRUPO PRISA 1H 2001 RESULTS July 2001. The Environment 1H 2001 Results Businesses Conclusions...

GRUPO PRISAGRUPO PRISA1H 2001 RESULTS1H 2001 RESULTS
July 2001July 2001

The Environment
1H 2001 Results
Businesses
Conclusions
Summary

1H 2001 RESULTS1H 2001 RESULTS
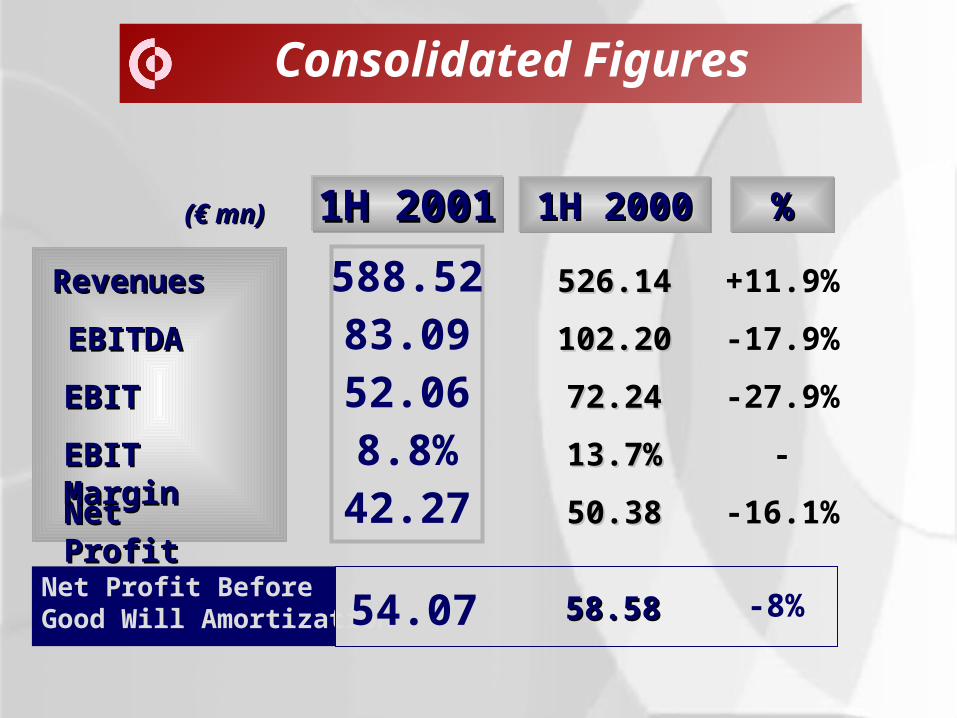
Consolidated Figures
RevenuesRevenues
EBITDAEBITDA
EBITEBIT
Net Net ProfitProfit
1H 20001H 20001H 20001H 2000 %%%%
526.14526.14
(€ mn)(€ mn)
50.3850.38
102.20102.20
72.2472.24
EBIT EBIT MarginMargin
13.7%13.7%
+11.9%
-16.1%
-17.9%
-27.9%
-
Net Profit Before Good Will Amortization 58.5858.58 -8%
1H 20011H 20011H 20011H 2001
588.52
42.27
83.0952.068.8%
54.07
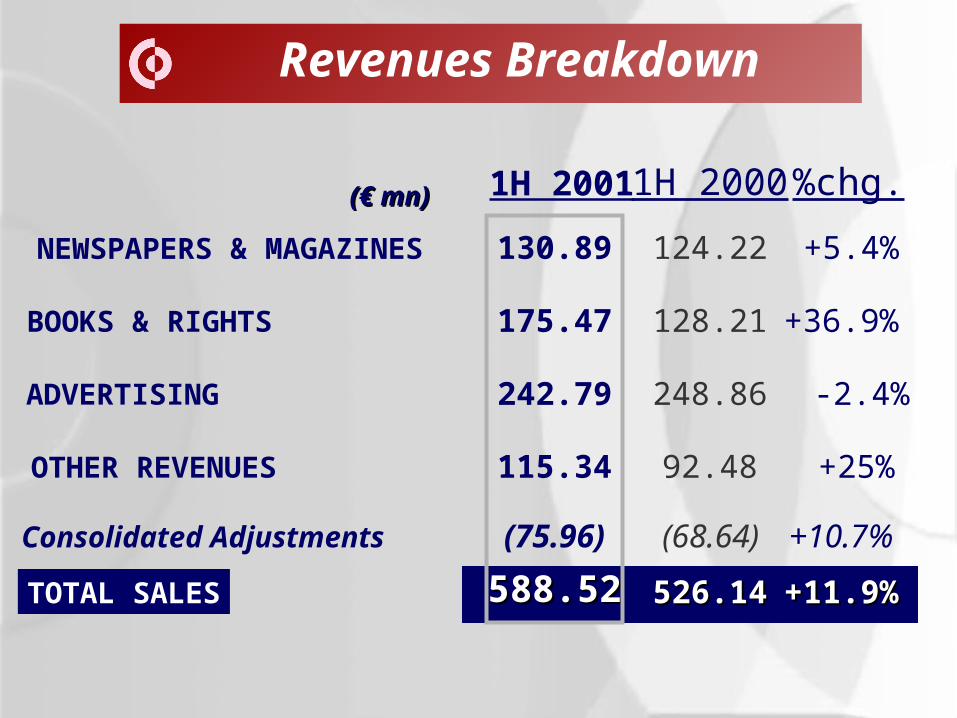
Revenues Breakdown
NEWSPAPERS & MAGAZINES
BOOKS & RIGHTS
ADVERTISING
OTHER REVENUES
TOTAL SALES
(€ mn)(€ mn)
124.22
128.21
248.86
92.48
1H 2000
+5.4%
+36.9%
-2.4%
+25%
%chg.
526.14526.14+11.9%+11.9%
Consolidated Adjustments (68.64) +10.7%
130.89
175.47
242.79
115.34
1H 2001
588.52588.52
(75.96)
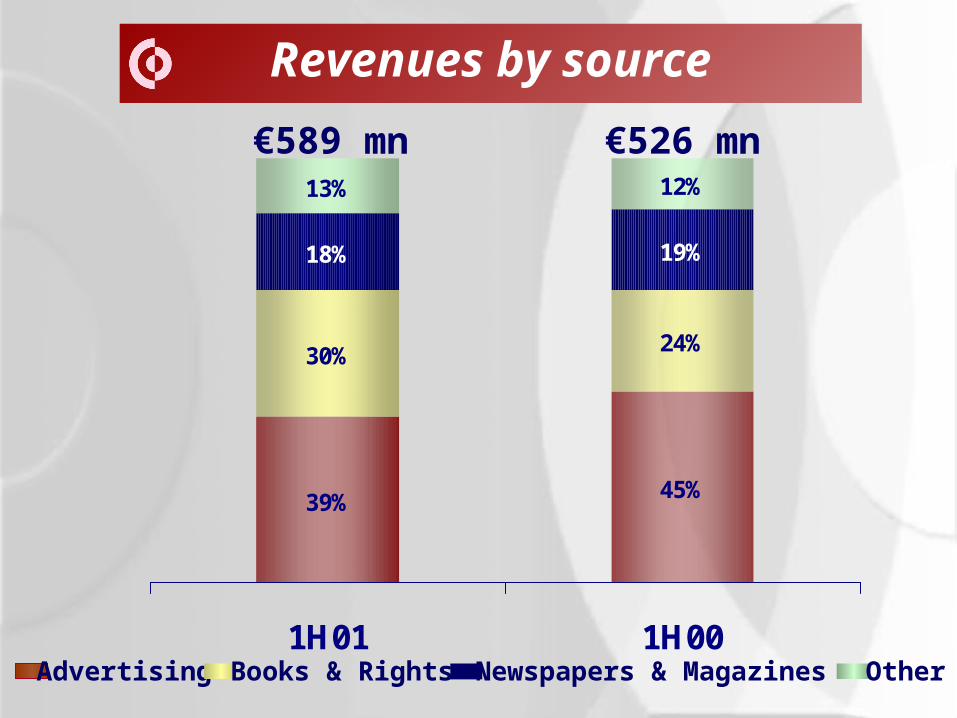
Revenues by source
39% 45%
30% 24%
18% 19%
13% 12%
1H01 1H00Advertising Newspapers & MagazinesBooks & Rights Other
€589 mn €526 mn

Balanced Business Structure
1H20011H2001
EBITEBIT
50%50% 50%50%Advertising
RelatedAdv.Non Related
1H 1H 20002000
AdvertisingRelated
Adv.Non Related
25%25%75%75%
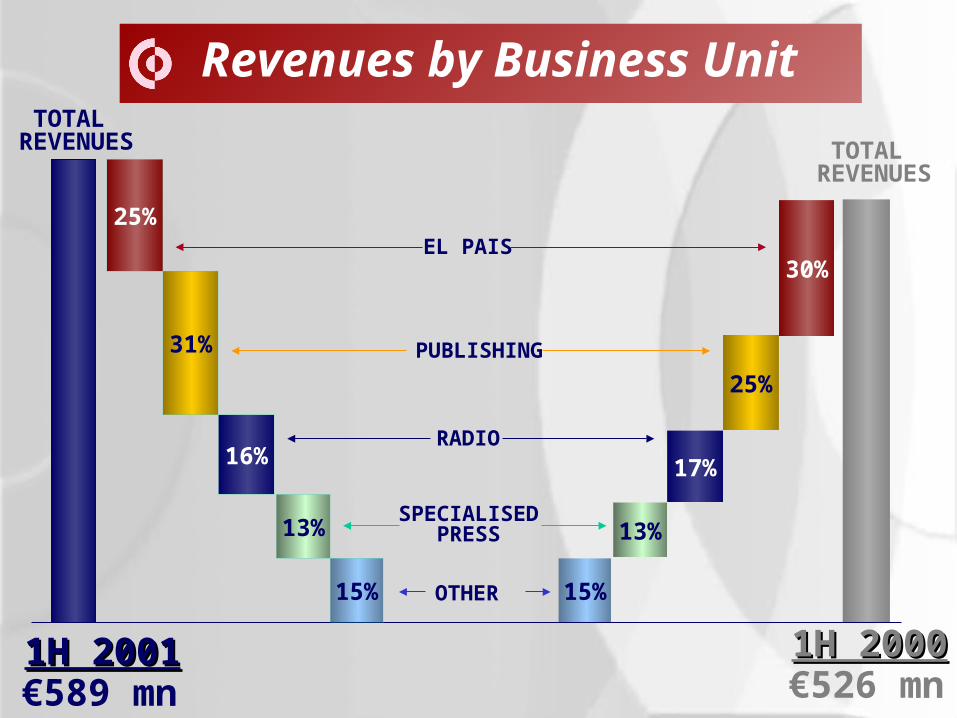
Revenues by Business Unit
1H 20001H 2000
15%
13%
17%
25%
30%EL PAIS
€526 mn
OTHER
TOTAL REVENUES
PUBLISHING
RADIO
SPECIALISED PRESS13%
16%
31%
25%
1H 20011H 2001
TOTAL REVENUES
€589 mn
15%

-25%
-10,2%
+4%
-2%
-15%
-9,6%
+4%
-11,00%
+6,1%
-2,4%
Advertising Trend
Prisa vs. SectorPrisa vs. SectorPrisa
Sector
1 Source: Prisa Group Estimates
96% 200%
TVTV NationalNationalPressPress
MagazinesMagazines RadioRadio InternetInternet TOTALTOTAL

BUSINESSESBUSINESSES
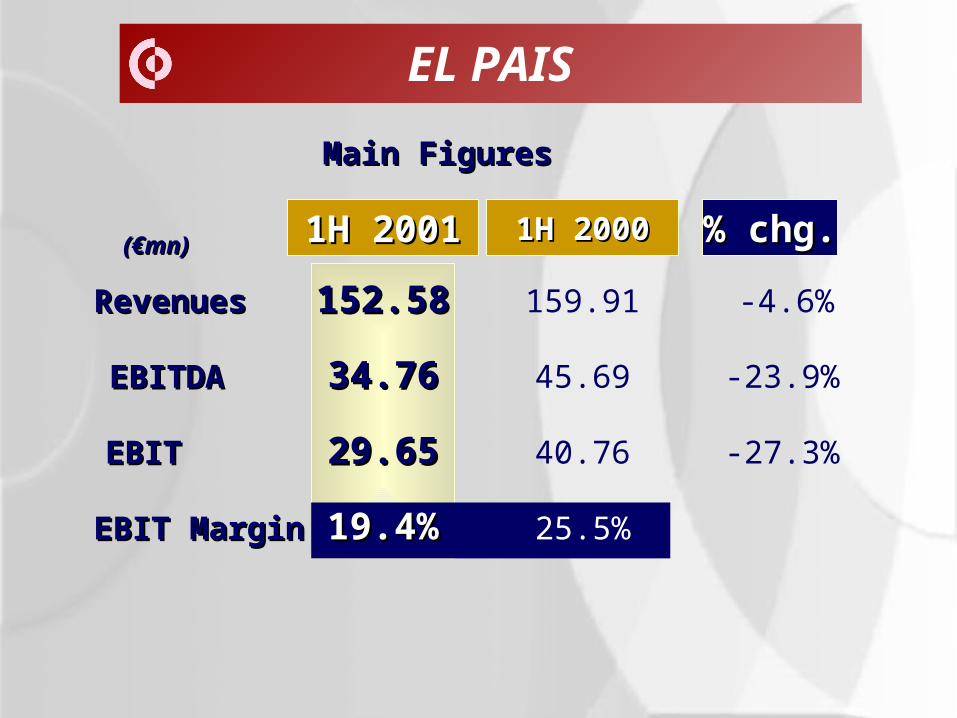
EL PAIS
RevenuesRevenues
EBITDAEBITDA
EBITEBIT
EBIT MarginEBIT Margin
159.91
45.69
40.76
25.5%
(€mn)(€mn) 1H 20001H 2000 % chg.% chg.
-4.6%
Main FiguresMain Figures
152.58152.58
34.7634.76
29.6529.65
19.4%19.4%
1H 20011H 2001
-23.9%
-27.3%
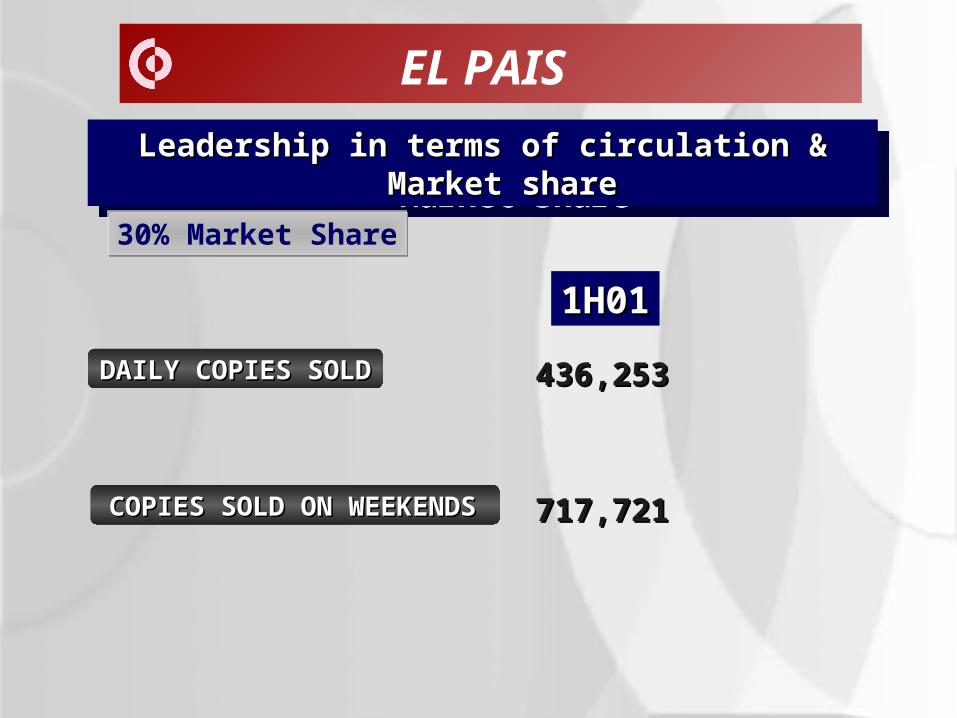
Leadership in terms of circulation & Leadership in terms of circulation & Market shareMarket share
Leadership in terms of circulation & Leadership in terms of circulation & Market shareMarket share
30% Market Share30% Market Share
DAILY COPIES SOLDDAILY COPIES SOLD
EL PAIS
COPIES SOLD ON WEEKENDSCOPIES SOLD ON WEEKENDS
1H011H01
436,253436,253
717,721717,721

54,4
82,93
54,28
102,03
56,99
90,55
1H99 1H00 1H01
((€€mn)mn)
Advertising SalesNewspaper & Magazines sales
EL PAIS
Revenues Revenues DistributionDistribution
Revenues Revenues DistributionDistribution

Including A3
RevenuesRevenues
EBITDAEBITDA
EBITEBIT
EBIT MarginEBIT Margin
91.59
21.34
18.74
(€mn)(€mn) 1H 20001H 2000 % chg.% chg.
+4.1%
Main FiguresMain Figures
RADIO/SER
EBITEBIT
EBIT MarginEBIT Margin 20%20%20.2620.26 -12%-12%
20.5%
95.3395.33
18.4918.49
15.4315.43
1H 20011H 2001
16.5%16.5%
24%24%23.0423.04
-13.4%
-17.6%
8875
85
1H99 1H00 1H01
GRUPO PRISA AUDIENCEGRUPO PRISA AUDIENCE IN SPAININ SPAIN
9.863.000
(€mn)(€mn)
(*) Source: EGM. Apr.01.
RADIO
Positive Evolution in Advertising Positive Evolution in Advertising SalesSales
Positive Evolution in Advertising Positive Evolution in Advertising SalesSales
MARKET SHAREMARKET SHARE
55%
CAGR 8%CAGR 8%
RevenuesRevenues
EBITDAEBITDA
EBITEBIT
(€mn)(€mn)
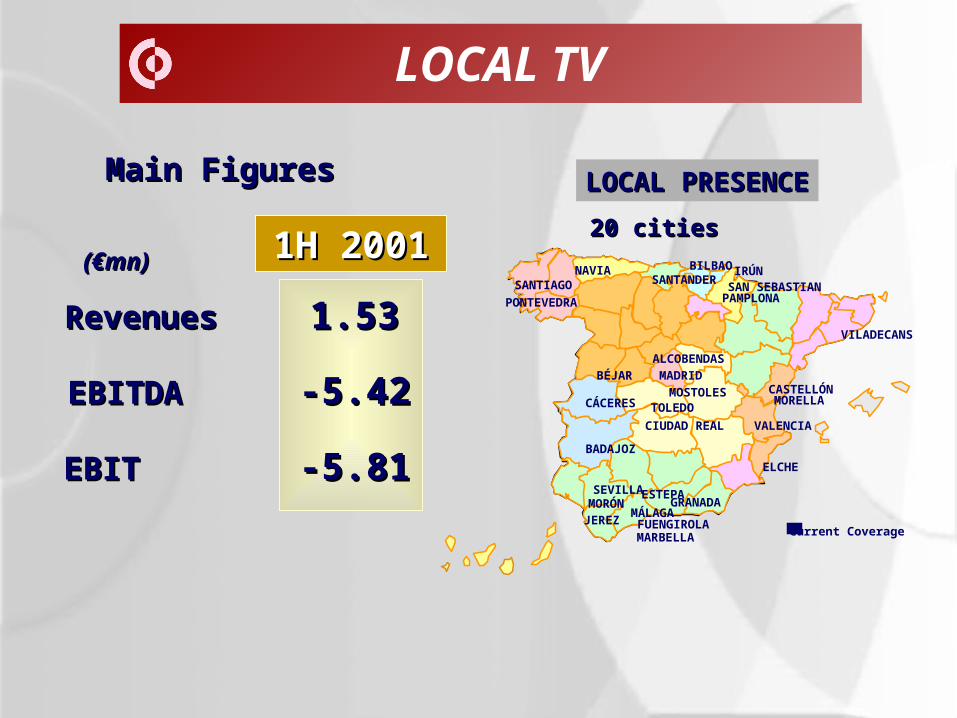
Main FiguresMain Figures
LOCAL TV
1.531.53
-5.42-5.42
-5.81-5.81
1H 20011H 2001PONTEVEDRA
SANTANDERBILBAO
SAN SEBASTIANPAMPLONA
CASTELLÓN
VALENCIA
CÁCERES
BADAJOZ
TOLEDO
MADRID
CIUDAD REAL
SEVILLA
MÁLAGAGRANADA
ELCHE
Current Coverage JEREZ
VILADECANS
MORELLA
SANTIAGO
MOSTOLES
ALCOBENDAS
MORÓN
BÉJAR
NAVIA
FUENGIROLA
IRÚN
ESTEPA
MARBELLA
LOCAL PRESENCELOCAL PRESENCE
20 cities20 cities
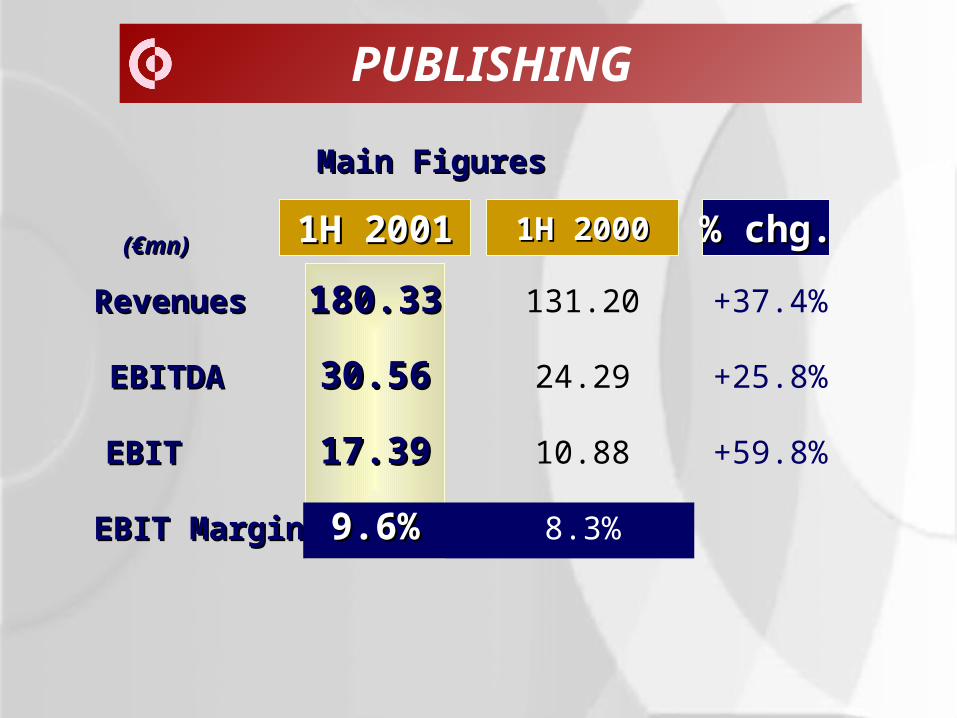
PUBLISHING
RevenuesRevenues
EBITDAEBITDA
EBITEBIT
EBIT MarginEBIT Margin
131.20
24.29
10.88
(€mn)(€mn) 1H 20001H 2000 % chg.% chg.
+37.4%
Main FiguresMain Figures
8.3%
180.33180.33
30.5630.56
17.3917.39
1H 20011H 2001
9.6%9.6%
+25.8%
+59.8%
PUBLISHING
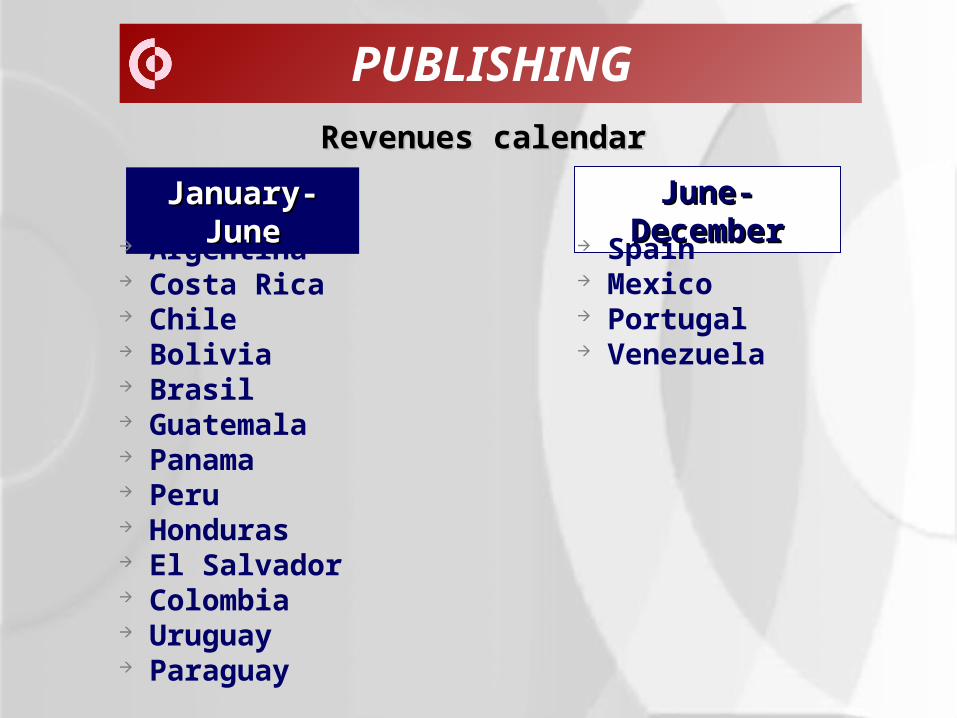
January-January-JuneJune
June-June-DecemberDecember
Argentina Costa Rica Chile Bolivia Brasil Guatemala Panama Peru Honduras El Salvador Colombia Uruguay Paraguay
Spain Mexico Portugal Venezuela
Revenues calendarRevenues calendar
PUBLISHING
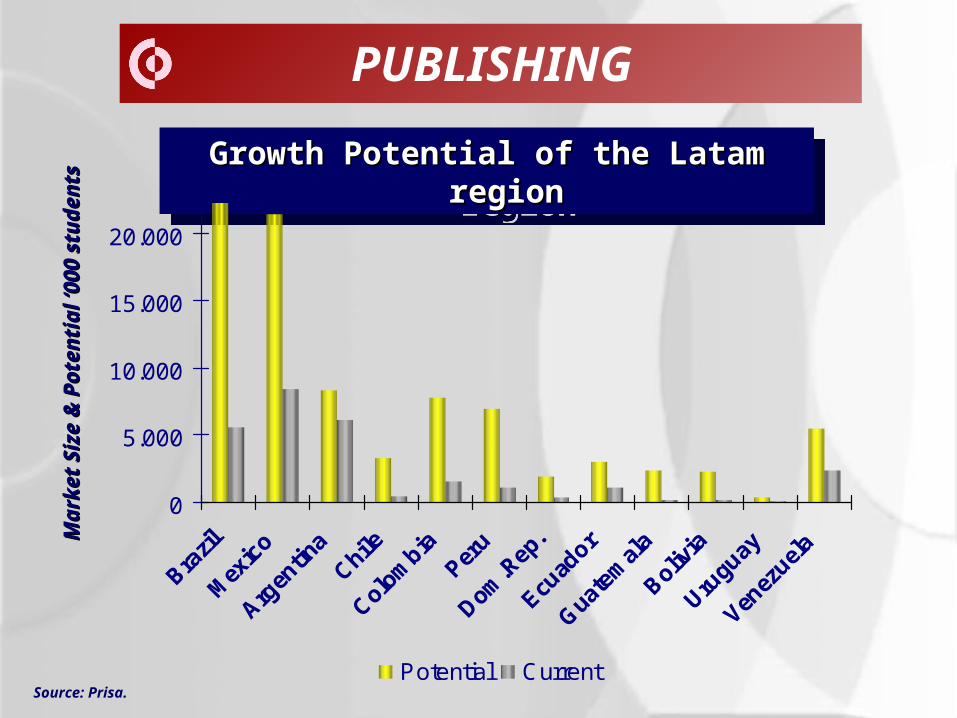
Growth Potential of the Latam Growth Potential of the Latam regionregion
Growth Potential of the Latam Growth Potential of the Latam regionregion
0
5.000
10.000
15.000
20.000
Potential Current
Mark
et
Siz
e &
Pote
nti
al ‘0
00
stu
den
tsM
ark
et
Siz
e &
Pote
nti
al ‘0
00
stu
den
ts
Source: Prisa.
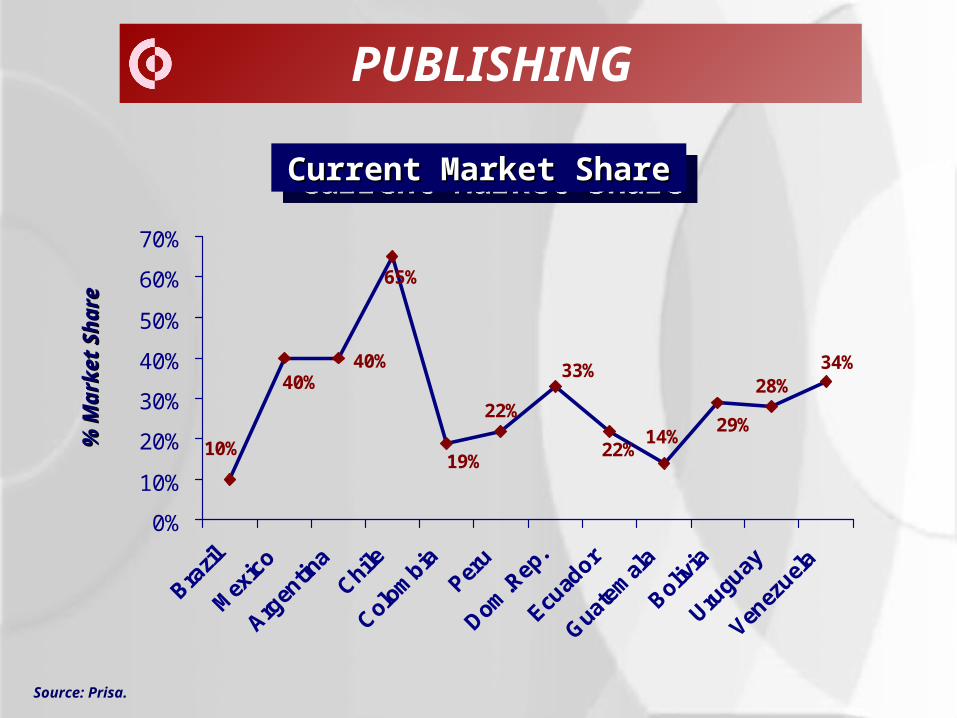
PUBLISHING
Current Market ShareCurrent Market ShareCurrent Market ShareCurrent Market Share
%
% M
ark
et
Sh
are
Mark
et
Sh
are
Source: Prisa.
40% 34%28%
29%14%
22%
33%
22%
19%
65%
40%
10%
0%
10%
20%
30%
40%
50%
60%
70%
Brazil
Mexico
ArgentinaChile
ColombiaPeru
Dom.Rep.
Ecuador
Guatemala
Bolivia
Uruguay
Venezuela
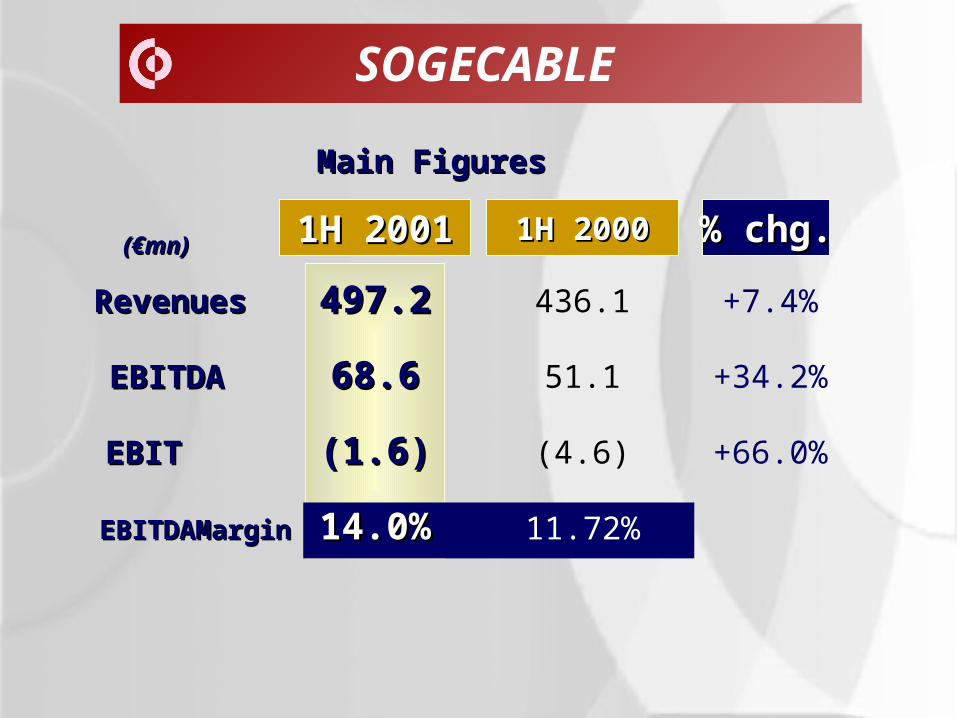
SOGECABLE
RevenuesRevenues
EBITDAEBITDA
EBITEBIT
EBITDAMarginEBITDAMargin
436.1
51.1
(4.6)
(€mn)(€mn) 1H 20001H 2000 % chg.% chg.
+7.4%
Main FiguresMain Figures
11.72%
497.2497.2
68.668.6
(1.6)(1.6)
1H 20011H 2001
14.0%14.0%
+34.2%
+66.0%

Purchase Centralisation
Reducing Consumption Improving negotiation with suppliers Improving process
Shared Services
Improving Efficiency & Cost Reduction
Administration Human Resources Treasury Centralisation

THE ENVIRONMENTTHE ENVIRONMENT
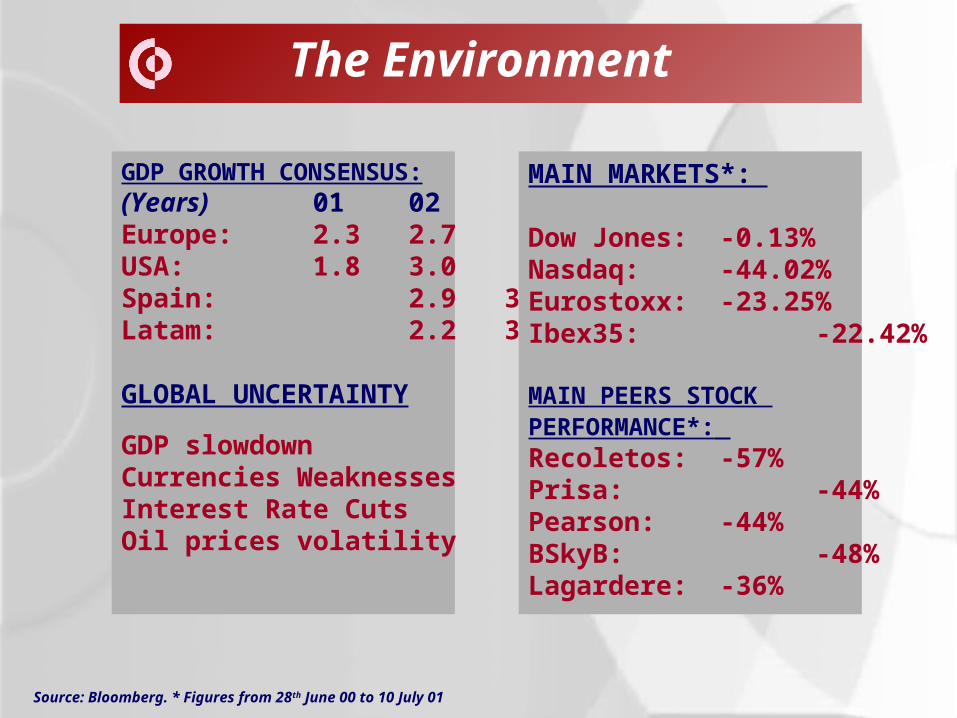
GDP GROWTH CONSENSUS:(Years) 01 02Europe: 2.3 2.7USA: 1.8 3.0Spain: 2.9 3.1Latam: 2.2 3.6
GLOBAL UNCERTAINTY
GDP slowdown Currencies WeaknessesInterest Rate CutsOil prices volatility
MAIN MARKETS*:
Dow Jones: -0.13%Nasdaq: -44.02%Eurostoxx: -23.25%Ibex35: -22.42%
MAIN PEERS STOCK PERFORMANCE*: Recoletos: -57%Prisa: -44%Pearson: -44%BSkyB: -48%Lagardere: -36%
The Environment
Source: Bloomberg. * Figures from 28th June 00 to 10 July 01

CONCLUSIONSCONCLUSIONS

ConclusionsDifficult Macroeconomic EnvironmentDifficult Macroeconomic Environment
Less Visibility in AdvertisingLess Visibility in Advertising
Balanced Business PortfolioBalanced Business Portfolio
International Growth StrategyInternational Growth Strategy
Cost reduction and efficiency improvementCost reduction and efficiency improvement
Investment Opportunities Investment Opportunities
Non-Core Business DisposalsNon-Core Business Disposals

GRUPO PRISAGRUPO PRISA1H 2001 RESULTS1H 2001 RESULTS
July 2001July 2001