Growth Investing: Cambridge Style Greg Dean, CFA Principal & Portfolio Manager.
20
Growth Investing: Cambridge Style Greg Dean, CFA Principal & Portfolio Manager
-
Upload
francis-gibbs -
Category
Documents
-
view
234 -
download
4
Transcript of Growth Investing: Cambridge Style Greg Dean, CFA Principal & Portfolio Manager.

Growth Investing: Cambridge Style
Greg Dean, CFAPrincipal & Portfolio Manager
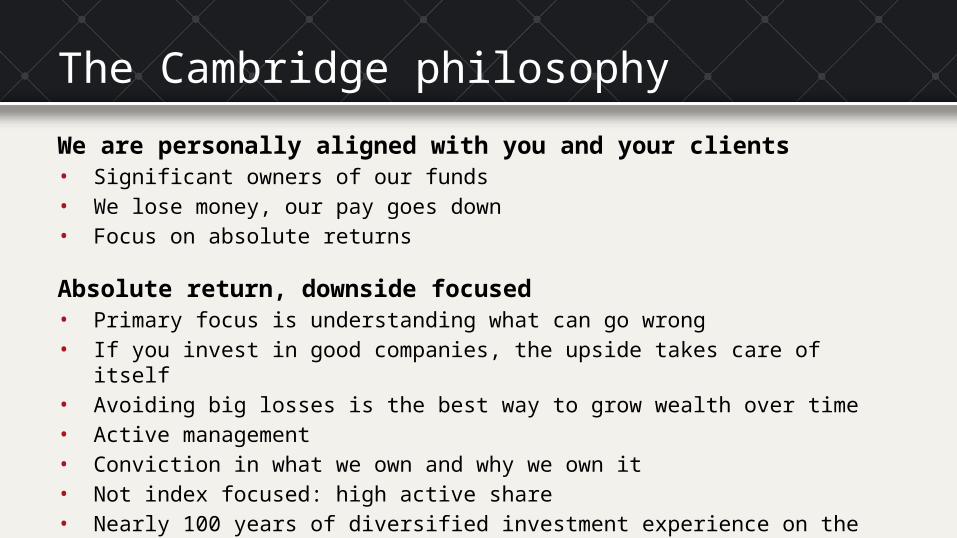
The Cambridge philosophy
We are personally aligned with you and your clients• Significant owners of our funds• We lose money, our pay goes down• Focus on absolute returns
Absolute return, downside focused• Primary focus is understanding what can go wrong• If you invest in good companies, the upside takes care of itself• Avoiding big losses is the best way to grow wealth over time• Active management• Conviction in what we own and why we own it• Not index focused: high active share• Nearly 100 years of diversified investment experience on the team

Manager checklist
ETF Manager 1 Manager 2
Manager alignmentNet worth and compensation
aligned
Active share 88-98%
Upside / downside capture
See slide 4

This fund is evolutionary not revolutionary
Core holdings Management aligned with shareholders
Strong capital allocationCompetitive advantage
Examples: Middleby Corp.
Priceline Group Inc. Starbucks Corp.
Non-core holdingsInformation edge
Emerging profitable businessThematic investing
Examples:TripAdvisor Inc.
Ocado Group PLCHargreaves Landsdown PLC
Attractive risk/reward

Core philosophical approach
Know the business first
Reinvest in the business BuybacksDividend
Value creation Total shareholder yield

The Cambridge suite of products
Diversified income & balanced
Dividend income
Equity
Small/mid-cap equity
• Cambridge High Income• Cambridge Canadian Asset
Allocation
• Cambridge Canadian Dividend
• Cambridge U.S. Dividend• Cambridge Global Dividend
• Cambridge Canadian Equity• Cambridge American Equity• Cambridge Global Equity
• Cambridge Canadian Growth Companies
• Cambridge Growth Companies
• Cambridge Pure Canadian Equity
Potential return
Pote
ntial
risk

Different geographies, same philosophy
Source: CI Investments
$13 billion in assets under management as of August 31, 2014
Canadian Equity39%
U.S. Equity32%
International Equity 13%
Fixed Income 4%
Cash & Equivalents 12%

Gross returns of Canadian and U.S. underlying holdings in Cambridge Canadian Growth Companies Fund relative to index returns
Source: CI Investments, February 2014
Different geographies, same philosophy,consistent return
23.4%
41.3%
14.4%
43.4%50.0%
110.7%
10.3%
116.3%

3-year metrics (August 31, 2014) Beta Alpha Std Dev Sharpe Ratio Upside/downside capture
Cambridge Canadian Growth Companies 0.66* 24.69* 9.0% 3.13 163.6%/-19.5%*
Average Cdn Focused Equity Small/Mid MF 0.86 4.59 12.5% 1.12 -
S&P/TSX Composite 1 0 9.9% 0.94 -
*Versus the S&P/TSX Composite Index, based on quarterly returns over 3-year periodSource: Paltrak, CI Investments
Risk management and downside protection

You make money by not losing money
Rolling one-year returns of underlying holdings in Cambridge Canadian Growth Companies Fund vs. TSX, July 2011 to March 2014
Source: CI Investments
Freq
uenc
y (a
s pe
rcen
t of t
otal
)
Downside protection

Building out our “core”
Cambridge Growth Companies Corporate Class

Defining the opportunity
Sweet spot of $1B to $10B market cap• Fantastic management access• Undercovered/underfollowed• Supernormal growth potential
Looking for secular, not cyclical growth• Resources are cyclical• ~50% of businesses that fit this criteria on S&P/TSX are mining/energy• Only 10% for Russell 2000, S&P 500, FTSE 100, FTSE Small cap
Highly concentrated fund• Ideal size of 35 businesses• Canada capped at 10% (2-5 stocks)• 10% cash is no cash – expect cash position to be 10% - 25%

What are we looking for?
• Very high ROIC / operating margins
• Low balance sheet leverage
• Demonstrated willingness/ability to inorganically allocate capital

You can profit in this market
If you have conviction in what you own• We talk to management often• Site tours and conferences
If you have flexibility• Never get married to a thesis or position• Open mandates no sector restrictions
By protecting capital• Proper diversification• No “filler” positions – we hold cash
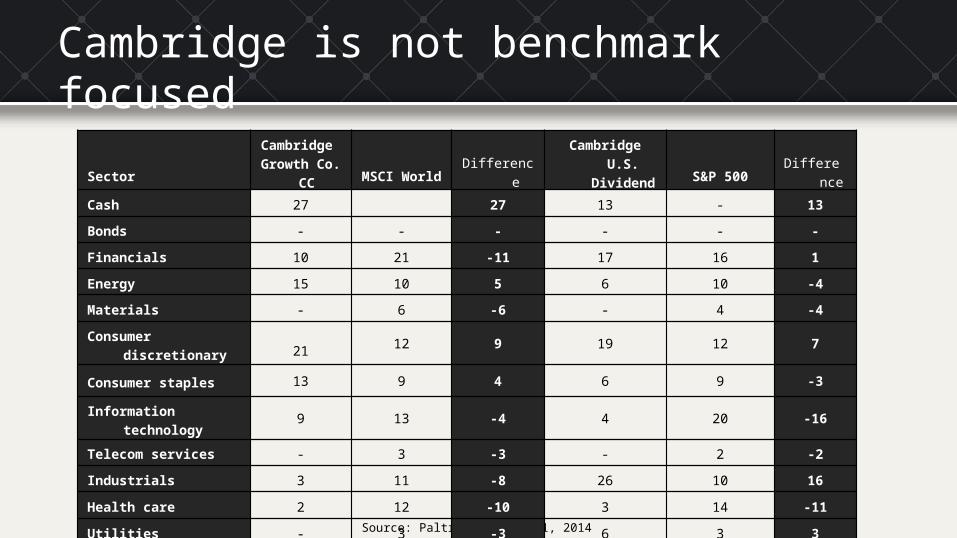
Cambridge is not benchmark focused
Source: Paltrak, August 31, 2014
Sector
Cambridge Growth Co. CC
MSCI World DifferenceCambridge U.S.
Dividend S&P 500 Difference
Cash 27 27 13 - 13
Bonds - - - - - -
Financials 10 21 -11 17 16 1
Energy 15 10 5 6 10 -4
Materials - 6 -6 - 4 -4
Consumer discretionary 21 12 9 19 12 7
Consumer staples 13 9 4 6 9 -3
Information technology 9 13 -4 4 20 -16
Telecom services - 3 -3 - 2 -2
Industrials 3 11 -8 26 10 16
Health care 2 12 -10 3 14 -11
Utilities - 3 -3 6 3 3

Cambridge is not benchmark focused
Source: CI Investments
Cambridge Growth Companies C.C.Top holdings
as at August 31, 2014
CGI Group 3.6%
Signature Bank of New York 3.5%
Tourmaline Oil 3.3%
Dollarama 3.0%
Priceline.com 2.9%
Cap Gemini 2.9%
Burger King Worldwide 2.8%
Kelt Exploration 2.7%
Encana 2.7%
Allison Transmission Holdings 2.7%
Total 30.1%
Cambridge U.S. Dividend FundTop holdings
as at August 31, 2014
Norfolk Southern 5.3%
US Bancorp 5.3%
First Republic Bank 5.2%
Thomson Reuters 5.1%
Home Depot 4.5%
Adecco 4.4%
Allison Transmission Holdings 4.0%
Microsoft 3.9%
United Parcel Service 3.9%
Anheuser-Busch InBev 3.9%
Total 45.3%

Source: RBC Investor & Treasury Services, August 31, 2014
Cambridge offers a variety of mandates
FundFund Code
Assets(million)
Foreign Content
Cambridge Canadian Equity Corporate Class CIG2321 $3,690.8 maximum 49%
Cambridge Canadian Asset Allocation Corporate Class CIG2322 $2,254.9 maximum 49%
Cambridge Canadian Growth Companies Fund CIG11108 $755.6 maximum 49%
Cambridge Pure Canadian Equity Fund CIG11109 $260.9 maximum 10%
Cambridge Global Dividend Fund CIG2639 $199.9 no restrictions
Cambridge Global Equity Corporate Class CIG2323 $1,752.7 no restrictions
Cambridge High Income Fund CIG6803 $702.0 no restrictions
Cambridge American Equity Corporate Class CIG294 $665.0 no restrictions
Cambridge American Equity Fund CIG 212 $238.0 no restrictions

Have you seen our blog?
Visit and sign up for our frequently updated blog at:
http://blogs.ci.com/cambridge
“It’s far better to buy a wonderful company at a fair price than a fair company at a wonderful price.”
Warren Buffet

Commissions, trailing commissions, management fees and expenses may be associated with mutual fund investments. Please read the prospectus before investing. Unless otherwise indicated and except for returns for periods less than one year, the indicated rates of return are the historical annual compounded total returns including changes in security value. All performance data assume reinvestment of all distributions or dividends and do not take into account sales, redemption, distribution or optional charges or income taxes payable by any securityholder that would have reduced returns. Mutual funds are not guaranteed, their values change frequently and past performance may not be repeated. ®CI Investments, the CI Investments design and Cambridge are registered trademarks of CI Investments Inc. Cambridge Global Asset Management is a business name of CI Investments Inc. used in connection with its subsidiary, CI Global Investments Inc. Certain portfolio managers of Cambridge Global Asset Management are registered with CI Investments Inc. This communication is published by CI as a general source of information and is not intended to provide personal legal, accounting, investment or tax advice. Facts and data provided by CI and other sources are believed to be reliable when posted; however, CI cannot guarantee that they are accurate or complete or that they will be current at all times. CI and its affiliates will not be responsible in any manner for direct, indirect, special or consequential damages howsoever caused, arising out of the use of this presentation.
Thank you
FOR ADVISOR USE ONLY – NOT FOR DISTRIBUTION TO CLIENTS

Appendix – Cambridge performance
1 year 3 year 5 yearSince
inception
Cambridge Canadian Equity Corporate Class 23.0% 18.9% 15.1% 8.9%*
Cambridge Canadian Asset Allocation Corporate Class 15.9% 9.6% 10.1% 6.2%*
Cambridge Canadian Growth Companies Fund 30.5% 32.8% n/a 28.0%**
Cambridge Pure Canadian Equity Fund 39.3% 33.7% n/a 28.3%**
Cambridge Global Dividend Fund 18.0% n/a n/a 16.4%
Cambridge Global Equity Corporate Class 20.3% 17.4% 11.5% 7.1%*
Cambridge High Income Fund 16.8% 10.3% 12.4% 10.7%
Cambridge American Equity Fund 26.6% 18.5% 12.2% 7.1%
Performance as at August 31, 2014
*Dec. 31, 2007; **Feb. 15, 2011; Jul. 31, 2013; Jul 2, 2004; May 25, 1989
Source: RBC Investor & Treasury Services, August 31, 2014