
Growth, Inequality, and Social Welfare - World Bank · Growth, Inequality, and Social Welfare David...
68
Growth, Inequality, and Social Welfare David Dollar (Brookings) Tatjana Kleineberg (Yale) Aart Kraay (World Bank) World Bank DECRG Policy Research Talk June 24, 2014
Transcript of Growth, Inequality, and Social Welfare - World Bank · Growth, Inequality, and Social Welfare David...

Growth, Inequality, and Social Welfare
David Dollar (Brookings)
Tatjana Kleineberg (Yale)
Aart Kraay (World Bank)
World Bank DECRG Policy Research Talk
June 24, 2014

Widespread concerns about rising inequality within countries
• US economy is a “winner-take-all economy where a few do better and better, while everybody else just treads water”
– Barack Obama, July 24, 2013 speech

Widespread concerns about rising inequality within countries
• US economy is a “winner-take-all economy where a few do better and better, while everybody else just treads water”
– Barack Obama, July 24, 2013 speech
• “Within most countries, income inequality is rising”
– Angus Deaton (2014), Science
• “r>g”
– Thomas Piketty (2014)
• “We are the 99%”
– Occupy Wall Street
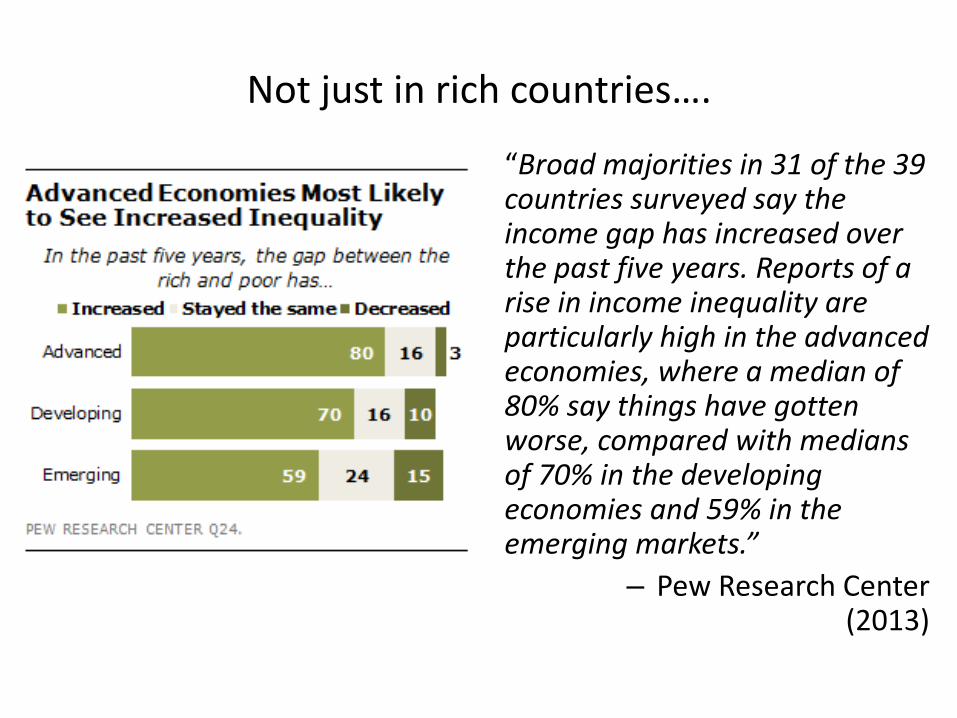
Not just in rich countries….
“Broad majorities in 31 of the 39 countries surveyed say the income gap has increased over the past five years. Reports of a rise in income inequality are particularly high in the advanced economies, where a median of 80% say things have gotten worse, compared with medians of 70% in the developing economies and 59% in the emerging markets.”
– Pew Research Center (2013)

Evidence on Inequality Trends is Mixed
• Inequality has increased in some countries, particularly due to gap between top end and everyone else
– US: Gini increases from 30 to 40 in past 40 years
– China: Gini increases from 32 to 42 in past 20 years
– Atkinson/Piketty/Saez data show big increases in top 1% income share in countries like United States, United Kingdom
• But inequality has remained stable in other countries, and fallen in still others
– Brazil: Gini falls from 60 to 55 during 2000s
– Atkinson/Piketty/Saez data show stable top 1% income share in countries like Japan, Switzerland, Germany


How Much Do These Changes in Inequality (in Either Direction) Matter?

How Much Do These Changes in Inequality (in Either Direction) Matter?
• Matter for what?
– Intrinsic notions of fairness?
– Economic outcomes like growth, institutions, etc.?
– Many other possibilities…..
How Much Do These Changes in Inequality (in Either Direction) Matter?
• Matter for what?
– Intrinsic notions of fairness?
– Economic outcomes like growth, institutions, etc.?
– Many other possibilities…..
• Focus in this talk on one very modest question: how much do trends in inequality matter for social welfare?
– Use several standard social welfare functions to value changes in inequality in terms of percentage points of growth in average incomes
• Useful way of thinking about whether changes in inequality are “big” or “small” relative to growth
• Useful to remember what inequality measures imply for social preferences across individuals

Illustration
• World Bank’s goal of “shared prosperity”, i.e. growth in average incomes in bottom 40%
– Social welfare function is average incomes in bottom 40%

Illustration
• World Bank’s goal of “shared prosperity”, i.e. growth in average incomes in bottom 40%
– Social welfare function is average incomes in bottom 40%
• Example: In China between 1990 and 2007…
Growth in Average Incomes 6.7%

Illustration
• World Bank’s goal of “shared prosperity”, i.e. growth in average incomes in bottom 40%
– Social welfare function is average incomes in bottom 40%
• Example: In China between 1990 and 2007…
Growth in Average Incomes 6.7%
+ Growth in Income Share of Bottom 40% -1.7%

Illustration
• World Bank’s goal of “shared prosperity”, i.e. growth in average incomes in bottom 40%
– Social welfare function is average incomes in bottom 40%
• Example: In China between 1990 and 2007…
Growth in Average Incomes 6.7%
+ Growth in Income Share of Bottom 40% -1.7%
= Growth in Social Welfare: 5.0%
• Two key ingredients
– Choose a social welfare function
– Decompose into growth and (in)equality change
• Both in units of income growth

Rest of Talk
• Review some common social welfare functions and what they imply for social preferences across individuals (nothing novel here)
• New empirical evidence on decomposition of social welfare growth into contributions of
– Growth in average incomes
– Growth in equality
– Relate both to determinants of growth and inequality from cross-country literature

Some Useful Social Welfare Functions
• Specific Examples
• Welfare Weights and Shared Prosperity

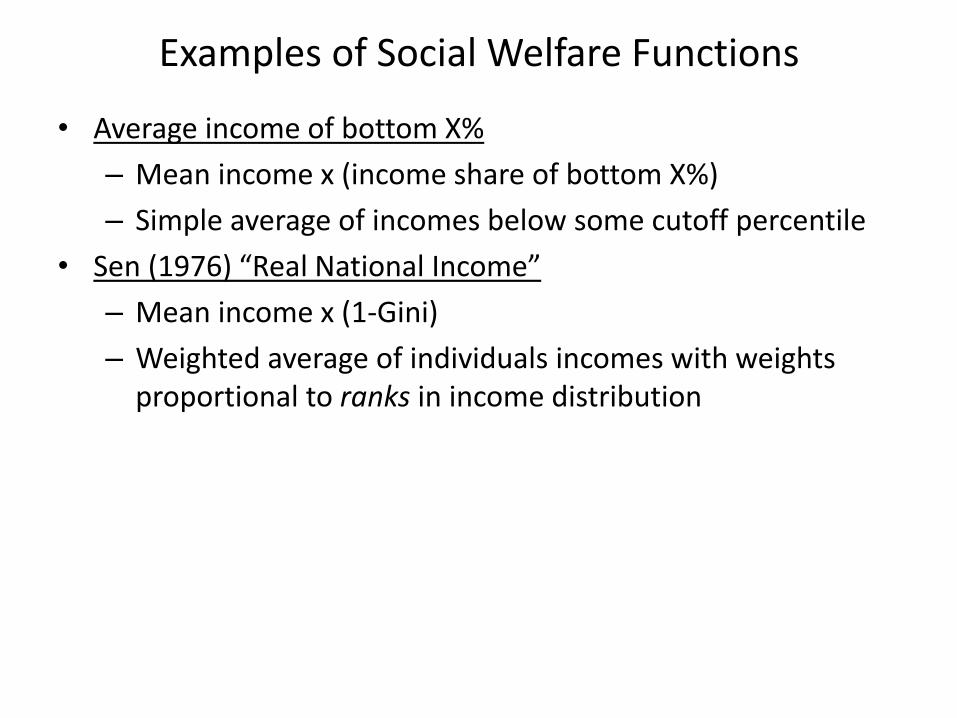
Examples of Social Welfare Functions
• Average income of bottom X%
– Mean income x (income share of bottom X%)
– Simple average of incomes below some cutoff percentile
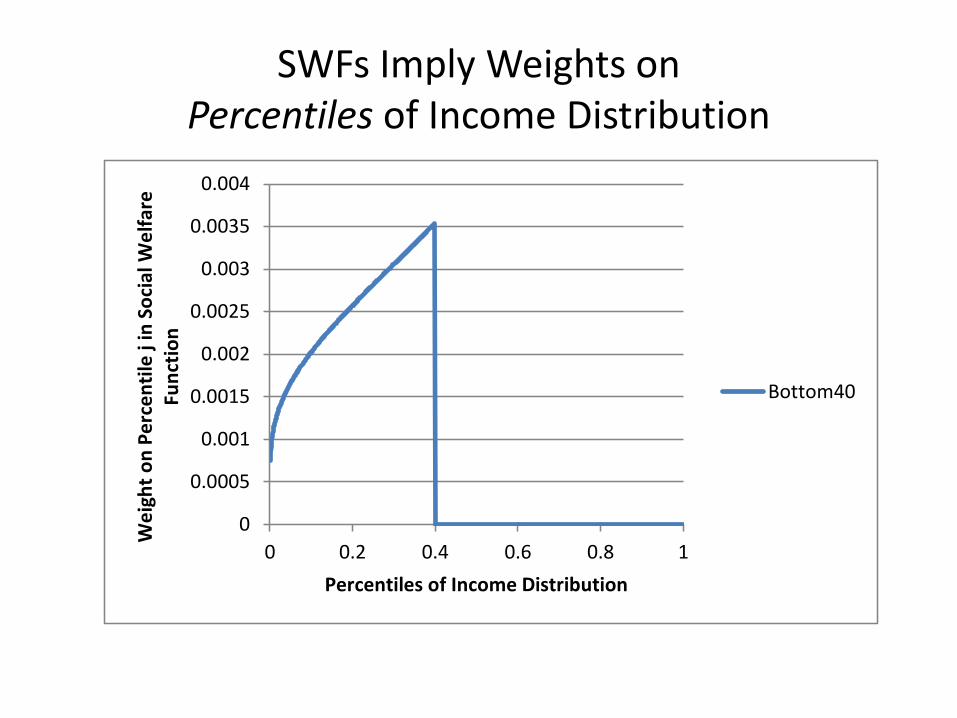
SWFs Imply Weights on Percentiles of Income Distribution
0
0.0005
0.001
0.0015
0.002
0.0025
0.003
0.0035
0.004
0 0.2 0.4 0.6 0.8 1
We
igh
t o
n P
erc
en
tile
j in
So
cial
We
lfar
e
Fun
ctio
n
Percentiles of Income Distribution
Bottom40
Examples of Social Welfare Functions
• Average income of bottom X%
– Mean income x (income share of bottom X%)
– Simple average of incomes below some cutoff percentile
• Sen (1976) “Real National Income”
– Mean income x (1-Gini)
– Weighted average of individuals incomes with weights proportional to ranks in income distribution

0
0.0005
0.001
0.0015
0.002
0.0025
0.003
0.0035
0.004
0 0.2 0.4 0.6 0.8 1
We
igh
t o
n P
erc
en
tile
j in
So
cial
We
lfar
e
Fun
ctio
n
Percentiles of Income Distribution
Bottom40
Sen
SWFs Imply Weights on Percentiles of Income Distribution

Examples of Social Welfare Functions
• Average income of bottom X%
– Mean income x (income share of bottom X%)
– Simple average of incomes below some cutoff percentile
• Sen (1976) “Real National Income”
– Mean income x (1-Gini)
– Weighted average of individuals incomes with weights proportional to ranks in income distribution
• Atkinson SWF
– Mean income x (1-Atkinson Inequality Index)
– Average of incomes raised to power 1-θ, higher θ means more inequality aversion
• θ=0 gives back simple average incomes

SWFs Imply Weights on Percentiles of Income Distribution
0
0.0005
0.001
0.0015
0.002
0.0025
0.003
0.0035
0.004
0.0045
0.005
0 0.2 0.4 0.6 0.8 1
We
igh
t o
n P
erc
en
tile
j in
So
cial
We
lfar
e
Fun
ctio
n
Percentiles of Income Distribution
Bottom40
Sen
Atkinson(0)

SWFs Imply Weights on Percentiles of Income Distribution
0
0.0005
0.001
0.0015
0.002
0.0025
0.003
0.0035
0.004
0.0045
0.005
0 0.2 0.4 0.6 0.8 1
We
igh
t o
n P
erc
en
tile
j in
So
cial
We
lfar
e
Fun
ctio
n
Percentiles of Income Distribution
Bottom40
Sen
Atkinson(0)
Atkinson(1)

SWFs Imply Weights on Percentiles of Income Distribution
0
0.0005
0.001
0.0015
0.002
0.0025
0.003
0.0035
0.004
0.0045
0.005
0 0.2 0.4 0.6 0.8 1
We
igh
t o
n P
erc
en
tile
j in
So
cial
We
lfar
e
Fun
ctio
n
Percentiles of Income Distribution
Bottom40
Sen
Atkinson(0)
Atkinson(1)
Atkinson (2)

Welfare Weights Worth Taking Seriously
• Shared prosperity target implies welfare weights that:
– Are zero above 40th percentile
– Increase with income for those below the 40th percentile

Welfare Weights Worth Taking Seriously
• Shared prosperity target implies welfare weights that:
– Are zero above 40th percentile
– Increase with income for those below the 40th percentile
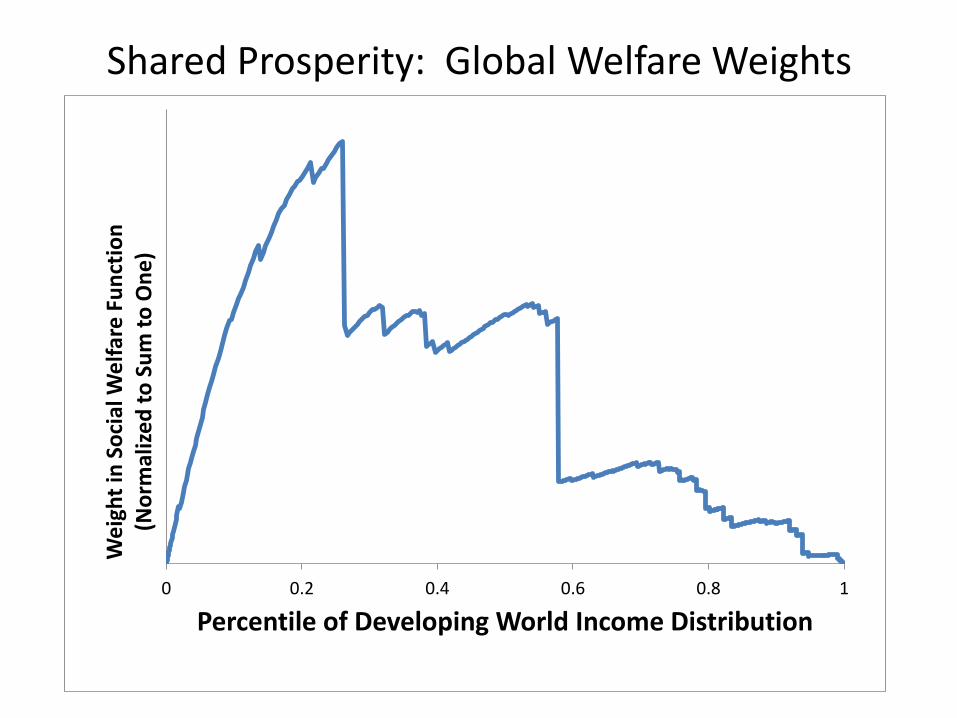
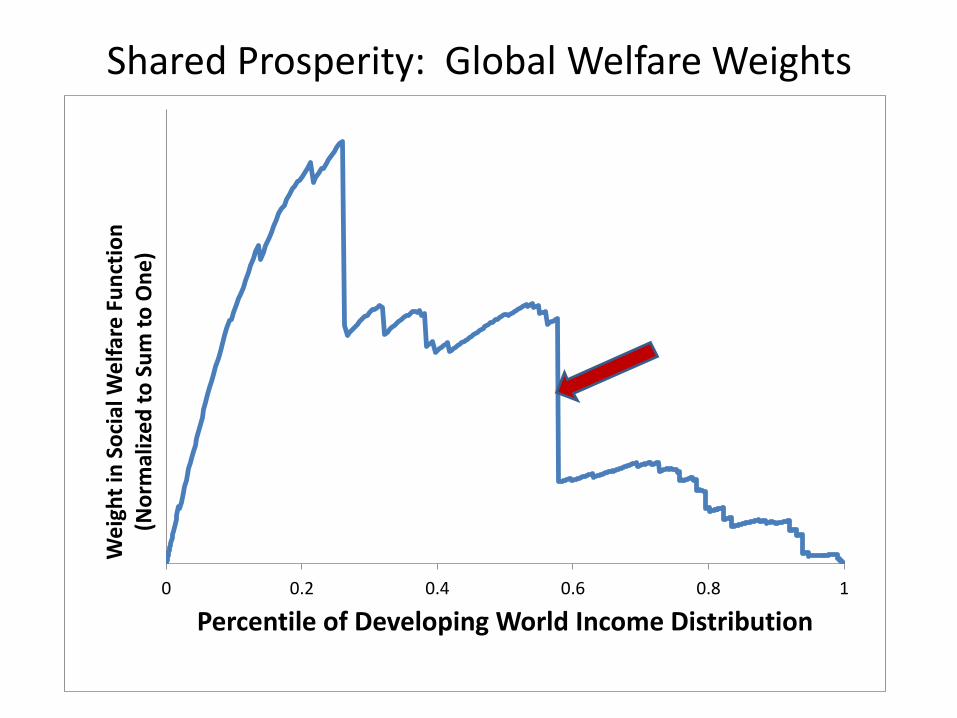
• What does shared prosperity target at country level imply for welfare weights in world?
– Not everyone in bottom 40 percent of world is also in bottom 40 percent of their own country
– Welfare weights still are proportional to incomes for those who are in bottom 40 percent of their own country
– Implies hump-shaped welfare weights across percentiles of world distribution
Shared Prosperity: Global Welfare Weights
0 0.2 0.4 0.6 0.8 1
We
igh
t in
So
cial
We
lfar
e F
un
ctio
n(N
orm
aliz
ed
to
Su
m t
o O
ne
)
Percentile of Developing World Income Distribution

Shared Prosperity: Global Welfare Weights
0 0.2 0.4 0.6 0.8 1
We
igh
t in
So
cial
We
lfar
e F
un
ctio
n(N
orm
aliz
ed
to
Su
m t
o O
ne
)
Percentile of Developing World Income Distribution

Shared Prosperity: Global Welfare Weights
0 0.2 0.4 0.6 0.8 1
We
igh
t in
So
cial
We
lfar
e F
un
ctio
n(N
orm
aliz
ed
to
Su
m t
o O
ne
)
Percentile of Developing World Income Distribution
Shared Prosperity: Global Welfare Weights
0 0.2 0.4 0.6 0.8 1
We
igh
t in
So
cial
We
lfar
e F
un
ctio
n(N
orm
aliz
ed
to
Su
m t
o O
ne
)
Percentile of Developing World Income Distribution

Global Welfare Weights for Twin Goals
0 0.2 0.4 0.6 0.8 1
We
igh
t in
So
cial
We
lfar
e F
un
ctio
n(N
orm
aliz
ed
to
Su
m t
o O
ne
)
Percentile of Developing World Income Distribution
Bottom 40%
$1.25/Day
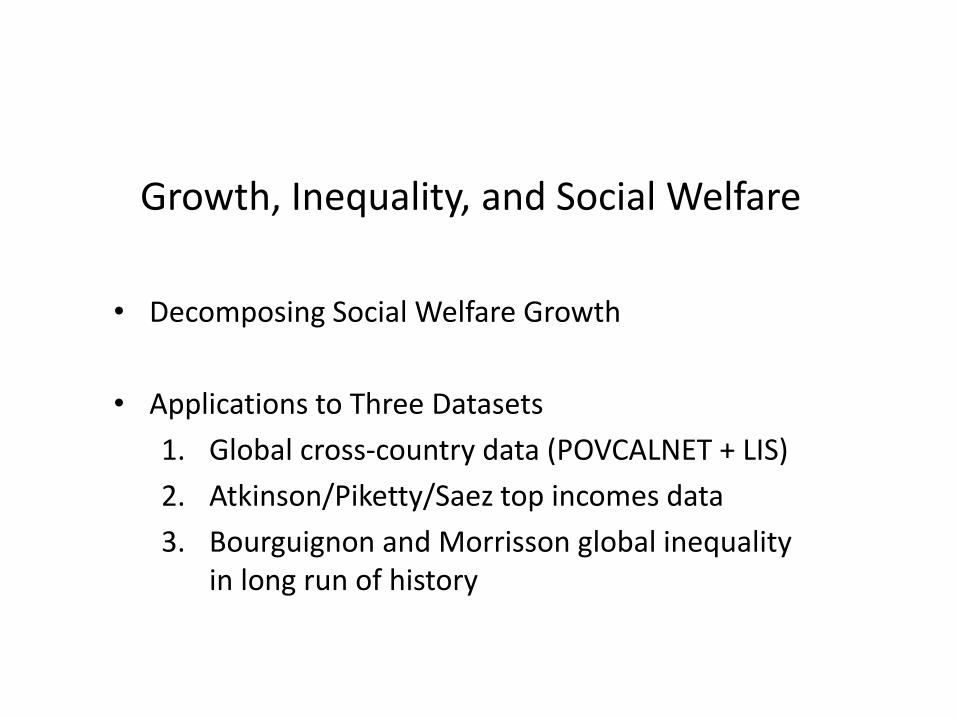
Growth, Inequality, and Social Welfare
• Decomposing Social Welfare Growth
• Applications to Three Datasets
1. Global cross-country data (POVCALNET + LIS)
2. Atkinson/Piketty/Saez top incomes data
3. Bourguignon and Morrisson global inequality in long run of history

Decomposing Growth in Social Welfare
Growth in Growth in Growth in
Social = Mean + Relevant
Welfare Income Equality
Measure
• First term is contribution of distribution-neutral growth to growth in social welfare
• Second term is “cost”/”benefit” of equality change in percentage points of welfare (and income) growth

Application 1: POVCALNET+LIS
• Large irregularly-spaced cross-country panel on average income/consumption and decile shares based on:
– POVCALNET – for developing countries
– LIS – for OECD countries
• High-quality sample based directly on primary data from household surveys
• Most results based on sample of “spells” at least 5 years long, ensuring both end-points of spell are same type

Growth and Social Welfare
SWF=Bottom 40%, aka “Shared Prosperity”

Growth and Social Welfare
SWF=Sen’s Real National Income

Growth and Social Welfare
SWF=Atkinson A(1)

Thought Experiment – Which Distribution Do You want to Draw Welfare Growth From?

Thought Experiment – Which Distribution Do You want to Draw Welfare Growth From?

Thought Experiment – Which Distribution Do You want to Draw Welfare Growth From?

Thought Experiment – Which Distribution Do You want to Draw Welfare Growth From?
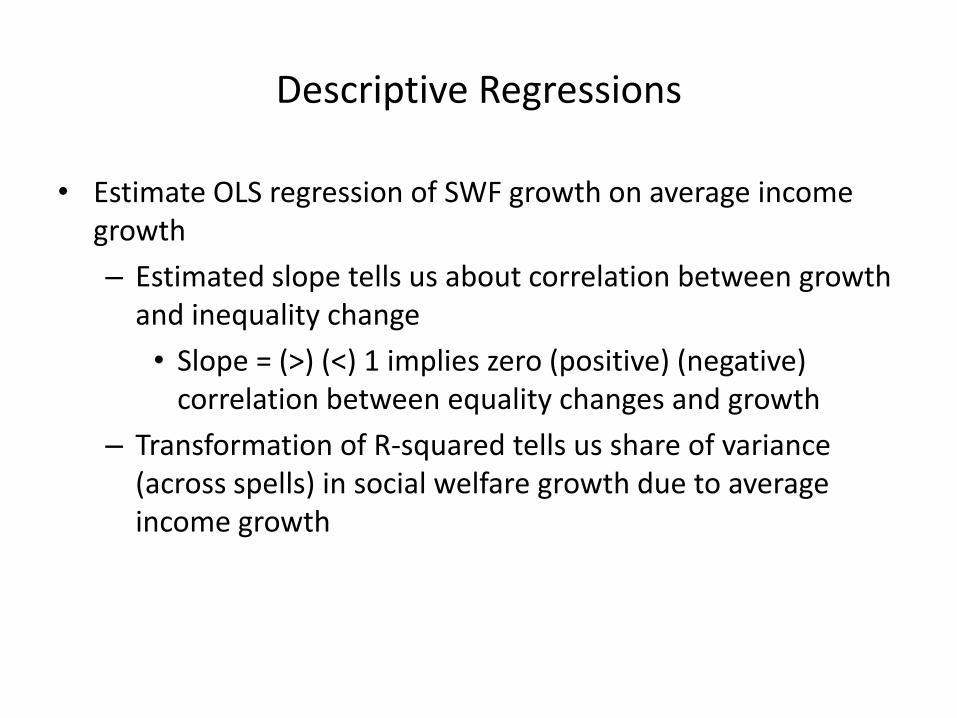
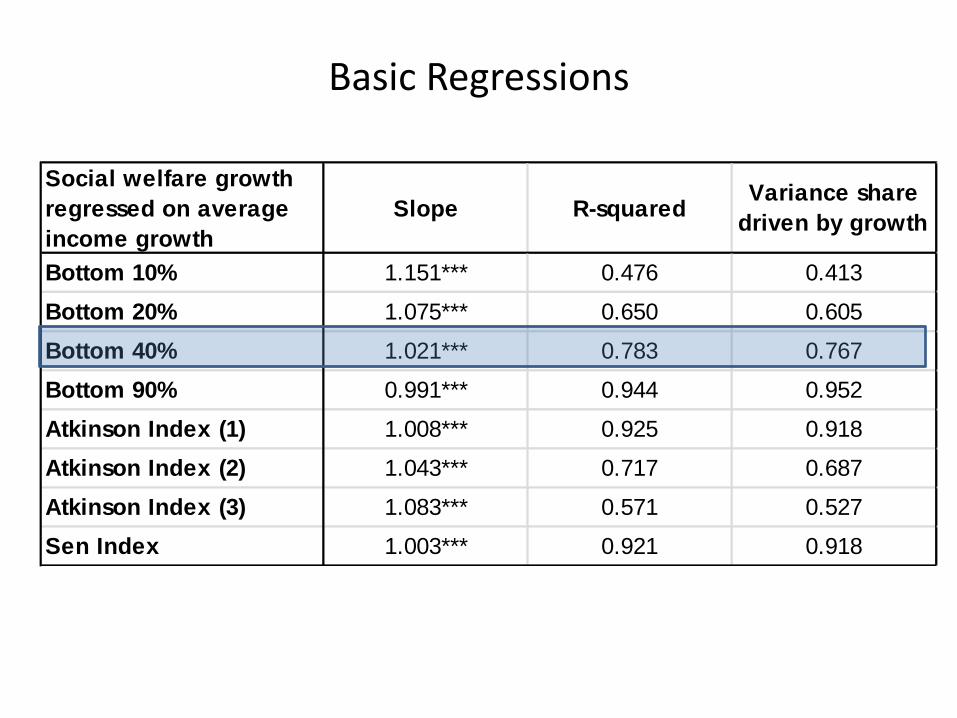
Descriptive Regressions
• Estimate OLS regression of SWF growth on average income growth
– Estimated slope tells us about correlation between growth and inequality change
• Slope = (>) (<) 1 implies zero (positive) (negative) correlation between equality changes and growth
– Transformation of R-squared tells us share of variance (across spells) in social welfare growth due to average income growth

Basic Regressions
Social welfare growth
regressed on average
income growth
Slope R-squaredVariance share
driven by growth
Bottom 10% 1.151*** 0.476 0.413
Bottom 20% 1.075*** 0.650 0.605
Bottom 40% 1.021*** 0.783 0.767
Bottom 90% 0.991*** 0.944 0.952
Atkinson Index (1) 1.008*** 0.925 0.918
Atkinson Index (2) 1.043*** 0.717 0.687
Atkinson Index (3) 1.083*** 0.571 0.527
Sen Index 1.003*** 0.921 0.918

Application 2: Piketty Top Incomes Data: United States 1950-2010
81
01
21
41
61
8
Top
1%
In
com
e S
hare
(%
)
1950 1960 1970 1980 1990 2000 2010Year
Top 1% Income Share in the United States, 1950-2010

Application 2: Piketty Top Incomes Data: United States 1950-2010
10
10.2
10.4
10.6
10.8
Log
201
2 U
SD
1950 1960 1970 1980 1990 2000 2010Year
Mean Income Social Welfare (Epsilon=0.25)
Social Welfare (Epsilon=0.5)
Income and Social Welfare in the United States, 1950-2010

Application 2: Piketty Top Incomes Data: United States 1950-2010
10
10.2
10.4
10.6
10.8
11
Log
201
2 U
SD
1950 1960 1970 1980 1990 2000 2010Year
Mean Income Social Welfare (Epsilon=0.25)
Social Welfare (Epsilon=0.5)
Income and Social Welfare in the United States, 1950-2010

Application 2: Piketty Top Incomes Data: All Countries 1950-1980 (red) 1980-2010 (blue)
Australia
CanadaDenmark
FranceGermany
Japan
Netherlands
New Zealand
Norway
South Africa
Sweden
Switzerland
United Kingdom
United States
Australia
Canada
China
Denmark
FranceGermany
Italy
Japan
Malaysia
Mauritius
Netherlands
New Zealand
Norway
Portugal
Singapore
SpainSweden
Switzerland
United Kingdom
United States
-20
24
68
So
cia
l w
elfare
gro
wth
(%
per
yea
r)
-2 0 2 4 6 8Mean income growth (% per year)
1950-1980 1980-2010
Income Growth versus Social Welfare Growth, 1950-1980 and 1980-2010

Application 3: Bourguignon and Morrisson (2002): Growth In Sen SWF For World
-0.005
0
0.005
0.01
0.015
0.02
0.025
0.03
Ave
rage
An
nu
al G
row
th
Inequality
Mean

Two Nerdy Digressions
• Why is the share of variance of social welfare growth due to growth in average incomes lower for more bottom-sensitive SWFs?
– Partly due to sampling variation that introduces more variability in poorest income shares
Two Nerdy Digressions
• Why is the share of variance of social welfare growth due to growth in average incomes lower for more bottom-sensitive SWFs?
– Partly due to sampling variation that introduces more variability in poorest income shares
• What if you prefer another SWF?
– Use concept of generalized Lorenz dominance to rank “final” distribution relative to “initial” distribution for each spell
– Any increasing concave SWF would have moved in same direction as mean in 75% of spells

Correlates of Growth and Equality Change

Correlates of Growth and Equality Changes
• Regress growth and equality measures on:
– Initial income
– Initial equality
– Usual suspects from cross-country literature
• Financial development, trade openness, financial openness, inflation rate, government budget balance, life expectancy, population growth, civil liberties/political rights, revolutions, war dummy
• Primary enrollment, educational inequality, share of agriculture in GDP

Correlates of Growth and Equality Changes
• Estimated “effects” on growth and equality sum to “effects” on social welfare
• To avoid cherrypicking favourite specifications, use Bayesian Model Averaging to combine results from all 2^13 combinations of RHS variables
• Lowbrow estimation by OLS on irregularly-spaced panel of pooled spells
– Least-bad alternative? (Hauk and Wacziarg)

Overview of BMA Results
Growth in Growth in Growth in
Mean Equality Social Welfare
• Initial Income <0 0 <0
• Strong mean reversion in income

Overview of BMA Results
Growth in Growth in Growth in
Mean Equality Social Welfare
• Initial Income <0 0 <0
• Initial Inequality <0
• Strong mean reversion in income
• Strong mean reversion in inequality

Overview of BMA Results
Growth in Growth in Growth in
Mean Equality Social Welfare
• Initial Income <0 0 <0
• Initial Inequality 0 <0 <0
• Strong mean reversion in income
• Strong mean reversion in inequality
• Little evidence that initial equality is correlated with subsequent growth

Overview of BMA Results
Growth in Growth in Growth in
Mean Equality Social Welfare
• Initial Income <0 0 <0
• Initial Inequality 0 <0 <0
• Strong mean reversion in income
• Strong mean reversion in inequality
• Little evidence that initial equality is correlated with subsequent growth
Faster social welfare growth in countries that are initially poor and initially unequal

Overview of BMA Results
• Magnitude and significance of effects of other variables on growth generally larger than effects on equality changes
• Some examples of tradeoffs, e.g. share of agriculture in GDP is fairly significantly correlated with:
– Slower growth
– Increases in equality
– But magnitude of growth effect is much larger so unambiguously bad for social welfare growth

Summary
• Social welfare functions provide an off-the-shelf useful tool for valuing effects of inequality changes
– Provides useful perspective on what we mean by “shared prosperity”
• Evidence from three datasets shows most of the variation in growth in social welfare is due to growth in average incomes
– Changes in inequality are on average small and uncorrelated with growth in average incomes
• Most of correlation between “growth determinants” and growth in social welfare due to effects on growth in average incomes
– Little systematic evidence on correlates of inequality change

Implications
• Growing emphasis on inequality in recent policy discussion raises question of how much it matters
• Inequality changes have on average contributed much less to social welfare growth than differences in average growth performance across countries
• Emphasis on inequality in development policy discussions should not come at expense of focus on growth


![Milanovic Global Inequality.sg1[1] - World Bank€¦ · Global inequality and the global inequality extraction ratio: The story of the past two centuries Branko Milanovic1 World Bank](https://static.fdocuments.net/doc/165x107/5af38f967f8b9a5b1e8b4c87/milanovic-global-1-world-bank-global-inequality-and-the-global-inequality.jpg)


