Growth in Singapore's Export Markets, 1991-96: A Shift-Share/media/MAS/Monetary Policy and...The...
52
Occasional Paper No. 4 February 1998 Economics Department Monetary Authority of Singapore Growth in Singapore's Export Markets, 1991-96: A Shift-Share Analysis
Transcript of Growth in Singapore's Export Markets, 1991-96: A Shift-Share/media/MAS/Monetary Policy and...The...
Occasional Paper No. 4February 1998
Economics DepartmentMonetary Authority of Singapore
Growth in Singapore'sExport Markets, 1991-96:
A Shift-Share Analysis

GROWTH INSINGAPORE’S EXPORT MARKETS, 1991-96:
A SHIFT-SHARE ANALYSIS
BY
DOMESTIC ECONOMY DIVISION*ECONOMICS DEPARTMENT
MONETARY AUTHORITY OF SINGAPORE
FEBRUARY 1998
* THE VIEWS IN THIS PAPER ARE SOLELY THOSE OF THE STAFF OF THE DOMESTIC ECONOMY DIVISION, AND SHOULD NOT BE ATTRIBUTED TO THE MONETARY AUTHORITY OF SINGAPORE
THE MONETARY AUTHORITY OF SINGAPORE
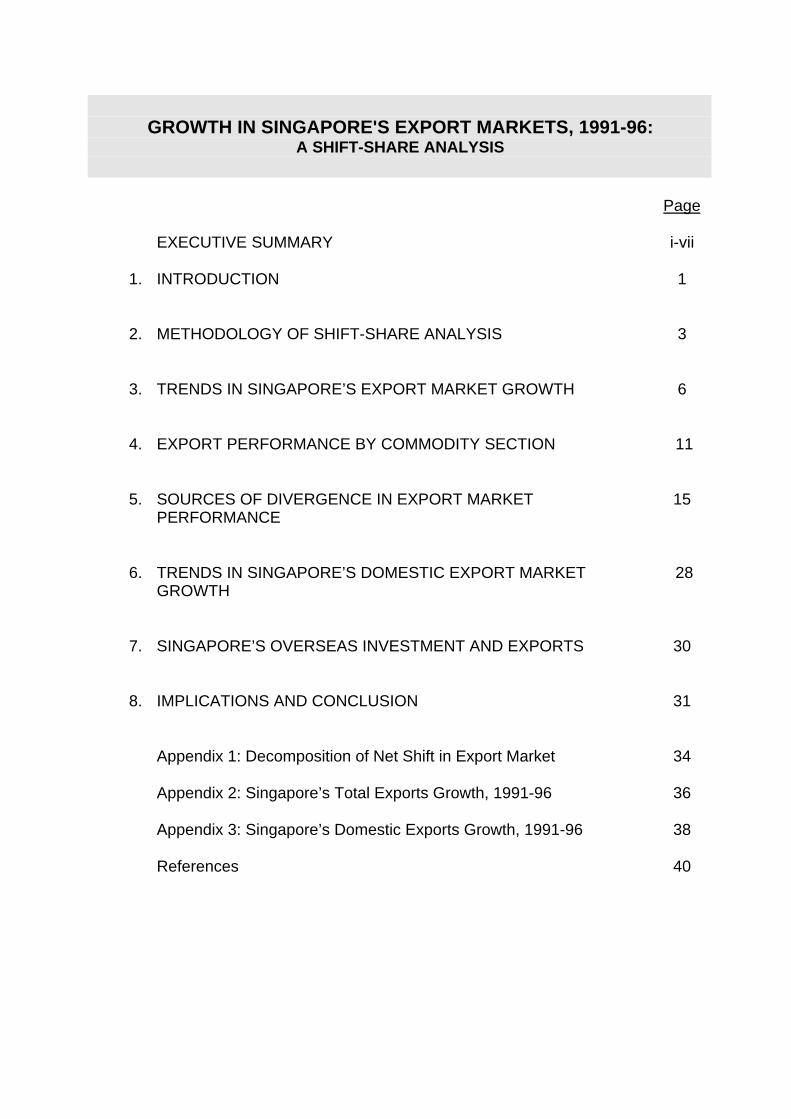
GROWTH IN SINGAPORE'S EXPORT MARKETS, 1991-96:A SHIFT-SHARE ANALYSIS
Page
EXECUTIVE SUMMARY i-vii
1. INTRODUCTION 1
2. METHODOLOGY OF SHIFT-SHARE ANALYSIS 3
3. TRENDS IN SINGAPORE’S EXPORT MARKET GROWTH 6
4. EXPORT PERFORMANCE BY COMMODITY SECTION 11
5. SOURCES OF DIVERGENCE IN EXPORT MARKETPERFORMANCE
15
6. TRENDS IN SINGAPORE’S DOMESTIC EXPORT MARKETGROWTH
28
7. SINGAPORE’S OVERSEAS INVESTMENT AND EXPORTS 30
8. IMPLICATIONS AND CONCLUSION 31
Appendix 1: Decomposition of Net Shift in Export Market 34
Appendix 2: Singapore’s Total Exports Growth, 1991-96 36
Appendix 3: Singapore’s Domestic Exports Growth, 1991-96 38
References 40
MAS Occasional Paper No. 4, Feb 98
Economics Department, Monetary Authority of Singapore
i
EXECUTIVE SUMMARY
1 Singapore's total exports have seen rapid growth over the last three
decades, reflecting the outward orientation of the economy and strong growth in
world trade. But given the openness of the economy, the spatial pattern and
composition of Singapore's exports are susceptible to changes in regional and
global economic trends. This paper employed the methodology of shift-share
analysis to examine the trends in Singapore's export market growth over 1991-96.
Exports data at the 3-digit Standard Industrial Trade Classification (SITC) are from
Singapore Trade Statistics: Imports and Exports compiled by the Singapore Trade
Development Board (TDB [various issues]), which do not include trade with
Indonesia. Markets which saw an increase in exports greater than that implied by
Singapore’s overall export growth rate are said to have experienced positive net
shifts in exports, and conversely for negative net shifts. These shifts in exports
are then decomposed into sources of divergence, namely, industry mix effect;
regional effect; and interaction effect, from which implications for Singapore’s
conduct of international trade could be drawn.
2 Industry Mix Effect captures that portion of the export divergence
that is due to the difference between a country’s composition of exports to a market
and the composition of that country’s total exports. A positive (negative) effect
results when the proportion of exports to a market in fast growing commodities is
greater (smaller) than the proportion of the country’s overall exports in these
commodities. Regional Effect measures the effect of differential growth of various
export commodities to a market compared to other markets. Interaction Effect
measures that portion of the net shift due to the difference in mix of commodity
exports to the various markets interacting with the difference in growth of
commodity exports to these markets.
Best and Worst Performing Export Markets
3 Our analysis showed that Malaysia recorded the largest positive net
shift for Singapore’s exports from 1991-1996, followed by Hong Kong, China,
Ireland and France. At the other end of the scale, the US, Germany, Thailand, Italy
and Japan had, in that order, the largest negative net shifts. Export markets with
positive net shifts increased their share of Singapore's total exports, and conversely
for those with negative net shifts.

MAS Occasional Paper No. 4, Feb 98
Economics Department, Monetary Authority of Singapore
ii
4 On a regional level, Singapore’s exports to ASEAN-5 (i.e. Malaysia,
Thailand, the Philippines, Brunei and Myanmar) posted the largest positive net shift.
This reflects the increasing importance of the ASEAN countries as Singapore's
export markets. After ASEAN-5, the East Asian market of China, Hong Kong,
Japan, South Korea and Taiwan experienced the next largest positive net shift. On
the other hand, Singapore's exports to the North American market – the US and
Canada – experienced the largest negative net shift, followed by the European
Union.
Export Performance by Commodity Section
5 A decomposition of Singapore's net shifts in exports by commodity
revealed that Singapore's strong export performance in Malaysia, Hong Kong,
China, Ireland and France was underpinned by the rapid growth in exports of
machinery & transport equipment (SITC 7), comprising largely electronics, to these
countries. Even among the five export markets with the largest negative net shifts,
viz. the US, Germany, Thailand, Italy and Japan, Singapore’s exports of machinery
& transport equipment grew faster than its overall export growth except in Germany
and Italy.
6 Within the SITC 7 category, exports of office & data machines (SITC
75), and electrical machinery (SITC 77) were largely responsible for the positive net
shifts. The strong growth in electronics exports to these five markets reflected
Singapore's favourable industrial structure that was skewed towards an industry
experiencing rapid growth over the last several years.
7 Singapore's exports of mineral fuels (SITC 3), comprising primarily
refined petroleum products, did not grow as fast as its overall exports. With the
exception of China, Hong Kong and Ireland, all the other markets registered a
negative net shift, reflecting the state of an industry beset by over-capacity and low
refining margins. Singapore faces increasing competition from South Korea and the
Middle East, notably Saudi Arabia. Moreover, increased import-substitution by
Thailand and Malaysia has limited Singapore's exports to these countries.
8 Exports of chemicals and related products (SITC 5), in general, also
grew slower than Singapore's overall exports. Among the ten major export
markets, the US experienced the largest negative net shift, followed by Malaysia
and Japan. However, with projected healthy growth and capacity expansion for the
MAS Occasional Paper No. 4, Feb 98
Economics Department, Monetary Authority of Singapore
iii
industry over the next few years, its exports could well assume increasing
importance.
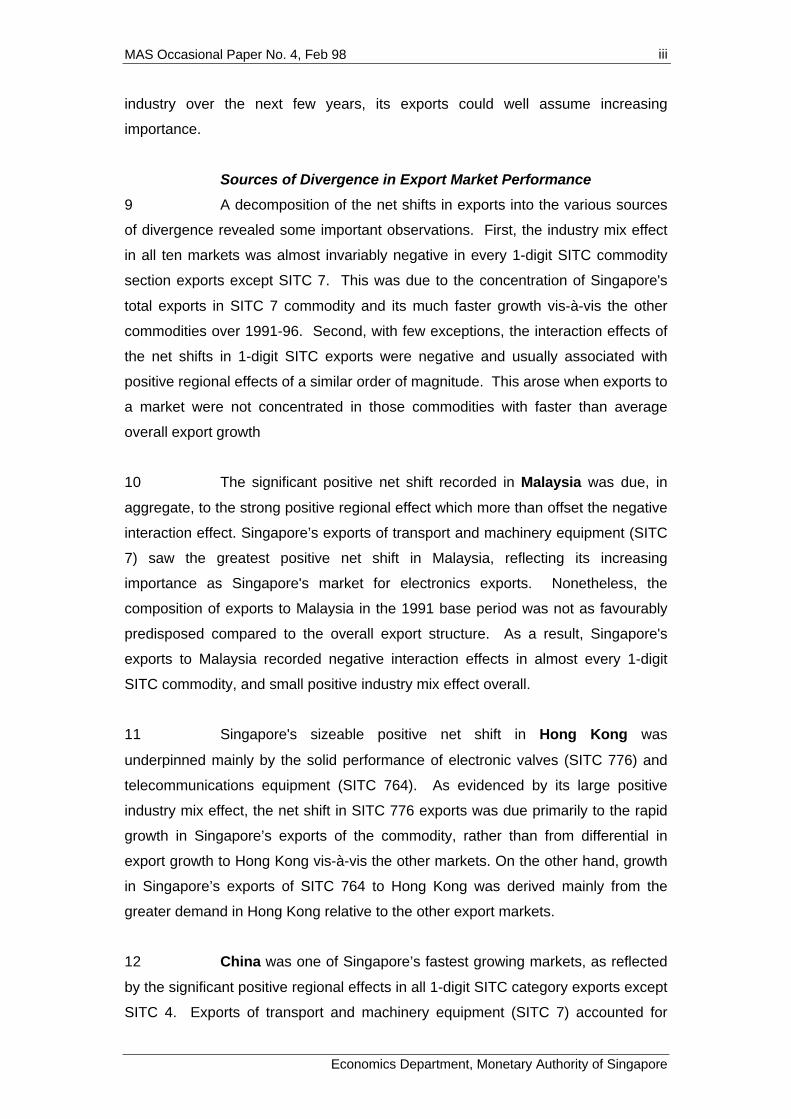
Sources of Divergence in Export Market Performance
9 A decomposition of the net shifts in exports into the various sources
of divergence revealed some important observations. First, the industry mix effect
in all ten markets was almost invariably negative in every 1-digit SITC commodity
section exports except SITC 7. This was due to the concentration of Singapore's
total exports in SITC 7 commodity and its much faster growth vis-à-vis the other
commodities over 1991-96. Second, with few exceptions, the interaction effects of
the net shifts in 1-digit SITC exports were negative and usually associated with
positive regional effects of a similar order of magnitude. This arose when exports to
a market were not concentrated in those commodities with faster than average
overall export growth
10 The significant positive net shift recorded in Malaysia was due, in
aggregate, to the strong positive regional effect which more than offset the negative
interaction effect. Singapore’s exports of transport and machinery equipment (SITC
7) saw the greatest positive net shift in Malaysia, reflecting its increasing
importance as Singapore's market for electronics exports. Nonetheless, the
composition of exports to Malaysia in the 1991 base period was not as favourably
predisposed compared to the overall export structure. As a result, Singapore's
exports to Malaysia recorded negative interaction effects in almost every 1-digit
SITC commodity, and small positive industry mix effect overall.
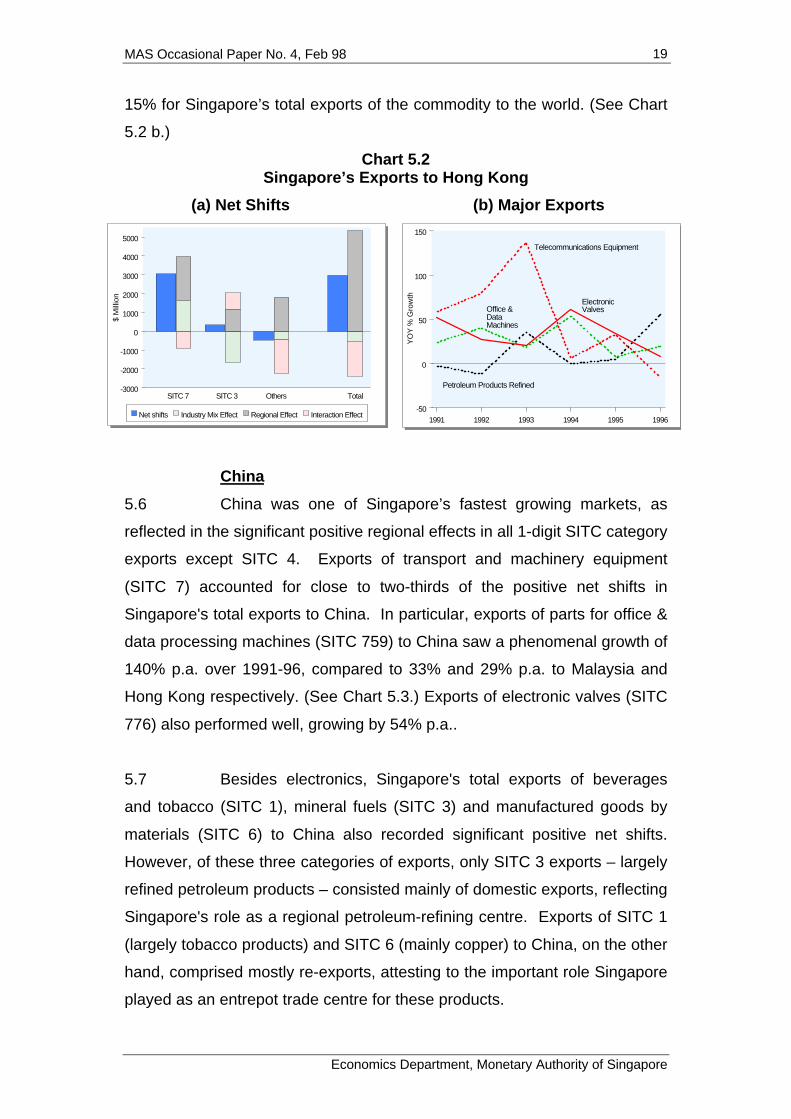
11 Singapore's sizeable positive net shift in Hong Kong was
underpinned mainly by the solid performance of electronic valves (SITC 776) and
telecommunications equipment (SITC 764). As evidenced by its large positive
industry mix effect, the net shift in SITC 776 exports was due primarily to the rapid
growth in Singapore’s exports of the commodity, rather than from differential in
export growth to Hong Kong vis-à-vis the other markets. On the other hand, growth
in Singapore’s exports of SITC 764 to Hong Kong was derived mainly from the
greater demand in Hong Kong relative to the other export markets.
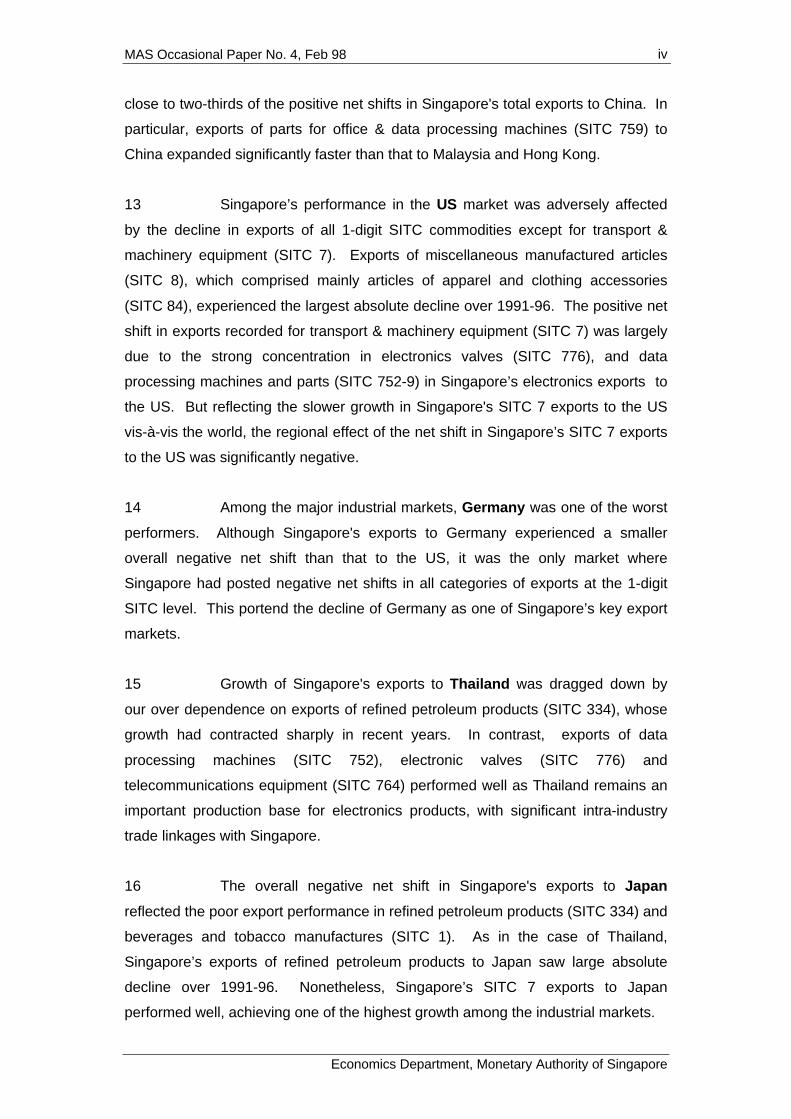
12 China was one of Singapore’s fastest growing markets, as reflected
by the significant positive regional effects in all 1-digit SITC category exports except
SITC 4. Exports of transport and machinery equipment (SITC 7) accounted for
MAS Occasional Paper No. 4, Feb 98
Economics Department, Monetary Authority of Singapore
iv
close to two-thirds of the positive net shifts in Singapore's total exports to China. In
particular, exports of parts for office & data processing machines (SITC 759) to
China expanded significantly faster than that to Malaysia and Hong Kong.
13 Singapore’s performance in the US market was adversely affected
by the decline in exports of all 1-digit SITC commodities except for transport &
machinery equipment (SITC 7). Exports of miscellaneous manufactured articles
(SITC 8), which comprised mainly articles of apparel and clothing accessories
(SITC 84), experienced the largest absolute decline over 1991-96. The positive net
shift in exports recorded for transport & machinery equipment (SITC 7) was largely
due to the strong concentration in electronics valves (SITC 776), and data
processing machines and parts (SITC 752-9) in Singapore’s electronics exports to
the US. But reflecting the slower growth in Singapore's SITC 7 exports to the US
vis-à-vis the world, the regional effect of the net shift in Singapore’s SITC 7 exports
to the US was significantly negative.
14 Among the major industrial markets, Germany was one of the worst
performers. Although Singapore's exports to Germany experienced a smaller
overall negative net shift than that to the US, it was the only market where
Singapore had posted negative net shifts in all categories of exports at the 1-digit
SITC level. This portend the decline of Germany as one of Singapore’s key export
markets.
15 Growth of Singapore's exports to Thailand was dragged down by
our over dependence on exports of refined petroleum products (SITC 334), whose
growth had contracted sharply in recent years. In contrast, exports of data
processing machines (SITC 752), electronic valves (SITC 776) and
telecommunications equipment (SITC 764) performed well as Thailand remains an
important production base for electronics products, with significant intra-industry
trade linkages with Singapore.
16 The overall negative net shift in Singapore's exports to Japan
reflected the poor export performance in refined petroleum products (SITC 334) and
beverages and tobacco manufactures (SITC 1). As in the case of Thailand,
Singapore’s exports of refined petroleum products to Japan saw large absolute
decline over 1991-96. Nonetheless, Singapore’s SITC 7 exports to Japan
performed well, achieving one of the highest growth among the industrial markets.
MAS Occasional Paper No. 4, Feb 98
Economics Department, Monetary Authority of Singapore
v
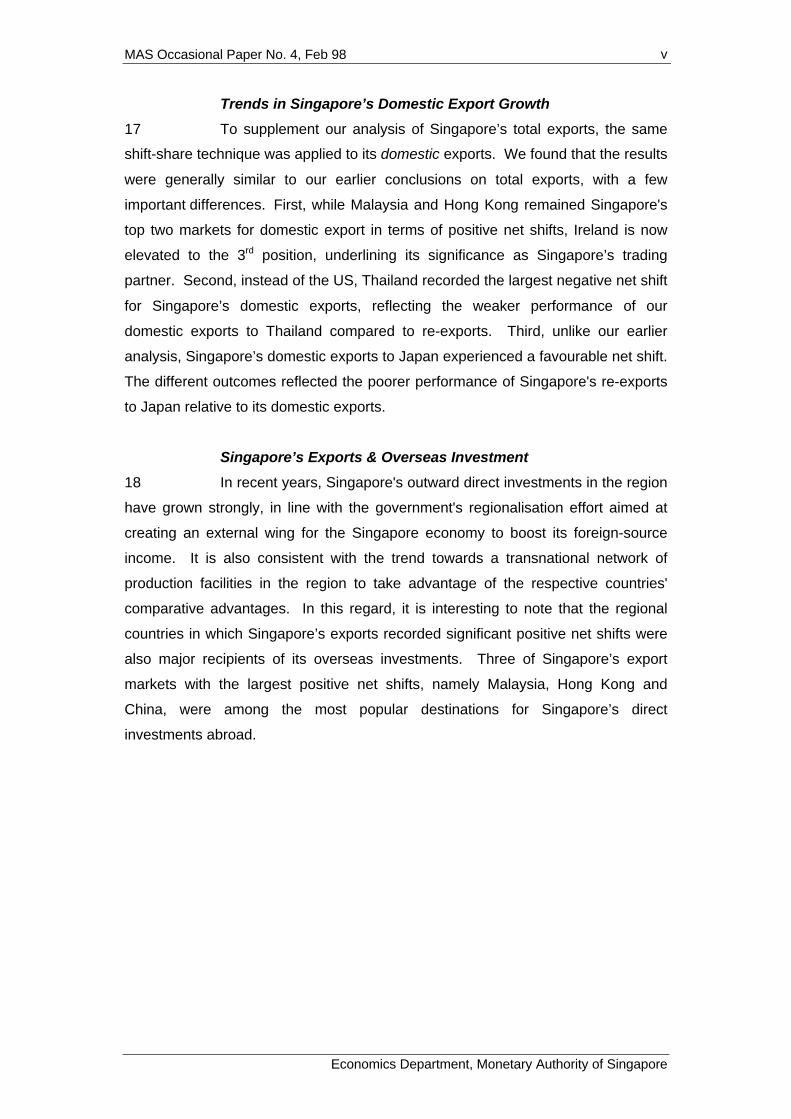
Trends in Singapore’s Domestic Export Growth
17 To supplement our analysis of Singapore’s total exports, the same
shift-share technique was applied to its domestic exports. We found that the results
were generally similar to our earlier conclusions on total exports, with a few
important differences. First, while Malaysia and Hong Kong remained Singapore's
top two markets for domestic export in terms of positive net shifts, Ireland is now
elevated to the 3rd position, underlining its significance as Singapore’s trading
partner. Second, instead of the US, Thailand recorded the largest negative net shift
for Singapore’s domestic exports, reflecting the weaker performance of our
domestic exports to Thailand compared to re-exports. Third, unlike our earlier
analysis, Singapore’s domestic exports to Japan experienced a favourable net shift.
The different outcomes reflected the poorer performance of Singapore's re-exports
to Japan relative to its domestic exports.
Singapore’s Exports & Overseas Investment
18 In recent years, Singapore's outward direct investments in the region
have grown strongly, in line with the government's regionalisation effort aimed at
creating an external wing for the Singapore economy to boost its foreign-source
income. It is also consistent with the trend towards a transnational network of
production facilities in the region to take advantage of the respective countries'
comparative advantages. In this regard, it is interesting to note that the regional
countries in which Singapore’s exports recorded significant positive net shifts were
also major recipients of its overseas investments. Three of Singapore’s export
markets with the largest positive net shifts, namely Malaysia, Hong Kong and
China, were among the most popular destinations for Singapore’s direct
investments abroad.
MAS Occasional Paper No. 4, Feb 98
Economics Department, Monetary Authority of Singapore
vi
Implications & Conclusion
19 A number of significant implications on the Singapore economy
could be drawn from the analyses. First, the government’s decision to focus on the
promotion of electronics industries was well justified by the fact that export growth
of Singapore in recent years was largely driven by the impressive performance of
electronics exports. While many have argued that Singapore’s heavy dependence
on the electronics industry has increased the economy’s vulnerability to swings in
the electronics cycle, it is almost certain that Singapore would not have achieved
such high export growth if not for electronics exports. The key to sustaining robust
export expansion will be continued emphasis on high growth sectors such as high-
end disk drives and semiconductors.
20 Second, while electronics would remain the mainstay of Singapore’s
export engine, industries such as chemicals and related products (SITC 5), and
mineral fuels, lubricants and related materials (SITC 3), and miscellaneous
manufactured articles (SITC 8) should not be overlooked. As these products
accounted for a significant 23% of our total exports in 1996, higher growth could be
obtained if greater efforts were made to expand their share in selected markets
where Singapore had a competitive advantage.
21 Third, while Singapore faces intense competition from the region in
its exports to the developed markets, it has also benefited greatly from exporting to
the regional economies. While the recent regional currency crisis may affect the
short-term growth prospects of some regional economies, the long-term prospects
for the region remain favourable. Nevertheless, the uncertainty surrounding the
region has underscored the importance for Singapore to diversify its export base by
reaching out to growth areas outside the region.
22 Fourth, the need for Singapore to explore new export destinations
was further heightened by the diminishing significance of the US, Japan and the EU
as its export markets. While Singapore has made some headway in penetrating
into some non-traditional markets, its trading relations with a number of emerging
markets remain superficial. Trading opportunities in other less familiar markets
should be identified and exploited to further boost Singapore’s export performance.
23 Finally, the regionalisation of the Singapore economy, with the
attendant relocation of industries to countries in the region, has not led to a
MAS Occasional Paper No. 4, Feb 98
Economics Department, Monetary Authority of Singapore
vii
hollowing-out of Singapore's manufacturing sector, nor has it adversely affected
export market growth. In fact, Singapore's exports are increasingly directed at
markets where Singapore has heavily invested. In this regard, Singapore's
regionalisation effort has been beneficial and initiatives such as the Singapore-
Johor-Riau Growth Triangle, which exploits the different comparative advantages of
the regional economies, should be promoted in order to attract investments of
higher quality into Singapore.
MAS Occasional Paper No. 4, Feb 98
Economics Department, Monetary Authority of Singapore
1
1 INTRODUCTION
1.1 Singapore's total exports have grown at a rapid rate over the
last three decades, reflecting the outward orientation of the economy and
strong growth in world trade. During 1965-96, Singapore's total exports
expanded by 15% p.a. while world trade grew by 12% p.a.. Over the same
period, Singapore's economic growth, which has been largely export-led,
averaged 9% p.a. over the last 30 years or so. Given the openness of the
economy, with trade amounting to 3 times nominal GDP, the spatial pattern
and composition of Singapore's exports are susceptible to changes in
regional and global economic trends. In recent years, several major
developments have taken place that may have an impact on Singapore's
exports, both in terms of the direction and mix of exports.
1.2 First, the trend towards greater industrialisation among the
other emerging Asian economies has led to an increase in competition
facing Singapore's exports. Besides its traditional export competitors of
Hong Kong, Taiwan and Korea, Singapore is expected to face increasing
competition from the regional economies, in particular Malaysia, in its
exports to the major markets of the US, Japan, and the EU.
1.3 Second, there has been a trend towards greater regional
economic integration even as countries in the region compete in exporting to
third-country markets. This is reflected in the rise of intra-Asian trade, which
has grown by 16% p.a. over the past 10 years. To the extent that
Singapore’s penetration into Asian markets reflects a diversification of its
export base, the relative performance of Singapore's exports to Asia vis-à-
vis that to its traditional markets such as the US would be of significance.
1.4 Third, in contrast to the booming Asian economies, many
OECD countries had recorded sluggish growth performance in recent years.
Extended recession in Japan and some European economies, such as
France and Germany, could have had an adverse impact on Singapore's
exports to these markets, thereby changing its overall patterns of trade.
MAS Occasional Paper No. 4, Feb 98
Economics Department, Monetary Authority of Singapore
2
1.5 Finally, following the regionalisation of the Singapore economy
since the early 1990s, there has been an increase in the number of
Singaporean firms investing overseas. While the nexus between trade and
investment can be rather complex, Singapore's greater investment linkages
with the region could lead to increased trade flows to and from the region.
1.6 This paper examines the trends in Singapore's export market
growth over 1991-96 against the backdrop of developments we have just
described. The methodology of shift-share analysis is used to identify which
export markets are of growing significance to Singapore, and which are
diminishing over time. Exports data at the 3-digit Standard Industrial Trade
Classification (SITC) are from Singapore Trade Statistics: Imports and
Exports compiled by the Singapore Trade Development Board (TDB [various
issues]), which do not include trade with Indonesia. Markets which saw an
increase in exports greater than that implied by Singapore’s overall export
growth rate are said to have experienced positive net shifts in exports, and
conversely for negative net shifts. These shifts in exports are then
decomposed into their various sources of divergence from which policy
implications for Singapore's conduct of international trade could be drawn.
1.7 Section 2 of the paper gives a brief exposition of the shift-share
technique used for our analysis. Sections 3 and 4 look at the trends in
Singapore’s export market growth and its export performance by commodity
respectively. Section 5 examines the sources of divergence in export
performance in each of our major export markets. Section 6 presents an
analysis of Singapore’s domestic exports growth using the same shift-share
technique. Section 7 examines the relationship between Singapore’s
overseas investment and exports. Section 8 concludes with some policy
implications for Singapore.
MAS Occasional Paper No. 4, Feb 98
Economics Department, Monetary Authority of Singapore
3
2 METHODOLOGY OF SHIFT-SHARE ANALYSIS
2.1 Shift-share analysis is a well-established methodology in
regional economic analysis where it has been used to examine issues such
as export market growth, industrial structure, employment changes and
labour productivity. For example, it was used in the study of export market
growth in Malaysia (Khalifah [1996]), export competition among selected
economies in East Asia (Herschede [1991]), labour productivity in US
manufacturing (Ledebur and Moomaw [1983]), and regional economic
growth in the US (Hayward [1995]). The technique of shift-share analysis
provides a very simple decomposition that lends itself to some meaningful
economic interpretation.
2.2 When applied to the study of export market growth of a
country, shift-share analysis measures the relative size of the gains or losses
of export markets relative to the overall export growth – termed the overall
growth or share effect – of that country. The resultant net shifts in exports
are better measures of export market performance than the more commonly
used measures such as absolute and relative changes in exports.
Absolute changes in exports tend to obscure the differential growth rate of
markets as they overstate the importance of larger vis-à-vis smaller markets,
while relative or percentage changes in exports tend to have the opposite
bias. For example, when comparing between the US and Laos as
Singapore’s export markets, the absolute increase in exports to the former is
expected to be considerably larger than that to the latter as the US is a much
bigger market. For the same reason, the growth of Singapore’s exports to
the US would be expected to be smaller than that to Laos. The shift-share
technique overcomes these limitations by taking into account both the size
and growth of a particular market when assessing its export performance
vis- à-vis another market.
2.3 Net shifts in export markets can be attributed to the following
three possible sources of export divergence: (a) industry mix effect; (b)
regional effect; and (c) interaction effect. The latter two effects are also
MAS Occasional Paper No. 4, Feb 98
Economics Department, Monetary Authority of Singapore
4
collectively termed the "competitiveness" effect. Appendix 1 provides a
more formal derivation of the above decomposition.
2.4 Industry Mix Effect captures that portion of the export
divergence that is due to the difference between the composition of exports
to a market and the composition of the country’s total exports. A positive
effect results when the proportion of exports to a market in fast growing
commodities is greater than the proportion of the country’s overall exports in
these commodities. A negative effect results when exports to a market are
dominated by slow growing commodities vis- à-vis the composition of total
exports. For example, if the share of Singapore’s electronics exports, a high-
growth commodity, to the US is greater than that of Singapore’s total
exports, the industry mix effect of Singapore’s net shifts in exports to the US
will be positive.
2.5 Regional Effect measures the effect of differential growth of
various export commodities to a market compared to other markets. Thus,
while the mix of exports to two markets may be the same, the difference in
growth rates of individual commodity exports between the markets can
contribute to a net shift in export market shares. Positive regional effect
occurs when the rates of growth in exports of various commodities to a
market are higher than the country’s overall export growth in these
commodities, and vice versa for negative regional effect. For example, if the
growth of Singapore’s electronics exports to the US is higher than that of
Singapore’s total electronics exports, the regional effect in the US will be
positive.
2.6 Interaction Effect measures that portion of the net shift due to
the difference in mix of commodity exports to the various markets interacting
with the difference in growth of commodity exports to these markets. A
positive effect results when exports to a market are either (a) concentrated in
those commodities with faster than average overall export growth or (b) not
concentrated in those with slower than average overall export growth. For
example, the interaction effect in the US will be positive if the share of
MAS Occasional Paper No. 4, Feb 98
Economics Department, Monetary Authority of Singapore
5
Singapore’s electronics exports to the US is greater than that of Singapore’s
total exports and, at the same time, the growth of Singapore’s electronics
exports to the US is higher than that of Singapore’s total electronics exports.
2.7 A closely related methodology, which is also frequently used in
the study of export growth, is Constant Market Share (CMS) analysis.
However, CMS has a number of weaknesses compared to the shift-share
analysis. (See, for example, Richardson (1971) for a detailed discussion of
the limitations of the CMS model.) The shift-share technique, on the other
hand, is not without its problems. The main weakness is that the results of
the analysis are influenced by the type of industrial classification used such
that the relative magnitudes of the three sources of export divergence vary
with different levels of disaggregation. The chosen level of aggregation is
usually dictated by the available data. In addition, as in the case of CMS
analysis, the shift-share technique only quantifies the sizes of the various
effects without explaining why the particular effects come about.
2.8 Notwithstanding its limitations, the shift-share model is a
simple but effective tool for disaggregating the components of export market
growth.1 The findings of the shift-share analysis in this paper will illuminate
our understanding of Singapore’s trade patterns. In order to keep the
analysis to manageable proportions, the paper focuses on Singapore’s top
five positive and negative net shifts markets.
1 In a study on regional growth in UK, the Shift Share technique has also proven to be
“robust” in comparison with other methodologies (Fothergill and Gudgin 1979).
MAS Occasional Paper No. 4, Feb 98
Economics Department, Monetary Authority of Singapore
6
3 TRENDS IN SINGAPORE'S EXPORT MARKET GROWTH
Export Structure and Key Markets
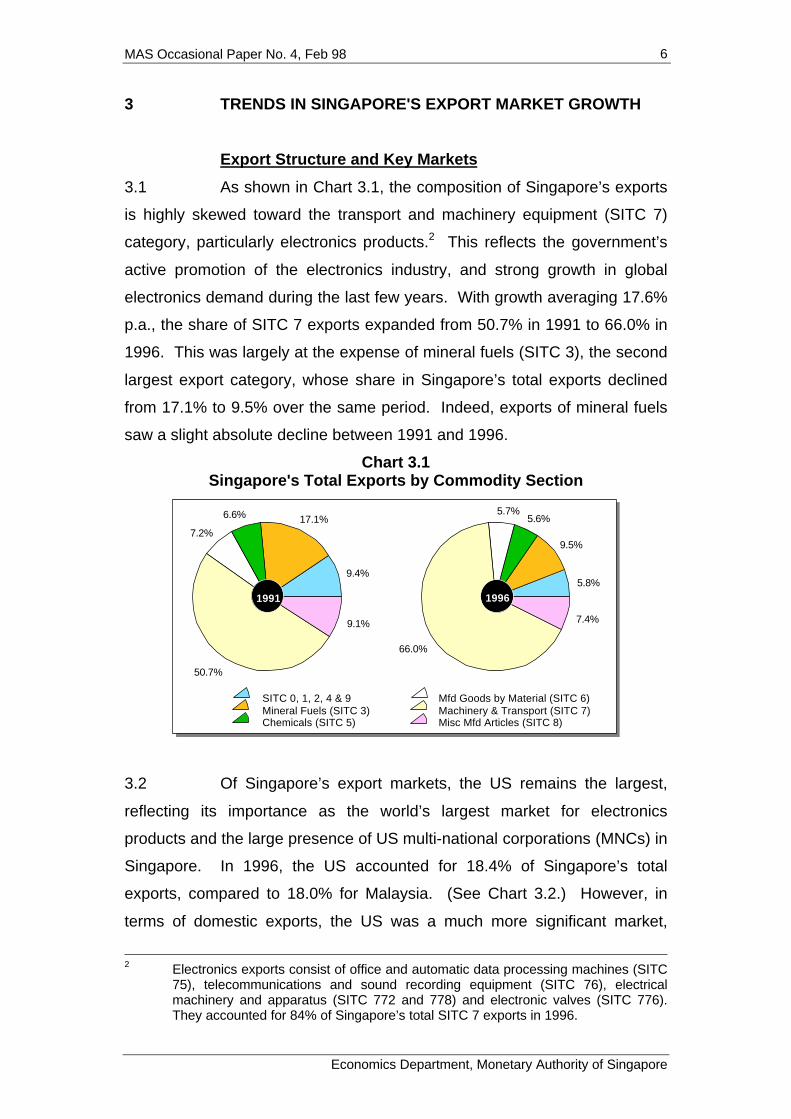
3.1 As shown in Chart 3.1, the composition of Singapore’s exports
is highly skewed toward the transport and machinery equipment (SITC 7)
category, particularly electronics products.2 This reflects the government’s
active promotion of the electronics industry, and strong growth in global
electronics demand during the last few years. With growth averaging 17.6%
p.a., the share of SITC 7 exports expanded from 50.7% in 1991 to 66.0% in
1996. This was largely at the expense of mineral fuels (SITC 3), the second
largest export category, whose share in Singapore’s total exports declined
from 17.1% to 9.5% over the same period. Indeed, exports of mineral fuels
saw a slight absolute decline between 1991 and 1996.
Chart 3.1Singapore's Total Exports by Commodity Section
5.8%
9.5%
5.6%5.7%
66.0%
7.4%
9.4%
17.1%6.6%
7.2%
50.7%
9.1%
SITC 0, 1, 2, 4 & 9Mineral Fuels (SITC 3)Chemicals (SITC 5)
Mfd Goods by Material (SITC 6)Machinery & Transport (SITC 7)Misc Mfd Articles (SITC 8)
19961991
3.2 Of Singapore’s export markets, the US remains the largest,
reflecting its importance as the world’s largest market for electronics
products and the large presence of US multi-national corporations (MNCs) in
Singapore. In 1996, the US accounted for 18.4% of Singapore’s total
exports, compared to 18.0% for Malaysia. (See Chart 3.2.) However, in
terms of domestic exports, the US was a much more significant market,
2 Electronics exports consist of office and automatic data processing machines (SITC
75), telecommunications and sound recording equipment (SITC 76), electricalmachinery and apparatus (SITC 772 and 778) and electronic valves (SITC 776).They accounted for 84% of Singapore’s total SITC 7 exports in 1996.

MAS Occasional Paper No. 4, Feb 98
Economics Department, Monetary Authority of Singapore
7
absorbing 24.8% of Singapore’s total domestic exports, or almost twice
Malaysia’s share of 12.8%. This suggests that Singapore handled a greater
volume of entrepot trade with the regional countries compared with the more
distant countries such as the US and Japan. For example, re-exports
accounted for 57.2% of Singapore’s total exports to Malaysia and Thailand in
1996, substantially higher than the 24.4% with the US and Japan.
Chart 3.2Singapore's Key Export Markets, 1996
18.4%
18.0%
13.0%
8.9%
8.2%
5.7%3.9% 3.0%
2.7%
18.1%
TotalExports
24.8%
12.8%
15.8%
9.2%
9.5%4.4% 3.6%
2.9%2.7%
14.3%
DomesticExports
USMalaysiaEU-15
ChinaOthers
TaiwanS Korea
Hong KongJapanThailand
3.3 Chart 3.3 shows that there has also been a relative increase in
concentration of Singapore’s exports in terms of both commodity and market
in recent years.
Chart 3.3Diversification of Singapore’s Exports3
(a) By Commodity (b) By Markets
1992 1993 1994 1995 199628
30
32
34
36
0.05
0.06
0.07
0.08
Inde
x
Herfindahl Index (RHS)
1992 1993 1994 1995 199637
38
39
40
41
42
43
0.07
0.08
0.09
0.10
Inde
x
Index of Specialization
Index of Specialization
More diversified
Herfindahl Index (RHS)
Less diversified
3 The Index of Specialisation (IS) and Herfindahl Index (HI) are computed as follows:
IS= 100 {1+ Σ[Si.ln(Si)] / ln(Σi)]}, 0 ≤ IS ≤ 100HI = Σ (Si)
2 , 0 ≤ HI ≤ 1where Si = share of exports of ith commodity or exports to ith market. In both cases,an index close to zero indicates a high degree of diversification, whereas a largeindex indicates a high degree of concentration or specialisation.

MAS Occasional Paper No. 4, Feb 98
Economics Department, Monetary Authority of Singapore
8
Best and Worst Performing Export Markets
3.4 Chart 3.4 presents the five markets which experienced the
largest positive net shifts and another five with the largest negative net shifts
in exports over 1991-96. Among the top 5 performing markets, Malaysia
recorded the largest positive net shift of $5.4 billion. In other words,
Singapore's exports to Malaysia in 1996 were $5.4 billion more than what
they would have been if they had grown at the same rate as Singapore's
overall exports during 1991-96. This was followed by Hong Kong ($3.0
billion), China ($2.2 billion), Ireland ($1.5 billion) and France ($1.4 billion) in
that order.4 (Appendix 2 lists all Singapore's export markets in descending
order of net shifts in exports.)
Chart 3.4Top Five Positive and Negative Net Shift Markets
-3
-2
-1
0
1
2
3
4
5
6
$ B
illio
n
Posi t ive Net Shi f t Negat ive Net Sh i f t
Ma laysia
Hong Kong
China
Ireland
JapanIta
ly
Thai land
Germany
USFra
nce
3.5 At the other end of the scale, the US (-$2.3 billion), Germany (-
$2.0 billion), Thailand (-$1.1 billion), Italy (-$0.9 billion) and Japan (-$0.8
billion) had, in that order, the largest negative net shifts. Export markets with
positive net shifts increased their share of Singapore's total exports, and
conversely for those with negative net shifts. Thus, the share of Malaysia,
Hong Kong, China, Ireland and France in Singapore’s total exports rose from
25.1% in 1991 to 32.7% in 1996, while the share of US, Germany, Thailand,
Italy and Japan fell from 39.9% to 35.8%.
4 Figures in parentheses refer to net shifts.
MAS Occasional Paper No. 4, Feb 98
Economics Department, Monetary Authority of Singapore
9
Regional Market Performance
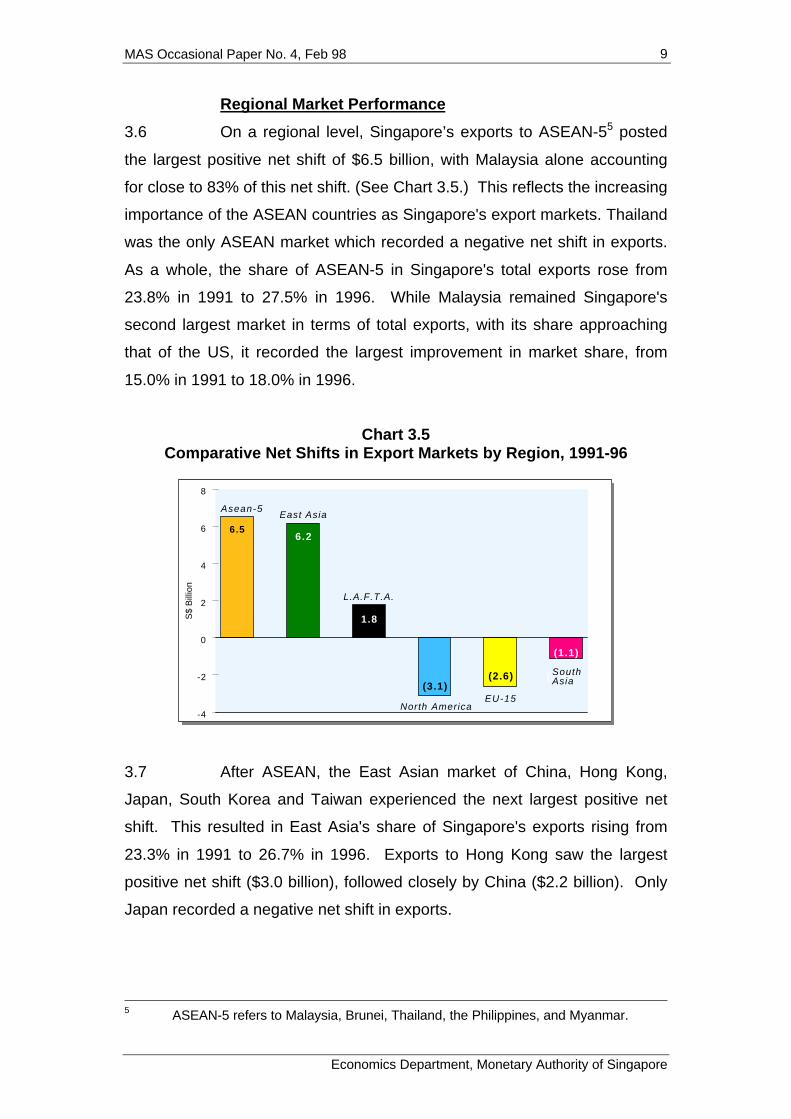
3.6 On a regional level, Singapore’s exports to ASEAN-55 posted
the largest positive net shift of $6.5 billion, with Malaysia alone accounting
for close to 83% of this net shift. (See Chart 3.5.) This reflects the increasing
importance of the ASEAN countries as Singapore's export markets. Thailand
was the only ASEAN market which recorded a negative net shift in exports.
As a whole, the share of ASEAN-5 in Singapore's total exports rose from
23.8% in 1991 to 27.5% in 1996. While Malaysia remained Singapore's
second largest market in terms of total exports, with its share approaching
that of the US, it recorded the largest improvement in market share, from
15.0% in 1991 to 18.0% in 1996.
Chart 3.5Comparative Net Shifts in Export Markets by Region, 1991-96
-4
-2
0
2
4
6
8
S$
Bill
ion
6.56.2
(3.1)(3.6)
Asean-5
South Asia
North America
East Asia
L.A.F.T.A.
1.8
EU-15
(2.6)
(1.1)
3.7 After ASEAN, the East Asian market of China, Hong Kong,
Japan, South Korea and Taiwan experienced the next largest positive net
shift. This resulted in East Asia's share of Singapore's exports rising from
23.3% in 1991 to 26.7% in 1996. Exports to Hong Kong saw the largest
positive net shift ($3.0 billion), followed closely by China ($2.2 billion). Only
Japan recorded a negative net shift in exports.
5 ASEAN-5 refers to Malaysia, Brunei, Thailand, the Philippines, and Myanmar.

MAS Occasional Paper No. 4, Feb 98
Economics Department, Monetary Authority of Singapore
10
3.8 On the other hand, Singapore's exports to the North American
market – the US and Canada – posted the largest negative net shift of $3.1
billion. This was largely due to the $2.3 billion negative net shift recorded in
the US market (Singapore's largest), which saw its share declining from
19.7% in 1991 to 18.4% in 1996. The European Union was the region with
the next largest negative net shift. The significant positive net shifts
recorded by Ireland and France were not sufficient to offset the large
negative net shifts experienced by Germany and Italy, and small negative
net shifts in almost all other European Union countries.
3.9 It is also noteworthy that, between 1991 and 1996, Singapore's
exports to the Latin American Free Trade Area recorded positive net shifts
while those to South Asia saw negative net shifts. Indeed, exports to every
country in South Asia posted negative net shifts during the period.
MAS Occasional Paper No. 4, Feb 98
Economics Department, Monetary Authority of Singapore
11
4 EXPORT PERFORMANCE BY COMMODITY SECTION
Strong Electronics Export Performance
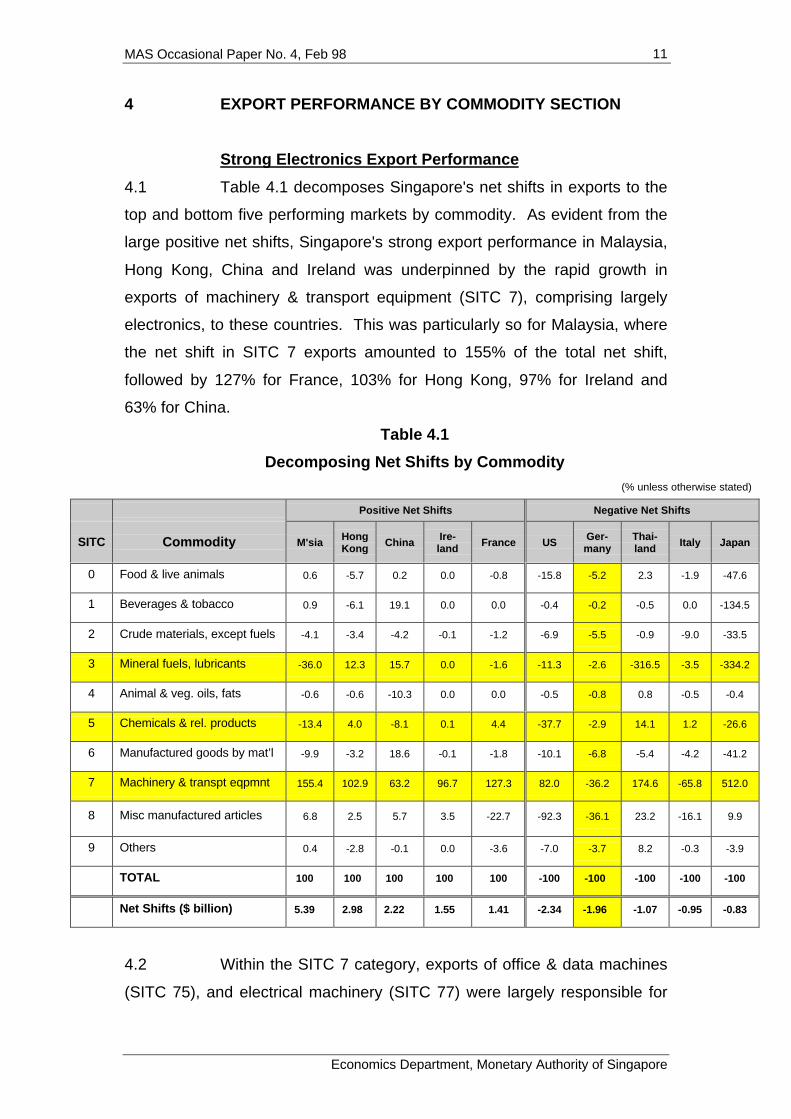
4.1 Table 4.1 decomposes Singapore's net shifts in exports to the
top and bottom five performing markets by commodity. As evident from the
large positive net shifts, Singapore's strong export performance in Malaysia,
Hong Kong, China and Ireland was underpinned by the rapid growth in
exports of machinery & transport equipment (SITC 7), comprising largely
electronics, to these countries. This was particularly so for Malaysia, where
the net shift in SITC 7 exports amounted to 155% of the total net shift,
followed by 127% for France, 103% for Hong Kong, 97% for Ireland and
63% for China.
Table 4.1
Decomposing Net Shifts by Commodity
(% unless otherwise stated)
Positive Net Shifts Negative Net Shifts
SITC Commodity M'sia HongKong China Ire-
land France US Ger-many
Thai-land Italy Japan
0 Food & live animals 0.6 -5.7 0.2 0.0 -0.8 -15.8 -5.2 2.3 -1.9 -47.6
1 Beverages & tobacco 0.9 -6.1 19.1 0.0 0.0 -0.4 -0.2 -0.5 0.0 -134.5
2 Crude materials, except fuels -4.1 -3.4 -4.2 -0.1 -1.2 -6.9 -5.5 -0.9 -9.0 -33.5
3 Mineral fuels, lubricants -36.0 12.3 15.7 0.0 -1.6 -11.3 -2.6 -316.5 -3.5 -334.2
4 Animal & veg. oils, fats -0.6 -0.6 -10.3 0.0 0.0 -0.5 -0.8 0.8 -0.5 -0.4
5 Chemicals & rel. products -13.4 4.0 -8.1 0.1 4.4 -37.7 -2.9 14.1 1.2 -26.6
6 Manufactured goods by mat’l -9.9 -3.2 18.6 -0.1 -1.8 -10.1 -6.8 -5.4 -4.2 -41.2
7 Machinery & transpt eqpmnt 155.4 102.9 63.2 96.7 127.3 82.0 -36.2 174.6 -65.8 512.0
8 Misc manufactured articles 6.8 2.5 5.7 3.5 -22.7 -92.3 -36.1 23.2 -16.1 9.9
9 Others 0.4 -2.8 -0.1 0.0 -3.6 -7.0 -3.7 8.2 -0.3 -3.9
TOTAL 100 100 100 100 100 -100 -100 -100 -100 -100
Net Shifts ($ billion) 5.39 2.98 2.22 1.55 1.41 -2.34 -1.96 -1.07 -0.95 -0.83
4.2 Within the SITC 7 category, exports of office & data machines
(SITC 75), and electrical machinery (SITC 77) were largely responsible for

MAS Occasional Paper No. 4, Feb 98
Economics Department, Monetary Authority of Singapore
12
the positive net shifts. Office & data machines (SITC 75) comprise mainly
disk drives (43%), while electrical machinery (SITC 77) consists primarily of
semiconductors (71%). The strong growth in electronics exports to these
five markets reflected Singapore's favourable industrial structure that was
skewed towards an industry experiencing rapid growth over the last few
years. Indeed, SITC 7 exports accounted for 51% and 66% of Singapore's
total exports in 1991 and 1996 respectively, growing by 17.6% p.a. during
the period, compared to 11.6% p.a. growth for total exports.
4.3 The strong performance in electronics exports to Malaysia was
also due to the rapid expansion of the electronics industry there, reflecting
the trend towards a regional production network, which had led to increased
sourcing of electronic parts and components from Singapore. Trade
Development Board's (TDB) estimates show that about 80% of Singapore’s
non-oil domestic exports to the region comprised intermediate goods.6
4.4 Even among the five export markets with the largest negative
net shifts, viz. the US, Germany, Thailand, Italy and Japan, Singapore’s
exports of machinery & transport equipment grew faster than its overall
export growth except in Germany and Italy.
Decline in Exports of Mineral Fuels
4.5 Singapore's exports of mineral fuels (SITC 3), comprising
primarily refined petroleum products, did not grow as fast as its overall
exports. With the exception of China and Hong Kong, all the other markets
registered zero or negative net shifts. In fact, Singapore's exports of refined
petroleum products (SITC 334) to Thailand, Japan, Malaysia and Italy
experienced large absolute declines over 1991-96, reflecting the state of an
industry beset by over-capacity and low refining margins. Singapore faces
increasing competition from South Korea and the Middle East, notably Saudi
Arabia. In particular, refining capacity in South Korea almost doubled
between 1991-96. From a position lower than Singapore's in 1991, South
6 See The Straits Times, 21 January 1998.
MAS Occasional Paper No. 4, Feb 98
Economics Department, Monetary Authority of Singapore
13
Korea had overtaken Singapore by 1996, with a refining capacity of 1.8
trillion bpd compared to Singapore's 1.2 trillion bpd. This is of particular
significance, considering the fact that South Korea is much closer to Japan
and China, two major markets for refined petroleum products in East Asia.
4.6 In addition, increased import-substitution by Thailand and
Malaysia has also limited Singapore's exports to these countries. Indeed,
Singapore's exports of refined petroleum products to Thailand have been on
a trend decline since 1991.
Weak Performance in Chemicals and Related Products
4.7 Exports of chemicals and related products (SITC 5), in general,
also grew slower than Singapore's overall exports despite the industry being
actively promoted by the government, along with electronics. Among the ten
export markets, the US registered the largest negative net shift, followed by
Japan and Malaysia. But with projected healthy growth and capacity
expansion for the industry over the next few years, its exports could well
assume increasing importance. Indeed, following the commissioning of
Singapore's second petrochemical complex – PCS II – in Apr 97, both
production and nominal exports of chemicals and related products surged,
with growth averaging 33.2% and 16.9% YOY respectively in Jun-Nov 97
compared with 17.1% and 3.0% YOY respectively in Jan-May 97. In
addition, the postponement or cancellation of some petrochemical projects in
the region7 amidst the recent currency crisis has alleviated competitive
pressures on the petrochemical industry in Singapore.
Broad-Based Decline in Export Performance to Germany
4.8 Germany stood out as the only export market among the ten to
which Singapore's exports in every commodity grew slower than average,
i.e. negative net shifts. A detailed examination, at 2- and 3-digit SITC levels,
shows that only semiconductor exports (SITC 776) to Germany experienced
7 For example, National Petrochemical Corp (NPC) and Thai Petrochemical Industry
(TPI) have postponed their plans to build ethylene plants, originally scheduled tobegin in 1999, indefinitely.
MAS Occasional Paper No. 4, Feb 98
Economics Department, Monetary Authority of Singapore
14
faster-than-average growth. These trends portend, in particular, the decline
of Germany as one of Singapore’s key export markets. From its position as
Singapore's sixth largest export market in 1991 with a 4.2% share, Germany
slipped to the seventh position in 1996 when its share declined to 3.1%.
Exports of Telecoms Equipment and Clothing to USShrank
4.9 Finally, the decline in the US share of Singapore's exports –
albeit still the largest – over the 1991-96 period was mainly attributable to the
absolute decline in exports of telecommunications equipment (SITC 76), and
clothing and apparel (SITC 84).
MAS Occasional Paper No. 4, Feb 98
Economics Department, Monetary Authority of Singapore
15
5 SOURCES OF DIVERGENCE IN EXPORT MARKETPERFORMANCE
5.1 This section examines the sources of export divergence in
each of the ten markets by decomposing the net shifts in exports into the
three effects described in Section 2. These effects are the industry mix
effect (IME), the regional effect (RE) and the interaction effect (IE), thus:
Net Shifts in Exports =
Industry Mix Effect + Regional Effect + Interaction Effect
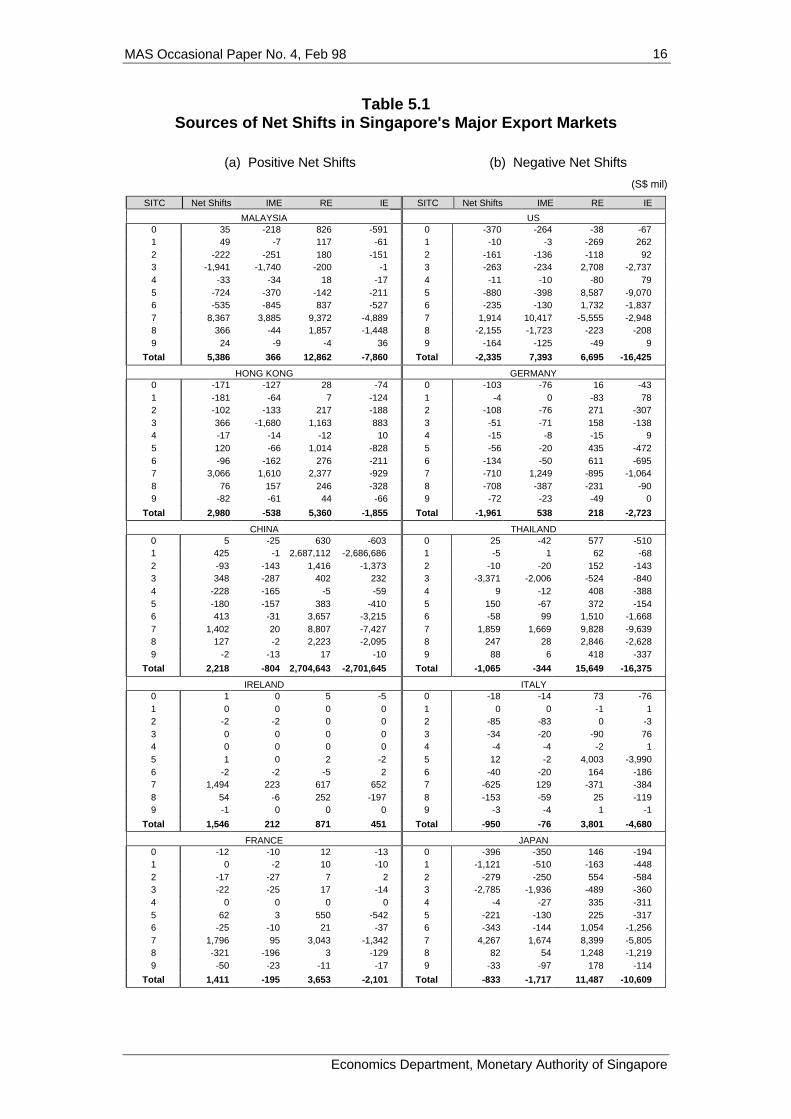
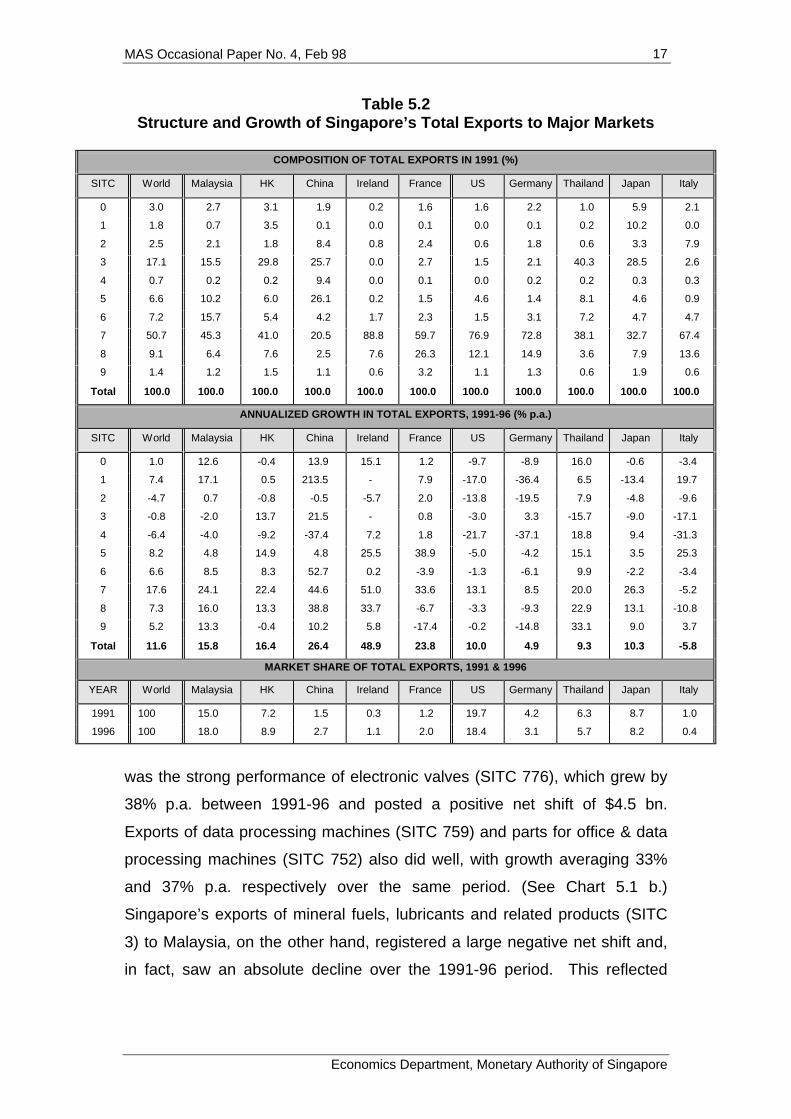
5.2 Table 5.1 summarises the sources of net shifts for the ten
export markets at the level of 1-digit SITC commodity section. Several
general observations can be made. First, the industry mix effect in all ten
markets was almost invariably negative in every 1-digit SITC commodity
section exports except SITC 7. This was due to the concentration of
Singapore's total exports in SITC 7 commodity (with 51% share in the 1991
base year), and its much faster growth vis- à-vis the other commodities over
the 1991-96 period (17.6% vs. 3.6% p.a.). Second, with few exceptions, the
interaction effects of the net shifts in 1-digit SITC exports were negative and
usually associated with positive regional effects of a similar order of
magnitude. This arose when exports to a market were not concentrated in
those commodities with faster than average overall export growth, as can be
clearly seen when Table 5.1 is compared with Table 5.2 displaying the
composition and growth of exports by commodity to the ten markets.
Malaysia
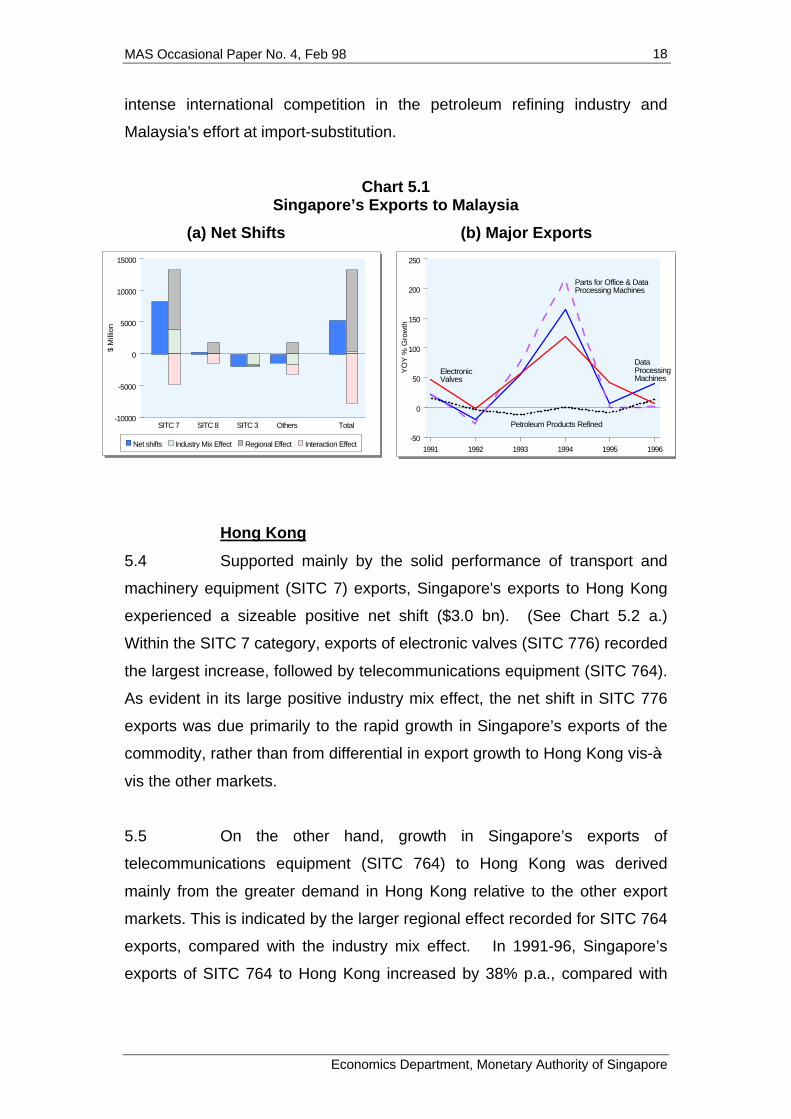
5.3 As noted earlier, Singapore’s total exports to Malaysia
recorded the largest positive net shift ($5.4 bn). In addition to a favourable
overall regional effect, Singapore’s total exports to Malaysia enjoyed a
positive overall industry mix effect. This was due largely to the
overwhelming positive industry mix and regional effects in Singapore's
exports of transport & machinery equipment (SITC 7) to Malaysia. (See
Chart 5.1 a.) Underpinning the robust growth in SITC 7 exports to Malaysia
MAS Occasional Paper No. 4, Feb 98
Economics Department, Monetary Authority of Singapore
16
Table 5.1Sources of Net Shifts in Singapore's Major Export Markets
(a) Positive Net Shifts (b) Negative Net Shifts
(S$ mil)
SITC Net Shifts IME RE IE SITC Net Shifts IME RE IE
MALAYSIA US0 35 -218 826 -591 0 -370 -264 -38 -671 49 -7 117 -61 1 -10 -3 -269 2622 -222 -251 180 -151 2 -161 -136 -118 923 -1,941 -1,740 -200 -1 3 -263 -234 2,708 -2,7374 -33 -34 18 -17 4 -11 -10 -80 795 -724 -370 -142 -211 5 -880 -398 8,587 -9,0706 -535 -845 837 -527 6 -235 -130 1,732 -1,8377 8,367 3,885 9,372 -4,889 7 1,914 10,417 -5,555 -2,9488 366 -44 1,857 -1,448 8 -2,155 -1,723 -223 -2089 24 -9 -4 36 9 -164 -125 -49 9
Total 5,386 366 12,862 -7,860 Total -2,335 7,393 6,695 -16,425
HONG KONG GERMANY0 -171 -127 28 -74 0 -103 -76 16 -431 -181 -64 7 -124 1 -4 0 -83 782 -102 -133 217 -188 2 -108 -76 271 -3073 366 -1,680 1,163 883 3 -51 -71 158 -1384 -17 -14 -12 10 4 -15 -8 -15 95 120 -66 1,014 -828 5 -56 -20 435 -4726 -96 -162 276 -211 6 -134 -50 611 -6957 3,066 1,610 2,377 -929 7 -710 1,249 -895 -1,0648 76 157 246 -328 8 -708 -387 -231 -909 -82 -61 44 -66 9 -72 -23 -49 0
Total 2,980 -538 5,360 -1,855 Total -1,961 538 218 -2,723
CHINA THAILAND0 5 -25 630 -603 0 25 -42 577 -5101 425 -1 2,687,112 -2,686,686 1 -5 1 62 -682 -93 -143 1,416 -1,373 2 -10 -20 152 -1433 348 -287 402 232 3 -3,371 -2,006 -524 -8404 -228 -165 -5 -59 4 9 -12 408 -3885 -180 -157 383 -410 5 150 -67 372 -1546 413 -31 3,657 -3,215 6 -58 99 1,510 -1,6687 1,402 20 8,807 -7,427 7 1,859 1,669 9,828 -9,6398 127 -2 2,223 -2,095 8 247 28 2,846 -2,6289 -2 -13 17 -10 9 88 6 418 -337
Total 2,218 -804 2,704,643 -2,701,645 Total -1,065 -344 15,649 -16,375
IRELAND ITALY0 1 0 5 -5 0 -18 -14 73 -761 0 0 0 0 1 0 0 -1 12 -2 -2 0 0 2 -85 -83 0 -33 0 0 0 0 3 -34 -20 -90 764 0 0 0 0 4 -4 -4 -2 15 1 0 2 -2 5 12 -2 4,003 -3,9906 -2 -2 -5 2 6 -40 -20 164 -1867 1,494 223 617 652 7 -625 129 -371 -3848 54 -6 252 -197 8 -153 -59 25 -1199 -1 0 0 0 9 -3 -4 1 -1
Total 1,546 212 871 451 Total -950 -76 3,801 -4,680
FRANCE JAPAN0 -12 -10 12 -13 0 -396 -350 146 -1941 0 -2 10 -10 1 -1,121 -510 -163 -4482 -17 -27 7 2 2 -279 -250 554 -5843 -22 -25 17 -14 3 -2,785 -1,936 -489 -3604 0 0 0 0 4 -4 -27 335 -3115 62 3 550 -542 5 -221 -130 225 -3176 -25 -10 21 -37 6 -343 -144 1,054 -1,2567 1,796 95 3,043 -1,342 7 4,267 1,674 8,399 -5,8058 -321 -196 3 -129 8 82 54 1,248 -1,2199 -50 -23 -11 -17 9 -33 -97 178 -114
Total 1,411 -195 3,653 -2,101 Total -833 -1,717 11,487 -10,609
MAS Occasional Paper No. 4, Feb 98
Economics Department, Monetary Authority of Singapore
17
Table 5.2Structure and Growth of Singapore’s Total Exports to Major Markets
COMPOSITION OF TOTAL EXPORTS IN 1991 (%)
SITC World Malaysia HK China Ireland France US Germany Thailand Japan Italy
0 3.0 2.7 3.1 1.9 0.2 1.6 1.6 2.2 1.0 5.9 2.1
1 1.8 0.7 3.5 0.1 0.0 0.1 0.0 0.1 0.2 10.2 0.0
2 2.5 2.1 1.8 8.4 0.8 2.4 0.6 1.8 0.6 3.3 7.9
3 17.1 15.5 29.8 25.7 0.0 2.7 1.5 2.1 40.3 28.5 2.6
4 0.7 0.2 0.2 9.4 0.0 0.1 0.0 0.2 0.2 0.3 0.3
5 6.6 10.2 6.0 26.1 0.2 1.5 4.6 1.4 8.1 4.6 0.9
6 7.2 15.7 5.4 4.2 1.7 2.3 1.5 3.1 7.2 4.7 4.7
7 50.7 45.3 41.0 20.5 88.8 59.7 76.9 72.8 38.1 32.7 67.4
8 9.1 6.4 7.6 2.5 7.6 26.3 12.1 14.9 3.6 7.9 13.6
9 1.4 1.2 1.5 1.1 0.6 3.2 1.1 1.3 0.6 1.9 0.6
Total 100.0 100.0 100.0 100.0 100.0 100.0 100.0 100.0 100.0 100.0 100.0
ANNUALIZED GROWTH IN TOTAL EXPORTS, 1991-96 (% p.a.)
SITC World Malaysia HK China Ireland France US Germany Thailand Japan Italy
0 1.0 12.6 -0.4 13.9 15.1 1.2 -9.7 -8.9 16.0 -0.6 -3.4
1 7.4 17.1 0.5 213.5 - 7.9 -17.0 -36.4 6.5 -13.4 19.7
2 -4.7 0.7 -0.8 -0.5 -5.7 2.0 -13.8 -19.5 7.9 -4.8 -9.6
3 -0.8 -2.0 13.7 21.5 - 0.8 -3.0 3.3 -15.7 -9.0 -17.1
4 -6.4 -4.0 -9.2 -37.4 7.2 1.8 -21.7 -37.1 18.8 9.4 -31.3
5 8.2 4.8 14.9 4.8 25.5 38.9 -5.0 -4.2 15.1 3.5 25.3
6 6.6 8.5 8.3 52.7 0.2 -3.9 -1.3 -6.1 9.9 -2.2 -3.4
7 17.6 24.1 22.4 44.6 51.0 33.6 13.1 8.5 20.0 26.3 -5.2
8 7.3 16.0 13.3 38.8 33.7 -6.7 -3.3 -9.3 22.9 13.1 -10.8
9 5.2 13.3 -0.4 10.2 5.8 -17.4 -0.2 -14.8 33.1 9.0 3.7
Total 11.6 15.8 16.4 26.4 48.9 23.8 10.0 4.9 9.3 10.3 -5.8
MARKET SHARE OF TOTAL EXPORTS, 1991 & 1996
YEAR World Malaysia HK China Ireland France US Germany Thailand Japan Italy
1991 100 15.0 7.2 1.5 0.3 1.2 19.7 4.2 6.3 8.7 1.0
1996 100 18.0 8.9 2.7 1.1 2.0 18.4 3.1 5.7 8.2 0.4
was the strong performance of electronic valves (SITC 776), which grew by
38% p.a. between 1991-96 and posted a positive net shift of $4.5 bn.
Exports of data processing machines (SITC 759) and parts for office & data
processing machines (SITC 752) also did well, with growth averaging 33%
and 37% p.a. respectively over the same period. (See Chart 5.1 b.)
Singapore’s exports of mineral fuels, lubricants and related products (SITC
3) to Malaysia, on the other hand, registered a large negative net shift and,
in fact, saw an absolute decline over the 1991-96 period. This reflected
MAS Occasional Paper No. 4, Feb 98
Economics Department, Monetary Authority of Singapore
18
intense international competition in the petroleum refining industry and
Malaysia's effort at import-substitution.
Chart 5.1Singapore’s Exports to Malaysia
(a) Net Shifts (b) Major Exports
SITC 7 SITC 8 SITC 3 Others Total -10000
-5000
0
5000
10000
15000
$ M
illio
n
Net shifts Industry Mix Effect Regional Effect Interaction Effect1991 1992 1993 1994 1995 1996
-50
0
50
100
150
200
250
YO
Y %
Gro
wth
Petroleum Products Refined
Data Processing Machines
Parts for Office & Data Processing Machines
Electronic Valves
Hong Kong
5.4 Supported mainly by the solid performance of transport and
machinery equipment (SITC 7) exports, Singapore's exports to Hong Kong
experienced a sizeable positive net shift ($3.0 bn). (See Chart 5.2 a.)
Within the SITC 7 category, exports of electronic valves (SITC 776) recorded
the largest increase, followed by telecommunications equipment (SITC 764).
As evident in its large positive industry mix effect, the net shift in SITC 776
exports was due primarily to the rapid growth in Singapore’s exports of the
commodity, rather than from differential in export growth to Hong Kong vis-à-
vis the other markets.
5.5 On the other hand, growth in Singapore’s exports of
telecommunications equipment (SITC 764) to Hong Kong was derived
mainly from the greater demand in Hong Kong relative to the other export
markets. This is indicated by the larger regional effect recorded for SITC 764
exports, compared with the industry mix effect. In 1991-96, Singapore’s
exports of SITC 764 to Hong Kong increased by 38% p.a., compared with
MAS Occasional Paper No. 4, Feb 98
Economics Department, Monetary Authority of Singapore
19
15% for Singapore’s total exports of the commodity to the world. (See Chart
5.2 b.)
Chart 5.2Singapore’s Exports to Hong Kong
(a) Net Shifts (b) Major Exports
SITC 7 SITC 3 Others Total-3000
-2000
-1000
0
1000
2000
3000
4000
5000
$ M
illio
n
Net shifts Industry Mix Effect Regional Effect Interaction Effect1991 1992 1993 1994 1995 1996
-50
0
50
100
150
YO
Y %
Gro
wth
Petroleum Products Refined
Electronic ValvesOffice &
Data Machines
Telecommunications Equipment
China
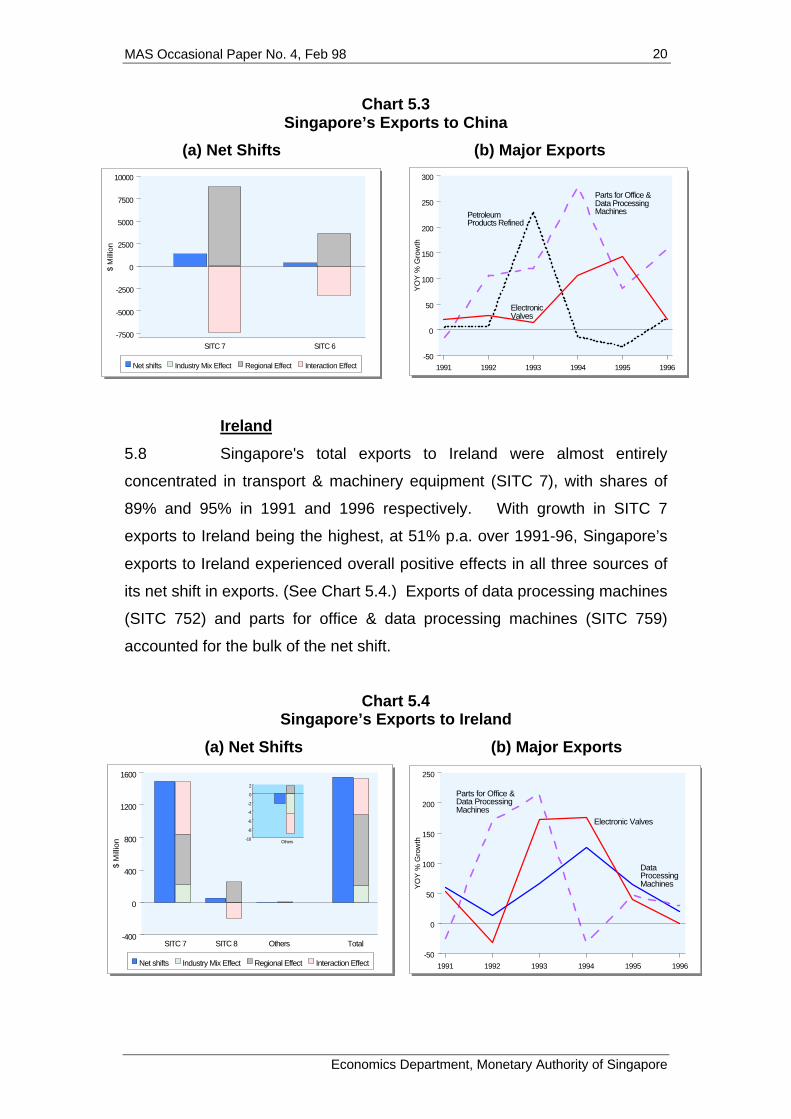
5.6 China was one of Singapore’s fastest growing markets, as
reflected in the significant positive regional effects in all 1-digit SITC category
exports except SITC 4. Exports of transport and machinery equipment
(SITC 7) accounted for close to two-thirds of the positive net shifts in
Singapore's total exports to China. In particular, exports of parts for office &
data processing machines (SITC 759) to China saw a phenomenal growth of
140% p.a. over 1991-96, compared to 33% and 29% p.a. to Malaysia and
Hong Kong respectively. (See Chart 5.3.) Exports of electronic valves (SITC
776) also performed well, growing by 54% p.a..
5.7 Besides electronics, Singapore's total exports of beverages
and tobacco (SITC 1), mineral fuels (SITC 3) and manufactured goods by
materials (SITC 6) to China also recorded significant positive net shifts.
However, of these three categories of exports, only SITC 3 exports – largely
refined petroleum products – consisted mainly of domestic exports, reflecting
Singapore's role as a regional petroleum-refining centre. Exports of SITC 1
(largely tobacco products) and SITC 6 (mainly copper) to China, on the other
hand, comprised mostly re-exports, attesting to the important role Singapore
played as an entrepot trade centre for these products.
MAS Occasional Paper No. 4, Feb 98
Economics Department, Monetary Authority of Singapore
20
Chart 5.3Singapore’s Exports to China
(a) Net Shifts (b) Major Exports
SITC 7 SITC 6
-7500
-5000
-2500
0
2500
5000
7500
10000
$ M
illio
n
Net shifts Industry Mix Effect Regional Effect Interaction Effect 1991 1992 1993 1994 1995 1996-50
0
50
100
150
200
250
300
YO
Y %
Gro
wth
Petroleum Products Refined
Electronic Valves
Parts for Office & Data Processing Machines
Ireland
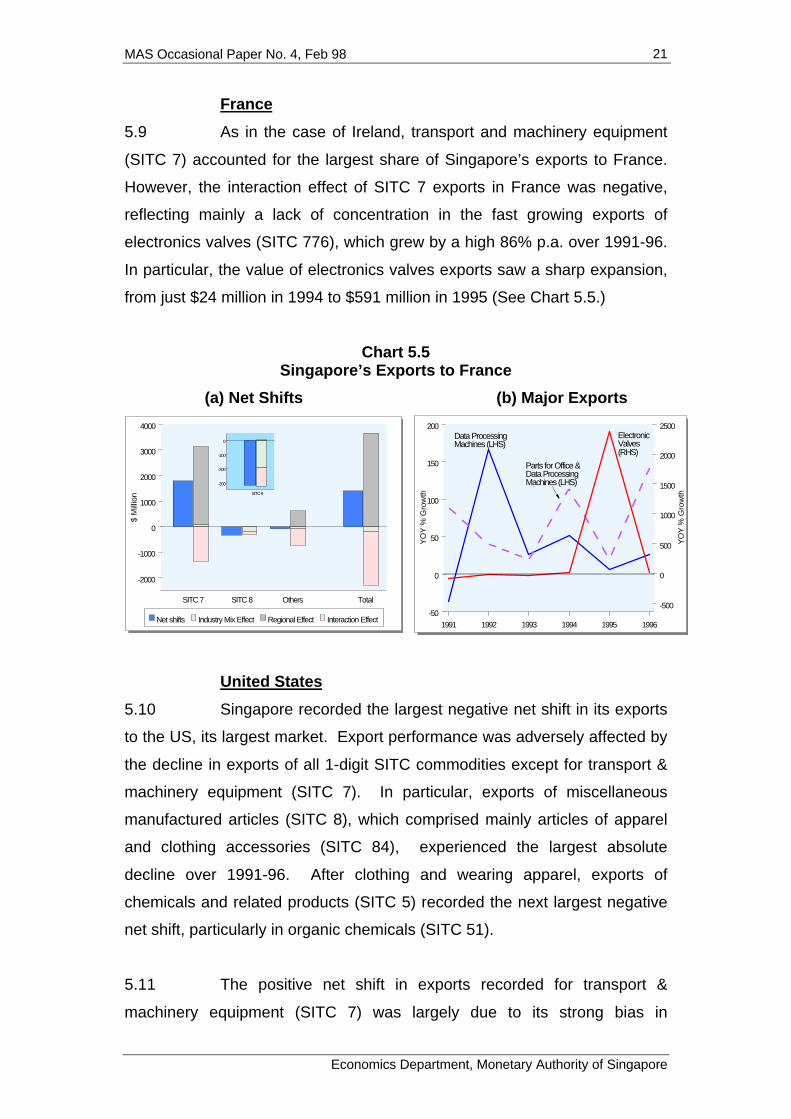
5.8 Singapore's total exports to Ireland were almost entirely
concentrated in transport & machinery equipment (SITC 7), with shares of
89% and 95% in 1991 and 1996 respectively. With growth in SITC 7
exports to Ireland being the highest, at 51% p.a. over 1991-96, Singapore’s
exports to Ireland experienced overall positive effects in all three sources of
its net shift in exports. (See Chart 5.4.) Exports of data processing machines
(SITC 752) and parts for office & data processing machines (SITC 759)
accounted for the bulk of the net shift.
Chart 5.4Singapore’s Exports to Ireland
(a) Net Shifts (b) Major Exports
SITC 7 SITC 8 Others Total -400
0
400
800
1200
1600
$ M
illio
n
Net shifts Industry Mix Effect Regional Effect Interaction Effect
Others -10
-8
-6
-4
-2
0
2
1991 1992 1993 1994 1995 1996
-50
0
50
100
150
200
250
YO
Y %
Gro
wth
Data Processing Machines
Electronic Valves
Parts for Office & Data Processing Machines
MAS Occasional Paper No. 4, Feb 98
Economics Department, Monetary Authority of Singapore
21
France
5.9 As in the case of Ireland, transport and machinery equipment
(SITC 7) accounted for the largest share of Singapore’s exports to France.
However, the interaction effect of SITC 7 exports in France was negative,
reflecting mainly a lack of concentration in the fast growing exports of
electronics valves (SITC 776), which grew by a high 86% p.a. over 1991-96.
In particular, the value of electronics valves exports saw a sharp expansion,
from just $24 million in 1994 to $591 million in 1995 (See Chart 5.5.)
Chart 5.5Singapore’s Exports to France
(a) Net Shifts (b) Major Exports
SITC 7 SITC 8 Others Total
-2000
-1000
0
1000
2000
3000
4000
$ M
illio
n
Net shifts Industry Mix Effect Regional Effect Interaction Effect
SITC 8
-300
-200
-100
0
1991 1992 1993 1994 1995 1996-50
0
50
100
150
200
-500
0
500
1000
1500
2000
2500Y
OY
% G
row
th
YO
Y %
Gro
wth
Data Processing Machines (LHS)
Electronic Valves (RHS)
Parts for Office & Data Processing Machines (LHS)
United States
5.10 Singapore recorded the largest negative net shift in its exports
to the US, its largest market. Export performance was adversely affected by
the decline in exports of all 1-digit SITC commodities except for transport &
machinery equipment (SITC 7). In particular, exports of miscellaneous
manufactured articles (SITC 8), which comprised mainly articles of apparel
and clothing accessories (SITC 84), experienced the largest absolute
decline over 1991-96. After clothing and wearing apparel, exports of
chemicals and related products (SITC 5) recorded the next largest negative
net shift, particularly in organic chemicals (SITC 51).
5.11 The positive net shift in exports recorded for transport &
machinery equipment (SITC 7) was largely due to its strong bias in

MAS Occasional Paper No. 4, Feb 98
Economics Department, Monetary Authority of Singapore
22
Singapore's exports to the US. This was underpinned by the strong
performance in exports of electronics valves (SITC 776), and data
processing machines and parts (SITC 752-9), whose combined growth
averaged 19% p.a. for 1991-96 compared to 13% p.a. for Singapore's total
SITC 7 exports to the US. (See Chart 5.6.) In contrast, Singapore's exports
of telecommunications equipment (SITC 764) and radio receivers (SITC 762)
to the US performed the worst, contracting by 10% p.a. in 1991-96.
Reflecting the slower growth in Singapore's SITC 7 exports to the US vis-à-
vis the world, the regional effect of the net shift in Singapore’s SITC 7
exports to the US was significantly negative.
Chart 5.6Singapore’s Exports to the US
(a) Net Shifts (b) Major Exports
SITC 5 SITC 7 SITC 8 Others Total -20000
-15000
-10000
-5000
0
5000
10000
15000
$ M
illio
n
Net shifts Industry Mix Effect Regional Effect Interaction Effect
SITC 8 -2500
-2000
-1500
-1000
-500
0
1991 1992 1993 1994 1995 1996-30
-20
-10
0
10
20
30
40
50
YO
Y %
Gro
wth
Data Processing Machines & Parts for Office & DP Machines
Electronic Valves
Telecommunications Apparatus
Chemicals
Clothing
Germany
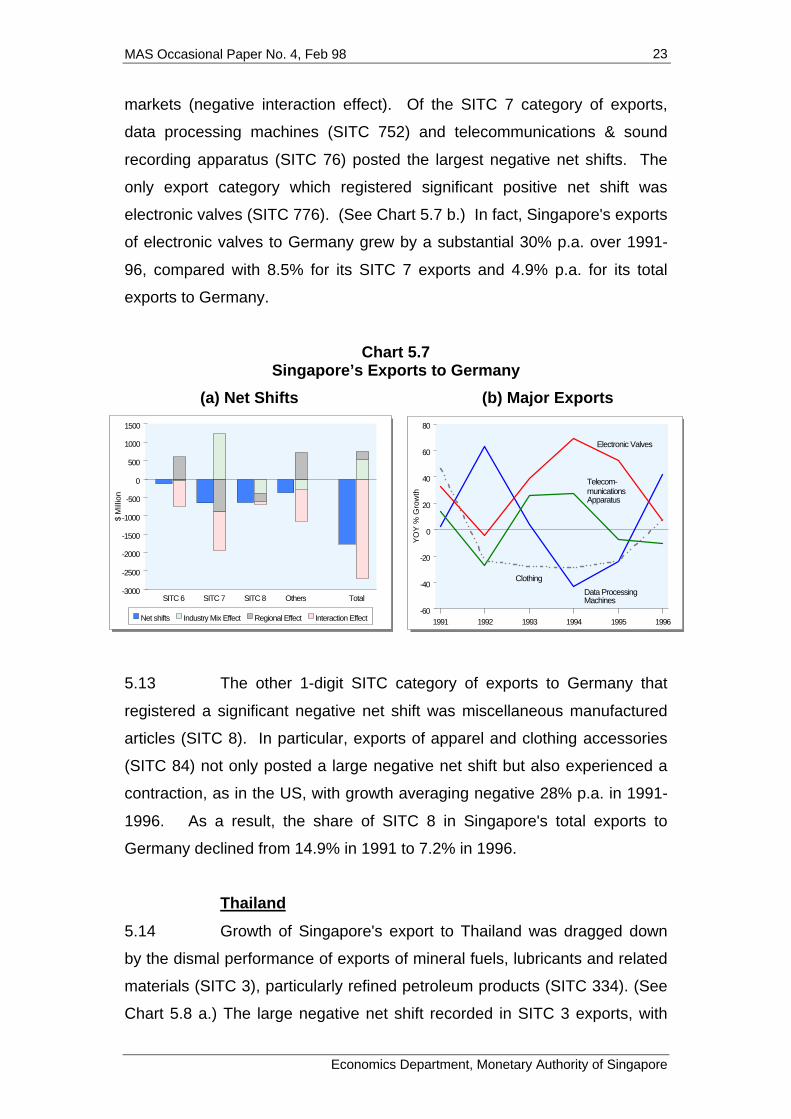
5.12 Among the major industrial markets, Germany was one of the
worst performers. Although Singapore's exports to Germany experienced a
smaller overall negative net shift than to the US, it was the only market
where Singapore had posted negative net shifts in all categories of exports
at the 1-digit SITC level. (See Chart 5.7 a.) Indeed, the largest negative net
shift was recorded for SITC 7 exports, which were the major category of
exports with substantial positive net shifts in Singapore’s other major export
markets. This was due to the much slower growth of Singapore's electronics
exports to Germany relative to all other markets (negative regional effect),
and the greater concentration of such exports to Germany vis-à-vis all other
MAS Occasional Paper No. 4, Feb 98
Economics Department, Monetary Authority of Singapore
23
markets (negative interaction effect). Of the SITC 7 category of exports,
data processing machines (SITC 752) and telecommunications & sound
recording apparatus (SITC 76) posted the largest negative net shifts. The
only export category which registered significant positive net shift was
electronic valves (SITC 776). (See Chart 5.7 b.) In fact, Singapore's exports
of electronic valves to Germany grew by a substantial 30% p.a. over 1991-
96, compared with 8.5% for its SITC 7 exports and 4.9% p.a. for its total
exports to Germany.
Chart 5.7Singapore’s Exports to Germany
(a) Net Shifts (b) Major Exports
SITC 6 SITC 7 SITC 8 Others Total -3000
-2500
-2000
-1500
-1000
-500
0
500
1000
1500
$ M
illio
n
Net shifts Industry Mix Effect Regional Effect Interaction Effect 1991 1992 1993 1994 1995 1996-60
-40
-20
0
20
40
60
80Y
OY
% G
row
th
Data Processing Machines
Electronic Valves
Telecom-munications Apparatus
Clothing
5.13 The other 1-digit SITC category of exports to Germany that
registered a significant negative net shift was miscellaneous manufactured
articles (SITC 8). In particular, exports of apparel and clothing accessories
(SITC 84) not only posted a large negative net shift but also experienced a
contraction, as in the US, with growth averaging negative 28% p.a. in 1991-
1996. As a result, the share of SITC 8 in Singapore's total exports to
Germany declined from 14.9% in 1991 to 7.2% in 1996.
Thailand
5.14 Growth of Singapore's export to Thailand was dragged down
by the dismal performance of exports of mineral fuels, lubricants and related
materials (SITC 3), particularly refined petroleum products (SITC 334). (See
Chart 5.8 a.) The large negative net shift recorded in SITC 3 exports, with

MAS Occasional Paper No. 4, Feb 98
Economics Department, Monetary Authority of Singapore
24
the industry mix effect, regional effect and interaction effect being all
negative, reflected Singapore’s over-dependence on exports of SITC 334 to
Thailand, whose growth had contracted by a considerable 16% p.a. over
1991-96. (See Chart 5.8 b.) Over the same period, the share of SITC 334 in
Singapore’s total exports to Thailand shrank from a high 40% to 10%. As
noted earlier, the trend decline in Singapore's exports of refined petroleum
products to Thailand reflected the latter's intensive effort to boost its own
petroleum refining capacity over the last few years.
Chart 5.8Singapore’s Exports to Thailand
(a) Net Shifts (b) Major Exports
SITC 3 SITC 7 Others Total
-15000
-10000
-5000
0
5000
10000
15000
$ M
illio
n
Net shifts Industry Mix Effect Regional Effect Interaction Effect 1991 1992 1993 1994 1995 1996-50
0
50
100
150
YO
Y %
Gro
wth
Petroleum Products Refined
Electronic Valves
Data Processing Machines
Telecom-munications Equipment
5.15 Singapore's exports of machinery and transport equipment
(SITC 7) to Thailand, on the other hand, experienced a favourable net shift
on account of its large positive regional effect. However, due to the smaller
base of Singapore's SITC 7 exports to Thailand relative to the rest of the
world in 1991, there was also a significant negative interaction effect.
Singapore's exports of data processing machines (SITC 752), electronic
valves (SITC 776) and telecommunications equipment (SITC 764) to
Thailand, in particular, performed well. These trends suggest that Thailand
has increasingly become an important production base for electronics
products, with significant intra-industry trade linkages with Singapore.
MAS Occasional Paper No. 4, Feb 98
Economics Department, Monetary Authority of Singapore
25
Italy
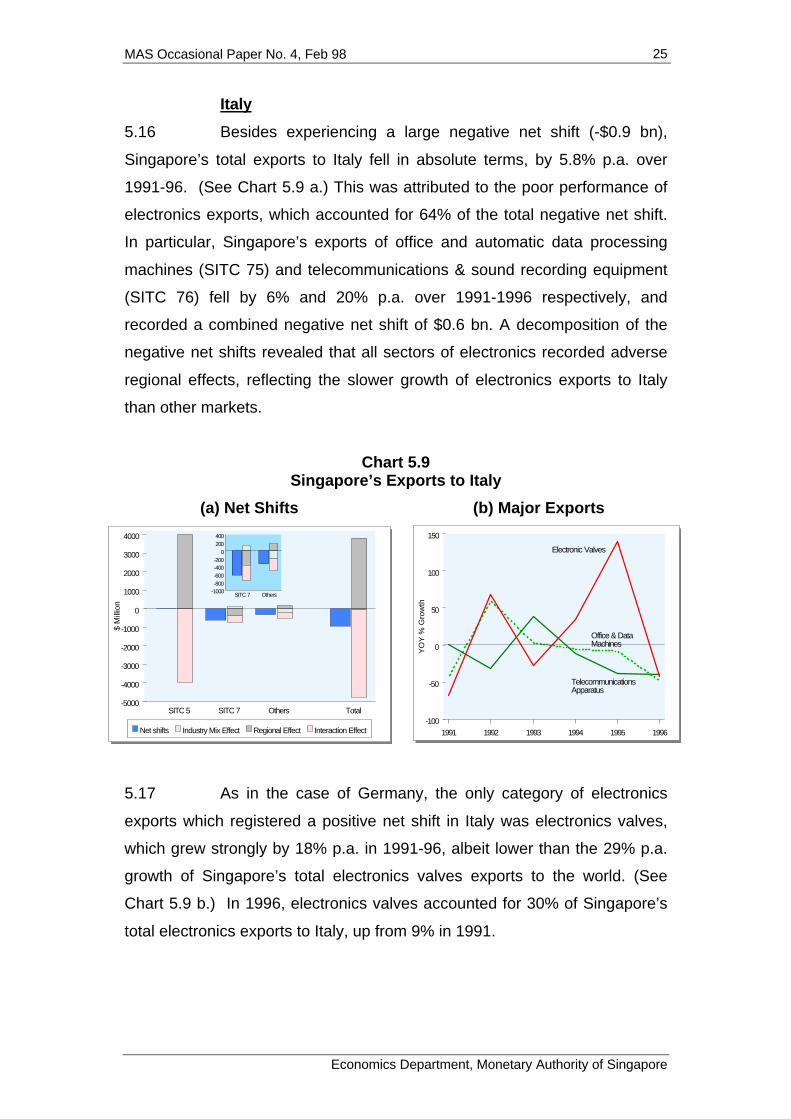
5.16 Besides experiencing a large negative net shift (-$0.9 bn),
Singapore’s total exports to Italy fell in absolute terms, by 5.8% p.a. over
1991-96. (See Chart 5.9 a.) This was attributed to the poor performance of
electronics exports, which accounted for 64% of the total negative net shift.
In particular, Singapore’s exports of office and automatic data processing
machines (SITC 75) and telecommunications & sound recording equipment
(SITC 76) fell by 6% and 20% p.a. over 1991-1996 respectively, and
recorded a combined negative net shift of $0.6 bn. A decomposition of the
negative net shifts revealed that all sectors of electronics recorded adverse
regional effects, reflecting the slower growth of electronics exports to Italy
than other markets.
Chart 5.9Singapore’s Exports to Italy
(a) Net Shifts (b) Major Exports
SITC 5 SITC 7 Others Total -5000
-4000
-3000
-2000
-1000
0
1000
2000
3000
4000
$ M
illio
n
Net shifts Industry Mix Effect Regional Effect Interaction Effect
SITC 7 Others -1000-800-600-400-200
0200400
1991 1992 1993 1994 1995 1996-100
-50
0
50
100
150
YO
Y %
Gro
wth
Office & Data Machines
Electronic Valves
Telecommunications Apparatus
5.17 As in the case of Germany, the only category of electronics
exports which registered a positive net shift in Italy was electronics valves,
which grew strongly by 18% p.a. in 1991-96, albeit lower than the 29% p.a.
growth of Singapore’s total electronics valves exports to the world. (See
Chart 5.9 b.) In 1996, electronics valves accounted for 30% of Singapore’s
total electronics exports to Italy, up from 9% in 1991.
MAS Occasional Paper No. 4, Feb 98
Economics Department, Monetary Authority of Singapore
26
Japan
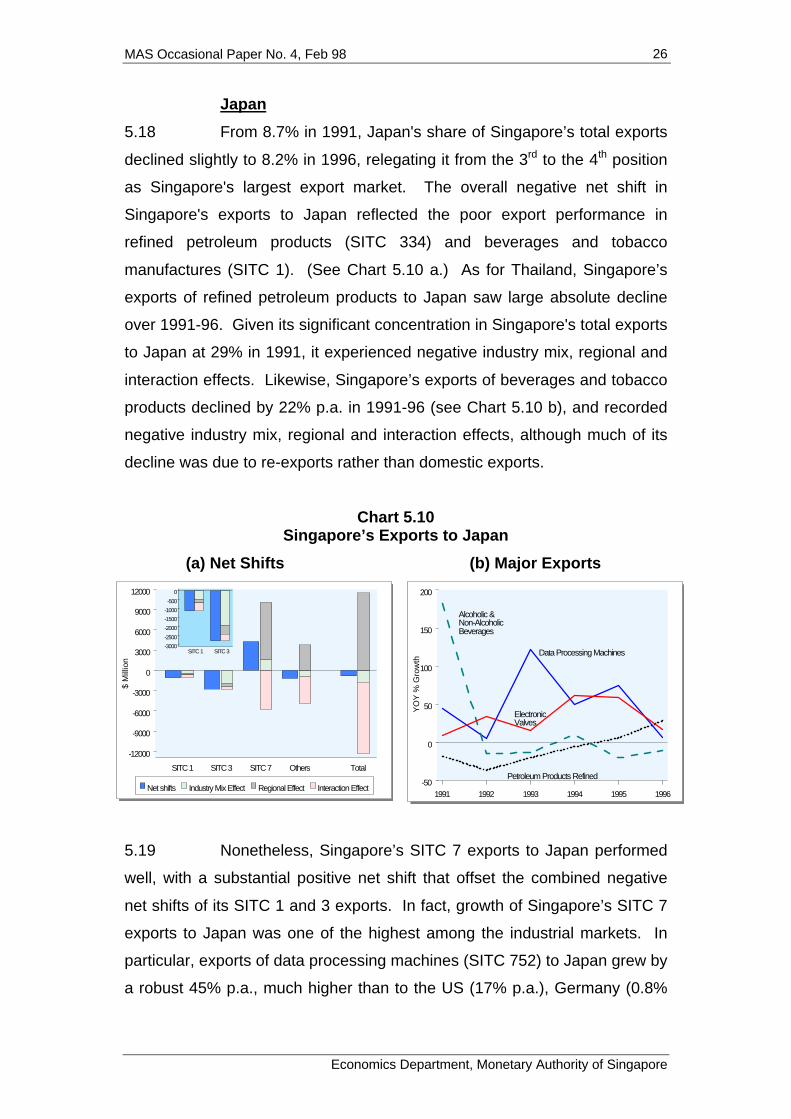
5.18 From 8.7% in 1991, Japan's share of Singapore’s total exports
declined slightly to 8.2% in 1996, relegating it from the 3rd to the 4th position
as Singapore's largest export market. The overall negative net shift in
Singapore's exports to Japan reflected the poor export performance in
refined petroleum products (SITC 334) and beverages and tobacco
manufactures (SITC 1). (See Chart 5.10 a.) As for Thailand, Singapore’s
exports of refined petroleum products to Japan saw large absolute decline
over 1991-96. Given its significant concentration in Singapore's total exports
to Japan at 29% in 1991, it experienced negative industry mix, regional and
interaction effects. Likewise, Singapore’s exports of beverages and tobacco
products declined by 22% p.a. in 1991-96 (see Chart 5.10 b), and recorded
negative industry mix, regional and interaction effects, although much of its
decline was due to re-exports rather than domestic exports.
Chart 5.10Singapore’s Exports to Japan
(a) Net Shifts (b) Major Exports
SITC 1 SITC 3 SITC 7 Others Total
-12000
-9000
-6000
-3000
0
3000
6000
9000
12000
$ M
illio
n
Net shifts Industry Mix Effect Regional Effect Interaction Effect
SITC 1 SITC 3 -3000
-2500
-2000
-1500
-1000
-500
0
1991 1992 1993 1994 1995 1996-50
0
50
100
150
200
YO
Y %
Gro
wth
Petroleum Products Refined
Electronic Valves
Data Processing Machines
Alcoholic & Non-Alcoholic Beverages
5.19 Nonetheless, Singapore’s SITC 7 exports to Japan performed
well, with a substantial positive net shift that offset the combined negative
net shifts of its SITC 1 and 3 exports. In fact, growth of Singapore’s SITC 7
exports to Japan was one of the highest among the industrial markets. In
particular, exports of data processing machines (SITC 752) to Japan grew by
a robust 45% p.a., much higher than to the US (17% p.a.), Germany (0.8%
MAS Occasional Paper No. 4, Feb 98
Economics Department, Monetary Authority of Singapore
27
p.a.) and even Malaysia (37% p.a.). Electronics valves also saw stronger
export growth in Japan, at 35% p.a., compared to 22% and 30% p.a. in the
US and Germany respectively. (See Chart 5.10 b.) Reflecting the
competitiveness of its electronics exports, Singapore's share of the
Japanese electronics market increased from 8% in 1991 to 10% in 1996.
MAS Occasional Paper No. 4, Feb 98
Economics Department, Monetary Authority of Singapore
28
6 TRENDS IN SINGAPORE’S DOMESTIC EXPORT MARKETGROWTH
6.1 To the extent that an economy’s capability to generate exports
from its own industrial base is better reflected by its domestic exports than
re-exports, it is useful to supplement our analysis of total exports with a
separate analysis of domestic exports only. By applying the same shift-
share technique to domestic exports, we found that the results of the
analysis were similar to our earlier findings on total exports. (See Appendix
3.) There are, however, some significant differences.
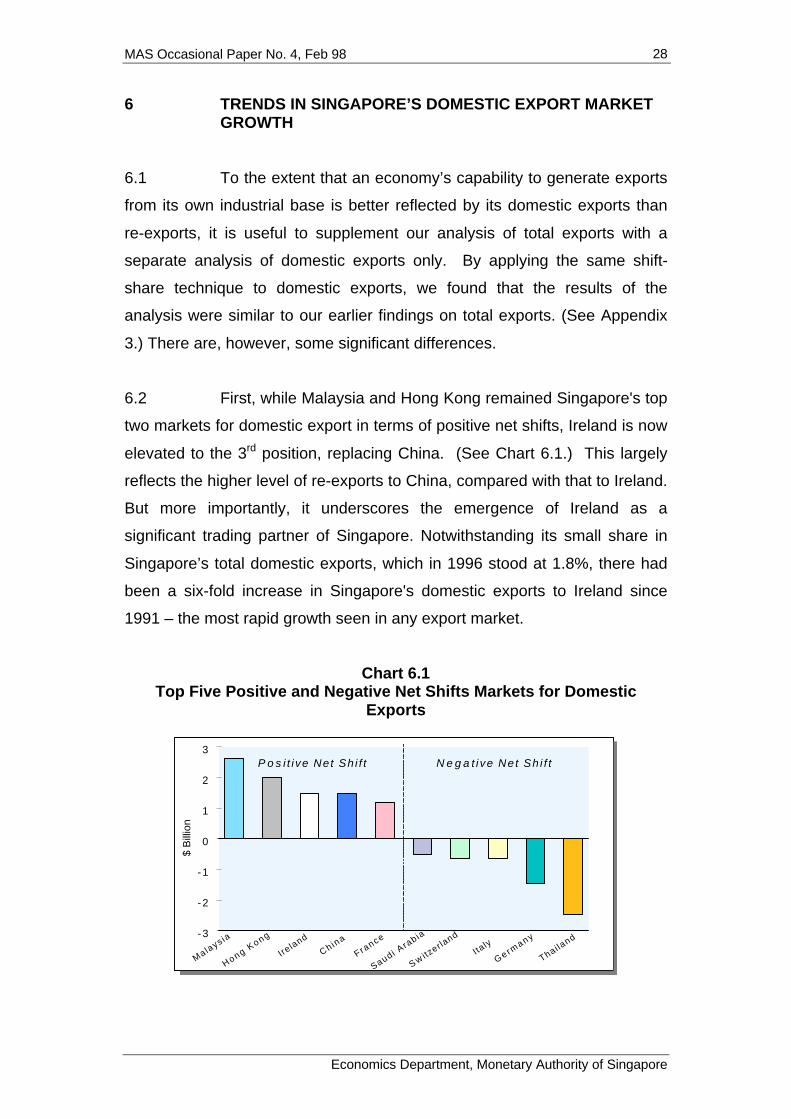
6.2 First, while Malaysia and Hong Kong remained Singapore's top
two markets for domestic export in terms of positive net shifts, Ireland is now
elevated to the 3rd position, replacing China. (See Chart 6.1.) This largely
reflects the higher level of re-exports to China, compared with that to Ireland.
But more importantly, it underscores the emergence of Ireland as a
significant trading partner of Singapore. Notwithstanding its small share in
Singapore’s total domestic exports, which in 1996 stood at 1.8%, there had
been a six-fold increase in Singapore's domestic exports to Ireland since
1991 – the most rapid growth seen in any export market.
Chart 6.1Top Five Positive and Negative Net Shifts Markets for Domestic
Exports
-3
-2
-1
0
1
2
3
$ B
illio
n
P o s i t i ve Net Sh i f t N e g a t i ve Net Sh i f t
Malays ia
Hong Kong
Ireland
Ch ina
Saudi Ara
b ia
Italy
Thai land
Ge rmany
France
S w itzer la
nd
MAS Occasional Paper No. 4, Feb 98
Economics Department, Monetary Authority of Singapore
29
6.3 Second, instead of the US, Thailand recorded the largest
negative net shift for Singapore’s domestic exports. This reflected the
weaker performance of Singapore's domestic exports to Thailand compared
to re-exports. The latter grew by 23.3% p.a. in 1991-96, significantly higher
than the 0.3% p.a. recorded by Singapore's domestic exports to Thailand.
6.4 Third, unlike our earlier analysis, Singapore’s domestic exports
to Japan experienced a favourable net shift. The different outcomes reflected
the weaker performance of Singapore's re-exports to Japan relative to its
domestic exports. Thus, while domestic exports to Japan grew by about the
same rate as Singapore's overall domestic exports of 10% p.a. in 1991-96,
the 10% p.a. growth of re-exports to the Japanese market was slower than
the 16% p.a. growth for Singapore's overall re-exports. The differential in
growth was significant, given that re-exports accounted for about a third of
Singapore's total exports to Japan.

MAS Occasional Paper No. 4, Feb 98
Economics Department, Monetary Authority of Singapore
30
7 SINGAPORE’S OVERSEAS INVESTMENT AND EXPORTS
7.1 In this section, we examine the linkages between investment
and trade. Since 1990, Singapore's outward direct investments in the region
have grown at 21% p.a.. This is in line with the government's regionalisation
effort aimed at creating an external wing for the Singapore economy to boost
its foreign-sourced income. It is also consistent with the trend towards a
transnational network of production facilities in the region to take advantage
of the respective countries' comparative advantages. In this regard, it is
interesting to note that the regional countries in which Singapore’s exports
recorded significant positive net shifts were also major recipients of its
overseas investments. Three of Singapore’s export markets with the largest
positive net shifts, namely Malaysia, Hong Kong and China, were among the
most popular destinations for Singapore’s direct investments abroad. (See
Chart 7.1 a.) Together, they accounted for half of Singapore’s total overseas
investment in 1995, with investments in Malaysia being the largest ($ 9.7
bn), followed by Hong Kong ($6.3 bn) and China ($3.0 bn). The strong link
between the direction of Singapore’s exports and its overseas investments is
even more apparent from the geographical pattern of manufacturing
investments abroad. (See Chart 7.1 b.)
Chart 7.1 (a) Singapore’s Export Growth (b) Singapore’s Manufacturing & Direct Investment Abroad Investment Abroad, 1995
Malaysia
Hong Kong
China
0 2000 4000 6000 8000 10000S$ Million
Net Shifts (1991-96) Direct Investment Abroad(end 1995)
Indonesia
Malaysia
Hong KongChina
Others
6.2%
26.3%
18.7%
35.5%
13.3%
MAS Occasional Paper No. 4, Feb 98
Economics Department, Monetary Authority of Singapore
31
8 IMPLICATIONS AND CONCLUSION
8.1 This paper has employed the shift-share technique to examine
Singapore’s export market growth in 1991-96. The results show that the
regional economies have played an increasingly significant role vis-à-vis the
industrial countries as Singapore's export markets. Exports to Malaysia,
Hong Kong, China, Ireland and France posted the largest positive net shifts
while exports to the US, Thailand, Germany, Italy and Japan recorded the
largest negative net shifts. A decomposition of the net shifts shed further
light on the factors that had contributed to the changes in share for all major
export categories in each market. A number of significant implications for
the Singapore economy can be drawn from the analyses.
8.2 First, the government’s decision to focus on the promotion of
electronics industries is well justified by the fact that export growth of
Singapore in recent years was largely driven by the impressive performance
of electronics exports. Despite the global electronics slowdown in 1992 and
more recently in the second half of 1996, Singapore’s exports of transport
and machinery equipment (SITC 7) recorded the highest industry-mix effect
in all its major export markets. While many have argued that Singapore’s
heavy dependence on the electronics industry has increased the economy’s
vulnerability to swings in the electronics cycle, it is almost certain that
Singapore would not have achieved such high export growth if not for
electronics exports. To be sure, the export performance of the various
electronics sub-industries has been mixed. For example, exports of office
and data processing machines (SITC 752) and electronic valves (SITC 776)
grew more rapidly than that of telecommunications equipment (SITC 764)
and consumer electronics like video recorders (SITC 763) and television
receivers (SITC 761). The key to sustaining robust export expansion will be
continued emphasis on fast growth sectors such as high-end disk drives and
semiconductors.8 Moreover, with increasing focus on the electronics
8 Dataquest has forecast the semiconductor industry to register double-digit growth
from 1998-2001, when the market is expected to surpass US$300 bn.
MAS Occasional Paper No. 4, Feb 98
Economics Department, Monetary Authority of Singapore
32
industry by the regional economies, Singapore could hardly afford not to
attract more high-tech investments to sharpen its competitive edge.
8.3 Second, while electronics would remain the mainstay of
Singapore’s export engine, industries such as chemicals and related
products (SITC 5), and mineral fuels, lubricants and related materials (SITC
3), and miscellaneous manufactured articles (SITC 8) should not be
overlooked. As these products accounted for a significant 23% of our total
exports in 1996, higher growth could be obtained if greater efforts were
made to expand their share in selected markets where Singapore has a
competitive advantage. The need to focus on specific products for each
export market where Singapore enjoys a competitive advantage is critical in
the face of increasing competition from other exporters as well as domestic
producers.
8.4 Third, while Singapore faces increasing competition from the
region in its exports to the developed markets, it has also benefited greatly
from exporting to the regional economies. This is reflected in the significant
positive net shifts of Singapore's exports in most Asian NIEs. While the
current regional currency crisis may affect the short-term growth prospects of
some regional economies, the long-term outlook for the region remains
favourable. Sustained growth and development in the region will continue to
underpin Singapore’s export growth. However, given that much of our
exports to the region were intermediate goods to be assembled into final
products for exports to third countries, the demand for our exports depends
more on the strength of the industrial economies. The regional slowdown is
thus unlikely to have significant adverse impact on our export growth
provided demand from the industrial economies remains strong.
Nevertheless, the uncertainty surrounding the region has underscored the
need for Singapore to diversify its export base by reaching out to new growth
areas outside the region.
8.5 Fourth, the diminishing importance of the US, Japan and the
EU as Singapore's export markets, as implied by their negative net shifts,
MAS Occasional Paper No. 4, Feb 98
Economics Department, Monetary Authority of Singapore
33
has heightened the need for us to explore new export markets. Singapore
has made some headway in penetrating into non-traditional markets, such
as Ireland, where significant positive net shifts were experienced. However,
our trading relations with a number of countries in the Middle East, Latin
America, Eastern Europe, Russia and South Africa remain superficial.
Trading opportunities in new markets in these areas should be identified and
exploited to further boost Singapore’s export performance. In this regard, the
strategy of TDB’s Committee on International Trade, as announced in Feb
1997, to focus more on emerging markets with the goal of turning Singapore
into a city of international trade with global reach is appropriate.9
Furthermore, given that emerging markets are among areas that have the
lowest penetration ratios for electronics products, the potential for growth of
our electronics exports is high.
8.6 Finally, the regionalisation of the Singapore economy, with the
attendant relocation of industries to countries in the region, has not led to a
hollowing-out of Singapore's manufacturing sector or adverse ramifications
on its export market growth. In fact, Singapore's exports are increasingly
directed at markets where Singapore has heavily invested. In this regard,
Singapore's regionalisation effort has been beneficial and initiatives such as
the Singapore-Johor-Riau Growth Triangle, which exploit the different
comparative advantages of the regional economies, should be promoted in
order to attract investments of higher quality into Singapore.
9 TDB’s recent strategic initiative to open an office in Dubai should be commended.
Dubai is not only the focal point for countries bordering the Arabian Sea andPersian Gulf, it has grown to serve the newly-independent Central Asian republics,East Africa and the Indian subcontinent.
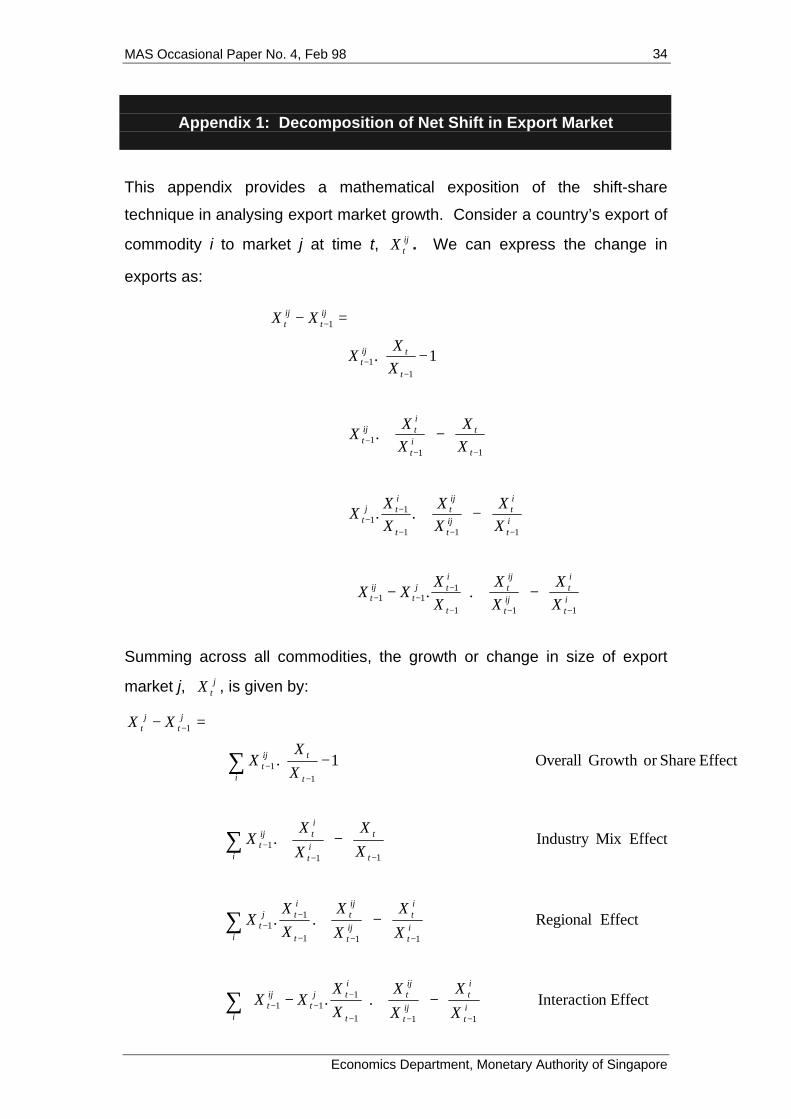
MAS Occasional Paper No. 4, Feb 98
Economics Department, Monetary Authority of Singapore
34
Appendix 1: Decomposition of Net Shift in Export Market
This appendix provides a mathematical exposition of the shift-share
technique in analysing export market growth. Consider a country’s export of
commodity i to market j at time t, ijtX . We can express the change in
exports as:
Summing across all commodities, the growth or change in size of export
market j, jtX , is given by:
−
−+
−
+
−
+
−
=−
−−−
−−−
−−−
−−
−−−
−−
−
it
it
ijt
ijt
t
itj
tijt
it
it
ijt
ijt
t
itj
t
t
tit
itij
t
t
tijt
ijt
ijt
XX
XX
XX
XX
XX
XX
XX
X
XX
XX
X
XX
X
XX
111
111
111
11
111
11
1
..
..
.
1.
Effectn Interactio..
Effect Regional..
EffectMixIndustry.
Effect Shareor GrowthOverall1.
111
111
111
11
11
1
11
1
⇒
−
−+
⇒
−
+
⇒
−
+
⇒
−
=−
∑
∑
∑
∑
−−−
−−−
−−−
−−
−−−
−−
−
iit
it
ijt
ijt
t
itj
tijt
iit
it
ijt
ijt
t
itj
t
i t
tit
itij
t
i t
tijt
jt
jt
X
X
X
X
X
XXX
X
X
X
X
X
XX
X
X
X
XX
X
XX
XX
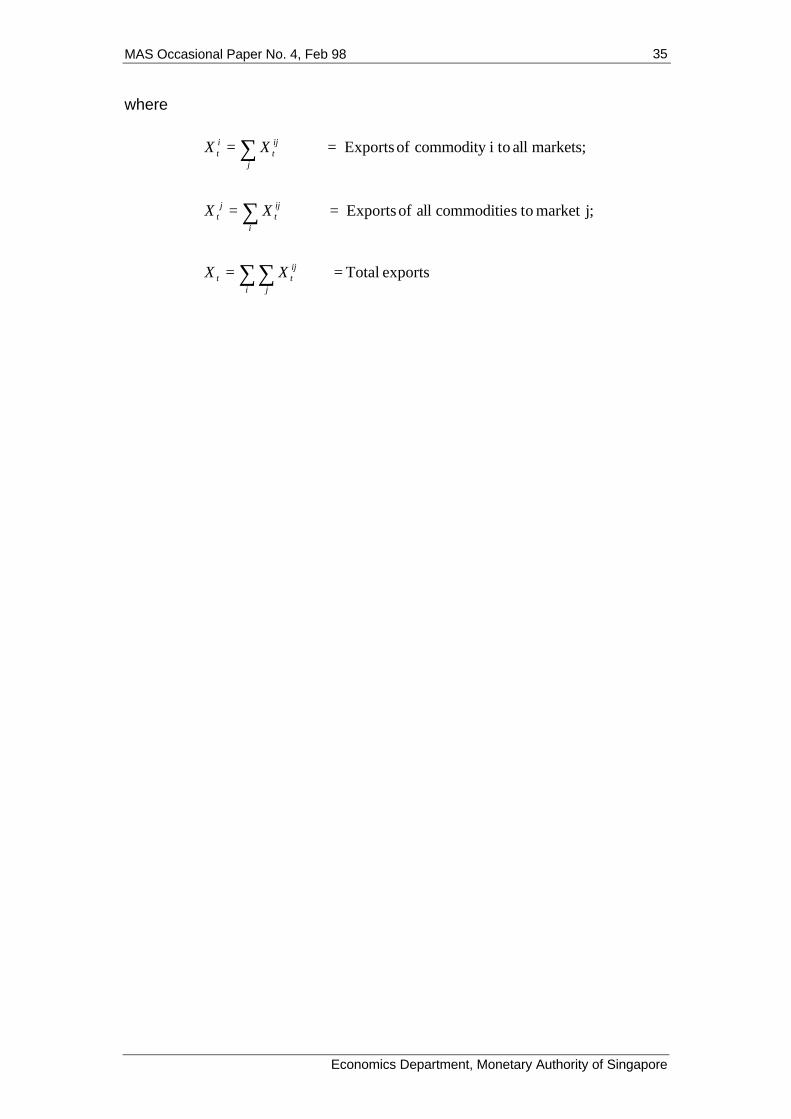
MAS Occasional Paper No. 4, Feb 98
Economics Department, Monetary Authority of Singapore
35
where
exports Total
j;market toscommoditie all of Exports
markets; all toicommodity of Exports
==
==
==
∑∑
∑
∑
i j
ijtt
i
ijt
jt
j
ijt
it
XX
XX
XX

MAS Occasional Paper No. 4, Feb 98
Economics Department, Monetary Authority of Singapore
36
Appendix 2: Singapore’s Total Exports Growth, 1991-96
Share Net % shareCountry 1991 1996 Change Effect Shifts 1991 1996
Malaysia 15,236,053 31,742,891 16,506,838 11,125,365 5,381,473 14.95 18.01Hong Kong 7,346,485 15,687,401 8,340,916 5,364,403 2,976,513 7.21 8.90China People's Republic 1,484,678 4,783,948 3,299,270 1,084,112 2,215,158 1.46 2.71Ireland 275,216 2,017,527 1,742,311 200,963 1,541,348 0.27 1.14France 1,190,070 3,466,986 2,276,916 868,989 1,407,927 1.17 1.97Philippines 1,175,847 3,237,505 2,061,658 858,603 1,203,055 1.15 1.84Korea, Republic Of 2,407,856 5,352,873 2,945,017 1,758,216 1,186,801 2.36 3.04Other Countries in Asia 1,346,570 3,239,484 1,892,914 983,265 909,649 1.32 1.84Brunei Darussalam 955,995 2,411,528 1,455,533 698,067 757,466 0.94 1.37Taiwan 3,621,037 6,869,884 3,248,847 2,644,081 604,766 3.55 3.90CIS 540,148 1,315,002 774,854 394,416 380,438 0.53 0.75Brazil 190,902 687,615 496,713 139,397 357,316 0.19 0.39Mexico 157,115 547,620 390,505 114,725 275,780 0.15 0.31Myanmar 462,859 1,017,933 555,074 337,980 217,094 0.45 0.58Malta 76,858 301,010 224,152 56,122 168,030 0.08 0.17Finland 103,769 289,903 186,134 75,772 110,362 0.10 0.16Macau 9,712 112,801 103,089 7,092 95,997 0.01 0.06Argentina 105,231 217,686 112,455 76,840 35,615 0.10 0.12Paraguay 8,064 41,798 33,734 5,888 27,846 0.01 0.02Czech Republic 0 27,366 27,366 0 27,366 0.00 0.02Israel 171,707 324,084 152,377 125,380 26,997 0.17 0.18Puerto Rico 32,529 72,737 40,208 23,753 16,455 0.03 0.04Madagascar 15,605 41,282 25,677 11,395 14,282 0.02 0.02Other Countries in America 47,165 91,585 44,420 34,440 9,980 0.05 0.05Ethiopia 2,026 10,991 8,965 1,479 7,486 0.00 0.01Gabon 5,165 16,250 11,085 3,771 7,314 0.01 0.01Uruguay 19,331 39,057 19,726 14,115 5,611 0.02 0.02Portugal 74,811 133,010 58,199 54,627 3,572 0.07 0.08Algeria 14,098 26,941 12,843 10,294 2,549 0.01 0.02Guatemala 2,303 5,589 3,286 1,682 1,604 0.00 0.00Slovak Republic (Slovakia) 0 1,484 1,484 0 1,484 0.00 0.00Somali Democratic Republic 19 121 102 14 88 0.00 0.00Iraq 0 6 6 0 6 0.00 0.00Cameroon 5,998 8,110 2,112 4,380 -2,268 0.01 0.00Zambia 2,881 2,697 -184 2,104 -2,288 0.00 0.00Uganda 5,617 7,066 1,449 4,102 -2,653 0.01 0.00Botswana 1,897 313 -1,584 1,385 -2,969 0.00 0.00Ghana 16,647 24,739 8,092 12,156 -4,064 0.02 0.01Cote D'Ivoire 8,951 11,324 2,373 6,536 -4,163 0.01 0.01Netherlands Antilles 7,439 8,476 1,037 5,432 -4,395 0.01 0.00Gibraltar 3,609 1,204 -2,405 2,635 -5,040 0.00 0.00Morocco 31,309 48,884 17,575 22,862 -5,287 0.03 0.03St Vincent and the Grenadines 20,461 29,851 9,390 14,941 -5,551 0.02 0.02Comoros 8,087 6,702 -1,385 5,905 -7,290 0.01 0.00Ecuador 7,244 4,828 -2,416 5,290 -7,706 0.01 0.00Jamaica 8,560 5,978 -2,582 6,251 -8,833 0.01 0.00Peru 18,845 22,179 3,334 13,761 -10,427 0.02 0.01Luxembourg 18,795 21,652 2,857 13,724 -10,867 0.02 0.01Trinidad and Tobago 7,976 2,557 -5,419 5,824 -11,243 0.01 0.00Nauru 8,885 2,863 -6,022 6,488 -12,510 0.01 0.00Honduras 24,479 27,595 3,116 17,875 -14,759 0.02 0.02Bermuda 14,139 9,409 -4,730 10,324 -15,054 0.01 0.01Tunisia 22,580 22,235 -345 16,488 -16,833 0.02 0.01Djibouti 20,705 17,995 -2,710 15,119 -17,829 0.02 0.01Korea, DPR 64,409 93,586 29,177 47,031 -17,854 0.06 0.05New Caledonia 63,479 87,603 24,124 46,352 -22,228 0.06 0.05New Zealand 326,371 541,729 215,358 238,316 -22,958 0.32 0.31Seychelles 44,235 50,628 6,393 32,300 -25,907 0.04 0.03Colombia 27,619 21,634 -5,985 20,167 -26,152 0.03 0.01Solomon Islands 27,795 18,463 -9,332 20,296 -29,628 0.03 0.01Hungary 67,789 87,547 19,758 49,500 -29,742 0.07 0.05Qatar 41,450 41,964 514 30,267 -29,753 0.04 0.02French Polynesia 38,187 32,923 -5,264 27,884 -33,148 0.04 0.02Other Countries in Europe 29,925 17,983 -11,942 21,851 -33,793 0.03 0.01Tanzania 44,759 39,897 -4,862 32,683 -37,545 0.04 0.02
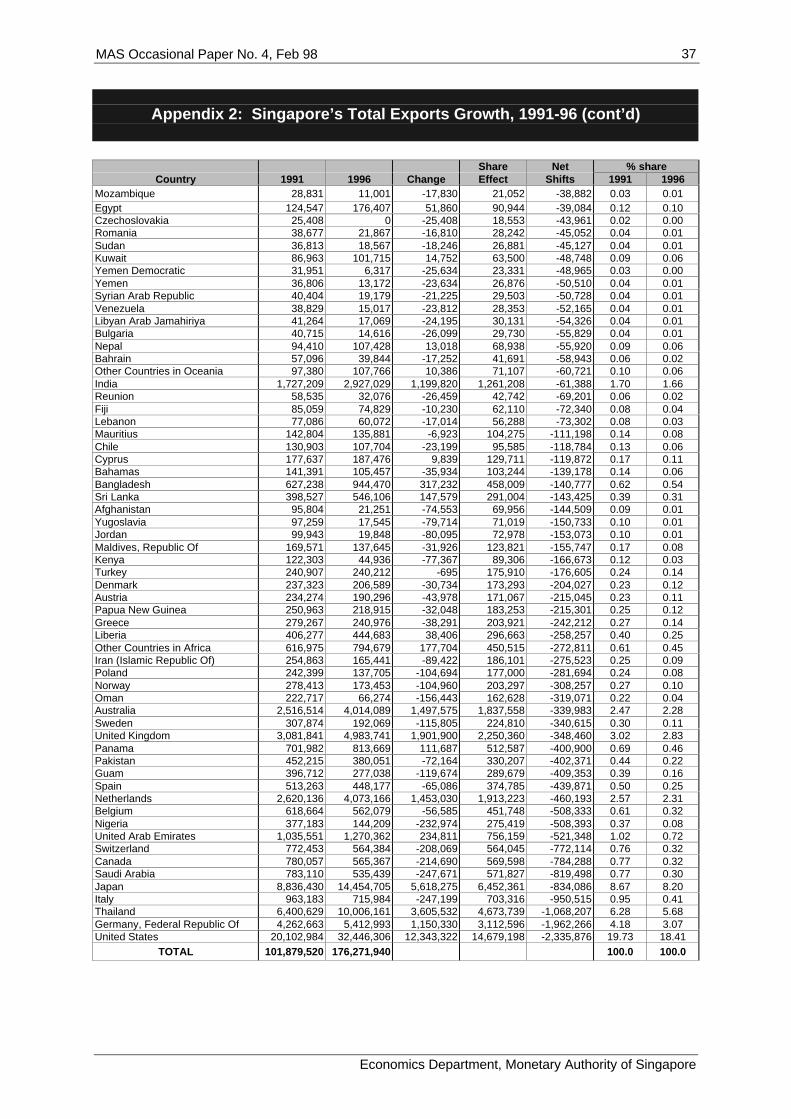
MAS Occasional Paper No. 4, Feb 98
Economics Department, Monetary Authority of Singapore
37
Appendix 2: Singapore’s Total Exports Growth, 1991-96 (cont’d)
Share Net % shareCountry 1991 1996 Change Effect Shifts 1991 1996
Mozambique 28,831 11,001 -17,830 21,052 -38,882 0.03 0.01Egypt 124,547 176,407 51,860 90,944 -39,084 0.12 0.10Czechoslovakia 25,408 0 -25,408 18,553 -43,961 0.02 0.00Romania 38,677 21,867 -16,810 28,242 -45,052 0.04 0.01Sudan 36,813 18,567 -18,246 26,881 -45,127 0.04 0.01Kuwait 86,963 101,715 14,752 63,500 -48,748 0.09 0.06Yemen Democratic 31,951 6,317 -25,634 23,331 -48,965 0.03 0.00Yemen 36,806 13,172 -23,634 26,876 -50,510 0.04 0.01Syrian Arab Republic 40,404 19,179 -21,225 29,503 -50,728 0.04 0.01Venezuela 38,829 15,017 -23,812 28,353 -52,165 0.04 0.01Libyan Arab Jamahiriya 41,264 17,069 -24,195 30,131 -54,326 0.04 0.01Bulgaria 40,715 14,616 -26,099 29,730 -55,829 0.04 0.01Nepal 94,410 107,428 13,018 68,938 -55,920 0.09 0.06Bahrain 57,096 39,844 -17,252 41,691 -58,943 0.06 0.02Other Countries in Oceania 97,380 107,766 10,386 71,107 -60,721 0.10 0.06India 1,727,209 2,927,029 1,199,820 1,261,208 -61,388 1.70 1.66Reunion 58,535 32,076 -26,459 42,742 -69,201 0.06 0.02Fiji 85,059 74,829 -10,230 62,110 -72,340 0.08 0.04Lebanon 77,086 60,072 -17,014 56,288 -73,302 0.08 0.03Mauritius 142,804 135,881 -6,923 104,275 -111,198 0.14 0.08Chile 130,903 107,704 -23,199 95,585 -118,784 0.13 0.06Cyprus 177,637 187,476 9,839 129,711 -119,872 0.17 0.11Bahamas 141,391 105,457 -35,934 103,244 -139,178 0.14 0.06Bangladesh 627,238 944,470 317,232 458,009 -140,777 0.62 0.54Sri Lanka 398,527 546,106 147,579 291,004 -143,425 0.39 0.31Afghanistan 95,804 21,251 -74,553 69,956 -144,509 0.09 0.01Yugoslavia 97,259 17,545 -79,714 71,019 -150,733 0.10 0.01Jordan 99,943 19,848 -80,095 72,978 -153,073 0.10 0.01Maldives, Republic Of 169,571 137,645 -31,926 123,821 -155,747 0.17 0.08Kenya 122,303 44,936 -77,367 89,306 -166,673 0.12 0.03Turkey 240,907 240,212 -695 175,910 -176,605 0.24 0.14Denmark 237,323 206,589 -30,734 173,293 -204,027 0.23 0.12Austria 234,274 190,296 -43,978 171,067 -215,045 0.23 0.11Papua New Guinea 250,963 218,915 -32,048 183,253 -215,301 0.25 0.12Greece 279,267 240,976 -38,291 203,921 -242,212 0.27 0.14Liberia 406,277 444,683 38,406 296,663 -258,257 0.40 0.25Other Countries in Africa 616,975 794,679 177,704 450,515 -272,811 0.61 0.45Iran (Islamic Republic Of) 254,863 165,441 -89,422 186,101 -275,523 0.25 0.09Poland 242,399 137,705 -104,694 177,000 -281,694 0.24 0.08Norway 278,413 173,453 -104,960 203,297 -308,257 0.27 0.10Oman 222,717 66,274 -156,443 162,628 -319,071 0.22 0.04Australia 2,516,514 4,014,089 1,497,575 1,837,558 -339,983 2.47 2.28Sweden 307,874 192,069 -115,805 224,810 -340,615 0.30 0.11United Kingdom 3,081,841 4,983,741 1,901,900 2,250,360 -348,460 3.02 2.83Panama 701,982 813,669 111,687 512,587 -400,900 0.69 0.46Pakistan 452,215 380,051 -72,164 330,207 -402,371 0.44 0.22Guam 396,712 277,038 -119,674 289,679 -409,353 0.39 0.16Spain 513,263 448,177 -65,086 374,785 -439,871 0.50 0.25Netherlands 2,620,136 4,073,166 1,453,030 1,913,223 -460,193 2.57 2.31Belgium 618,664 562,079 -56,585 451,748 -508,333 0.61 0.32Nigeria 377,183 144,209 -232,974 275,419 -508,393 0.37 0.08United Arab Emirates 1,035,551 1,270,362 234,811 756,159 -521,348 1.02 0.72Switzerland 772,453 564,384 -208,069 564,045 -772,114 0.76 0.32Canada 780,057 565,367 -214,690 569,598 -784,288 0.77 0.32Saudi Arabia 783,110 535,439 -247,671 571,827 -819,498 0.77 0.30Japan 8,836,430 14,454,705 5,618,275 6,452,361 -834,086 8.67 8.20Italy 963,183 715,984 -247,199 703,316 -950,515 0.95 0.41Thailand 6,400,629 10,006,161 3,605,532 4,673,739 -1,068,207 6.28 5.68Germany, Federal Republic Of 4,262,663 5,412,993 1,150,330 3,112,596 -1,962,266 4.18 3.07United States 20,102,984 32,446,306 12,343,322 14,679,198 -2,335,876 19.73 18.41
TOTAL 101,879,520 176,271,940 100.0 100.0
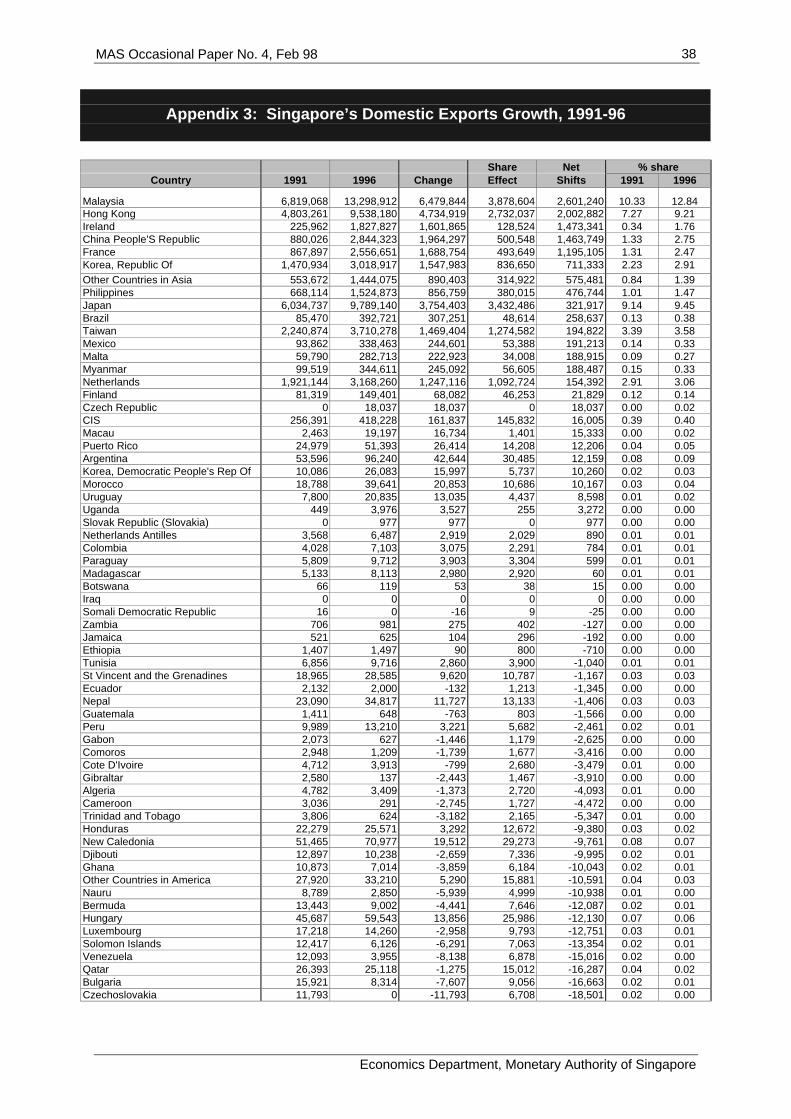
MAS Occasional Paper No. 4, Feb 98
Economics Department, Monetary Authority of Singapore
38
Appendix 3: Singapore’s Domestic Exports Growth, 1991-96
Share Net % shareCountry 1991 1996 Change Effect Shifts 1991 1996
Malaysia 6,819,068 13,298,912 6,479,844 3,878,604 2,601,240 10.33 12.84Hong Kong 4,803,261 9,538,180 4,734,919 2,732,037 2,002,882 7.27 9.21Ireland 225,962 1,827,827 1,601,865 128,524 1,473,341 0.34 1.76China People'S Republic 880,026 2,844,323 1,964,297 500,548 1,463,749 1.33 2.75France 867,897 2,556,651 1,688,754 493,649 1,195,105 1.31 2.47Korea, Republic Of 1,470,934 3,018,917 1,547,983 836,650 711,333 2.23 2.91Other Countries in Asia 553,672 1,444,075 890,403 314,922 575,481 0.84 1.39Philippines 668,114 1,524,873 856,759 380,015 476,744 1.01 1.47Japan 6,034,737 9,789,140 3,754,403 3,432,486 321,917 9.14 9.45Brazil 85,470 392,721 307,251 48,614 258,637 0.13 0.38Taiwan 2,240,874 3,710,278 1,469,404 1,274,582 194,822 3.39 3.58Mexico 93,862 338,463 244,601 53,388 191,213 0.14 0.33Malta 59,790 282,713 222,923 34,008 188,915 0.09 0.27Myanmar 99,519 344,611 245,092 56,605 188,487 0.15 0.33Netherlands 1,921,144 3,168,260 1,247,116 1,092,724 154,392 2.91 3.06Finland 81,319 149,401 68,082 46,253 21,829 0.12 0.14Czech Republic 0 18,037 18,037 0 18,037 0.00 0.02CIS 256,391 418,228 161,837 145,832 16,005 0.39 0.40Macau 2,463 19,197 16,734 1,401 15,333 0.00 0.02Puerto Rico 24,979 51,393 26,414 14,208 12,206 0.04 0.05Argentina 53,596 96,240 42,644 30,485 12,159 0.08 0.09Korea, Democratic People's Rep Of 10,086 26,083 15,997 5,737 10,260 0.02 0.03Morocco 18,788 39,641 20,853 10,686 10,167 0.03 0.04Uruguay 7,800 20,835 13,035 4,437 8,598 0.01 0.02Uganda 449 3,976 3,527 255 3,272 0.00 0.00Slovak Republic (Slovakia) 0 977 977 0 977 0.00 0.00Netherlands Antilles 3,568 6,487 2,919 2,029 890 0.01 0.01Colombia 4,028 7,103 3,075 2,291 784 0.01 0.01Paraguay 5,809 9,712 3,903 3,304 599 0.01 0.01Madagascar 5,133 8,113 2,980 2,920 60 0.01 0.01Botswana 66 119 53 38 15 0.00 0.00Iraq 0 0 0 0 0 0.00 0.00Somali Democratic Republic 16 0 -16 9 -25 0.00 0.00Zambia 706 981 275 402 -127 0.00 0.00Jamaica 521 625 104 296 -192 0.00 0.00Ethiopia 1,407 1,497 90 800 -710 0.00 0.00Tunisia 6,856 9,716 2,860 3,900 -1,040 0.01 0.01St Vincent and the Grenadines 18,965 28,585 9,620 10,787 -1,167 0.03 0.03Ecuador 2,132 2,000 -132 1,213 -1,345 0.00 0.00Nepal 23,090 34,817 11,727 13,133 -1,406 0.03 0.03Guatemala 1,411 648 -763 803 -1,566 0.00 0.00Peru 9,989 13,210 3,221 5,682 -2,461 0.02 0.01Gabon 2,073 627 -1,446 1,179 -2,625 0.00 0.00Comoros 2,948 1,209 -1,739 1,677 -3,416 0.00 0.00Cote D'Ivoire 4,712 3,913 -799 2,680 -3,479 0.01 0.00Gibraltar 2,580 137 -2,443 1,467 -3,910 0.00 0.00Algeria 4,782 3,409 -1,373 2,720 -4,093 0.01 0.00Cameroon 3,036 291 -2,745 1,727 -4,472 0.00 0.00Trinidad and Tobago 3,806 624 -3,182 2,165 -5,347 0.01 0.00Honduras 22,279 25,571 3,292 12,672 -9,380 0.03 0.02New Caledonia 51,465 70,977 19,512 29,273 -9,761 0.08 0.07Djibouti 12,897 10,238 -2,659 7,336 -9,995 0.02 0.01Ghana 10,873 7,014 -3,859 6,184 -10,043 0.02 0.01Other Countries in America 27,920 33,210 5,290 15,881 -10,591 0.04 0.03Nauru 8,789 2,850 -5,939 4,999 -10,938 0.01 0.00Bermuda 13,443 9,002 -4,441 7,646 -12,087 0.02 0.01Hungary 45,687 59,543 13,856 25,986 -12,130 0.07 0.06Luxembourg 17,218 14,260 -2,958 9,793 -12,751 0.03 0.01Solomon Islands 12,417 6,126 -6,291 7,063 -13,354 0.02 0.01Venezuela 12,093 3,955 -8,138 6,878 -15,016 0.02 0.00Qatar 26,393 25,118 -1,275 15,012 -16,287 0.04 0.02Bulgaria 15,921 8,314 -7,607 9,056 -16,663 0.02 0.01Czechoslovakia 11,793 0 -11,793 6,708 -18,501 0.02 0.00
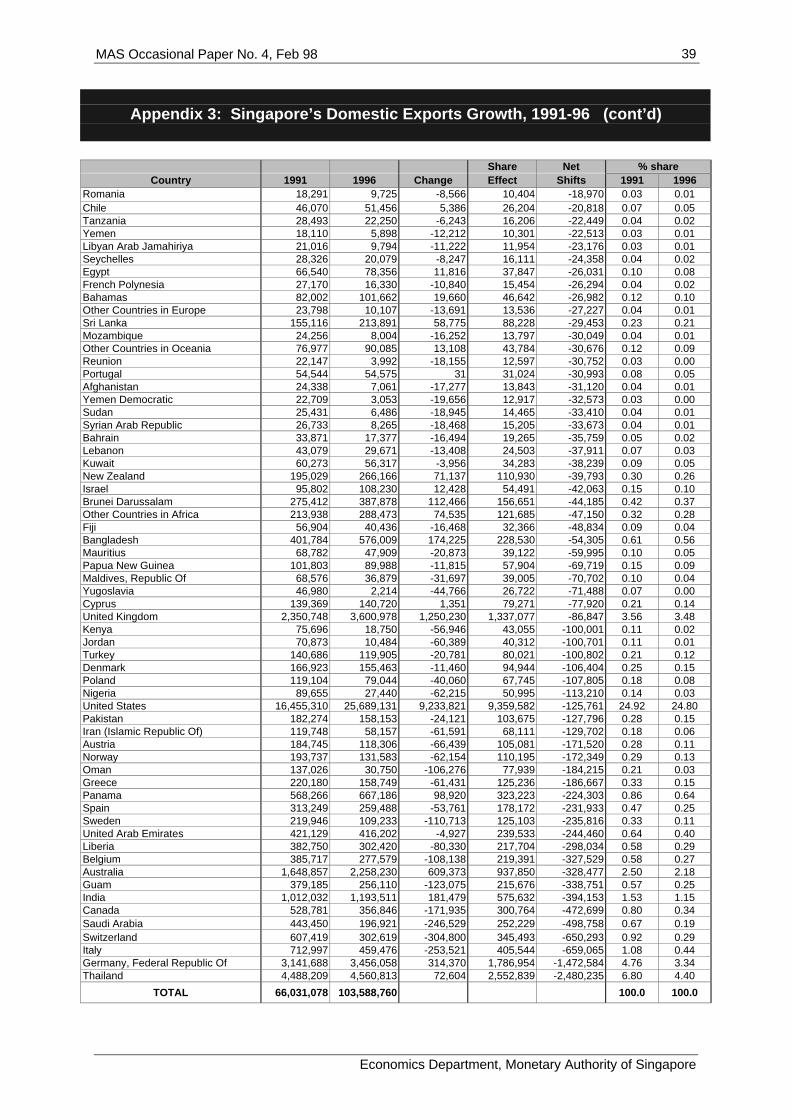
MAS Occasional Paper No. 4, Feb 98
Economics Department, Monetary Authority of Singapore
39
Appendix 3: Singapore’s Domestic Exports Growth, 1991-96 (cont’d)
Share Net % shareCountry 1991 1996 Change Effect Shifts 1991 1996
Romania 18,291 9,725 -8,566 10,404 -18,970 0.03 0.01Chile 46,070 51,456 5,386 26,204 -20,818 0.07 0.05Tanzania 28,493 22,250 -6,243 16,206 -22,449 0.04 0.02Yemen 18,110 5,898 -12,212 10,301 -22,513 0.03 0.01Libyan Arab Jamahiriya 21,016 9,794 -11,222 11,954 -23,176 0.03 0.01Seychelles 28,326 20,079 -8,247 16,111 -24,358 0.04 0.02Egypt 66,540 78,356 11,816 37,847 -26,031 0.10 0.08French Polynesia 27,170 16,330 -10,840 15,454 -26,294 0.04 0.02Bahamas 82,002 101,662 19,660 46,642 -26,982 0.12 0.10Other Countries in Europe 23,798 10,107 -13,691 13,536 -27,227 0.04 0.01Sri Lanka 155,116 213,891 58,775 88,228 -29,453 0.23 0.21Mozambique 24,256 8,004 -16,252 13,797 -30,049 0.04 0.01Other Countries in Oceania 76,977 90,085 13,108 43,784 -30,676 0.12 0.09Reunion 22,147 3,992 -18,155 12,597 -30,752 0.03 0.00Portugal 54,544 54,575 31 31,024 -30,993 0.08 0.05Afghanistan 24,338 7,061 -17,277 13,843 -31,120 0.04 0.01Yemen Democratic 22,709 3,053 -19,656 12,917 -32,573 0.03 0.00Sudan 25,431 6,486 -18,945 14,465 -33,410 0.04 0.01Syrian Arab Republic 26,733 8,265 -18,468 15,205 -33,673 0.04 0.01Bahrain 33,871 17,377 -16,494 19,265 -35,759 0.05 0.02Lebanon 43,079 29,671 -13,408 24,503 -37,911 0.07 0.03Kuwait 60,273 56,317 -3,956 34,283 -38,239 0.09 0.05New Zealand 195,029 266,166 71,137 110,930 -39,793 0.30 0.26Israel 95,802 108,230 12,428 54,491 -42,063 0.15 0.10Brunei Darussalam 275,412 387,878 112,466 156,651 -44,185 0.42 0.37Other Countries in Africa 213,938 288,473 74,535 121,685 -47,150 0.32 0.28Fiji 56,904 40,436 -16,468 32,366 -48,834 0.09 0.04Bangladesh 401,784 576,009 174,225 228,530 -54,305 0.61 0.56Mauritius 68,782 47,909 -20,873 39,122 -59,995 0.10 0.05Papua New Guinea 101,803 89,988 -11,815 57,904 -69,719 0.15 0.09Maldives, Republic Of 68,576 36,879 -31,697 39,005 -70,702 0.10 0.04Yugoslavia 46,980 2,214 -44,766 26,722 -71,488 0.07 0.00Cyprus 139,369 140,720 1,351 79,271 -77,920 0.21 0.14United Kingdom 2,350,748 3,600,978 1,250,230 1,337,077 -86,847 3.56 3.48Kenya 75,696 18,750 -56,946 43,055 -100,001 0.11 0.02Jordan 70,873 10,484 -60,389 40,312 -100,701 0.11 0.01Turkey 140,686 119,905 -20,781 80,021 -100,802 0.21 0.12Denmark 166,923 155,463 -11,460 94,944 -106,404 0.25 0.15Poland 119,104 79,044 -40,060 67,745 -107,805 0.18 0.08Nigeria 89,655 27,440 -62,215 50,995 -113,210 0.14 0.03United States 16,455,310 25,689,131 9,233,821 9,359,582 -125,761 24.92 24.80Pakistan 182,274 158,153 -24,121 103,675 -127,796 0.28 0.15Iran (Islamic Republic Of) 119,748 58,157 -61,591 68,111 -129,702 0.18 0.06Austria 184,745 118,306 -66,439 105,081 -171,520 0.28 0.11Norway 193,737 131,583 -62,154 110,195 -172,349 0.29 0.13Oman 137,026 30,750 -106,276 77,939 -184,215 0.21 0.03Greece 220,180 158,749 -61,431 125,236 -186,667 0.33 0.15Panama 568,266 667,186 98,920 323,223 -224,303 0.86 0.64Spain 313,249 259,488 -53,761 178,172 -231,933 0.47 0.25Sweden 219,946 109,233 -110,713 125,103 -235,816 0.33 0.11United Arab Emirates 421,129 416,202 -4,927 239,533 -244,460 0.64 0.40Liberia 382,750 302,420 -80,330 217,704 -298,034 0.58 0.29Belgium 385,717 277,579 -108,138 219,391 -327,529 0.58 0.27Australia 1,648,857 2,258,230 609,373 937,850 -328,477 2.50 2.18Guam 379,185 256,110 -123,075 215,676 -338,751 0.57 0.25India 1,012,032 1,193,511 181,479 575,632 -394,153 1.53 1.15Canada 528,781 356,846 -171,935 300,764 -472,699 0.80 0.34Saudi Arabia 443,450 196,921 -246,529 252,229 -498,758 0.67 0.19Switzerland 607,419 302,619 -304,800 345,493 -650,293 0.92 0.29Italy 712,997 459,476 -253,521 405,544 -659,065 1.08 0.44Germany, Federal Republic Of 3,141,688 3,456,058 314,370 1,786,954 -1,472,584 4.76 3.34Thailand 4,488,209 4,560,813 72,604 2,552,839 -2,480,235 6.80 4.40
TOTAL 66,031,078 103,588,760 100.0 100.0

MAS Occasional Paper No. 4, Feb 98
Economics Department, Monetary Authority of Singapore
40
REFERENCES
Fothergill, Stephen and Graham Gudgin. 1979. “In defence of Shift-Share” Urban
Studies, 16:309-319.
Hayward, J. David. 1995. International Trade and Regional Economies: The Impacts
of European Integration on the United States. Colorado: WestView Press.
Herschede, Fred. 1991. “Competition among ASEAN, China, and the East Asian
NICs: A Shift-Share Analysis" ASEAN Economic Bulletin, 7:3:290-306.
Khalifah, N. Aini. 1996. “Identifying Malaysia’s Export Market Growth: A Shift-Share
Analysis" Asia-Pacific Development Journal, 3:1:73-92.
Leamer, E.F. and R.M. Stern. 1969. Quantitative International Economics. New York:
John Wiley and Sons.
Ledebur, L.C. and R.L.Moomaw. 1983. “A Shift-Share Analysis of Regional Labour
Productivity in Manufacturing” Growth and Change, Jan:2-9.
Richardson, J. David. 1971. “Constant-Market-Shares Analysis of Export Growth”
Journal of International Economics I, 2:227-239.
Trade Development Board. Various issues. Singapore Trade Statistics: Imports and
Exports, Singapore.
* All MAS Occasional Papers in Adobe Acrobat (PDF) format can be downloaded at theMAS Website at http://www.mas.gov.sg.
MAS OCCASIONAL PAPER SERIES*
Number Title Date
1 Current Account Deficits in the ASEAN-3: Is There Cause for Concern?
May 1997
2 Quality of Employment Growth in Singapore: 1983-96
Oct 1997
3 Whither the Reminbi? Dec 1997
4 Growth in Singapore's Export Markets, 1991-96: A Shift-Share Analysis
Feb 1998