Growth. Evolution. · PDF fileFinancial highlights 5 Chairman’s report 6 ... > BOQ...
122
Growth. Evolution. Achievement.
-
Upload
nguyendang -
Category
Documents
-
view
220 -
download
5
Transcript of Growth. Evolution. · PDF fileFinancial highlights 5 Chairman’s report 6 ... > BOQ...

Growth. Evolution. Achievement.

The Bank’s goal throughout 2008/09 has been to emerge from the economic crisis a stronger, leaner, more competitive bank. A bank that continues to grow, evolve and achieve.
Contents Operational highlights 3
Financial highlights 5
Chairman’s report 6
Managing Director’s report 9
Outlook 11
Corporate Social Responsibility 13
Executive team 14
Your Board 16
Corporate governance 19
Shareholder information 22
Financial report 23
Front cover: Chris Nilon, General Manager of IT, climbed three of the highest peaks in Antarctica on his annual leave in December 2008, including Mt Vinson where this photo was taken.

Project Pathways completed
Project Pathways, launched in December 2008, was the formal process to further enhance the Bank’s strength through efficiency initiatives, portfolio optimisation and strategic partnerships.
The project, which had the main aim of maximising shareholder value, was successfully completed in August 2009.
Efficiency program
Estimated annual cost savings of >approximately $50m.
Executed initiatives that allowed the Bank to >become competitive with major banks on a cost-to-income ratio basis.
Organisation restructure resulted in a single >management structure and shared services function to better service the Bank’s unique Owner-Managed Branch™ (OMB) network.
Portfolio optimisation
Completed enhancements to direct channels >and the OMB network to incentivise stronger growth in retail deposits.
Focused on increasing our share of the SME >market, via enhanced product offerings and cross-sell capability.
Strategic partner
BOQ received interest from a number >of parties, with capital raising providing competitive pricing for potential shareholders.
BOQ will remain an independent and >credible alternative to the major banks.
1

Growth
Following the successful completion of our $340 million equity raising, the Bank’s Tier 1 capital position is now one of the strongest of Australian banks. This new capital will allow BOQ to take advantage of emerging growth opportunities and to support BOQ’s unique Owner-Managed Branch network in pursuing its natural growth potential.
“ We are a strong competitor ...... focused on continuing to grow our business further and faster than the others.”
2

Our focus remains on building shareholder value, and in the current economic environment it is imperative we continue to think outside the square to do this.
Strong growth
BOQ continued to outperform competitors in loan >growth, with 88% of this growth funded through retail deposits.
Awards for excellence
Bank of Queensland won the ‘Best Value Savings >Accounts in Australia’ award from CANSTAR CANNEX.
Managing Director David Liddy was named >Australia’s Financial Services Executive of the Year by Australian Banking & Finance Magazine.
BOQ’s online banking services were >recently highly rated 5 out of 6 stars by PC Authority magazine.
TNS Business Finance Monitor Survey ranked >BOQ number 1 in business customer satisfaction.
Improved capital position
The retail entitlement shareholder offer raised >$111m in September 2009.
The institutional offer and placement raised $230m >in August 2009.
Raised $108m in January 2009 through institutional >placement and share purchase plan.
Even throughout the global financial crisis, the Bank’s unique OMB network continued to demonstrate unmatched productivity.
We have now converted 39 corporate branches to high-yielding OMBs, where we have seen average monthly settlements increase 64% after conversion.
16%Retail deposit growth
10%Lending growth
3

Evolution
“ BOQ has emerged from the recent changes to the financial services landscape well placed to become the credible alternative to the major banks in Australia.” – David Liddy
4

Despite adverse market conditions and reduced net interest margins, >continued growth in lending and deposits combined with rigorous cost surveillance helped drive normalised cash net profit after tax 21% higher to $187.4m.
Controlled approach to expense management, along with efficiencies >identified by Project Pathways, resulted in normalised cash cost-to-income ratio dropping 6.2% to 49.9%.
Continued focus on well-secured housing and SME lending, maintained >sound asset quality. Bad debts have been increasing, but are still tracking well below major bank peers.
In response to prevailing market conditions, BOQ adopted a prudent >dividend policy, declaring a full-year dividend of 52 cents fully franked per share.
2006
49.9%
2007
64.5%
2008
62.6%
2009
56.1%
Normalised cash cost-to-income ratio
Financial summary$ millions (unless otherwise stated)
2009$m
2008$m
2007$m
2006$m
2005$m
Financial position:
Total assets under management 34,545.8 30,912.5 21,653.3 16,866.7 14,388.6
Total loans under management 28,866.3 26,291.8 19,224.5 15,081.4 12,381.5
Total assets on balance sheet 34,012.0 29,883.2 20,037.3 15,797.1 13,650.6
Retail deposits 16,248.9 13,984.5 9,160.9 6,867.2 5,843.3
Financial performance:
Normalised cash net profit after tax 187.4 155.4 106.1 86.7 75.6
Shareholder performance:
Market capitalisation at balance date 2,327.7 2,377.4 2,101.0 1,628.4 1,177.8
Share price at balance date $11.65 $15.86 $18.56 $15.29 $11.65
Fully franked ordinary dividend per share $0.52 $0.73 $0.69 $0.57 $0.48
Ratios:
Net interest margin 1.56% 1.67% 1.81% 1.83% 1.83%
Capital adequacy ratio 11.5% 11.0% 11.5% 12.5% 12.4%
Normalised cash cost-to-income ratio1,2 49.9% 56.1% 62.6% 64.5% 65.8%
(1) Excluding significant and non-recurring items.
(2) Non cash items relate to amortisation of identifiable assets.
5

Normalised cash net profit after tax$ million
DividendsCents per share
Dividend yield
20072006 2008
106.1
86.7
2009
155.4
2007 2008
6973
2006
57
3.7%
2009
187.4
52
4.5%4.6%3.7%
FY 2009 funding mix
Short-term Wholesale 17%
Retail 48%
Long-term Wholesale 11%
Securitisation 18%
Capital 6%
6

It is no exaggeration to say that the past 18 months has been an unprecedented time, not only for the Australian financial
services industry, but for the global economy. Fortunately, the unique strength of our domestic banking system and the stimulus of expansionary fiscal and monetary policy have to a large degree insulated Australia from the worst of the global recession.
Notwithstanding, an inescapable consequence of the global financial crisis for Australian banks has been the severe contraction of traditional wholesale funding channels. Despite intensified demand within the marketplace for alternate funding, over the past 12 months Bank of Queensland has consolidated one of the strongest capital positions of Australian banks and sourced additional liquidity.
Another undoubted impact on the Australian financial system has been the significant increase in impaired assets for many banks. Notably, Bank of Queensland’s impaired assets in the 2009 financial year were much lower than our competitors, reflecting our continued focus on well-secured housing and SME lending.
The deteriorating economy forced many Australian companies to fail in the 2009 financial year which in turn forced bad debts upwards for banks. Fortunately Bank of Queensland’s position is much better than the major banks due to our lower risk profile and our traditionally low levels of corporate exposure.
Against this backdrop of challenges, the Bank’s ability to increase normalised cash net profit after tax by 21% to $187.4 million is an outstanding achievement.
Consistent with the prudent approach by the wider banking market, directors remained conscious of the over-riding need to preserve capital given prevailing market conditions and declared a reduced final dividend of 26 cents per share fully franked. This lifted the full-year dividend to 52 cents per share fully franked.
During the year under review we not only increased profitability but also, through the successful completion of Project Pathways, created a platform that will strategically drive our continued growth into the future.
Project Pathways was the formal process announced at our 2008 AGM designed to further strengthen the Bank’s foundations and forward growth prospects through efficiency initiatives, portfolio optimisation, strategic partnerships and complementary mergers.
Within six months this comprehensive diagnostic review of our entire organisation had identified $50 million in annualised cost saving opportunities. Among the key restructuring outcomes achieved through Project Pathways was the merging of our Retail and Business Financial Services channels into a single Banking channel, that will better drive targeted growth in the retail and SME segments.
In early 2009 the Bank commenced the search for a strategic partner and received significant interest from European and Asian investors. The improved market conditions in August 2009 allowed for a successful capital raising where the potential strategic partners competed for BOQ stock.
The Bank received tremendous support from shareholders for the 1-for-9 pro-rata non-renounceable Entitlement Offer which was successfully completed in September 2009. The retail component raised $111 million and followed the completion of an institutional component and placement which raised approximately $230 million.
Our institutional shareholders subscribed for approximately 93% of their entitlements. This exceptional show of support by our institutional shareholders is an endorsement of the Bank’s business model and strategic growth blueprint.
Furthermore, in a clear reinforcement of our credit standing in the debt markets, the Bank’s Government guaranteed bond issue launched in early July was three times oversubscribed and raised $750 million.
As a result of these various equity and debt raising initiatives, the Bank has exceptionally strong capital and liquidity positions which will enable us to fully capitalise on growth opportunities we expect to progressively unfold throughout the current financial year and beyond.
I must thank your Board for the valued strategic input and sage advice collectively made to the Bank’s successful result. In addition to guiding the Bank through this challenging time, your Board has also undertaken a comprehensive review to improve the Bank’s Corporate Governance policies to ensure continued best practice in governing our bank.
Our Managing Director David Liddy must also be congratulated on his appointment as Deputy Chair of the Australian Bankers’ Association (ABA). Given the key role played by the ABA in the regulation of a stable Australian banking system, his appointment to this influential position reflects Mr Liddy’s standing and respect within the domestic banking sector.
On behalf of the Board, I thank all shareholders for their loyalty and support over the past year and going forward.
At the start of the new financial year there were emerging signs of a more buoyant Australian economic outlook, with both household spending and business investment gaining traction. In early September the Reserve Bank of Australia noted that domestic economic conditions had not only been stronger than expected, but that sentiment in global financial markets had also continued to improve.
The RBA’s synopsis indicates that there should be more conducive trading conditions for the Bank in 2010 than the past 12 months and we believe this, combined with the sustainable lower cost base now in place as a result of the successfully completed Project Pathways, can be leveraged to grow shareholder wealth in the year ahead.
Neil Summerson
Chairman
7

Achievement
8

etail deposits$ billion
2006
6.9
2007
9.2
2008
14.0
2009
16.2
FY 2009 g g i n n i nQLD 64%
NSW 12%
VIC 11%
WA 10%
Other 3%
Bank of Queensland emerged at the end of the 2009 financial year a leaner, more robust bank with a platform
ready to strategically drive our continued growth forward.
The Bank has continued to grow despite the challenging economic environment and has again recorded a strong profit. Stringent asset quality surveillance and targeted cost savings combined to underpin the Bank’s normalised cash net profit after tax of $187.4 million, a 21% increase over the prior year.
Not only did we achieve our earnings forecasts, but also again outpaced the vast majority of our competitors in loan growth. Increasing retail deposits was particularly important during the first half of the year under review as higher costs of funding led to banks vying for alternative funding sources.
9

As a result aggressive sector-wide competition for deposits intensified during the year. At BOQ, the productivity and flexibility of our unique Owner-Managed Branch model ensured we were able to quickly and efficiently realign the Bank’s operational focus to driving deposit growth. With Owner-Managers directly incentivised, the Bank’s retail deposits increased 16% from the previous record year.
Also contributing to the strong retail deposit growth achieved was an enhanced product offering. In 2009 Canstar Cannex rated Bank of Queensland as providing the best value nationally for savings accounts - with our Online Savings, Cash Management and Term Deposit products all rated as offering outstanding value for customers.
In the second half of the year we focused on margin improvement in our deposit book, which stifled further growth somewhat but overall put us in a relatively strong position.
The Bank’s positive result is also due to our highly disciplined focus on maintaining strong asset quality. As at 31 August 2009, unlike our competitors with large exposures, Bank of Queensland had only 67 exposures over $10 million, reinforcing that we are essentially a domestic retail bank focused on low risk housing and small commercial lending.
In Australia we have seen many companies struggling in the past year, increasing bad debts for banks. Bank of Queensland has faced a moderate increase in bad debts as was expected with the downturn in the economy, but this is well below those incumbent on the major Australian banks.
Despite the challenging economic environment the Bank started the new financial year more strongly placed than ever to capitalise on future growth opportunities, largely due to Project Pathways.
Project Pathways represents one of the most significant strategic initiatives undertaken by the Bank for many years. Comprising three core streams - efficiency, portfolio optimisation and strategic partnerships, Pathways was implemented to take advantage of opportunities arising out of the financial crisis, to counter the negative effects of the economic downturn and to lay a foundation for our forward growth.
As part of the efficiency stream of Pathways, a cross sectional team of BOQ senior staff examined every aspect of our expenditure in order to effectively target $50 million in annualised cost savings opportunities. One of the main initiatives of the team and the Portfolio Optimisation Program was to streamline costs and synergies of the Retail and Business Financial Services channels. As a result, these channels were merged into a single Banking division.
One of the most positive outcomes of the efficiency stream of Pathways is the Bank’s reduction in the cost-to-income ratio. The cost disciplines we have put in place combined with our expanding revenue base have seen our normalised cash cost-to-income ratio decrease to 49.9% in FY 2009, a 6.2% decrease from the previous year. This is a long way from the 76% cash cost-to-income ratio the Bank had back in 2001, the year I joined BOQ.
By September 2009 we had successfully completed Project Pathways with the efficiency program executed, the portfolio optimisation strategy underway and we had completed an additional equity raising to further bolster our already strong balance sheet.
The retail and institutional equity raisings completed in September 2009 were heavily subscribed, raising $340 million and contributing to the highest capital position held in the 135 year history of the Bank. Our high capital ratio of 12.2% (Tier One 9.6%) at the writing of this report, is one of the strongest of all Australian banks, and well in excess of both APRA requirements and our own internal benchmarks.
We did look at possible merger and acquisition activity as part of the strategic partnership arm of Project Pathways and received interest from a number of parties looking to gain a strategic relationship with the Bank. However, in the context of preserving the value creation from the Pathways internal initiatives for our existing shareholders, our long term ambitions as an independent bank, and the improving equity markets, we decided to pursue the capital raising rather than choose a strategic partner.
In other initiatives designed to optimise the performance of our sector leading distribution channel, we have now converted 39 corporate branches to higher-yielding Owner-Managed Branches and the under-performing New South Wales branches have now been consolidated to improve the overall performance of the region.
Interstate expansion of our Owner-Managed Branches will continue and this expansion, combined with our acquisition of Western Australia’s Home Building Society in December 2007, is diminishing BOQ’s traditional geographic concentration in Queensland. This reduces the Bank’s geographic risk and provides a nationwide base to further grow our brand.
The Bank has continued it’s corporate social responsibility strategy which is the process that ensures all stakeholders of the Bank – including shareholders, customers, employees, the environment and community – all collectively benefit as the Bank grows.
As part of our commitment to shareholders we are focused on maximising shareholder value. To do this we will continue to focus on optimising the Bank’s portfolio through enhancing our direct channels, using the power of our OMB network to grow deposits and increasing revenue from the SME market through cross selling and enhanced product offerings.
With the Australian public continuing to widely demand a credible, customer-centric alternative to the major banks, our unique OMB channel and the unprecedented strength of our financial position clearly present a major opportunity for us in the immediate future to bridge the void in the banking market following the takeovers of St George and Bank West.
We intend to harness this opportunity so that we can continue to be a rewarding investment for shareholders.
David Liddy
Managing Director and Chief Executive Officer
10
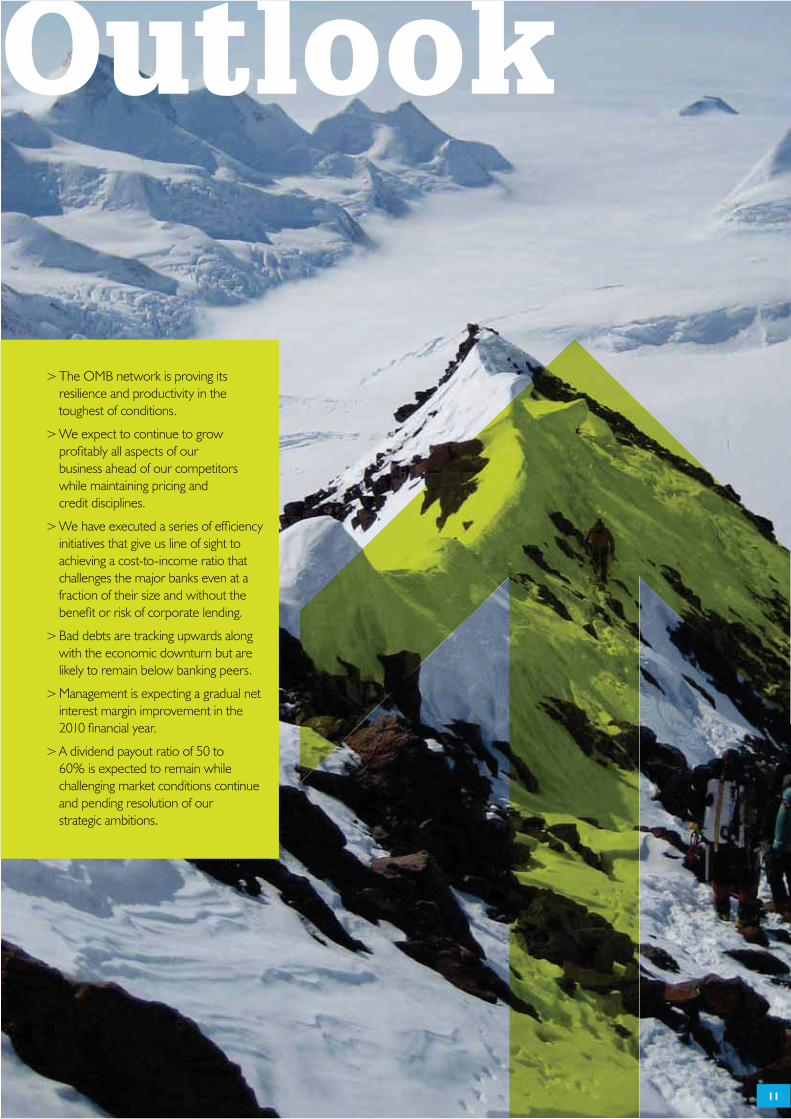
The OMB network is proving its >resilience and productivity in the toughest of conditions.
We expect to continue to grow >profitably all aspects of our business ahead of our competitors while maintaining pricing and credit disciplines.
We have executed a series of efficiency >initiatives that give us line of sight to achieving a cost-to-income ratio that challenges the major banks even at a fraction of their size and without the benefit or risk of corporate lending.
Bad debts are tracking upwards along >with the economic downturn but are likely to remain below banking peers.
Management is expecting a gradual net >interest margin improvement in the 2010 financial year.
A dividend payout ratio of 50 to >60% is expected to remain while challenging market conditions continue and pending resolution of our strategic ambitions.
11

12

Corporate Social Responsibility
Community
The Bank’s annual Banking >on our Kids appeal raised more than $180,000 for Children’s Hospital Foundations Australia (CHFA) to be used to support initiatives leading to breakthrough treatments and cures for sick and injured children.
BOQ donated $100,000 to >the victims of the Victorian bushfires and $50,000 to the Queensland Premier’s Disaster Relief Appeal to help those impacted by floods.
The Bank matched over >$40,000 raised by employees through its Dollar-for-Dollar program.
Shareholders donated over >$30,000 to children’s hospitals around Australia via the Investing in Hope program.
Customers
The Bank has been monitoring >and improving service by conducting regular mystery shopping exercises across our branch network.
We are discussing with >customers what they want and using this information to design a set of service standards to ensure consistent delivery of a quality customer service experience.
Environment
92.4 tonnes of paper and >cardboard were recycled by Bank of Queensland this financial year, saving approximately 1,202 trees.
The Bank more than halved >its carbon footprint originating from travel-related activities estimated to be equal to the annual greenhouse gas emissions from around 16 average Australian households.
The Bank recycles >obsolete mobile phone handsets, Blackberries and computer equipment.
The Bank is using vegetable- >based inks and recycled paper in large printing jobs.
The Bank works with transport >and logistic service providers with a focus on reducing carbon emissions from its fleet operations via hybrid vehicles.
The Bank is partnering with >a plastic card manufacturer with the capability of offering cards made from up to 88% recycled plastic.
Employees
The Bank has revitalised it’s >induction process to ensure employees are properly welcomed and quickly become accustomed to the BOQ culture.
13

David Liddy
Managing Director & Chief Executive Officer
In April 2001, David was appointed as Managing Director & Chief Executive Officer. Since his appointment, the Bank has recorded a succession of record half-year and full-year profits which have occurred through a complete transformation of the Bank, with the opening of new branches, through a unique Owner-Managed Branch Model and a return to more traditional, face-to-face, people-focused business and commercial banking services.
Ram Kangatharan
Group Executive & Chief Financial Officer
Ram Kangatharan was appointed in October 2007. He is responsible for Finance, Treasury and Management Information Systems. He is a senior finance executive with global corporate experience in a range of industries including banking, telecommunications and investments. He was most recently with EDS (Electronic Data Systems) in the USA.
David Marshall
Group Executive Banking
David Marshall was appointed Group Executive Banking in April 2009. He is responsible for the Bank’s franchise banking, corporate branch banking, Private Banking, as well as Business Banking, Equipment Finance, Property Finance, Debtor Finance and Trade Finance. David joined the Bank as Group Executive Business Financial Services in September 2007. He has had 23 years’ banking experience including senior national roles in business and retail banking and risk management with CBA and Westpac.
14

Bruce Auty
Group Executive Group Risk
Bruce Auty joined Bank of Queensland in 2004 and was appointed Group Executive Group Risk in September 2007. His responsibilities include Credit Risk Assessment, Credit Risk Review, Credit Policy, Portfolio Performance, Internal Audit, Operational Risk, Compliance and Fraud. Bruce has 40 years’ experience in corporate, investment, commercial and retail banking in the USA, Australia and New Zealand.
Daniel Musson
Group Executive People & Corporate Services
Daniel Musson was appointed in October 2007 to oversee the Bank’s Brand Management, Product Management, Human Resources, Customer Relations, Investor Relations and Corporate Affairs functions. He has broad experience in senior marketing, brand, product and customer management roles across the banking, insurance and retail sectors. He was most recently Head of Product and Underwriting Personal Insurance with the Insurance Australia Group (IAG).
Jim Stabback
Group Executive IT & Operations
Jim Stabback joined Bank of Queensland in September 2008 as Group Executive, IT & Operations. In this role, he oversees the strategic focus of the Bank’s IT platform and its service delivery, along with the Bank’s important outsourcing relationships with EDS and Fiserv. Jim has over 20 years’ experience managing large scale operations, technology and service delivery management in the financial services and telecommunications industries.
15

Neil Summerson
B Com, FCA, FAICD, FAIM
Chairman, Non-Executive Independent Director – Age: 61
Neil Summerson is a Chartered Accountant with 39 years’ experience and is a past Chairman of the Queensland branch of the Institute of Chartered Accountants. He was formerly the Queensland Managing Partner at Ernst & Young. He is a Director of AmerAlia Inc, Australian Made Campaign Limited, Australian Property Growth Limited and Moore Stephens (Queensland) Limited. He is a former Chairman of the Brisbane Water Board and is currently Chairman of Motorama Holdings Pty Ltd, IDEC Pty Ltd and Australian Property Growth Fund. Mr Summerson has been a Director of the Bank since December 1996 and was appointed Chairman on 20 August 2008. Mr Summerson is Chair of the Bank’s Remuneration and Nomination Committee and a member of the Audit Committee.
Anthony Howarth, AO
FAICD, SF Fin
Deputy Chairman, Non-Executive Independent Director – Age: 57
Tony Howarth was Chairman of Home Building Society Ltd which merged with the Bank in December 2007. He has worked in the banking and finance industry for over 31 years. His work has involved a number of overseas appointments. He has been the Managing Director of Challenge Bank Limited and the CEO of Hartleys Limited. He was a former Chairman of Alinta Limited (retired 24 July 2006) and is currently Chairman of Mermaid Marine Australia Limited and Non-Executive Director of AWB Limited and Wesfarmers Limited. He is also involved with a number of business and community organisations being Chairman of St John of God Health Care Group, President of the Australian Chamber of Commerce and Industry and Chair of the Committee for Perth. In addition, he is a member of the Rio-Tinto WA Future Fund, and is on the University of Western Australia’s Senate. Tony was appointed Deputy Chair of the Bank in August 2008 and is a member of the Remuneration and Nomination Committee, Risk Committee and Corporate Governance Committee.
David Liddy
MBA, FAICD, SF Fin
Managing Director & Chief Executive Officer, Executive Non-Independent Director – Age: 59
David Liddy has over 40 years’ experience in banking, including international postings in London and Hong Kong. He was appointed Managing Director of the Bank in April 2001. He has a Masters in Business Administration. He is Deputy Chairman of the Australian Bankers’ Association Council, Chairman of the Queensland Museum Foundation and a Board member of the Brisbane Lions Australian Football Club. He is also a member of the Federal Treasurer’s Financial Sector Advisory Council and the Queensland Government’s Smart State Council. Mr Liddy is a Senior Fellow of the Financial Services Institute of Australasia and a Fellow of the Australian Institute of Company Directors.
16

Steve Crane
B Com, SF Fin, MAICD, FAIM
Non-Executive Independent Director – Age: 57
Steve Crane was appointed a Director of the Bank at the Annual General Meeting on 11 December 2008. He has almost 40 years’ experience in financial markets in Australia, including experience at both AMP and BZW Australia, where he was promoted to Managing Director – Financial Markets in 1995 and became Chief Executive in 1996. In 1998, when RBS Group (Australia) Pty Limited (formerly ABN AMRO Australia Pty Limited) acquired BZW Australia and New Zealand, Steve became Chief Executive and remained in this role until his retirement in June 2003. Steve is now a member of RBS Group’s (Australia) Advisory Council and a Director of Transfield Services, APA Ethane Limited, The Sunnyfield Association, Taronga Conservation Society Australia, Australian Reward Investment Alliance, and Chairman of Global Valve Technology Limited. Mr Crane is a member of the Bank’s Corporate Governance Committee and the Chair of the Budget Committee.
Roger Davis
B.Econ (Hons), Masters Philosophy
Non-Executive Independent Director – Age: 57
Roger Davis was appointed a Director of the Bank on 20 August 2008. He has almost 31 years’ experience in banking and investment banking in Australia, the US and Japan. He is currently a consulting Director at Rothschild Australia Limited. He was previously a Managing Director at Citigroup where he worked for over 20 years and more recently was a Group Managing Director at ANZ Bank. He is a Director of Macquarie Office Management Ltd, Ardent Leisure Management Ltd and Ardent Leisure Ltd, Aristocrat Leisure Ltd, Territory Insurance Office and Trust Ltd. He was formerly Chair of Pengana Hedgefunds Ltd and Esanda, and a Director of ANZ (New Zealand) Limited, CitiTrust in Japan and Citicorp Securities Inc. in the USA. He has a Bachelor of Economics (Hons) degree from the University of Sydney, a Master of Philosophy degree from Oxford and is a Rhodes Scholar. Mr Davis is a member of the Risk Committee.
Peter Fox
B Bus (Hons)
Non-Executive Non-Independent Director – Age: 48
Peter Fox has been with the Linfox Group for over 22 years. After a diverse career within the organisation, he was appointed, in chronological order, National Fleet Manager, Executive Officer, and Director of Linfox Pty Ltd, culminating in his appointment as Executive Chairman of Fox Group Holdings in 1994. Mr Fox was appointed a Director of the Bank in May 2001. He is also a Director of the Alfred Foundation and a member of the Australian Graduate School of Management Advisory Council (UNSW). He is a member of the Bank’s Budget Committee.
David Graham
B Com, B.Econ (Hons), MBA, FCPA
Non-Executive Non-Independent Director – Age: 67
David Graham has had extensive experience in the financial sector specialising in capital markets transactions. He was appointed as a non-executive Director of the Bank in October 2006. He has been a non-executive Director of a number of ASX listed companies and he is currently a non-executive Director of Bandanna Energy Limited. He is Chairman of DDH Graham Limited, an advisory and funds management company he founded in 1981. He is a member of the Audit and Budget Committees.
17

Carmel Gray
B Bus
Non-Executive Independent Director – Age: 60
Carmel Gray was appointed a Director of the Bank on 6 April 2006. Ms Gray has had an extensive career in IT and Banking. Ms Gray was Group Executive Information Technology at Suncorp from 1999 to 2004. Prior to her Suncorp appointment she was General Manager of Energy Information Solutions Pty Ltd and Managing Director of Logica Pty Ltd. Ms Gray is Chair of Information Technologies Australia Pty Ltd. Ms Gray is a member of the Bank’s Risk Committee and the Chair of the Audit Committee.
Bill Kelty, AC
B Econ
Non-Executive Non-Independent Director – Age: 61
Bill Kelty has over 32 years’ experience in industrial relations. He was appointed a Director of the Bank in August 2001 and is currently a Director of the Linfox Group and a Commissioner of the Australian Football League. He is also involved in the Foundation for Rural and Regional Taskforce and was previously Chairman of the Federal Government’s Regional Development Taskforce. Mr Kelty was Secretary of the Australian Council of Trade Unions from 1983-2000 and a member of the Reserve Bank Board from 1988-1996. He is Chair of the Bank’s Corporate Governance Committee.
John Reynolds
B Sc (Hons), Dip Ed, FAICD, FAIM
Non-Executive Independent Director – Age: 66
John Reynolds was appointed a Director of the Bank in April 2003. He has had extensive CEO-level experience at Top 100 media and resource companies in Australian and overseas. He is Chairman of Arrow Energy Limited. He is a Director of Mater Health Services Brisbane Limited and an advisor to various private companies and professional organisations. Mr Reynolds is Chairman of the Bank’s Risk Committee, a member of the Audit Committee and a member of the Bank’s Remuneration and Nomination Committee.
18

Overview
Directors and Management of the Bank are committed to excellence in corporate governance.
In striving to achieve its objectives, the Bank endeavours to be a bank that looks after its staff, values and services customers, rewards its shareholders and partners with the community.
Corporate governance is not just about compliance, but about our values and our behaviour. We believe in excellence in corporate governance because it is in the best interests of the Bank and all of its stakeholders.
The Board has over many years developed and implemented policies and practices which at the timing of publishing this statement are consistent with the ASX Corporate Governance Principles and Recommendations, Second Edition (‘Principles’) developed by the ASX Corporate Governance Council in 2007, and the corporate governance standards set out in Australian Prudential Standard (APS) 510 “Corporate Governance”. In addition, the Board has adopted a fit and proper policy as required by APS 520 “Fit and Proper”, which sets out the requirements for regulated authorised deposit-taking institutions to assess the competencies and fitness for office of persons appointed as directors, senior managers and auditors.
You can read all of the Bank’s corporate governance polices in full on its website (www.boq.com.au). These policies are reviewed annually and their maintenance is overseen by the Board’s Corporate Governance Committee under its Charter.
The Bank is required to disclose in this report the extent to which it has followed the best practice recommendations in the Principles throughout the 2009 financial year. The Bank has followed those recommendations
throughout the year. A summary of the Bank’s corporate governance policies and practices, organised in order of the Principles, is set out below.
Principle 1: Board and Management
The Board Charter sets out the key governance principles adopted by the Board in governing the Bank. There is a functional difference between the Board’s role and responsibilities and that of management which is recognised in the Board Charter.
The responsibilities of the Board include:
the overall corporate governance of the >Bank including:
overseeing regulatory compliance; -
ensuring the Bank observes appropriate -ethical standards; and
achievement of the Bank’s values. -
the overall strategy and direction of the >Bank, including approving, monitoring and reviewing strategic, financial and operational plans;
the appointment of the Managing Director, >including the delegation of powers to the Managing Director within authorised discretionary levels; and
succession planning, including Board and >Committee composition.
In order to fulfil these responsibilities, the Board reserves to itself certain powers including:
reviewing the Bank’s strategic plan at least >annually, approving budgets and reviewing financial results;
dealing with matters outside discretions >conferred on the Managing Director;
ensuring that areas of significant business risk >are identified and effectively managed;
setting targets for and assessing the >performance of the Managing Director; and
establishing Board committees. >
Certain powers are delegated to management including:
responsibility for day to day management >of the Bank within the overall strategies and frameworks approved by the Board including the following:
developing strategy for approval by -the Board;
financial and capital management -and reporting;
operations; -
information technology; -
marketing the current business of the -Bank and acquiring new business;
customer relationship service; -
developing and maintaining key external -relationships, including with investors, media, analysts and industry participants;
human resources, people development, -performance and the creation of a safe and enjoyable workplace; and
credit. -
reporting to the Board on the performance >of the Bank and its management; and
performing duties that are delegated by >the Board.
The Chairman is available to the Board and to senior executives at any time to discuss Board performance and the Deputy Chairman is likewise available in respect of the Chairman’s performance. A performance evaluation for the Board, its committees and directors took place in the reporting period in accordance with the process contained in the Board Performance Review Policy.
Corporate governance
19

The Board undertakes an annual performance review of the Managing Director. Management has a program for annual performance reviews for all levels of management.
The Bank provides an induction program for new Board members.
Principle 2: Board Structure
The Board has ten Directors (including the Chairman) of whom nine are non-executive Directors and one executive Director (the Managing Director). The skills and experience of the Directors and their length of service, membership of Board committees and record of attendance at meetings, are set out in the Directors’ Report.
The Remuneration and Nomination Committee monitors the skills and experience of existing Directors and the balance between experience and new skills, which may lead to consideration of appointments of new Directors. The names and qualifications of those appointed to the Remuneration and Nomination Committee, and number of meetings of the Remuneration and Nomination Committee, during the financial year are set out in the Directors’ Report.
All new and existing Directors are subject to assessment of their fitness and propriety to hold that office under the Bank’s fit and proper policy established under APS 520. This involves an assessment of the Director’s qualifications and experience against documented criteria for the competencies required for the office. The assessment includes checks on the Director’s propriety such as police checks and insolvency checks.
Every Director and Committee of the Board has the right to seek independent professional advice in connection with carrying out their duties at the expense of the Bank. Prior written approval of the Chairman is required.
The Board has assessed that a majority of the non-executive Directors are “independent”. The non-executive Directors who had been assessed not to be independent are Mr Peter Fox and Mr Bill Kelty who during the financial year were associated with substantial shareholder, the Linfox Group, and Mr David Graham who is Executive Chairman of DDH Graham Limited which has a commercial relationship with the Bank. In August 2009, the Linfox Group ceased to be a substantial shareholder so the assessment of Mr Fox and Mr Kelty may change in the 2010 financial year.
The Board Charter requires that all Directors bring an independent mind to bear on all matters coming before the Board for consideration.
The basis of the Board’s assessment is its independence policy which takes into account whether Directors have relationships with the Bank, its shareholders or advisers which are likely to materially interfere with the exercise of the Director’s unfettered and independent judgment, having regard to all the circumstances.
The Bank does not consider that the length of service on the Board of any of the independent Directors is currently a factor affecting the Director’s ability to act independently and in the best interests of the Bank. The Board generally judges independence against the ability, integrity and willingness of the Director to act, and places less emphasis on length of service as a matter which impairs independence.
Principle 3: Ethical and Responsible Decision-Making
The Bank’s Code of Conduct sets out the principles which all Directors, employees, owner-managers and contractors are expected to uphold in order to promote the interests of the Bank and its shareholders and drive its relationships with employees,
customers and the community. Through training and enforcement of the Code, the Bank actively promotes ethical and responsible decision-making within the Bank.
The Bank’s Insider Trading Policy provides a framework to assist Directors, employees, owner-managers, agents and contractors of the Bank to understand their legal obligations with respect to insider trading.
Principle 4: Financial Reporting
The Managing Director and Chief Financial Officer state in writing to the Board that the Bank’s financial reports present a true and fair view, in all material respects, of the Bank’s financial condition and operational results in accordance with the relevant accounting standards.
The Audit Committee is comprised in accordance with the recommendations in the Principles and the requirements of APS 510. The Committee operates under the Audit Committee Charter approved by the Board. The Committee is charged with making recommendations to the Board on the adequacy of external audit and the independence of the external auditor, and internal audit procedures.
The Audit Committee comprises non-executive members of the Board with the majority of members being independent directors. The Audit Committee is chaired by an independent director, who is not the Chairman of the Board. The names and qualifications of those appointed to the Audit Committee, and number of meetings of the Audit Committee during the financial year are set out in the Directors’ Report.
Corporate governance
20

Principle 5: Timely and Balanced Disclosure
The Continuous Disclosure Policy provides a framework to assist the Bank in achieving its aims of keeping the market informed of material information and enhancing its communication with the market, thereby ensuring its compliance with legal requirements.
The Bank is committed to creating and maintaining an informed market in its securities and enhancing corporate governance by encouraging a culture of transparency in relation to its corporate activities. The Bank will also provide relevant information to media organisations, to ensure the broadest possible communication with investors and the general market.
The Managing Director and the Company Secretary are responsible for communications with the ASX. Continuous disclosure is a permanent item on the agenda for Board meetings. All announcements made by the Bank to the ASX are accessible via the Bank’s website.
Principle 6: Respect Rights of Shareholders
The Bank’s Investor Relations Policy is designed to promote effective communication with shareholders, provide them with ready access to balanced, understandable information about the Bank and simplify their participation at general meetings. This policy is in addition to and designed to enhance the Bank’s Continuous Disclosure Policy.
All information released to the market and the media is available via the Bank’s website. Feedback from shareholders is also welcomed through the Bank’s branch network or through the ‘contact us’ page on the Bank’s website.
Principle 7: Recognise and Manage Risk
The Board believes that risk management is a critical part of the Bank’s operations and a comprehensive risk management program has been developed. Management of risk is a key function of the Risk Committee under its Charter.
The Risk Committee is a sub-committee of the Board of Directors and assists the Board to discharge its responsibilities to oversee the risk profile and recommend the risk management framework of the Bank to the Board. The Risk Committee is responsible for performing its duties in accordance with its Charter and making recommendations to the Board on the effective discharge of its responsibilities for the key risk areas below and for the management of the Bank’s compliance obligations.
The Bank has separate risk management functions in Market Risk, Liquidity Risk, Balance Sheet Risk, Credit Risk, Operational Risk, and Compliance Risk which are reported to the Risk Committee through the Managing Director and Group Executive Group Risk. Employees are trained on important risk management techniques.
The names and qualifications of those appointed to the Risk Committee, and number of meetings of the Risk Committee during the financial year are set out in the Directors’ Report.
The Board has received a report from management as to the effectiveness of the Bank’s management of its material business risks, and the declaration provided in accordance with section 295A of the Corporations Act is founded on a sound system of risk management and internal control, and that the system is operating effectively in all material respects in relation to financial reporting risks.
Principle 8: Remuneration
The Remuneration and Nomination Committee is charged with assisting the Board to discharge its responsibilities regarding the public reporting of remuneration information, appropriate Board composition and other matters. The names and qualifications of those appointed to the Remuneration and Nomination Committee, and number of meetings of the Remuneration and Nomination Committee during the financial year are set out in the Directors’ Report.
The Board has approved a remuneration policy (see the Directors’ Report). The remuneration of the Board, the Managing Director and senior management is overseen by the Remuneration and Nomination Committee. Non-executive Directors remuneration is distinguished from the remuneration of the Managing Director and senior managers.
Directors’ retirement benefits were frozen in 2003 and the practice discontinued. Directors are entitled on retirement to their accrued benefit as at 31 August 2003 (increased annually in line with CPI increases).
21

New share registry
On Monday, 29 June 2009 Bank of Queensland changed share registries to:
Link Market Services Limited
Level 19, 324 Queen Street Brisbane QLD 4000
Australia: 1800 779 639 International: +61 2 8280 7626 Facsimile: +61 2 9287 0303
Email: [email protected]
Website: www.linkmarketservices.com.au
Australian Business and Company Numbers
ABN 32 009 656 740 ACN 009 656 740
Registered office
Bank of Queensland Limited Level 17, BOQ Centre 259 Queen Street Brisbane Qld 4000
Telephone: (07) 3212 3333 Facsimile: (07) 3212 3399
Website: www.boq.com.au
Investor Relations: (07) 3212 3463
Customer Service: 1300 55 72 72
E-communications
Register now to receive Annual Reports, dividend advices and other company information from Bank of Queensland by email. By registering for this free service, you can receive significant company announcements as they happen. Furthermore, by reducing printing, there are significant cost savings for the Bank and you are helping to save the Australian environment.
To register please call the share registry on 1800 779 639.
Annual General Meeting
The 2009 Annual General Meeting will be held at the Sofitel Hotel, 249 Turbot Street, Brisbane on Thursday, 10 December 2009 (registration commences at 9.15am).
Financial calendar
2009
Ordinary shares (BOQ)*
Ex-dividend date 13 November 2009
Record date 19 November 2009
Final dividend payment date 1 December 2009
Annual General Meeting 10 December 2009
2010
Ordinary shares (BOQ)*
Interim results and interim dividend announcement 15 April 2010
Ex-dividend date 28 April 2010
Record date 4 May 2010
Interim dividend payment date 18 May 2010
Final results and final dividend announcement 14 October 2010
Ex-dividend date 12 November 2010
Record date 18 November 2010
Final dividend payment date 2 December 2010
Annual General Meeting 9 December 2010
RePS (BOQPA)*
Announcement date 17 March 2010
Ex-dividend date 22 March 2010
Record date 26 March 2010
Payment date 15 April 2010
Announcement date 20 September 2010
Ex-dividend date 23 September 2010
Record date 29 September 2010
Payment date/Dividend reset date 15 October 2010
PEPS (BOQPC)*
Announcement date 17 March 2010
Ex-dividend date 22 March 2010
Record date 26 March 2010
Payment date 15 April 2010
Announcement date 20 September 2010
Ex-dividend date 23 September 2010
Record date 29 September 2010
Payment date 15 October 2010
* Dates are subject to change
Shareholder Information
22

Contents Directors’ report 24
Lead auditor’s independence declaration 47
Income statements 48
Statements of recognised income and expense 49
Balance sheets 50
Statements of cash flows 51
Notes to the financial statements 52
Directors’ declaration 114
Independent audit report 115
Shareholding details 117
Financial report
23

Directors’ ReportYear ended 31 August 2009
The directors present their report together with the financial report of Bank of Queensland Limited (“the Bank”) and of the Consolidated Entity, being the Bank and its controlled entities for the year ended 31 August 2009 and the auditor’s report thereon.
Directors
The directors of the Bank at any time during or since the end of the financial year are:
Name, qualifications and independence status Age Experience, special responsibilities and other directorships
Neil SummersonB Com, FCA, FAICD, FAIMChairmanNon-Executive Independent Director
61 Neil Summerson is a Chartered Accountant with 39 years experience and is a past Chairman of the Queensland branch of the Institute of Chartered Accountants. He was formerly the Queensland Managing Partner at Ernst & Young. He is a Director of AmerAlia Inc, Australian Made Campaign Limited, Australian Property Growth Limited and Moore Stephens (Queensland) Limited. He is a former Chairman of the Brisbane Water Board and is currently Chairman of Motorama Holdings Pty Ltd, IDEC Pty Ltd and Australian Property Growth Fund. Mr Summerson has been a Director of the Bank since December 1996 and was appointed Chairman on 20 August 2008. Mr Summerson is Chair of the Bank’s Remuneration and Nomination Committee and a member of the Audit Committee.
Anthony Howarth, AOFAICD, SF FinDeputy Chairman Non-Executive Independent Director
57 Tony Howarth was Chairman of Home Building Society Ltd which merged with the Bank in December 2007. He has worked in the banking and finance industry for over 31 years. His work has involved a number of overseas appointments. He has been the Managing Director of Challenge Bank Limited and the CEO of Hartleys Limited. He was a former Chairman of Alinta Limited (retired 24 July 2006) and is currently Chairman of Mermaid Marine Australia Limited and Non-Executive Director of AWB Limited and Wesfarmers Limited. He is also involved with a number of business and community organisations being Chairman of St John of God Health Care Group, President of the Australian Chamber of Commerce and Industry and Chair of the Committee for Perth. In addition, he is a member of the Rio-Tinto WA Future Fund, and is on the University of Western Australia’s Senate. Tony was appointed Deputy Chair of the Bank in August 2008 and is a member of the Remuneration and Nomination Committee, Risk Committee and Corporate Governance Committee.
David Liddy MBA, FAICD, SF Fin Managing Director & Chief Executive OfficerExecutive Non-Independent Director
59 David Liddy has over 40 years experience in banking, including international postings in London and Hong Kong. He was appointed Managing Director of the Bank in April 2001. He has a Masters in Business Administration. He is Deputy Chairman of the Australian Bankers’ Association Council, Chairman of the Queensland Museum Foundation and a Board member of the Brisbane Lions Australian Football Club. He is also a member of the Federal Treasurer’s Financial Sector Advisory Council. Mr Liddy is a Senior Fellow of the Financial Services Institute of Australasia and a Fellow of the Australian Institute of Company Directors.
Steve CraneB Com, SF Fin, MAICD, FAIMNon-Executive Independent Director
57 Steve Crane was appointed Director of the Bank at the Annual General Meeting on 11 December 2008. He has almost 40 years’ experience in financial markets in Australia, including experience at both AMP and BZW Australia, where he was promoted to Managing Director – Financial Markets in 1995 and became Chief Executive in 1996. In 1998, when RBS Group (Australia) Pty Limited (formerly ABN AMRO Australia Pty Limited) acquired BZW Australia and New Zealand, Steve became Chief Executive and remained in this role until his retirement in June 2003. Steve is now a member of RBS Group’s (Australia) Advisory Council and a Director of Transfield Services, APA Ethane Limited, The Sunnyfield Association, Taronga Conservation Society Australia, Australian Reward Investment Alliance, and Chairman of Global Valve Technology Limited. Mr Crane is a member of the Bank’s Corporate Governance Committee and the Chair of the Budget Committee.
Roger DavisB.Econ (Hons), Masters Philosophy Non-Executive Independent Director
57 Roger Davis was appointed a Director of the Bank on 20 August 2008. He has almost 31 years’ experience in banking and investment banking in Australia, the US and Japan. He is currently a consulting Director at Rothschild Australia Limited. He was previously a Managing Director at Citigroup where he worked for over 20 years and more recently was a Group Managing Director at ANZ Bank. He is a Director of Macquarie Office Management Ltd, Ardent Leisure Management Ltd and Ardent Leisure Ltd, Aristocrat Leisure Ltd, Territory Insurance Office and Trust Ltd. He was formerly Chair of Pengana Hedgefunds Ltd and Esanda and a Director of ANZ (New Zealand) Limited, CitiTrust in Japan and Citicorp Securities Inc. in the USA. He has a Bachelor of Economics (Hons) degree from the University of Sydney, a Master of Philosophy degree from Oxford and is a Rhodes Scholar. Mr Davis is a member of the Risk Committee.
Peter Fox B Bus (Hons) Non-Executive Non-Independent Director
48 Peter Fox has been with the Linfox Group for over 22 years. After a diverse career within the organisation, he was appointed, in chronological order, National Fleet Manager, Executive Officer, and Director of Linfox Pty Ltd, culminating in his appointment as Executive Chairman of Fox Group Holdings in 1994. Mr Fox was appointed a Director of the Bank in May 2001. He is also a Director of the Alfred Foundation and a member of the Australian Graduate School of Management Advisory Council (UNSW). He is a member of the Bank’s Budget Committee.
David GrahamB Com, B.Econ(Hons), MBA, FCPANon-Executive Non-Independent Director
67 David Graham has had extensive experience in the financial sector specialising in capital markets transactions. He was appointed as a non-executive Director of the Bank in October 2006. He has been a non-executive Director of a number of ASX listed companies and he is currently a non-executive Director of Bandanna Energy Limited. He is Chairman of DDH Graham Limited, an advisory and funds management company he founded in 1981. He is a member of the Audit and Budget Committee.
Bank of Queensland Annual Report 200924

Directors’ ReportYear ended 31 August 2009
Name, qualifications and independence status Age Experience, special responsibilities and other directorships
Carmel GrayB BusNon-Executive Independent Director
60 Carmel Gray was appointed a Director of the Bank on 6 April 2006. Ms Gray has had an extensive career in IT and Banking. Ms Gray was Group Executive Information Technology at Suncorp from 1999 to 2004. Prior to her Suncorp appointment she was General Manager of Energy Information Solutions Pty Ltd and Managing Director of Logica Pty Ltd. Ms Gray is Chair of Information Technologies Australia Pty Ltd. Ms Gray is a member of the Bank’s Risk Committee and the Chair of the Audit Committee.
Bill Kelty, AC B Econ Non-Executive Non-Independent Director
61 Bill Kelty has over 32 years’ experience in industrial relations. He was appointed a Director of the Bank in August 2001 and is currently a Director of the Linfox Group and a Commissioner of the Australian Football League. He is also involved in the Foundation for Rural and Regional Taskforce and was previously Chairman of the Federal Government’s Regional Development Taskforce. Mr Kelty was Secretary of the Australian Council of Trade Unions from 1983-2000 and a member of the Reserve Bank Board from 1988-1996. He is the chair of the Bank’s Corporate Governance Committee.
John Reynolds B Sc (Hons), Dip Ed, FAICD, FAIMNon-Executive Independent Director
66 John Reynolds was appointed a Director of the Bank in April 2003. He has extensive CEO-level experience at Top 100 media and resource companies in Australian and overseas. He is Chairman of Arrow Energy Limited. He is a Director of Mater Health Services Brisbane Limited and an advisor to various private companies and professional organisations. Mr Reynolds is Chairman of the Bank’s Risk Committee, a member of the Audit Committee and a member of the Bank’s Remuneration and Nomination Committee.
Antony Love retired as a director on 11 December 2008.
Company Secretary
Mr Brad Edwards LLB was appointed to the position of company secretary and general counsel in May 2000. He is a director of the Prince Charles Hospital Foundation. Prior to his appointment as company secretary and general counsel, Mr Edwards worked as a solicitor and partner in several legal firms in private practice.
Ms Stacey Hester LLB (Hons), LLM, was jointly appointed to the position of Company Secretary on 26 August 2009. Prior to her appointment as company secretary, Ms Hester held various roles within the Bank, including Assistant Company Secretary, Head of Legal and Corporate Solicitor.
Directors’ Meetings
The number of meetings of the Bank’s directors (including meetings of Committees of directors) and the number of meetings attended by each director during the financial year were:
Board of Directors
Risk Committee(1)
Audit Committee(1)
Corporate Governance Committee
Remuneration & Nomination
CommitteeBudget
CommitteeInvestment
Committee(2)
A B A B A B A B A B A B A B
Neil Summerson 14 14 - - 7 9 1 1 3 3 - - 4 4
Anthony Howarth 13 14 5 5 - - - - 3 3 - - 1 1
David Liddy (3) 14 14 2 5 4 9 - - 3 3 1 1 4 4
Steve Crane 9 10 - - - - - - - - 1 1 2 2
Roger Davis 11 14 5 5 - - - - - - - - 3 3
Peter Fox 10 14 - - - - - - - - 1 1 - -
David Graham 14 14 - - 9 9 - - - - 1 1 2 2
Carmel Gray 14 14 5 5 8 8 - - - - - - 1 1
Bill Kelty 11 14 - - - - 1 1 - - - - 2 2
Antony Love (4) 4 4 - - - - - - - - - - - -
John Reynolds 14 14 5 5 9 9 1 1 3 3 - - 2 2
Total number of meetings held
14 5 9 1 3 1 4
A - Number of meetings attended
B - Number of meetings held during the time the director was a member of the Board / Committee during the year
(1) The Bank’s Audit & Risk Committee was split into two separate committees, the Audit Committee and the Risk Committee, on 8 October 2008. The meeting of the Audit & Risk Committee of 26 October 2008 has been included under Audit Committee in the above table.
(2) The composition of the Investment Committee is not fixed. Composition and meetings held are set by the Board on an as required basis.
(3) David Liddy attends Committee meetings but is not a formal Committee member.
(4) Antony Love retired on 11 December 2008.
25

Directors’ ReportYear ended 31 August 2009
Principal activities
The principal activity of the Consolidated Entity is the provision of financial services to the community. The Bank has an authority to carry on banking business under the Banking Act 1959 (Commonwealth) (as amended). There were no significant changes during the year in the nature of the activities of the Consolidated Entity.
Operating and finance review
Profitability
Profit after tax for the year ended 31 August 2009 increased by 2% to $141.1 million compared with the 2008 result of $138.7 million. Profit after tax in the current year was impacted by the one off costs recognised in the interim result primarily relating to the restructure of NSW distribution and head office under Project Pathways and property related impairment charges.
Cash profit, profit after tax excluding non recurring and non cash items, increased by 21% from $155.4m to $187.4m. This result is largely due to the cost cutting measures undertaken as part of Project Pathways and increased net interest income. The result was achieved in difficult conditions with margins under pressure and increased bad debt charges.
Income
Total income increased by 10% during the current year to $629.0 million.
Net interest income for the year ended 31 August 2009 increased by 14% to $481.1 million from the prior period result of $421.1 million. This was a strong result given margin pressures and is a result of the Bank’s ability to deliver strong asset growth and the benefit of the Home Building Society Ltd (“Home”) acquisition which contributed to the increase in net interest income.
Other operating income decreased by 1% to $147.9 million for the 2009 year from $149.5 million in the prior year. Other income was impacted adversely by the ATM Direct Charge system introduced in March 2009.
Expenses
The Bank’s costs increased by 8% to $369.8 million in the current financial year from the previous year’s expenses of $341.7 million. However, non-operational expenses such as non-recurring Home integration costs and other due diligence costs amounting to $13.0m, impairment on primarily property related equity investments of $13.2m, restructuring costs for NSW distribution and head office of $18.7m, and amortisation of customer contracts amounting to $10.9m are included in the years expenses. In the prior year, non-operational expenses such as non-recurring Home integration costs and other due diligence costs amounting to $14.0m, and amortisation of customer contracts amounting to $7.7m are included in the expenses.
If these amounts were excluded, the Bank’s expenses would be $314.0m, a decrease of 2% on the prior year of $320.0m. This decrease in costs is largely due to the Bank’s restructure at February 2009 and continued focus on cost control.
Efficiency
The Bank’s cash cost to income ratio has decreased from the 2008 result of 58.3% to 57.1% in the current year.
Adjusting for aforementioned non recurring items, the Bank cash cost to income ratio has decreased from 56.1% in the 2008 year to 49.9% in the current year.
Asset quality and provisioning
Impairment on loans and advances
Expenses relating to impairment on loans and advances were $66.0 million for the year ended 31 August 2009. This expense consisted of $60.0 million of specific provision impairment expense and $6.0 million of expense relating to the collective provision.
The impairment expense of $60.0 million for the 2009 financial year has increased by $35.7 million or 147% on the prior period expense of $24.3 million.
Impaired assets
Impaired assets increased in gross terms to $117.4 million at 31 August 2009 from $31.6 million for the prior year. Impaired assets as a percentage of non- securitised loans have increased to 0.56% from 0.17% in the prior year. Specific provisions have been raised for $29.4m (25%) of impaired assets.
Lending approvals and asset growth
Lending approvals for the year were $13.6 billion, a decrease of $0.3 billion over the comparative 2008 approval result of $13.9 billion. This decrease of 2% is due to lower system growth as the Australian economy slows. The Bank has however continued to outperform system growth.
The lending approval growth translated into loans under management balance of $28.9 billion, an increase of $2.6 billion from 31 August 2008 which represents growth of 10%.
Of the loans under management balance of $28.9 billion, $28.4 billion is on balance sheet and $0.5 billion off balance sheet. The off balance sheet lending relates to certain REDS EHP leasing trusts which are not consolidated for accounting purposes as the residual risk has been sold by the Bank.
Bank of Queensland Annual Report 200926

Directors’ ReportYear ended 31 August 2009
Operating and finance review (continued)
Retail deposit growth
Retail deposits have grown strongly during the 2009 financial year and have reached $16.2 billion, an increase of $2.2 billion or 16% from $14.0 billion as at 31 August 2008.
The Bank has focused on retail deposit growth in response to the dislocation of wholesale funding markets though it should be noted that competition for retail funding has increased its relative cost, negatively impacting net interest margin.
Capital management
The Board has set capital targets at 8.0% of risk weighted assets as Tier 1 capital with a minimum of 7.0% provided that total capital does not fall below 10.0%. The total capital adequacy ratio at 31 August 2009 was 11.5% and Tier 1 capital was 8.9%. Reset Preference Shares (“RePS”) and Perpetual Equity Preference Shares (“PEPS”), issued as hybrid capital instruments, comprise 17% of total Tier 1 capital.
Total Tier 1 capital of 8.9% is represented by 7.4% of Core Tier 1 capital and 1.5% of hybrid capital instruments, including preference shares.
Subsequent to balance date the retail component of the non renounceable entitlements issue settled. This raised approximately $110m in capital lifting both Tier 1 capital and total capital by approximately 70 basis points.
The Bank continued with an active capital management program, including dividend reinvestment program, a share purchase plan, institutional placements and a non renounceable entitlements offer. Securitisation markets continue to provide limited opportunities for capital efficient issues.
Branch network expansion
The Bank opened 4 branches and closed 16 branches during the financial year to bring total branches to 256 as at 31 August 2009.
Of these 256 branches, 104 are located outside Queensland. The Bank has converted 15 corporate branches to owner managed branches during the financial year.
Shareholder returns
Diluted earnings per share decreased 17% from 89.6c in the 2008 year to 74.4c in the current year.
Excluding the impact of non-cash and non-recurring items the Bank’s diluted earnings per share would be 98.4c. The 2008 result also adjusted for non-cash and non-recurring items was 99.9c.
On this basis, the current year’s diluted earnings per share decreased by 2%.
The Bank has declared a final dividend of 26 cents per share fully franked. This is a decrease of 12 cents (32%) from the 2008 dividend of 38 cents.
Dividends
Dividends paid or declared by the Bank to members since the end of the previous financial year were:
TypeCents
per shareTotal Amount
$m%
frankedDate of
Payment
Final 2008 Declared after the end of the year
- Final – preference shares (RePS) 257 1.2 100% 15/10/2008
- Final – preference shares (S1RPS) 261 1.7 100% 20/10/2008
- Final – preference shares (PEPS) 353 7.1 100% 15/10/2008
- Final – ordinary 38 58.9 100% 24/11/2008
Interim 2009 Declared and paid during the year
- Interim – preference shares (RePS) 255 1.2 100% 15/04/2009
- Interim – preference shares (PEPS) 265 5.3 100% 15/04/2009
- Interim – ordinary 26 44.8 100% 19/05/2009
Final 2009 Declared after the end of the year
- Final – preference shares (RePS) 257 1.2 100% 15/10/2009
- Final – preference shares (PEPS) 180 3.6 100% 15/10/2009
- Final – ordinary 26 54.8 100% 01/12/2009
All the franked dividends paid or declared by the Bank since the end of the previous financial year were franked at the tax rate of 30%.
The balance of the Bank of Queensland Limited dividend franking account at the date of this report, after adjusting for franking credits and debits that will arise on payment of income tax and dividends relating to the year ended 31 August 2009, is $31.1 million credit calculated at the 30% tax rate (2008: $25.1 million credit).
It is anticipated, based on these franking account balances that the Bank will continue to pay fully franked dividends in the foreseeable future.
27

Directors’ ReportYear ended 31 August 2009
Operating and finance review (continued)
Environmental regulation
The Consolidated Entity’s operations are not subject to any significant environmental regulations under either Commonwealth or State legislation. The Board believes that the Consolidated Entity is not aware of any breach of environmental requirements as they apply to the Consolidated Entity.
State of affairs
Significant changes in the state of affairs of the Consolidated Entity during the financial year were as follows:
Acquisitions
The Bank established the Series 2009-1 REDS Trust securitisation vehicle during the year.
Refer to Note 34 of the financial report for further information.
Disposals
The following entities were voluntarily deregistered during the financial year:
Refer to Note 34 of the financial report for further information.
Events subsequent to balance date
Dividends have been declared after 31 August 2009, refer to Note 7.
The financial effect of the above transactions have not been brought to account in the financial statements for the year ended 31 August 2009.
On 18 September 2009 the retail entitlement offer settled at an issue price of $10.00 and 11,080,536 ordinary shares were issued.
Likely developments
The Bank will continue to provide a wide range of banking and financial services for the benefit of its customers, expanding and developing these where appropriate. This will require further investment, particularly in systems and information technology.
Further information about likely developments in the operations of the Consolidated Entity and the expected results of those operations in future financial years have not been included in this report because disclosure of the information would be likely to result in unreasonable prejudice to the Consolidated Entity.
Remuneration Report - Audited
Introduction
This remuneration report is prepared for consideration by shareholders at the 2009 Annual General Meeting of the Bank.
The report sets out:
Remuneration Policy - Audited
The Bank recognises that it needs to regularly reshape its remuneration programs to effectively support its business operations, goals, strategies and to enhance shareholder value. The Bank needs to remain competitive in the market place and remunerate reasonably and responsibly, helping it to attract, retain, motivate and reward its diverse workforce.
The Remuneration & Nomination Committee, chaired by the Chairman of the Board, is responsible for making recommendations to the Board on remuneration policies and directors’ and executives’ remuneration (which includes the Company Secretary). This Committee considers remuneration issues at least annually and obtains advice from external independent remuneration specialists to assist in its decisions. The objective is to ensure remuneration packages properly reflect the person’s duties and responsibilities and level of performance as well as ensuring that remuneration attracts and motivates people of the highest calibre.
Bank of Queensland Annual Report 200928

Directors’ ReportYear ended 31 August 2009
Remuneration Report - Audited (continued)
Remuneration Policy - Audited (continued)
The policies relating to non-executive director remuneration are discussed later in this report in the Non-Executive Directors Remuneration Framework.
Remuneration at all other levels of the organisation can be comprised of 3 main components:
The Bank has guidelines restricting the dealings of directors and executives in Bank securities through its Insider Trading Policy. This policy includes the Board’s policies on margin lending and hedging of risk associated with directors’ and executives’ ownership of Bank securities.
Fixed Component
Executives and senior management are offered a competitive fixed component of pay and rewards that reflect the core performance requirements and expectations of the role. This amount is market tested annually by remuneration specialists to ensure that it remains competitive.
Short-term Incentives
Payments in cash are provided to executives and senior management once specified quantifiable results are achieved within appropriate risk management parameters. Linking these short-term incentives to individual and corporate performance within appropriate risk management parameters ensures that executives and senior management continue to create a prudent performance focused work culture within the Bank that supports the long-term financial soundness of the Bank. The target award for each executive level participant is usually stated as a percentage of the executive’s total fixed remuneration. Business objectives and Short-term Incentive Plan design features are revisited annually by the Remuneration and Nomination Committee prior to the commencement of the plan year, but typically may include achievement of financial and non-financial targets for a person, team or division, individual performance criteria and risk management and compliance benchmarks.
Long-Term Incentives - Award Rights
The Award Rights Plan is a shareholder approved equity based program under which Award Rights are granted as long-term incentives. During the year ended 31 August 2009, the Bank has granted Performance Award Rights (“PARs”) and Deferred Award Rights (“DARs”) to executives and senior management.
PARs
The grant of PARs is made to Group Executives and other identified key senior managers due to the pivotal role they will play in achieving the longer-term business goals of the Group. The Board believes that part of the rewards for their services to the Bank should be performance-based and at risk and should involve equity interests in the Bank. This approach reflects national and international best practice in executive remuneration and corporate governance. In structuring the terms of the long-term incentives, the Board carefully considered market practice among comparable companies listed on the ASX.
The grant of the long-term incentives to executives and managers align their interests with those of the Bank and its shareholders. This includes encouraging behaviour that supports the risk management framework of the Bank and the long-term financial soundness of the Bank that in turn supports long-term performance. The performance hurdles for the PARs comprising the long-term incentive, will allow the Board to ensure that the incentives are aligned with the Bank’s future strategies and the interest of shareholders.
DARs
DARs are awarded to a broader range of BOQ employees and are designed to promote employee retention and productivity. The number of DARs awarded to an individual employee will depend on their position and relative performance, as determined under the normal performance review and development process that the Bank undertakes for all employees. DARs are performance tensioned and linked to this process by goals (both financial and non-financial, including risk management) which must be achieved to receive DARs.
Long-term Incentives - Options
The Senior Management Option Plan (“SMOP”) is a shareholder approved equity based program that offered options over Bank of Queensland Limited shares based on the achievement of specific performance hurdles. The exercise of options previously issued under this plan is conditional upon the Bank achieving specific performance hurdles. Further details of the SMOP are set out later in this report.
The SMOP has now been replaced by the Award Rights Plan as the mechanism for providing long-term incentives.
Further details of the nature and amount of each of the major elements of the remuneration paid to each director and each executive, including the five most highly paid executive officers of the Bank and the Consolidated Entity, are detailed in this report.
29

Directors’ ReportYear ended 31 August 2009
Remuneration Report - Audited (continued)
Key management personnel – Audited
Key management personnel including directors and executives have authority and responsibility for planning, directing and controlling the activities of the Bank and Consolidated Entity. Key management personnel include the five most highly remunerated S300A directors and executives of the Bank and Consolidated Entity.
Directors:
Neil Summerson Chairman (Non-executive)
Anthony Howarth Director (Non-executive)
David Liddy Managing Director and Chief Executive Officer
Steve Crane Director (Non-executive) (appointed 11 December 2008)
Roger Davis Director (Non-executive)
Peter Fox Director (Non-executive)
David Graham Director (Non-executive)
Carmel Gray Director (Non-executive)
Bill Kelty Director (Non-executive)
Antony Love Director (Non-executive)
John Reynolds Director (Non-executive)
Antony Love retired as a Director on 11 December 2008.
Executives:
Ram Kangatharan Group Executive and Chief Financial Officer
David Marshall Group Executive Banking
Daniel Musson Group Executive People & Corporate Services
Jim Stabback Group Executive and Chief Information Officer
Bruce Auty Group Executive Group Risk
Robert Hines resigned as Group Executive Retail Financial Services on 9 April 2009.
Len Stone resigned as Treasurer on 29 May 2009.
Non-executive Directors Remuneration Framework - Audited
Directors’ fees and payments are reviewed annually by the Remuneration and Nomination Committee, chaired by the Chairman of the Board. These fees and payments reflect advice given by independent remuneration specialists to ensure market comparability. The Chairman’s fees are determined independently to the fees of other directors and again are based upon information provided by independent remuneration specialists about market rates. The Chairman is not present at any discussions relating to determination of his own remuneration.
Directors’ Fees
The current fixed component of remuneration for directors is $90,000 plus superannuation per director per year. The Chairman receives remuneration of $225,000 plus superannuation per year. The Chairman receives no additional remuneration for involvement with committees.
Additional remuneration is paid to non-executive directors for committee work:
Non-executive directors’ fees are determined within an aggregate fee pool limit, which is periodically recommended for approval by shareholders. The maximum currently stands at $1,500,000 (inclusive of superannuation) and was approved by shareholders on 7 December 2006.
No part of non-executive director remuneration is based on the performance of the director or the Bank or is otherwise at risk. Non-executive directors do not participate in the Bank’s plans designed for the remuneration of executives.
Bank of Queensland Annual Report 200930

Directors’ ReportYear ended 31 August 2009
Remuneration Report - Audited (continued)
Non-executive Directors Remuneration Framework - Audited (continued)
Equity Participation
Non-executive directors do not receive shares, award rights or share options.
Retirement Benefits
Non-executive directors are no longer provided with retirement benefits apart from statutory superannuation. The accumulated value of non-executive director
Executive Director Remuneration Framework - Audited
Remuneration for the Managing Director is designed to:
role he undertakes.
The Managing Director, David Liddy, commenced employment with the Bank in April 2001 under an initial 5 year contract term expiring on 8 April 2006. On 14 October 2004, the Bank extended the term of David Liddy’s appointment as Managing Director until 31 August 2009 under a new employment agreement. On 20 August 2008, the Bank extended the term of David Liddy’s appointment as Managing Director until 31 December 2011 under new employment arrangements.
The remuneration structure is consistent with the Bank’s remuneration policy and includes:
the achievement of specified, quantifiable results including the Bank’s performance against budget for profit after tax and cost to income ratio as well
On 9 December 2004, shareholders approved the issue of 2,000,000 options over unissued ordinary shares of the Bank as a long-term equity performance incentive package. On 11 December 2008, shareholders approved the grant by the Bank of 175,072 Performance Award Rights as a long-term equity performance incentive package. The options and Award Rights are subject to continuous employment and performance hurdles which are detailed later in this report.
The existing contract may be terminated by the Bank at any time by the payment of a termination benefit equal to the lesser of:
The termination benefit also applies if the Managing Director resigns after ceasing to be the most senior executive of the Bank (whether at the instigation of the Board or as a result of a merger or takeover), or is removed as a director by shareholders.
Executives’ Remuneration Framework - Audited
The Bank’s executive reward structure is designed to:
the Bank.
Executive employment contracts are for a fixed term of 3 years with terms and conditions in line with the standards of the Australian banking and finance industry. Total remuneration is currently a mix of fixed salary in addition to short-term incentives and long-term incentives under the current Award Rights Plan and previous SMOP.
Payment of termination benefits on early termination by the employer, other than for gross misconduct, equal the lesser of 12 months remuneration or the fixed remuneration payable for the balance of the contract term.
31

Directors’ ReportYear ended 31 August 2009
Remuneration Report - Audited (continued)
Executives’ Remuneration Framework - Audited (continued)
Fixed Component
Executives are offered a competitive fixed component of remuneration that reflects the core performance requirements and expectations of the role. This amount is market tested annually by remuneration specialists to ensure that it remains competitive.
Short-term Incentive
Payments in cash are provided to executives based on the achievement of specified, quantifiable results being normalised cash net profit after tax within an appropriate risk management framework. These results include the Bank’s performance against the budget for profit after tax, and the Bank’s normalised cash cost to income ratio as well as individual performance criteria. Linking these short-term incentives to individual and corporate performance ensures that executives create a prudent performance-focused work culture within the Bank that supports the long-term financial soundness of the Bank. Short-Term Incentive Plan design features and business objectives are reviewed annually by the Remuneration and Nomination Committee.
Long-Term Incentives - Award Rights
The Award Rights Plan was approved by shareholders on 11 December 2008. It is an equity based program under which Award Rights are granted as long-term incentives. The two types of award rights currently granted to executives under the plan are PARs and DARs. No amount is payable by employees for the grant or exercise of these award rights.
PARs
PARs have a vesting framework based on Total Shareholder Return (TSR) of the Bank as measured against a Peer Group over a 3 year period. The PARs for the Managing Director vest over a 2 year period. The Peer Group consists of the S&P / ASX 200 from time to time excluding selected entities in resources, real estate investment trusts, telecommunications (offshore headquartered), energy and utilities and such other inclusions and exclusions as the Board considers appropriate. TSR is a measure of the entire return a shareholder would obtain from holding an entity’s securities over a period, taking into account factors such as changes in the market value of the securities and dividends paid over the period.
One half of an employee’s PARs will vest if the Bank’s TSR performance over the three year period is in the top 50% of the Peer Group. All of the PARs vest if the Bank’s TSR performance is in the top 25%. For TSR performance between those targets, a relative proportion of the PARs between one half and 100% would vest.
Vested PARs are generally exercisable within 5 years after they are granted (approximately 2 years after vesting).
DARs
DARs currently on issue vest proportionately over 3 years in the ratio of 20% (end Year 1), 30% (end Year 2) and 50% (end Year 3). There are no market performance hurdles or vesting conditions for DARs but the holder must remain an employee of the Bank.
Vested DARs are generally exercisable within 5 years after they are granted (approximately 2 to 4 years after vesting).
Other PARs and DARs terms
PARs and DARs which lapse, do not vest or are not exercised within 5 years after they are granted will expire.
If an employee’s employment ceases for serious misconduct involving fraud or dishonesty, their PARs and DARs (whether exercisable or not) will lapse.
If an employee resigns or is terminated for other reasons, vested PARs and DARs may generally be exercised within 90 days of the employee ceasing employment. PARs and DARs which are not vested may, at the Board’s discretion, vest on a pro rata basis and become exercisable if the employment ceases due to a transfer of employment to an Owner Managed Branch, retirement, redundancy, death, total and permanent disablement, or with the Board’s consent. Otherwise, PARs and DARs will lapse on cessation of employment.
The shares that are obtained on exercise of the PARs and DARs are initially held by a trustee (appointed by the Board) for the employee’s benefit and can remain in the trust for up to 10 years from the date the Award Rights are granted. While the shares are in the trust, they may be forfeited by the Bank if the employee’s employment ceases for reasons of serious misconduct involving dishonesty or fraud. The shares held by the trustee may be sold for the benefit of the employee or withdrawn from the trust by the employee, with the Board’s approval.
Bank of Queensland Annual Report 200932

Directors’ ReportYear ended 31 August 2009
Remuneration Report - Audited (continued)
Executives’ Remuneration Framework - Audited (continued)
Long-term Incentive - Options
The SMOP has been replaced by the Award Rights Plan, but options previously granted under the SMOP remain on issue. The ability to exercise options under this plan is conditional upon the Bank achieving specific performance hurdles. Details of these financial hurdles and specifics about issues of SMOP options are detailed later in this report.
The SMOP sets out the general terms and conditions attaching to options. Options are exercisable not less than 3 years and not more than 5 years after they are granted to eligible employees. Each option will convert into one ordinary fully paid share on exercise, after payment to the Bank of a strike price. Options which are exercisable, but which have not been exercised, lapse on the first to occur of the following events:
If an option holder ceases employment because of a Qualifying Reason, then a proportion of unvested options will become exercisable, such proportion being based on the time elapsed in the non-exercise period. The Board may allow more unvested options to become exercisable than the formula allows. If a Capital Event occurs, all unvested options become exercisable.
The Board has discretion to allow options to become exercisable in circumstances where it would otherwise be unfair to the holder for the options to lapse or not be exercisable.
Option holders do not participate in new issues of securities made by the Bank but adjustments are to be made to the number of shares over which the options exist and/or the exercise price to take into account changes to the capital structure of the Bank that occur by way of pro rata and bonus issues, according to the formula set out in the plan and the ASX Listing Rules. In any capital reconstruction, options will be similarly reconstructed in accordance with the Listing Rules.
33

Directors’ ReportYear ended 31 August 2009
Remuneration Report - Audited (continued)
Remuneration disclosures for key management personnel - Audited
The following table shows the nature and amount of each major element of the remuneration of all of the directors of the Bank including the five highest paid members of the executive team and other key management personnel, who were officers of the Bank and the Group for the year ended 31 August 2009.
2009 Financial Year Short-termPost-
employment (3)
Salary and fees
$
STI Cash Bonus (1)
$
Non- Monetary benefits (2)
$Total
$ $
Non-Executive Directors
Neil Summerson 2009 231,500 - - 231,500 23,217
2008 134,750 - - 134,750 55,130
Anthony Howarth 2009 117,917 - - 117,917 10,613
2008 63,929 - - 63,929 5,754
Steve Crane(commenced 11 December 2008)
2009 67,500 - - 67,500 6,075
2008 - - - - -
Roger Davis 2009 112,083 - - 112,083 10,088
2008 7,500 - - 7,500 675
Peter Fox 2009 90,000 - - 90,000 8,789
2008 90,000 - - 90,000 10,077
David Graham 2009 155,814 - - 155,814 14,023
2008 94,500 - - 94,500 8,505
Carmel Gray 2009 135,083 - - 135,083 12,158
2008 93,000 - - 93,000 8,370
Bill Kelty 2009 97,833 - - 97,833 9,416
2008 100,000 - - 100,000 10,753
John Reynolds 2009 154,500 - - 154,500 13,924
2008 145,083 - - 145,083 12,925
Former Director
Antony Love (retired 11 December 2008)
2009 33,333 - - 33,333 3,000
2008 104,000 - - 104,000 17,372
Executive Directors
David LiddyManaging Director
2009 1,230,424 1,000,000 7,806 2,238,230 13,829
2008 982,972 1,000,000 7,354 1,990,326 13,197
(1) STI cash reflects amount paid or accrued in respect of the year ended 31 August 2009. Refer to “Executive director remuneration framework” for a discussion of the Bank’s short- term incentive arrangement.
(2) The Bank has also paid insurance premiums in respect of Directors’ and Officers’ Liability Insurance which is not reflected in the above table as there is no appropriate basis for allocation.
(3) This includes superannuation benefits, salary sacrificed benefits and interest which is accrued at the CPI rate on director retirement benefits which was frozen effective from at 31 August 2003.
(4) Comprises long service leave accrued or utilised during the financial year.
(5) The fair value of the options and rights is calculated at the date of grant using an industry accepted option pricing model and allocated to each reporting period evenly over the period from grant date to vesting date. The value disclosed is the portion of the fair value of the options and rights allocated to this reporting period.
(6) The shares cannot be traded until the term of his engagement as Managing Director terminates.
Bank of Queensland Annual Report 200934

Directors’ ReportYear ended 31 August 2009
Other long-term (4)
Termination benefits Share based payments Total
S300A (1)(e)(i) Proportion of remuneration performance
related
S300A (1)(e)(vi)Value of
options and rights as proportion of remuneration
$ $
Options and rights(5)
$
Shares and units
$ $ % %
- - - - 254,717 - -
- - - - 189,880 - -
- - - - 128,530 - -
- - - - 69,683 - -
- - - - 73,575 - -
- - - - - - -
- - - - 122,175 - -
- - - - 8,175
- - - - 98,789 - -
- - - - 100,077 - -
- - - - 169,837 - -
- - - - 103,005 - -
- - - - 147,241 - -
- - - - 101,370 - -
- - - - 107,249 - -
- - - - 110,753 - -
- - - - 168,424 - -
- - - - 158,008 - -
- 188,661 - - 224,994 - -
- - - - 121,372 - -
56,994 - 979,079 500,000 3,788,132 65% 26%
31,958 - 433,895 250,000(6) 2,719,376 62% 16%
35

Directors’ ReportYear ended 31 August 2009
Remuneration Report – Audited (continued)
Remuneration disclosures for key management personnel - Audited (continued)
2009 Financial Year Short-termPost-
employment(3)
Salary and fees $
STI Cash Bonus(1)
$
Other short-term
employee benefits(2)
$Total
$ $
Executives
Ram Kangatharan 2009 502,837 275,000 - 777,837 13,829
2008 409,296 375,000 - 784,296 12,233
David Marshall 2009 396,425 150,000 - 546,425 39,206
2008 338,548 350,000 - 688,548 33,483
Daniel Musson 2009 356,853 100,000 - 456,853 35,293
2008 273,867 280,000 115,000 668,867 27,026
Jim Stabback 2009 345,260 115,000 - 460,260 34,147
2008 - - - - -
Bruce Auty 2009 321,944 92,500 - 414,444 41,581
2008 312,682 210,000 - 522,682 35,978
Former Executives
Robert Hines (resigned on 9 April 2009)
2009 293,658 224,940 - 518,598 30,863
2008 450,565 450,000 - 900,565 47,519
Len Stone (resigned on 29 May 2009)
2009 230,750 - - 230,750 49,000
2008 284,544 275,000 - 559,544 56,608
(1) STI cash reflects amount paid or accrued in respect of the year ended 31 August 2009. Refer to “Executive remuneration framework” for a discussion of the Bank’s short-term incentive arrangement.
(2) This relates to a sign on cash incentive.
(3) This includes superannuation and salary sacrificed benefits.
(4) Comprises long service leave accrued or utilised during the financial year.
(5) The fair value of the options and rights is calculated at the date of grant using an industry accepted option pricing model and allocated to each reporting period evenly over the period from grant date to vesting date. The value disclosed is the portion of the fair value of the options and rights allocated to this reporting period.
Bank of Queensland Annual Report 200936

Directors’ ReportYear ended 31 August 2009
Other long-term(4)Termination
benefitsShare based
payments Total
S300A (1)(e)(i) Proportion of remuneration
performance related
S300A (1)(e)(vi) Value of options and rights as proportion
of remuneration
$ $
Options and rights(5)
$ $ % %
815 - 247,277 1,039,758 50% 24%
555 - 124,748 921,832 54% 14%
747 - 144,549 730,927 40% 20%
525 - 71,285 793,841 53% 9%
625 - 143,449 636,220 38% 23%
397 - 71,285 767,575 61% 9%
388 - 14,476 509,271 25% 3%
- - - - - -
4,077 - 236,502 696,604 47% 34%
4,650 - 160,931 724,241 51% 22%
- 651,998 476,412 1,677,871 42% 28%
22,374 - 253,411 1,223,869 58% 21%
- 734,214 395,791 1,409,755 28% 28%
13,117 - 182,811 812,080 56% 23%
37

Directors’ ReportYear ended 31 August 2009
Remuneration Report – Audited (continued)
Remuneration disclosures for key management personnel - Audited (continued)
The following factors and assumptions were used in determining the fair value of rights on grant date:
Right Type Grant date Expiry dateFair value per right
Exercise price
Price of shares on grant date
Expected volatility
Risk free interest
rateDividend
yield
Executive Director
PARs 11 December 2008 (1) 29 June 2014 $5.76 Nil $10.25 26.7% 4.5 5.2%
Executives
PARs 29 June 2009 29 June 2014 $4.59 Nil $8.89 35.1% 4.2 7.2%
DARs 29 June 2009 29 June 2014 $7.59 Nil $8.89 35.1% 4.2 7.2%
(1) The grant date is deemed to be the date the Award Rights were approved at the Annual General Meeting, the rights were issued on 29 June 2009.
At Risk Remuneration - Audited
Short-term incentive
The short-term incentive referred to in the above remuneration table represents 100% of the short-term incentive component of “at risk” remuneration in the year for the benefit of the executive director and the executives. Those bonuses were determined on the basis of the Bank’s and the individual executive’s performance over the financial year ended 31 August 2009 and are therefore deemed to be attributable to that year, although payment will not occur until October 2009. Based on the remuneration policies and practices described in this report there were no short-term incentive bonus amounts attributable to the executive director and executives that are considered to have been forfeited or deferred in the year.
Consequences of performance on shareholder wealth
In considering the Consolidated Entity’s performance and benefits for shareholder wealth, the Remuneration and Nomination Committee had regard to the following indices in respect of the current financial year and the previous four financial years:
2009 2008 2007 2006 2005
Normalised cash net profit after tax $187.4m $155.4m $106.1m $86.7m $75.6m
Normalised cash diluted earnings per share 98.4c 99.9c 93.0c 79.8c 67.7c
Normalised cash cost to income ratio 49.9% 56.1% 62.6% 64.5% 65.8%
Share price $11.65 $15.86 $18.56 $15.29 $11.65
Normalised cash net profit after tax and normalised cash cost to income ratio are considered as targets in setting the short-term incentive. Normalised cash results exclude one-off, non-recurring amounts and amortisation of customer contracts. Normalised cash diluted earnings per share is included in the calculation of current long-term incentives for executives and for the Managing Director’s options.
Currently, the average performance-linked component of remuneration comprises approximately 49% (2008: 54%) of total payments made to the Managing Director and executives.
Bank of Queensland Annual Report 200938

Directors’ ReportYear ended 31 August 2009
Remuneration Report – Audited (continued)
Options and Rights Terms – Audited
Details of the vesting profile of the options over and rights to ordinary shares in the Bank granted as remuneration to each key management person of the Bank is detailed below:
Options or rights granted
Value yet to vest
Number Date
% vested during year
% Forfeited in year(1)
Financial years in which
options or rights vest
Fair value per
option or right at grant
date
Exercise Price per
optionExpiry Date Min(2) Max(3)
Value of Options
($) ($) ($) ($) ($)
Executive Director
David LiddyManaging Director
Options 500,000 1 November 2005
100% - 31 August 2009
2.16 13.37 20 December 2010
Nil - 1,080,000
500,000 1 November 2006
- - 31 August 2010
2.13 16.40 20 November 2011
Nil 242,583 1,065,000
PARs 175,072 11 December 2008
- - 31 August 2011
5.76 Nil 29 June 2014
Nil 672,277 1,008,415
Executives
Ram Kangatharan
Options 350,000 1 November 2007
- - 31 August 2011
2.57 19.25 1 November 2012
Nil 550,082 899,500
DARs 8,550 29 June 2009
- - 31 August 2012(4)
7.59 Nil 29 June 2014
10,816 56,243 64,895
PARs 45,600 29 June 2009
- - 31 August 2012
4.59 Nil 29 June 2014
Nil 195,350 209,304
David Marshall
Options 200,000 1 November 2007
- - 31 August 2011
2.57 19.25 1 November 2012
Nil 314,333 514,000
DARs 6,840 29 June 2009
- - 31 August 2012(4)
7.59 Nil 29 June 2014
8,653 44,993 51,916
PARs 30,210 29 June 2009
- - 31 August 2012
4.59 Nil 29 June 2014
Nil 129,420 138,664
Daniel Musson
Options 200,000 1 November 2007
- - 31 August 2011
2.57 19.25 1 November 2012
Nil 314,333 514,000
DARs 6,270 29 June 2009
- - 31 August 2012(4)
7.59 Nil 29 June 2014
7,932 41,244 47,589
PARs 28,500 29 June 2009
- - 31 August 2012
4.59 Nil 29 June 2014
Nil 122,094 130,815
Jim Stabback
DARs 7,410 29 June 2009
- - 31 August 2012(4)
7.59 Nil 29 June 2014
9,374 48,743 56,242
PARs 22,800 29 June 2009
- - 31 August 2012
4.59 Nil 29 June 2014
Nil 97,675 104,652
Bruce Auty
Options 150,000 17 October 2005
100% - 31 August 2009
2.16 13.37 17 October 2010
Nil - 324,000
100,000 20 November 2006
- - 31 August 2010
2.13 16.40 20 November 2011
Nil 78,903 213,000
100,000 1 November 2007
- - 31 August 2011
2.57 19.25 1 November 2012
Nil 157,166 257,000
DARs 5,700 29 June 2009
- - 31 August 2012(4)
7.59 Nil 29 June 2014
7,211 37,495 43,263
PARs 13,680 29 June 2009
- - 31 August 2012
4.59 Nil 29 June 2014
Nil 58,605 62,791
39

Directors’ ReportYear ended 31 August 2009
Options or rights granted
Value yet to vest
Number Date
% vested during year
% Forfeited in year(1)
Financial years in which
options or rights vest
Fair value per
option or right at grant
date
Exercise Price per
optionExpiry Date Min(2) Max(3)
Value of Options
($) ($) ($) ($) ($)
Former Executives
Robert Hines
Options 200,000 17 October 2005
100% - 31 August 2009
2.16 13.37 17 October 2010
Nil Nil 432,000
175,000 20 November 2006
81% 19% 31 August 2010
2.13 16.40 20 November 2011
Nil Nil 372,750
175,000 1 November 2007
50% 50% 31 August 2011
2.57 19.25 1 November 2012
Nil Nil 449,750
Len StoneOptions 150,000 17 October
2005100% - 31 August
20092.16 13.37 17 October
2010Nil Nil 324,000
100,000 20 November 2006
95% 5% 31 August 2010
2.13 16.40 20 November 2011
Nil Nil 213,000
130,000 1 November 2007
63% 37% 31 August 2011
2.57 19.25 1 November 2012
Nil Nil 334,100
(1) The % forfeited in the year represents the reduction in number of options or rights available due to cessation of employment. The value of forfeited options during the year was $80,091 for SMOP 6 & $348,238 for SMOP 7.
(2) The minimum value of options or PARs yet to vest is $nil as the performance criteria may not be met and consequently the options or rights may not vest. The DARs reflect service conditions as at the end of the financial year.
(3) The residual fair value expense to be recognised in future years assuming all performance criteria are met.
(4) The DARs will vest 20% in financial year 2010, 30% in financial year 2011 and 50% in financial year 2012.
No options or rights have been granted since the end of the financial year. No options or rights were exercised during the year. The above options or rights were provided at no cost to the recipients.
No shares were issued on the exercise of award rights granted as remuneration during the year ended 31 August 2009.
Award rights and options have been granted under the Award Rights Plan or SMOP to executives and senior management on an ongoing basis in line with the Bank’s remuneration policy. The performance hurdles are reviewed annually by the Board Remuneration and Nomination Committee.
There are no voting rights attached to the unissued ordinary shares. Voting rights will be attached to the unissued ordinary shares when vested award rights or options are exercised. Award rights or options may lapse in the event of cessation of employment depending on the circumstances of such cessation.
Remuneration Report – Audited (continued)
Options and Rights Terms – Audited (continued)
Bank of Queensland Annual Report 200940

Directors’ ReportYear ended 31 August 2009
Remuneration Report – Audited (continued)
Options and Rights Terms – Audited (continued)
Managing Director’s options and rights
The Managing Director, David Liddy, has been granted the following PARs as approved by shareholders at the Annual General Meeting held on 11 December 2008:
Number of PARs Vesting date Expiry date Exercise price Issue price
175,072 Date of release of financial results in October 2010 29 June 2014 Nil Nil
The ability to exercise the PARs is conditional on the Bank achieving certain market performance hurdles. The performance hurdles for vesting of the PARs to be granted to Mr Liddy are:
Peer Group for the PARs of other executives as outlined above in this report) over a 2 year period (instead of the 3 year period applicable to the
Director and Chief Executive Officer as agreed with the Board, including to have managed the process of succession planning for those positions, to the satisfaction of the Board.
The PARs granted to Mr Liddy under the Award Rights Plan are otherwise granted on the same terms outlined above in this report as apply to the other executives of the Bank.
Using industry accepted pricing methodologies, each PAR had a value of $5.76 as at date of grant.
The market value of shares at 31 August 2009 was $11.65 (2008: $15.86).
Options
The Managing Director has been granted the following options as approved by shareholders at the Annual General Meeting held on 9 December 2004:
Tranche Number of options Exercise date Expiry date Exercise price Issue price
4 500,000 Date of release of financial results in October 2009 20 November 2011 $16.40 Nil
Tranche 4 was granted on 1 November 2006.
Tranche 3 vested during the year as the performance hurdles required by the Managing Director Option Plan had been met.
The ability to exercise the options is conditional on the Consolidated Entity achieving certain performance hurdles. The performance hurdle for Tranche 4 is based on diluted cash EPS growth and requires the Bank’s diluted cash EPS growth to outperform the average diluted cash EPS growth of the Comparison Banks over financial years 2007 - 2009.
To reach the EPS performance hurdle the Consolidated Entity must achieve the following for the performance period:
Percentage range by which cash EPS growth exceeds comparison banks Percentage of options to vest
5% and up to but not exceeding 10% 25%
10% and up to but not exceeding 15% 50%
15% and up to but not exceeding 20% 75%
20% or more 100%
Should any Tranche 4 options remain unvested as at November 2010, the EPS test will be applied across financial years 2007, 2008, 2009 and 2010.
Should any Tranche 4 options remain unvested as at November 2011, the EPS test will be applied across financial years 2007, 2008, 2009, 2010 and 2011.
There are no voting rights attached to the unissued ordinary shares. Voting rights will be attached to the unissued ordinary shares when the vested options are exercised. Options may lapse in the event of cessation of employment depending on the circumstances of such cessation.
Using industry accepted pricing methodologies, each Tranche 4 option had a value of $2.13 as at date of granting.
The market value of shares at 31 August 2009 was $11.65 (2008: $15.86).
41

Directors’ ReportYear ended 31 August 2009
Remuneration Report – Audited (continued)
Options and Rights Terms – Audited (continued)
Details of all options and rights on issue at 31 August 2009, are set out below:
Senior Managers’ options and rights
1. Options issued on 10 November 2003 (SMOP 3):
Options originally issued: Options lapsed during the year:Options exercised during the year:Options on issue at balance date:Exercise date: Expiry date: Options exercisable at balance date:Issue price: Exercise price: $9.49.
2. Options issued on 20 December 2004 (SMOP 4):
Options originally issued: Options lapsed during the year:Options exercised during the year:Options on issue at balance date:Exercise date: Expiry date: Options exercisable at balance date:Issue price: Exercise price: (1) $10.57.
(1) The exercise price was adjusted due to the entitlements offer as required under the plan rules.
3. Options issued on 17 October 2005 (SMOP 5):
Options originally issued: Options lapsed during the year:Options exercised during the year:Options on issue at balance date:Exercise date: Expiry date: Options exercisable at balance date:Issue price: Exercise price: (1) $13.23.
During the year, 2,523,740 options vested under this plan as the performance hurdles had been met.
4. Options issued on 20 November 2006 (SMOP 6):
Options originally issued: Options lapsed during the year:Options exercised during the year:Options on issue at balance date:Exercise date: Expiry date: Options exercisable at balance date:Issue price: Exercise price: (1) $16.26.
The ability to exercise the options is conditional on the Consolidated Entity achieving certain performance hurdles. The performance hurdles are based on diluted cash EPS growth and require the Bank’s diluted cash EPS to outperform the average diluted cash EPS growth of the Comparison Banks over the financial years 2007, 2008 and 2009 (“performance period”), as described above.
Bank of Queensland Annual Report 200942

Directors’ ReportYear ended 31 August 2009
Remuneration Report – Audited (continued)
Options and Rights Terms – Audited (continued)
Senior Managers’ options and rights (continued)
To reach the EPS performance hurdle the Consolidated Entity must achieve the following for the performance period:
Percentage range by which cash EPS growth exceeds Comparison banks Percentage of options to vest
5% and up to but not exceeding 10% 25%
10% and up to but not exceeding 15% 50%
15% and up to but not exceeding 20% 75%
20% or more 100%
Should any SMOP 6 options remain unvested as at November 2010, the EPS test will be applied across financial years 2007, 2008, 2009 and 2010.
Should any SMOP 6 options remain unvested as at November 2011, the EPS test will be applied across financial years 2007, 2008, 2009, 2010 and 2011.
Using the trinomial pricing methodology, each option had a value of $2.13 as at date of granting. The market value of shares at 31 August 2009 was $11.65 (2008: $15.86).
During the year 566,729 options vested under this plan at the discretion of the directors, as permitted under the terms of the option plan.
5. Options issued on 1 November 2007 (SMOP 7):
Options originally issued: 3,999,000Options lapsed during the year:Options exercised during the yearOptions on issue at balance date:Exercise date: 1 November 2010Expiry date: 1 November 2012Options exercisable at balance date:Issue Price:Exercise Price: (1) $19.11.
(1) The exercise price was adjusted due to the entitlements offer as required under the plan rules.
The ability to exercise the options is conditional on the Consolidated Entity achieving certain performance hurdles. The performance hurdles are based on diluted cash EPS growth and require the Bank’s diluted cash EPS to outperform the average diluted cash EPS growth of the Comparison Banks over the financial years 2008, 2009 and 2010 (“performance period”), as described above.
To reach the EPS performance hurdle the Consolidated Entity must achieve the following for the performance period:
Percentage range by which cash EPS growth exceeds Comparison banks Percentage of options to vest
5% and up to but not exceeding 10% 25%
10% and up to but not exceeding 15% 50%
15% and up to but not exceeding 20% 75%
20% or more 100%
Should any SMOP 7 options remain unvested as at November 2011, the EPS test will be applied across financial years 2008, 2009, 2010 and 2011.
Should any SMOP 7 options remain unvested as at November 2012, the EPS test will be applied across financial years 2008, 2009, 2010, 2011 and 2012.
Using the trinomial pricing methodology, each option had a value of $2.57 as at date of granting. The market value of shares at 31 August 2009 was $11.65 (2008: $15.86).
During the year 380,584 options vested under this plan at the discretion of the directors, as permitted under the terms of the option plan.
43

Directors’ ReportYear ended 31 August 2009
Remuneration Report – Audited (continued)
Options and Rights Terms – Audited (continued)
Senior Managers’ options and rights (continued)
6. PARs issued on 29 June 2009:
PARs originally granted:PARs lapsed during the year:PARs vested during the year:PARs on issue at balance date:Vesting date: Date of release of financial results in October 2011Expiry date: 29 June 2014Issue Price:Exercise Price: $Nil.
The ability to exercise the PARs is conditional on the Bank achieving certain market performance hurdles. Refer to “Executives Remuneration Framework” for further details.
Using the Monte Carlo simulation approach, each PAR had a value of $4.59 as at date of grant. The market value of shares at 31 August 2009 was $11.65 (2008: $15.86).
During the year 703 PARs vested under the Award Rights Plan at the discretion of the directors, as permitted under the terms of the plan.
7. DARs issued on 29 June 2009:
DARs originally granted:DARs lapsed during the year:DARs vested during the year:DARs on issue at balance date:Vesting date:Expiry date:Issue Price:Exercise Price: $Nil.
The ability to exercise the DARs is conditional on a qualifying service period. Refer to “Executive Remuneration Framework” for further details.
Using the Monte Carlo simulation approach, each DAR had a value of $7.59 as at date of grant. The market value of shares at 31 August 2009 was $11.65 (2008: $15.86).
During the year 1,746 DARs vested under the Award Rights Plan at the discretion of the directors, as permitted under the terms of the plan.
Indemnification of officers
The Bank’s Constitution provides that all officers of the Bank are indemnified by the Bank against liabilities incurred by them in the capacity of officer to the full extent permitted by the Corporations Act 2001.
Insurance of officers
Since the end of the previous financial year the Bank has paid insurance premiums in respect of a Directors’ and Officers’ liability insurance contract. The contract insures each person who is or has been a director or executive officer (as defined in the Corporations Act 2001) of the Bank against certain liabilities arising in the course of their duties to the Bank and its controlled entities. The directors have not included details of the nature of the liabilities covered or the amount of the premium paid in respect of the insurance contract as such disclosure is prohibited under the terms of the contract.
Bank of Queensland Annual Report 200944

Directors’ ReportYear ended 31 August 2009
Directors’ interests
Directors’ interests as at the date of this report were as follows:
Director Ordinary Shares
Neil Summerson 25,057
Anthony Howarth 46,514
David Liddy (1) 1,018,052
Steve Crane 12,224
Roger Davis 3,463
Peter Fox 1,775,499
David Graham 9,576
Carmel Gray 5,899
Bill Kelty 1,165
John Reynolds 1,000
(1) Includes 28,239 restricted shares
Antony Love retired as Director on 11 December 2008.
Audit and Non–audit services
During the year KPMG, the Bank’s auditor, has performed certain other services in addition to their statutory duties. The Board has considered the non-audit services provided during the year by the auditor are in accordance with written advice provided by resolution of the Audit Committee, and is satisfied that the provision of those non-audit services during the year by the auditor is compatible with, and did not compromise, the auditor’s independence requirements of the Corporations Act 2001 for the following reasons:
all non-audit services were subject to the corporate governance procedures adopted by the Bank and have been reviewed by the Audit Committee
the non-audit services provided do not undermine the general principles relating to auditor’s independence as set out in APES 110 Code of Ethics for Professional Accountants, as they did not involve reviewing or auditing the auditor’s own work, acting in a management or decision making capacity for the Bank, acting as an advocate for the Bank or jointly sharing risks and rewards.
Details of the amounts paid to the auditor of the Bank, KPMG and its related practices for audit and non-audit services provided during the year are set out below:
Consolidated Bank
2009$000
2008$000
2009$000
2008$000
Audit services – KPMG Australia
- Audit and review of the financial reports 613.8 843.0 555.3 763.9
- Other regulatory and audit services 177.2 189.5 99.9 81.7
791.0 1,032.5 655.2 845.6
Audit related services – KPMG Australia
- Other assurance services (1) 278.3 307.8 95.1 65.6
278.3 307.8 95.1 65.6
Other services – KPMG Australia
- Tax advisory services 27.7 - 21.5 -
27.7 - 21.5 -
Other services – KPMG Australia
- Due diligence services 436.9 193.5 53.8 86.0
436.9 193.5 53.8 86.0
(1) Other assurance services comprise accounting opinions, and audit related services provided in relation to mortgage securitisation trusts which are consolidated under Australian International Financial Reporting Standards.
Fees for audit and non-audit services paid to KPMG which were provided in relation to leasing securitisation trusts which are not consolidated by the Bank were $86,677 (2008: $139,159).
45
Directors’ ReportYear ended 31 August 2009
Lead Auditor’s Independence Declaration
The lead auditor’s independence declaration is set out on page 47 and forms part of the directors’ report for the year ended 31 August 2009.
Rounding of amounts
The Bank is a company of a kind referred to in ASIC Class Order 98/100 dated 10 July 1998 (as amended by Class Order 04/667 dated 15 July 2004) and in accordance with that Class Order, amounts in this financial report and directors’ report have been rounded off to the nearest hundred thousand dollars, unless otherwise stated.
Dated at Brisbane this fifteenth day of October 2009.
Signed in accordance with a resolution of the directors:
Neil Summerson David Liddy Chairman Managing Director
Bank of Queensland Annual Report 200946

Lead Auditor’s Independence Declarationunder Section 307C of the Corporations Act 2001
To the directors of Bank of Queensland Limited
I declare that, to the best of my knowledge and belief, in relation to the audit for the financial year ended 31 August 2009 there have been:
(ii) no contraventions of any applicable code of professional conduct in relation to the audit.
KPMG
John Teer Partner
Brisbane 15 October 2009
KPMG, an Australian partnership, is part of the KPMG International network.KPMG International is a Swiss cooperative.
47

Income StatementsFor the year ended 31 August 2009
Consolidated Bank
Note2009
$m2008
$m2009
$m2008
$m
Interest income 4 2,031.2 2,043.1 1,963.1 1,808.0
Less: Interest expense 4 1,550.1 1,622.0 1,588.7 1,518.2
Net interest income 481.1 421.1 374.4 289.8
Other operating income 4 147.9 149.5 215.6 194.7
Total operating income 629.0 570.6 590.0 484.5
Less: Expenses 5 369.8 341.7 339.4 294.4
Profit before impairment on loans and advances and tax 259.2 228.9 250.6 190.1
Less: Impairment on loans and advances 13 66.0 27.0 49.1 20.3
Profit before income tax 193.2 201.9 201.5 169.8
Less: Income tax expense 6 52.1 63.2 60.9 52.9
Profit for the year 23 141.1 138.7 140.6 116.9
Basic earnings per share Ordinary shares 8 75.9c 94.4c
Diluted earnings per share Ordinary shares 8 74.4c 89.6c
The above income statements should be read in conjunction with the accompanying notes.
Bank of Queensland Annual Report 200948

Statements of Recognised Income and Expense For the year ended 31 August 2009
Consolidated Bank
Note2009
$m2008
$m2009
$m2008
$m
Items of income and expense (net of tax)
Cash flow hedges:
Net losses taken to equity 23 (68.1) (28.0) (70.8) (31.8)
Net gains transferred to income statement 23 (5.6) (2.1) (5.6) (2.1)
Change in fair value of assets available for sale 23 (1.4) (2.8) (2.3) (0.9)
Net expense recognised directly in equity (75.1) (32.9) (78.7) (34.8)
Profit for the year 141.1 138.7 140.6 116.9
Total recognised income and expense for the year 66.0 105.8 61.9 82.1
Attributable to:
Equity holders of the parent 66.0 105.8 61.9 82.1
Other movements in equity arising from transactions with owners as owners are set out in Note 23. The amounts recognised directly in equity are disclosed net of tax, refer to Note 6.
The above statements of recognised income and expense should be read in conjunction with the accompanying notes.
49

Balance SheetsAs at 31 August 2009
Consolidated Bank
Note2009
$m2008
$m2009
$m2008
$m
Assets
Cash and liquid assets 9 353.8 399.5 250.3 242.9
Due from other financial institutions 10 74.6 56.9 74.6 56.9
Other financial assets 11 4,423.3 3,263.9 4,536.4 3,180.6
Derivative financial instruments 27 88.5 111.7 58.7 74.9
Loans and advances at amortised cost 12 28,310.8 25,246.8 25,694.4 20,669.5
Shares in controlled entities 34 - - 681.0 680.8
Property, plant and equipment 14 24.5 25.4 24.5 18.3
Current tax assets - - - 0.3
Deferred tax assets 15 13.3 - 12.1 -
Other assets 16 104.3 150.7 221.1 256.0
Intangible assets 17 587.8 590.6 96.1 89.8
Investments accounted for using the equity method 39 31.1 37.7 - -
Total assets 34,012.0 29,883.2 31,649.2 25,270.0
Liabilities
Due to other financial institutions 18 192.7 135.6 192.7 135.6
Deposits 19 24,197.2 20,036.5 24,413.5 17,920.1
Derivative financial instruments 27 205.0 109.0 205.0 109.0
Accounts payable and other liabilities 277.6 296.5 246.5 222.9
Current tax liabilities 24.4 6.8 24.4 -
Provisions 20 20.9 17.0 13.8 12.8
Deferred tax liabilities 15 - 11.4 - 18.5
Borrowings including subordinated notes 21 6,982.8 7,579.5 1,369.0 1,514.1
Amounts due to controlled entities - - 3,118.0 3,687.4
Total liabilities 31,900.6 28,192.3 29,582.9 23,620.4
Net assets 2,111.4 1,690.9 2,066.3 1,649.6
Equity
Issued capital 22 1,903.1 1,439.4 1,903.4 1,439.4
Reserves 23 17.4 60.3 (4.3) 46.2
Retained profits 23 190.9 191.2 167.2 164.0
Total Equity 2,111.4 1,690.9 2,066.3 1,649.6
The above balance sheets should be read in conjunction with the accompanying notes.
Bank of Queensland Annual Report 200950

Statements of Cash FlowsFor the year ended 31 August 2009
Consolidated Bank
Note2009
$m2008
$m2009
$m2008
$m
Cash flows from operating activities
Interest received 2,006.1 2,000.0 1,816.8 1,732.3
Fees and other income received 171.2 142.7 239.1 119.0
Dividends received 1.3 0.1 0.6 -
Interest paid (1,538.4) (1,564.8) (1,566.6) (1,462.2)
Cash paid to suppliers and employees (350.0) (306.9) (203.5) (282.8)
Operating income tax paid (29.3) (58.9) (29.3) (56.3)
Other taxes paid - (0.3) - (0.3)
260.9 211.9 257.1 49.7
Increase in operating assets:
Loans and advances at amortised cost (3,133.0) (5,032.2) (5,497.7) (3,309.2)
Other financial assets (1,156.7) (1,315.5) (1,499.4) (2,265.8)
Increase / (decrease) in operating liabilities:
Deposits 4,250.5 4,786.0 6,576.0 5,550.3
Securitisation liabilities 21 (394.1) 1,240.0 - -
Net cash from operating activities 28 (172.4) (109.8) (164.0) 25.0
Cash flows from investing activities
Payments for property, plant and equipment (9.2) (11.3) (9.2) (6.9)
Payments for intangible assets - software (25.6) (20.2) (25.6) (20.2)
Cash distribution received from equity accounted investments 1.7 3.0 - -
Payments for acquisition of Home Building Society Ltd 34 (b) - (66.2) - (103.3)
Proceeds from sale of property, plant and equipment 2.4 5.5 2.1 0.8
Net cash from investing activities (30.7) (89.2) (32.7) (129.6)
Cash flows from financing activities
Proceeds from issue of ordinary shares 22 374.5 90.0 374.5 90.0
Cost of capital issues (8.6) (6.2) (8.6) (6.2)
Proceeds from borrowings and foreign exchange instruments 21 1,416.0 2,758.6 1,462.4 2,757.9
Repayments of borrowings 21 (1,539.0) (2,866.0) (1,539.0) (2,866.0)
Payments for treasury shares (0.3) - - -
Proceeds from issue of Perpetual Equity Preference Shares - 200.0 - 200.0
Dividends paid (85.2) (57.0) (85.2) (57.0)
Net cash from financing activities 157.4 119.4 204.1 118.7
Net increase / (decrease) in cash and cash equivalents (45.7) (79.6) 7.4 14.1
Cash and cash equivalents at beginning of year 399.5 479.1 242.9 228.8
Cash and cash equivalents at end of year 9 353.8 399.5 250.3 242.9
The above statements of cash flows should be read in conjunction with the accompanying notes.
51

Notes to and Forming Part of the Financial StatementsYear ended 31 August 2009
Note Contents Page
1. Reporting entity 53
2. Basis of preparation 53
3. Significant accounting policies 54
4. Operating income 62
5. Expenses 63
6. Income tax expense 64
7. Dividends 65
8. Earnings per share 66
9. Cash and liquid assets 66
10. Due from other financial institutions 66
11. Other financial assets 67
12. Loans and advances at amortised cost 67
13. Provisions for impairment 68
14. Property, plant and equipment 69
15. Deferred tax assets and liabilities 71
16. Other assets 71
17. Intangible assets 72
18. Due to other financial institutions 74
19. Deposits 74
20. Provisions 75
21. Borrowings including subordinated notes 76
22. Issued capital 77
23. Reserves and retained profits 78
24. Segment reporting 79
25. Risk management 79
26. Capital management 87
27. Financial instruments 89
28. Notes to the statements of cash flows 91
29. Auditors’ remuneration 92
30. Contingent liabilities 92
31. Commitments 93
32. Employee benefits 93
33. Key management personnel disclosures 101
34. Controlled entities 108
35. Related parties information 110
36. Average balances and margin analysis 110
37. Deed of cross guarantee 111
38. Events subsequent to balance date 113
39. Investments accounted for using the equity method 113
Bank of Queensland Annual Report 200952

Notes to and Forming Part of the Financial StatementsYear ended 31 August 2009
1. Reporting entity
Bank of Queensland Limited (the “Bank”) is a company domiciled in Australia. The address of the Bank’s registered office is Level 17, 259 Queen Street, Brisbane, QLD, 4000. The consolidated financial report of the Bank for the financial year ended 31 August 2009 comprises the Bank and its subsidiaries (together referred to as the “Consolidated Entity”) and the Consolidated Entity’s interest in equity accounted investments.
2. Basis of preparation
(a) Statement of compliance
The financial report is a general purpose financial report which has been prepared in accordance with Australian Accounting Standards (“AASBs” – including Australian Interpretations) adopted by the Australian Accounting Standards Board (“AASB”) and the Corporations Act 2001. The financial statements and notes of the Consolidated Entity and Bank also comply with International Financial Reporting Standards (“IFRSs”) and interpretations adopted by the International Accounting Standards Board.
The consolidated financial report was authorised for issue by the directors on 15 October 2009.
(b) Basis of measurement
The financial report is prepared on the historical cost basis with the exception of the following assets and liabilities which are stated at their fair value:
derivative financial instruments;
financial instruments designated at fair value; and
financial instruments classified as available-for-sale.
(c) Functional and presentation currency
The consolidated financial statements are presented in Australian dollars, which is the Bank’s functional currency and the functional currency of the majority of the Consolidated Entity.
(d) Rounding
The Consolidated Entity is of a kind referred to in ASIC Class Order 98/100 dated 10 July 1998 (updated by CO 05/641 effective 28 July 2005 and CO 06/51 effective 31 January 2006) and in accordance with that Class Order, amounts in this financial report and directors’ report have been rounded off to the nearest hundred thousand dollars, unless otherwise stated.
(e) Use of estimates and judgements
The preparation of a financial report in conformity with Australian Accounting Standards requires management to make judgements, estimates and assumptions that affect the application of policies and reported amounts of assets, liabilities, income and expenses. These estimates and associated assumptions are based on historical experience and various other factors that are believed to be reasonable under the circumstances, the results of which form the basis of making the judgements about carrying values of assets and liabilities that are not readily apparent from other sources. Actual results may differ from these estimates. These accounting policies have been consistently applied by each entity in the Consolidated Entity.
The estimates and underlying assumptions are reviewed on an ongoing basis. Revisions to accounting estimates are recognised in the period in which the estimates are revised if the revision only affects that period, or in the period of the revision and future periods if the revision affects both current and future periods.
Information about significant areas of estimation uncertainty and critical judgements in applying accounting policies that have the most significant effect on the amount recognised in the financial statements are described in the following notes:
Provisions for impairment – Note 13;
Intangible assets - Note 17;
Provisions - Note 20;
Financial instruments - Note 27; and
Controlled entities - Note 34.
53

Notes to and Forming Part of the Financial StatementsYear ended 31 August 2009
2. Basis of preparation (continued)
(f) Restatement of acquisition accounting adjustments
The prior period income statement and balance sheets were stated using provisional entries in accordance with AASB 3 Business Combinations. These provisional entries have now been finalised resulting in restatement of several income statement and balance sheet items. A summary of these restatements are provided in the table below.
31 August 2008
Restated$m
Reported$m
Increase / (Decrease)
Income Statement
Amortisation of intangibles 7.7 26.7 (19.0)
Income tax expense 63.2 56.1 7.1
Profit for the year 138.7 126.8 11.9
Balance Sheet
Intangible assets 590.6 571.6 19.0
Current tax asset - 0.3 (0.3)
Current tax liabilities 6.8 - 6.8
Retained profits 191.2 179.3 11.9
3. Significant accounting policies
The following standards and amendments have been identified as those which may impact the Bank and were available for early adoption at 31 August 2009 but have not been applied in these financial statements:
Revised AASB 3 Business Combinations changes the application of acquisition accounting for business combinations and the accounting for non-controlling (minority) interests. Key changes include: the immediate expensing of all transaction costs; measurement of contingent consideration at acquisition date with subsequent changes through the income statement; measurement of non-controlling (minority) interest at full fair value or the proportionate share of the fair value of the underlying net assets; guidance on issues such as reacquired rights and vendor indemnities; and the inclusion of combinations by contract alone and those involving mutuals. The revised standard becomes mandatory for the Bank’s 31 August 2010 financial report and only applies to business combinations after 31 August 2009 and is not expected to impact business combinations prior to the date;
AASB 8 Operating Segments replaces the presentation requirements of segment reporting in AASB 114 Segment Reporting. AASB 8 is applicable for annual reporting periods beginning on or after 1 January 2009 and is not expected to have an impact on the financial results of the Bank as the standard is only concerned with disclosures;
AASB 101 Presentation of Financial Statements introduces as a financial statement (formerly “primary” statement) the “statement of comprehensive income”. The revised standard does not change the recognition, measurement or disclosure of transactions and events that are required by other AASBs. The revised AASB 101 will become mandatory for the Bank’s 31 August 2010 financial report. The Bank has not yet determined the potential effect of the revised standard on the Bank’s disclosures;
Revised AASB 127 Consolidated and Separate Financial Statements changes the accounting for investments in subsidiaries. Key changes include: the remeasurement to fair value of any previous/retained investment when control is obtained/lost, with any resulting gain or loss being recognised in profit or loss; and the treatment of increases in ownership interest after control is obtained as transactions with equity holders in their capacity as equity holders. The revised standard will become mandatory for the Bank’s 31 August 2010 financial statements. The Bank has not yet determined the potential effect of the revised standard on the Bank’s financial report;
AASB 2008-1 Amendments to Australian Accounting Standard - Share-based Payment: Vesting Conditions and Cancellations changes the measurement of share-based payments that contain non-vesting conditions. AASB 2008-1 becomes mandatory for the Bank’s 31 August 2010 financial statements. The Bank has not yet determined the potential effect of the amending standard on the Bank’s financial report;
AASB 2008-5, AASB 2008-6, AASB 2009-4, AASB 2009-5, AASB 2009-6 and AASB 2009-7 Amendments to Australian Accounting Standards arising from the Annual Improvements Project, makes amendments to a number of accounting standards. These standards become mandatory for the Bank’s 31 August 2010 financial statements. The Bank has not yet determined the potential effect of these amending standards on the Bank’s financial report;
Bank of Queensland Annual Report 200954

Notes to and Forming Part of the Financial StatementsYear ended 31 August 2009
3. Significant accounting policies (continued)
AASB 2008-7 Amendments to Australian Accounting Standards – Cost of an Investment in a Subsidiary, Jointly Controlled Entity or Associate makes the following changes: the definition of ‘cost method’ is removed; all dividends from subsidiaries, jointly controlled entities or associates to be recognised as income in the separate financial statements of the investor; receipt of dividend may be an indicator of impairment if certain criteria are met; and specified accounting for certain transaction where a newly formed entity become the new part of another entity in a group. AASB 2008-7 becomes mandatory for the Bank’s 31 August 2010 financial statements. The Bank has not yet determined the potential effect of the amending standard on the Bank’s financial report;
AASB 2008-8 Amendments to Australian Accounting Standards – Eligible Hedged Items clarifies the effect of using options as hedging instruments and the circumstances in which inflation risk can be hedged. The amendments become mandatory for the Bank’s 31 August 2010 financial statements, with retrospective application. The Bank has not yet determined the potential effect of the amendment; and
AASB 2009-2 Amendments to Australian Accounting Standards – Improving Disclosures about Financial Instruments. These amendments primarily require enhanced disclosures regarding fair value measurements and liquidity risk under AASB 7 Financial Instruments: Disclosures. The Bank has not yet determined the potential effect of the amendment.
Except as described in the subsequent notes, the accounting policies set out below have been applied consistently to all periods presented in the consolidated financial report, and have been applied consistently across the Consolidated Entity.
(a) Basis of consolidation
(i) Subsidiaries
Subsidiaries are entities controlled by the Bank. Control exists when the Bank has the power, directly or indirectly, to govern the financial and operating policies of an entity so as to benefit from its activities. In assessing control, potential voting rights that presently are exercisable or convertible are taken into account. The financial statements of subsidiaries are included in the consolidated financial report from the date that control commences until the date that control ceases. In the Bank’s financial statements, investments in subsidiaries are carried at cost.
(ii) Securitisation
The Bank conducts a loan securitisation program whereby mortgage loans are packaged and sold to the REDS Securitisation and Warehouse Trusts (“RMBS Trusts”).
The Bank also securitises Hire Purchase, Chattel Mortgages and Finance Leases which are packaged and sold to REDS EHP Securitisation Trusts (“REDS EHP Trusts”).
Consolidated Entity
The Consolidated Entity receives the residual income distributed by the RMBS Trusts after all payments due to investors and associated costs of the program have been met and as a result the Consolidated Entity is considered to control the RMBS Trusts and they are treated as controlled entities.
The RMBS Trusts fund their purchase of the loans by issuing floating-rate pass-through debt securities. The securities are issued by the RMBS Trusts. These are represented as other liabilities of the Consolidated Entity, however the Consolidated Entity does not stand behind the capital value or the performance of the securities or the assets of the RMBS Trusts. The Consolidated Entity does not guarantee the payment of interest or the repayment of principal due on the securities. The loans subject to the securitisation program have been pledged as security for the securities issued by the RMBS Trusts. The Consolidated Entity is not obliged to support any losses that may be suffered by investors and does not intend to provide such support.
The Bank also securitises Hire Purchase, Chattel Mortgages and Finance Leases to the REDS EHP Trusts. Where the residual income units in these trusts are held by external investors the trusts are not consolidated as the Consolidated Entity does not meet the conditions associated with control of an entity as defined by AASB 127 Consolidated and Separate Financial Statements and the original sale of these assets meets the de-recognition criteria set out in AASB 139.
To the extent that the Consolidated Entity does not substantially transfer all the risk and rewards associated with these assets, the level of the Consolidated Entity’s continuing involvement in these assets continues to be recognised.
55

Notes to and Forming Part of the Financial StatementsYear ended 31 August 2009
3. Significant accounting policies (continued)
(a) Basis of consolidation (continued)
Bank
Interest rate risk from the RMBS Trusts is transferred back to the Bank by way of interest rate swaps. Accordingly, under AASB 139 the original sale of the mortgages from the Bank to the RMBS Trusts does not meet the de-recognition criteria set out in AASB 139. The Bank continues to reflect the securitised loans in their entirety and also recognises a financial liability to the RMBS Trusts. The interest payable on the intercompany financial asset / liability represents the return on an imputed loan between the Bank and the RMBS Trusts and is based on the interest income under the mortgages, the fees payable by the RMBS Trusts and the interest income or expense not separately recognised under interest rate and basis swaps transactions between the Bank and the RMBS Trusts.
All transactions between the Bank and the RMBS Trusts are eliminated on consolidation.
(iii) Transactions eliminated on consolidation
Intragroup balances, and any unrealised gains and losses or income and expenses arising from intragroup transactions, are eliminated in preparing the consolidated financial statements.
Unrealised losses are eliminated in the same way as unrealised gains, but only to the extent that there is no evidence of impairment.
(iv) Derecognition of financial assets and liabilities
Financial assets are derecognised when the contractual rights to receive cash flows from the assets have expired, or where the Bank has transferred its contractual rights to receive the cash flows of the financial assets and has transferred substantially all the risks and rewards of ownership, or where control is not retained. Financial liabilities are derecognised when they are extinguished, i.e. when the obligation is discharged, cancelled or expired.
(b) Foreign currency
Foreign currency transactions
Transactions in foreign currencies are translated at the foreign exchange rate ruling at the date of the transaction. Monetary assets and liabilities denominated in foreign currencies at the balance sheet date are translated into Australian dollars at the foreign exchange rate ruling at that date. Foreign exchange differences arising on translation are recognised in the Income Statement.
Where a foreign currency transaction is part of a hedge relationship it is accounted for as above, subject to the Hedge Accounting rules set out in Note 3 (c) Derivative financial instruments and hedging.
(c) Derivative financial instruments and hedging
Treasury shares
Ordinary shares of the bank may be purchased from time to time by a subsidiary of the Bank authorised to do so under the Bank’s Award Rights Plan. Where these shares remain unvested to employees they are treated as treasury shares and deducted from capital as required by AASB 132 Financial Instruments: Presentation and Disclosure. No profit or loss is recorded on purchase, sale, issue or cancellation of these shares.
Derivatives
The Consolidated Entity uses derivative financial instruments to hedge its exposure to foreign exchange and interest rate risks arising from operating, financing and investing activities. In accordance with its treasury policy, the Consolidated Entity can hold derivative financial instruments for trading purposes. Also, derivatives that do not qualify for hedge accounting are accounted for as trading instruments.
Derivative financial instruments are recognised initially at trade date fair value and are subsequently remeasured at fair value at the reporting date. The gain or loss on re-measurement is recognised immediately in the Income Statement. However, when derivatives qualify for hedge accounting, recognition of any resultant gain or loss depends on the nature of the hedge relationship discussed below.
The fair value of interest rate swaps is the estimated amount that the Consolidated Entity would receive or pay to terminate the swap at the balance sheet date, taking into account current interest rates and the current creditworthiness of the swap counterparties. The fair value of forward exchange contracts is their quoted market price at the balance sheet date, being the present value of the quoted forward price. The fair value of futures contracts is their quoted market price.
All of the Bank’s hedging relationships are designated as cash flow hedges. The Bank has not designated any hedges as fair value hedges.
Bank of Queensland Annual Report 200956

Notes to and Forming Part of the Financial StatementsYear ended 31 August 2009
3. Significant accounting policies (continued)
(c) Derivative financial instruments and hedging (continued)
Cash flow hedges
Where a derivative financial instrument is designated as a hedge of the variability of the cash flows of a recognised asset or liability, or a highly probable forecasted transaction, the effective part of any gain or loss on the derivative financial instrument is recognised directly in equity. The ineffective part of any gain or loss is recognised immediately in the Income Statement. If a hedge of a forecasted transaction subsequently results in the recognition of a financial asset or a financial liability, then the associated gains and losses that were recognised directly in equity are reclassified into the Income Statement in the same period or periods in which the asset acquired or liability assumed affects the Income Statement (i.e. when interest income or expense is recognised).
When a hedging instrument expires or is sold, terminated or exercised, or the Consolidated Entity revokes designation of the hedge relationship but the hedged forecast transaction still is expected to occur, the cumulative gain or loss at that point remains in equity and is recognised in accordance with the above policy when the transaction occurs. If the hedged transaction is no longer expected to take place, then the cumulative unrealised gain or loss is recognised immediately in the Income Statement.
Financial investments
The Bank classifies its financial investments into one of the following two categories upon initial recognition:
(i) Financial assets at fair value through the Income Statement
Financial assets that are held as part of the Bank’s Trading Book (refer Note 11) are designated at fair value through the Income Statement if the Bank manages such financial assets and makes purchase and sale decisions based on their fair value in accordance with the Bank’s documented risk management or investment strategy. Upon initial recognition attributable transaction costs are recognised in the income statement when incurred. Financial instruments at fair value through the Income Statement are measured at fair value, and changes therein are recognised in the income statement.
(ii) Available-for-sale
Assets that are intended to be held for an indefinite period of time but which may be sold in response to changes in interest rates, exchange rates and liquidity needs are classified as available for sale. These assets are initially measured at fair value with any changes in fair value being recognised in equity until the asset is sold. Interest income received on these assets is recorded as net interest income and any realised gains or losses recorded in other revenue from other activities.
(d) Cash and Liquid assets
Cash and liquid assets comprise cash at branches, cash on deposit, balances with the Reserve Bank of Australia and money market deposits at call.
(e) Receivables due from other Banks
Receivables due from other banks are recognised and measured at amortised cost and include nostro balances (an account held with a foreign bank usually in a foreign currency) and settlement account balances.
Loans and advances at amortised cost(f)
Loans and advances are originated by the Bank and are recognised upon cash being advanced to the borrower. Loans and advances are initially recognised at fair value plus incremental direct transaction costs and subsequently measured at each reporting date at amortised cost using the effective interest method.
Refer Note 3 (j) for impairment of loans and advances.
Leases(g)
Finance Leases
Finance leases in which the Bank is the lessor, are recorded in the Balance Sheet as loans and advances at amortised cost. They are recorded on the commencement of the lease as the net investment in the lease, being the present value of the minimum lease payments.
The Consolidated Entity does not have finance leases as lessee.
Operating Leases
Operating leases in which the Bank is the lessee, are expensed on a straight-line basis over the term of the lease, except where an alternative basis is more representative of the pattern of benefits to be derived from the leased property. When an operating lease terminates before the lease period expires, any payment required to be made to the lessor by way of penalty, is recognised as an expense in the period in which termination takes place.
The Consolidated Entity does not have any operating leases as lessor.
57

Notes to and Forming Part of the Financial StatementsYear ended 31 August 2009
3. Significant accounting policies (continued)
Property, plant and equipment(h)
Recognition and initial measurement
Items of property, plant and equipment are stated at cost or deemed cost less accumulated depreciation and impairment losses. The cost of self-constructed assets includes the cost of materials, direct labour and an appropriate proportion of production overheads.
Subsequent Costs
Subsequent additional costs are only capitalised when it is probable that future economic benefits in excess of the originally assessed performance of the assets will flow to the Bank in future years. Where these costs represent separate components, they are accounted for as separate assets and are separately depreciated over their useful lives. Costs that do not meet the criteria for subsequent capitalisation are expensed as incurred.
Subsequent Measurement
The Bank has elected to use the cost model to measure property, plant and equipment after recognition. The carrying value is the initial cost less accumulated depreciation and any accumulated impairment losses.
Depreciation
Depreciation is charged to the Income Statement on a straight-line basis over the estimated useful lives of each part of an item of property, plant and equipment. Land is not depreciated.
The estimated useful lives in the current and comparative periods are as follows:
Years
Buildings 40
IT equipment 3 – 10
Plant, furniture and equipment 3 – 25
Leasehold improvements 10 (or term of lease if less)
The residual value, if not insignificant, is reassessed annually.
Intangible Assets(i)
Initial recognition and measurement
Intangible assets are stated at cost less any accumulated amortisation and any impairment losses. Expenditure on internally generated goodwill, research costs and brands is recognised in the Income Statement as an expense as incurred.
Subsequent expenditure
Subsequent expenditure on intangible assets is capitalised only when it increases the future economic benefits embodied in the specific asset to which it relates. All other expenditure is expensed as incurred.
Goodwill
Goodwill is the excess of the cost of acquisition over the fair value of the Bank’s share of the identifiable net assets of the acquired subsidiary. Any goodwill is tested annually for impairment, with any impairment taken directly to the Income Statement. Refer Note 3 (j).
Amortisation
Amortisation is charged to the Income Statement on a straight-line basis over the estimated useful life of the intangible asset unless the life of the intangible asset is indefinite. Where applicable, intangible assets are amortised from the date they are available for use. The amortisation period and method are reviewed on an annual basis.
The amortisation rates used in the current and comparative periods are as follows:
Years
Software 5-10
Customer related intangibles and brands 3-10
Technology Infrastructure 12
Bank of Queensland Annual Report 200958

Notes to and Forming Part of the Financial StatementsYear ended 31 August 2009
3. Significant accounting policies (continued)
Impairment(j)
The carrying value of the Bank’s assets are reviewed at each reporting date to determine whether there is any indication of impairment. If any such indication exists, the assets’ recoverable amount is estimated. For goodwill, the recoverable amount is estimated annually.
An impairment loss is recognised whenever the carrying amount of a non-financial asset or its cash generating unit exceeds its recoverable amount. Impairment losses are recognised in the Income Statement unless the asset has previously been revalued in which case the impairment loss is recognised as a reversal to the extent of that previous revaluation with any excess being recognised through the Income Statement.
Impairment losses recognised in respect of cash-generating units are allocated firstly to reduce the carrying amount of any goodwill allocated to the cash-generating unit (group of units), and secondly to reduce the carrying amount of the other assets in the unit (group of units) on a pro rata basis.
When a decline in the fair value of an available-for-sale financial asset has been recognised directly in equity and there is objective evidence that a loss event has occurred after the initial recognition of the asset, and the loss event has an impact on the future cashflow of the asset that can be reliably measured, the cumulative loss recognised directly in equity is recognised in the Income Statement even though the financial asset has not been derecognised. The amount of the cumulative loss that is recognised in the Income Statement is the difference between the acquisition cost and current fair value, less any impairment loss previously recognised in the Income Statement.
Calculation of recoverable amount
Receivables with a short duration are not discounted. The recoverable amount of other assets is the greater of their fair value less costs to sell and value in use. In assessing value in use, the estimated future cash flows are discounted to their present value using a pre-tax discount rate that reflects current market assessments of the time value of money and the risks specific to the asset.
The unwinding of the discount from initial recognition of impairment through to recovery of the written down amount is recognised through interest income.
Impairment of loans and advances
The Bank uses two methods for calculating impairment:
(i) Specific impairment provisions
Impairment losses on individually assessed loans and advances are determined on a case-by-case basis. If there is objective evidence that an individual loan or advance is impaired, then a specific provision for impairment is raised. The amount of the specific provision is based on the carrying amount of the loan or advance, including the security held against the loan or advance and the present value of expected future cash flows. Any subsequent write-offs for bad debts are then made against the specific provision for impairment.
The unwinding of the discount from initial recognition of impairment through to recovery of the written down amount is recognised through interest income.
(ii) Collective impairment provisions
Where no evidence of impairment has been identified for loans and advances, these loans and advances are grouped together on the basis of similar credit characteristics for the purpose of calculating a collective impairment loss. Collective impairment provisions are based on historical loss experience adjusted for current observable data. The amount required to bring the collective provision for impairment to its required level is charged to the Income Statement.
Financial Liabilities(k)
Financial liabilities including current accounts, deposits, subordinated notes and term deposits are initially recognised at fair value plus transaction costs that are directly attributable to the issue of the financial liability and are subsequently measured at amortised cost using the effective interest method.
Securitisation set-up costs relating to on-balance sheet assets are included with securitisation borrowings and amortisation is recorded as interest expense.
Employee benefits(l)
Wages, Salaries and Annual Leave(i)
Liabilities for employee benefits to wages, salaries and annual leave represents present obligations resulting from employees’ services provided up to the reporting date, calculated at undiscounted amounts based on remuneration wage and salary rates that the Bank expects to pay as at reporting date including related on-costs.
Long Service Leave(ii)
The provision for employee benefits to long service leave represents the present value of the estimated future cash outflows to be made resulting from employee’s services provided to reporting date. The provision is calculated using expected future increases in wage and salary rates including related on-costs, and expected settlement dates based on turnover history and is discounted using the rates attached to national government bonds at reporting date which most closely match the terms of maturity of the related liabilities.
59

Notes to and Forming Part of the Financial StatementsYear ended 31 August 2009
3. Significant accounting policies (continued)
(l) Employee benefits (continued)
Superannuation plan(iii)
The Bank contributes to a number of defined contribution superannuation plans which complies with the Superannuation Contributions Act Legislation. Contributions are charged against income as they are made.
Share based payments(iv)
The Bank operates the following equity-settled compensation plans:
Managing Director Option Plan (“MD plan”);
Senior Management Option Plan (“SMOP”); and
Award Rights Plan.
The above plans allow Bank employees to acquire shares in the Bank. The fair value of options and rights granted is recognised as an employee expense with a corresponding increase to the Employee Benefits Reserve. The fair value is measured at grant date and spread over the period during which the employees become unconditionally entitled to the options and rights. The fair value of the options and rights granted is measured using industry accepted option pricing methodologies, taking into account the terms and conditions upon which the options and rights are granted. The fair value of the options and rights is expensed over the vesting period. Where options and rights do not vest due to failure to meet a non market condition (e.g. employee service period) the expense is reversed. Where options and rights do not vest due to failure to meet a market condition (e.g. Total Shareholder Return test) the expense is not reversed.
Provisions(m)
A provision is recognised in the Balance Sheet when the Consolidated Entity has a present legal or constructive obligation as a result of a past event, and it is probable that an outflow of economic benefits will be required to settle the obligation. If the effect is material, provisions are determined by discounting the expected future cash flows at a pre-tax rate that reflects current market assessments of the time value of money and, when appropriate, the risks specific to the liability.
Preference Shares(n)
Preference share capital is classified as equity if it is non-redeemable or redeemable only at the Bank’s option, and any dividends are discretionary. Dividends thereon are recognised as distributions within equity upon declaration by the directors.
Preference share capital is classified as a liability if it is redeemable on a specific date or at the option of the shareholders, or if dividend payments are not discretionary. Dividends thereon are recognised as interest expense in the income statement as accrued.
Revenue(o)
Interest income and expense
Interest income and expense for all interest-bearing financial instruments are recognised in the Income Statement using the effective interest rates of the financial assets or financial liabilities to which they relate.
The effective interest rate is the rate that discounts estimated future cash payments or receipts through the expected life of the financial asset or financial liability or, where appropriate, a shorter period, to the net carrying amount of the financial asset or financial liability. When calculating the effective interest rate, the Bank estimates cash flows considering all contractual terms of the financial instrument but not future credit losses. The calculation includes all amounts paid or received by the Bank that are an integral part of the effective interest rate, including transaction costs and all other premiums or discounts. Transaction costs include loan acquisition costs such as commissions paid to Owner Managed Branches, Agents and other intermediaries.
Interest on impaired financial assets is recognised at the original effective interest rate of the financial asset applied to the carrying amount as reduced by any allowance for impairments.
Non-interest income
Non-yield related lending application fees received are recognised as income when the loan is disbursed or the commitment to lend expires.
Service fees that represent the recoupment of the costs of providing the service are recognised on an accruals basis when the service is provided.
Lending fees that are considered an integral part of the effective interest rate are recognised within interest revenue on an effective interest rate basis.
Fair value gains and losses from financial assets held at fair value are recognised in the Income Statement immediately.
Franchise fees received under Owner Managed Branch agreements are recognised as income upon the signing of an unconditional agreement.
Bank of Queensland Annual Report 200960

Notes to and Forming Part of the Financial StatementsYear ended 31 August 2009
3. Significant accounting policies (continued)
Income tax(p)
Income tax on the Income Statement for the periods presented comprises current and deferred tax. Income tax is recognised in the Income Statement except to the extent that it relates to items recognised directly in equity, in which case it is recognised in equity.
Current tax is the expected tax payable on the taxable income for the year, using tax rates enacted or substantially enacted at the Balance Sheet date, and any adjustment to tax payable in respect of previous years.
Deferred tax is provided using the liability method, providing for temporary differences between the carrying amounts of assets and liabilities for financial reporting purposes and the amounts used for taxation purposes. The amount of deferred tax provided is based on the expected manner of realisation or settlement of the carrying amount of assets and liabilities, using tax rates enacted or substantially enacted at the Balance Sheet date. A deferred tax asset is recognised only to the extent that it is probable that future taxable profits will be available against which the asset can be utilised. Deferred tax assets are reduced to the extent that it is no longer probable that the related tax benefit will be realised.
Tax Consolidation
The Bank is the head entity in the tax consolidated group comprising all the Australian wholly-owned subsidiaries. The implementation date for the tax-consolidated group was 1 September 2004.
Current tax expense/income, deferred tax liabilities and deferred tax assets arising from temporary differences of the members of the tax-consolidated group are recognised in the separate financial statements of the members of the tax-consolidated group using a ‘group allocation’ approach by reference to the carrying amounts in the separate financial statements of each entity and the tax values applying under tax consolidation.
Any current tax liabilities (or assets) and deferred tax assets arising from unused tax losses of the subsidiaries is assumed by the head entity in the tax consolidated group and are recognised as amounts payable (receivable) to (from) other entities in the tax-consolidated group in conjunction with any tax funding arrangement amounts (refer below). Any difference between these amounts is recognised by the Bank as an equity contribution, or distribution from the subsidiary.
The Bank recognises deferred tax assets arising from unused tax losses of the tax-consolidated group to the extent that it is probable that future taxable profits of the tax-consolidated group will be available against which the asset can be utilised.
Any subsequent period adjustments to deferred tax assets arising from unused tax losses as a result of revised assessments of the probability of recoverability is recognised by the head entity only.
Nature of tax funding and tax sharing arrangements
The Bank, in conjunction with other members of the tax-consolidated group, has entered into a tax funding agreement which sets out the funding obligations of members of the tax-consolidated group in respect of tax amounts. The tax funding agreement requires payments to/from the head entity equal to the current tax liability (asset) assumed by the head entity and any tax-loss deferred tax asset assumed by the head entity, resulting in the Bank recognising an inter-entity payable (receivable) equal in amount to the tax liability (asset) assumed.
Contributions to fund the current tax liabilities are payable as per the Tax Funding Arrangement and reflect the timing of the head entity’s obligation to make payments for tax liabilities to the relevant tax authorities.
The Bank, in conjunction with other members of the tax-consolidated group, has also entered into a Tax Sharing Agreement (“TSA”). The TSA provides for the determination of the allocation of income tax liabilities between the entities should the head entity default on its tax payment obligations. No amounts have been recognised in the financial statements in respect of this agreement as payment of any amounts under the TSA is considered remote.
Goods and services tax(q)
Revenues, expenses and assets are recognised net of the amount of goods and services tax (GST), except where the amount of GST incurred is not recoverable from the Australian Tax Office (ATO). In these circumstances the GST is recognised as part of the cost of acquisition of the asset or as part of the expense.
Receivables and payables are stated with the amount of GST included.
The net amount of GST recoverable from, or payable to, the ATO is included as a current asset or liability in the Balance Sheet.
Cash flows are included in the statements of cash flows on a gross basis. The GST components of cash flows arising from investing and financing activities which are recoverable from, or payable to, the ATO are classified as operating cash flows.
Earnings per share(r)
Basic earnings per share (“EPS”) is calculated by dividing the net profit attributable to members of the Consolidated Entity for the reporting period, after excluding any costs of servicing equity (other than ordinary shares), by the weighted average number of ordinary shares of the Bank, adjusted for any bonus issues.
Diluted EPS is calculated by dividing the basic EPS earnings, adjusted by the after tax effect of financing costs associated with dilutive potential ordinary shares and the effect on revenues and expenses of conversion to ordinary shares associated with dilutive potential ordinary shares, by the weighted average number of ordinary shares and dilutive potential ordinary shares adjusted for any bonus issue.
61

Notes to and Forming Part of the Financial StatementsYear ended 31 August 2009
3. Significant accounting policies (continued)
Business Combinations(s) The purchase method of accounting is used to account for the acquisition of subsidiaries by the Consolidated Entity.
The cost of an acquisition is measured as the fair value of the assets given, equity instruments issued and liabilities incurred or assumed by the Consolidated Entity, plus costs directly attributable to the acquisition. The subsidiary’s identifiable assets, liabilities and contingent liabilities are measured at their fair values at the acquisition date. If the cost of acquisition is more than the fair value of the Consolidated Entity’s share of the identifiable net assets acquired, the excess is recorded as goodwill. If the cost of the acquisition is less than the fair value of the net assets of the subsidiary acquired, the difference is recognised directly in the Income Statement.
General reserve for credit losses(t) The Bank is required by the Australian Prudential Regulation Authority (“APRA”) to maintain a general provision for credit losses. As the Bank is unable to hold a general provision under current accounting standards, the Bank has created a general reserve for credit losses. The general reserve for credit losses and collective provision for impairment are aggregated for the purpose of satisfying the APRA requirement for a general reserve for credit losses.
Investment in jointly controlled operations(u) The Bank has interests in joint ventures that are part of jointly controlled operations. The Bank’s investments in jointly controlled joint venture entities are accounted for under the equity method of accounting in the consolidated financial statements. These are entities in which the Bank has joint control over all operational decisions and activities.
Under the equity method, the investments in joint ventures are recognised at the cost of acquisition and the carrying value is subsequently adjusted by the Bank’s share of the joint venture entity’s profit or loss and movement in post-acquisition reserves, after adjusting to align the accounting policies with that of the Bank.
The Bank’s share of the joint venture entity’s net profit or loss is calculated based on the sale of land, together with any tax expense, and is brought to account based on the proportion of settled land sales contracts.
Consolidated Bank
4. Operating income2009
$m2008
$m2009
$m2008
$m
Interest income
Loans and advances 1,835.2 1,811.8 1,721.2 1,597.6
Securities at fair value 196.0 231.3 241.9 210.4
Total interest income 2,031.2 2,043.1 1,963.1 1,808.0
Interest expense
Retail deposits 722.6 731.7 713.2 617.2
Wholesale deposits and borrowings 827.5 890.3 875.5 901.0
Total interest expense 1,550.1 1,622.0 1,588.7 1,518.2
Net interest income 481.1 421.1 374.4 289.8
Income from operating activities
Other customer fees and charges 122.4 116.6 122.2 110.8
Securitisation income (1) 3.3 5.7 48.5 36.9
Net income / (loss) from financial instruments and derivatives at fair value 8.6 (8.9) 8.7 (4.7)
Commission – insurance and financial planning 8.9 9.8 7.0 5.5
Franchise fees 2.9 2.6 2.9 2.6
Management fee – controlled entities - - 26.9 24.9
Bad debts recovered 2.1 1.4 1.6 0.7
ATM branding royalties - 4.8 - 4.8
Foreign exchange income – customer based 5.3 4.8 5.3 4.8
Income from outside operating activities
Profit on sale of property, plant and equipment 0.5 2.3 0.5 0.3
Other income (2) 7.9 20.3 6.0 18.0
Share of fee revenue paid to Owner Managed Branches (14.0) (9.9) (14.0) (9.9)
Other operating income 147.9 149.5 215.6 194.7
Total operating income 629.0 570.6 590.0 484.5
(1) At a consolidated level represents securitisation income from the Bank’s leasing trusts which are not consolidated.(2) The prior year includes the gain on the Visa Initial Public Offering of $6.3m after tax.
Bank of Queensland Annual Report 200962

Notes to and Forming Part of the Financial StatementsYear ended 31 August 2009
Consolidated Bank
5. Expenses2009
$m2008
$m2009
$m2008
$mOperating expenses
Advertising 11.8 12.5 11.8 11.8
Commissions to Owner Managed Branches 6.8 10.2 6.8 10.2
Communications and postage 13.8 13.9 13.6 12.4
Printing and stationery 4.0 4.7 3.9 4.5
Non-lending losses 3.4 5.8 3.3 5.2
Processing costs 30.7 32.9 30.7 29.1
Amortisation – securitisation setup costs 1.8 1.7 0.5 0.8
Impairment (1) 13.2 - 7.8 -
Other operating expenses 13.1 12.8 12.6 12.6
98.6 94.5 91.0 86.6
Administrative expenses
Professional fees 9.8 6.3 9.5 5.8
Directors’ fees 1.3 1.0 1.3 1.0
Other 5.0 4.5 4.3 3.9
16.1 11.8 15.1 10.7
Computer costs
Data processing 44.5 46.8 44.5 45.5
Amortisation – computer software (intangible) 16.9 14.2 16.9 13.9
Amortisation – technology infrastructure (intangible) 1.5 1.5 1.5 1.5
Depreciation – IT equipment 1.5 2.0 1.5 1.5
64.4 64.5 64.4 62.4
Occupancy expenses
Lease rental 17.4 16.3 17.2 13.7
Depreciation of plant, furniture, equipment and leasehold improvements 5.1 3.9 5.1 3.1
Other 2.0 1.6 1.9 1.5
24.5 21.8 24.2 18.3
Employee expenses
Salaries and wages 99.2 96.6 96.0 84.3Superannuation contributions 9.5 10.7 9.2 9.6Fringe benefits tax 1.7 1.5 1.5 1.1Amounts set aside to provision for employee entitlements 0.6 3.1 0.4 2.2Payroll tax 6.0 5.2 5.7 4.4Equity settled transactions 4.9 5.2 4.9 5.2Other 3.9 5.2 3.9 4.8
125.8 127.5 121.6 111.6OtherAmortisation – acquired intangibles (2) 10.9 7.7 1.1 1.0Pioneer integration costs - 0.3 - 0.3Home integration costs (3) 10.8 13.6 3.3 3.5Restructuring expenses (4) 18.7 - 18.7 -Expenses 369.8 341.7 339.4 294.4
(1) Impairment primarily relating to property related equity investments.
(2) The prior period amortisation of acquired intangibles has been restated. Refer to Note 2(f).
(3) Relates to non-recurring integration costs associated with the acquisition of Home Building Society Ltd.
(4) Relates to the provision raised for the NSW distribution restructure and head office restructure.
63

Notes to and Forming Part of the Financial StatementsYear ended 31 August 2009
Consolidated Bank
6. Income tax expense2009
$m2008
$m2009
$m2008
$m
Recognised in the Income Statement
Current tax expense
Current year 50.5 45.3 59.2 39.1
Adjustments for prior years (2.4) (1.9) (2.5) (1.6)
48.1 43.4 56.7 37.5
Deferred tax expense
Origination and reversal of temporary differences 4.0 19.8 4.2 15.4
4.0 19.8 4.2 15.4
Total income tax expense in Income Statement 52.1 63.2 60.9 52.9
Attributable to:
Continuing Operations 52.1 63.2 60.9 52.9
Deferred tax recognised in equity
Equity raising costs (2.6) (1.9) (2.6) (1.9)
Cash flow hedge reserve (23.5) (14.5) (24.9) (14.3)
Other (0.6) (1.2) (1.0) (0.8)
(26.7) (17.6) (28.5) (17.0)
Numerical reconciliations between tax expense and pre-tax profit
Profit before tax - continuing operations 193.2 201.9 201.5 169.8
Profit before tax 193.2 201.9 201.5 169.8
Income tax using the domestic corporate tax rate of 30% (2008: 30%)57.9 60.6 60.4 50.9
Increase in income tax expense due to:
Non-deductible expenses 5.3 5.1 3.3 3.2
Decrease in income tax expense due to:
Research and development expenses - (0.5) - (0.5)
Tax exempt revenues (2.8) (2.3) - -
Investment allowance (4.8) - - -
55.6 62.9 63.7 53.6
Under / (Over) provided in prior years (3.5) 0.3 (2.8) (0.7)
Income tax expense on pre-tax net profit 52.1 63.2 60.9 52.9
Bank of Queensland Annual Report 200964

Notes to and Forming Part of the Financial StatementsYear ended 31 August 2009
7. Dividends
Bank
2009 2008
Cents per share $m
Percentage franked
%Cents per
share $m
Percentage franked
%
Ordinary shares
Final 2008 dividend paid 24 November 2008 (2008: 26 November 2007) 38 58.9 100% 37 42.5 100%
Interim 2009 dividend paid 19 May 2009 (2008: 16 May 2008) 26 44.8 100% 35 51.3 100%
103.7 93.8
Preference shares recognised as liabilities
RePS half-yearly dividend paid 15 October 2008 (2008: 15 October 2007)
257 1.2 100% 257 1.2 100%
S1RPS half-yearly dividend paid 20 October 2008 (2008: 22 October 2007)
261 1.7 100% 261 1.7 100%
RePS half-yearly dividend paid 15 April 2009 (2008: 15 April 2008)
255 1.2 100% 257 1.2 100%
S1RPS half-yearly dividend (2008: 21 April 2008) - - - 261 1.7 100%
4.1 5.8
Preference shares not recognised as liabilities
Half-yearly PEPS dividend paid on 15 October 2008 (2008: nil) 353 7.1 100% - - -
Half-yearly PEPS dividend paid on 15 April 2009 (2008: 15 April 2008) 265 5.3 100% 216 4.3 100%
12.4 4.3
All the franked dividends paid or declared by the Bank since the end of the previous financial year were franked at the prevailing tax rate of 30%.
Since the end of the financial year, the directors have declared the following dividends: Cents per share $m
Percentage franked
%Date of
payment
- RePS half-yearly dividend (BOQPA) 257 1.2 100% 15 October 2009
- PEPs half-yearly dividend (BOQPC) 180 3.6 100% 15 October 2009
- Final - ordinary shares (BOQ) 26 54.8 100% 1 December 2009
Bank
2009$m
2008$m
Dividend franking account
30% franking credits available to shareholders of the Bank for subsequent financial years 31.1 25.1
The above available amounts are based on the balance of the dividend franking account at year-end adjusted for:
franking debits that will arise from the refund of the amount of the current tax assets and franking credits arising from the payment of current tax (a) liabilities;
franking debits that will arise from the payment of dividends subsequent to year-end;(b)
franking credits that will arise from the receipt of dividends recognised as receivables at the year end; and(c)
franking credits that the entity may be prevented from distributing in subsequent years.(d)
The ability to utilise the franking credits is dependent upon there being sufficient available profits to declare dividends.
All the franked dividends paid or declared by the Bank since the end of the previous financial year were franked at the tax rate of 30%.
The balance of the Bank of Queensland Limited dividend franking account at the date of this report, after adjusting for franking credits and debits that will arise on payment of income tax and dividends relating to the year ended 31 August 2009, is $31.1 million credit calculated at the 30% tax rate (2008: $25.1 million credit).
It is anticipated, based on these franking account balances that the Bank will continue to pay fully franked dividends in the foreseeable future.
65

Notes to and Forming Part of the Financial StatementsYear ended 31 August 2009
Consolidated
8. Earnings per share2009cents
2008cents
Basic earnings per share 75.9c 94.4c
Diluted earnings per share 74.4c 89.6c
2009$m
2008$m
Earnings reconciliation
Net profit 141.1 138.7
Less other equity instrument dividends (12.4) (4.3)
Basic earnings 128.7 134.4
Effect of distributions on convertible preference shares 15.3 10.2
Diluted earnings 144.0 144.6
Consolidated
Weighted average number of shares used as the denominator2009
Number2008
Number (1)
Number for basic earnings per share
Ordinary shares 169,662,278 142,435,783
Number for diluted earnings per share
Ordinary shares 169,662,278 142,435,783
Effect of SMOP (2) 81 840,452
Effect of Managing Director options (3) - 251,244
Effects of converting preference shares 23,746,231 17,860,112
193,408,590 161,387,591
(1) Comparatives for basic and diluted earnings per share have been adjusted for the effect of the rights issue that occurred during the current financial year and up to the date of the issuance of this report.
(2) During the year 31,000 (2008: 2,824,736) options were converted into ordinary shares under the Senior Management Option Plan. The diluted EPS calculation includes that portion of these options assumed to be issued for nil consideration weighted with reference to the date of conversion. The weighted average number included is 81 (2008: 260,199).
(3) During the year no (2008: 500,000) options were converted into ordinary shares under the Managing Director Option Plan. The diluted EPS calculation includes that portion of these options assumed to be issued for nil consideration weighted with reference to the date of conversion. The weighted average number included is nil (2008: 166,978).
Consolidated Bank
9. Cash and liquid assets2009
$m2008
$m2009
$m2008
$m
Notes, coin and cash at bank 256.7 334.0 153.2 177.4
Bills receivable and remittances in transit 97.1 65.5 97.1 65.5
353.8 399.5 250.3 242.9
10. Due from other financial institutions
Term deposits 74.6 56.9 74.6 56.9
74.6 56.9 74.6 56.9
Bank of Queensland Annual Report 200966

Notes to and Forming Part of the Financial StatementsYear ended 31 August 2009
Consolidated Bank
11. Other financial assets2009
$m2008
$m2009
$m2008
$m
At fair value through income statement
Floating rates notes and bonds 936.0 435.6 936.0 435.6
Negotiable certificates of deposit 2,071.6 1,522.5 2,071.6 1,522.5
Deposits at call 275.1 152.4 275.1 217.4
Bank accepted bills 399.3 593.1 399.3 323.9
Promissory notes 370.5 139.7 370.5 139.7
4,052.5 2,843.3 4,052.5 2,639.1
Investment securities available for sale
Debt instruments 354.5 401.0 467.6 531.5
Unlisted equity instruments 16.3 19.6 16.3 10.0
370.8 420.6 483.9 541.5
Total other financial assets 4,423.3 3,263.9 4,536.4 3,180.6
12. Loans and advances at amortised cost
Residential property loans - secured by mortgages 13,706.3 12,441.5 13,713.1 10,487.4
Securitised residential property loans - secured by mortgages 6,929.8 5,960.4 6,929.8 5,589.5
Personal loans 360.1 457.5 360.1 380.7
Overdrafts 486.7 481.8 487.6 461.7
Commercial loans 4,247.0 3,956.8 4,247.0 3,768.9
Leasing finance 3,083.6 2,365.6 0.2 2.9
Gross loans and advances at amortised cost 28,813.5 25,663.6 25,737.8 20,691.1
Less:Unearned lease finance incomeCollective provision for impairmentSpecific provisions for impairment
(451.6)(21.7)(29.4)
(382.4)(15.7)(18.7)
-(17.8)(25.6)
(0.1)(9.8)
(11.7)
Total loans and advances at amortised cost 28,310.8 25,246.8 25,694.4 20,669.5
Loans and advances at amortised cost include the following finance lease receivables for leases of certain property and equipment where the Bank is the lessor:
Gross investment in finance lease receivables:
Less than one year 179.3 145.8 0.2 2.4
Between one and five years 2,824.6 2,127.7 - 0.5
More than five years 79.7 92.1 - -
3,083.6 2,365.6 0.2 2.9
Unearned finance income (451.6) (382.4) - (0.1)
Net investment in finance leases 2,632.0 1,983.2 0.2 2.8
The net investment in finance leases comprise:
Less than one year 174.4 137.4 0.2 2.3
Between one and five years 2,399.7 1,774.7 - 0.5
More than five years 57.9 71.1 - -
2,632.0 1,983.2 0.2 2.8
67

Notes to and Forming Part of the Financial StatementsYear ended 31 August 2009
12. Loans and advances at amortised cost (continued)
The securities issued under the REDS programs do not represent deposits or other liabilities of Bank of Queensland Limited or any other member of the Bank of Queensland group. Neither Bank of Queensland Limited nor any other member of the Bank of Queensland group in any way stands behind the capital value or performance of the REDS programs. The Bank does however provide the REDS programs with arm’s length services and facilities including the management and servicing of the leases securitised.
The Bank has no right to repurchase any of the securitised leases and no obligation to do so, other than in certain circumstances where there is a breach of warranty within 120 days of the sale or when certain criteria are met under the Clean up Provision per the Trust Deed Supplement.
Securitisation of leases
The Bank has entered into a securitisation program via the REDS EHP Trusts (“REDS EHP program”) whereby the Bank securitises chattel, hire purchase and finance leases.
Where the residual income units of the REDS EHP Trusts are held by external investors, these Trusts are not recognised on the balance sheet of the Bank as the original sale of these assets meet the de-recognition criteria set out in AASB 139 Financial Instruments: Recognition and Measurement. The assets of these Trusts are not consolidated under AASB 127 Consolidated and Separate Financial Statements as the Consolidated Entity does not meet the conditions associated with control of an entity. In the current year, Series 2008-1E EHP REDS Trust is recognised on the balance sheet as the residual income unit is not held by external investors. As at 31 August 2009, off balance sheet securitised leases under management amounted to $533.8m (2008: $1,006.3m).
Consolidated Bank
13. Provisions for impairment2009
$m2008
$m2009
$m2008
$m
Specific provision:
Balance at the beginning of the year 18.7 6.2 11.7 4.6
Add: Expensed during the year 60.0 24.3 46.4 17.1
Add: Acquired during the year (1) - 3.2 - -
Less: Amounts written off against specific provision (49.3) (15.0) (35.8) (10.0)
Transferred in from subsidiary - - 3.3 -
Balance at the end of the year 29.4 18.7 25.6 11.7
Collective provision:
Balance at the beginning of the year 15.7 7.7 9.8 6.6
Add: Expensed during the year 6.0 2.7 2.7 3.2
Add: Acquired during the year (1) - 5.3 - -
Transferred in from subsidiary - - 5.3 -
Balance at the end of the year 21.7 15.7 17.8 9.8
Total provisions for impairment 51.1 34.4 43.4 21.5
(1) Provisions acquired in the prior year relates to the acquisition of Home Building Society Ltd on 18 December 2007.
Bank of Queensland Annual Report 200968

Notes to and Forming Part of the Financial StatementsYear ended 31 August 2009
14. Property, plant and equipment
2009
Leasehold improvements
$m
Plant, furniture and equipment
$mIT equipment
$m
Capital works in progress
$mTotal$m
Consolidated
Cost
Balance at the beginning of the financial year 16.4 27.8 28.7 1.1 74.0
Additions 6.4 1.4 1.3 0.1 9.2
Disposals (3.4) (4.6) (0.9) - (8.9)
Transfers between categories 1.0 0.1 - (1.1) -
Balance at the end of the financial year 20.4 24.7 29.1 0.1 74.3
Depreciation
Balance at the beginning of the financial year 7.4 16.3 24.9 - 48.6
Depreciation charge for the year 3.3 1.8 1.5 - 6.6
Disposals (1.9) (2.8) (0.7) - (5.4)
Balance at the end of the financial year 8.8 15.3 25.7 - 49.8
Carrying amounts
Carrying amount at the beginning of the financial year 9.0 11.5 3.8 1.1 25.4
Carrying amount at the end of the financial year 11.6 9.4 3.4 0.1 24.5
Bank
Cost
Balance at the beginning of the financial year 14.6 22.9 27.8 1.1 66.4
Transferred from subsidiary 1.8 4.9 0.9 - 7.6
Additions 6.4 1.4 1.3 0.1 9.2
Disposals (3.4) (4.6) (0.9) - (8.9)
Transfers between categories 1.0 0.1 - (1.1) -
Balance at the end of the financial year 20.4 24.7 29.1 0.1 74.3
Depreciation
Balance at the beginning of the financial year 7.2 16.1 24.8 - 48.1
Transferred from subsidiary 0.2 0.2 0.1 - 0.5
Depreciation charge for the year 3.3 1.8 1.5 - 6.6
Disposals (1.9) (2.8) (0.7) - (5.4)
Balance at the end of the financial year 8.8 15.3 25.7 - 49.8
Carrying amounts
Carrying amount at the beginning of the financial year 7.4 6.8 3.0 1.1 18.3
Carrying amount at the end of the financial year 11.6 9.4 3.4 0.1 24.5
69

Notes to and Forming Part of the Financial StatementsYear ended 31 August 2009
14. Property, plant and equipment (continued)
2008Land$m
Buildings$m
Leasehold improvements
$m
Plant, furniture and equipment
$mIT equipment
$m
Capital works in progress
$mTotal$m
Consolidated
Cost
Balance at the beginning of the financial year
1.1 1.3 11.6 22.6 31.5 0.8 68.9
Acquired during the year (1) - - 1.8 3.4 1.7 - 6.9
Additions - 0.1 2.9 6.2 1.0 1.1 11.3
Disposals (1.3) (1.4) (0.5) (4.4) (5.5) - (13.1)
Transfers between categories 0.2 - 0.6 - - (0.8) -
Balance at the end of the financial year - - 16.4 27.8 28.7 1.1 74.0
Depreciation
Balance at the beginning of the financial year
- - 5.4 16.4 27.4 - 49.2
Depreciation charge for the year - - 2.3 1.6 2.0 - 5.9
Disposals - - (0.3) (1.7) (4.5) - (6.5)
Balance at the end of the financial year - - 7.4 16.3 24.9 - 48.6
Carrying amounts
Carrying amount at the beginning of the financial year
1.1 1.3 6.2 6.2 4.1 0.8 19.7
Carrying amount at the end of the financial year
- - 9.0 11.5 3.8 1.1 25.4
Bank
Cost
Balance at the beginning of the financial year
- - 11.6 22.0 29.8 0.8 64.2
Transferred from subsidiary - - - 0.6 1.6 - 2.2
Additions - 0.1 2.9 2.0 0.8 1.1 6.9
Disposals (0.2) (0.1) (0.5) (1.7) (4.4) - (6.9)
Transfers between categories 0.2 - 0.6 - - (0.8) -
Balance at the end of the financial year - - 14.6 22.9 27.8 1.1 66.4
Depreciation
Balance at the beginning of the financial year
- - 5.4 16.0 26.2 - 47.6
Transferred from subsidiary - - - 0.4 1.3 - 1.7
Depreciation charge for the year - - 2.1 1.0 1.5 - 4.6
Disposals - - (0.3) (1.3) (4.2) - (5.8)
Balance at the end of the financial year - - 7.2 16.1 24.8 - 48.1
Carrying amounts
Carrying amount at the beginning of the financial year
- - 6.2 6.0 3.6 0.8 16.6
Carrying amount at the end of the financial year
- - 7.4 6.8 3.0 1.1 18.3
(1) The increase in property, plant and equipment is due to the acquisition of Home Building Society Ltd on 18 December 2007.
Bank of Queensland Annual Report 200970

Notes to and Forming Part of the Financial StatementsYear ended 31 August 2009
15. Deferred tax assets and liabilities
Recognised tax assets and liabilities
Deferred tax assets and liabilities are attributable to the following:
Assets Liabilities Net
2009$m
2008$m
2009$m
2008$m
2009$m
2008$m
Consolidated
Accruals 0.7 1.0 - - 0.7 1.0
Capitalised expenditure - - (30.7) (24.4) (30.7) (24.4)
Intangibles 2.0 6.0 (0.4) (7.5) 1.6 (1.5)
Leasing 4.2 6.9 - - 4.2 6.9
Property, plant, equipment and software - - (14.5) (16.4) (14.5) (16.4)
Provision for impairment 15.3 9.1 - - 15.3 9.1
Provisions other 9.6 9.1 - - 9.6 9.1
Receivables - - (0.3) (4.3) (0.3) (4.3)
Unrealised trading gains - - (4.4) (6.2) (4.4) (6.2)
Unrealised trading losses 4.2 4.5 - - 4.2 4.5
Other 7.3 6.1 (6.0) (3.4) 1.3 2.7
Equity reserves 32.0 8.1 (5.7) - 26.3 8.1
Tax assets / (liabilities) 75.3 50.8 (62.0) (62.2) 13.3 (11.4)
Bank
Accruals 0.7 1.0 - - 0.7 1.0
Capitalised expenditure - - (27.5) (20.1) (27.5) (20.1)
Intangibles - - (0.4) (0.7) (0.4) (0.7)
Property, plant, equipment and software - - (14.5) (16.5) (14.5) (16.5)
Provision for impairment 13.0 6.5 - - 13.0 6.5
Provisions other 7.5 7.0 - - 7.5 7.0
Receivables - - (0.3) (4.3) (0.3) (4.3)
Unrealised trading gains - - (4.4) (6.2) (4.4) (6.2)
Unrealised trading losses 2.4 4.5 - - 2.4 4.5
Other 7.5 2.7 (0.1) - 7.4 2.7
Equity reserves 33.9 7.6 (5.7) - 28.2 7.6
Tax assets / (liabilities) 65.0 29.3 (52.9) (47.8) 12.1 (18.5)
16. Other assets
Consolidated Bank
2009$m
2008$m
2009$m
2008$m
Accrued interest 48.0 56.4 48.0 56.0
Other debtors and prepayments 56.3 94.3 173.1 200.0
104.3 150.7 221.1 256.0
71
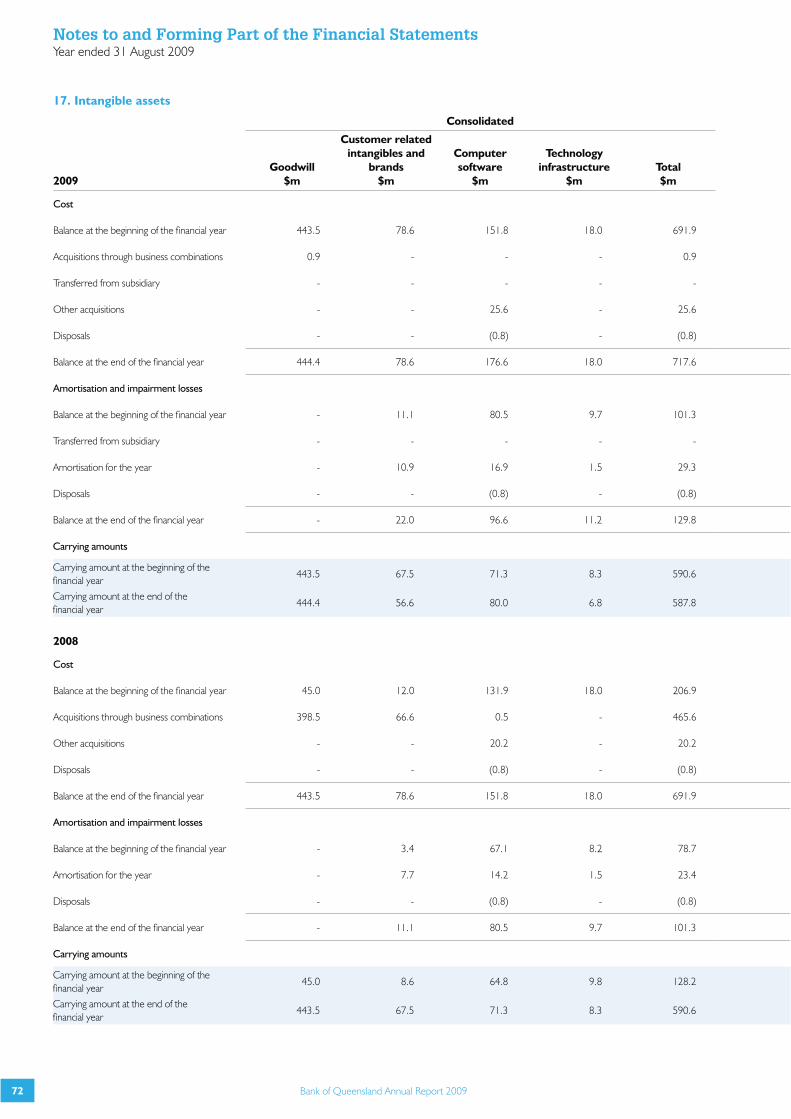
Notes to and Forming Part of the Financial StatementsYear ended 31 August 2009
17. Intangible assets
Consolidated
2009Goodwill
$m
Customer related intangibles and
brands$m
Computer software
$m
Technology infrastructure
$mTotal$m
Cost
Balance at the beginning of the financial year 443.5 78.6 151.8 18.0 691.9
Acquisitions through business combinations 0.9 - - - 0.9
Transferred from subsidiary - - - - -
Other acquisitions - - 25.6 - 25.6
Disposals - - (0.8) - (0.8)
Balance at the end of the financial year 444.4 78.6 176.6 18.0 717.6
Amortisation and impairment losses
Balance at the beginning of the financial year - 11.1 80.5 9.7 101.3
Transferred from subsidiary - - - - -
Amortisation for the year - 10.9 16.9 1.5 29.3
Disposals - - (0.8) - (0.8)
Balance at the end of the financial year - 22.0 96.6 11.2 129.8
Carrying amounts
Carrying amount at the beginning of the financial year
443.5 67.5 71.3 8.3 590.6
Carrying amount at the end of the financial year
444.4 56.6 80.0 6.8 587.8
2008
Cost
Balance at the beginning of the financial year 45.0 12.0 131.9 18.0 206.9
Acquisitions through business combinations 398.5 66.6 0.5 - 465.6
Other acquisitions - - 20.2 - 20.2
Disposals - - (0.8) - (0.8)
Balance at the end of the financial year 443.5 78.6 151.8 18.0 691.9
Amortisation and impairment losses
Balance at the beginning of the financial year - 3.4 67.1 8.2 78.7
Amortisation for the year - 7.7 14.2 1.5 23.4
Disposals - - (0.8) - (0.8)
Balance at the end of the financial year - 11.1 80.5 9.7 101.3
Carrying amounts
Carrying amount at the beginning of the financial year
45.0 8.6 64.8 9.8 128.2
Carrying amount at the end of the financial year
443.5 67.5 71.3 8.3 590.6
Bank of Queensland Annual Report 200972

Notes to and Forming Part of the Financial StatementsYear ended 31 August 2009
Bank
Goodwill$m
Customer contracts
$m
Computer software
$m
Technology infrastructure
$mTotal$m
8.1 5.0 151.4 18.0 182.5
- - - - -
- - 0.4 - 0.4
- - 25.6 - 25.6
- - (0.8) - (0.8)
8.1 5.0 176.6 18.0 207.7
- 2.7 80.3 9.7 92.7
- - 0.2 - 0.2
- 1.1 16.9 1.5 19.5
- - (0.8) - (0.8)
- 3.8 96.6 11.2 111.6
8.1 2.3 71.1 8.3 89.8
8.1 1.2 80.0 6.8 96.1
8.1 5.0 131.9 18.0 163.0
- - - - -
- - 20.2 - 20.2
- - (0.7) - (0.7)
8.1 5.0 151.4 18.0 182.5
- 1.7 67.1 8.2 77.0
- 1.0 13.9 1.5 16.4
- - (0.7) - (0.7)
- 2.7 80.3 9.7 92.7
8.1 3.3 64.8 9.8 86.0
8.1 2.3 71.1 8.3 89.8
73

Notes to and Forming Part of the Financial StatementsYear ended 31 August 2009
17. Intangible assets (continued)
Impairment testing of the cash generating unit containing goodwill
The aggregate carrying amounts of goodwill are:
Consolidated Bank
2009$m
2008$m
2009$m
2008$m
BOQ Equipment Finance Limited 12.9 12.9 - -
Orix debtor finance division 8.1 8.1 8.1 8.1
Pioneer Permanent Building Society Limited 24.0 24.0 - -
Home Building Society Ltd 399.4 398.5 - -
444.4 443.5 8.1 8.1
The cash generating unit (“CGU”) to which all goodwill has been allocated is the Consolidated Entity’s primary segment, retail banking.
The impairment test for goodwill is performed by comparing the CGU’s carrying amount with its recoverable amount. The recoverable amount is based on the CGU’s value in use.
Value in use was determined by discounting the future cash flows generated from the continued use of the CGU and was based on the following assumptions:
cash flows based on the Consolidated Entity’s 3 year projections;
a medium term growth rate of 10% for the 7 years subsequent to these projections;
a terminal value at year 10 based on a long term growth rate of 2.5% and a terminal price earnings multiple of 11.5 times earnings; and
a pre tax discount rate of 15.4%.
The values assigned to the key assumptions represent management’s assessments of future trends in retail banking and are based on both external sources and internal sources. The assumed medium term growth rate would need to reduce from 10% to 5.6% before the carrying value for the CGU would exceed its recoverable value.
18. Due to other financial institutions
Consolidated Bank
2009$m
2008$m
2009$m
2008$m
Amounts payable – at call 192.7 135.6 192.7 135.6
19. Deposits
Deposits at call 8,979.2 8,039.9 9,210.9 6,614.3
Term deposits 9,598.3 7,308.5 9,582.9 6,563.8
Certificates of deposit 5,619.7 4,688.1 5,619.7 4,742.0
Total 24,197.2 20,036.5 24,413.5 17,920.1
Concentration of deposits:
Retail deposits 16,248.9 13,984.5 16,481.8 11,849.3
Wholesale deposits 7,948.3 6,052.0 7,931.7 6,070.8
Total 24,197.2 20,036.5 24,413.5 17,920.1
Deposits are well-diversified across industries and regions. All deposits are sourced in Australia.
Bank of Queensland Annual Report 200974

Notes to and Forming Part of the Financial StatementsYear ended 31 August 2009
Consolidated Bank
2009$m
2008$m
2009$m
2008$m
20. Provisions
Employee benefits 10.6 13.2 10.6 11.0
Directors’ retiring allowance (1) 0.3 0.4 0.3 0.4
Leases 0.5 1.3 0.5 0.1
Restructuring (2) 1.1 - 1.1 -
Other 8.4 2.1 1.3 1.3
Total 20.9 17.0 13.8 12.8
(1) The directors’ retiring allowance has been frozen as at 31 August 2003 and will only be increased in line with CPI movements.
(2) Provision relates to the NSW distribution restructure and head office restructure.
Movements in provisions
Movements in each class of provision during the year, other than employee benefits, are as follows:
2009
Consolidated Bank
Leases$m
Restructuring (1)
$m Other
$mLeases
$mOther
$mRestructuring (1)
$m
Carrying amount at beginning of year 1.3 - 2.1 0.1 1.3 -
Transferred in from subsidiary - - - 0.4 - -
Additional provision recognised 0.2 18.7 7.1 0.2 0.3 18.7
Payments made (1.0) (17.6) (0.8) (0.2) (0.3) (17.6)
Carrying amount at end of year 0.5 1.1 8.4 0.5 1.3 1.1
2008
Consolidated Bank
Leases$m
Restructuring (1)
$m Other
$mLeases
$mOther
$m
Carrying amount at beginning of year 0.1 1.6 0.8 0.1 0.8
Additional provision recognised 0.1 0.4 0.5 0.1 0.5
Acquired during the period (2) 1.2 - 0.8 - -
Payments made (0.1) (2.0) - (0.1) -
Carrying amount at end of year 1.3 - 2.1 0.1 1.3
(1) Provision relates to the NSW distribution restructure and head office restructure and the prior year relates to integration costs associated with the acquisition of Pioneer Permanent Building Society Limited.
(2) Provision transferred in the current year relates to the integration of Home Building Society Ltd.
75

Notes to and Forming Part of the Financial StatementsYear ended 31 August 2009
21. Borrowings including subordinated notes
The Consolidated Entity recorded the following movements on borrowings including subordinated notes:
Securitisation liabilities (1)
$m
EMTN Program
$mECP Program
$m
Borrowings including
subordinated notes$m
Preference shares (2)
$m
Syndicated Loan$m
Total$m
Year ended 31 August 2009
Balance at beginning of year 6,018.7 464.4 558.8 425.7 111.9 - 7,579.5
Proceeds from issues 1,628.7 15.5 1,048.7 - - 311.7 3,004.6
Repayments (2,022.8) - (1,459.0) (80.0) (64.7) - (3,626.5)
Deferred establishment costs (5.8) - - - - - (5.8)
Amortisation of deferred costs 5.6 - - - - - 5.6
Foreign exchange translation (10.6) 13.1 15.9 - - 7.0 25.4
Balance at end of the year 5,613.8 493.0 164.4 345.7 47.2 318.7 6,982.8
Securitisation liabilities (1)
$m
EMTN Program
$m
ECP Program
$m
Borrowings including
subordinated notes$m
Preference shares (2)
$mTotal$m
Year ended 31 August 2008
Balance at beginning of year 4,375.8 853.1 398.4 265.0 111.9 6,004.2
Recognised on acquisition of Home 365.0 - - 46.0 - 411.0
Proceeds from issues 2,763.0 - 2,588.9 169.7 - 5,521.6
Repayments (1,522.3) (331.1) (2,479.9) (55.0) - (4,388.3)
Deferred establishment costs (7.3) - - - - (7.3)
Amortisation of deferred costs 2.9 - - - - 2.9
Foreign exchange translation 41.6 (57.6) 51.4 - - 35.4
Balance at end of the year 6,018.7 464.4 558.8 425.7 111.9 7,579.5
(1) Securitisation liabilities are secured by a floating charge over securitised assets for amounts owing to noteholders and any other secured creditors of the securitisation vehicles.
The Bank recorded the following movements on borrowings including subordinated notes:
EMTN Program
$m
ECP Program
$m
Borrowings including
subordinated notes$m
Preference shares (2)
$m
Syndicated Loan$m
Total$m
Year ended 31 August 2009
Balance at beginning of year 464.4 558.8 379.0 111.9 - 1,514.1
Proceeds from issues 15.5 1,048.7 46.7 (3) - 311.7 1,422.6
Repayments - (1,459.0) (80.0) (64.7) - (1,603.7)
Foreign exchange translation 13.1 15.9 - - 7.0 36.0
Balance at end of the year 493.0 164.4 345.7 47.2 318.7 1,369.0
(2) The Reset Preference Shares (“RePS”) do not give the holders any voting rights at any general shareholder meetings, except in certain special circumstances. In the event of the winding up of the Bank the holders of these preference shares rank before the holders of ordinary shares in relation to return on capital. Series 1 reset preference shares (S1RPS) were converted to ordinary shares.
(3) Transferred from subsidiary.
Bank of Queensland Annual Report 200976

Notes to and Forming Part of the Financial StatementsYear ended 31 August 2009
21. Borrowings including subordinated notes (continued)
The Bank recorded the following movements on borrowings including subordinated notes:
EMTN Program
$m
ECP Program
$m
Borrowings including
subordinated notes$m
Preference shares
$mTotal$m
Year ended 31 August 2008
Balance at beginning of year 853.1 398.4 265.0 111.9 1,628.4
Proceeds from issues - 2,588.9 169.0 - 2,757.9
Repayments (331.1) (2,479.9) (55.0) - (2,866.0)
Foreign exchange translation (57.6) 51.4 - - (6.2)
Balance at end of the year 464.4 558.8 379.0 111.9 1,514.1
22. Issued capital Note
Consolidated Bank
2009$m
2008$m
2009$m
2008$m
Issued and paid up capital
Ordinary Shares, fully paid (a) 1,707.4 1,243.7 1,707.7 1,243.7
Perpetual Equity Preference Shares, fully paid (b) 195.7 195.7 195.7 195.7
Balance at end of year 1,903.1 1,439.4 1,903.4 1,439.4
(a) Ordinary shares
Movements during the year
Balance at the beginning of the year – 149,947,719 (2008: 113,188,223), fully paid 1,243.7 615.7 1,243.7 615.7
Dividend reinvestment plan – 3,389,282 shares (2008: 2,572,109) 30.9 41.1 30.9 41.1
Share issued under an Underwriting Agreement – 4,259,053 shares (2008: 3,258,880) 36.6 52.7 36.6 52.7
Exercise of options – 31,000 shares (1) (2008: 3,324,736) 0.3 37.3 0.3 37.3
Conversion of Series 1 reset preference shares (S1RPS) to ordinary shares – 5,069,360 (2008: nil)
64.7 - 64.7 -
Home Acquisition – nil shares (2008: 27,603,771) (2) - 496.9 - 496.9
Share purchase plan and placement – 14,177,758 (2008: nil) (3) 106.7 - 106.7 -
Treasury Shares - 25,412 (2008: nil) (4) (0.6) - (0.3) -
Institutional placement and entitlements offer - 22,915,775 (2008: nil) (5) 225.1 - 225.1 -
Balance at the end of the year – 199,815,359 (2008: 149,947,719), fully paid 1,707.4 1,243.7 1,707.7 1,243.7
(1) Refer to Note 32 (c) for further information.
(2) Net of costs before tax of $4.4m.
(3) The share purchase plan commenced on 15 December 2008 and closed on 23 January 2009. Existing shareholders as at 10 December 2008 were eligible to purchase shares from a minimum of $1,000 to a maximum of $10,000. The issue price was the lesser of a 7.5% discount to the volume weighted average market price over the five business days before and including the closing date of the new shares being issued or $10.08 which was the approximate price at which shares were issued under the Bank’s most recent dividend reinvestment plan issue and partial underwriting. 5,781,993 shares were issued under this plan at an issue price of $7.64. On 3 February 2009, the Bank completed a placement of 8,395,765 ordinary shares at $7.64 to a range of institutional investors. The amount raised is net of costs of $2.6m before tax.
(4) Treasury shares represent the value of shares held by a subsidiary that the Bank is required to include in the Consolidated Entity’s financial statements. No gain or loss is recognised in profit or loss on the purchase, sale, issue or cancellation of the Bank’s own equity instruments. The amount includes costs of $0.4m before tax.
(5) The institutional placement and entitlements offer was announced on 19 August 2009 and settled on the 31 August 2009. The entitlement offer was a 1-for-9 accelerated pro rata non-renounceable entitlement offer. Institutional investors settled their right at 31 August 2009 at an issue price of $10.00. The issue price was at an 11.5% discount to the last closing price of BOQ shares on Tuesday, 18 August 2009 and a 9.8% discount to the theoretical ex-rights price. The amount raised is net of costs of $5.6m before tax. The retail entitlement offer settled on 18 September 2009.
Terms and conditions
Holders of ordinary shares are entitled to receive dividends as declared from time to time and are entitled to one vote per share at shareholders’ meetings.
In the event of winding up of the Bank, ordinary shareholders rank after RePS and PEPS shareholders and creditors and are fully entitled to any proceeds of liquidation.
77

Notes to and Forming Part of the Financial StatementsYear ended 31 August 2009
22. Issued capital (continued)
Consolidated Bank
2009$m
2008$m
2009$m
2008$m
(b) Perpetual Equity Preference Shares (“PEPS”)
Balance at beginning of the year – 2,000,000 (2008: nil) (1) 195.7 195.7 195.7 195.7
Balance at end of the year – 2,000,000 (2008: 2,000,000), fully paid 195.7 195.7 195.7 195.7
(1) Net of costs before tax of $5.9m.
Terms and conditions
The PEPS are fully paid, redeemable, perpetual, non-cumulative preference shares. Dividends are non-cumulative and payable semi-annually at the discretion of directors and subject to certain conditions being met, such as sufficient distributable profit. BOQ is entitled to redeem, buy-back or cancel the preference shares on a call date (5 years from issue date) and each subsequent dividend payment date, subject to the prior written approval from APRA. BOQ is also entitled to redeem the preference shares on the occurrence of a regulatory event, tax event or a control event. The preference shareholders have no right to demand redemption of the preference shares but they are entitled to receive a liquidation amount being equal to the issue price plus all dividends due but unpaid. PEPS are subordinate to all creditors and depositors, holders of RePS, and rank ahead of ordinary shareholders for return of capital on liquidation.
23. Reserves and retained profits
Consolidated
Employee benefits reserve
$m
General reserve for
credit losses$m
Cashflow hedge reserve
$m
Available for sale reserve
$mTotal reserves
$m
Retained profits
$m
2009
Balance at beginning of year 21.3 57.9 (17.7) (1.2) 60.3 191.2
Total recognised income and expense - - (73.7) (1.4) (75.1) 141.1
Dividends to ordinary shareholders - - - - - (103.7)
Dividends to PEPS - - - - - (12.4)
Equity settled transactions 6.9 - - - 6.9 -
Transfers - 25.3 - - 25.3 (25.3)
Balance at end of year 28.2 83.2 (91.4) (2.6) 17.4 190.9
2008
Balance at beginning of year 16.1 57.5 12.4 1.6 87.6 151.0
Total recognised income and expense - - (30.1) (2.8) (32.9) 138.7
Dividends to ordinary shareholders - - - - - (93.8)
Dividends to PEPS - - - - - (4.3)
Equity settled transactions 5.2 - - - 5.2 -
Transfers - 0.4 - - 0.4 (0.4)
Balance at end of year 21.3 57.9 (17.7) (1.2) 60.3 191.2
Bank of Queensland Annual Report 200978

Notes to and Forming Part of the Financial StatementsYear ended 31 August 2009
23. Reserves and retained profits (continued)
Bank
Employee benefits reserve
$m
General reserve for
credit losses$m
Cashflow hedge reserve
$m
Available for sale reserve
$mTotal reserves
$m
Retained profits
$m
2009
Balance at beginning of year 21.3 44.3 (20.1) 0.7 46.2 164.0
Total recognised income and expense - - (76.4) (2.3) (78.7) 140.6
Dividends to ordinary shareholders - - - - - (103.7)
Dividends to PEPS - - - - - (12.4)
Equity settled transactions 6.9 - - - 6.9 -
Transfers - 21.3 - - 21.3 (21.3)
Balance at end of year 28.2 65.6 (96.5) (1.6) (4.3) 167.2
2008
Balance at beginning of year 16.1 49.2 13.8 1.6 80.7 140.3
Total recognised income and expense - - (33.9) (0.9) (34.8) 116.9
Dividends to ordinary shareholders - - - - - (93.8)
Dividends to PEPS - - - - - (4.3)
Equity settled transactions 5.2 - - - 5.2 -
Transfers - (4.9) - - (4.9) 4.9
Balance at end of year 21.3 44.3 (20.1) 0.7 46.2 164.0
24. Segment reporting
Business segments
The Consolidated Entity comprises one segment, this being the provision of retail banking services and products. This determination is based on the risks involved with the provision of these services and products and the Consolidated Entity’s management reporting system.
Geographical segments
The Consolidated Entity’s business segment operates principally in Australia, with the majority of customers being in Queensland, with the exception of leasing assets which are spread throughout Australia and New Zealand.
25. Risk management
The Bank adopts a “managed risk” approach to its banking and trading activities. As such, the articulation of a risk aware culture is prevalent throughout the Bank’s credit, liquidity, market, operational risk and compliance policies and procedures. The Board has adopted policies in relation to the assessment, management and monitoring of these risks and ownership of the frameworks within which these risks are managed, reside with the Group Executive, Group Risk.
Group Executive, Group Risk contributes towards the achievement of the Bank’s corporate objectives through the operationalisation and progressive development of the group’s risk management function. In particular, improvement of the risk management function is focussed in a number of areas:
the efficiency and effectiveness of the Bank’s credit, liquidity, market, operational risk and compliance management process controls and 1. policies to support improved competitive advantage, support growth and enable improved cost controls;
to provide management and the Board with risk reporting that contributes to the further development of sound corporate governance 2. standards;
to maintain regulatory compliance in line with regulators’ expectations;3.
to provide a sound basis from which the Bank can progress to the required compliance level under the Basel II accord; and 4.
to contribute to the Bank achieving risk based performance management.5.
Group Risk is an independent function and is responsible for providing the framework, policies and procedures for managing credit, liquidity, market, operational risk and compliance throughout the Bank. Policies are set in line with the governing strategy and risk guidelines set by the Board.
79

Notes to and Forming Part of the Financial StatementsYear ended 31 August 2009
25. Risk management (continued)
Market risk(a)
Market risk is the risk that movements in market rates and prices will result in profits or losses to the Bank.
(i) Interest rate risk management
The management of interest rate market risk is separated into balance sheet (non-traded) and traded market risk.
Balance sheet (non-traded) market risk
The operations of the Bank are subject to the risk of interest rate fluctuations as a result of mismatches in the timing of the repricing of interest rates on the Bank’s assets and liabilities.
It is the principal objective of the Bank’s asset/liability management process to maximise levels of net interest income whilst limiting the effects of volatile and unpredictable movements in interest rates. To achieve these objectives, the Bank uses derivative financial instruments, principally interest rate swaps, forward rate agreements and futures.
The current policy of the Bank is to eliminate market risk in the balance sheet where practical and to consciously establish specific positions within conservative limits for changes in value of the residual risk.
A 1% parallel shock in the yield curve is used to determine the potential adverse change in net interest income in the ensuing 12 month period. This is a standard risk quantification measure used by the Bank. A number of supplementary scenarios comprising variations in size and duration of interest rate moves together with changes in the balance sheet size and mix are also used to provide a range of net interest income outcomes.
The figures in the table below indicate the potential change in net interest income for an ensuing 12 month period. The change is expressed as a percentage and dollar impact of expected net interest earnings based on a 1% parallel adverse shock.
Consolidated and Bank2009
%2008
%2009
$m2008
$m
Exposure at the end of the year 3.37 0.43 20.6 2.1
Average monthly exposure during the year 1.79 1.02 11.0 4.9
High month exposure during the year 3.87 1.83 23.7 8.8
Low month exposure during the year 0.48 0.30 2.9 1.5
Traded market risk
Traded market risk is primarily measured and monitored using a value-at-risk (“VaR”) analysis. VaR is a statistical technique that estimates the potential losses that could occur on risk positions taken due to movements in market rates and prices over a specified holding period and to a given level of confidence. The Bank uses a 1-day holding period and a 99% confidence level.
As VaR is a statistical measure and only attempts to cover losses to a 99% confidence level, the Bank supplements this analysis with stress testing. Stress testing attempts to adequately assess the risks inherent in its trading activities by applying appropriate scenario analyses.
The VaR for the Bank’s trading portfolio for the year was as follows:
Trading VaR2009
$m2008
$m
Average 0.45 0.28
Maximum 0.85 0.52
Minimum 0.12 0.08
(ii) Foreign exchange risk
It is the Bank’s policy not to carry material foreign exchange rate exposures. At balance date there are no material foreign exchange rate exposures.
The Bank uses cross currency swaps and foreign exchange forwards to hedge its exchange rate exposures arising from borrowing off-shore in foreign currencies. The Bank uses forward foreign exchange contracts to hedge potential exchange rate exposures created by customer-originated foreign currency transactions.
Bank of Queensland Annual Report 200980

Notes to and Forming Part of the Financial StatementsYear ended 31 August 2009
25. Risk management (continued)
Credit risk (b)
Credit risk arises in the business from lending activities, the provision of guarantees including letters of credit and commitments to lend, investment in bonds and notes, financial market transactions and other associated activities. Credit risk is the potential loss arising from the possibility that customers or counterparties fail to meet contractual payment obligations to the Bank as they fall due.
The Board of Directors have implemented a structured framework of systems and controls to monitor and manage credit risk comprising:
documented credit risk management principles which are disseminated to all staff involved with the lending process;
documented policies;
a process for approving risk, based on tiered delegated approval authorities, whereby the largest exposures are jointly assessed by the Managing Director and the Group Executive Group Risk;
risk grading the Bank’s commercial exposures for facilities greater than $100,000 based on items inclusive of financial performance and stability, organisational structure, industry segment and security support. Exposures within this segment of the portfolio are generally subject to annual review including reassessment of the assigned risk grade;
an automated scorecard approval model for the Bank’s retail portfolio inclusive of home loans, personal loans, lines of credit and credit cards. This model is supported by experienced Risk Assessment Managers; and
a series of management reports detailing industry concentrations, counterparty concentrations, loan grades and security strength ratings.
The Bank has adopted a policy of only dealing with creditworthy counterparties and obtaining sufficient collateral where appropriate, as a means of mitigating the risk of financial loss from defaults.
The Consolidated Entity uses derivative financial instruments to hedge its exposure to foreign exchange and interest rate risks arising from operating, financing and investing activities. In accordance with its treasury policy, the Consolidated Entity can hold derivative financial instruments for trading purposes. Credit risk on derivative contracts is minimised as counterparties are recognised financial intermediaries with acceptable credit ratings determined by a recognised rating agency.
Maximum exposure to credit risk
The amounts disclosed are the maximum exposure to credit risk, before taking account of any collateral held or other credit enhancements. For financial assets recognised on the balance sheet, the exposure to credit risk equals their carrying amount. For customer commitments, the maximum exposure to credit risk is the full amount of the committed facilities as at reporting date.
The carrying amount of the Consolidated Entity’s and Bank’s financial assets represents the maximum credit exposure. The maximum exposure to credit risk at the reporting date was:
Consolidated Bank
2009$m
2008$m
2009$m
2008$m
Cash and liquid assets 353.8 399.5 250.3 242.9
Due from other financial institutions 74.6 56.9 74.6 56.9
Other assets 4,471.3 3,320.3 4,584.4 3,236.6
Derivative financial instruments 88.5 111.7 58.7 74.9
Financial assets other than loans and advances 4,988.2 3,888.4 4,968.0 3,611.3
Gross loans and advances at amortised cost 28,813.5 25,663.6 25,737.8 20,691.1
Total financial assets 33,801.7 29,552.0 30,705.8 24,302.4
Customer commitments (1) 1,175.4 1,453.7 722.7 953.1
Total potential exposure to credit risk 34,977.1 31,005.7 31,428.5 25,255.5
(1) Refer to Note 31 for full details of customer commitments.
81

Notes to and Forming Part of the Financial StatementsYear ended 31 August 2009
25. Risk management (continued)
(b) Credit risk (continued)
Distribution of financial assets by credit quality
Consolidated Bank
2009$m
2008$m
2009$m
2008$m
Neither past due or impaired
Gross loans and advances at amortised cost 27,503.6 24,622.6 24,590.7 19,840.3
Financial assets other than loans and advances 4,988.2 3,888.4 4,968.0 3,611.3
Past due but not impaired
Gross loans and advances at amortised cost 1,192.5 1,009.4 1,045.8 827.1
Impaired
Gross loans and advances at amortised cost 117.4 31.6 101.3 23.7
33,801.7 29,552.0 30,705.8 24,302.4
There is no item included in impaired assets which exceeds 5.0% of shareholders’ equity (2008: nil).
The Bank holds collateral against loans and advances to customers in the form of mortgage interest over property, other registered securities over assets and guarantees and mortgage insurance. Estimates of fair value are based on the value of collateral assessed at the time of borrowing, and generally are not updated except when a loan is individually assessed as impaired. An estimate of the collateral held against past due but not impaired and impaired loans and advances at amortised cost was:
Consolidated Bank
2009$m
2008$m
2009$m
2008$m
Held against past due but not impaired assets 1,236.1 1,093.8 1,090.1 906.0
Held against impaired assets 88.0 12.9 75.7 12.0
Credit quality
The credit quality of our financial assets has been determined based on Standard and Poors credit ratings, APRA risk weightings and the Bank’s standard risk grading.
The table below presents the analysis of the Bank’s financial asset credit quality:
Consolidated
2009$m
2008$m
Gross loans and advances Gross loans and advances
Retail Commercial Total loans
and advances
Financial assets other than loans
and advances Retail Commercial Total loans
and advances
Financial assets other than loans
and advances
High Grade 17,175.5 1,610.5 18,786.0 4,954.9 15,609.9 1,269.6 16,879.5 3,842.9
Satisfactory 3,162.7 4,802.8 7,965.5 5.1 2,631.0 4,348.5 6,979.5 8.0
Weak 457.2 917.3 1,374.5 28.2 330.8 704.3 1,035.1 37.5
Unrated (1) 687.5 - 687.5 - 769.5 - 769.5 -
21,482.9 7,330.6 28,813.5 4,988.2 19,341.2 6,322.4 25,663.6 3,888.4
Bank of Queensland Annual Report 200982

Notes to and Forming Part of the Financial StatementsYear ended 31 August 2009
25. Risk management (continued)
(b) Credit risk (continued)
Bank
2009$m
2008$m
Gross loans and advances Gross loans and advances
Retail Commercial Total loans
and advances
Financial assets other than loans
and advances Retail Commercial Total loans
and advances
Financial assets other than loans
and advances
High Grade 17,175.5 1,495.7 18,671.2 4,873.3 13,441.9 1,148.7 14,590.6 3,512.6
Satisfactory 3,170.4 2,547.1 5,717.5 5.1 2,476.0 2,582.0 5,058.0 8.0
Weak 457.2 204.4 661.6 89.6 328.9 41.1 370.0 90.7
Unrated (1) 687.5 - 687.5 - 672.5 - 672.5 -
21,490.6 4,247.2 25,737.8 4,968.0 16,919.3 3,771.8 20,691.1 3,611.3
(1) Those items that remain unrated for retail gross loans and advances represent mainly personal loans and advances, which although are not secured, are not determined to be weak. Any loans which have been rated, have been included in the appropriate category.
Restructured / Renegotiated Loans
Generally, the terms of consumer loans are primarily renegotiated on a temporary basis in the event of customer hardship. Should temporary hardship conditions need to be extended, some examples of assistance offered include:
The carrying value of consumer loans that would otherwise be past due or impaired whose terms have been re-negotiated is considered immaterial.
Where business loans require restructuring, and the borrowing would not normally be entertained if it were from a customer new to the Bank, extended repayment terms and concessional interest rates may apply.
The carrying value of business loans that would otherwise be past due or impaired whose terms have been restructured, is considered minimal.
Loans and advances which were past due but not impaired
Loans which are 90 or more days past due are not classified as impaired assets where the estimated net realisable value of the security is sufficient to cover the repayment of all principal and interest amounts due. No losses are anticipated from these loans as they are adequately secured, for housing products usually by residential mortgage, and are spread across a range of customer and product groups.
Consolidated Bank
2009$m
2008$m
2009$m
2008$m
Less than 30 days 762.1 564.9 672.4 425.3
31 to 90 days 238.4 287.1 200.0 262.7
More than 90 days 192.0 157.4 173.4 139.1
1,192.5 1,009.4 1,045.8 827.1
Income received on impaired assets
Consolidated Bank
2009$m
2008$m
2009$m
2008$m
Income received on impaired assets for the year:
Gross interest receivable 2.8 1.1 2.8 1.1
Less : Interest foregone (2.8) (1.1) (2.8) (1.1)
Interest taken to account - - - -
83

Notes to and Forming Part of the Financial StatementsYear ended 31 August 2009
25. Risk management (continued)
(b) Credit risk (continued)
Concentration of exposure for gross loans and advances at amortised cost
Concentration of credit risk exists when a number of counterparties are engaged in similar activities, or operate in the same geographical areas or industry sectors and have similar economic characteristics so that their ability to meet contractual obligations is similarly affected by changes in economic, political or other conditions.
The Bank monitors concentrations of credit risk by geographical location for loans and advances. An analysis of these concentrations of credit risk at balance sheet date is shown below:
Consolidated Bank
Geographical concentration of credit risk for loans and advances at amortised cost (before provisions and unearned income):
2009$m
2008$m
2009$m
2008$m
Queensland 18,575.7 16,750.7 17,428.4 16,013.1
New South Wales 3,481.9 2,885.0 2,947.0 2,445.9
Victoria 3,230.4 2,324.4 2,490.1 1,679.1
Northern Territory 75.3 59.7 71.9 54.2
Australian Capital Territory 354.4 288.8 181.2 159.0
Western Australia 2,760.5 3,091.9 2,482.1 272.7
South Australia 147.7 116.0 48.4 27.7
Tasmania 92.7 45.4 88.7 39.4
International (New Zealand) 94.9 101.7 - -
28,813.5 25,663.6 25,737.8 20,691.1
Liquidity risk(c)
Liquidity risk arises from the possibility that the Bank is unable to meet its financial obligations as they fall due. Liquidity risk is managed through a series of detailed policies, including the management of cash flow mismatches, the maintenance of a stable, core retail deposits base, the diversification of the funding base and the retention of adequate levels of high quality liquid assets.
The Consolidated Entity manages liquidity risk by maintaining adequate reserves and facilities by continuously monitoring forecast and actual cash flows and matching maturity profiles of financial assets and liabilities.
Consolidated2009
Carrying amount
$mAt Call
$m3 mths or less
$m3 to 12 mths
$m1 to 5 years
$mOver 5 years
$m
Total contractual cash flows
$m
Financial liabilities
Due to other financial institutions
192.7 192.7 - - - - 192.7
Deposits 24,197.2 8,350.5 9,888.7 3,916.5 2,532.4 - 24,688.1
Derivative financial instruments(1) 1.6 0.1 0.6 0.9 - - 1.6
Accounts payable and other liabilities
277.6 - 277.6 - - - 277.6
Securitisation liabilities (2) 5,613.8 - 357.4 2,749.0 1,977.0 727.5 5,810.9
Borrowings including subordinated notes
1,321.8 - 168.9 521.8 721.2 - 1,411.9
Preference shares 47.2 - 1.2 1.2 48.4 - 50.8
Total 31,651.9 8,543.2 10,694.4 7,189.4 5,279.0 727.5 32,433.6
(1) Derivative financial instruments other than those designated in a cashflow hedge relationship.
(2) Repayment of securitisation bonds is forecast based on the expected repayment profile of the underlying assets of the trusts.
Bank of Queensland Annual Report 200984

Notes to and Forming Part of the Financial StatementsYear ended 31 August 2009
25. Risk management (continued)
(c) Liquidity risk (continued)
Consolidated2009
Carrying amount
$mAt Call
$m3 mths or less
$m3 to 12 mths
$m1 to 5 years
$mOver 5 years
$m
Total contractual cash flows
$m
Derivative financial instruments (hedging relationship)
Contractual amounts payable - (0.5) (303.8) (702.6) (634.2) (2.9) (1,644.0)
Contractual amounts receivable - 0.9 347.4 836.7 746.7 5.5 1,937.2
119.1 0.4 43.6 134.1 112.5 2.6 293.2
Consolidated2008
Carrying amount
$mAt Call
$m3 mths or less
$m3 to 12 mths
$m1 to 5 years
$mOver 5 years
$m
Total contractual cash flows
$m
Financial liabilities
Due to other financial institutions
135.6 135.6 - - - - 135.6
Deposits 20,036.5 6,862.3 8,333.4 4,479.8 817.6 - 20,493.1
Derivative financial instruments (1) 3.8 - 0.5 3.3 - - 3.8
Accounts payable and other liabilities
296.5 - 296.5 - - - 296.5
Securitisation liabilities (2) 6,018.7 - 576.3 3,215.9 2,517.2 630.7 6,940.1
Borrowings including subordinated notes
1,448.9 - 590.3 82.3 914.7 - 1,587.3
Preference shares 111.9 - 67.6 1.2 50.8 - 119.6
Total 28,051.9 6,997.9 9,864.6 7,782.5 4,300.3 630.7 29,576.0
Derivative financial instruments (hedging relationship)
Contractual amounts payable - (1.0) (696.0) (430.0) (1,154.0) (4.0) (2,285.0)
Contractual amounts receivable - 1.0 670.0 469.0 1,121.0 4.0 2,265.0
0.2 - (26.0) 39.0 (33.0) - (20.0)
(1) Derivative financial instruments other than those designated in a cashflow hedge relationship.
(2) Repayment of securitisation bonds is forecast based on the expected repayment profile of the underlying assets of the trusts.
85

Notes to and Forming Part of the Financial StatementsYear ended 31 August 2009
25. Risk management (continued)
(c) Liquidity risk (continued)
Bank2009
Carrying amount
$mAt Call
$m3 mths or less
$m3 to 12 mths
$m1 to 5 years
$mOver 5 years
$m
Total contractual cash flows
$m
Financial liabilities
Due to other financial institutions 192.7 192.7 - - - - 192.7
Deposits 24,413.5 8,566.7 9,888.7 3,916.5 2,532.4 - 24,904.3
Derivative financial instruments(1) 1.6 0.1 0.6 0.9 - - 1.6
Accounts payable and other liabilities
246.5 - 246.5 - - - 246.5
Borrowings including subordinated notes
1,321.8 - 168.9 521.8 721.2 - 1,411.9
Preference shares 47.2 - 1.2 1.2 48.4 - 50.8
Amounts due to controlled entities
3,118.0 3,118.0 - - - - 3,118.0
Total 29,341.3 11,877.5 10,305.9 4,440.4 3,302.0 - 29,925.8
Derivative financial instruments (hedging relationship)
Contractual amounts payable - (0.5) (303.8) (702.6) (634.2) (2.9) (1,644.0)
Contractual amounts receivable - 0.9 347.4 836.7 746.7 5.5 1,937.2
148.9 0.4 43.6 134.1 112.5 2.6 293.2
(1) Derivative financial instruments other than those designated in a cashflow hedge relationship.
Bank2008
Carrying amount
$mAt Call
$m3 mths or less
$m3 to 12 mths
$m1 to 5 years
$mOver 5 years
$m
Total contractual cash flows
$m
Financial liabilities
Due to other financial institutions 135.6 135.6 - - - - 135.6
Deposits 17,920.1 6,149.4 7,186.5 3,974.6 814.2 - 18,124.7
Derivative financial instruments (1) 3.8 - 0.5 3.3 - - 3.8
Accounts payable and other liabilities
222.9 - 222.9 - - - 222.9
Borrowings including subordinated notes
1,402.2 - 589.3 59.3 884.6 - 1,533.2
Preference shares 111.9 - 67.6 1.2 50.8 - 119.6
Amounts due to controlled entities
3,687.4 3,687.4 - - - - 3,687.4
Total 23,483.9 9,972.4 8,066.8 4,038.4 1,749.6 - 23,827.2
Derivative financial instruments (hedging relationship)
Contractual amounts payable - (1.0) (696.0) (430.0) (1,154.0) (4.0) (2,285.0)
Contractual amounts receivable - 1.0 670.0 469.0 1,121.0 4.0 2,265.0
37.0 - (26.0) 39.0 (33.0) - (20.0)
(1) Derivative financial instruments other than those designated in a cashflow hedge relationship.
Bank of Queensland Annual Report 200986

Notes to and Forming Part of the Financial StatementsYear ended 31 August 2009
25. Risk management (continued)
Operational risk(d)
Operational risk is the risk of loss resulting from inadequate or failed internal processes, people and systems or from external events.
Operational risk is managed by the Bank through appropriate reporting lines, defined responsibilities, policies and procedures and an operational risk program which incorporates quarterly risk monitoring and reporting by each Business unit. Operational Risks and their mitigants are documented in the Business unit risk databases. These provide the basis for the business unit and Bank wide risk profile. The Bank wide risk profile is reported to the Board on a regular basis.
26. Capital management
The Bank and Group’s capital management strategy aims to ensure that the Consolidated Entity maintains adequate capital to act as a buffer against risks associated with activities whilst maximising returns to shareholders.
The Bank’s capital is measured and managed in line with Prudential Standards issued by APRA. This regulatory capital differs from statutory capital in that certain liabilities such as preference shares are considered capital from a regulatory perspective and certain assets including goodwill and other intangibles are considered a deduction from regulatory capital.
The Bank and Group have a capital management plan, consistent with their overall business plans, for managing capital levels on an ongoing basis. This plan sets out:
(i) the strategy for maintaining adequate capital over time including the capital target, how the target level is to be met and the means available for sourcing additional capital when required; and
(ii) the actions and procedures for monitoring compliance with minimum regulatory capital adequacy requirements, including trigger ratios to alert management to, and avert, potential breaches of these requirements.
The capital management plan is updated at least annually and submitted to the Board for approval. Current and projected capital positions are reported to the Board and APRA on a monthly basis.
The Board has set capital targets at 8.0% of risk weighted assets as Tier 1 capital with a minimum of 7.0% provided that total capital does not fall below 10.0%. The total capital adequacy ratio at 31 August 2009 was 11.5% and Tier 1 capital was 8.9%. Reset Preference Shares (“RePS”) and Perpetual Equity Preference Shares (“PEPS”), issued as hybrid capital instruments, comprise 17% of total Tier 1 capital.
Total Tier 1 capital of 8.9% is represented by 7.4% of Core Tier 1 capital and 1.5% of hybrid capital instruments, including preference shares.
87

Notes to and Forming Part of the Financial StatementsYear ended 31 August 2009
A summary of the consolidated capital position is shown in the table below:
Consolidated
Qualifying capital2009
$m2008
$m
Tier 1
Fundamental Tier 1
Ordinary Share Capital 1,707.4 1,243.7
Reserves 28.2 1.2
Retained profits (1) 176.1 156.9
1,911.7 1,401.8
Residual Tier 1
Non Innovative (PEPS) 195.7 195.7
Innovative (RePS and S1RPS) 47.2 111.9
Residual Tier 1 transferred to Upper Tier 2 - (57.4)
242.9 250.2
Tier 1 Deductions
Deferred Expenditure (82.1) (66.6)
Goodwill and other identifiable intangibles (587.8) (573.1)
Other deductions (24.1) (11.3)
(694.0) (651.0)
Net Tier 1 Capital 1,460.6 1,001.0
Tier 2
Upper Tier 2
General Reserve for Credit Losses 98.5 68.9
Residual Tier 1 transferred to Upper Tier 2 - 57.4
98.5 126.3
Lower Tier 2
Term subordinated debt 346.0 426.0
346.0 426.0
Tier 2 Deductions (24.1) (31.4)
(24.1) (31.4)
Net Tier 2 Capital 420.4 520.9
Capital Base 1,881.0 1,521.9
Risk Weighted Assets 16,360.1 13,813.0
Capital Adequacy Ratio 11.5% 11.0%
(1) For calculation of capital adequacy retained profits includes current year’s profit less accrual of expected dividends net of expected dividend reinvestment.
26. Capital management (continued)
Bank of Queensland Annual Report 200988

Notes to and Forming Part of the Financial StatementsYear ended 31 August 2009
27. Financial instruments
Derivative financial instruments(a)
The Consolidated Entity and Bank used derivative financial instruments for both hedging and trading purposes in the current year.
Refer to Note 25 for an explanation of the Consolidated Entity and Bank’s risk management framework.
The following table summarises the notional and net fair value of the Bank’s commitments to derivative financial instruments at 31 August 2009. Notional amounts do not represent amounts exchanged by the transaction counterparties, and thus, are not a measure of the exposure of the Bank through its use of derivatives. Net fair value in relation to derivative financial instruments is calculated using the quoted market price less transaction costs. Where the instrument does not have a quoted market price, the net fair value is estimated using the net present value techniques.
Consolidated
2009 2008Notional Amount
Net Fair ValueAsset / (Liability)
Notional Amount
Net Fair ValueAsset / (Liability)
$mAsset$m
Liability$m $m
Asset$m
Liability$m
Derivatives held for trading
Interest Rate Swaps 679.4 0.1 (0.6) 1,369.6 2.2 (2.8)
Forward Rate Agreements - - - 500.0 0.1 -
Foreign Exchange Forwards 51.7 1.1 (1.0) 55.3 0.7 (1.0)
Futures 3,481.0 3.0 - 5,582.2 3.7 -
4,212.1 4.2 (1.6) 7,507.1 6.7 (3.8)
Derivatives held as cash flow hedges
Interest Rate Swaps 15,062.7 46.3 (158.6) 8,924.2 46.8 (53.0)
Cross Currency Swaps 1,775.4 37.9 (38.5) 1,659.6 38.7 (51.6)
Foreign Exchange Forwards 169.9 0.1 (6.3) 524.8 19.5 (0.6)
17,008.0 84.3 (203.4) 11,108.6 105.0 (105.2)
21,220.1 88.5 (205.0) 18,615.7 111.7 (109.0)
Bank
2009 2008Notional Amount
Net Fair ValueAsset / (Liability)
Notional Amount
Net Fair ValueAsset / (Liability)
$mAsset$m
Liability$m $m
Asset$m
Liability$m
Derivatives held for trading
Interest Rate Swaps 679.4 0.1 (0.6) 1,369.6 2.2 (2.8)
Forward Rate Agreements - - - 500.0 0.1 -
Foreign Exchange Forwards 51.7 1.1 (1.0) 55.3 0.7 (1.0)
Futures 3,481.0 3.0 - 5,582.2 3.7 -
4,212.1 4.2 (1.6) 7,507.1 6.7 (3.8)
Derivatives held as cash flow hedges
Interest Rate Swaps 15,062.7 46.3 (158.6) 8,924.2 46.7 (53.0)
Cross Currency Swaps 904.8 8.1 (38.5) 577.7 2.0 (51.6)
Foreign Exchange Forwards 169.9 0.1 (6.3) 524.8 19.5 (0.6)
16,137.4 54.5 (203.4) 10,026.7 68.2 (105.2)
20,349.5 58.7 (205.0) 17,533.8 74.9 (109.0)
89

Notes to and Forming Part of the Financial StatementsYear ended 31 August 2009
27. Financial Instruments (continued)
Other financial instruments(b)
Where an active and liquid market exists for a financial instrument, net fair value is calculated using the quoted market price adjusted for any transaction costs of disposal.
Where there is no market for a financial instrument, or an illiquid market exists, estimates of net fair value have been made using net present value techniques. If such a financial instrument has no specific maturity or is at call, and the interest rate is either discretionary or will reprice in the short term, the historical cost or face value is used to approximate net fair value.
Net fair values which are based on estimates and which rely on information current at only one point in time are subjective, change continuously and are not necessarily representative of the underlying value of the financial instrument to the economic entity.
Fair values of financial instruments at balance date are as follows:
Consolidated Entity
Carrying value Net fair value
2009$m
2008$m
2009$m
2008$m
Assets
Cash and liquid assets 353.8 399.5 353.8 399.5
Due from other financial institutions 74.6 56.9 74.6 56.9
Other financial assets 4,423.3 3,263.9 4,423.2 3,263.9
Loans and advances at amortised cost 28,310.8 25,246.8 28,321.4 25,202.8
Liabilities
Balances due to other banks (192.7) (135.6) (192.7) (135.6)
Deposits (24,197.2) (20,036.5) (24,167.5) (20,047.2)
Borrowings including subordinated notes (6,982.8) (7,579.5) (6,952.5) (7,608.0)
Bank
Assets
Cash and liquid assets 250.3 242.9 250.3 242.9
Due from other financial institutions 74.6 56.9 74.6 56.9
Other financial assets 4,536.4 3,180.6 4,536.4 3,180.6
Loans and advances at amortised cost 25,694.4 20,669.5 25,705.0 20,610.7
Liabilities
Balances due to other banks (192.7) (135.6) (192.7) (135.6)
Deposits (24,413.5) (17,920.1) (24,383.8) (17,930.8)
Borrowings including subordinated notes (1,369.0) (1,514.1) (1,338.7) (1,542.6)
The fair value of derivative financial instruments can be found in Note 27 (a). The estimated net fair values disclosed do not include the assets and liabilities that are not considered financial instruments.
Bank of Queensland Annual Report 200990

Notes to and Forming Part of the Financial StatementsYear ended 31 August 2009
28. Notes to the statements of cash flows
Reconciliation of profit for the year to net cash provided by operating activities:
Consolidated Bank
2009$m
2008$m
2009$m
2008$m
Profit from ordinary activities after income tax 141.1 138.7 140.6 116.9
Add / (less) items classified as investing / financing activities or non cash items
Depreciation 6.6 5.9 6.6 4.6
Amortisation 10.9 7.7 1.1 1.0
Joint venture distribution (0.7) (1.3) - -
Software amortisation 18.4 15.7 18.4 15.4
Loss on sale / asset writedowns 1.6 3.5 1.6 0.5
Share based payments 6.9 5.2 6.9 5.2
Property, plant & equipment - (0.1) - -
Purchase of Home Building Society Ltd - 90.6 - -
Profit on sale of property, plant and equipment (0.5) (2.3) (0.5) (0.3)
Increase in due from other financial institutions (17.7) (20.5) (17.7) (20.5)
(Increase) in other financial assets (1,137.3) (1,661.6) (1,334.9) (1,668.9)
Increase in loans and advances at amortised cost (3,080.7) (7,666.5) (5,046.8) (4,370.8)
Increase in derivatives (17.9) (68.5) (8.3) (46.0)
Increase in provision for impairment 16.7 20.5 21.9 10.3
Increase in deferred tax asset (45.3) (0.3) (1.9) (0.3)
(Increase) / decrease in other assets 46.5 (22.8) 34.9 (62.9)
(Increase) / decrease in investments accounted for using the equity method 5.6 (36.4) - -
Increase / (decrease) in amounts due from controlled entities - - (584.7) 424.3
Increase in due to other financial institutions 57.1 14.1 57.1 14.1
Increase in deposits 4,160.7 7,316.2 6,493.4 5,589.0
Increase / (decrease) in accounts payable and other liabilities (18.9) 63.1 23.6 18.4
Increase / (decrease) in current tax liabilities 23.6 (14.1) 24.6 (21.2)
Increase in provisions 3.9 4.3 1.0 0.5
Increase / (decrease) in deferred tax liabilities 41.1 16.4 (0.9) 15.7
Increase / (decrease) in borrowings including subordinated notes (394.1) 1,682.7 - -
Net cash from operating activities (172.4) (109.8) (164.0) 25.0
Cash flows from the following activities are presented on a net basis in the statements of cash flows:
91

Notes to and Forming Part of the Financial StatementsYear ended 31 August 2009
29. Auditors’ remuneration
Consolidated Bank
2009$000
2008$000
2009$000
2008$000
Audit services – KPMG Australia
– Audit and review of the financial reports
– Other regulatory and audit services
613.8
177.2
843.0
189.5
555.3
99.9
763.9
81.7
791.0 1,032.5 655.2 845.6
Audit related services – KPMG Australia
– Other assurance services (1) 278.3 307.8 95.1 65.6
278.3 307.8 95.1 65.6
Other services – KPMG Australia
– Tax advisory services 27.7 - 21.5 -
27.7 - 21.5 -
Other services – KPMG Australia
– Due diligence services 436.9 193.5 53.8 86.0
436.9 193.5 53.8 86.0
(1) Other assurance services comprise accounting opinions, and audit related services provided in relation to mortgage securitisation trusts which are consolidated under Australian International Financial Reporting Standards.
Fees for audit and non-audit related services paid to KPMG which were provided in relation to leasing securitisation trusts which are not consolidated were $86,677 (2008: $139,159).
30. Contingent liabilities
Consolidated Bank
2009$000
2008$000
2009$000
2008$000
Guarantees 125.8 63.4 125.8 62.0
Letters of credit 14.9 47.3 14.9 47.3
Guarantees, indemnities and letters of credit
There are contingent liabilities arising in the normal course of business for which there are equal and opposite contingent assets and against which no loss is anticipated. Guarantees are provided to third parties on behalf of customers. The credit risks of such facilities are similar to the credit risks of loans and advances.
As at 10 September 2009 Bank of Queensland has around 261 customers who were associated with Storm Financial Ltd (a financial planning firm that went into liquidation on 26 March 2009) and is currently the subject of an ASIC investigation. Aggregate loan exposure to these customers is $85.8m. All loans are home equity loans secured by residential property. The Bank has received 45 hardship applications as at 7 September 2009 from affected Storm Financial customers, 43 of which have been approved. The Bank has received two legal claims in respect of former Storm Financial customers. The claims are not considered financially material to the Bank. The Bank is dealing with the claims in the normal course and as at the date of the report the likelihood of any material liability arising out of this claim is considered remote.
Bank of Queensland Annual Report 200992

Notes to and Forming Part of the Financial StatementsYear ended 31 August 2009
31. Commitments
Consolidated Bank
2009$m
2008$m
2009$m
2008$m
(a) Lease commitmentsFuture rentals in respect of operating leases (principally in respect of premises) not provided for in these financial statements comprise amounts payable:
Within 1 year 37.2 40.1 37.2 36.7
Between 1 year and 5 years 96.7 104.1 96.7 93.8
Later than 5 years 8.7 16.1 8.7 10.5
142.6 160.3 142.6 141.0
(b) Customer funding commitmentsLoans to customers approved but not drawn at year end
885.8780.8
433.1750.4
Amounts undrawn against lines of credit 289.6 672.9 289.6 202.7
1,175.4 1,453.7 722.7 953.1
In the normal course of business the Bank makes commitments to extend credit to its customers. Most commitments either expire if not taken up within a specified time or can be cancelled by the Bank within one year. Credit risk is significantly less than the notional amount and does not crystallise until a commitment is funded.
32. Employee benefits
Superannuation commitments(a)
The Consolidated Entity contributes to any defined contribution superannuation plan which complies with the Superannuation Contributions Act legislation.
Basis of contributions
Employee superannuation contributions are based on various percentages of employees’ gross salaries. The Consolidated Entity’s contributions are also based on various percentages of employees’ gross salaries.
The Consolidated Entity is under no legal obligation to make superannuation contributions except for the minimum contributions required under the Superannuation Guarantee Legislation.
During the year employer contributions were made, refer Note 5.
Employee share plan(b)
The Bank’s Employee Share Plan (“ESP”) was originally approved by shareholders on 5 December 1996 and is re-approved every three years. If the Board approves an offer to be made under the plan, all full time and part time employees of the Bank who have completed a prerequisite period of continuous service may be offered shares to a market value of $1,000 at no cost. Only one offer may be made each financial year. Shares issued under the plan cannot be sold for three years or until the employee leaves the Bank and rank equally with other fully paid ordinary shares.
During the year nil (2008: nil) shares were issued. Since the commencement of the plan 841,953 shares have been issued. At 31 August 2009, these shares were valued at $9,808,752 (2008: $13,353,375) under the terms of the plan.
The aggregate number of shares issued under the plan or any other employee share plan during any five year period must not exceed 5% of the total issued capital of the Bank at the end of that five year period.
93

Notes to and Forming Part of the Financial StatementsYear ended 31 August 2009
32. Employee benefits (continued)
Share based payments(c)
The Consolidated Entity has two options plans. The Managing Director option plan, which was established in 2001 and the Senior Management Option Plan (“SMOP”), which was established in 2001.
For options issued before 7 November 2002, the recognition and measurement principles in AASB 2 have not been applied to these grants in accordance with the transitional provisions in AASB 1.
The terms and conditions of options granted under the above plans are as follows, whereby all options are settled by physical delivery of shares:
Grant date / employee entitled
Number of instruments Vesting conditions
Contractual life of options
Options granted to key management at 10 November 2003 – SMOP 3
3,120,000(1) To reach the performance hurdle the Consolidated Entity must achieve a minimum return on equity of 14.5% in the financial year immediately preceding the third anniversary of the issue date (31 August 2006). A return on equity of 14.5% will result in 50% of the issued options vesting. Each 0.01% return on equity in excess of 14.5% will result in an additional 1% of options vesting. A return on equity equal to or greater than 15.0% will result in 100% of the issued options vesting.
At the Annual General Meeting on 9 December 2004, ordinary shareholders approved the following change under ASX Listing Rule 6.23.4:
test will be applied across financial years 2005, 2006 and 2007; and
will be applied across financial years 2005, 2006, 2007 and 2008.
The new Earnings Per Share (“EPS”) test requires the Bank’s diluted cash EPS to outperform the average diluted cash EPS growth of a group of comparison banks over approximately the same period. The comparison banks are seven peer group banks, being ANZ, National Australia Bank, Commonwealth Bank, Westpac, St George Bank, Adelaide Bank and Bendigo Bank (“Comparison Banks”). The Bank engages an independent analyst to make adjustments to reported EPS figures to ensure they are prepared on a comparable basis. A cap of 20% growth and a floor of 10% decline will be applied to each adjusted EPS growth figure to account for abnormal results of a Comparison Bank.
To reach the EPS performance hurdle the Consolidated Entity must achieve the following:
Percentage range by which cash EPS growth exceeds Comparison banks Percentage of options to vest
5% and up to but not exceeding 10% 25%
10% and up to but not exceeding 15% 50%
15% and up to but not exceeding 20% 75%
20% or more 100%
5 years
(1) These options vested in the 2007 financial year.
Bank of Queensland Annual Report 200994

Notes to and Forming Part of the Financial StatementsYear ended 31 August 2009
32. Employee benefits (continued)
(c) Share based payments (continued)
Grant date / employee entitled
Number of instruments Vesting conditions
Contractual life of options
Options granted to Managing Director at 24 December 2004
500,000 (1)
500,000 (2)
The performance hurdle is based on diluted cash EPS growth and requires the Bank’s diluted cash EPS to outperform the average diluted cash EPS growth of the Comparison Banks over the relevant performance period (financial years 2005 – 2006).
To reach the EPS performance hurdle the Consolidated Entity must achieve the following for the performance period:
Percentage range by which cash EPS growth exceeds Comparison banks Percentage of options to vest
5% and up to but not exceeding 10% 25%
10% and up to but not exceeding 15% 50%
15% and up to but not exceeding 20% 75%
20% or more 100%
Should any options remain unvested as at November 2007, the EPS test will be applied across financial years 2005, 2006 and 2007. Should any options remain unvested as at November 2008, the EPS test will be applied across financial years 2005, 2006, 2007 and 2008.
The performance hurdle is based on diluted cash EPS growth and requires the Bank’s diluted cash EPS to outperform the average diluted cash EPS growth of the Comparison Banks over the relevant performance period (financial years 2005 – 2007).
To reach the EPS performance hurdle the Consolidated Entity must achieve the following for the performance period:
Percentage range by which cash EPS growth exceeds Comparison banks Percentage of options to vest
5% and up to but not exceeding 10% 25%
10% and up to but not exceeding 15% 50%
15% and up to but not exceeding 20% 75%
20% or more 100%
Should any options remain unvested as at November 2008, the EPS test will be applied across financial years 2005, 2006, 2007 and 2008. Should any options remain unvested as at November 2009, the EPS test will be applied across financial years 2005, 2006, 2007, 2008 and 2009.
4 years
5 years
(1) These options vested in the 2007 financial year.
(2) These options vested in the 2008 financial year.
95

Notes to and Forming Part of the Financial StatementsYear ended 31 August 2009
32. Employee benefits (continued)
(c) Share based payments (continued)
Grant date / employee entitled
Number of instruments Vesting conditions
Contractual life of options
Options granted to key management at 20 December 2004 – SMOP 4
3,005,000(1) The ability to exercise the options is conditional on the Consolidated Entity achieving certain performance hurdles. The performance hurdles are based on diluted cash EPS growth and require the Bank’s diluted cash EPS to outperform the average diluted cash EPS growth of the Comparison Banks over the financial years 2005, 2006 and 2007 (“performance period”), as described above.
To reach the EPS performance hurdle the Consolidated Entity must achieve the following for the performance period:
Percentage range by which cash EPS growth exceeds Comparison banks Percentage of options to vest
5% and up to but not exceeding 10% 25%
10% and up to but not exceeding 15% 50%
15% and up to but not exceeding 20% 75%
20% or more 100%
Should any SMOP 4 options remain unvested as at December 2008, the EPS test will be applied across financial years 2005, 2006, 2007 and 2008. Should any SMOP 4 options remain unvested as at December 2009, the EPS test will be applied across financial years 2005, 2006, 2007, 2008 and 2009.
5 years
Options granted to key management at 17 October 2005 - SMOP 5
3,805,000(2) The ability to exercise the options is conditional on the Consolidated Entity achieving certain performance hurdles. The performance hurdles are based on diluted cash EPS growth and require the Bank’s diluted cash EPS to outperform the average diluted cash EPS growth of the Comparison Banks over the financial years 2006, 2007 and 2008 (“performance period”), as described above.
To reach the EPS performance hurdle the Consolidated Entity must achieve the following for the performance period:
Percentage range by which cash EPS growth exceeds Comparison banks Percentage of options to vest
5% and up to but not exceeding 10% 25%
10% and up to but not exceeding 15% 50%
15% and up to but not exceeding 20% 75%
20% or more 100%
Should any SMOP 5 options remain unvested as at November 2009, the EPS test will be applied across financial years 2006, 2007, 2008 and 2009. Should any SMOP 5 options remain unvested as at November 2010, the EPS test will be applied across financial years 2006, 2007, 2008, 2009 and 2010.
5 years
(1) These options vested in the 2008 financial year.
(2) These options vested in the 2009 financial year.
Bank of Queensland Annual Report 200996

Notes to and Forming Part of the Financial StatementsYear ended 31 August 2009
32. Employee benefits (continued)
(c) Share based payments (continued)
Grant date / employee entitled
Number of instruments Vesting conditions
Contractual life of options
Options granted to Managing Director at 1 November 2005 (continued)
500,000 (1) The performance hurdle is based on diluted cash EPS growth and requires the Bank’s diluted cash EPS to outperform the average diluted cash EPS growth of the Comparison Banks over the relevant performance period (financial years 2006 – 2008).
To reach the EPS performance hurdle the Consolidated Entity must achieve the following for the performance period:
Percentage range by which cash EPS growth exceeds Comparison banks Percentage of options to vest
5% and up to but not exceeding 10% 25%
10% and up to but not exceeding 15% 50%
15% and up to but not exceeding 20% 75%
20% or more 100%
Should any options remain unvested as at November 2009, the EPS test will be applied across financial years 2006, 2007, 2008 and 2009. Should any options remain unvested as at November 2010, the EPS test will be applied across financial years 2006, 2007, 2008, 2009 and 2010.
5 years
Options granted to Managing Director at 1 November 2006 (continued)
500,000 The performance hurdle is based on diluted cash EPS growth and requires the Bank’s diluted cash EPS to outperform the average diluted cash EPS growth of the Comparison Banks over the relevant performance period (financial years 2007 – 2009)
To reach the EPS performance hurdle the Consolidated Entity must achieve the following for the performance period:
Percentage range by which cash EPS growth exceeds Comparison banks Percentage of options to vest
5% and up to but not exceeding 10% 25%
10% and up to but not exceeding 15% 50%
15% and up to but not exceeding 20% 75%
20% or more 100%
Should any options remain unvested as at November 2010, the EPS test will be applied across financial years 2007, 2008, 2009 and 2010. Should any options remain unvested as at November 2011, the EPS test will be applied across financial years 2007, 2008, 2009, 2010 and 2011.
5 years
(1) These options vested in the 2009 financial year.
97

Notes to and Forming Part of the Financial StatementsYear ended 31 August 2009
32. Employee benefits (continued)
(c) Share based payments (continued)
Grant date / employee entitled
Number of instruments Vesting conditions
Contractual life of options
Options granted to key management at 20 November 2006 - SMOP 6
3,370,000 The ability to exercise the options is conditional on the Consolidated Entity achieving certain performance hurdles. The performance hurdles are based on diluted cash EPS growth and require the Bank’s diluted cash EPS to outperform the average diluted cash EPS growth of the Comparison Banks over the financial years 2007, 2008 and 2009 (“performance period”), as described above.To reach the EPS performance hurdle the Consolidated Entity must achieve the following for the performance period:Percentage range by which cash EPS growth exceeds Comparison banks Percentage of options to vest
5% and up to but not exceeding 10% 25%
10% and up to but not exceeding 15% 50%
15% and up to but not exceeding 20% 75%
20% or more 100%
Should any SMOP 6 options remain unvested as at November 2010, the EPS test will be applied across financial years 2007, 2008, 2009 and 2010. Should any SMOP 6 options remain unvested as at November 2011, the EPS test will be applied across financial years 2007, 2008, 2009, 2010 and 2011.
5 years
Options granted to key management at 1 November 2007 - SMOP 7
3,999,000 The ability to exercise the options is conditional on the Consolidated Entity achieving certain performance hurdles. The performance hurdles are based on diluted cash EPS growth and require the Bank’s diluted cash EPS to outperform the average diluted cash EPS growth of the Comparison Banks over the financial years 2008, 2009 and 2010 (“performance period”), as described above.
To reach the EPS performance hurdle the Consolidated Entity must achieve the following for the performance period:
Percentage range by which cash EPS growth exceeds Comparison banks Percentage of options to vest
5% and up to but not exceeding 10% 25%
10% and up to but not exceeding 15% 50%
15% and up to but not exceeding 20% 75%
20% or more 100%
Should any SMOP 7 options remain unvested as at November 2011, the EPS test will be applied across financial years 2008, 2009, 2010 and 2011. Should any SMOP 7 options remain unvested as at November 2012, the EPS test will be applied across financial years 2008, 2009, 2010, 2011 and 2012.
Long-Term Incentives - Award Rights
The Award Rights Plan was approved by shareholders on 11 December 2008. It is an equity based program under which Award Rights are granted as long-term incentives. The two types of award rights currently granted to executives under the plan are PARs and DARs. No amount is payable by employees for the grant or exercise of these award rights.
PARs
PARs have a vesting framework based on Total Shareholder Return (TSR) of the Bank as measured against a Peer Group over a 3 year period. That Peer Group consists of the S&P / ASX 200 from time to time excluding selected entities in resources, real estate investment trusts, telecommunications (offshore headquartered), energy and utilities and such other inclusions and exclusions as the Board considers appropriate. TSR is a measure of the entire return a shareholder would obtain from holding an entity’s securities over a period, taking into account factors such as changes in the market value of the securities and dividends paid over the period.
One half of an employee’s PARs will vest if the Bank’s TSR performance over the three year period is in the top 50% of the Peer Group. All of the PARs vest if the Bank’s TSR performance is in the top 25%. For TSR performance between those targets, a relative proportion of the PARs between one half and 100% would vest.
Vested PARs are generally exercisable within 5 years after they are granted (approximately 2 years after vesting).
Bank of Queensland Annual Report 200998

Notes to and Forming Part of the Financial StatementsYear ended 31 August 2009
32. Employee benefits (continued)
(c) Share based payments (continued)
DARs
DARs currently on issue vest proportionately over 3 years in the ratio 20% (end Year 1), 30% (end Year 2) and 50% (end Year 3). There are no market performance hurdles or vesting conditions for DARs but the holder must remain an employee of the Bank.
Vested DARs are generally exercisable within 5 years after they are granted (approximately 2 to 4 years after vesting).
The following factors and assumptions were used in determining the fair value of options or rights on grant date:
Option or right Type Grant date Expiry date
Fair value per option
or rightExercise price (1)
Price of shares on grant date
Expected volatility
Risk free interest rate Dividend yield
Executives - Options
SMOP 420 December
200420 December
2009$1.17 $10.57 $10.65 17.5% 5.45% 4.0%
SMOP 517 October
200517 October
2010$2.16 $13.23 $13.06 20.1% 5.85% 3.7%
SMOP 620 November
200620 November
2011$2.13 $16.26 $14.90 15.0% 6.00% 4.5%
SMOP 71 November
20071 November
2012$2.57 $19.11 $19.44 14.0% 6.50% 4.3%
Managing Director - Options
MD Scheme 2 – Tranche 2
24 December 2004
24 December 2009
$1.17 $10.71 $10.65 17.5% 5.45% 4.0%
MD Scheme 2 – Tranche 3
1 November 2005
20 December 2010
$2.16 $13.37 $13.06 20.1% 5.85% 3.7%
MD Scheme 2 – Tranche 4
1 November 2006
20 November 2011
$2.13 $16.40 $16.37 15.0% 6.00% 4.5%
Executives Director - Rights
PARs11 December
2008 (2) 29 June 2014 $5.76 Nil $10.25 26.7% 4.49% 5.2%
Executives - Rights
PARs 29 June 2009 29 June 2014 $4.59 Nil $8.89 35.1% 4.2% 7.2%
DARs 29 June 2009 29 June 2014 $7.59 Nil $8.89 35.1% 4.2% 7.2%
(1) The exercise price is calculated as the volume weighted average price of shares traded over the ten business days immediately after the date of the announcement of the Bank’s most recent annual results and requires Board approval. The exercise price was adjusted due to the entitlements offer as required under the plan rules.
(2) The grant date is deemed to be the date the Award Rights were approved at the Annual General Meeting, the rights were issued on 29 June 2009.
99

Notes to and Forming Part of the Financial StatementsYear ended 31 August 2009
32. Employee benefits (continued)
(c) Share based payments (continued)
The number and weighted average exercise price of share options is as follows:
Weighted average exercise price
Number of options
Weighted average exercise price
Number of options
20092009 ’000 2008
2008 ’000
Outstanding at the beginning of the year $16.25 9,987 $13.55 10,263
Forfeited during the year $17.20 (1,057) $17.14 (950)
Exercised during the year $10.32 (31) $11.26 (3,325)
Granted during the year - - $19.25 3,999
Outstanding at the end of the year $16.16 8,899 $16.25 9,987
Exercisable at the end of the year 3,701 506
The options outstanding at 31 August 2009 have an exercise price in the range of $10.00 to $19.50 and a weighted average contractual life of 2.2 years (2008: 3.2 years).
During the year 31,000 options were exercised (2008: 3,324,736). The weighted average share price at the date of exercise was $12.80 (2008: $17.79).
The number of award rights is as follows:
Number of rights
2009 ’000
Granted during the year 698
Forfeited during the year (14)
Exercised during the year -
Granted during the year -
Outstanding at the end of the year 684
Bank of Queensland Annual Report 2009100

Notes to and Forming Part of the Financial StatementsYear ended 31 August 2009
33. Key management personnel disclosures
Key management personnel have authority and responsibility for planning, directing and controlling the activities of the Bank and the Consolidated Entity, including directors and other executives. Key management personnel include the five most highly remunerated S300A directors and executives for the Bank and Consolidated Entity.
Key management personnel compensation(a)
Key management personnel compensation included in ‘administrative expenses’ and ‘employee expenses’ (refer note 5) is as follows:
Consolidated and Bank
2009 $
2008$
Short-term employee benefits 6,838,960 7,439,963
Post-employment benefits 369,051 514,314
Long term employee benefits 63,646 73,576
Termination benefits 1,574,873 732,827
Share based employment benefits 3,137,535 1,548,366
11,984,065 10,309,046
Individual directors and executives compensation disclosures
Information regarding individual directors and executives compensation and some equity instruments disclosures as permitted by Corporations Regulation 2M.3.03 is provided in the remuneration report section of the directors’ report.
Apart from the details disclosed in the note, no director has entered into a material contract with the Bank since the end of the previous financial year and there were no material contracts involving directors’ interest existing at year end.
101

Notes to and Forming Part of the Financial StatementsYear ended 31 August 2009
33. Key management personnel disclosures (continued)
Equity Instruments - holdings and movements(b)
The movement during the reporting period in the number of options and rights over ordinary shares in Bank of Queensland Limited held, directly, indirectly or beneficially, by key management personnel, including their personally related entities, is as follows:
Managing Director, Senior Management Option Plans (“SMOP”) and Award rights
All options issued under the Managing Director option plan, SMOP and Award rights refer to options and rights over ordinary shares of Bank of Queensland Limited, which are exercisable on a one-for-one basis.
During the reporting period, the following options and rights over ordinary shares were granted to executives under the SMOP and Award Rights:
Held at 1 September
2008Granted as
remuneration ExercisedOther
changes (1)
Held at 31 August
2009Vested during
the year
Vested and exercisable
at 31 August 2009
Managing Director option plan:
David Liddy - Options 1,000,000 - - - 1,000,000 500,000 500,000
- Rights - 175,072 - - 175,072 - -
SMOP:
Executives
Ram Kangatharan - Options 350,000 - - - 350,000 - -
- Rights - 54,150 - - 54,150 - -
David Marshall - Options 200,000 - - - 200,000 - -
- Rights - 37,050 - - 37,050 - -
Daniel Musson - Options 200,000 - - - 200,000 - -
- Rights - 34,770 - - 34,770 - -
Jim Stabback - Rights - 30,210 - - 30,210 - -
Bruce Auty - Options 350,000 - - - 350,000 150,000 150,000
- Rights - 19,380 - - 19,380 - -
Former Executives
Robert Hines - Options 750,000 - - (120,392) 629,608 429,608 629,608
Len Stone - Options 380,000 - - (52,701) 327,299 327,299 327,299
(1) Other changes represent options and rights that forfeited during the year.
Bank of Queensland Annual Report 2009102

Notes to and Forming Part of the Financial StatementsYear ended 31 August 2009
33. Key management personnel disclosures (continued)
(b) Equity Instruments - holdings and movements (continued)
Held at 1 September
2007Granted as
remuneration Exercised (1)Other
changes (2)
Held at 31 August
2008Vested during
the year
Vested and exercisable
at 31 August 2008
Managing Director option plan:
David Liddy 1,500,000 - (500,000) - 1,000,000 500,000 -
SMOP:
Executives
Ram Kangatharan - 350,000 - - 350,000 - -
David Marshall - 200,000 - - 200,000 - -
Daniel Musson - 200,000 - - 200,000 - -
Bruce Auty 350,000 100,000 (100,000) - 350,000 100,000 -
Robert Hines 575,000 175,000 - - 750,000 200,000 200,000
Len Stone 400,000 130,000 (150,000) - 380,000 150,000 -
Former Executives
Donna Quinn 475,000 - (350,000) (125,000) - 350,000 -
Iain Blacklaw 100,000 150,000 - (250,000) - - -
(1) Options exercised had an exercise price of $10.71 and $13.37.
(2) Other changes represent options that forfeited during the year.
Movement in shares
The number of shares held directly, indirectly or beneficially by each key management person is as follows:
Ordinary shares
Held at 1 September
2008Purchases /
(Sales)
Received on exercise of
options
Held at 31 August
2009
Directors of Bank of Queensland Limited
Neil Summerson 18,528 4,022 - 22,550
Anthony Howarth 37,819 4,043 - 41,862
David Liddy 1,616,565 (700,319) - 916,246
Steve Crane - 11,000 - 11,000
Roger Davis 2,909 207 - 3,116
Peter Fox 11,801,257 (10,025,758) - 1,775,499
David Graham 6,000 2,618 - 8,618
Carmel Gray 4,000 1,309 - 5,309
Bill Kelty 1,088 77 - 1,165
John Reynolds 1,000 - - 1,000
Former Director
Antony Love (1) 11,990 - - -
Executive
Bruce Auty 100,000 (98,691) - 1,309
Former Executives
Robert Hines 197,999 - - -
Len Stone 12,500 - - -
103

Notes to and Forming Part of the Financial StatementsYear ended 31 August 2009
33. Key management personnel disclosures (continued)
(b) Equity Instruments - holdings and movements (continued)
Convertible Preference shares
Held at 1 September
2008Purchases /
(Sales)Held at
31 August 2009
Directors of Bank of Queensland Limited
Former Director
Antony Love (1) 500 - -
(1) Antony Love retired as a Director on 11 December 2008.
Ordinary shares
Held at 1 September
2007Purchases /
(Sales)
Received on exercise of
options Held at
31 August 2008
Directors of Bank of Queensland Limited
Neil Summerson 17,731 797 - 18,528
Anthony Howarth - 37,819 - 37,819
David Liddy 1,412,387 (295,822) 500,000 1,616,565
Roger Davis - 2,909 - 2,909
Peter Fox 11,294,704 506,553 - 11,801,257
David Graham 6,000 - - 6,000
Carmel Gray 1,000 3,000 - 4,000
Bill Kelty 1,040 48 - 1,088
Antony Love 11,990 - - 11,990
John Reynolds 1,000 - - 1,000
Former Director
Neil Roberts (1) 21,464 - - -
Executives
Bruce Auty 200,000 (200,000) 100,000 100,000
Robert Hines 347,999 (150,000) - 197,999
Len Stone 250,000 (387,500) 150,000 12,500
Former Executive
Donna Quinn 167,725 - - -
(1) Neil Roberts retired as Chairman and as a Director on 20 August 2008.
Convertible Preference shares
Held at 1 September
2007Purchases /
(Sales)Held at
31 August 2008
Directors of Bank of Queensland Limited
Antony Love - 500 500
Bank of Queensland Annual Report 2009104

Notes to and Forming Part of the Financial StatementsYear ended 31 August 2009
33. Key management personnel disclosures (continued)
Loans to key management personnel disclosures(c)
Details of loans outstanding at the reporting date to key management personnel, where the individual’s aggregate loan balance exceeded $100,000 at any time in the reporting period, are as follows:
2009 2008
Balance at 1 September
2008$
Interest paid and payable during the
year$
Balance at
31 August 2009
$
Highest balance during
the year$
Balance at 1 September
2007$
Interest paid and payable during the
year$
Balance at
31 August 2008
$
Highest balance during
the year$
Directors:
Neil Summerson 416,335 26,717 421,910 444,325 79,742 7,544 416,335 432,373
Anthony Howarth 332,148 3,803 - 332,505 - - 332,148 332,148
David Liddy - 89,558 - 3,010,069 - - - -
David Graham 4,109,430 134,528 4,109,261 4,872,672 4,147,107 284,586 4,109,430 4,245,144
Bill Kelty 325,782 17,166 325,782 653,533 325,782 23,498 325,782 325,792
Former Director:
Antony Love 217,750 6,191 - 219,705 278,800 23,989 217,750 497,800
Executive:
Daniel Musson 1,815,807 50,644 1,843,198 2,479,049 400,000 41,378 1,815,807 1,832,596
Former Executives:
Robert Hines 3,880,380 168,897 - 4,877,972 3,132,176 290,992 3,880,380 4,765,279
Len Stone 521,068 27,995 - 524,204 1,085,203 52,070 521,068 1,060,870
All loans with key management personnel are conducted on an arm’s length basis in the normal course of business and on terms and conditions as available to all employees of the Bank.
Details regarding the aggregate of loans made, guaranteed or secured by any entity in the economic entity to all key management personnel and their related parties, and the number of individuals in each group are as follows:
Balance at 1 September
2008 $
Balance at 31 August 2009
$
Interest paid and payable
$
Number in group at
31 August 2009#
Directors: 5,401,445 4,856,953 277,963 6
Executives: 6,217,255 1,843,198 247,536 4
Balance at 1 September
2007$
Balance at 31 August 2008
$
Interest paid and payable
$
Number in group at
31 August 2008#
Directors: 4,831,431 5,401,445 339,617 5
Executives: 6,197,870 6,217,255 434,298 3
105

Notes to and Forming Part of the Financial StatementsYear ended 31 August 2009
33. Key management personnel disclosures (continued)
Other financial instrument transactions with key management personnel and personally-related entities(d)
A number of key management personnel or their related parties hold positions in other entities that result in them having control or significant influence over the financial or operating policies of those entities. Financial instrument transactions with key management personnel and personally-related entities during the financial year arise out of the provision of banking services, the acceptance of funds on deposit, the granting of loans and other associated financial activities. The terms and conditions of the transactions with management personnel and their related parties were no more favourable than those available, or which might reasonably be expected to be available, on similar transactions to non-director related entities on an arm’s length basis. Included in these prior year transactions are certain loans made to the Linfox Group. At 31 August 2009 these facilities totalled nil (2008: $28.2m). DDH Preferred Income Fund (a fund managed by DDH Graham Limited) is a noteholder in the Series 2007-1 REDS Trust holding an investment of 10,000 units at $90.85 totalling $908,533 (2008: 10,000 units at $100.00 totalling $1,000,000). A guarantee of $500,000 provided to DDH Graham Limited for regulatory purposes by Bank of Queensland at the request of its directors, including David Graham and supported by them.
Other non financial instrument transactions with key management personnel
Antony Love is a director of McGees Property which from time to time renders services to the Bank and its controlled entities in the ordinary course of business. Fees paid to the firm by the Bank and its controlled entities during the period September 2008 to 11 December 2008 amounted to $18,809 (2008: $58,031) (1).
Peter Fox and Bill Kelty are directors of Linfox Proprietary Limited of which Linfox Armaguard Pty Ltd is a subsidiary. The Bank has paid $2,404,762 (2008: $1,956,987) to Linfox Armaguard Pty Ltd in the ordinary course of business for cash delivery services. The directors in question have no involvement in the contract negotiation nor the provision of these services.
The Bank of Queensland has entered into a rolling contract with a 2 year termination clause with DDH Graham Limited, of which David Graham is the Executive Chairman. Under this contract, DDH Graham Limited provides funding to the Bank through introduced customer money market deposit accounts, and in turn the Bank pays DDH Graham Limited a commission based on the value of deposited funds held with the Bank. Commission is paid on a monthly basis for the duration of the contract. Commission amounts for these services were billed based on normal market rates and were due and payable under normal payment terms. Commission payments paid to the firm by the Bank during the financial year amounted to $4,539,186 (2008: $4,349,973).
Liabilities recognised at reporting date arising from the above transactions were:
Other transactions with directors, executives and their personally-related entities are conducted on an arm’s length basis and are deemed trivial or domestic in nature.
(1) Antony Love retired as a Director on 11 December 2008.
Bank of Queensland Annual Report 2009106

Notes to and Forming Part of the Financial StatementsYear ended 31 August 2009
33. Key management personnel disclosures (continued)
(d) Other financial instrument transactions with key management personnel and personally-related entities (continued)
The following are transactions undertaken between the Consolidated Entity and key management personnel as at 31 August 2009:
Balance as at For the period (1)
01/09/08$
31/08/09$
Total Loan Repayments
$
Total Loan Redraws / Further Advances
$
Total Loan / Overdraft interest
$
Total Fees on Loans / Overdraft
$
Term Products (Loans / Advances) (11,618,700) (6,700,151) 7,671,091 (7,769,658) (508,754) (17,702)
Balance as at For the period (1)
01/09/07$
31/08/08$
Total Loan Repayments
$
Total LoanRedraws /Further
Advances$
Total Loan / Overdraft interest
$
Total Fees on Loans / Overdraft
$
Term Products (Loans / Advances) (11,029,301) (11,618,700) 10,444,002 (11,197,156) (773,915) (16,398)
Balance as at For the period (1)
01/09/08$
31/08/09$
Total Deposits $
Total Withdrawals
$
Total Account Fees
$
Total Deposit Interest
$
Transaction Products (Deposits) 2,224,558 4,647,223 24,147,893 (19,752,323) (3,666) 253,766
Balance as at For the period (1)
01/09/07$
31/08/08$
Total Deposits$
Total Withdrawals
$Total Account
$
Total Deposit Interest
$
Transaction Products (Deposits) 984,396 2,224,558 16,937,627 (15,792,400) (4,622) 99,557
(1) Amounts are included only for the period that the director / executive are classified as a member of the key management personnel.
107

Notes to and Forming Part of the Financial StatementsYear ended 31 August 2009
34. Controlled entities
Parent entity’s interest
Amount of Investment (at cost)
2009 2008 2009 $m
2008 $m
(a) Particulars in relation to controlled entities
Controlled entities:
B.Q.L. Management Pty Ltd 100% 100% - -
B.Q.L. Nominees Pty Ltd 100% 100% 5.0 5.0
B.Q.L. Properties Limited 100% 100% - -
Queensland Electronic Switching Pty Ltd 100% 100% 0.1 0.1
BOQ Equipment Finance Limited 100% 100% 15.4 15.4
Electronic Financial Solutions Pty Ltd 100% 100% - -
Series 2003-2 REDS Trust 100% 100% - -
Series 2004-1 REDS Trust 100% 100% - -
Series 2005-1 REDS Trust 100% 100% - -
Series 2005-2 REDS Trust 100% 100% - -
REDS Warehouse Trust No.1 100% 100% - -
REDS Warehouse Trust No.2 100% 100% - -
Series 2006-1E REDS Trust 100% 100% - -
Series 2007-1E REDS Trust 100% 100% - -
Series 2007-2 REDS Trust 100% 100% - -
Series 2008-1 REDS Trust 100% 100% - -
Series 2008-2 REDS Trust 100% 100% - -
Series 2008-1E EHP REDS Trust 100% 100% - -
Series 2009-1 REDS Trust 100% - - -
REDS Warehouse Trust No.3 100% 100% - -
Pioneer Permanent Building Society Limited 100% 100% 60.1 60.1
Home Building Society Ltd 100% 100% 600.2 600.2
Home Financial Planning Pty Ltd 100% 100% - -
Horizon Portfolio Services Pty Ltd - 100% - -
Home Direct WA Pty Ltd - 100% - -
Home Credit Management Ltd 100% 100% - -
Statewest Financial Services Ltd 100% 100% - -
Statewest Conveyancing Pty Ltd - 100% - -
Statewest Financial Planning Pty Ltd 100% 100% - -
BOQ Share Plans Nominee Pty Ltd 100% 100% - -
Bank of Queensland Limited Employee Share Plans Trust 100% - 0.2 -
681.0 680.8
Bank of Queensland Annual Report 2009108

Notes to and Forming Part of the Financial StatementsYear ended 31 August 2009
34. Controlled entities (continued)
(b) Acquisition of controlled entities
The following controlled entities were acquired during the prior year:
Acquisition of entities
On 18 December 2007, the Bank acquired all the shares of Home Building Society Ltd (“Home”) for $600.2 million in a combination of cash and ordinary shares in the Bank. Home operates as an authorised deposit taking institution providing various financial services, and includes property development activity via equity accounted investments, and in the period from 18 December 2007 to 31 August 2008 contributed profit of $12.3 million. If the acquisition had occurred on 1 September 2007, management estimates that consolidated total operating income would have been $597.9 million and consolidated profit would have been $133.6 million for the year ended 31 August 2008.
The acquisition had the following effect on the consolidated entity’s assets and liabilities:
Recognised values on acquisition
$m
Pre-acquisition carrying amounts
$m
Cash 37.2 37.2
Loans and advances 2,634.9 2,668.2
Investments accounted for using the equity method 39.2 27.7
Other financial assets 365.6 365.6
Derivative financial instruments 6.0 6.0
Property, plant and equipment 7.0 7.0
Other assets 2.8 2.8
Deferred tax assets 11.9 1.6
Intangible assets 0.5 170.2
Deposits (2,503.5) (2,503.5)
Borrowings including subordinated notes (411.0) (411.0)
Deferred tax liabilities (10.7) (12.4)
Accounts payable and other liabilities (40.2) (40.2)
Provisions (5.5) (4.7)
Net identifiable assets and liabilities 134.2 314.5
Goodwill and other identifiable intangibles on acquisition 466.0
Total Consideration 600.2
Consideration paid, satisfied in Bank ordinary shares (1) 496.9
Consideration paid, satisfied in cash (2) 103.3
Cash acquired (37.1)
Net cash outflow 66.2
(1) Shares were issued at $18.00, based on the closing price on the day of acquisition.
(2) Includes cash of $91.6 million, option payments of $7.4 million and incidental costs of $4.3 million.
At 31 August 2008, the acquisition accounting balances were provisional due to ongoing work finalising valuations and tax related matters which impacted acquisition accounting entries. Finalisation of provisional accounting resulted in restatement of comparatives, refer Note 2 (f).
109

Notes to and Forming Part of the Financial StatementsYear ended 31 August 2009
35. Related parties information
Controlled entities
Details of interests in controlled entities are set out in Note 34.
During the year there have been transactions between the Bank and all of its controlled entities. The Bank conducted normal banking business with its operating controlled entities. Amounts owing to or from controlled entities do not attract interest, except in respect of BOQ Equipment Finance Limited where interest is charged on normal terms and conditions.
The Bank receives management fees from B.Q.L. Management Pty Ltd and BOQ Equipment Finance Limited. In the prior year, the Bank paid management fees and received management fees from Home Building Society Ltd.
The Bank has a related party with equity accounted investees, refer to Note 39.
36. Average balances and margin analysis
Consolidated2009
Consolidated2008
Average Balance
$mInterest
$mAverage Rate
%
Average Balance
$mInterest
$mAverage Rate
%
Interest earning assets
Gross loans and advances at amortised cost * 26,830.5 1,835.2 6.84 22,031.0 1,811.8 8.22
Investments and other securities * 4,107.5 196.0 4.77 3,171.3 231.3 7.29
Total interest earning assets 30,938.0 2,031.2 6.57 25,202.3 2,043.1 8.11
Non-interest earning assets
Property, plant and equipment 25.5 23.9
Other assets 1,044.0 715.4
Provision for impairment (40.8) (20.5)
Total non-interest earning assets 1,028.7 718.8
Total assets 31,938.2 25,921.1
Interest bearing liabilities
Retail deposits * 15,512.6 722.6 4.66 12,354.1 731.7 5.92
Wholesale deposits and borrowings * 14,218.1 827.5 5.82 11,831.1 890.3 7.52
Total interest bearing liabilities 29,730.7 1,550.1 5.21 24,185.2 1,622.0 6.71
Non-interest bearing liabilities 497.5 300.1
Total liabilities 30,228.2 24,485.3
Shareholders’ funds 1,738.5 1,435.8
Total liabilities and shareholders’ funds 31,966.7 25,921.1
Interest margin and interest spread
Interest earning assets 30,938.0 2,031.2 6.57 25,202.3 2,043.1 8.11
Interest bearing liabilities 29,730.7 1,550.1 5.21 24,185.2 1,622.0 6.71
Net interest spread (1) 1.35 1.40
Net interest margin - on average interest earning assets
30,938.0 481.1 1.56 25,202.3 421.1 1.67
* Calculated on average monthly balances
(1) Interest spread is calculated after taking into account third party and OMB commissions.
Bank of Queensland Annual Report 2009110

Notes to and Forming Part of the Financial StatementsYear ended 31 August 2009
37. Deed of cross guarantee
Pursuant to ASIC Class Order 98/1418 (as amended) dated 13 August 1998, certain wholly-owned subsidiaries are relieved from the Corporations Act 2001 requirements for preparation, audit and lodgement of financial reports, and directors’ reports.
It is a condition of the Class Order that the Bank and each of the subsidiaries enter into a Deed of Cross Guarantee. The effect of the Deed is that the Bank guarantees to each creditor payment in full of any debt in the event of winding up of any of the subsidiaries under certain provisions of the Corporations Act 2001. If a winding up occurs under other provisions of the Act, the Bank will only be liable in the event that after six months any creditor has not been paid in full. The subsidiaries have also given similar guarantees in the event that the Bank is wound up.
The subsidiaries to the Deed are:
B.Q.L. Properties Limited;
BOQ Equipment Finance Limited;
B.Q.L. Management Pty Ltd;
Queensland Electronic Switching Pty Ltd;
B.Q.L. Nominees Pty Ltd;
Electronic Financial Solutions Pty Ltd;
BOQ Share Plans Nominee Pty Ltd;
Pioneer Permanent Building Society Limited;
Home Building Society Ltd;
Home Credit Management Ltd; and
StateWest Financial Services Limited.
A consolidated Income Statement and consolidated Balance Sheet, comprising the Bank and its controlled entities which are a party to the Deed, after eliminating all transactions between parties to the Deed of Cross Guarantee, at 31 August 2009 is set out as follows:
Summarised income statement and retained profits
Consolidated
2009$m
2008$m
Profit before tax 188.6 182.6
Less: Income tax expense 52.2 47.9
Profit for the year 136.4 134.7
Retained profits at beginning of year 192.8 152.0
Dividends to shareholders (116.1) (98.1)
Equity settled transactions and transfers (24.8) 4.2
Retained profits at end of year 188.3 192.8
Attributable to:
Equity holders of the parent 136.4 134.7
Profit for the year 136.4 134.7
111

Notes to and Forming Part of the Financial StatementsYear ended 31 August 2009
37. Deed of cross guarantee (continued)
BALANCE SHEETAs at 31 August 2009
Consolidated
2009$m
2008$m
Assets
Cash and liquid assets 250.6 242.9
Due from other financial institutions 74.6 133.0
Other financial assets 4,535.1 2,931.1
Derivative financial instruments 58.7 74.9
Loans and advances at amortised cost 28,310.9 21,161.3
Shares in controlled entities - 660.3
Property, plant and equipment 24.5 18.3
Deferred tax assets 13.6 -
Other assets 251.5 179.1
Intangible assets 587.8 100.9
Total assets 34,107.3 25,501.8
Liabilities
Due to other financial institutions 192.7 135.6
Deposits 24,402.8 17,786.1
Derivative financial instruments 205.0 109.0
Accounts payable and other liabilities 254.7 230.3
Current tax liabilities 24.2 0.3
Provisions 20.8 12.7
Deferred tax liabilities - 15.4
Borrowings including subordinated notes 1,358.1 818.5
Amounts due to controlled entities 5,544.9 4,708.6
Total liabilities 32,003.2 23,816.5
Net assets 2,104.1 1,685.3
Equity
Issued capital 1,903.1 1,439.4
Reserves 12.7 53.1
Retained profits 188.3 192.8
Total equity 2,104.1 1,685.3
Bank of Queensland Annual Report 2009112

Notes to and Forming Part of the Financial StatementsYear ended 31 August 2009
38. Events subsequent to balance date
Dividends have been declared after 31 August 2009, refer to Note 7.
The financial effect of the above transactions have not been brought to account in the financial statements for the year ended 31 August 2009.
On 18 September 2009 the retail entitlement offer settled at an issue price of $10.00 and 11,080,536 ordinary shares were issued.
39. Investments accounted for using the equity method
The Consolidated Entity’s share of profit in its equity accounted investees for the year was $0.7m (2008: $1.3m).
The principal activity of the joint venture entities is land subdivision, development and sale. Details of material interest in joint ventures are as follows:
Percentage Ownership Interest
2009(%)
2008(%)
Ocean Springs Pty Ltd (Brighton) 9.31 9.31
Dalyellup Beach Pty Ltd (Dalyellup) 17.08 17.08
Wanneroo North Pty Ltd (The Grove) 21.42 21.42
East Busselton Estate Pty Ltd (Provence) 25.00 25.00
Coastview Nominees Pty Ltd (Margaret River) 5.81 5.81
Satterlley Austin Cove Pty Ltd (Austin Cove) 4.18 4.18
Provence 2 Pty Ltd (Provence 2) 25.00 25.00
Crestview Asset Pty Ltd (Beacham Road) 7.36 7.36
The above companies are proprietary companies incorporated in Australia. An impairment loss of $5.4m was recognised in the income statement this financial year relating to the investment in joint ventures. There are no material capital commitments relating to the joint ventures.
Summary financial information for equity accounted investees, not adjusted for the percentage ownership held by the consolidated entity and fair value adjustments on acquisition is contained in the table below:
2009$m
2008$m
Balance Sheet
Current assets 127.6 131.6
Non-current assets 180.4 188.0
Total assets 308.0 319.6
Current liabilities 81.5 46.9
Non-current liabilities 6.1 54.5
Total liabilities 87.6 101.4
Net assets 220.4 218.2
Profit and Loss
Revenues 55.1 94.7
Expenses 37.7 38.6
Profit 17.4 56.1
113

1 In the opinion of the directors of Bank of Queensland Limited (“the Bank”):
(a) the financial statements and notes, including the remuneration disclosures that are contained in the Remuneration report of the Directors’ report, set out on pages 24 to 113, are in accordance with the Corporations Act 2001, including:
(i) giving a true and fair view of the financial position of the Bank and Consolidated Entity as at 31 August 2009 and of their performance, for the year ended on that date; and
(ii) complying with Australian Accounting Standards (including the Australian Accounting Interpretations) and the Corporations Regulations 2001.
(b) the financial report also complies with International Financial Reporting Standards as disclosed in Note 2 (a);
(c) the remuneration disclosures that are contained in the Remuneration report of the Directors’ Report comply with Australian Accounting Standard AASB 124 Related Party Disclosures, the Corporations Act 2001 and the Corporations Regulations 2001; and
(d) there are reasonable grounds to believe that the Bank will be able to pay its debts as and when they become due and payable.
2 There are reasonable grounds to believe that the Bank and the Controlled Entities identified in Note 37 will be able to meet any obligations or liabilities to which they are or may become subject to by virtue of the Deed of Cross Guarantee between the Bank and those Controlled Entities pursuant to ASIC Class Order 98/1418.
3 The directors have been given the declarations required by Section 295A of the Corporations Act 2001 from the Chief Executive Officer and Chief Financial Officer for the financial year ended 31 August 2009.
Signed in accordance with a resolution of the directors:
Neil Summerson David Liddy
Chairman Managing Director
Dated at Brisbane this fifteenth day of October 2009
Directors’ Declaration
Bank of Queensland Annual Report 2009114

Independent Audit Reportto members of Bank of Queensland Limited
Report on the financial report
We have audited the accompanying financial report of Bank of Queensland Limited (the “Bank”), which comprises the Balance Sheets as at 31 August 2009, and the Income Statements, Statements of Recognised Income and Expense and Statements of Cash Flows for the year ended on that date, a summary of significant accounting policies and other explanatory notes 1 to 39 and the directors’ declaration of the Consolidated Entity comprising the Bank and the entities it controlled at the year’s end or from time to time during the financial year.
Directors’ responsibility for the financial report
The directors of the Bank are responsible for the preparation and fair presentation of the financial report in accordance with Australian Accounting Standards (including the Australian Accounting Interpretations) and the Corporations Act 2001. This responsibility includes establishing and maintaining internal control relevant to the preparation and fair presentation of the financial report that is free from material misstatement, whether due to fraud or error; selecting and applying appropriate accounting policies; and making accounting estimates that are reasonable in the circumstances. In note 2 (a), the directors also state, in accordance with Australian Accounting Standard AASB 101 Presentation of Financial Statements, that the financial report of the Consolidated Entity and the Bank, comprising the financial statements and notes, comply with International Financial Reporting Standards.
The directors of the Bank are also responsible for the remuneration disclosures contained in the directors’ report.
Auditor’s responsibility
Our responsibility is to express an opinion on the financial report based on our audit. We conducted our audit in accordance with Australian Auditing Standards. These Auditing Standards require that we comply with relevant ethical requirements relating to audit engagements and plan and perform the audit to obtain reasonable assurance whether the financial report is free from material misstatement.
An audit involves performing procedures to obtain audit evidence about the amounts and disclosures in the financial report. The procedures selected depend on the auditor’s judgement, including the assessment of the risks of material misstatement of the financial report, whether due to fraud or error. In making those risk assessments, the auditor considers internal control relevant to the entity’s preparation and fair presentation of the financial report in order to design audit procedures that are appropriate in the circumstances, but not for the purpose of expressing an opinion on the effectiveness of the entity’s internal control. An audit also includes evaluating the appropriateness of accounting policies used and the reasonableness of accounting estimates made by the directors, as well as evaluating the overall presentation of the financial report.
We performed the procedures to assess whether in all material respects the financial report presents fairly, in accordance with the Corporations Act 2001 and Australian Accounting Standards (including the Australian Accounting Interpretations), a view which is consistent with our understanding of the Bank’s and the Consolidated Entity’s financial position and of their performance.
We believe that the audit evidence we have obtained is sufficient and appropriate to provide a basis for our audit opinion.
Independence
In conducting our audit, we have complied with the independence requirements of the Corporations Act 2001.
Auditor’s opinion
In our opinion:
(a) The financial report of Bank of Queensland Limited is in accordance with the Corporations Act 2001, including:
(i) giving a true and fair view of the Bank’s and the Consolidated Entity’s financial position as at 31 August 2009 and of their performance for the year ended on that date; and
(ii) complying with Australian Accounting Standards (including the Australian Accounting Interpretations) and the Corporations Regulations 2001.
(b) The financial report of the Consolidated Entity and Bank also comply with International Financial Reporting Standards as disclosed in note 2 (a).
KPMG, an Australian partnership, is part of the KPMG International network.
KPMG International is a Swiss cooperative.
115

Report on the remuneration report
We have audited the remuneration report included in pages 28 to 44 of the directors’ report for the year ended 31 August 2009. The directors of the Bank are responsible for the preparation and presentation of the remuneration report in accordance with Section 300A of the Corporations Act 2001. Our responsibility is to express an opinion on the remuneration report, based on our audit conducted in accordance with auditing standards.
Auditor’s opinion
In our opinion, the remuneration report of Bank of Queensland Limited for the year ended 31 August 2009, complies with Section 300A of the Corporations Act 2001.
KPMG
John Teer
Partner
Brisbane, 15 October 2009
Independent Audit Reportto members of Bank of Queensland Limited
KPMG, an Australian partnership, is part of the KPMG International network.
KPMG International is a Swiss cooperative.
Bank of Queensland Annual Report 2009116

Shareholding Details
As at 24 September 2009, the following shareholding details applied:
1. Twenty largest ordinary shareholders
Shareholder No. of ordinary shares %
HSBC Custody Nominees (Australia) Limited 29,872,611 14.17
National Nominees Limited 19,490,787 9.24
J P Morgan Nominees Australia Limited 14,056,169 6.67
Milton Corporation Limited 4,432,296 2.10
UBS Nominees Pty Ltd 4,127,964 1.96
Citicorp Nominees Pty Limited 3,900,648 1.85
ANZ Nominees Limited 3,380,507 1.60
HSBC Custody Nominees (Australia) Limited – GSCO ECA 2,634,877 1.25
UBS Nominees Pty Ltd 2,049,749 0.97
RBC Dexia Investor Services Australia Nominees Pty Limited 2,037,181 0.97
Linfox Share Investment No.2 Pty Ltd 1,971,666 0.94
Queensland Investment Corporation 1,934,761 0.92
AMP Life Limited 1,582,540 0.75
Citicorp Nominees Pty Limited 1,504,060 0.71
Cogent Nominees Pty Limited 1,358,403 0.64
Washington H Soul Pattinson and Company Limited 1,310,907 0.62
Invia Custodian Pty Limited 1,094,171 0.52
HSBC Custody Nominees (Australia) Limited – A/c 2 957,326 0.45
Choiseul Investments Limited 916,900 0.43
Mr David Paul Liddy(1) 766,016 0.36
Total 99,379,539 47.12
(1) Including shares held beneficially, Mr David Paul Liddy holds 1,018,052 as at 24 September 2009.
Voting rights
On a show of hands every person present who is a holder of ordinary shares or a duly appointed representative of a holder of ordinary shares has one vote, and on a poll each member present in person or by proxy or attorney has one vote for each share that person holds.
117

Shareholding Details
2. Twenty largest RePS shareholders
Shareholder No. of RePS shares %
ANZ Nominees Limited 26,630 5.64
Milton Corporation Limited 15,598 3.31
Taverner No 11 Pty Ltd 8,250 1.75
National Nominees Limited 8,050 1.71
Argo Investments Limited 7,500 1.59
Citicorp Nominees Pty Limited 5,775 1.22
The Synod of the Diocese of Adelaide of the Anglican Church of Australia Inc 5,380 1.14
Questor Financial Services Limited 5,125 1.09
Choiseul Investments Limited 5,000 1.06
M F Custodians Ltd 4,702 1.00
Cogent Nominees Pty Limited 4,201 0.89
Mr Kevin Joseph Troy & Mrs Dawn Troy 3,495 0.74
Laidlaw Family Investments Pty Ltd 3,000 0.64
Mrs Eily Dawn Campbell 3,000 0.64
Baker Custodian Corporation 3,000 0.64
Miss Joan Sorrell Norris 3,000 0.64
The Trustees of the Diocese of Tasmania 2,962 0.63
Mr Alan Muir Greenfield 2,800 0.59
HSBC Custody Nominees (Australia) Limited 2,515 0.53
Uniting Church in Australia Property Trust (WA) 2,500 0.53
Total 122,483 25.98
Voting rights
The RePS do not give the holders any voting rights at any general shareholders meetings, except in certain circumstances.
Bank of Queensland Annual Report 2009118

Shareholding Details
3. Twenty largest PEPS shareholders
Shareholder No. of PEPS shares %
J P Morgan Nominees Australia Limited 194,460 9.72
RBC Dexia Investor Services Australia Nominees Pty Limited 77,554 3.88
Milton Corporation Limited 50,000 2.50
Domer Mining Co Pty Ltd 32,200 1.61
Cogent Nominees Pty Limited 19,000 0.95
Count Financial Limited 18,000 0.90
RBC Dexia Investor Services Australia Nominees Pty Limited 16,922 0.85
HSBC Custody Nominees (Australia) Limited 15,068 0.75
Australian Executor Trustees Limited 14,176 0.71
National Nominees Limited 13,429 0.67
Citicorp Nominees Pty Limited 13,000 0.65
FJP Pty Ltd 10,663 0.53
Eastcote Pty Ltd 10,000 0.50
The Baptist Union of Queensland 10,000 0.50
Presbyterian Church of Victoria Trusts 10,000 0.50
Corlette Holdings Pty Ltd 10,000 0.50
F & B Investments Pty Limited 10,000 0.50
Blann Investments Pty Limited 9,144 0.46
Equity Trustees Limited 9,100 0.46
Baptist Investments and Finance Ltd 8,546 0.43
Total 551,262 27.57
Voting rights
The PEPS do not give the holders any voting rights at any general shareholders meetings, except in certain circumstances.
119

Shareholding Details
4. Distribution of equity security holders
Ordinary shares RePs S1RPS PEPS
Category 2009 2008 2009 2008 2009 2008 2009 2008
1 - 1,000 60,821 64,5451,089 1,170
- 704,027 4,169
1,001 - 5,000 19,937 16,845 52 50 - 12 158 142
5,001 – 10,000 2,340 1,752 6 5 - 4 24 20
10,001 – 100,000 1,094 878 2 2 - 8 11 11
100,001 – and over 68 52 - - - 2 1 1
Total 84,260 84,072 1,149 1,227 - 96 4,221 4,343
The number of ordinary shareholders holding less than a marketable parcel is 2,493.
The number of reset preference shareholders holding less than a marketable parcel is 1.
The number of perpetual equity preference shareholders holding less than a marketable parcel is nil.
5. Partly paid shares
There are no partly paid shares.
6. The names of substantial shareholders in the Bank and the number of shares in which each has an interest as disclosed in substantial shareholder notices given to the Bank are:
Substantial shareholders No. of ordinary shares in which
interest is held (at date of notification) Date of notification
BRED Banque Et Populaire 26,359,271 2 September 2009
7. Stock exchange listing
The shares of Bank of Queensland Limited (“BoQ”), RePS (“BOQPA”), and PEPS (“BOQPC”) are quoted on the Australian Securities Exchange.
8. Options
At 31 August 2009 there were options over 8,899,281 (2008: 9,987,338) unissued ordinary shares. There are no voting rights attached to the unissued ordinary shares. Voting rights will be attached to the unissued ordinary shares when the options have been exercised.
9. On market buy-back
There is no current on market buy-back.
10. Other information
Bank of Queensland Limited is a publicly listed company limited by shares and is incorporated and domiciled in Australia.
Bank of Queensland Annual Report 2009120