Growth and physiological responses of snapper ( Pagrus ...
152
Department of Environment and Agriculture School of Science Growth and physiological responses of snapper (Pagrus auratus) and cobia (Rachycentron canadum) fed various inclusion levels of selenium supplemented lupin meal as fishmeal replacement diets Pham Duc Hung This thesis is presented for the Degree of Doctor of Philosophy of Curtin University July 2016
Transcript of Growth and physiological responses of snapper ( Pagrus ...
Department of Environment and Agriculture
School of Science
Growth and physiological responses of snapper (Pagrus auratus) and cobia (Rachycentron canadum) fed various inclusion levels of
selenium supplemented lupin meal as fishmeal replacement diets
Pham Duc Hung
This thesis is presented for the Degree of Doctor of Philosophy
of Curtin University
July 2016
DECLARATION
To the best of my knowledge and belief this thesis contains no material previously
published by any other person except where due acknowledgment has been made.
This thesis contains no material which has been accepted for the award of any other
degree or diploma in any university.
The research presented and reported in this thesis was conducted in compliance with the
National Health and Medical Research Council Australian code for the care and use of
animals for scientific purposes 8th edition (2013). The proposed research study received
animal ethics approval from the Curtin University Animal Ethics Committee, Approval
Number AEC_2013_11.
Signature
Date: 8 July, 2016
ii
ACKNOWLEDGEMENTS
I would like to thank Curtin University and Ministry of Education and Training
Vietnam (MoET) for sponsoring me to undertake a PhD study at the Department of
Environment and Aquatic Science, Curtin University, Perth, Western Australia. Without
their support my research would have been very difficult.
Sincere thanks are due to my supervisor, Professor. Dr Ravi Fotedar for his support,
encouragement and advice during my study. His guidance in experimental design,
producing articles for publication and thesis preparation are invaluable which have given
me the confidence and inspiration to complete my PhD.
I would like thank to Batavia Coast Maritime Institute for supplying snapper and
facilities. Sincere thanks to Dr Suresh Job, Dr Colin Johnson, Daniel Hoare and Kym
Lockwood and technical staff in Batavia Coast Maritime Institute for their invaluable
help in setting up experimental system and implementation of feeding experiments in
snapper.
I am grateful to the ARSS Company for cobia and experimental facilities support. I
would like thank to Mr Anh Duc Le, Ut Van Phan, Kien Dac Nguyen and other
technicians in the company for their assistance during experimental design and
implementation of cobia trials in Vietnam.
I would also like to thank Dr Xung Van Vu, former rector of Nha Trang University,
Associate Professor Trung Si Trang, Rector of Nha Trang University, Associate
Professor Dr Hung Van Lai, Dr Hung Quoc Pham, Dr Sy Tan Nguyen, Mr Luong Duc
Tran and other staff in the university for their help to offer the opportunity to study PhD
in Australia.
I am grateful to other academics in Curtin University: Simon Longbottom for his help in
ordering chemicals and feed ingredients; Dr Jane Fewtrell for her guidance in laboratory
work at Curtin Aquatic Research Laboratories; Mrs Anne Barnes for her assistance in
preparation of animal ethic applications.
Thanks also to post-graduate students at the Aquatic Science Research Unit, Department
of Environment and Aquatic Science and my friends: Ky, Huy, Ha, Tin, Binh, Quy,
Ilham, Irfan, Anthony, Dong, Quang and Thanh for their great help, encouragement and
sharing experience and happiness during my study in Australia.
iii

Finally, my deepest thanks go to my family for their hope, dreams and prayers,
especially my wife and my kids who have daily encouraged and continuously supported
me throughout my PhD.
iv
PREAMBLE
The thesis includes six chapters. The brief overviews about the use of dietary selenium
(Se) supplementation, fishmeal replacement in fish are presented in chapter 1. This
chapter also clarifies the current issues related to Australian snapper Pagrus auratus and
cobia Rachycentron canadum aquaculture. The aim, main objectives and significance of
this research also are highlighted in this chapter.
The literature review in chapter 2 reviews the biology, aquaculture and nutritional
research in snapper and cobia. The relevant information on Se and its effects on growth
and physiology in fish also are described. The chapter also reviews the nutritional values
and uses of lupin meal as alternative protein sources to reduce the fishmeal reliance in
aqua-feeds.
The material and methodology of this research are presented in chapter 3. This chapter
details the preparation of experimental diets, fish rearing methodologies, sample
collections, sample analysis and data analysis of five feeding trials which starts with first
trial on evaluating the effects of organic selenium in juvenile snapper fed reconstituted
commercial and formulated basal diets. Following sections describe the material and
methods of the second trial which determined the effects of various levels of organic Se
on juvenile cobia fed a commercial feed. Following sections display the methodologies
of the third and fourth feeding experiments to evaluate effects of dietary lupin kernel
meal as fishmeal replacement on growth and physiological responses of snapper and
cobia, respectively. The material and methods of the last trial on determining the effects
of organic Se on juvenile cobia fed lupin-based diets are presented in the last section of
this chapter.
All experimental results of the five trials are presented in chapter 4
Chapter 5 summaries and discusses all results in this study. The discussion not only
follows the order of five trials but tries to amalgamate the discussion into one coherent
theme. The evaluations of the results in the current study with previous research on the
use of Se supplementation and plant protein inclusion in aqua-feeds also are discussed in
this chapter. The interrelationship between dietary Se and protein sources on growth and
physiological responses of fish also are presented and discussed.
The main conclusions and recommendations for future research are highlighted in the
chapter 6. The last chapter, the chapter 7 includes all the references used in this thesis.
v
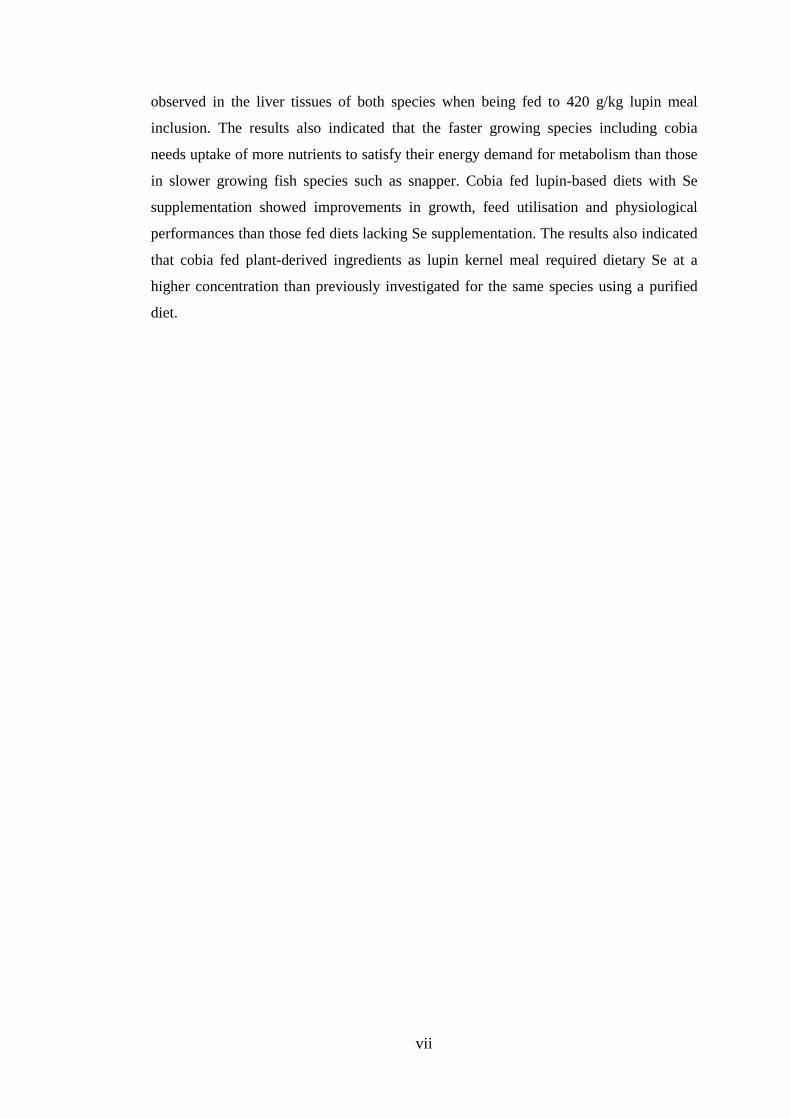
ABSTRACT
The past literature has demonstrated the beneficial effects of dietary mineral
supplementation such as zinc and copper on growth and physiological performances in
fish fed plant-based diets. However, the relationship between dietary selenium (Se), an
essential mineral for growth and physiological functions in aquatic species, with plant-
derived ingredients such as lupin meal is very limited and never researched in
commercially important carnivorous marine finfish species such as Australian snapper
Pagrus auratus and cobia Rachycentron canadum. A series of five feeding trials were
conducted to investigate the nutritional effects of dietary Se and lupin kernel meal on the
responses of growth and physiology of snapper and cobia.
In the first experiment, Australian snapper were fed to a reconstituted commercial diet
and formulated basal diet with 0 and 0.8 mg/kg Se supplementation to evaluate the
effects of dietary supplemental Se on the growth, feed utilisation, body composition and
liver histology of juvenile Australian snapper. In the second experiment, five levels of Se
extracted from Se-yeast were supplemented to a commercial cobia feed to determine the
dietary Se requirement for juvenile cobia. The third and fourth trials evaluated the
growth and physiological responses of both snapper and cobia after being fed to various
inclusion levels of 0, 105, 210, 315 and 420 g/kg lupin kernel meal as fishmeal
replacement which presented in a comparative study. The last experiment investigated
effects of dietary Se supplementation on growth and physiological performances of
juvenile cobia fed lupin-based diets.
The results indicated that snapper required a lower concentration of dietary protein than
the currently used diets derived from other commercial marine finfish and there is no
need to provide supplementary Se to the snapper diet, as basic dietary ingredients are
capable of providing adequate Se to meet the nutritional requirements of the species.
Juvenile cobia fed available commercial cobia feed containing 1.15 mg/kg showed
deficient-Se symptoms. The dietary Se concentration required for juvenile cobia fed
pelleted formulated feed was 2.32 mg/kg based on the quadratic regression of specific
growth rate, whereas dietary Se of 3.14 mg/kg may be threshold level for the species.
Cobia showed less susceptibility to dietary lupin than snapper. Snapper displayed
negative growth and feed efficiency with increasing inclusion lupin levels. Meanwhile,
the dietary inclusion level of 105 g/kg lupin kernel meal did not impair the growth rates
and feed efficiency, digestibility and health of cobia. The histopathological lesions were
vi
observed in the liver tissues of both species when being fed to 420 g/kg lupin meal
inclusion. The results also indicated that the faster growing species including cobia
needs uptake of more nutrients to satisfy their energy demand for metabolism than those
in slower growing fish species such as snapper. Cobia fed lupin-based diets with Se
supplementation showed improvements in growth, feed utilisation and physiological
performances than those fed diets lacking Se supplementation. The results also indicated
that cobia fed plant-derived ingredients as lupin kernel meal required dietary Se at a
higher concentration than previously investigated for the same species using a purified
diet.
vii
TABLE OF CONTENTS
DECLARATION ........................................................................................................ ii
ACKNOWLEDGEMENTS ...................................................................................... iii
PREAMBLE ............................................................................................................... v
ABSTRACT ............................................................................................................... vi
TABLE OF CONTENTS ........................................................................................ viii
LIST OF TABLES ................................................................................................... xii
LIST OF FIGURES ................................................................................................ xiv
LIST OF ABBREVIATIONS ................................................................................ xvi
LIST OF COMMON AND SCIENTIFIC NAMES ............................................ xvii
LIST OF PUBLICATIONS .................................................................................. xviii
CHAPTER 1. INTRODUCTION ............................................................................. 1
1.1 BACKGROUND ........................................................................................... 1
1.2 AIM ............................................................................................................... 4
1.3 OBJECTIVES ............................................................................................... 4
1.4 SIGNIFICANCE ........................................................................................... 4
CHAPTER 2. LITERATURE REVIEW ................................................................. 6
2.1 SELENIUM ................................................................................................... 6
2.1.1 Selenium sources and bioavailability ..................................................... 6
2.1.2 Selenium requirement in fish ................................................................. 6
2.1.3 Selenium deficiency and toxicity ........................................................... 9
2.1.4 The interaction between Se and other nutrients ................................... 11
2.1.5 Effects of dietary selenium on growth and feed utilization in fish ...... 12
2.1.6 Effects of dietary selenium on physiological responses ...................... 15
2.1.7 Selection of selenium form .................................................................. 18
2.2 LUPIN MEAL PRODUCTION AND USE IN AQUACULTURE ............ 19
2.2.1 Lupin production .................................................................................. 19
2.2.2 Nutritional values of lupin ................................................................... 19
2.2.3 Use of lupin in aqua-feeds.................................................................... 24
2.3 SNAPPER AND COBIA TAXONOMY AND BIOLOGY ....................... 30
2.3.1 Snapper ................................................................................................. 30
2.3.2 Cobia .................................................................................................... 31
viii
2.4 SNAPPER AND COBIA AQUACULTURE AND NUTRTIONAL RESEARCH ........................................................................................................... 33
2.4.1 Snapper aquaculture ............................................................................. 33
2.4.2 Cobia aquaculture................................................................................. 34
2.4.3 Nutritional research on snapper ........................................................... 36
2.4.4 Nutritional research on cobia ............................................................... 37
CHAPTER 3. MATERIALS AND METHODS .................................................... 41
EXPERIMENT 1: EFFECTS OF DIETARY SELENIUM 3.1SUPPLEMENTATION ON NUTRITIONAL AND PHYSIOLOGICAL RESPONSES OF SNAPPER ................................................................................. 41
3.1.1 Experimental diets ................................................................................ 41
3.1.2 Fish rearing .......................................................................................... 42
3.1.3 Sample collection ................................................................................. 43
3.1.4 Chemical analysis................................................................................. 43
3.1.5 Histological examination ..................................................................... 43
3.1.6 Calculations and statistical analysis ..................................................... 44
EXPERIMENT 2: NUTRITIONAL ROLES OF SELENIUM 3.2SUPPLEMENTATION ON GROWTH AND PHYSIOLOGICAL PERFORMANCES OF COBIA ............................................................................ 45
3.2.1 Experimental diet ................................................................................. 45
3.2.2 Fish rearing .......................................................................................... 45
3.2.3 Sample collection ................................................................................. 46
3.2.4 Chemical, haematological and enzymatic analysis .............................. 46
3.2.5 Histological evaluation......................................................................... 46
3.2.6 Statistical analysis ................................................................................ 46
EXPERIMENT 3: NUTRITIONAL AND PHYSIOLOGICAL 3.3RESPONSES OF SNAPPER FED VARIOUS DIETARY LUPIN KERNEL MEAL INCLUSIONS ............................................................................................ 47
3.3.1 Experimental diet preparation .............................................................. 47
3.3.2 Fish rearing .......................................................................................... 49
3.3.3 Sample collection ................................................................................. 49
3.3.4 Chemical analysis................................................................................. 50
3.3.5 Haematological examination ................................................................ 50
3.3.6 Histological evaluation......................................................................... 50
3.3.7 Statistical analysis ................................................................................ 51
ix
EXPERIMENT 4: NUTRITIONAL AND PHYSIOLOGICAL 3.4RESPONSES OF COBIA FED DIETARY LUPIN KERNEL MEAL LEVELS . 52
3.4.1 Experimental diet preparation .............................................................. 52
3.4.2 Fish rearing .......................................................................................... 52
3.4.3 Sample collection ................................................................................. 52
3.4.4 Chemical analysis................................................................................. 52
3.4.5 Histological evaluation......................................................................... 53
3.4.6 Calculations and statistical analysis ..................................................... 53
EXPERIMENT 5: BENEFICIAL EFFECTS OF SELENIUM 3.5SUPPLEMENTATION ON COBIA FED LUPIN-BASED DIETS ..................... 53
3.5.1 Experimental diet preparation .............................................................. 53
3.5.2 Fish rearing .......................................................................................... 55
3.5.3 Sample collection ................................................................................. 55
3.5.4 Chemical and haematological analysis ................................................ 56
3.5.5 Statistical analysis ................................................................................ 56
CHAPTER 4. RESULTS ......................................................................................... 58
4.1 EXPERIMENT 1: EFFECTS OF DIETARY SELENIUM SUPPLEMENTATION ON NUTRITIONAL AND PHYSIOLOGICAL RESPONSES OF SNAPPER ................................................................................. 58
4.1.1 Growth performance and feed utilisation ............................................. 58
4.1.2 Somatic indices .................................................................................... 60
4.1.3 Proximate composition ........................................................................ 61
4.1.4 Histological evaluation......................................................................... 64
4.2 EXPERIMENT 2: NUTRITIONAL ROLES OF SELENIUM SUPPLEMENTATION ON GROWTH AND PHYSIOLOGICAL PERFORMANCES OF COBIA ............................................................................ 65
4.2.1 Growth performances and feed utilization ........................................... 65
4.2.2 Body and muscle composition ............................................................. 66
4.2.3 Haematological and glutathione peroxidase responses ........................ 68
4.2.4 Somatic indices .................................................................................... 69
4.2.5 Histological examination ..................................................................... 69
4.3 EXPERIMENT 3 & 4: NUTRTIONAL AND PHYSIOLOGICAL RESPONSES OF SNAPPER AND COBIA FED DIETARY LUPIN KERNEL MEAL LEVELS .................................................................................................... 71
4.3.1 Growth and feed utilisation .................................................................. 71
x
4.3.2 Digestibility .......................................................................................... 73
4.3.3 Proximate compositions ....................................................................... 74
4.3.4 Somatic indices and haematological parameters.................................. 76
4.3.5 Amino acid profiles .............................................................................. 77
4.3.6 Histological evaluations ....................................................................... 77
4.4 EXPERIMENT 5: BENEFICIAL EFFECTS OF SELENIUM SUPPLEMENTATION ON COBIA FED LUPIN-BASED DIETS ..................... 80
4.4.1 Growth and feed utilisation performances ........................................... 80
4.4.2 Digestibility .......................................................................................... 82
4.4.3 Haematological parameters .................................................................. 82
4.4.4 Proximate composition ........................................................................ 82
CHAPTER 5. DISCUSSIONS ................................................................................ 85
5.1. INTRODUCTION ....................................................................................... 85
5.2. EFFECTS OF DIETARY ORGANIC SELENIUM SUPPLEMENTATION IN SNAPPER ......................................................................................................... 88
5.3. EFFECTS OF DIETARY SELENIUM SUPPLEMENTATION IN COBIA FED COMMERCIALLY AVAILABLE DIET ..................................................... 92
5.4. EFFECTS OF DIETARY LUPIN MEAL INCLUSION IN SNAPPER AND COBIA .......................................................................................................... 97
5.5. ROLES OF MINERAL SUPPLEMENTATION IN FISH FED PLANT-BASED DIETS .................................................................................................... 104
5.6. EFFECTS OF DIETARY ORGANIC SELENIUM SUPPLEMENTATION IN COBIA FED LUPIN-BASED DIETS ............................................................ 106
CHAPTER 6. CONCLUSIONS, RESEARCH LIMITATION AND RECOMMENDATIONS ....................................................................................... 111
6.1 CONCLUSIONS ....................................................................................... 111
6.2 LIMITATIONS ......................................................................................... 112
6.3 RECOMMENDATIONS .......................................................................... 112
REFERENCES ....................................................................................................... 114
xi
LIST OF TABLES
Table 2.1.1 Bioavailability of dietary Se forms in fish ................................................ 7 Table 2.1.2 Dietary Se requirement in fish .................................................................. 8 Table 2.1.3 Effects of Se deficiency in fish ................................................................. 9 Table 2.1.4 Toxic levels of Se in fish......................................................................... 10 Table 2.2.1 Chemical composition (% or MJ/kg) of lupin kernel meal species, soybean meal and fishmeal ........................................................................................ 20 Table 2.2.2 Essential amino acid composition (g/16 g N) in lupin species and other feed ingredients .......................................................................................................... 20 Table 2.2.3 Mineral concentrations in lupin species .................................................. 21 Table 2.2.4 Anti-nutrient concentrations in narrow-leafed lupin and other plant-derived ingredients ..................................................................................................... 24 Table 2.2.5 Overview fishmeal replacement by lupin meals in diet for fish ............. 29 Table 3.1.1 Ingredient composition of the formulated basal diet .............................. 41 Table 3.1.2 Proximate compositions (dry weight basic) of the test diets .................. 42 Table 3.3.1 Feed ingredient composition (g/100 g or MJ/kg in dry matter) .............. 47 Table 3.3.2 Ingredients and composition of the experimental diets g/kg in dry weight)........................................................................................................................ 48 Table 3.5.1 Ingredients and composition of the experimental diets (g/kg in dry weight)........................................................................................................................ 54 Table 3.5.2 Feed ingredient composition (g/100 g or MJ/kg in dry matter) unless specified ..................................................................................................................... 55 Table 3.5.3 Essential amino acid profiles of the experimental diets (g/100g dry sample) ....................................................................................................................... 56 Table 4.1.1 Growth performances of Australian snapper fed diets with Se supplementation ......................................................................................................... 58 Table 4.1.2 Feed utilisation of Australian snapper fed diets with Se supplementation .................................................................................................................................... 59 Table 4.1.3 Somatic indices and Se contents of Australian snapper fed diets with Se supplementation ......................................................................................................... 60 Table 4.1.4 Body compositions of Australian snapper fed diets with Se supplementation ......................................................................................................... 62 Table 4.1.5 Muscle composition, liver lipid and tissue Se depositions in Australian snapper fed diets with Se supplementation ................................................................ 63 Table 4.2.1 Growth performances of cobia fed diets containing various inclusion levels of Se for 8 weeks ............................................................................................. 65 Table 4.2.2 Feed utilization of cobia fed diets containing various inclusion levels of Se for 8 weeks ............................................................................................................ 66 Table 4.2.3 Whole-body and muscle compositions of cobia fed test diets ................ 67 Table 4.2.4 Liver lipid and Se accumulation in the tissues ........................................ 67 Table 4.2.5 Haematological parameters of cobia fed test diets .................................. 68
xii
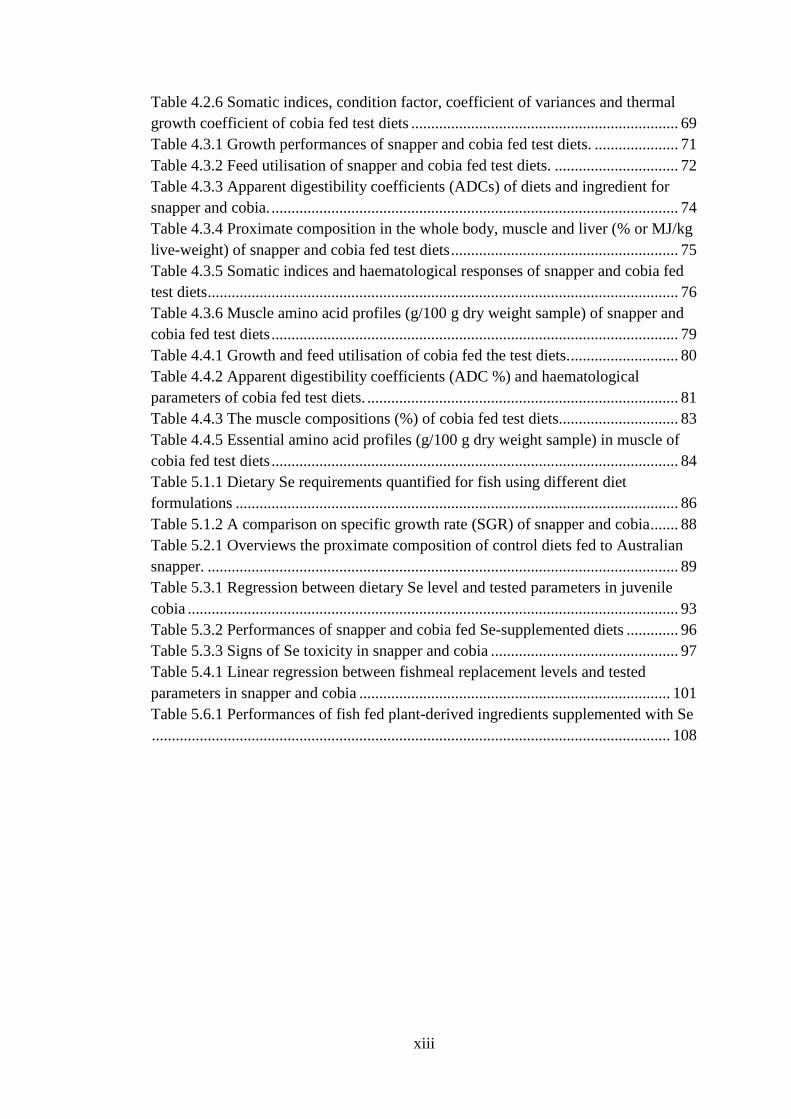
Table 4.2.6 Somatic indices, condition factor, coefficient of variances and thermal growth coefficient of cobia fed test diets ................................................................... 69 Table 4.3.1 Growth performances of snapper and cobia fed test diets. ..................... 71 Table 4.3.2 Feed utilisation of snapper and cobia fed test diets. ............................... 72 Table 4.3.3 Apparent digestibility coefficients (ADCs) of diets and ingredient for snapper and cobia. ...................................................................................................... 74 Table 4.3.4 Proximate composition in the whole body, muscle and liver (% or MJ/kg live-weight) of snapper and cobia fed test diets ......................................................... 75 Table 4.3.5 Somatic indices and haematological responses of snapper and cobia fed test diets ...................................................................................................................... 76 Table 4.3.6 Muscle amino acid profiles (g/100 g dry weight sample) of snapper and cobia fed test diets ...................................................................................................... 79 Table 4.4.1 Growth and feed utilisation of cobia fed the test diets. ........................... 80 Table 4.4.2 Apparent digestibility coefficients (ADC %) and haematological parameters of cobia fed test diets. .............................................................................. 81 Table 4.4.3 The muscle compositions (%) of cobia fed test diets.............................. 83 Table 4.4.5 Essential amino acid profiles (g/100 g dry weight sample) in muscle of cobia fed test diets ...................................................................................................... 84 Table 5.1.1 Dietary Se requirements quantified for fish using different diet formulations ............................................................................................................... 86 Table 5.1.2 A comparison on specific growth rate (SGR) of snapper and cobia ....... 88 Table 5.2.1 Overviews the proximate composition of control diets fed to Australian snapper. ...................................................................................................................... 89 Table 5.3.1 Regression between dietary Se level and tested parameters in juvenile cobia ........................................................................................................................... 93 Table 5.3.2 Performances of snapper and cobia fed Se-supplemented diets ............. 96 Table 5.3.3 Signs of Se toxicity in snapper and cobia ............................................... 97 Table 5.4.1 Linear regression between fishmeal replacement levels and tested parameters in snapper and cobia .............................................................................. 101 Table 5.6.1 Performances of fish fed plant-derived ingredients supplemented with Se .................................................................................................................................. 108
xiii
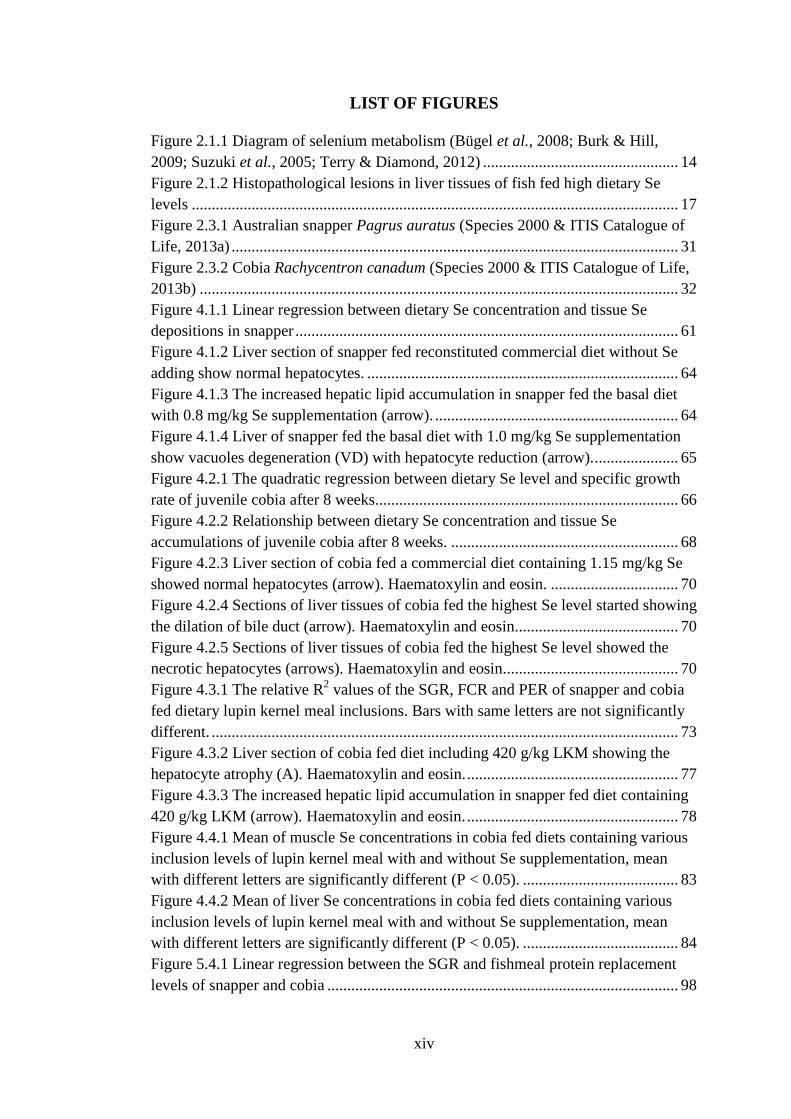
LIST OF FIGURES
Figure 2.1.1 Diagram of selenium metabolism (Bügel et al., 2008; Burk & Hill, 2009; Suzuki et al., 2005; Terry & Diamond, 2012) ................................................. 14 Figure 2.1.2 Histopathological lesions in liver tissues of fish fed high dietary Se levels .......................................................................................................................... 17 Figure 2.3.1 Australian snapper Pagrus auratus (Species 2000 & ITIS Catalogue of Life, 2013a) ................................................................................................................ 31 Figure 2.3.2 Cobia Rachycentron canadum (Species 2000 & ITIS Catalogue of Life, 2013b) ........................................................................................................................ 32 Figure 4.1.1 Linear regression between dietary Se concentration and tissue Se depositions in snapper ................................................................................................ 61 Figure 4.1.2 Liver section of snapper fed reconstituted commercial diet without Se adding show normal hepatocytes. .............................................................................. 64 Figure 4.1.3 The increased hepatic lipid accumulation in snapper fed the basal diet with 0.8 mg/kg Se supplementation (arrow). ............................................................. 64 Figure 4.1.4 Liver of snapper fed the basal diet with 1.0 mg/kg Se supplementation show vacuoles degeneration (VD) with hepatocyte reduction (arrow). ..................... 65 Figure 4.2.1 The quadratic regression between dietary Se level and specific growth rate of juvenile cobia after 8 weeks............................................................................ 66 Figure 4.2.2 Relationship between dietary Se concentration and tissue Se accumulations of juvenile cobia after 8 weeks. ......................................................... 68 Figure 4.2.3 Liver section of cobia fed a commercial diet containing 1.15 mg/kg Se showed normal hepatocytes (arrow). Haematoxylin and eosin. ................................ 70 Figure 4.2.4 Sections of liver tissues of cobia fed the highest Se level started showing the dilation of bile duct (arrow). Haematoxylin and eosin. ........................................ 70 Figure 4.2.5 Sections of liver tissues of cobia fed the highest Se level showed the necrotic hepatocytes (arrows). Haematoxylin and eosin. ........................................... 70 Figure 4.3.1 The relative R2 values of the SGR, FCR and PER of snapper and cobia fed dietary lupin kernel meal inclusions. Bars with same letters are not significantly different. ..................................................................................................................... 73 Figure 4.3.2 Liver section of cobia fed diet including 420 g/kg LKM showing the hepatocyte atrophy (A). Haematoxylin and eosin. ..................................................... 77 Figure 4.3.3 The increased hepatic lipid accumulation in snapper fed diet containing 420 g/kg LKM (arrow). Haematoxylin and eosin. ..................................................... 78 Figure 4.4.1 Mean of muscle Se concentrations in cobia fed diets containing various inclusion levels of lupin kernel meal with and without Se supplementation, mean with different letters are significantly different (P < 0.05). ....................................... 83 Figure 4.4.2 Mean of liver Se concentrations in cobia fed diets containing various inclusion levels of lupin kernel meal with and without Se supplementation, mean with different letters are significantly different (P < 0.05). ....................................... 84 Figure 5.4.1 Linear regression between the SGR and fishmeal protein replacement levels of snapper and cobia ........................................................................................ 98
xiv
Figure 5.4.2 Linear regression between the FCR and fishmeal protein replacement levels of snapper and cobia ...................................................................................... 100
xv
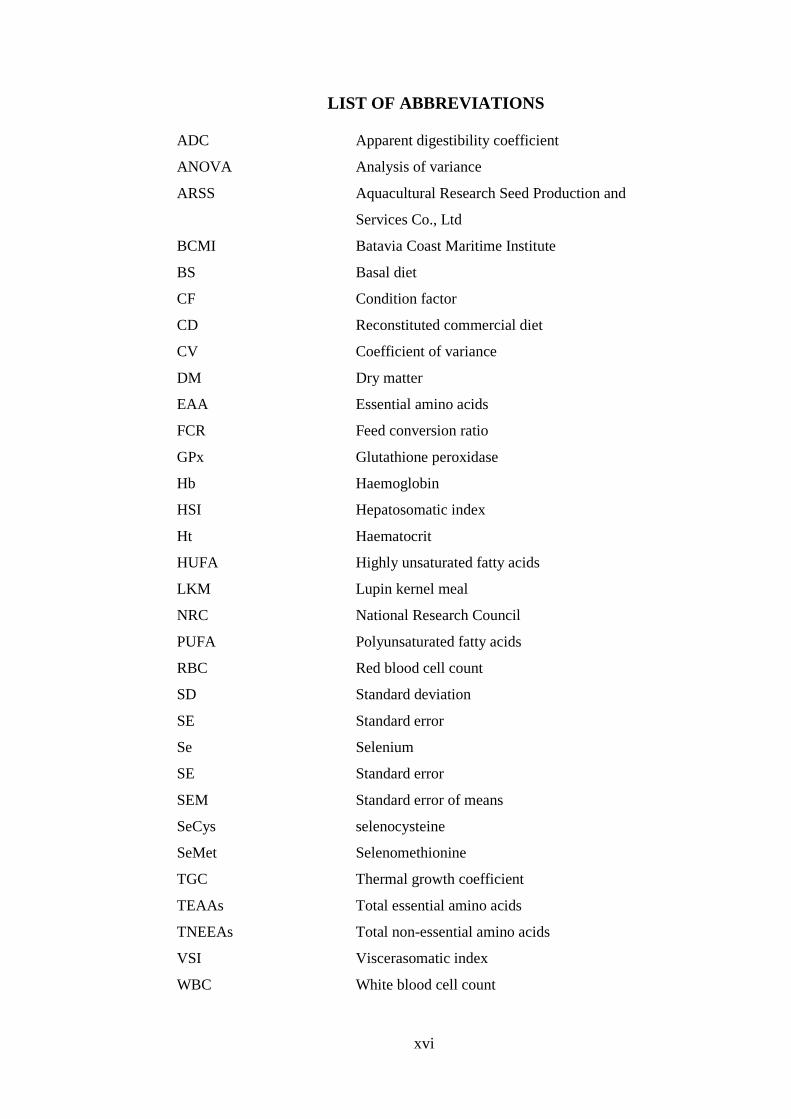
LIST OF ABBREVIATIONS
ADC Apparent digestibility coefficient
ANOVA Analysis of variance
ARSS Aquacultural Research Seed Production and
Services Co., Ltd
BCMI Batavia Coast Maritime Institute
BS Basal diet
CF Condition factor
CD Reconstituted commercial diet
CV Coefficient of variance
DM Dry matter
EAA Essential amino acids
FCR Feed conversion ratio
GPx Glutathione peroxidase
Hb Haemoglobin
HSI Hepatosomatic index
Ht Haematocrit
HUFA Highly unsaturated fatty acids
LKM Lupin kernel meal
NRC National Research Council
PUFA Polyunsaturated fatty acids
RBC Red blood cell count
SD Standard deviation
SE Standard error
Se Selenium
SE Standard error
SEM Standard error of means
SeCys selenocysteine
SeMet Selenomethionine
TGC Thermal growth coefficient
TEAAs Total essential amino acids
TNEEAs Total non-essential amino acids
VSI Viscerasomatic index
WBC White blood cell count
xvi
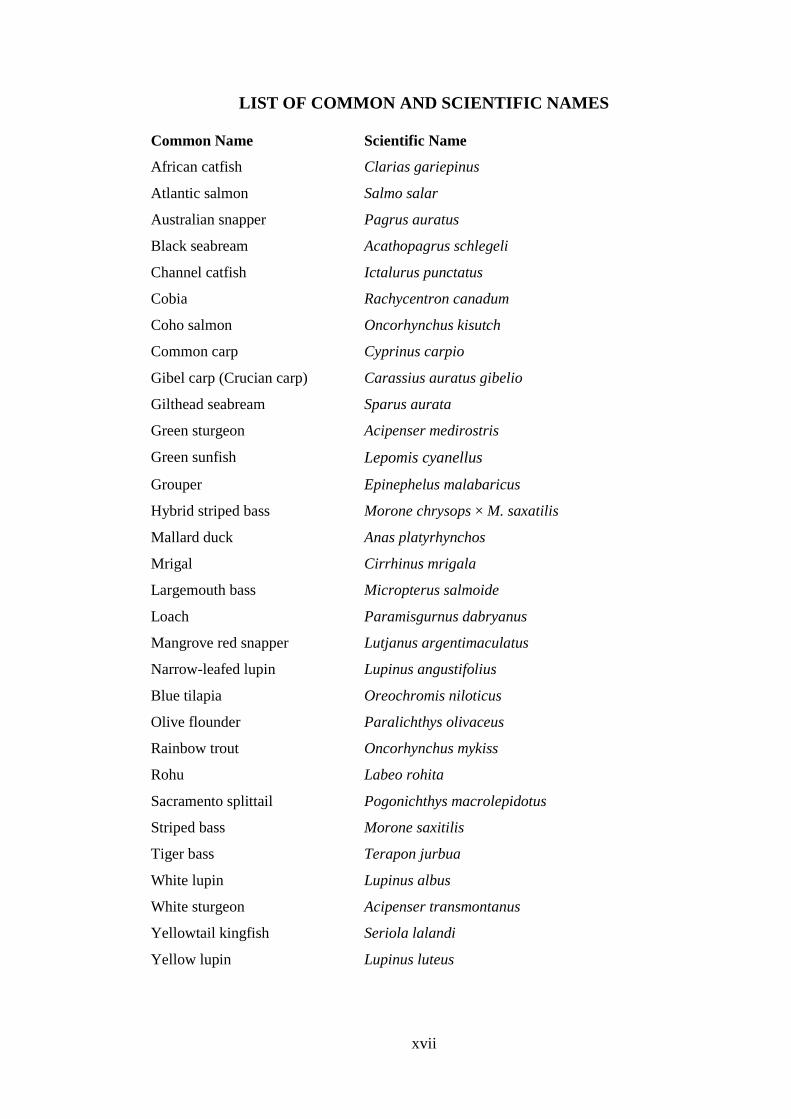
LIST OF COMMON AND SCIENTIFIC NAMES
Common Name Scientific Name
African catfish Clarias gariepinus
Atlantic salmon Salmo salar
Australian snapper Pagrus auratus
Black seabream Acathopagrus schlegeli
Channel catfish Ictalurus punctatus
Cobia Rachycentron canadum
Coho salmon Oncorhynchus kisutch
Common carp Cyprinus carpio
Gibel carp (Crucian carp) Carassius auratus gibelio
Gilthead seabream Sparus aurata
Green sturgeon Acipenser medirostris
Green sunfish Lepomis cyanellus
Grouper Epinephelus malabaricus
Hybrid striped bass Morone chrysops × M. saxatilis
Mallard duck Anas platyrhynchos
Mrigal Cirrhinus mrigala
Largemouth bass Micropterus salmoide
Loach Paramisgurnus dabryanus
Mangrove red snapper Lutjanus argentimaculatus
Narrow-leafed lupin Lupinus angustifolius
Blue tilapia Oreochromis niloticus
Olive flounder Paralichthys olivaceus
Rainbow trout Oncorhynchus mykiss
Rohu Labeo rohita
Sacramento splittail Pogonichthys macrolepidotus
Striped bass Morone saxitilis
Tiger bass Terapon jurbua
White lupin Lupinus albus
White sturgeon Acipenser transmontanus
Yellowtail kingfish Seriola lalandi
Yellow lupin Lupinus luteus
xvii
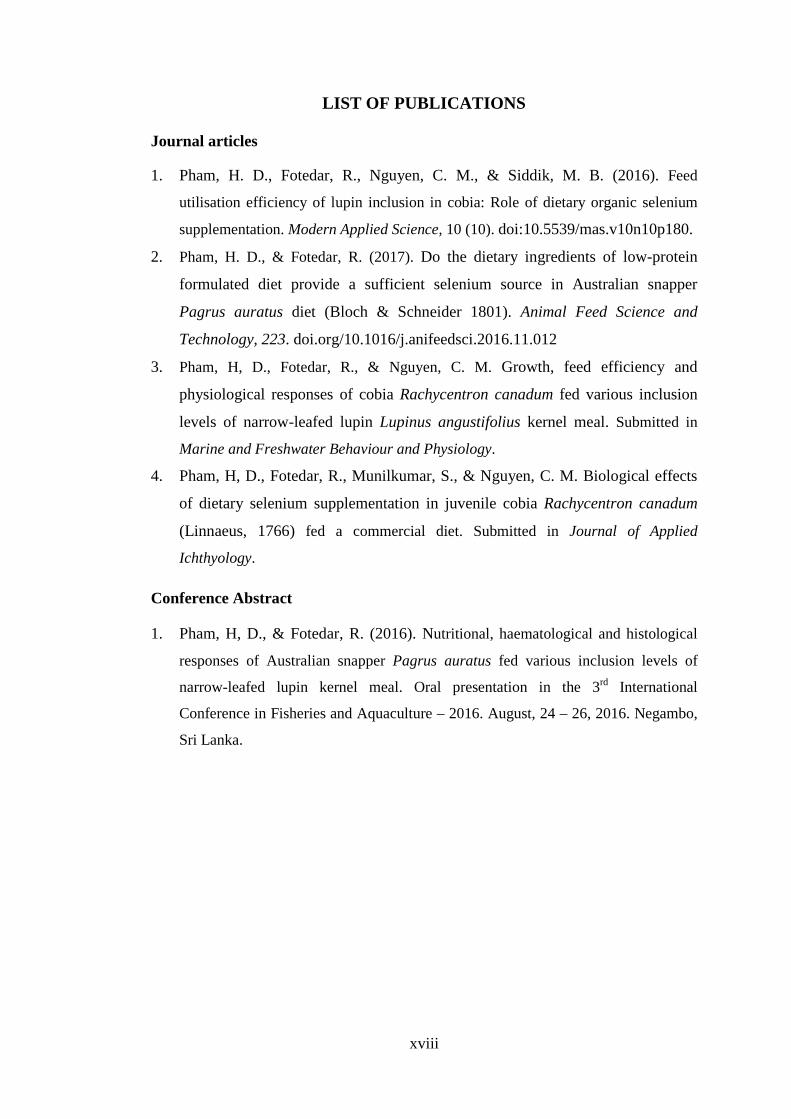
LIST OF PUBLICATIONS
Journal articles
1. Pham, H. D., Fotedar, R., Nguyen, C. M., & Siddik, M. B. (2016). Feed
utilisation efficiency of lupin inclusion in cobia: Role of dietary organic selenium
supplementation. Modern Applied Science, 10 (10). doi:10.5539/mas.v10n10p180.
2. Pham, H. D., & Fotedar, R. (2017). Do the dietary ingredients of low-protein
formulated diet provide a sufficient selenium source in Australian snapper
Pagrus auratus diet (Bloch & Schneider 1801). Animal Feed Science and
Technology, 223. doi.org/10.1016/j.anifeedsci.2016.11.012
3. Pham, H, D., Fotedar, R., & Nguyen, C. M. Growth, feed efficiency and
physiological responses of cobia Rachycentron canadum fed various inclusion
levels of narrow-leafed lupin Lupinus angustifolius kernel meal. Submitted in
Marine and Freshwater Behaviour and Physiology.
4. Pham, H, D., Fotedar, R., Munilkumar, S., & Nguyen, C. M. Biological effects
of dietary selenium supplementation in juvenile cobia Rachycentron canadum
(Linnaeus, 1766) fed a commercial diet. Submitted in Journal of Applied
Ichthyology.
Conference Abstract
1. Pham, H, D., & Fotedar, R. (2016). Nutritional, haematological and histological
responses of Australian snapper Pagrus auratus fed various inclusion levels of
narrow-leafed lupin kernel meal. Oral presentation in the 3rd International
Conference in Fisheries and Aquaculture – 2016. August, 24 – 26, 2016. Negambo,
Sri Lanka.
xviii
Chapter 1 Introduction
CHAPTER 1. INTRODUCTION
1.1 BACKGROUND
Carnivorous marine fish species generally require high dietary protein to provide
adequate amino acids and nitrogen for the synthesis of protein for maintenance and
growth (Fraser & Davies, 2009; Tacon & Metian, 2008). Fishmeal rather than terrestrial
plant ingredients contains significantly higher protein content with well-balanced
essential amino acids, high nutrient digestibility to meet nutritional requirement of the
fish (Gatlin et al., 2007; Olsen & Hasan, 2012). The plant protein ingredients are also
known to contain relatively high amounts of anti-nutrients such as protease inhibitors,
saponins and non-starch polysaccharides (Francis et al., 2001; Gatlin et al., 2007;
Kaushik & Hemre, 2008) that are not associated with the natural feeding habits and
nutrition profile of carnivorous marine species (Kaushik & Hemre, 2008). However, the
rapid development of aquaculture has led to an increase in the demand for fishmeal
coupled with its unstable supply (Olsen & Hasan, 2012). Besides, the high price and
environmental impacts relating to use of fishmeal are also challenges for aquaculture
industry to reduce fishmeal reliance of aqua-feeds (Hardy, 2010; Olsen & Hasan, 2012).
A series of studies have been conducted to determine the economically and
environmentally alternatives to fishmeal source for the culture of various species (Kader
et al., 2010; Luo et al., 2012; Luo et al., 2013; Regost et al., 1999; Watanabe et al.,
2001). Even though, some nutritional drawbacks such as reduction of growth and feed
efficiency have been reported in some fish fed high dietary plant ingredients, plant-
derived feedstuffs have been proven as the main choice for fishmeal replacement in
aqua-feeds, due to their availability, cost-effectiveness and acceptable nutritional
characteristics (Olsen & Hasan, 2012).
Meals from lupin such as, narrow-leafed lupin Lupinus angustifolius, white lupin
Lupinus albus and yellow lupin Lupinus luteus can be used as alternative protein sources
to replace protein from fishmeal in fish diets due to their high protein contents,
reasonable prices and availabilities (Pereira & Oliva-Teles, 2004; Salini & Adams,
2014). Protein and lipid contents in lupin seeds range from 32 to 38% and 6 to 9%,
respectively, while lupin kernel meals contain higher levels of protein (39-52 %) and
lipid (9-11%) (Kaushik & Hemre, 2008) and relatively low anti-nutritional factors
(ANFs) such as alkaloids, phytic acid, tannin and oligosaccharides are present in narrow-
leafed lupin kernel meal than other plant-derived ingredients (Glencross, 2001;
Petterson, 2000). Farhangi and Carter (2001) and (Glencross et al., 2004b) incorporated
1
Chapter 1 Introduction
up to 40% lupin (narrow-leafed and yellow lupins) in rainbow trout Oncorhynchus
mykiss diets, without any adverse effects in growth performances, while 50 % whole
grain white lupin could be included in the diet of this species without reducing growth
and feed utilisation (Borquez et al., 2011). Salini and Adams (2014) showed that the
dietary inclusion of 20 % narrow-leafed lupin or white lupin had no negative effects on
growth and the feed conversion ratio of Atlantic salmon Salmon salar, while no
significant effects were observed in growth and feed utilisation in gilthead seabream
Sparus aurata fed a diet with 39 % narrow-leafed lupin seed meal (Pereira & Oliva-
Teles, 2004; Robaina et al., 1995). However, the high levels of lupin inclusion in the diet
impaired the growth and feed efficiency of rainbow trout (Glencross et al., 2004b), and
caused ulcer-like lesions in the stomach of Atlantic salmon (Refstie et al., 2006).
The increased inclusion levels of plant-derived ingredients in aqua-feeds might impact
the uptake and digestion of minerals, consequently, changing the mineral needs in fish
(Antony Jesu Prabhu et al., 2016; Barrows et al., 2010; Read et al., 2014). This is
attributed to the interactions of anti-nutrients presented in plant-based diets and minerals,
making these mineral become less availability for fish. The chelation of phytate or tannin
with minerals in protein and amino acids has been evidenced in the reduction of nutrient
digestibility and growth in fish and other animals (Antony Jesu Prabhu et al., 2016;
Ilham et al., 2016a; Kumar et al., 2012; Petterson, 2000). It is recognised that dietary
mineral supplementation into plant-based diets to satisfy nutritional requirement can be
an alternative approach to enhance beneficial aspects of plant protein in fish, as
evidenced in rainbow trout (Barrows et al., 2010; Read et al., 2014), African catfish
Clarias gariepinus (Abdel-Tawwab et al., 2007) and barramundi Lates calcarifer (Ilham
et al., 2016a).
Selenium (Se) is an essential trace element for normal growth and physiological
functions of animal (Watanabe et al., 1997). However, the deficient and/or excessive
dietary Se levels can cause negative effects on growth, survival, peroxidative damage to
cells and membranes (Arteel & Sies, 2001; Lin & Shiau, 2005; Liu et al., 2010) and
reduced host defence function (Liu et al., 2010; Sweetman et al., 2010; Wang et al.,
2013) in fish. Feed ingredients contain varied amounts of Se, with relatively lower Se
contents in plant-derived products than fishmeal (Antony Jesu Prabhu et al., 2016;
Watanabe et al., 1997). Additionally, the low Se level in lupin meal (18 – 240 µg/kg) in
Australia due to the low Se concentration in Australian soils (Petterson, 2000), probably
results in the inadequacy of Se in the diets when fishmeal protein is replaced with lupin
2
Chapter 1 Introduction
meal protein, consequently, impairing the growth and health status. Ilham et al. (2016a)
showed that the reduction in growth and feed efficiency in barramundi fed high inclusion
levels of lupin kernel meal which corresponded with decreasing dietary Se level from
3.11 mg/kg in the fishmeal-based diet to 1.58 mg/kg in lupin-based diet. Due to the lack
of Se supplementation, the hybrid striped bass Morone chrysops × M. saxatilis fed diets
containing soybean, or casein resulted in lower growth and glutathione peroxidase (GPx)
activity compared to fish fed fishmeal based diet (Cotter, 2006). Whereas, soybean-
based diets for rainbow trout fry need to be supplemented with Se to achieve optimum
GPx activity (Fontagné-Dicharry et al., 2015). Similarly, Abdel-Tawwab et al. (2007)
also observed the improved growth performance, feed utilisation and health in African
catfish fed plant-based diet supplemented organic Se. Literature also indicated that the
fish fed plant-based diets could require nutrient requirements at higher concentrations
than those recommended by NRC (2011) to improve growth and feed utilisation
(Barrows et al., 2008; Barrows et al., 2010; Read et al., 2014). Clearly, Se is limiting
trace element, and need to be concerned when high plant-derived ingredients are
incorporated into fish diets.
The Australian snapper Pagrus auratus and cobia Rachycentron canadum have become
important marine finfish cultured in Asian countries due to their high flesh qualities and
market price (Chou et al., 2001; Huang et al., 2007; Nhu et al., 2011; Rahimnejad &
Lee, 2013; Zhou et al., 2011). However, the reliance on imported high-cost commercial
feeds, difficulties in storage, low feed efficiency and adverse effects on water quality
caused by using trash fish are the limiting factors for the expansion of snapper culture in
Australia (Booth et al., 2005) and cobia culture in Vietnam (Nhu et al., 2011; Zhou et
al., 2011). To develop sustainable culture, some studies have focussed on determining
the nutrient requirements of cobia (Chou et al., 2001; Craig et al., 2006; Mai et al., 2009;
Zhou et al., 2012; Zhou et al., 2007; Zhou et al., 2006), and replacing fishmeal with
availably alternative ingredients for snapper (Booth et al., 2012; Quartararo et al.,
1998a) and cobia (Chou et al., 2004; Luo et al., 2012; Luo et al., 2013; Romarheim et
al., 2008; Salze et al., 2010; Zhou et al., 2005).
In nature, both snapper and cobia are carnivorous species, with cobia showing relatively
faster growth rate than snapper. Therefore, it can be assumed that cobia requires
significantly higher feed intake and has higher metabolic rate than snapper to maximise
its growth potential. Consequently, snapper and cobia could show different pathways in
uptake and digestion of nutrients due to differences in their digestible capacities and
3
Chapter 1 Introduction
growth rates, as reported in rainbow trout and barramundi (Glencross et al., 2011),
rainbow trout and Atlantic salmon (Glencross et al., 2004a; Refstie et al., 2000) and
between rainbow trout and snapper (Glencross et al., 2004c). However, there is very
limited information on the biological effects of dietary inclusion levels of trace minerals
such as Se as well as lupin kernel meal in snapper and cobia. Further, the interactive
and/or synergistic roles of organic Se and lupin kernel meal in replacing fishmeal in two
distinct carnivorous marine fish is not investigated so far.
1.2 AIM
The study aims to understand the growth performance, feed efficiency and physiological
responses of juvenile Australian snapper and cobia fed various dietary levels of selenium
in lupin-based diets.
1.3 OBJECTIVES
The aim of the research can be achieved by addressing the following objectives:
1. To evaluate the effects of dietary organic Se supplementation on growth
performances, body composition and histological changes of the juvenile
snapper.
2. To understand the effects of dietary organic Se supplementation on the growth
and physiological responses of the juvenile cobia fed a commercial diet.
3. To compare the growth, feed utilisation, digestibility, haematological and
histological performances of snapper and cobia fed various inclusion levels of
lupin kernel meal, replacing fishmeal protein.
4. To evaluate the effects of organic selenium supplementation on growth,
digestibility, haematological responses of juvenile cobia fed lupin-based diets.
1.4 SIGNIFICANCE
The present study should make significant contributions in improving the marine finfish
aquaculture by contribution to the understanding of the effective uses of dietary organic
selenium supplementation and lupin protein meal for snapper and cobia aquaculture. The
specific significances of the present study are outlined as follows:
• The study will assist in understanding the discrepancies in biological effects of
Se in different growth rate marine finfish.
4
Chapter 1 Introduction
• The research will contribute new findings to understanding the variability in Se
requirements in fish due to the inconsistency in the dietary formulation.
• The study can also provide new information on the Se threshold levels for both
snapper and cobia that may be applied to diet formulation to prevent the Se
toxicity for these species.
• The growth and physiological responses of snapper and cobia fed various
inclusion levels of lupin kernel meal in the current study can contribute to
understandings the different mechanisms of absorption and digestion of lupin
protein meal in two different species.
• The research will contribute to the basic knowledge of cobia immunity and
physiology under the influence of dietary organic selenium and alternative
protein sources.
• The study will contribute to sustaining the marine finfish aquaculture via
reducing the fishmeal reliance by increasing the uses of plant-derived
ingredients.
5
Chapter 2 Literature review
CHAPTER 2. LITERATURE REVIEW
2.1 SELENIUM
2.1.1 Selenium sources and bioavailability
In nature, selenite and selenate are inorganic forms, while organic Se forms comprise
selenomethionine, selenium-methylselenomethionine (SeMet), selenocystine and
selenocysteine (SeCys) (Watanabe et al., 1997) which result in different pathways on
absorption and metabolism in animal (Burk, 1976). Thus, the optimum Se required for
fish can vary due to the bioavailability of Se sources. Lin (2014) determined the
optimum Se (mg/kg) requirement for grouper Epinephelus malabaricus fed dietary
selenomethionine and sodium selenite to be 0.98 and 0.90, respectively. Grouper fed
organic Se also resulted in relatively higher muscle Se deposition than the fish fed
inorganic Se compound. Previous studies have indicated that the organic Se forms
showed more bioavailability than inorganic compounds in grouper (Lin, 2014),
yellowtail kingfish Seriola lalandi (Le & Fotedar, 2014a), gibel carp Carassius auratus
gibelio (Wang et al., 2007; Zhou et al., 2009), Atlantic salmon (Bell & Cowey, 1989)
and channel catfish Ictalurus punctatus (Wang & Lovell, 1997). The bioavailability of
Se sources in fish is displayed in Table 2.1.1.
2.1.2 Selenium requirement in fish
Fish can absorb Se from water through gills to meet their needs (Hilton et al., 1982;
Watanabe et al., 1997). The Se concentration of less than 0.1 µg/L in water enhance the
Se uptake through gills and stores as inorganic forms (Watanabe et al., 1997). The
minimal dietary Se was quantified for channel catfish to be 0.25 mg/kg with adequate
vitamin E and Se level in water less than 2.5 µg/L, whereas this concentration increased
to 0.28 mg/kg when Se in rearing water was reduced to 0.4 µg/L (Gatlin & Wilson,
1984). In natural water, Se is present in Se0, Se2-, Se4+ and Se6+ forms (Liu et al., 2007).
The Se concentration in water has strong relationship with Se levels in sediments, where
it can rapidly be dissolved in water and transform into selenite which can be absorbed by
aquatic animals (Liu et al., 2007; William et al., 2010), while the degradation of aquatic
organisms can also redistribute Se forms to sediments through transformation of SeMet,
SeCys to Se0 and binding to organic matter (Zhang & Moore, 1997).
Dietary Se requirements have been quantified for grouper (Lin, 2014; Lin & Shiau,
2005), gibel carp (Wang et al., 2007; Zhou et al., 2009), black seabream Acathopagrus
6
Chapter 2 Literature review
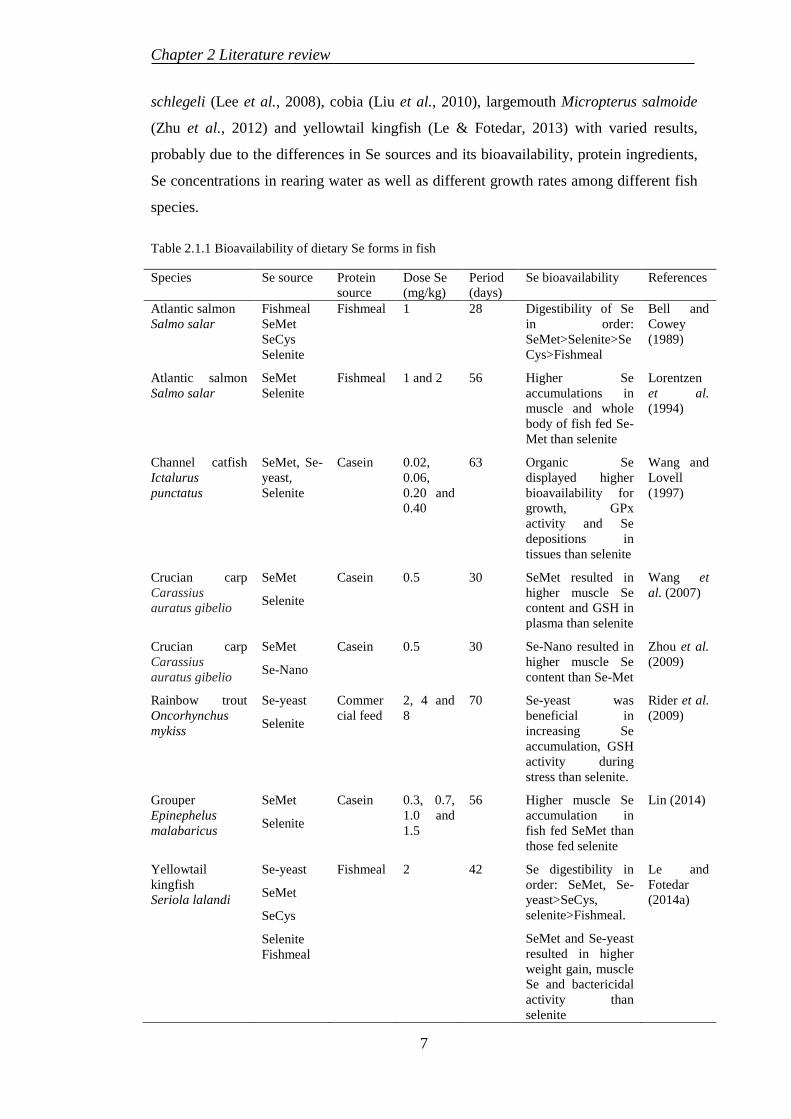
schlegeli (Lee et al., 2008), cobia (Liu et al., 2010), largemouth Micropterus salmoide
(Zhu et al., 2012) and yellowtail kingfish (Le & Fotedar, 2013) with varied results,
probably due to the differences in Se sources and its bioavailability, protein ingredients,
Se concentrations in rearing water as well as different growth rates among different fish
species.
Table 2.1.1 Bioavailability of dietary Se forms in fish
Species Se source Protein source
Dose Se (mg/kg)
Period (days)
Se bioavailability References
Atlantic salmon Salmo salar
Fishmeal SeMet SeCys Selenite
Fishmeal 1 28 Digestibility of Se in order: SeMet>Selenite>SeCys>Fishmeal
Bell and Cowey (1989)
Atlantic salmon Salmo salar
SeMet Selenite
Fishmeal 1 and 2 56 Higher Se accumulations in muscle and whole body of fish fed Se-Met than selenite
Lorentzen et al. (1994)
Channel catfish Ictalurus punctatus
SeMet, Se-yeast, Selenite
Casein 0.02, 0.06, 0.20 and 0.40
63 Organic Se displayed higher bioavailability for growth, GPx activity and Se depositions in tissues than selenite
Wang and Lovell (1997)
Crucian carp Carassius auratus gibelio
SeMet
Selenite
Casein 0.5 30 SeMet resulted in higher muscle Se content and GSH in plasma than selenite
Wang et al. (2007)
Crucian carp Carassius auratus gibelio
SeMet
Se-Nano
Casein 0.5 30 Se-Nano resulted in higher muscle Se content than Se-Met
Zhou et al. (2009)
Rainbow trout Oncorhynchus mykiss
Se-yeast
Selenite
Commercial feed
2, 4 and 8
70 Se-yeast was beneficial in increasing Se accumulation, GSH activity during stress than selenite.
Rider et al. (2009)
Grouper Epinephelus malabaricus
SeMet
Selenite
Casein 0.3, 0.7, 1.0 and 1.5
56 Higher muscle Se accumulation in fish fed SeMet than those fed selenite
Lin (2014)
Yellowtail kingfish Seriola lalandi
Se-yeast
SeMet
SeCys
Selenite Fishmeal
Fishmeal 2 42 Se digestibility in order: SeMet, Se-yeast>SeCys, selenite>Fishmeal.
SeMet and Se-yeast resulted in higher weight gain, muscle Se and bactericidal activity than selenite
Le and Fotedar (2014a)
7
Chapter 2 Literature review
Table 2.1.2 Dietary Se requirement in fish
Species Se source Protein source
Optimum Se
(mg/kg)
References
Rainbow trout Oncorhynchus mykiss
Selenite Casein 0.15 - 0.38 Hilton et al. (1980)
Channel catfish Ictalurus punctatus
Selenite Casein 0.25 Gatlin and Wilson (1984)
Black seabream Acathopagrus schlegeli
Selenite Casein 0.21 Lee et al. (2008)
Grouper Epinephelus malabaricus
Se-Met Casein 0.70 Lin and Shiau (2005)
Grouper Epinephelus malabaricus
Selenite Casein 0.90 Lin (2014)
Grouper Epinephelus malabaricus
Se-Met Casein 0.98 Lin (2014)
Cobia Rachycentron canadum
Se-Met Casein 0.79 - 0.81 Liu et al. (2010)
African catfish Clarias gariepinus
Se-yeast Plant meal 3.67 Abdel-Tawwab et al. (2007)
Gibel carp Carassius auratus gibelio
Se-Met Casein 1.18 Han et al. (2011)
Hybrid striped bass Morone chrysops × M. saxatilis
Selenite Fishmeal 1.81 Cotter et al. (2008)
Hybrid striped bass Morone chrysops × M. saxatilis
Se-yeast Fishmeal 1.61 Cotter et al. (2008)
Largemouth Micropterus salmoide
Selenite Fishmeal 1.6 – 1.85 Zhu et al. (2012)
Yellowtail kingfish Seriola lalandi
Se-yeast Fishmeal 4.91 – 15.43
Le and Fotedar (2014b)
Coho salmon Oncorhynchus kisutch
Selenite CD diet 8.6 max Felton et al. (1996)
Yellowtail kingfish Seriola lalandi
Se-yeast CD diet 5.56 Le and Fotedar (2013)
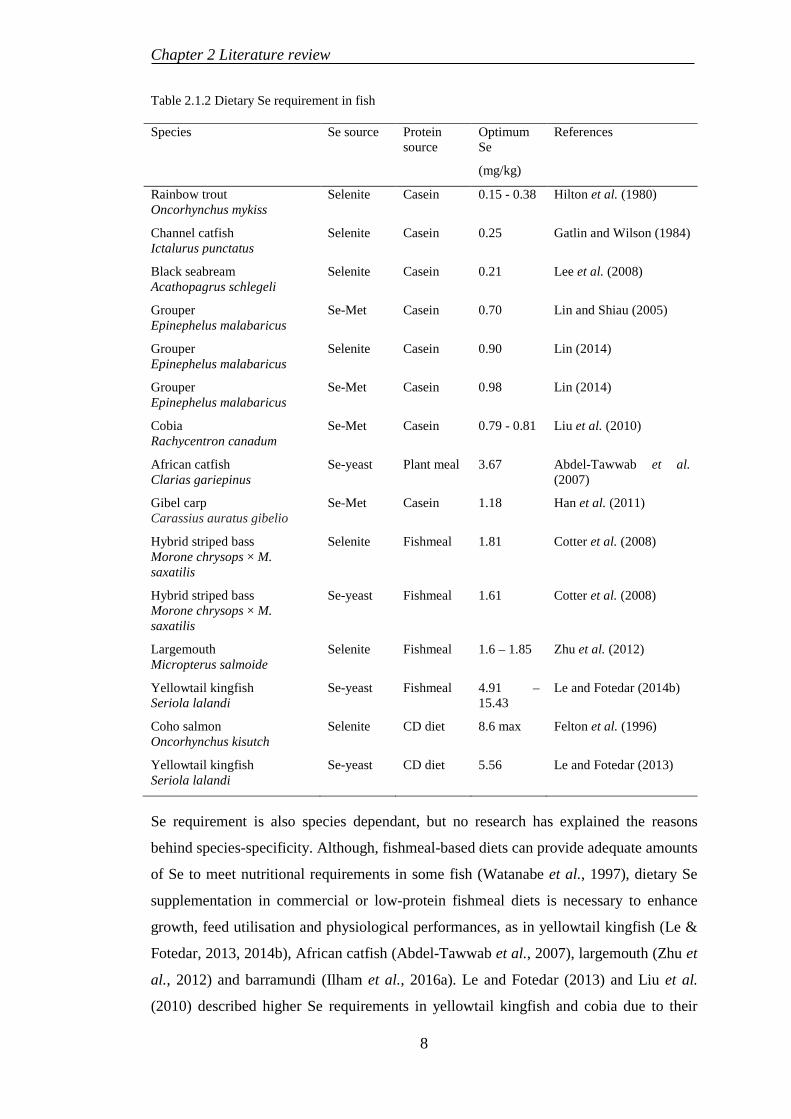
Se requirement is also species dependant, but no research has explained the reasons
behind species-specificity. Although, fishmeal-based diets can provide adequate amounts
of Se to meet nutritional requirements in some fish (Watanabe et al., 1997), dietary Se
supplementation in commercial or low-protein fishmeal diets is necessary to enhance
growth, feed utilisation and physiological performances, as in yellowtail kingfish (Le &
Fotedar, 2013, 2014b), African catfish (Abdel-Tawwab et al., 2007), largemouth (Zhu et
al., 2012) and barramundi (Ilham et al., 2016a). Le and Fotedar (2013) and Liu et al.
(2010) described higher Se requirements in yellowtail kingfish and cobia due to their
8
Chapter 2 Literature review
higher growth rates. The higher metabolic rates associated with faster-growing fish
require sufficient energy to maximize their growth potential (DeVries & Eastman, 1981),
resulting in a need to uptake more nutrients, including Se to meet their nutritional
requirements. The dietary Se requirement for fish is displayed in Table 2.1.2.
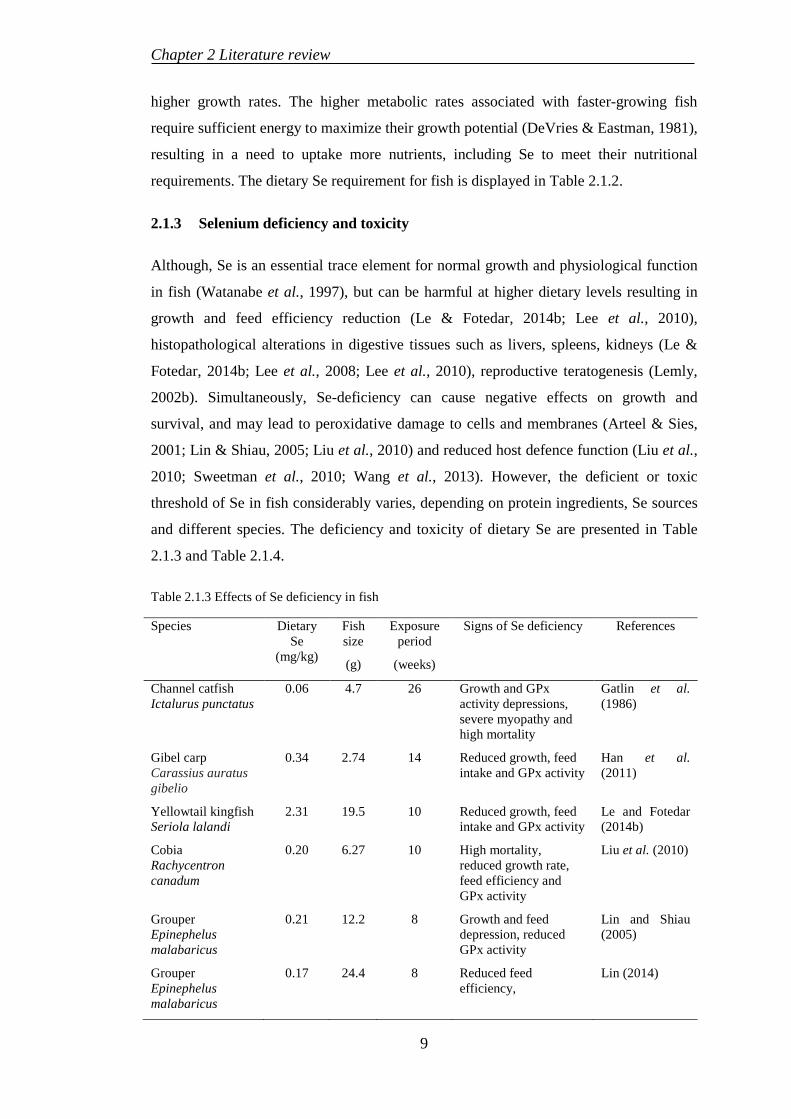
2.1.3 Selenium deficiency and toxicity
Although, Se is an essential trace element for normal growth and physiological function
in fish (Watanabe et al., 1997), but can be harmful at higher dietary levels resulting in
growth and feed efficiency reduction (Le & Fotedar, 2014b; Lee et al., 2010),
histopathological alterations in digestive tissues such as livers, spleens, kidneys (Le &
Fotedar, 2014b; Lee et al., 2008; Lee et al., 2010), reproductive teratogenesis (Lemly,
2002b). Simultaneously, Se-deficiency can cause negative effects on growth and
survival, and may lead to peroxidative damage to cells and membranes (Arteel & Sies,
2001; Lin & Shiau, 2005; Liu et al., 2010) and reduced host defence function (Liu et al.,
2010; Sweetman et al., 2010; Wang et al., 2013). However, the deficient or toxic
threshold of Se in fish considerably varies, depending on protein ingredients, Se sources
and different species. The deficiency and toxicity of dietary Se are presented in Table
2.1.3 and Table 2.1.4.
Table 2.1.3 Effects of Se deficiency in fish
Species Dietary Se
(mg/kg)
Fish size
(g)
Exposure period
(weeks)
Signs of Se deficiency References
Channel catfish Ictalurus punctatus
0.06 4.7 26 Growth and GPx activity depressions, severe myopathy and high mortality
Gatlin et al. (1986)
Gibel carp Carassius auratus gibelio
0.34 2.74 14 Reduced growth, feed intake and GPx activity
Han et al. (2011)
Yellowtail kingfish Seriola lalandi
2.31 19.5 10 Reduced growth, feed intake and GPx activity
Le and Fotedar (2014b)
Cobia Rachycentron canadum
0.20 6.27 10 High mortality, reduced growth rate, feed efficiency and GPx activity
Liu et al. (2010)
Grouper Epinephelus malabaricus
0.21 12.2 8 Growth and feed depression, reduced GPx activity
Lin and Shiau (2005)
Grouper Epinephelus malabaricus
0.17 24.4 8 Reduced feed efficiency,
Lin (2014)
9
Chapter 2 Literature review
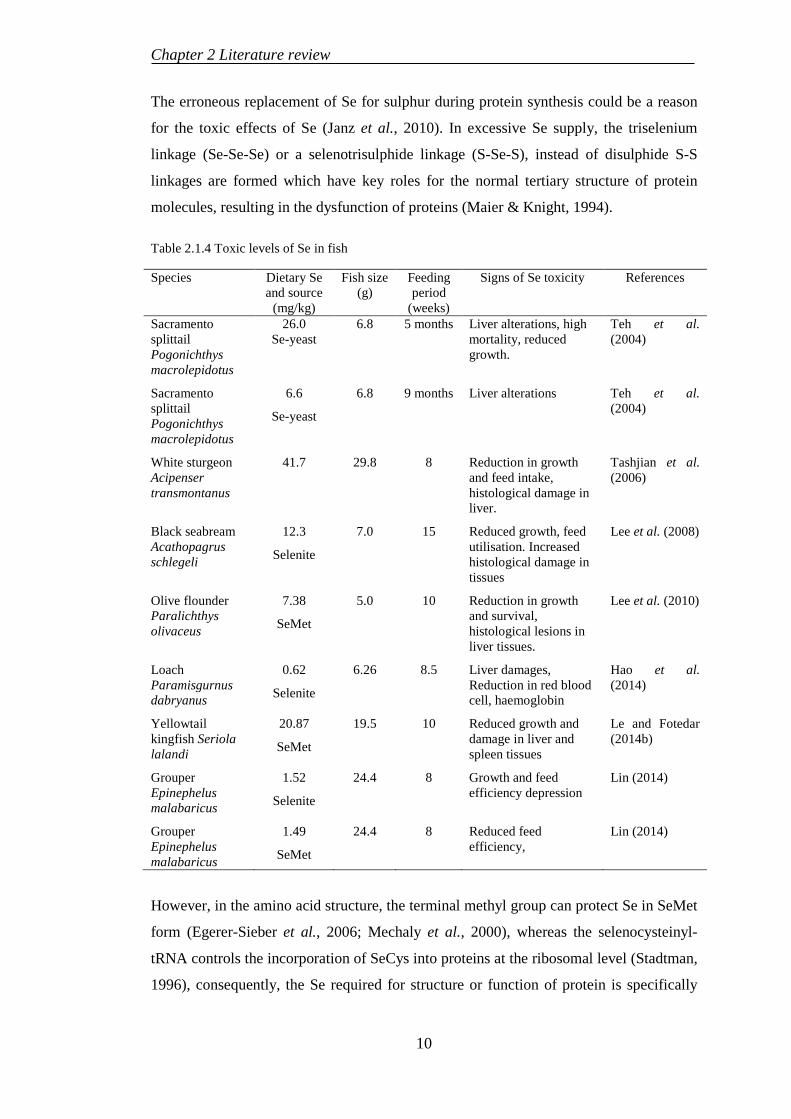
The erroneous replacement of Se for sulphur during protein synthesis could be a reason
for the toxic effects of Se (Janz et al., 2010). In excessive Se supply, the triselenium
linkage (Se-Se-Se) or a selenotrisulphide linkage (S-Se-S), instead of disulphide S-S
linkages are formed which have key roles for the normal tertiary structure of protein
molecules, resulting in the dysfunction of proteins (Maier & Knight, 1994).
Table 2.1.4 Toxic levels of Se in fish
Species Dietary Se and source
(mg/kg)
Fish size (g)
Feeding period
(weeks)
Signs of Se toxicity References
Sacramento splittail Pogonichthys macrolepidotus
26.0 Se-yeast
6.8 5 months Liver alterations, high mortality, reduced growth.
Teh et al. (2004)
Sacramento splittail Pogonichthys macrolepidotus
6.6
Se-yeast
6.8 9 months Liver alterations Teh et al. (2004)
White sturgeon Acipenser transmontanus
41.7 29.8 8 Reduction in growth and feed intake, histological damage in liver.
Tashjian et al. (2006)
Black seabream Acathopagrus schlegeli
12.3
Selenite
7.0 15 Reduced growth, feed utilisation. Increased histological damage in tissues
Lee et al. (2008)
Olive flounder Paralichthys olivaceus
7.38
SeMet
5.0 10 Reduction in growth and survival, histological lesions in liver tissues.
Lee et al. (2010)
Loach Paramisgurnus dabryanus
0.62
Selenite
6.26 8.5 Liver damages, Reduction in red blood cell, haemoglobin
Hao et al. (2014)
Yellowtail kingfish Seriola lalandi
20.87
SeMet
19.5 10 Reduced growth and damage in liver and spleen tissues
Le and Fotedar (2014b)
Grouper Epinephelus malabaricus
1.52
Selenite
24.4 8 Growth and feed efficiency depression
Lin (2014)
Grouper Epinephelus malabaricus
1.49
SeMet
24.4 8 Reduced feed efficiency,
Lin (2014)
However, in the amino acid structure, the terminal methyl group can protect Se in SeMet
form (Egerer-Sieber et al., 2006; Mechaly et al., 2000), whereas the selenocysteinyl-
tRNA controls the incorporation of SeCys into proteins at the ribosomal level (Stadtman,
1996), consequently, the Se required for structure or function of protein is specifically
10
Chapter 2 Literature review
incorporated in the polypeptide via the mRNA sequence. Thus, both SeMet and SeCys
may not cause the dysfunctional proteins (Janz et al., 2010).
2.1.4 The interaction between Se and other nutrients
The biological effects of interaction between dietary Se and vitamin E on physiological
functions of Se have been demonstrated in fish (Jaramillo et al., 2009; Le et al., 2014b;
Lin & Shiau, 2009). The effectiveness of Se is through GPx activity, whereas vitamin E
is a part of membrane antioxidant, thus the interaction of these nutrients is beneficial in
protecting biological membranes against lipid oxidation (Watanabe et al., 1997). The
peroxides formation can improve the functions of vitamin E, whereas Se is responsible
for peroxide degradation, thus the dietary Se need in fish may vary, depending on the
concentration of dietary vitamin E (Watanabe et al., 1997), as reported in grouper, where
the dietary Se requirement was reduced from 1.6 to 0.4 mg/kg when dietary vitamin E
increased from 50 to 200 mg/kg (Lin & Shiau, 2009).
Besides, the interactions between Se and other elements such as arsenic, sulphur,
mercury, cadmium, copper have also been revealed in fish (Dang & Wang, 2011;
Watanabe et al., 1997). The mercury bioaccumulation reduced in tiger bass Terapon
jurbua fed dietary Se supplementation (Dang & Wang, 2011). Lorentzen et al. (1998)
showed that elevated dietary copper decreased the Se accumulation in the livers of
Atlantic salmon that could be attributable to the forming of Se-copper compounds in the
intestine, reduction of Se availability and their complexes in the livers.
The interactive effects between Se and plant-derived ingredients have also been reported
in some fish species (Abdel-Tawwab et al., 2007; Ilham et al., 2016a; Ilham et al.,
2016b). Due to the lower Se concentrations in plants feedstuffs compared to fishmeal
(Antony Jesu Prabhu et al., 2016; Watanabe et al., 1997), the increased dietary plant
meal in aqua-feeds results in the variation of Se supply in fish, consequently, affecting
the growth and physiological performances. Barramundi fed either lupin kernel meal or
soybean meal resulted in the growth and feed efficiency reductions, reduced GPx activity
as well as histopathological damages in livers, corresponded with decreasing dietary Se
level from 3.11 and 3.15 mg/kg in the fishmeal-based diet to 1.58 and 1.53 mg/kg in
lupin-based diet and soybean-based diet, respectively (Ilham et al., 2016a; Ilham et al.,
2016b). Interestingly, barramundi fed plant-based diet with supplemental Se showed
improved growth, physiological and histological performances, as were those in fishmeal
diets (Ilham et al., 2016a; Ilham et al., 2016b). Similarly, Abdel-Tawwab et al. (2007)
11
Chapter 2 Literature review
also observed the improved growth performance, feed utilization and health in African
catfish fed plant-based diet supplemented organic Se. The hybrid striped bass fed diets
containing soybean or casein required Se supplementation to enhance growth and GPx
activity (Cotter, 2006), similar to data reported in rainbow trout fry fed soybean-based
diets (Fontagné-Dicharry et al., 2015). It seems that the Se fortification in fish fed high
inclusion levels of plant-derived ingredients is inevitable to optimise growth, feed
efficiency and physiological responses.
2.1.5 Effects of dietary selenium on growth and feed utilization in fish
Due to the narrow margin between deficiency, efficiency and toxicity of Se in fish, the
changing in dietary Se supply may rapidly affect the growth and feed utilisation
responses (Hodson & Hilton, 1983; Watanabe et al., 1997). Literature reviews have
indicated the improvement in growth, feed utilization in fish fed adequate Se diets
(Abdel-Tawwab et al., 2007; Le & Fotedar, 2013, 2014a; Lin & Shiau, 2005; Liu et al.,
2010). Meanwhile, fish fed deficient Se diets generally result in growth and feed
utilisation depression. Cobia fed casein-based diet containing 0.21 mg/kg Se resulted in
reducing growth and feed efficiency and high mortality compared to those fed sufficient
Se diets (Liu et al., 2010). Similar results were also reported in grouper fed to 0.17
mg/kg Se in casein-based diets (Lin & Shiau, 2005). The weight gain and feed intake
were significantly reduced in yellowtail kingfish fed to 3.35 and 2.21 mg/kg Se,
respectively (Le & Fotedar, 2013, 2014b).
The excessive dietary Se levels can also negatively impact the growth and feed
efficiency in fish. The reduced weight gain and feed intake have been reported in
yellowtail kingfish (Le & Fotedar, 2014b), black seabream (Lee et al., 2008), olive
flounder Paralichthys olivaceus (Lee et al., 2010) and rainbow trout (Hilton et al., 1980)
fed to 20.87, 12.3, 7.38 and 13.06 mg/kg Se, respectively. The increased mortality was
also observed in olive flounder (Lee et al., 2010) and rainbow trout (Hilton et al., 1980)
fed to excessive Se diets.
However, the impacts of dietary Se on growth and feed utilization in fish appear
differently, depending on dietary Se sources, exposed period and specific-species. Fish
fed dietary Se in organic forms such as SeMet, SeCys and/or Se-yeast resulted in higher
growth rate than those fed inorganic Se forms, as reported in juvenile yellowtail kingfish
(Le & Fotedar, 2014a) and grouper (Lin, 2014). Olive flounder did not show any
differences in growth and feed efficiency after being fed to dietary Se levels for 4 weeks,
12
Chapter 2 Literature review
however, the growth rate and feed utilization were significantly reduced in fish fed high
dietary Se levels after 10 weeks exposure (Lee et al., 2010), as in yellowtail kingfish (Le
& Fotedar, 2014b).
Dietary Se also affects the nutrient composition in fish. Olive flounder showed the lipid
reduction in the whole-body corresponded with increasing dietary Se levels (Lee et al.,
2010). In contradiction, dietary Se had no significant effects on the proximate
composition in the muscle tissues of yellowtail kingfish (Le & Fotedar, 2014b) and
largemouth bass (Zhu et al., 2012). However, cobia showed increased protein and lipid
concentrations in the whole-body, corresponding with the increasing dietary Se levels
(Liu et al., 2010). Similarly, in largemouth, where liver lipid were significantly increased
as increasing dietary Se levels, which was attributable to the different pathways in
lipoprotein uptake and accumulation, hepatic fatty acid synthesis and lipid metabolism in
liver tissues impacted by a specific Se mechanism (Zhu et al., 2012).
A series studies have stated the positive relationship between dietary Se and tissue Se
deposition in fish (Le & Fotedar, 2014b; Lin & Shiau, 2005; Liu et al., 2010; Wang et
al., 2007; Zhu et al., 2012). Tashjian et al. (2006) demonstrated the increased Se
concentrations with no breakpoints in the kidney, muscle, liver, gill and plasma tissues
of white sturgeon Acipenser transmontanus fed up to 191.1 mg/kg Se for 8 weeks,
similar in black seabream after being fed up to 12.3 mg/kg Se for 15 weeks (Lee et al.,
2008). In fish, the Se deposition is affected by dietary Se sources. Lorentzen et al. (1994)
evaluated the muscle Se concentrations in Atlantic salmon after being fed the fishmeal-
based diet supplemented with 1 and 2 mg/kg Se in the form of selenite or SeMet. The
muscle Se levels were considerably higher in fish fed dietary SeMet supplementation
(1.57 and 2.51 mg/kg) than those fed supplemental selenite (0.43 and 0.57 mg/kg,
respectively). Le and Fotedar (2014a) also demonstrated a higher muscle Se
accumulations in yellowtail kingfish fed Se-yeast and SeMet than those fed inorganic Se.
The reason for this difference is probably due to the different absorption and digestion
pathways for Se. In animal, SeMet is metabolized following the methionine pathways,
where it is readily assimilated into proteins and then accumulated in liver and muscle
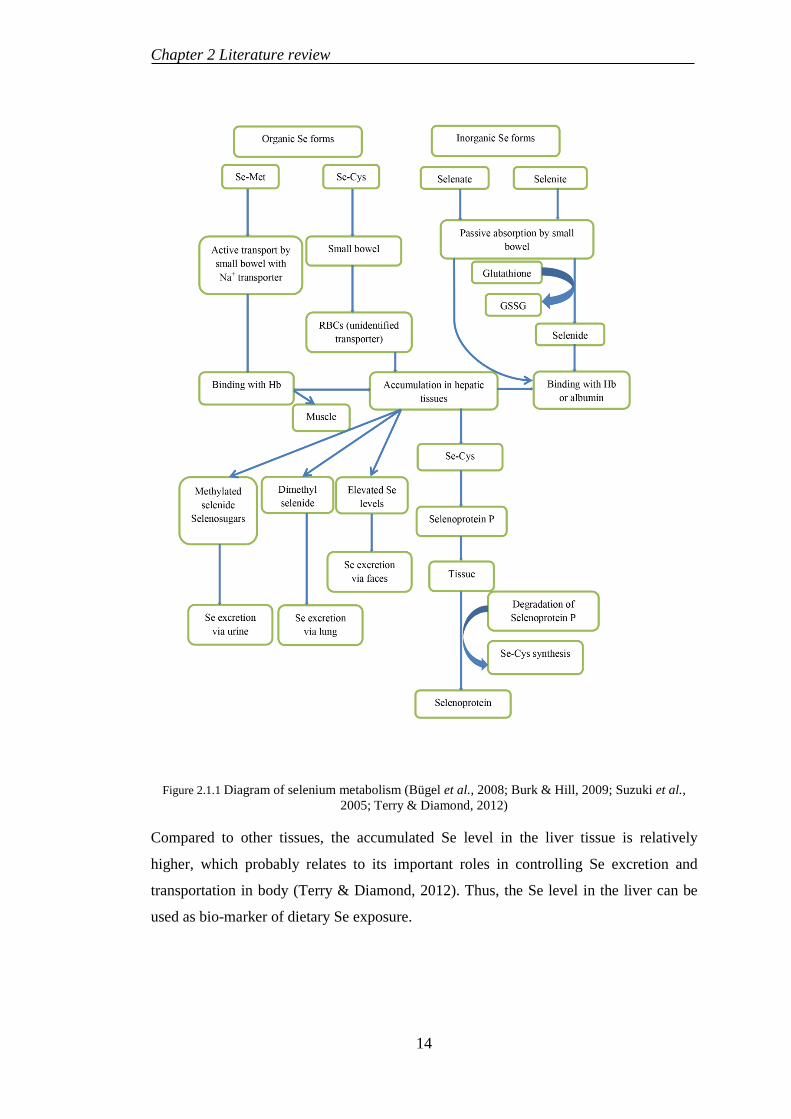
tissues (Figure 2.1.1) (Terry & Diamond, 2012; Yeh et al., 1997), wherein selenite is
converted to selenide before binding with albumin or hemoglobin and transported to
liver for further processes (Haratake et al., 2008).
13
Chapter 2 Literature review
Figure 2.1.1 Diagram of selenium metabolism (Bügel et al., 2008; Burk & Hill, 2009; Suzuki et al., 2005; Terry & Diamond, 2012)
Compared to other tissues, the accumulated Se level in the liver tissue is relatively
higher, which probably relates to its important roles in controlling Se excretion and
transportation in body (Terry & Diamond, 2012). Thus, the Se level in the liver can be
used as bio-marker of dietary Se exposure.
14
Chapter 2 Literature review
2.1.6 Effects of dietary selenium on physiological responses
As Se is an essential component of GPx, which plays important function in protecting
cell membranes against oxidative damage by catalysing crucial reactions to convert fatty
acid hydroperoxides and hydrogen peroxides into water using reduced glutathione (Lin
& Shiau, 2005; Rotruck et al., 1973; Watanabe et al., 1997). Previous studies stated a
positive relationship between dietary Se and GPx activity in fish (Le & Fotedar, 2014b;
Lin & Shiau, 2005; Liu et al., 2010). The increases in hepatic GPx were observed in
grouper (Lin & Shiau, 2005), largemouth bass (Zhu et al., 2012), gibel carp (Han et al.,
2011), African catfish (Abdel-Tawwab et al., 2007) and yellowtail kingfish (Le &
Fotedar, 2014b) fed dietary Se levels of up to 4.00, 2.06, 5.13, 5.54 and 20.87 mg/kg,
respectively. However, the liver GPx gained a peak in cobia fed dietary Se of only 0.85
mg/kg (Liu et al., 2010). The organic Se is known to have higher bioavailability in rising
liver GPx than inorganic Se, as in common carp Cyprinus carpio (Jovanovic et al., 1997)
and channel catfish (Wang & Lovell, 1997). However, in hybrid striped bass (Cotter et
al., 2008) and Atlantic salmon (Bell & Cowey, 1989) indicated higher hepatic GPx and
plasma GPx fed dietary selenite than fed organic Se such as Se-yeast and SeMet. This
can be attributable to the complexity of chemical speciation of Se, where some Se forms
may be incapable to associate with glutathione and to propagate the oxidative damage
(Spallholz & Hoffman, 2002).
The positive effects of Se on immune functions in yellowtail kingfish, where the fish fed
dietary organic Se as Se-yeast or SeMet showed increased bactericidal activity than the
fish fed diet with no Se supplementation (Le & Fotedar, 2014a). As bactericidal activity
serves as natural defense protecting the host against an invasion of microorganisms
(Ueda et al., 1999). Therefore, an increased organic Se can reflect the enhancement in
fish immune system as observed in channel catfish (Wang & Lovell, 1997).
The hematological changes are also linked to the dietary Se level. The hematocrit (Ht)
levels of yellowtail kingfish fed more than 15.43 mg/kg Se were significantly lower than
the fish fed lower dietary Se levels (Le & Fotedar, 2013). This is in contradiction in
African catfish, where Ht, red blood cells (RBC) and hemoglobin (Hb) levels are
significantly increased as increasing dietary Se levels (Abdel-Tawwab et al., 2007).
Meanwhile, the RBC and Hb concentrations in black seabream showed no significant
differences after being fed to 1.29 mg/kg Se, but slightly reduced in fish fed diet
containing 12.3 mg/kg Se (Lee et al., 2008). In animals, the RBC and Hb play important
15
Chapter 2 Literature review
roles in transport oxygen and carbon dioxide in the blood and haemoglobin synthesis
(Olugbemi et al., 2010). The increased RBC and Hb can be used as indicators indicating
the enhancement of fish health stimulated by dietary Se supplementation (Abdel-
Tawwab et al., 2007; Kader et al., 2010).
Abdel-Tawwab et al. (2007) revealed the increases in total lipid, total protein, albumin
and globulin levels, aspartate aminotransferase and alanine aminotransferase in blood of
African catfish as increasing dietary Se levels. The performances of non-specific
immune parameters such as albumin and globulin have been used as indicators to
evaluate the effects of nutrients in fish immunity. The increase in albumin and globulin
is attributed to the increases of these compounds in liver (Abdel-Tawwab et al., 2007).
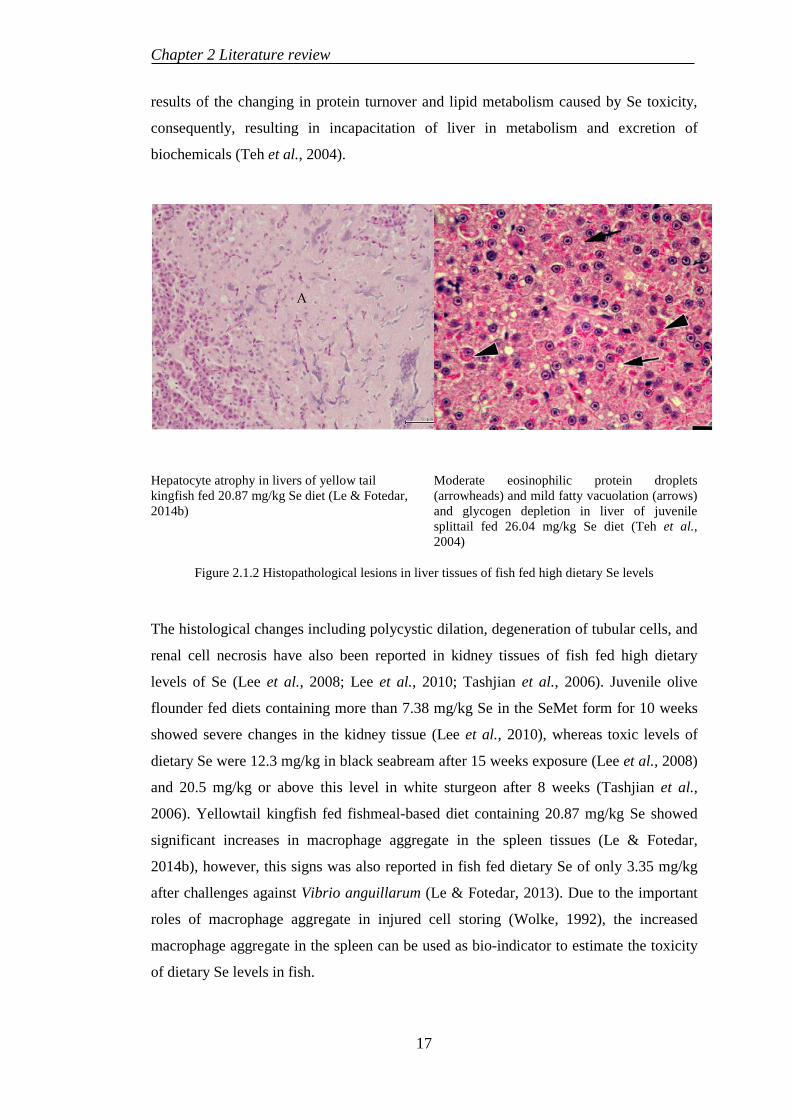
The interrelationship between dietary Se and histopathological alterations has been
evidenced in fish, mainly due to the excessive Se concentrations in diets. However, the
effects are variable, depending on different tissues, exposed Se concentrations and the
species. Juvenile sacramento splittail Pogonichthys macrolepidotus exposed to 6.6
mg/kg Se diet for 9 months resulted in severe glycogen depletion and moderate fatty
vacuolar degeneration in the liver tissues, whereas moderate eosinophilic protein
droplets, mild fatty vacuolation and glycogen depletion were observed in liver tissues of
fish fed 26.04 mg/kg Se diet for 5 months (Teh et al., 2004). Yellowtail kingfish fed
dietary of 20.87 mg/kg Se in the fishmeal-based diet caused atrophic hepatocytes (Le &
Fotedar, 2014b), meanwhile, white sturgeon showed histopathological alternations such
as glycogen depletion, hepatocellular vacuolar degeneration and necrosis in livers, and
hepatocellular and bile ductural hyperplasia when exposed to diets containing more than
20.5 mg/kg Se (Tashjian et al., 2006). Green sunfish Lepomis cyanellus fed dietary Se
levels of 7.0 and 21.4 mg/kg dry weight, respectively, showed lymphocyte infiltration
and an increase in lipid droplets relative to the fish containing 1.3 mg/kg Se in the liver
(Sorensen et al., 1984). No histopathological alterations were recorded in the liver
tissues of olive flounder and black seabream exposed up to 18.6 and 12.3 mg/kg Se diet,
respectively (Lee et al., 2008; Lee et al., 2010).
The cell necrosis of hepatocytes can be explained by the gradual deterioration in
synthesis of new structural and metabolic component of the cell to restore the damages
caused by toxic effects of Se, resulting in cell death (Teh et al., 2004). Besides, glycogen
depletion induced by increasing glycogenolysis may also cause single cell necrosis and
macrophage aggregates in the liver. The lipid vacuolar degenerations in livers may be
16
Chapter 2 Literature review
results of the changing in protein turnover and lipid metabolism caused by Se toxicity,
consequently, resulting in incapacitation of liver in metabolism and excretion of
biochemicals (Teh et al., 2004).
Hepatocyte atrophy in livers of yellow tail kingfish fed 20.87 mg/kg Se diet (Le & Fotedar, 2014b)
Moderate eosinophilic protein droplets (arrowheads) and mild fatty vacuolation (arrows) and glycogen depletion in liver of juvenile splittail fed 26.04 mg/kg Se diet (Teh et al., 2004)
Figure 2.1.2 Histopathological lesions in liver tissues of fish fed high dietary Se levels
The histological changes including polycystic dilation, degeneration of tubular cells, and
renal cell necrosis have also been reported in kidney tissues of fish fed high dietary
levels of Se (Lee et al., 2008; Lee et al., 2010; Tashjian et al., 2006). Juvenile olive
flounder fed diets containing more than 7.38 mg/kg Se in the SeMet form for 10 weeks
showed severe changes in the kidney tissue (Lee et al., 2010), whereas toxic levels of
dietary Se were 12.3 mg/kg in black seabream after 15 weeks exposure (Lee et al., 2008)
and 20.5 mg/kg or above this level in white sturgeon after 8 weeks (Tashjian et al.,
2006). Yellowtail kingfish fed fishmeal-based diet containing 20.87 mg/kg Se showed
significant increases in macrophage aggregate in the spleen tissues (Le & Fotedar,
2014b), however, this signs was also reported in fish fed dietary Se of only 3.35 mg/kg
after challenges against Vibrio anguillarum (Le & Fotedar, 2013). Due to the important
roles of macrophage aggregate in injured cell storing (Wolke, 1992), the increased
macrophage aggregate in the spleen can be used as bio-indicator to estimate the toxicity
of dietary Se levels in fish.
17
Chapter 2 Literature review
The intestinal structures appear less susceptibility to dietary Se than other digestive
organs. Le and Fotedar (2014b) reported that yellowtail kingfish fed up to 20.87 mg/kg
Se diet did not show any histological alterations in the intestine after 10 weeks exposure,
similar in barramundi fed plant-based diet with Se supplementation (Ilham et al., 2016a).
The effects of dietary Se deficiency in histological performances in fish have been
reported in a few fish species. Yellowtail kingfish fed dietary Se levels of 2.31 and 3.35
mg/kg in the fishmeal and/or commercial diets, respectively, resulted in necrotic fibres in
the muscle tissues (Le & Fotedar, 2013, 2014b). Common carp fed deficient Se diets
showed histopathological lesions in the tissues, resulting in muscle atrophy, degeneration
and necrosis in the liver, pancreatic cells and renal tubular epithelial cells (Wang et al.,
2013). In contrast, muscles of black seabream and white sturgeon showed normal
histopathological structures when exposed to 0.21 and 0.40 mg/kg Se diet, respectively
(Lee et al., 2008; Tashjian et al., 2006).
2.1.7 Selection of selenium form
Selenite and selenate are inorganic forms of Se, whereas organic Se includes SeMet and
SeCys (Watanabe et al., 1997). Past investigations have indicated higher bioavailability
of organic Se in fish than inorganic Se sources (Bell & Cowey, 1989; Le & Fotedar,
2014a; Lin, 2014; Wang & Lovell, 1997; Wang et al., 2007; Zhou et al., 2009), which is
associated with the differences in metabolic pathway between two Se forms (Luten et al.,
2008). In all species, the SeMet is metabolised following the methionine pathways,
where it is readily assimilated into proteins and then accumulated in liver and muscle
tissues (Terry & Diamond, 2012; Yeh et al., 1997), meanwhile selenite is converted to
selenite before binding with albumin or hemoglobin and transported to liver for further
processing (Haratake et al., 2008).
Compared to inorganic Se, organic Se supplementation maintains the elevated platelet
GSHPx activity for longer duration (Levander et al., 1983). The higher absorption and
digestibility of organic Se than the inorganic forms in yellowtail king fish (Le & Fotedar,
2014a) and channel catfish (Paripatananont & Lovell, 1997) is further example of the
higher bioavailability of Se in its organic forms. Further, the SeMet and Se-yeast are
beneficial Se sources in aqua-feeds due to their higher digestibility and accumulation
than the SeCys, as evidenced in yellowtail kingfish (Le & Fotedar, 2014a). However,
purified SeMet is not stable and is quickly oxidised, whereas SeMet in yeast shows
higher stability (Block et al., 2004). The SeMet in Se-yeast also accounts for 81 – 82%
18
Chapter 2 Literature review
of total Se with less toxicity than pure SeMet (Schrauzer, 2006). Se in Se-yeast is easily
assimilated with glucomano-protein compounds in the yeast cell wall or O- and N-
glucosylated proteins in the intracellular space. During feed production, the carbohydrate
complexes presented in the ingredients increase the stability of these selenoproteins
when feed ingredients are extruded under high temperature and pressures (Sweetman et
al., 2010). Besides, the beneficial effects of Se-yeast in protecting the host against
disease challenges and histopathological lesions have also been reported when it is used
to replace the inorganic Se form (Sweetman et al., 2010). Therefore, Se-yeast was
selected as a Se source to evaluate the effects of Se supplementation on snapper and
cobia in this study.
2.2 LUPIN MEAL PRODUCTION AND USE IN AQUACULTURE
2.2.1 Lupin production
Australia accounts for more than two-third of the total lupin production in the world
(Kaushik & Hemre, 2008). Narrow-leafed lupin, white lupin and yellow lupin are three
major commercial lupin species, with the majority of production being the narrow-leafed
lupin, comprising 77 % of global production. The total lupin production in Australia was
approximately 1 million tons in 2012 which was mainly produced in Western Australia,
accounting for 782.000 tons (Statistics, 2013). However, the total area recently produced
lupin had reduced to 689,000 hectares in whole Australia, especially in New South
Wales (Statistics, 2013).
2.2.2 Nutritional values of lupin
Protein and amino acids
Protein content in lupin seeds range from 31-42%, depending on the different lupin
species, growing conditions and soil type (Petterson et al., 1997). The highest protein
level was found in yellow lupin, ranging from 40 to 45 % of the whole seed, whereas
narrow-leafed and white lupins contain relatively lower protein concentrations of 32 – 44
and 30-41 %, respectively (Glencross, 2001). The dehulled process significantly
improves the protein content in both narrow-leafed and yellow lupins, but not for white
lupin due to the thinner seed coat of this species. The protein concentrations of narrow-
leafed kernel meal and yellow kernel meal are approximately 53 % and 41 %,
respectively (Glencross, 2001).
19
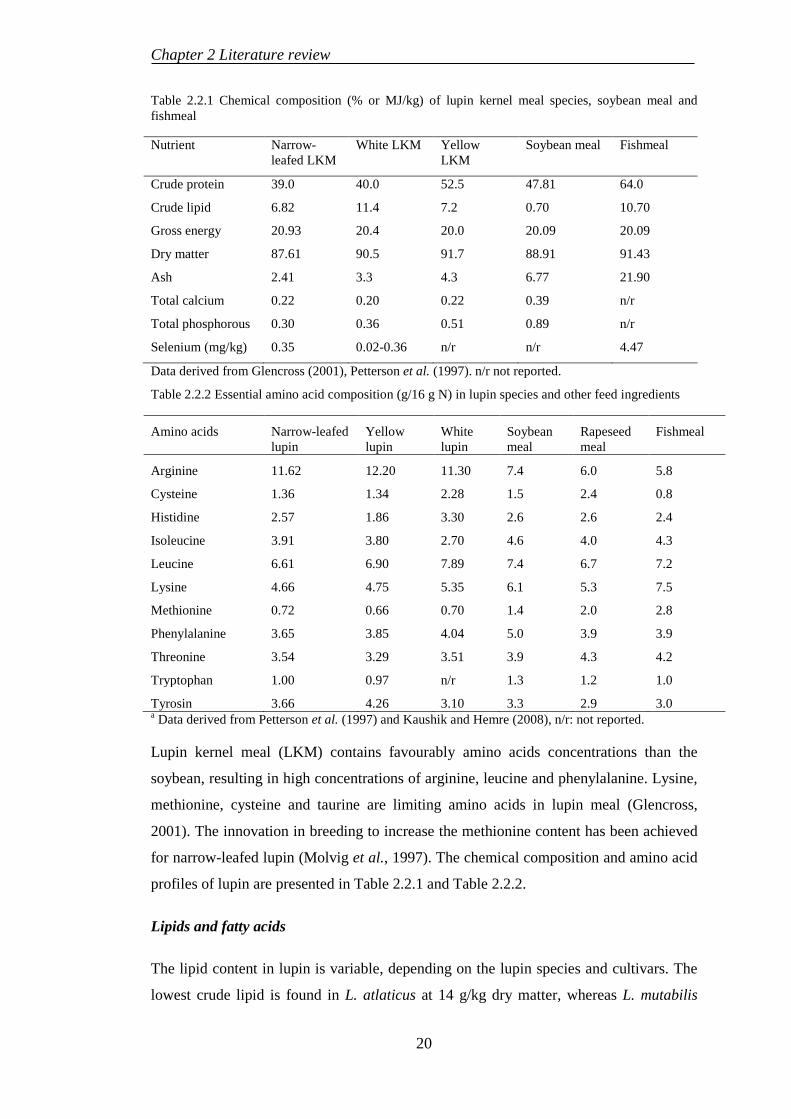
Chapter 2 Literature review
Table 2.2.1 Chemical composition (% or MJ/kg) of lupin kernel meal species, soybean meal and fishmeal
Nutrient Narrow-leafed LKM
White LKM Yellow LKM
Soybean meal Fishmeal
Crude protein 39.0 40.0 52.5 47.81 64.0
Crude lipid 6.82 11.4 7.2 0.70 10.70
Gross energy 20.93 20.4 20.0 20.09 20.09
Dry matter 87.61 90.5 91.7 88.91 91.43
Ash 2.41 3.3 4.3 6.77 21.90
Total calcium 0.22 0.20 0.22 0.39 n/r
Total phosphorous 0.30 0.36 0.51 0.89 n/r
Selenium (mg/kg) 0.35 0.02-0.36 n/r n/r 4.47
Data derived from Glencross (2001), Petterson et al. (1997). n/r not reported.
Table 2.2.2 Essential amino acid composition (g/16 g N) in lupin species and other feed ingredients
Amino acids Narrow-leafed lupin
Yellow lupin
White lupin
Soybean meal
Rapeseed meal
Fishmeal
Arginine 11.62 12.20 11.30 7.4 6.0 5.8
Cysteine 1.36 1.34 2.28 1.5 2.4 0.8
Histidine 2.57 1.86 3.30 2.6 2.6 2.4
Isoleucine 3.91 3.80 2.70 4.6 4.0 4.3
Leucine 6.61 6.90 7.89 7.4 6.7 7.2
Lysine 4.66 4.75 5.35 6.1 5.3 7.5
Methionine 0.72 0.66 0.70 1.4 2.0 2.8
Phenylalanine 3.65 3.85 4.04 5.0 3.9 3.9
Threonine 3.54 3.29 3.51 3.9 4.3 4.2
Tryptophan 1.00 0.97 n/r 1.3 1.2 1.0
Tyrosin 3.66 4.26 3.10 3.3 2.9 3.0 a Data derived from Petterson et al. (1997) and Kaushik and Hemre (2008), n/r: not reported.
Lupin kernel meal (LKM) contains favourably amino acids concentrations than the
soybean, resulting in high concentrations of arginine, leucine and phenylalanine. Lysine,
methionine, cysteine and taurine are limiting amino acids in lupin meal (Glencross,
2001). The innovation in breeding to increase the methionine content has been achieved
for narrow-leafed lupin (Molvig et al., 1997). The chemical composition and amino acid
profiles of lupin are presented in Table 2.2.1 and Table 2.2.2.
Lipids and fatty acids
The lipid content in lupin is variable, depending on the lupin species and cultivars. The
lowest crude lipid is found in L. atlaticus at 14 g/kg dry matter, whereas L. mutabilis
20
Chapter 2 Literature review
contains 230 g/kg DM. The lipid levels in three major lupin species including narrow-
leafed, yellow and white lupin are 62-83 and 82-145 g/kg DM, respectively (Petterson,
2000). Triacylglycerides are predominant in crude fat, comprising 71.1 %, whereas
phospholipids, free sterols, glycolipids, sterol and wax esters, free fatty acids and
hydrocarbons account for 14.9, 5.2, 3.5, 0.5, 0.4 and 0.4 %, respectively (Petterson,
2000).
White lupin contains relatively higher monounsaturates (59.2 %) than those in narrow-
leafed (38.5 %) and yellow lupin (23.6 %), however, total polyunsaturates (PUFA) is
only 26.7 %, considerably lower than that of narrow-leafed lupin (42.4 %) and yellow
lupin (54.8 %). White lupin contains highest level of n-3 (omega-3) (9.5 %), followed by
yellow lupin and narrow-leafed lupin (7.5 and 5.3 %, respectively). In contrast, the
highest levels of n-6 (omega-6) is found in yellow lupin (47.3 %), followed by narrow-
leafed lupin (37.1 %) and white lupin (17.2 %) (Glencross, 2001).
The total carotenoids in lupin varies considerably in different lupin species, resulting in
lowest level in white whole seed lupin (9 mg/kg) and highest in narrow-leafed lupin (35
mg/kg). Hydroxycarotenoids is the major carotenoids in lupin, accounting for 66 % of
total carotenoids in narrow-leafed lupin, whereas β-carotene comprises about 30 % of all
carotenoids (Glencross, 2001). However, astaxanthin, an important carotenoid required
in fish, is deficient in lupin (Glencross, 2001).
Vitamin and mineral contents
The concentration of minerals in lupin vary slightly among different lupin species and
the soil conditions where lupin was produced (Petterson, 2000). The major minerals in
lupin seeds comprise calcium, magnesium, phosphorus, potassium, sodium and sulphur,
whereas copper, iron, manganese, molybdenum, zinc, cobalt and selenium account for
minor amount in lupin ingredients (Table 2.2.3).
Petterson (2000) reported the levels of vitamins in the whole seed meal of narrow-leafed
lupin as: thiamin (5.9 mg/kg), riboflavin (3.1 mg/kg), biotin (0.04 mg/kg), folate (0.4
mg/kg), choline (3.4 mg/kg), niacin (40 mg/kg), pantothenate (1.8 mg/kg), α-tocopherol
(2.4 mg/kg) and β-carotene (3.9 mg/kg).
Table 2.2.3 Mineral concentrations in lupin species
Minerals Narrow-leafed lupin White lupin Yellow lupin
21
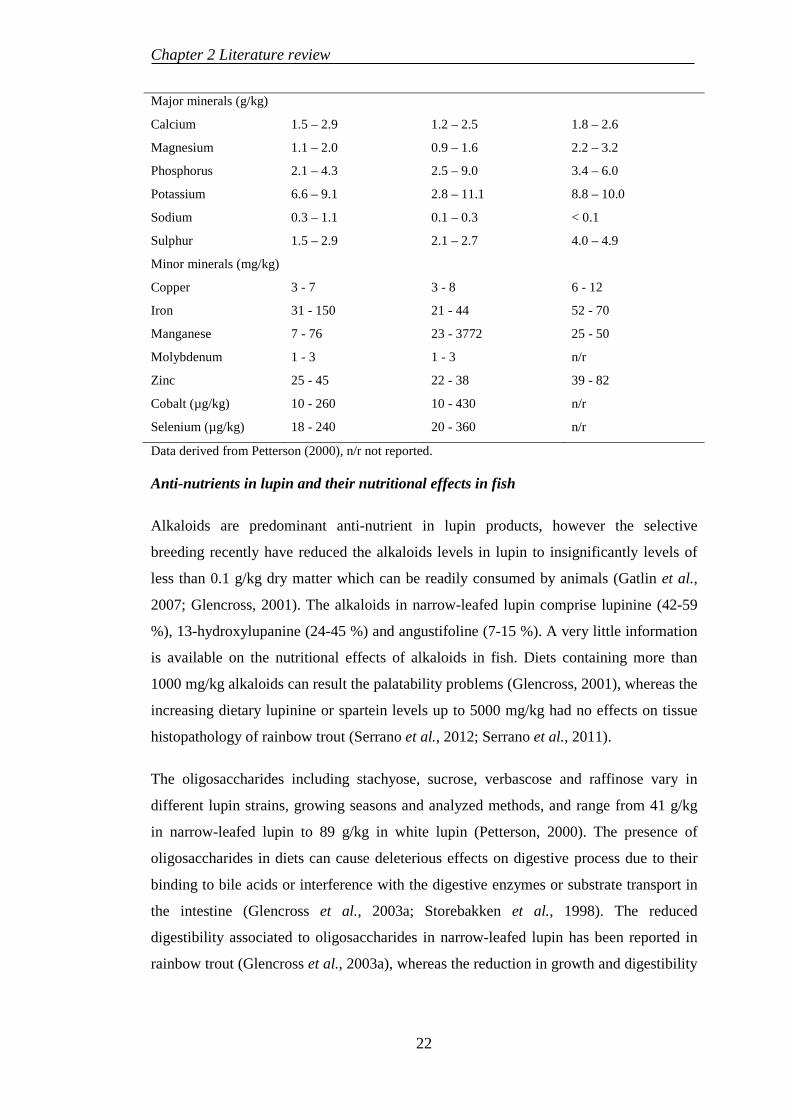
Chapter 2 Literature review
Major minerals (g/kg)
Calcium 1.5 – 2.9 1.2 – 2.5 1.8 – 2.6
Magnesium 1.1 – 2.0 0.9 – 1.6 2.2 – 3.2
Phosphorus 2.1 – 4.3 2.5 – 9.0 3.4 – 6.0
Potassium 6.6 – 9.1 2.8 – 11.1 8.8 – 10.0
Sodium 0.3 – 1.1 0.1 – 0.3 < 0.1
Sulphur 1.5 – 2.9 2.1 – 2.7 4.0 – 4.9
Minor minerals (mg/kg)
Copper 3 - 7 3 - 8 6 - 12
Iron 31 - 150 21 - 44 52 - 70
Manganese 7 - 76 23 - 3772 25 - 50
Molybdenum 1 - 3 1 - 3 n/r
Zinc 25 - 45 22 - 38 39 - 82
Cobalt (µg/kg) 10 - 260 10 - 430 n/r
Selenium (µg/kg) 18 - 240 20 - 360 n/r
Data derived from Petterson (2000), n/r not reported.
Anti-nutrients in lupin and their nutritional effects in fish
Alkaloids are predominant anti-nutrient in lupin products, however the selective
breeding recently have reduced the alkaloids levels in lupin to insignificantly levels of
less than 0.1 g/kg dry matter which can be readily consumed by animals (Gatlin et al.,
2007; Glencross, 2001). The alkaloids in narrow-leafed lupin comprise lupinine (42-59
%), 13-hydroxylupanine (24-45 %) and angustifoline (7-15 %). A very little information
is available on the nutritional effects of alkaloids in fish. Diets containing more than
1000 mg/kg alkaloids can result the palatability problems (Glencross, 2001), whereas the
increasing dietary lupinine or spartein levels up to 5000 mg/kg had no effects on tissue
histopathology of rainbow trout (Serrano et al., 2012; Serrano et al., 2011).
The oligosaccharides including stachyose, sucrose, verbascose and raffinose vary in
different lupin strains, growing seasons and analyzed methods, and range from 41 g/kg
in narrow-leafed lupin to 89 g/kg in white lupin (Petterson, 2000). The presence of
oligosaccharides in diets can cause deleterious effects on digestive process due to their
binding to bile acids or interference with the digestive enzymes or substrate transport in
the intestine (Glencross et al., 2003a; Storebakken et al., 1998). The reduced
digestibility associated to oligosaccharides in narrow-leafed lupin has been reported in
rainbow trout (Glencross et al., 2003a), whereas the reduction in growth and digestibility
22
Chapter 2 Literature review
in Atlantic salmon was attributable to the presence of oligosaccharides in soybean-based
diets (Refstie et al., 1998).
Lupin meal contains insignificant concentration of phytate (0.5 %) than in soybean (1-
1.5 %) and rapeseed meal (5-7.5 %). The chelation of phytate presented in diet and
minerals such as calcium and zinc can reduce the uptake and metabolism of these
nutrients (Antony Jesu Prabhu et al., 2016; Kumar et al., 2012). However, the anti-
nutritional effects of phytate may vary, depending on its content in the diet and the
existence or absenteeism of distinct stomach (Usmani & Jafri, 2002). The rohu Labeo
rohita and mrigal Cirrhinus mrigala showed reduced SGR when fed diets containing
more than 10 g/kg of phytate (Usmani & Jafri, 2002). Atlantic salmon fed dietary
phytate of 18 g/kg resulted in the reductions of growth and mineral utilization
(Storebakken et al., 1998) , whereas this level were 22 and 13 g/kg in channel catfish
(Satoh et al., 1989) and striped bass Morone saxatilis (Papatryphon et al., 1999),
respectively. The reduced protein and amino acid digestibility and histopathological
lesions in the digestive tissues were also reported in fish and animals fed diets containing
high levels of phytate (Antony Jesu Prabhu et al., 2016).
The saponin content in lupin considerably varies among lupin species. The narrow-
leafed lupin seed contains 0.57 g/kg, while this concentration is only 0.055 g/kg in the
yellow lupin (Glencross, 2001). The presence of saponins in diets can increase the
permeability of the small intestine mucosal cells (Glencross, 2001) and reduce the
transportation of nutrients (Francis et al., 2001). The reduced growth performances of
rainbow trout and tilapia had been linked to the high inclusion levels of saponins in their
diets (Francis et al., 2001). Interestingly, the integration between saponins and other
anti-nutritional factors could inactivate the negative effects of these components. The
toxicities of saponins and tannins could be inactivated by the linkage of saponin- tannins,
as reported in animal (Freeland et al., 1985). Besides, almost saponins can be extracted
from the plant-derived ingredients due to their high solubility in water, making these
feedstuffs have little negative effects in fish (Francis et al., 2001).
The binding between tannins and enzymes and/or nutrients in diets such as protein or
minerals can interfere the nutrient digestion, reduce the vitamin absorption (Francis et
al., 2001), as described in common carp (Becker & Makkar, 1999). Similar to saponins,
the interaction between tannins and cyanogenic glycosides in the diets can reduce the
detrimental effects of the latter (Goldstein & Spencer, 1985), while the impacts of
23
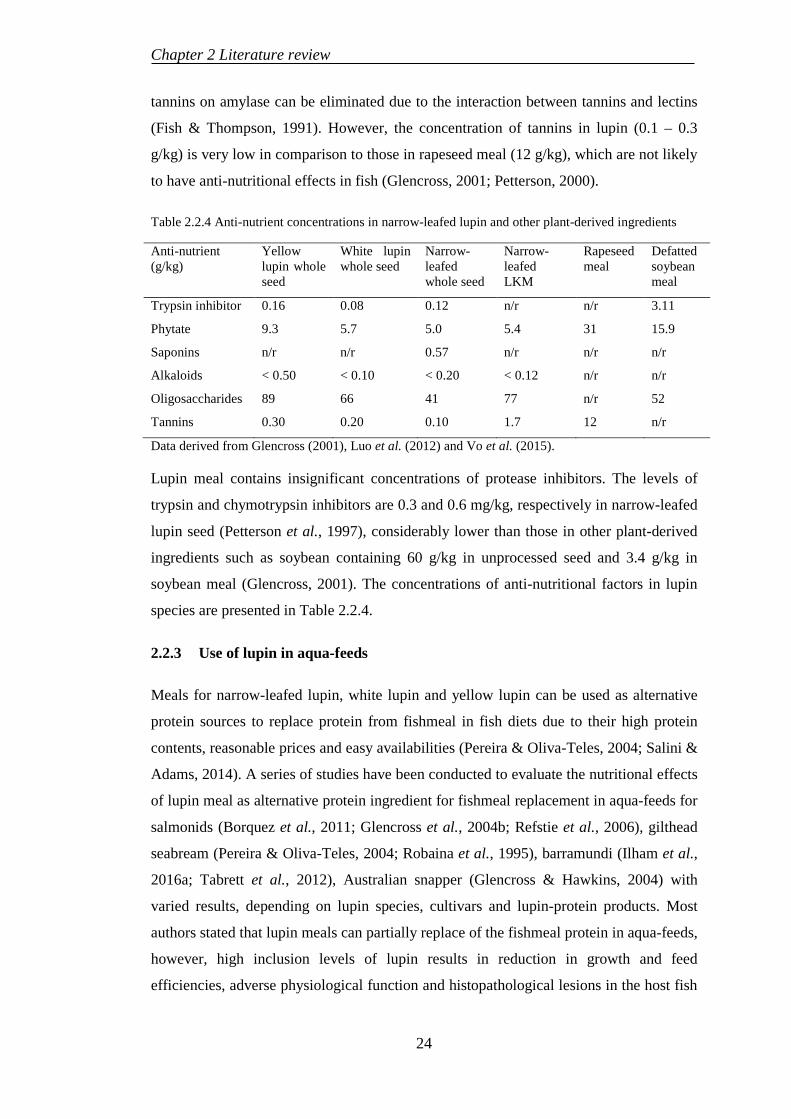
Chapter 2 Literature review
tannins on amylase can be eliminated due to the interaction between tannins and lectins
(Fish & Thompson, 1991). However, the concentration of tannins in lupin (0.1 – 0.3
g/kg) is very low in comparison to those in rapeseed meal (12 g/kg), which are not likely
to have anti-nutritional effects in fish (Glencross, 2001; Petterson, 2000).
Table 2.2.4 Anti-nutrient concentrations in narrow-leafed lupin and other plant-derived ingredients
Anti-nutrient (g/kg)
Yellow lupin whole seed
White lupin whole seed
Narrow-leafed whole seed
Narrow-leafed LKM
Rapeseed meal
Defatted soybean meal
Trypsin inhibitor 0.16 0.08 0.12 n/r n/r 3.11
Phytate 9.3 5.7 5.0 5.4 31 15.9
Saponins n/r n/r 0.57 n/r n/r n/r
Alkaloids < 0.50 < 0.10 < 0.20 < 0.12 n/r n/r
Oligosaccharides 89 66 41 77 n/r 52
Tannins 0.30 0.20 0.10 1.7 12 n/r
Data derived from Glencross (2001), Luo et al. (2012) and Vo et al. (2015).
Lupin meal contains insignificant concentrations of protease inhibitors. The levels of
trypsin and chymotrypsin inhibitors are 0.3 and 0.6 mg/kg, respectively in narrow-leafed
lupin seed (Petterson et al., 1997), considerably lower than those in other plant-derived
ingredients such as soybean containing 60 g/kg in unprocessed seed and 3.4 g/kg in
soybean meal (Glencross, 2001). The concentrations of anti-nutritional factors in lupin
species are presented in Table 2.2.4.
2.2.3 Use of lupin in aqua-feeds
Meals for narrow-leafed lupin, white lupin and yellow lupin can be used as alternative
protein sources to replace protein from fishmeal in fish diets due to their high protein
contents, reasonable prices and easy availabilities (Pereira & Oliva-Teles, 2004; Salini &
Adams, 2014). A series of studies have been conducted to evaluate the nutritional effects
of lupin meal as alternative protein ingredient for fishmeal replacement in aqua-feeds for
salmonids (Borquez et al., 2011; Glencross et al., 2004b; Refstie et al., 2006), gilthead
seabream (Pereira & Oliva-Teles, 2004; Robaina et al., 1995), barramundi (Ilham et al.,
2016a; Tabrett et al., 2012), Australian snapper (Glencross & Hawkins, 2004) with
varied results, depending on lupin species, cultivars and lupin-protein products. Most
authors stated that lupin meals can partially replace of the fishmeal protein in aqua-feeds,
however, high inclusion levels of lupin results in reduction in growth and feed
efficiencies, adverse physiological function and histopathological lesions in the host fish
24
Chapter 2 Literature review
tissues. An overview of lupin as alternative protein source to replace fishmeal in various
fish is described in Table 2.2.5.
Effects of dietary lupin on growth and feed utilisation
Farhangi and Carter (2001) and Glencross et al. (2004b) showed that up to 400 g/kg
lupin of narrow-leafed and yellow lupins can be successfully used in rainbow trout,
without impairing growth and nutrient utilisation, however, the reduced growth and
energy efficiency ratio were observed in fish fed to 500 g/kg lupin. Meanwhile, up to
500 g/kg of whole grain white lupin could be included in the diet of this species without
reducing growth and feed efficiency (Borquez et al., 2011). The increasing dietary
narrow-leafed lupin kernel meal from 0 to 510 g/kg had no negative effects on growth,
feed intake and FCR in barramundi (Ilham et al., 2016a). The barramundi fed 300 g/kg
yellow or narrow-leafed lupin kernel meal resulted in significantly higher final weight
and feed intake than those fed fishmeal-based diet (Glencross et al., 2011). Gilthead
seabream also showed less susceptibility to dietary lupin, where approximately 400 g/kg
lupin seed meals could be incorporated without depressing growth and feed utilisation
(Pereira & Oliva-Teles, 2004; Robaina et al., 1995).
Nutrient digestibility
As lysine and methionine are limiting essential amino acids in lupin meal, high inclusion
levels of lupin in diets can result in imbalanced amino acid profiles (Gatlin et al., 2007),
consequently, impairing the growth and feed utilisation in fish (Borquez et al., 2011).
Besides, the presence of anti-nutritional factors in lupin might interfere with other
nutrients, resulting in low digestibility of these components. Glencross and Hawkins
(2004) demonstrated a higher digestibility of protein (> 88 %) and phosphorus (> 90 %)
in both Australian snapper and rainbow trout fed different lupin species, whereas the
organic matter and energy were poorly digested, with less than 60 % and 70 %,
respectively. This finding was similar to barramundi (Ilham et al., 2016a; Tabrett et al.,
2012).
However, the nutrient digestibility of lupin meal shows a degree of variability,
depending on the lupin species, cultivars and lupin products (Glencross, 2001; Tabrett et
al., 2012). The digestibility of organic matter and energy in barramundi fed white lupin
kernel meal were significantly higher than in fish fed narrow-leafed lupin kernel meal
(Tabrett et al., 2012). Rainbow trout fed lupin protein isolates resulted in higher nutrient
25
Chapter 2 Literature review
digestibility than fed lupin kernel meal or lupin protein concentrates (Glencross et al.,
2010), whereas dietary lupin protein concentrates resulted in higher digestibility of
protein, organic matter and energy values in Atlantic salmon than fish fed lupin kernel
meal (Refstie et al., 2006).
Borquez et al. (2011) showed that rainbow trout fed dietary whole grain white lupin did
not cause any effects on proximate composition in the whole-body and muscle fatty acid
concentrations, similar to those reported in rainbow trout fed to yellow lupin kernel meal
(Glencross et al., 2004b) or narrow-leafed lupin kernel meal, except a slight fluctuation
in crude protein level (Farhangi & Carter, 2001). This was also consistent with the
results reported in gilthead seabream (Pereira & Oliva-Teles, 2004) and Atlantic salmon
(Carter & Hauler, 2000) after being fed to narrow-leafed lupin seed meal and/or narrow-
leafed protein concentrate, respectively. However, the reduction in crude lipid caused by
high dietary narrow-leafed lupin seed was reported in gilthead seabream (Robaina et al.,
1995), which could be attributed to a low energy intake caused by a low feed intake,
energy digestibility in fish fed high inclusion level of plant-derived ingredients (Luo et
al., 2012).
High inclusion levels of plant-derived feedstuffs in aqua-feeds may result in imbalanced
amino acid profiles in the diets due to the low concentrations of essential amino acids as
lysine, methionine in plant meal (Gatlin et al., 2007), thus, impairing the amino acid
concentrations in fish, as reported in cobia (Chou et al., 2004) and gilthead seabream
(Gómez-Requeni et al., 2004). However, there is no available information on the effects
of dietary lupin on amino acid profiles in tissues of fish.
Effects of dietary lupin on the physiology of the host species
Barramundi fed dietary levels of 185 and 510 g/kg lupin kernel meal did not show any
significant changes in haematological parameters and GPx activity in RBCs after 60
days exposure (Ilham et al., 2016a). Dietary lupin also did not affect the total cholesterol
and triacylglycerol in plasma of black seabream (Zhang et al., 2012). As RBC and Hb
play important roles in fish health (Kader et al., 2010), the levels of RBC and Hb are
useful bio-markers to evaluate health status in fish fed lupin-based diets.
Dietary lupin also resulted in the reduction of protease and trypsin activity in gilthead
seabream (Glencross et al., 2004b). However, these effects are species-specific and
dependent on different lupin ingredients. Refstie et al. (2006) investigated the
26
Chapter 2 Literature review
physiological responses of Atlantic salmon fed to different lupin products, wherein, fish
fed yellow and narrow-leafed protein concentrates resulted in significantly higher trypsin
activity and bile acid concentrations in the distal intestine than fed lupin kernel meals.
Dietary lupin had no effects on hepatosomatic index (HSI) and viscerasomatic index
(VSI) in gilthead seabream (Glencross et al., 2004b; Pereira & Oliva-Teles, 2004) and
black seabream (Zhang et al., 2012). This was opposite to the reduced HSI in rainbow
trout fed high levels of whole grain lupin (Borquez et al., 2011).
The histopathological lesions including the increase in lipid droplet in the livers, changes
in the structural muscles caused by dietary lupin meal levels have been observed in fish
(Gu et al., 2014; Ilham et al., 2016a). The falsification, disconnection, and longitudinal
rupture of muscle fibres were observed in barramundi fed 185 and 510 g/kg narrow-
leafed lupin kernel meal, whereas fish fed 510 g/kg lupin also showed increasing hepatic
lipid droplets (Ilham et al., 2016a). The increased lipid vacuolization was also found in
hepatocytes of rainbow trout fed dietary inclusion of 400 g/kg whole grain white lupin
(Borquez et al., 2011), similar to reported in gilthead seabream fed 208 g/kg narrow-
leafed lupin seed (Glencross et al., 2004b). Atlantic salmon fed diets containing 200 g/kg
lupin meal and 190 g/kg wheat gluten showed increased lipid droplet deposition in
enterocytes and severe hepatic steatosis compared to those fed fishmeal-based diets (Gu
et al., 2014), which may be linked to increasing lipolysis from adipose tissue, as
mentioned in Atlantic salmon (Gu et al., 2014) and gilthead seabream (Bouraoui et al.,
2011).
The increment of lipid accumulated in liver tissues have been linked to deficiency of Se
in the diets (Burk et al., 1995). Lupin meal contains insignificant concentration of Se
(Petterson, 2000), which can lead to Se deficiency when high fishmeal protein is
replaced with lupin protein ingredient, resulting in histological changes in liver tissues,
as reported in barramundi (Ilham et al., 2016a). The barramundi fed lupin-based with
organic Se supplementation did not show any histopathological lesions in the livers
(Ilham et al., 2016a), however, the specific mechanism of the interaction between Se and
plant-derived ingredients in histological responses in fish is still unknown.
The increment of lipid accumulations in intestines induced by dietary lupin meal have
been demonstrated in Atlantic salmon (Gu et al., 2014) and rainbow trout (Borquez et
al., 2011) fed 200 and 500 g/kg, respectively of lupin meals. This is inconsistent with a
report in Atlantic salmon, where fish fed 300 g/kg lupin kernel meal showed normal
27
Chapter 2 Literature review
intestinal morphology, resulting in well-differentiated enterocytes with many absorptive
vacuoles. Similar results were also observed in digestive tracts of barramundi (Ilham et
al., 2016a) fed different inclusion levels of lupin kernel meal.
28
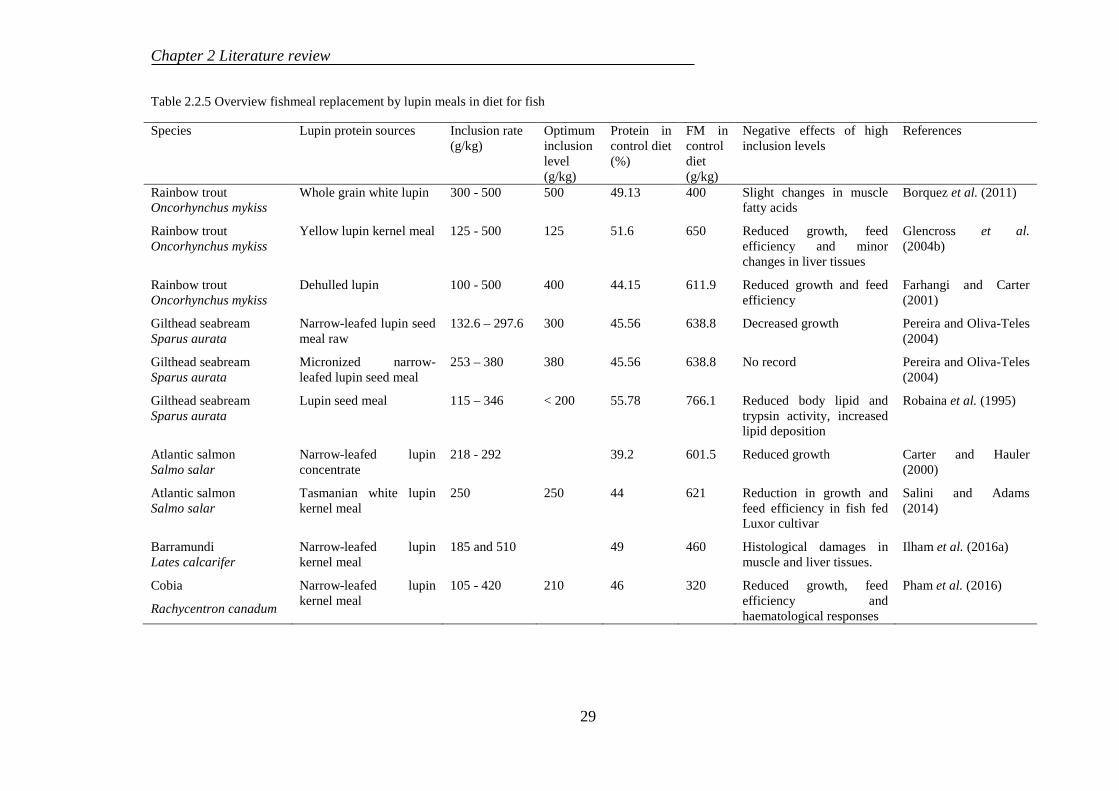
Chapter 2 Literature review
Table 2.2.5 Overview fishmeal replacement by lupin meals in diet for fish
Species Lupin protein sources Inclusion rate (g/kg)
Optimum inclusion level (g/kg)
Protein in control diet (%)
FM in control diet (g/kg)
Negative effects of high inclusion levels
References
Rainbow trout Oncorhynchus mykiss
Whole grain white lupin 300 - 500 500 49.13 400 Slight changes in muscle fatty acids
Borquez et al. (2011)
Rainbow trout Oncorhynchus mykiss
Yellow lupin kernel meal 125 - 500 125 51.6 650 Reduced growth, feed efficiency and minor changes in liver tissues
Glencross et al. (2004b)
Rainbow trout Oncorhynchus mykiss
Dehulled lupin 100 - 500 400 44.15 611.9 Reduced growth and feed efficiency
Farhangi and Carter (2001)
Gilthead seabream Sparus aurata
Narrow-leafed lupin seed meal raw
132.6 – 297.6 300 45.56 638.8 Decreased growth Pereira and Oliva-Teles (2004)
Gilthead seabream Sparus aurata
Micronized narrow-leafed lupin seed meal
253 – 380 380 45.56 638.8 No record Pereira and Oliva-Teles (2004)
Gilthead seabream Sparus aurata
Lupin seed meal 115 – 346 < 200 55.78 766.1 Reduced body lipid and trypsin activity, increased lipid deposition
Robaina et al. (1995)
Atlantic salmon Salmo salar
Narrow-leafed lupin concentrate
218 - 292 39.2 601.5 Reduced growth Carter and Hauler (2000)
Atlantic salmon Salmo salar
Tasmanian white lupin kernel meal
250 250 44 621 Reduction in growth and feed efficiency in fish fed Luxor cultivar
Salini and Adams (2014)
Barramundi Lates calcarifer
Narrow-leafed lupin kernel meal
185 and 510 49 460 Histological damages in muscle and liver tissues.
Ilham et al. (2016a)
Cobia
Rachycentron canadum
Narrow-leafed lupin kernel meal
105 - 420 210 46 320 Reduced growth, feed efficiency and haematological responses
Pham et al. (2016)
29
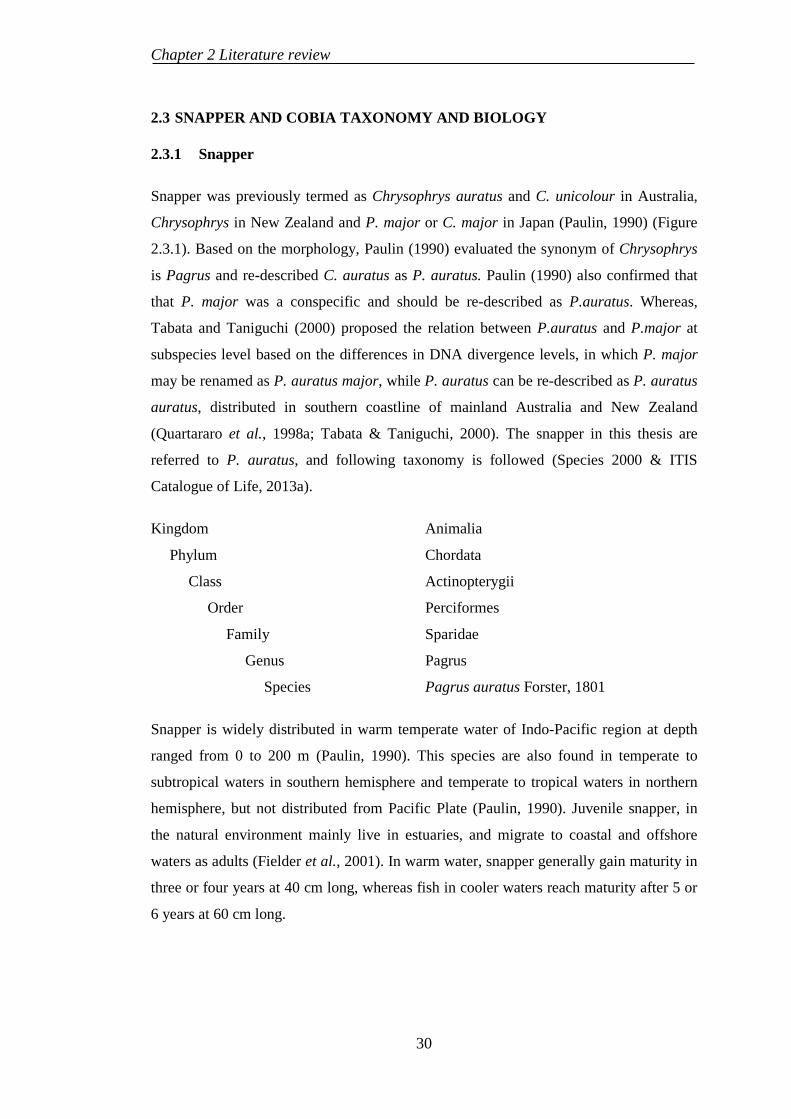
Chapter 2 Literature review
2.3 SNAPPER AND COBIA TAXONOMY AND BIOLOGY
2.3.1 Snapper
Snapper was previously termed as Chrysophrys auratus and C. unicolour in Australia,
Chrysophrys in New Zealand and P. major or C. major in Japan (Paulin, 1990) (Figure
2.3.1). Based on the morphology, Paulin (1990) evaluated the synonym of Chrysophrys
is Pagrus and re-described C. auratus as P. auratus. Paulin (1990) also confirmed that
that P. major was a conspecific and should be re-described as P.auratus. Whereas,
Tabata and Taniguchi (2000) proposed the relation between P.auratus and P.major at
subspecies level based on the differences in DNA divergence levels, in which P. major
may be renamed as P. auratus major, while P. auratus can be re-described as P. auratus
auratus, distributed in southern coastline of mainland Australia and New Zealand
(Quartararo et al., 1998a; Tabata & Taniguchi, 2000). The snapper in this thesis are
referred to P. auratus, and following taxonomy is followed (Species 2000 & ITIS
Catalogue of Life, 2013a).
Kingdom Animalia
Phylum Chordata
Class Actinopterygii
Order Perciformes
Family Sparidae
Genus Pagrus
Species Pagrus auratus Forster, 1801
Snapper is widely distributed in warm temperate water of Indo-Pacific region at depth
ranged from 0 to 200 m (Paulin, 1990). This species are also found in temperate to
subtropical waters in southern hemisphere and temperate to tropical waters in northern
hemisphere, but not distributed from Pacific Plate (Paulin, 1990). Juvenile snapper, in
the natural environment mainly live in estuaries, and migrate to coastal and offshore
waters as adults (Fielder et al., 2001). In warm water, snapper generally gain maturity in
three or four years at 40 cm long, whereas fish in cooler waters reach maturity after 5 or
6 years at 60 cm long.
30
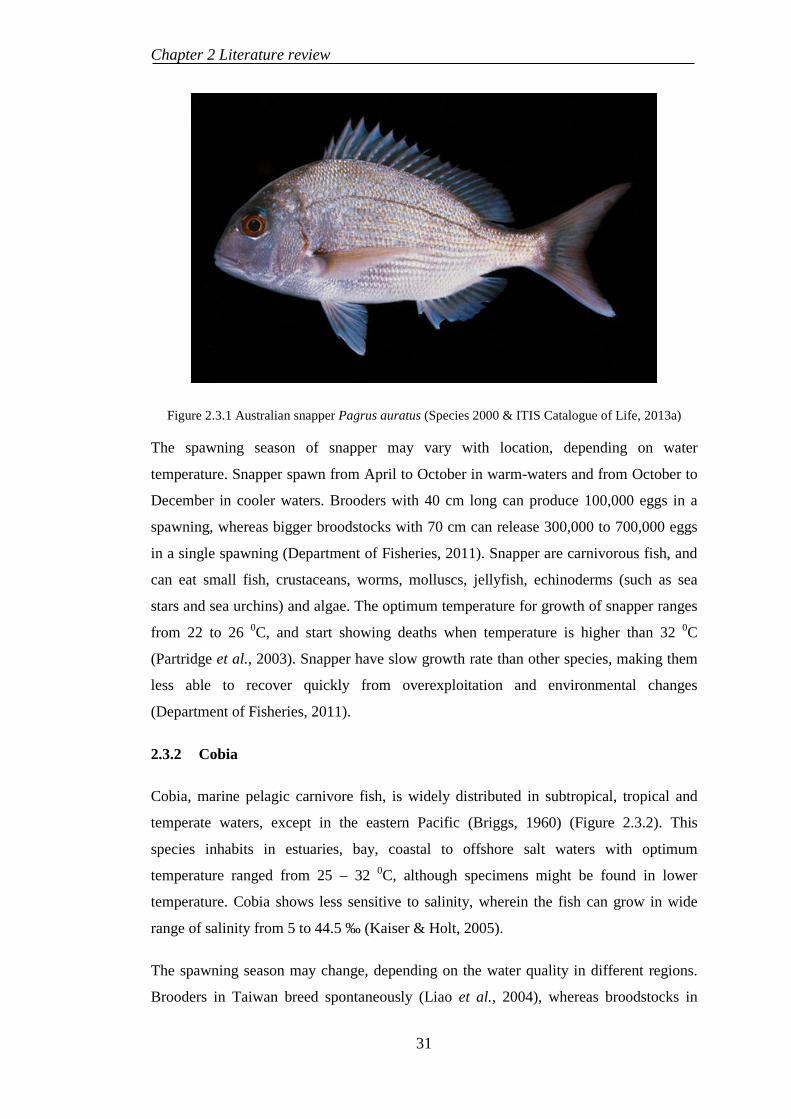
Chapter 2 Literature review
Figure 2.3.1 Australian snapper Pagrus auratus (Species 2000 & ITIS Catalogue of Life, 2013a)
The spawning season of snapper may vary with location, depending on water
temperature. Snapper spawn from April to October in warm-waters and from October to
December in cooler waters. Brooders with 40 cm long can produce 100,000 eggs in a
spawning, whereas bigger broodstocks with 70 cm can release 300,000 to 700,000 eggs
in a single spawning (Department of Fisheries, 2011). Snapper are carnivorous fish, and
can eat small fish, crustaceans, worms, molluscs, jellyfish, echinoderms (such as sea
stars and sea urchins) and algae. The optimum temperature for growth of snapper ranges
from 22 to 26 0C, and start showing deaths when temperature is higher than 32 0C
(Partridge et al., 2003). Snapper have slow growth rate than other species, making them
less able to recover quickly from overexploitation and environmental changes
(Department of Fisheries, 2011).
2.3.2 Cobia
Cobia, marine pelagic carnivore fish, is widely distributed in subtropical, tropical and
temperate waters, except in the eastern Pacific (Briggs, 1960) (Figure 2.3.2). This
species inhabits in estuaries, bay, coastal to offshore salt waters with optimum
temperature ranged from 25 – 32 0C, although specimens might be found in lower
temperature. Cobia shows less sensitive to salinity, wherein the fish can grow in wide
range of salinity from 5 to 44.5 ‰ (Kaiser & Holt, 2005).
The spawning season may change, depending on the water quality in different regions.
Brooders in Taiwan breed spontaneously (Liao et al., 2004), whereas broodstocks in
31
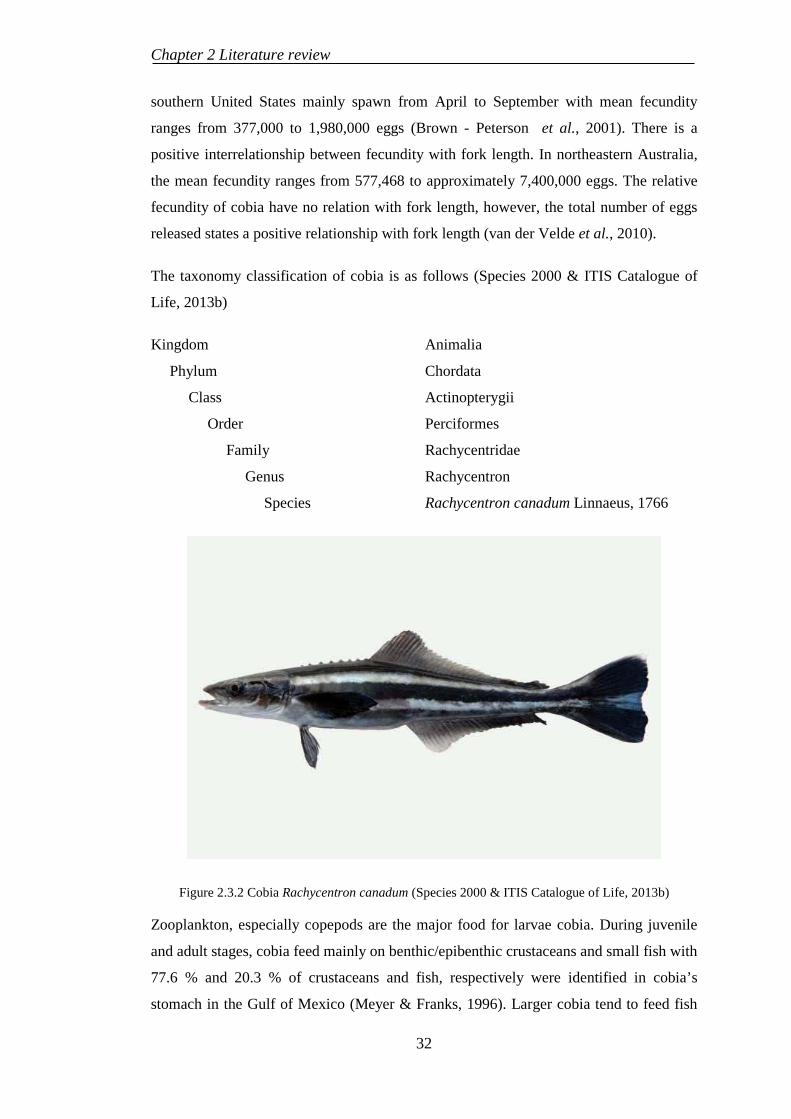
Chapter 2 Literature review
southern United States mainly spawn from April to September with mean fecundity
ranges from 377,000 to 1,980,000 eggs (Brown - Peterson et al., 2001). There is a
positive interrelationship between fecundity with fork length. In northeastern Australia,
the mean fecundity ranges from 577,468 to approximately 7,400,000 eggs. The relative
fecundity of cobia have no relation with fork length, however, the total number of eggs
released states a positive relationship with fork length (van der Velde et al., 2010).
The taxonomy classification of cobia is as follows (Species 2000 & ITIS Catalogue of
Life, 2013b)
Kingdom Animalia
Phylum Chordata
Class Actinopterygii
Order Perciformes
Family Rachycentridae
Genus Rachycentron
Species Rachycentron canadum Linnaeus, 1766
Figure 2.3.2 Cobia Rachycentron canadum (Species 2000 & ITIS Catalogue of Life, 2013b)
Zooplankton, especially copepods are the major food for larvae cobia. During juvenile
and adult stages, cobia feed mainly on benthic/epibenthic crustaceans and small fish with
77.6 % and 20.3 % of crustaceans and fish, respectively were identified in cobia’s
stomach in the Gulf of Mexico (Meyer & Franks, 1996). Larger cobia tend to feed fish
32
Chapter 2 Literature review
than other preys, resulting in 84.4 % of fish on stomach of cobia (1,150 – 1,530 mm folk
length), however, the feeding habits of cobia may change, depending on the availability
of preys rather than specific food organisms (Meyer & Franks, 1996).
Cobia have relatively fast growth rate in the first two year, and gradually reduced in
following years. Juveniles (30 g) can reach to 5 kg in one year in sea-cage farming
(Chou et al., 2001). The maximum length, weight and age of female sampled in the Gulf
of Mexico were 160 cm, 62.2 kg and 11 years, respectively (Franks et al., 1999). The
relationship between fork length with age based on the von Bertalanffy equation for male
and female are FLt = 1171(1-exp [-0.432(t + 1.1150)]) and FLt = 1555(1-exp [-272(t +
1.254)]) (Franks et al., 1999).
2.4 SNAPPER AND COBIA AQUACULTURE AND NUTRTIONAL RESEARCH
2.4.1 Snapper aquaculture
Snapper was first made to reproduce in Australia and New Zealand in the late 1980’s.
Some hatcheries were established in New South Wales, South Australia and Western
Australia to produce fingerling for research and small-scale farming of snapper
(Battaglene, 1996). Hatchery manual for Australian snapper production has been
produced by Battaglene and Talbot (1992) and Partridge et al. (2003). Adult snapper are
collected from wild and transferred to hatchery for reproduction. If fish is collected in
deep water (> 15 m), the venting needs to be applied to maintain their buoyancy.
Broodstock are fed prawn, squid, whitebait, mussels and pilchards at ratio of 2:2:1:1:1 to
provide sufficient DHA, EPA, vitamin, carotenoids and astaxanthin requirements
(Partridge et al., 2003). Brooders are injected with human chorionic gonadotropin
(HCG) at 1000 UI/kg and transferred into seawater through flowing tank and kept in the
dark in 24 h before egg stripping. However, hatchery-reared broodstock can naturally
spawn throughout the year without application of induced hormones or ecological
factors such as photoperiod and temperature. Spawned eggs are 920 to 1000 µm in
diameter with single oil globule ranging from 200 to 250 µm (Partridge et al., 2003).
During incubation, tanks need to be darkened to improve swim-bladder inflation
(Battaglene & Talbot, 1992). Enriched rotifers following with brine shrimp are used to
feed snapper larvae. Feeding regimes of snapper followed the protocols installed for
reproduction of red seabream in Japan (Battaglene & Talbot, 1992). The larvae start
weaning after 16 days with size from 7.0 mm and completed in 30 days. The commercial
feeds having 200 µm in diameter can be used at this stage (Partridge et al., 2003).
33
Chapter 2 Literature review
Juveniles (1- 20 g) are reared in tanks at a stocking density of 11.6 kg/m3. A water flow
and pure oxygen should be installed to increase water quality. As snapper is very
sensitive to lighting, the illumination needs to be kept constant at the levels of at least
100 – 250 lux. During this phase, juveniles are fed commercial salmon sinking pellets
containing 50 % protein and 14 % lipid. The high-energy feeds should be used for larger
juveniles (40 – 60 g). Juveniles must be graded to avoid cannibalism (Partridge et al.,
2003).
In Australia, small-scale tank-based culture of snapper is practices mainly in New South
Wales, South Australia and Western Australia because of the lack of available protected
coastal areas for sea cage culture (Patridge & Jenkins, 2003), the reliance on high cost
commercial diets of other marine fish (Booth et al., 2005). Wild snapper juveniles are
easily adapted to rearing condition and artificial feed. Snapper cultured under captivity in
tanks shows significantly higher growth rate than those in natural condition. The snapper
juveniles can reach to marketable size (25 cm) after 21 months (Bell et al., 1991).
Australian snapper can be cultured in saline groundwater if the potassium is
supplemented to meet 50 % or 100 % potassium level in the coastal water (Fielder et al.,
2001).
Snapper cultured under poor conditions may be infested with bacteria such as Vibrio
harveyii, V. damsel, V. tubiashi, Photobacterium damsel, Flexibacter sp and
Pseudomonas sp in which fish infested V. damsel caused 100 % mortality in infected
tank. Other diseases caused by protozoan, metazoan and parasitic copepods are also
reported in snapper farming (Partridge et al., 2003).
2.4.2 Cobia aquaculture
The small-scale cobia culture began in Taiwan from 1970s, relying on juveniles
collected form wild. The successful seed production in 1997 has increased the cobia
farming in both area and production (Liao et al., 2004). The global cobia production has
rapidly increased from 9 tons in 1997 to approximately 30,000 tons in 2007 (Nhu et al.,
2011) and 40,000 tons in 2010 (FAO, 2012). The cobia farming has been introduced to
more than 23 countries and territories, mainly located in Asian-Pacific region, where
China, Taiwan and Vietnam are the largest cobia producers in the world (Nhu et al.,
2011).
34
Chapter 2 Literature review
The protocol for cobia seed reproduction has been demonstrated by Liao et al. (2004)
and Nhu et al. (2011). Broodstock are fed trash fish at a feeding rate of 3 – 5 %/day, and
supplemented with squid oil, vitamin and minerals three months before spawning.
Brooders fed commercial diets should be supplemented with n-3 HUFA to improve the
egg quality and fertilisation (Nhu et al., 2011). Cobia can spawn spontaneously year
around, depending on water temperature. In North Vietnam, cobia spawn naturally from
April to July, whereas it spawns from January to November in South Vietnam (Nhu et
al., 2011). Hormone, LRH-a can be used to induce cobia breeding at doses of 20 μg/kg
for female and 10 μg/kg for male. Cobia larvae can be reared in intensive system using
recirculating water system and live feed products or in pond with natural zooplankton, as
detailed description by Nhu et al. (2011). To improve the growth and survival, rotifers
and Artemia need to be enriched to provide adequate n-3 HUFA requirement for cobia
larvae (Nhu et al., 2011).
The cobia is usually cultured in sea-cages. In Vietnam, the small-scale wooden cages (4
x 4 x 4m) are installed in closed bays while trash fish are used as the major feed (Nhu et
al., 2011). In Taiwan, cobia fingerlings are stocked in both rectangular cages (3 x 3 x
3m) in small-scale circular cages (7 x 5m) before transferred into bigger circular cages
(12.7 x 8m or 16 x 9m) (Liao et al., 2004). The commercial diets containing 42 – 45 %
crude protein and 15 – 16 % lipid are generally used in grow-out cobia farming in
Taiwan. After 12 -14 months, cobia can reach to 7 kg with FCR of 1.5 (Liao et al.,
2004). In Vietnam, cobia fed extruded pellet diet can reach to 6.84 kg after one year, is
twice higher than those fed trash fish (3.35 kg). The FCR of cobia fed commercial feeds
varies from 1.2 – 2.0, depending on fish size, but lower than those fed trash fish (2.4) in
dry weight (Nhu et al., 2011).
During larval rearing, protozoan infestations from Vorticella sp, Epistylis sp, Benedenia
Pseudorhabdosynochus epinepheli, and Trichodina have been reported, whereas
Amyloodinium ocellatum and Myxosporidean infestation may cause massive mortality in
cobia juveniles (Liao et al., 2004; Nhu et al., 2011). The bacterial infections can cause
high mortality in cage culture of cobia. Besides, the quantity and quality of cobia
juveniles, availability of commercial feeds and market as well as weather conditions are
major challenges for expansion of cobia farming (Liao et al., 2004; Nhu et al., 2011).
35
Chapter 2 Literature review
2.4.3 Nutritional research on snapper
A very little information on the nutritional requirement for Australian snapper is
available. Thus, the commercial barramundi and Atlantic salmon feeds (51.9 % crude
protein and 13.5 % lipid) are generally used to feed snapper both in commercial and
laboratory environment (Booth et al., 2012). Booth et al. (2007) determined digestible
protein (DP) requirement in Australian snapper fed various levels of digestible energy
(DE). The optimum digestible protein to energy ratio in fish fed high, mild and low
energy diets are 460:20, 420:18 and 350:15, respectively, whereas the optimum DP:DE
ratio for maximum growth and protein deposition in this species is 23 g (Booth et al.,
2007). Glencross et al. (2004d) also indicated that the Australian snapper fed diet
containing 52.6 % crude protein showed significantly higher growth rate than those fed
diet containing 36 % protein. There is no published report on amino acid requirement of
Australian snapper. Whereas, the dietary lysine and taurine requirement for subspecies,
red sea bream Pagrus major have been quantified to be 3.6 and 0.52 % of the diet,
respectively (Forster & Ogata, 1998; Matsunari et al., 2008) which can be applicable in
formulated diet for Australian snapper. Moderate levels of gelatin starch can be digested
by Australian snapper, however, the starch levels of 250 and 350 g/kg are threshold
levels for small (110 g/fish) and large (375 g/fish) snapper (Booth et al., 2006).
In spite of the lack of standard reference diet, a few studies on the digestibility and
growth performance of snapper fed alternative protein and lipid sources have been
evaluated (Booth et al., 2005; Booth et al., 2012; Booth et al., 2006; Glencross et al.,
2003b; Glencross et al., 2003c; Glencross et al., 2004c; Quartararo et al., 1998a), in
which the control diets contained a relatively large variety of protein and lipid levels (51
– 70 % and 6.8 – 17.5 %, respectively). The fishmeal can be substituted by 36 % poultry
meal, or 35 % meat meal, and or 42 % soybean meal without impairing the growth
performances and feed efficiency of snapper compared to those fed the commercial diet
(Booth et al., 2012). The small and large snapper also shows high capacity to digest
gelatinized starch at inclusion levels less than 250 and 350 g/kg diet, respectively (Booth
et al., 2006), whereas fishmeal can be replaced up to 50 % by meat meal or poultry meal,
and/or 30 % soybean meal without comprising the digestibility of nutrients (Booth et al.,
2005). When feeding to limited dietary protein, snapper fed Australian canola meal-
based diet did not show any difference in growth and feed efficiency in comparison to
those fed fishmeal-based diet (Glencross et al., 2004d). Similar to fishmeal, some studies
have indicated that up to 100 % of fish oil can be replaced by canola oil or soybean oil in
36
Chapter 2 Literature review
the diets for snapper without negative effects on growth, feed efficiency and proximate
composition. The combination of 50 % soybean oil and 50 % fish oil can improve the
final weight of snapper compared to those fed 100 % fish oil (Glencross et al., 2003c).
Although snapper fed different oil sources showed no difference in fatty acid profiles,
however, fish fed fish oil diet as finisher diet after feeding with soybean oil or canola oil
shows the increase in levels of long-chain polyunsaturated fatty acid (lcPUFA) such as
20: 5n-3 and 22: 6n-3 and decrease in PUFA such as 18: 2n-6 and 18: 2n-3 (Glencross et
al., 2003c).
2.4.4 Nutritional research on cobia
Carnivorous marine fish such as cobia requires high dietary protein to provide adequate
amino acids and nitrogen for the synthesis of non-essential amino acids and other
biological compounds (Fraser & Davies, 2009). The optimum dietary protein for
maximal growth rate and feed utilisation in cobia is 44.5 % (Chou et al., 2001), whereas
Craig et al. (2006) reported that dietary protein levels (40 – 50 %) had no significant
differences on nutritional responses of cobia (49.3 g/fish), but significantly affected the
feed efficiency in smaller cobia (7.3 g/fish). The commercial feed for cobia in United
States contains more than 58 % crude protein, while this level is less than 48 % in
Taiwan and Asian countries (Craig et al., 2006). The dietary methionine required for
maximal SGR and FE in cobia is 1.19 % DM in the diet containing 0.67 % cysteine
(Zhou et al., 2006), whereas the optimum lysine requirement is 2.33 % DM (5.30 % of
dietary protein) based on the maximum specific growth rate (SGR) (Zhou et al., 2007).
Ren et al. (2014) determined the arginine requirement in juvenile cobia to be 2.85 and
2.82% DM, respectively based on the maximal SGR and FE. Salze et al. (2012)
indicated that dietary taurine supplementation improved the growth and activity of
digestive enzymes in larval cobia, whereas juvenile cobia fed plant protein-based diets
required taurine supplementation for potential growth (Lunger et al., 2007).
According to Chou et al. (2001), dietary lipid required for cobia is 5.76% DM. Wang et
al. (2005) found no significant differences in growth in cobia fed dietary lipid of 5 and
15 % DM, whereas the reduced growth was observed in cobia fed dietary lipid of 25 %.
Craig et al. (2006) showed that dietary lipid level from 6 to 18 % has no impact on
growth performance in small cobia (7.4 g/fish), but reduced growth was recorded in
larger cobia (49.3 g/fish) fed dietary lipid of 18 %. The fatty acid requirements for larval
cobia have been estimated based on the biochemical composition of eggs and yolksac
37
Chapter 2 Literature review
larvae (Sargent et al., 1999). Fraser and Davies (2009) found high concentrations of
highly unsaturated fatty acids (HUFAs) in the eggs and yolksac of cobia, which may
indicate the high requirements for these fatty acids in cobia diets The dietary n-3 HUFA
requirement for cobia broodstocks should be higher than 1.86 % DM, however, high
dietary ARA (0.40 – 0.60 %) resulted negative effects on the fertilization of this species
(Nguyen et al., 2010).
Carbohydrates, a less costly energy source, is inefficiently utilised in marine carnivorous
fish (de la Higuera, 2001). However, an adequate starch supplementation in diet can
improve growth of some carnivorous fish (Hemre et al., 2002). Ren et al. (2011)
determined the optimum dietary carbohydrate requirement in juvenile cobia is 21.1 and
18.0 % based on the SGR and FER, respectively.
There is a little available information on the nutritional requirement of both vitamins and
minerals in cobia, though, these elements play important roles for normal growth and
physiological functions in fish (Fraser & Davies, 2009). Mai et al. (2009) determined the
optimum dietary choline requirement to be 696, 877 and 950 mg/kg based on WG and
tissue choline accumulations, respectively. The Se required for small cobia fed casein-
based diet is 0.788, 0.811 and 0.793 mg/kg based on the SGR and Se concentrations in
the tissues (Liu et al., 2010).
Fishmeal rather than terrestrial plant ingredients contains significantly higher protein
content with well-balanced essential amino acids, high nutrient digestibility to meet
nutritional requirement of the fish (Gatlin et al., 2007). However, the rapid development
of aquaculture has led to increased demand for fishmeal coupled with unstable supply
(Olsen & Hasan, 2012; Tacon & Metian, 2008). Several studies have been evaluated to
reduce the fishmeal dependence in cobia diets by using plant-derived ingredients for
cobia (Chou et al., 2004; Luo et al., 2012; Romarheim et al., 2008; Salze et al., 2010;
Suarez et al., 2013; Zhou et al., 2005). In soy products, 40% of protein from fishmeal
can be substituted with soy-derived protein without comprising the growth performances
and feed utilisation (Chou et al., 2004; Zhou et al., 2005), however, the optimum growth
achieved at 16.9 and 18.9 % of replacement levels based on the quadratic regression. The
reduced growth and increased feed conversion ratio (FCR) were reported when more
than 40 % fishmeal protein were substituted with soybean meal. Whereas, 50 % and 94
% of fishmeal protein could be replaced with soy-derived protein and soy protein
concentrate, respectively (Salze et al., 2010; Trushenski et al., 2011). Watson et al.
38
Chapter 2 Literature review
(2014b) demonstrated that non-genetically modified soybean could replace up to 70 % of
protein in a referenced cobia diet without any negative effects on the growth and feed
efficiency. Luo et al. (2012) determined the maximum dietary rapeseed meal in cobia
diet to be 125 g/kg, whereas higher inclusion levels significantly reduced growth
performance and digestibility of nutrients. Luo et al. (2013) showed that up to 300 g/kg
corn gluten meal could be included in cobia diet without impairing the growth and feed
intake (FI), while, dietary inclusion above this level resulted in reduced growth, FI and
survival.
Organically certified yeast-based, another alternative protein ingredient has also been
evaluated in juvenile cobia. The fish fed 195 g/kg yeast-based diet showed equal growth
rate compared to those fed fishmeal-based diet. The increased plasma protein level also
were observed in cobia fed diet containing 25 % yeast-based protein (Lunger et al.,
2006). The dietary taurine supplementation at 5 g/kg increased the inclusion level of
yeast-based protein to be 40 % in cobia diet without impairing growth and feed
efficiency (Lunger et al., 2007). Besides, cobia fed diets containing 302 g/kg poultry-by
product meal did not show any differences on growth, feed efficiency, proximate
composition and haematological performance compared to those fed fishmeal-based diet
(Zhou et al., 2011).
Compared to fishmeal, plant-derived protein ingredients contain considerably amount of
anti-nutritional factors such as saponins, phytate, tannins, oligosaccharides, alkaloids and
protease inhibitors which can interfere the absorption and metabolism of nutrient
components in fish (Francis et al., 2001; Gatlin et al., 2007). Moreover, the lacking of
essential amino acids as methionine, lysine in plant meal can cause imbalanced amino
acid profile when fishmeal is replaced with plant meal protein, consequently, resulting in
reduced growth and feed efficiency, altering the histopathological performances in
digestive tissues. The decreased growth and nutrient digestibility in cobia have been
linked to the presence of high phytic acid and tannins concentrations in rapeseed meal
(Luo et al., 2012), whereas, Chou et al. (2004) showed that the methionine deficiency in
soybean caused negative effects on growth and FCR in juvenile cobia.
To increase inclusion levels of plant-derived ingredients in aqua-feeds, the
supplementation of amino acids, feed stimulants as flavourings and exogenous enzymes
are necessary to enhance the performances of growth and feed utilisation (Gatlin et al.,
2007). The beneficial effects of trace element as selenium (Se) on growth, nutrient
39
Chapter 2 Literature review
digestibility and physiological responses in fish fed plant-based diets have been
investigated in African catfish (Abdel-Tawwab et al., 2007) and barramundi (Ilham et
al., 2016a). However, no published information is available on effects of dietary Se and
plant-derived ingredients as lupin in carnivorous marine finfish such as Australian
snapper and cobia.
40
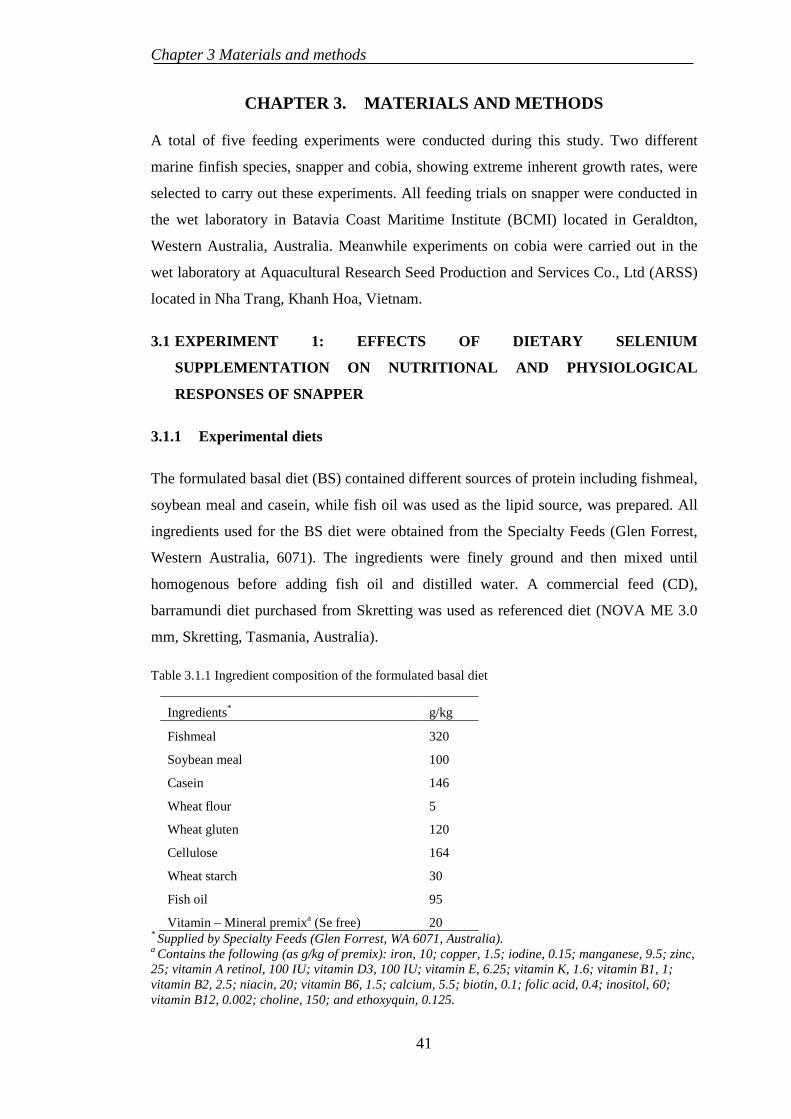
Chapter 3 Materials and methods
CHAPTER 3. MATERIALS AND METHODS
A total of five feeding experiments were conducted during this study. Two different
marine finfish species, snapper and cobia, showing extreme inherent growth rates, were
selected to carry out these experiments. All feeding trials on snapper were conducted in
the wet laboratory in Batavia Coast Maritime Institute (BCMI) located in Geraldton,
Western Australia, Australia. Meanwhile experiments on cobia were carried out in the
wet laboratory at Aquacultural Research Seed Production and Services Co., Ltd (ARSS)
located in Nha Trang, Khanh Hoa, Vietnam.
EXPERIMENT 1: EFFECTS OF DIETARY SELENIUM 3.1
SUPPLEMENTATION ON NUTRITIONAL AND PHYSIOLOGICAL
RESPONSES OF SNAPPER
3.1.1 Experimental diets
The formulated basal diet (BS) contained different sources of protein including fishmeal,
soybean meal and casein, while fish oil was used as the lipid source, was prepared. All
ingredients used for the BS diet were obtained from the Specialty Feeds (Glen Forrest,
Western Australia, 6071). The ingredients were finely ground and then mixed until
homogenous before adding fish oil and distilled water. A commercial feed (CD),
barramundi diet purchased from Skretting was used as referenced diet (NOVA ME 3.0
mm, Skretting, Tasmania, Australia).
Table 3.1.1 Ingredient composition of the formulated basal diet
Ingredients* g/kg
Fishmeal 320
Soybean meal 100
Casein 146
Wheat flour 5
Wheat gluten 120
Cellulose 164
Wheat starch 30
Fish oil 95
Vitamin – Mineral premixa (Se free) 20 * Supplied by Specialty Feeds (Glen Forrest, WA 6071, Australia). a Contains the following (as g/kg of premix): iron, 10; copper, 1.5; iodine, 0.15; manganese, 9.5; zinc, 25; vitamin A retinol, 100 IU; vitamin D3, 100 IU; vitamin E, 6.25; vitamin K, 1.6; vitamin B1, 1; vitamin B2, 2.5; niacin, 20; vitamin B6, 1.5; calcium, 5.5; biotin, 0.1; folic acid, 0.4; inositol, 60; vitamin B12, 0.002; choline, 150; and ethoxyquin, 0.125.
41
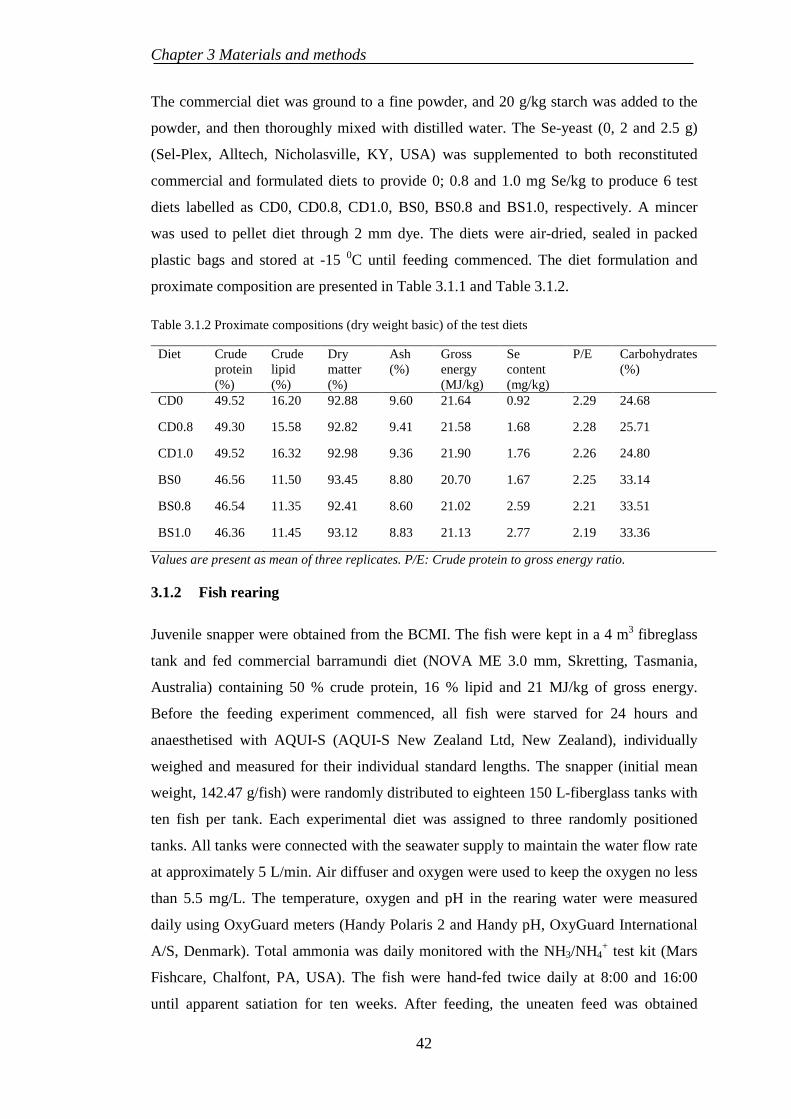
Chapter 3 Materials and methods
The commercial diet was ground to a fine powder, and 20 g/kg starch was added to the
powder, and then thoroughly mixed with distilled water. The Se-yeast (0, 2 and 2.5 g)
(Sel-Plex, Alltech, Nicholasville, KY, USA) was supplemented to both reconstituted
commercial and formulated diets to provide 0; 0.8 and 1.0 mg Se/kg to produce 6 test
diets labelled as CD0, CD0.8, CD1.0, BS0, BS0.8 and BS1.0, respectively. A mincer
was used to pellet diet through 2 mm dye. The diets were air-dried, sealed in packed
plastic bags and stored at -15 0C until feeding commenced. The diet formulation and
proximate composition are presented in Table 3.1.1 and Table 3.1.2.
Table 3.1.2 Proximate compositions (dry weight basic) of the test diets
Diet Crude protein (%)
Crude lipid (%)
Dry matter (%)
Ash (%)
Gross energy (MJ/kg)
Se content (mg/kg)
P/E Carbohydrates (%)
CD0 49.52 16.20 92.88 9.60 21.64 0.92 2.29 24.68
CD0.8 49.30 15.58 92.82 9.41 21.58 1.68 2.28 25.71
CD1.0 49.52 16.32 92.98 9.36 21.90 1.76 2.26 24.80
BS0 46.56 11.50 93.45 8.80 20.70 1.67 2.25 33.14
BS0.8 46.54 11.35 92.41 8.60 21.02 2.59 2.21 33.51
BS1.0 46.36 11.45 93.12 8.83 21.13 2.77 2.19 33.36
Values are present as mean of three replicates. P/E: Crude protein to gross energy ratio.
3.1.2 Fish rearing
Juvenile snapper were obtained from the BCMI. The fish were kept in a 4 m3 fibreglass
tank and fed commercial barramundi diet (NOVA ME 3.0 mm, Skretting, Tasmania,
Australia) containing 50 % crude protein, 16 % lipid and 21 MJ/kg of gross energy.
Before the feeding experiment commenced, all fish were starved for 24 hours and
anaesthetised with AQUI-S (AQUI-S New Zealand Ltd, New Zealand), individually
weighed and measured for their individual standard lengths. The snapper (initial mean
weight, 142.47 g/fish) were randomly distributed to eighteen 150 L-fiberglass tanks with
ten fish per tank. Each experimental diet was assigned to three randomly positioned
tanks. All tanks were connected with the seawater supply to maintain the water flow rate
at approximately 5 L/min. Air diffuser and oxygen were used to keep the oxygen no less
than 5.5 mg/L. The temperature, oxygen and pH in the rearing water were measured
daily using OxyGuard meters (Handy Polaris 2 and Handy pH, OxyGuard International
A/S, Denmark). Total ammonia was daily monitored with the NH3/NH4+ test kit (Mars
Fishcare, Chalfont, PA, USA). The fish were hand-fed twice daily at 8:00 and 16:00
until apparent satiation for ten weeks. After feeding, the uneaten feed was obtained
42
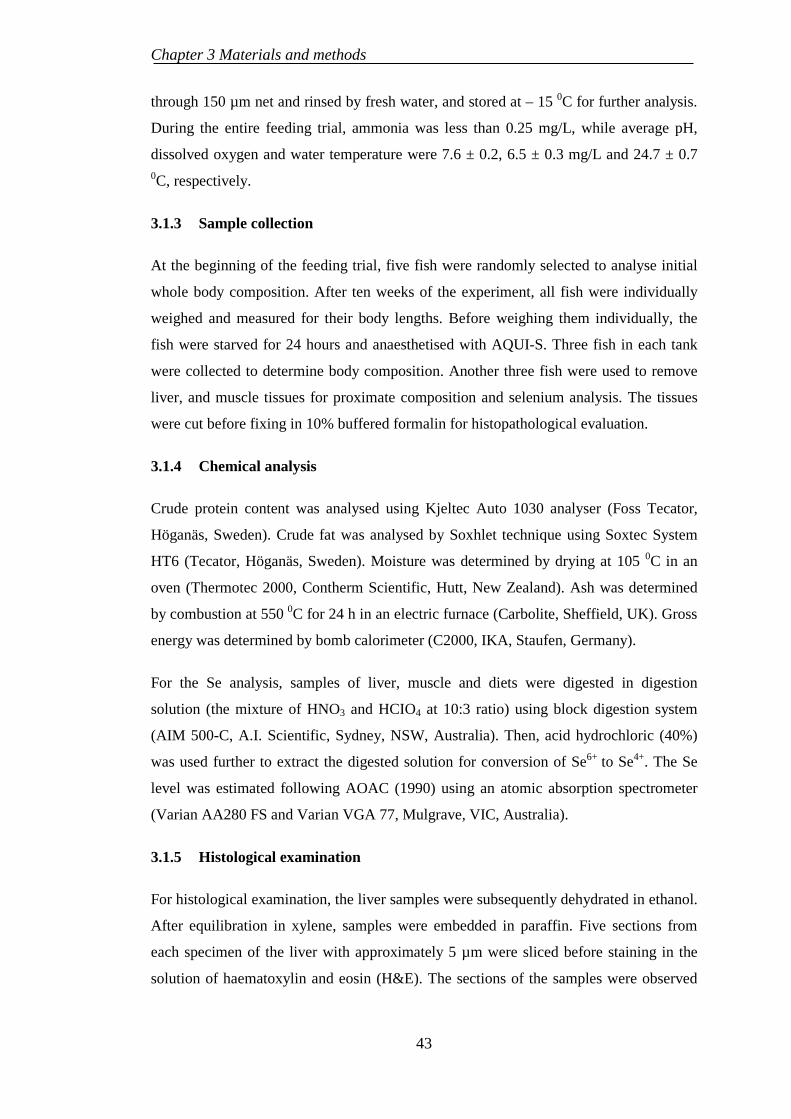
Chapter 3 Materials and methods
through 150 µm net and rinsed by fresh water, and stored at – 15 0C for further analysis.
During the entire feeding trial, ammonia was less than 0.25 mg/L, while average pH,
dissolved oxygen and water temperature were 7.6 ± 0.2, 6.5 ± 0.3 mg/L and 24.7 ± 0.7 0C, respectively.
3.1.3 Sample collection
At the beginning of the feeding trial, five fish were randomly selected to analyse initial
whole body composition. After ten weeks of the experiment, all fish were individually
weighed and measured for their body lengths. Before weighing them individually, the
fish were starved for 24 hours and anaesthetised with AQUI-S. Three fish in each tank
were collected to determine body composition. Another three fish were used to remove
liver, and muscle tissues for proximate composition and selenium analysis. The tissues
were cut before fixing in 10% buffered formalin for histopathological evaluation.
3.1.4 Chemical analysis
Crude protein content was analysed using Kjeltec Auto 1030 analyser (Foss Tecator,
Höganäs, Sweden). Crude fat was analysed by Soxhlet technique using Soxtec System
HT6 (Tecator, Höganäs, Sweden). Moisture was determined by drying at 105 0C in an
oven (Thermotec 2000, Contherm Scientific, Hutt, New Zealand). Ash was determined
by combustion at 550 0C for 24 h in an electric furnace (Carbolite, Sheffield, UK). Gross
energy was determined by bomb calorimeter (C2000, IKA, Staufen, Germany).
For the Se analysis, samples of liver, muscle and diets were digested in digestion
solution (the mixture of HNO3 and HCIO4 at 10:3 ratio) using block digestion system
(AIM 500-C, A.I. Scientific, Sydney, NSW, Australia). Then, acid hydrochloric (40%)
was used further to extract the digested solution for conversion of Se6+ to Se4+. The Se
level was estimated following AOAC (1990) using an atomic absorption spectrometer
(Varian AA280 FS and Varian VGA 77, Mulgrave, VIC, Australia).
3.1.5 Histological examination
For histological examination, the liver samples were subsequently dehydrated in ethanol.
After equilibration in xylene, samples were embedded in paraffin. Five sections from
each specimen of the liver with approximately 5 µm were sliced before staining in the
solution of haematoxylin and eosin (H&E). The sections of the samples were observed
43
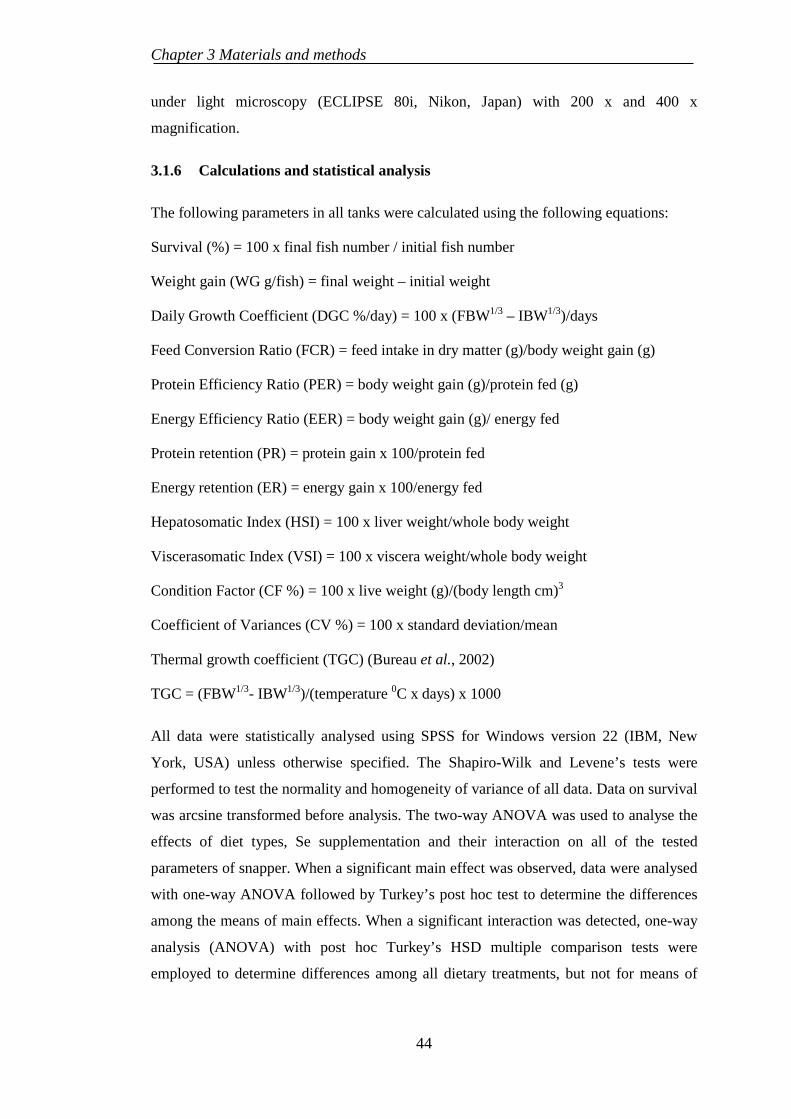
Chapter 3 Materials and methods
under light microscopy (ECLIPSE 80i, Nikon, Japan) with 200 x and 400 x
magnification.
3.1.6 Calculations and statistical analysis
The following parameters in all tanks were calculated using the following equations:
Survival (%) = 100 x final fish number / initial fish number
Weight gain (WG g/fish) = final weight – initial weight
Daily Growth Coefficient (DGC %/day) = 100 x (FBW1/3 – IBW1/3)/days
Feed Conversion Ratio (FCR) = feed intake in dry matter (g)/body weight gain (g)
Protein Efficiency Ratio (PER) = body weight gain (g)/protein fed (g)
Energy Efficiency Ratio (EER) = body weight gain (g)/ energy fed
Protein retention (PR) = protein gain x 100/protein fed
Energy retention (ER) = energy gain x 100/energy fed
Hepatosomatic Index (HSI) = 100 x liver weight/whole body weight
Viscerasomatic Index (VSI) = 100 x viscera weight/whole body weight
Condition Factor (CF %) = 100 x live weight (g)/(body length cm)3
Coefficient of Variances (CV %) = 100 x standard deviation/mean
Thermal growth coefficient (TGC) (Bureau et al., 2002)
TGC = (FBW1/3- IBW1/3)/(temperature 0C x days) x 1000
All data were statistically analysed using SPSS for Windows version 22 (IBM, New
York, USA) unless otherwise specified. The Shapiro-Wilk and Levene’s tests were
performed to test the normality and homogeneity of variance of all data. Data on survival
was arcsine transformed before analysis. The two-way ANOVA was used to analyse the
effects of diet types, Se supplementation and their interaction on all of the tested
parameters of snapper. When a significant main effect was observed, data were analysed
with one-way ANOVA followed by Turkey’s post hoc test to determine the differences
among the means of main effects. When a significant interaction was detected, one-way
analysis (ANOVA) with post hoc Turkey’s HSD multiple comparison tests were
employed to determine differences among all dietary treatments, but not for means of
44
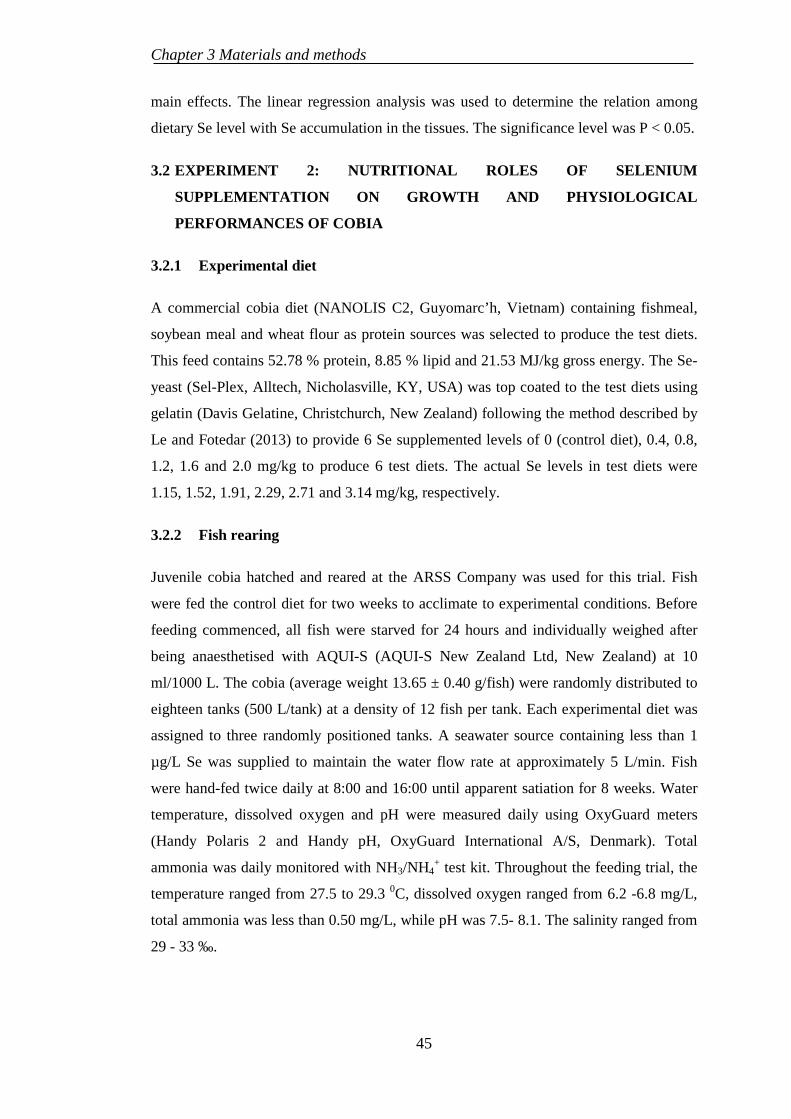
Chapter 3 Materials and methods
main effects. The linear regression analysis was used to determine the relation among
dietary Se level with Se accumulation in the tissues. The significance level was P < 0.05.
EXPERIMENT 2: NUTRITIONAL ROLES OF SELENIUM 3.2
SUPPLEMENTATION ON GROWTH AND PHYSIOLOGICAL
PERFORMANCES OF COBIA
3.2.1 Experimental diet
A commercial cobia diet (NANOLIS C2, Guyomarc’h, Vietnam) containing fishmeal,
soybean meal and wheat flour as protein sources was selected to produce the test diets.
This feed contains 52.78 % protein, 8.85 % lipid and 21.53 MJ/kg gross energy. The Se-
yeast (Sel-Plex, Alltech, Nicholasville, KY, USA) was top coated to the test diets using
gelatin (Davis Gelatine, Christchurch, New Zealand) following the method described by
Le and Fotedar (2013) to provide 6 Se supplemented levels of 0 (control diet), 0.4, 0.8,
1.2, 1.6 and 2.0 mg/kg to produce 6 test diets. The actual Se levels in test diets were
1.15, 1.52, 1.91, 2.29, 2.71 and 3.14 mg/kg, respectively.
3.2.2 Fish rearing
Juvenile cobia hatched and reared at the ARSS Company was used for this trial. Fish
were fed the control diet for two weeks to acclimate to experimental conditions. Before
feeding commenced, all fish were starved for 24 hours and individually weighed after
being anaesthetised with AQUI-S (AQUI-S New Zealand Ltd, New Zealand) at 10
ml/1000 L. The cobia (average weight 13.65 ± 0.40 g/fish) were randomly distributed to
eighteen tanks (500 L/tank) at a density of 12 fish per tank. Each experimental diet was
assigned to three randomly positioned tanks. A seawater source containing less than 1
µg/L Se was supplied to maintain the water flow rate at approximately 5 L/min. Fish
were hand-fed twice daily at 8:00 and 16:00 until apparent satiation for 8 weeks. Water
temperature, dissolved oxygen and pH were measured daily using OxyGuard meters
(Handy Polaris 2 and Handy pH, OxyGuard International A/S, Denmark). Total
ammonia was daily monitored with NH3/NH4+ test kit. Throughout the feeding trial, the
temperature ranged from 27.5 to 29.3 0C, dissolved oxygen ranged from 6.2 -6.8 mg/L,
total ammonia was less than 0.50 mg/L, while pH was 7.5- 8.1. The salinity ranged from
29 - 33 ‰.
45

Chapter 3 Materials and methods
3.2.3 Sample collection
Fifteen juveniles were randomly collected for initial whole-body composition analysis at
the beginning of the feeding trial. At the end of the feeding trial, all fish were
individually weighed after 24 hours of starvation. Blood samples from three fish per tank
were collected by puncturing their caudal vein using a syringe and transferred to BD
Vacutainer (with K2E 5.4 mg, United Kingdom) for haematological analysis. The
remaining blood was transferred into Eppendorf tubes and allowed to clot in a fridge at 4 0 C for 2 hours before collecting red blood cells by centrifuging whole blood at 5000 rpm
in 10 mins. The pellets of red blood cell (RBCs) were stored in a freezer for glutathione
peroxidase (GPx) analysis. Three fish in each tank were collected to analyse body
composition. Liver and flesh tissues from six fish were dissected for proximate
composition and selenium analysis. The distal intestine and livers from three fish in each
tank were dissected out before fixing in 10% buffered formalin for histopathological
evaluation.
3.2.4 Chemical, haematological and enzymatic analysis
The proximate composition and selenium concentrations were analysed according to the
methods mentioned in section 3.1.4. Blood constituents of cobia were automatically
determined using automated hematology analyser (Sysmex XT-162 1800i, Kobe, Japan).
GPx in RBCs was analysed by the Ransel reagent (Randox, Antrim, United Kingdom).
The selenium concentration in the rearing water, cobia muscles and the test diets samples
were analysed following the method described in section 3.1.4.
3.2.5 Histological evaluation
The histopathological performance was analysed following the method described in
section 3.1.5. The sections of the samples were examined by light microscopy (Olympus
BX51, Tokyo, Japan) with 400 x magnification.
3.2.6 Statistical analysis
The variables in all tanks were calculated using equations described in section 3.1.6.
Specific Growth Rate (SGR %/day) = 100 x [(Ln FBW – Ln IBW)/feeding period
(days)]
Mean corpuscular volume (MCV) = Haematocrit/Red blood cell
46
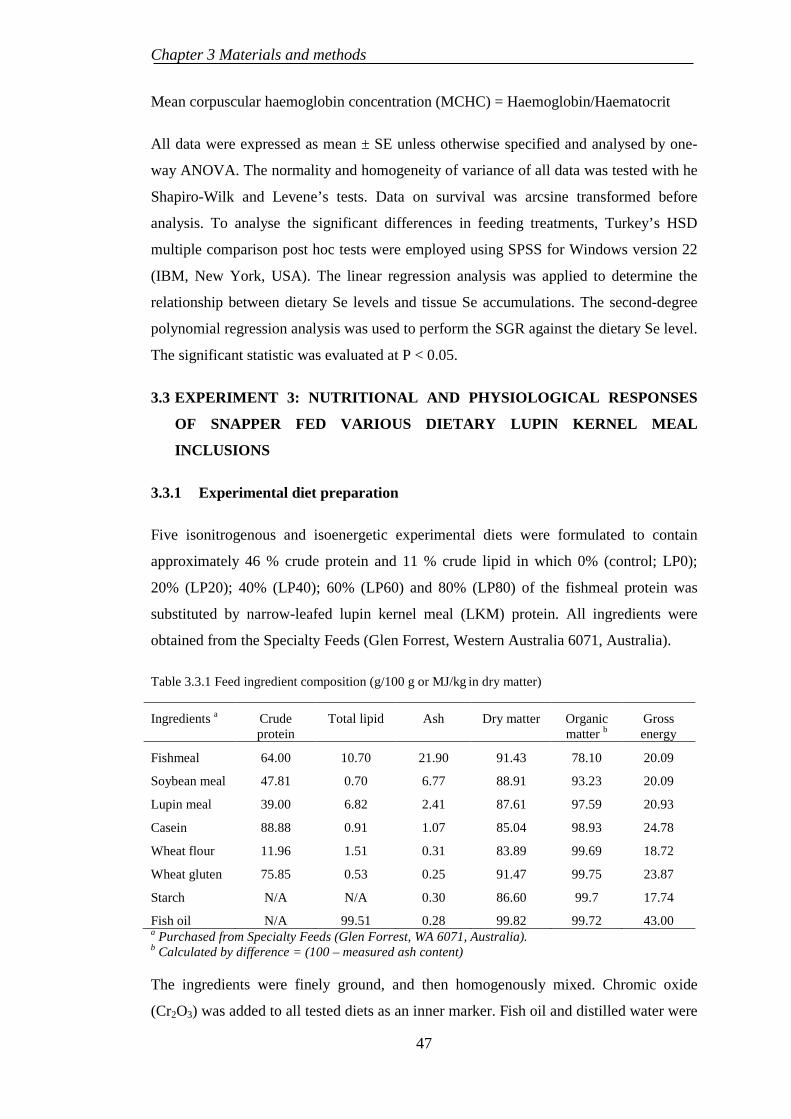
Chapter 3 Materials and methods
Mean corpuscular haemoglobin concentration (MCHC) = Haemoglobin/Haematocrit
All data were expressed as mean ± SE unless otherwise specified and analysed by one-
way ANOVA. The normality and homogeneity of variance of all data was tested with he
Shapiro-Wilk and Levene’s tests. Data on survival was arcsine transformed before
analysis. To analyse the significant differences in feeding treatments, Turkey’s HSD
multiple comparison post hoc tests were employed using SPSS for Windows version 22
(IBM, New York, USA). The linear regression analysis was applied to determine the
relationship between dietary Se levels and tissue Se accumulations. The second-degree
polynomial regression analysis was used to perform the SGR against the dietary Se level.
The significant statistic was evaluated at P < 0.05.
EXPERIMENT 3: NUTRITIONAL AND PHYSIOLOGICAL RESPONSES 3.3
OF SNAPPER FED VARIOUS DIETARY LUPIN KERNEL MEAL
INCLUSIONS
3.3.1 Experimental diet preparation
Five isonitrogenous and isoenergetic experimental diets were formulated to contain
approximately 46 % crude protein and 11 % crude lipid in which 0% (control; LP0);
20% (LP20); 40% (LP40); 60% (LP60) and 80% (LP80) of the fishmeal protein was
substituted by narrow-leafed lupin kernel meal (LKM) protein. All ingredients were
obtained from the Specialty Feeds (Glen Forrest, Western Australia 6071, Australia).
Table 3.3.1 Feed ingredient composition (g/100 g or MJ/kg in dry matter)
Ingredients a Crude protein
Total lipid Ash Dry matter Organic matter b
Gross energy
Fishmeal 64.00 10.70 21.90 91.43 78.10 20.09
Soybean meal 47.81 0.70 6.77 88.91 93.23 20.09
Lupin meal 39.00 6.82 2.41 87.61 97.59 20.93
Casein 88.88 0.91 1.07 85.04 98.93 24.78
Wheat flour 11.96 1.51 0.31 83.89 99.69 18.72
Wheat gluten 75.85 0.53 0.25 91.47 99.75 23.87
Starch N/A N/A 0.30 86.60 99.7 17.74
Fish oil N/A 99.51 0.28 99.82 99.72 43.00 a Purchased from Specialty Feeds (Glen Forrest, WA 6071, Australia). b Calculated by difference = (100 – measured ash content)
The ingredients were finely ground, and then homogenously mixed. Chromic oxide
(Cr2O3) was added to all tested diets as an inner marker. Fish oil and distilled water were
47
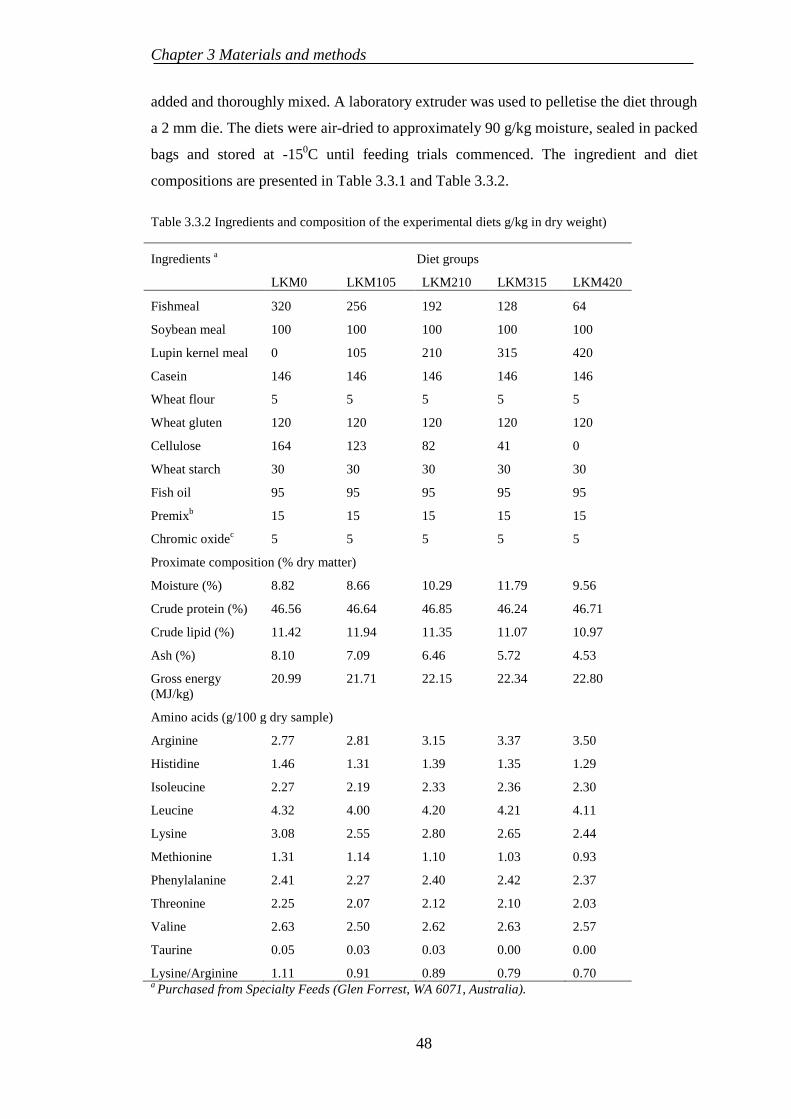
Chapter 3 Materials and methods
added and thoroughly mixed. A laboratory extruder was used to pelletise the diet through
a 2 mm die. The diets were air-dried to approximately 90 g/kg moisture, sealed in packed
bags and stored at -150C until feeding trials commenced. The ingredient and diet
compositions are presented in Table 3.3.1 and Table 3.3.2.
Table 3.3.2 Ingredients and composition of the experimental diets g/kg in dry weight)
Ingredients a Diet groups
LKM0 LKM105 LKM210 LKM315 LKM420
Fishmeal 320 256 192 128 64
Soybean meal 100 100 100 100 100
Lupin kernel meal 0 105 210 315 420
Casein 146 146 146 146 146
Wheat flour 5 5 5 5 5
Wheat gluten 120 120 120 120 120
Cellulose 164 123 82 41 0
Wheat starch 30 30 30 30 30
Fish oil 95 95 95 95 95
Premixb 15 15 15 15 15
Chromic oxidec 5 5 5 5 5
Proximate composition (% dry matter)
Moisture (%) 8.82 8.66 10.29 11.79 9.56
Crude protein (%) 46.56 46.64 46.85 46.24 46.71
Crude lipid (%) 11.42 11.94 11.35 11.07 10.97
Ash (%) 8.10 7.09 6.46 5.72 4.53
Gross energy (MJ/kg)
20.99 21.71 22.15 22.34 22.80
Amino acids (g/100 g dry sample)
Arginine 2.77 2.81 3.15 3.37 3.50
Histidine 1.46 1.31 1.39 1.35 1.29
Isoleucine 2.27 2.19 2.33 2.36 2.30
Leucine 4.32 4.00 4.20 4.21 4.11
Lysine 3.08 2.55 2.80 2.65 2.44
Methionine 1.31 1.14 1.10 1.03 0.93
Phenylalanine 2.41 2.27 2.40 2.42 2.37
Threonine 2.25 2.07 2.12 2.10 2.03
Valine 2.63 2.50 2.62 2.63 2.57
Taurine 0.05 0.03 0.03 0.00 0.00
Lysine/Arginine 1.11 0.91 0.89 0.79 0.70 a Purchased from Specialty Feeds (Glen Forrest, WA 6071, Australia).
48
Chapter 3 Materials and methods
b Contains the following (as g/kg of premix): iron, 10; copper, 1.5; iodine, 0.15; manganese, 9.5; zinc, 25; vitamin A retinol, 100 IU; vitamin D3, 100 IU; vitamin E, 6.25; vitamin K, 1.6; vitamin B1, 1; vitamin B2, 2.5; niacin, 20; vitamin B6, 1.5; calcium, 5.5; biotin, 0.1; folic acid, 0.4; inositol, 60; vitamin B12, 0.002; choline, 150; and ethoxyquin, 0.125. c Purchased from Thermo Fisher Scientific, Scoresby, Victoria, Australia.
3.3.2 Fish rearing
Juvenile snapper hatched and reared at the Batavia Coast Maritime Institute was used in
this study. Before the beginning of the feeding trial, snapper was acclimated to the
experimental conditions for 2 weeks. During this period, snapper were fed a commercial
barramundi diet (NOVA ME, Skretting, Tasmania, Australia) containing 50 % protein,
17 % lipid and 21.1 MJ/kg gross energy. Before commencing feed trial, all fish were
anaesthetised by AQUI-S (AQUI-S New Zealand Ltd, New Zealand) at 10 ml/1000L
and individually weighed. The snapper (initial mean weight of 21.64 g) were randomly
distributed to fifteen 150L-fiberglass tanks with stocking density of 12 fish per tank.
Each experimental diet was assigned to three randomly positioned tanks. All
experimental tanks were connected to a continuously flow-through seawater supply to
maintain the water flow rate at approximately 5 L/min. The fish were hand-fed twice
daily at 8:00 and 16:00 until apparent satiation. The feeding experiment was conducted
for 70 days. After 10 minutes of feeding, uneaten feed was siphoned through a 150 µm
net and rinsed with fresh water, and then stored in freezers until analysis. The
temperature, salinity and dissolved oxygen were monitored daily, whereas pH and total
ammonia were monitored once per week. The temperature in the rearing water ranged
from 19.2 to 22.5 0C, total ammonia was less than 0.25 mg/L, and pH was 7.5- 8.0. The
salinity in rearing systems ranged from 28 - 33 ppt.
3.3.3 Sample collection
Fifteen fish were randomly sampled for an analysis of their initial whole body
composition. At the end of feeding trial, fish were anaesthetised by AQUI-S at 15 mg/L
and individually weighed after starving for 24 hours. Three fish per tank were sampled
to analyse body composition. Another three fish were used to collect blood samples by
puncturing their caudal vein with a syringe and transferred to BD Vacutainer (with K2E
5.4 mg, UK) for haematological analysis. The liver and muscle tissues from six fish per
tank were collected for proximate composition analysis. The distal intestines and livers
of snapper were cut and fixed in Bouin solution for histopathological evaluation. Faeces
were collected from week 6 of the feeding period according to procedures of Kim et al.
49
Chapter 3 Materials and methods
(2007) until an adequate amount for faeces was available for the digestibility analysis.
One hour after the last feeding, the air diffusers, and the bottom and walls of the tanks
were carefully cleaned to remove any residual feed and waste from the rearing system.
Faeces were allowed to settle overnight. The faeces were gently collected into a 200 mL
polyethylene bottle in the following morning and then were centrifuged for 20 min at
10000 rpm before the supernatant was discarded; the faecal material was stored at -20 0C
until analysis.
3.3.4 Chemical analysis
Proximate compositions in the samples were analysed following the protocols mentioned
in section 3.1.4. Amino acid compositions in the muscle and test diets were analysed
using high performance liquid chromatography after acid hydrolysis. Cr2O3 was
determined by the method from Bolin et al. (1952).
3.3.5 Haematological examination
Blood parameters in snapper were analysed following protocols:
The Ht was determined following method described by Rey Vázquez and Guerrero
(2007). Blood was collected into heparin-coated microhaematocrit tubes (Livingstone,
Rosebery, NSW, Australia) before centrifuging at 13000×g for 5 min. Ht level was
measured as the percentage of packed cell volume.
The RBC was determined following method described by Le et al. (2014a). Microscope
slides were used to make blood smear. After staining with May-Grünwald and Giemsa
solutions, the total RBC was calculated using a light microscope (ECLIPSE 80i, Nikon,
Japan) and the relative percentage was calculated. A haemocytometer was used to count
total number of blood cells. The RBC value was calculated by multiplying relative
percentage with total blood cells.
The Hb was measured using the Hb HG-1539 kit (Randox, Crumlin, County Antrim,
UK) and a chemistry immune analyser (Olympus AU400, Tokyo, Japan).
3.3.6 Histological evaluation
The histopathological performance was analysed following the method described in
section 3.1.5. The sections of the samples were examined by light microscopy (Olympus
BX51, Tokyo, Japan) with 400 x magnification.
50
Chapter 3 Materials and methods
3.3.7 Statistical analysis
The variables in all tanks were calculated using the equations described in section 3.1.6
and following formula:
Apparent digestibility coefficients (ADCs) of tested diets and the basal diet were
calculated using the formula described by Cho et al. (1982):
ADCdiet = 100 x [1-(Fnut/Dnut x DCr/FCr)]
where Fnut is the % of nutrient or gross energy in faeces, Dnut represents % of nutrient or
gross energy in the diet, and DCr and FCr are % of the chromic oxide in diet and faeces,
respectively.
The ADC of ingredients in each diet were calculated following the equation from
Sugiura et al. (1998):
ADCingredient = [(NutTD x ADCTD) – (NutBS x ADCBS x PBS)]/(PIngredient x NutIngredient)
where NutTD, NutBS and Nutingredient represent for % of the nutrient or gross energy in the
tested diet, basal diet and ingredient, respectively. ADCTD and ADCBS are % of the
apparent digestibility coefficient of nutrient or gross energy in the tested and basal diet,
respectively. PBS is the proportion of the basal diet, and PIngredient is the proportional
amount of ingredient in tested diet.
All data were expressed as mean ± SE unless otherwise specified and analysed by one-
way analysis of variance (ANOVA). The Shapiro-Wilk and Levene’s tests were used
examine the normality and homogeneity of variance. Data on survival was arcsine
transformed before analysis. To analyse the significant differences in feeding treatments,
Turkey’s HSD multiple comparison post hoc tests were employed using SPSS for
Windows version 22 (IBM, New York, USA). The linear regression model was applied
to evaluate the relationship between dietary lupin kernel meal inclusions and the SGR,
FCR and PER of snapper.
51
Chapter 3 Materials and methods
EXPERIMENT 4: NUTRITIONAL AND PHYSIOLOGICAL RESPONSES 3.4
OF COBIA FED DIETARY LUPIN KERNEL MEAL LEVELS
3.4.1 Experimental diet preparation
The experimental diets used in this feeding trial were similar to test diets previously
described in section 3.3.1.
3.4.2 Fish rearing
Juvenile cobia hatched and reared at the ARSS Company (Khanh Hoa Province,
Vietnam) was used in this experiment. Before the commencement of feeding trial, cobia
were acclimated to the experimental conditions for 2 weeks using a commercial cobia
diet (NRD P16, INVE Ltd, Thailand) containing 53 % protein, 12 % lipid and 21.0
MJ/kg gross energy. Prior to the test feeding, all fish were starved for 24 hours and
anaesthetised by AQUI-S (AQUI-S New Zealand Ltd, New Zealand) at 10 mg/L and
individually weighed. The cobia (initial mean weight of 18.05 g) were randomly
distributed to fifteen tanks (500 L) at a density of 12 fish per tank. Each experimental
diet was assigned to three randomly positioned tanks. All experimental tanks were
connected to a continuously flow-through seawater supply to maintain the water flow
rate at approximately 5 L/min. The fish were hand-fed twice daily at 8:00 and 16:00 until
apparent satiation. The feeding trial lasted for 56 days. After 10 minutes of feeding,
uneaten feed was siphoned through a 150 µm net and rinsed with fresh water, and then
stored in freezers until analysis. The water parameters were measured following methods
in section 3.2.2. During the feeding trial, the water temperature ranged from 28 - 30 0C,
total ammonia was less than 0.25 mg/L, and pH was 7.8- 8.2. The salinity in rearing
systems ranged from 28 - 33 ppt.
3.4.3 Sample collection
Sample collection was similar to those described in section 3.3.3.
3.4.4 Chemical analysis
Proximate compositions in the samples were analysed following the protocols mentioned
in section 3.1.4. Blood constituents of cobia were automatically determined using
automated hematology analyser (Sysmex XT-162 1800i, Kobe, Japan). Amino acid
compositions in the muscle and test diets were analysed using high performance liquid
52
Chapter 3 Materials and methods
chromatography after acid hydrolysis. Chromic oxide was determined by the method
from Bolin et al. (1952).
3.4.5 Histological evaluation
The histopathological performance was analysed following the method described in
section 3.3.6.
3.4.6 Calculations and statistical analysis
The variables in all tanks and the digestibility were calculated using the equations in
section 3.1.6 and 3.3.7.
All data were expressed as mean ± SE unless otherwise specified and analysed by one-
way analysis of variance (ANOVA). The Shapiro-Wilk and Levene’s tests were
performed to test the normality and homogeneity of variance of all data. Data on survival
was arcsine transformed before analysis. To analyse the significant differences in
feeding treatments, Turkey’s HSD multiple comparison post hoc tests were employed
using SPSS for Windows version 22 (IBM, New York, USA). The linear regression
model was applied to evaluate the relationship between dietary lupin kernel meal
inclusions and the SGR, FCR and PER of cobia. The differences between snapper in the
section 3.3 and cobia in section 3.4 in all of the tested parameters at each inclusion level
of lupin kernel meal in the third and fourth experiments were analysed using T-test: two
samples. The difference between the correlation coefficients (R-squared values) of the
SGR, FCR and PER of snapper and cobia also were identified. The statistical
significance was evaluated at P < 0.05.
EXPERIMENT 5: BENEFICIAL EFFECTS OF SELENIUM 3.5
SUPPLEMENTATION ON COBIA FED LUPIN-BASED DIETS
3.5.1 Experimental diet preparation
The fishmeal protein in the control diet (LP0) was replaced with 40% and 60% of
narrow-leafed lupin kernel meal (LKM) protein with and without 0.8 mg/kg Se extracted
from Se-yeast (Sel-Plex, Alltech, Nicholasville, KY, USA) supplementation to formulate
six isonitroenous and isoenergetic test diets, labelled as LP0, LP0Se, LP40, LP40Se,
LP60 and LP60Se, respectively. The ingredients were finely ground, and then
homogenously mixed. Chromic oxide (Cr2O3) was added to all tested diets as inner
53
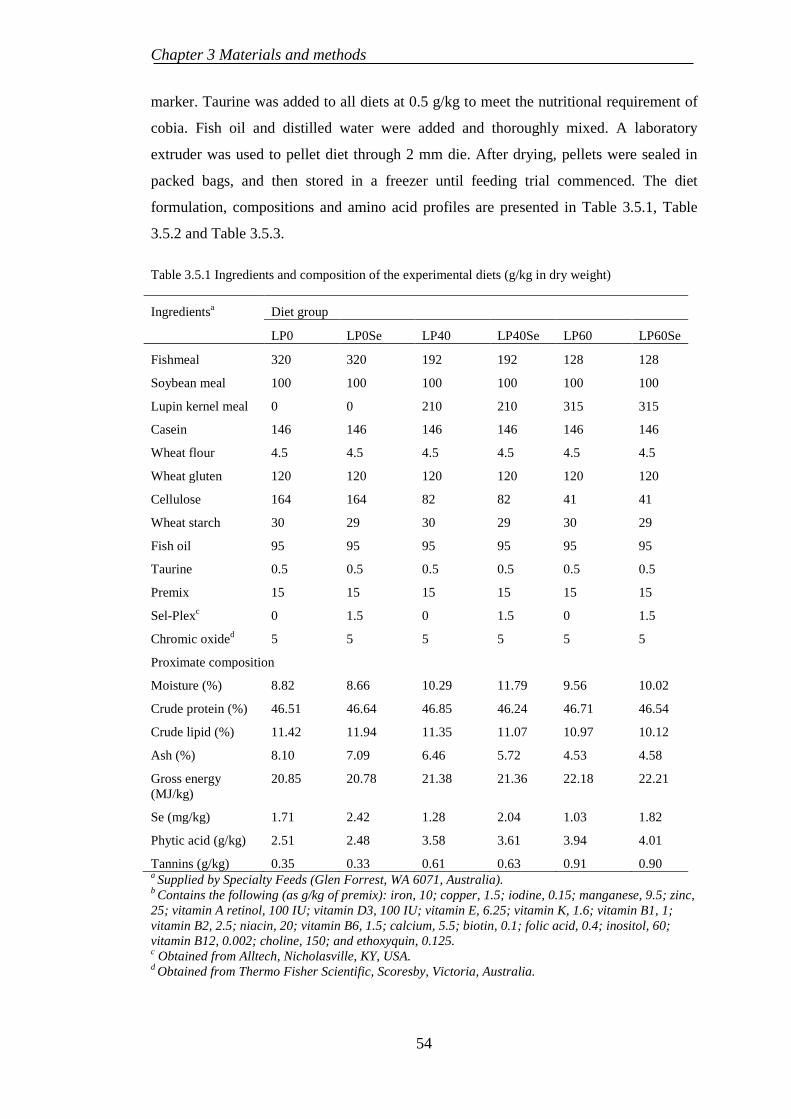
Chapter 3 Materials and methods
marker. Taurine was added to all diets at 0.5 g/kg to meet the nutritional requirement of
cobia. Fish oil and distilled water were added and thoroughly mixed. A laboratory
extruder was used to pellet diet through 2 mm die. After drying, pellets were sealed in
packed bags, and then stored in a freezer until feeding trial commenced. The diet
formulation, compositions and amino acid profiles are presented in Table 3.5.1, Table
3.5.2 and Table 3.5.3.
Table 3.5.1 Ingredients and composition of the experimental diets (g/kg in dry weight)
Ingredientsa Diet group
LP0 LP0Se LP40 LP40Se LP60 LP60Se
Fishmeal 320 320 192 192 128 128
Soybean meal 100 100 100 100 100 100
Lupin kernel meal 0 0 210 210 315 315
Casein 146 146 146 146 146 146
Wheat flour 4.5 4.5 4.5 4.5 4.5 4.5
Wheat gluten 120 120 120 120 120 120
Cellulose 164 164 82 82 41 41
Wheat starch 30 29 30 29 30 29
Fish oil 95 95 95 95 95 95
Taurine 0.5 0.5 0.5 0.5 0.5 0.5
Premix 15 15 15 15 15 15
Sel-Plexc 0 1.5 0 1.5 0 1.5
Chromic oxided 5 5 5 5 5 5
Proximate composition
Moisture (%) 8.82 8.66 10.29 11.79 9.56 10.02
Crude protein (%) 46.51 46.64 46.85 46.24 46.71 46.54
Crude lipid (%) 11.42 11.94 11.35 11.07 10.97 10.12
Ash (%) 8.10 7.09 6.46 5.72 4.53 4.58
Gross energy (MJ/kg)
20.85 20.78 21.38 21.36 22.18 22.21
Se (mg/kg) 1.71 2.42 1.28 2.04 1.03 1.82
Phytic acid (g/kg) 2.51 2.48 3.58 3.61 3.94 4.01
Tannins (g/kg) 0.35 0.33 0.61 0.63 0.91 0.90 a Supplied by Specialty Feeds (Glen Forrest, WA 6071, Australia). b Contains the following (as g/kg of premix): iron, 10; copper, 1.5; iodine, 0.15; manganese, 9.5; zinc, 25; vitamin A retinol, 100 IU; vitamin D3, 100 IU; vitamin E, 6.25; vitamin K, 1.6; vitamin B1, 1; vitamin B2, 2.5; niacin, 20; vitamin B6, 1.5; calcium, 5.5; biotin, 0.1; folic acid, 0.4; inositol, 60; vitamin B12, 0.002; choline, 150; and ethoxyquin, 0.125. c Obtained from Alltech, Nicholasville, KY, USA. d Obtained from Thermo Fisher Scientific, Scoresby, Victoria, Australia.
54
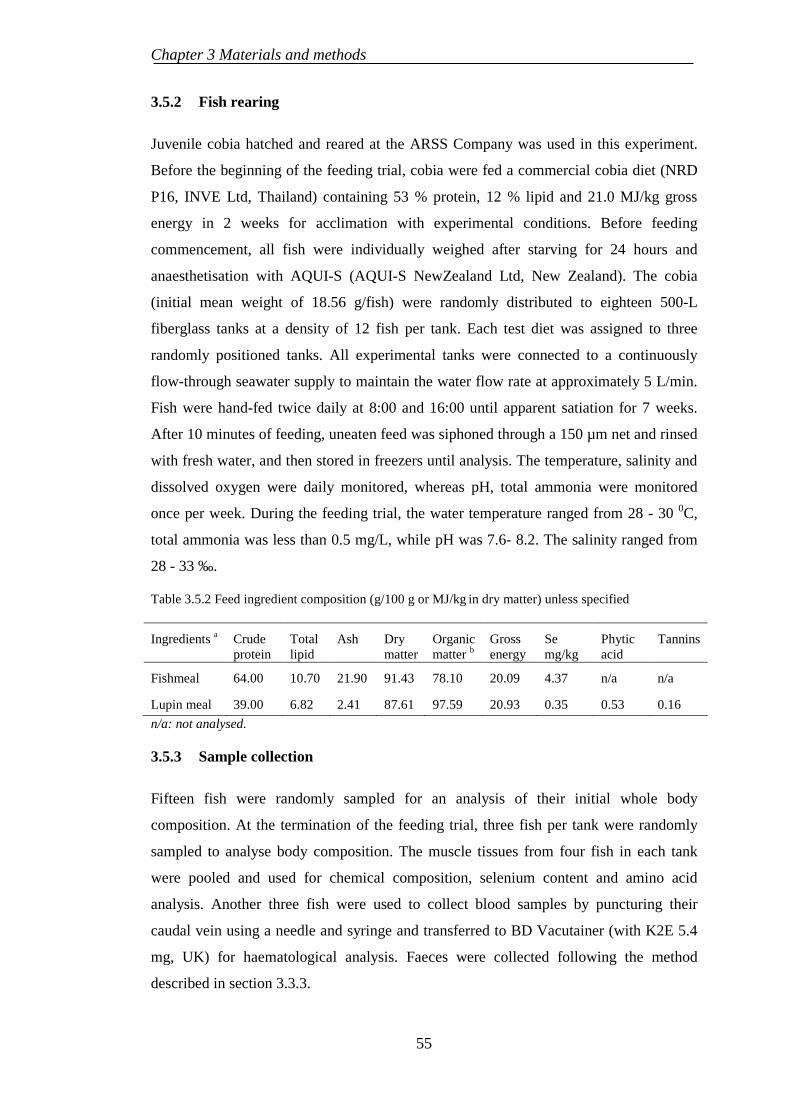
Chapter 3 Materials and methods
3.5.2 Fish rearing
Juvenile cobia hatched and reared at the ARSS Company was used in this experiment.
Before the beginning of the feeding trial, cobia were fed a commercial cobia diet (NRD
P16, INVE Ltd, Thailand) containing 53 % protein, 12 % lipid and 21.0 MJ/kg gross
energy in 2 weeks for acclimation with experimental conditions. Before feeding
commencement, all fish were individually weighed after starving for 24 hours and
anaesthetisation with AQUI-S (AQUI-S NewZealand Ltd, New Zealand). The cobia
(initial mean weight of 18.56 g/fish) were randomly distributed to eighteen 500-L
fiberglass tanks at a density of 12 fish per tank. Each test diet was assigned to three
randomly positioned tanks. All experimental tanks were connected to a continuously
flow-through seawater supply to maintain the water flow rate at approximately 5 L/min.
Fish were hand-fed twice daily at 8:00 and 16:00 until apparent satiation for 7 weeks.
After 10 minutes of feeding, uneaten feed was siphoned through a 150 µm net and rinsed
with fresh water, and then stored in freezers until analysis. The temperature, salinity and
dissolved oxygen were daily monitored, whereas pH, total ammonia were monitored
once per week. During the feeding trial, the water temperature ranged from 28 - 30 0C,
total ammonia was less than 0.5 mg/L, while pH was 7.6- 8.2. The salinity ranged from
28 - 33 ‰.
Table 3.5.2 Feed ingredient composition (g/100 g or MJ/kg in dry matter) unless specified
Ingredients a Crude protein
Total lipid
Ash Dry matter
Organic matter b
Gross energy
Se mg/kg
Phytic acid
Tannins
Fishmeal 64.00 10.70 21.90 91.43 78.10 20.09 4.37 n/a n/a
Lupin meal 39.00 6.82 2.41 87.61 97.59 20.93 0.35 0.53 0.16
n/a: not analysed.
3.5.3 Sample collection
Fifteen fish were randomly sampled for an analysis of their initial whole body
composition. At the termination of the feeding trial, three fish per tank were randomly
sampled to analyse body composition. The muscle tissues from four fish in each tank
were pooled and used for chemical composition, selenium content and amino acid
analysis. Another three fish were used to collect blood samples by puncturing their
caudal vein using a needle and syringe and transferred to BD Vacutainer (with K2E 5.4
mg, UK) for haematological analysis. Faeces were collected following the method
described in section 3.3.3.
55
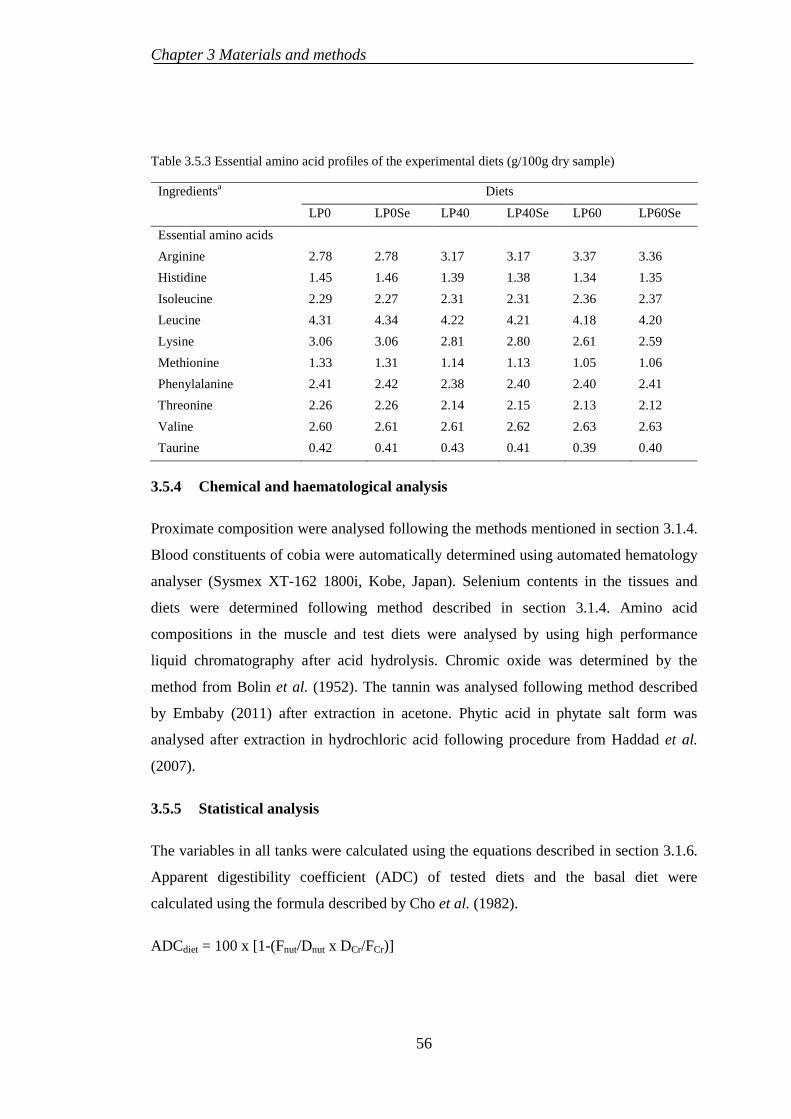
Chapter 3 Materials and methods
Table 3.5.3 Essential amino acid profiles of the experimental diets (g/100g dry sample)
Ingredientsa Diets
LP0 LP0Se LP40 LP40Se LP60 LP60Se
Essential amino acids Arginine 2.78 2.78 3.17 3.17 3.37 3.36 Histidine 1.45 1.46 1.39 1.38 1.34 1.35 Isoleucine 2.29 2.27 2.31 2.31 2.36 2.37 Leucine 4.31 4.34 4.22 4.21 4.18 4.20 Lysine 3.06 3.06 2.81 2.80 2.61 2.59 Methionine 1.33 1.31 1.14 1.13 1.05 1.06 Phenylalanine 2.41 2.42 2.38 2.40 2.40 2.41 Threonine 2.26 2.26 2.14 2.15 2.13 2.12 Valine 2.60 2.61 2.61 2.62 2.63 2.63 Taurine 0.42 0.41 0.43 0.41 0.39 0.40
3.5.4 Chemical and haematological analysis
Proximate composition were analysed following the methods mentioned in section 3.1.4.
Blood constituents of cobia were automatically determined using automated hematology
analyser (Sysmex XT-162 1800i, Kobe, Japan). Selenium contents in the tissues and
diets were determined following method described in section 3.1.4. Amino acid
compositions in the muscle and test diets were analysed by using high performance
liquid chromatography after acid hydrolysis. Chromic oxide was determined by the
method from Bolin et al. (1952). The tannin was analysed following method described
by Embaby (2011) after extraction in acetone. Phytic acid in phytate salt form was
analysed after extraction in hydrochloric acid following procedure from Haddad et al.
(2007).
3.5.5 Statistical analysis
The variables in all tanks were calculated using the equations described in section 3.1.6.
Apparent digestibility coefficient (ADC) of tested diets and the basal diet were
calculated using the formula described by Cho et al. (1982).
ADCdiet = 100 x [1-(Fnut/Dnut x DCr/FCr)]
56
Chapter 3 Materials and methods
where Fnut is the % of nutrient or gross energy in faeces, Dnut represents % of nutrient or
gross energy in the diet, and DCr and FCr are % of the chromic oxide in diet and faeces,
respectively.
All data were statistically analysed using SPSS for Windows version 22 (IBM, New
York, USA) unless otherwise specified. Data on survival was arcsine transformed before
analysis. The two-way ANOVA was used to analyse the effects of lupin meal inclusions,
Se supplementation and their interactions on all of the tested parameters of cobia. When
a significant main effect was observed, data were analysed to determine the differences
among the dietary groups with or without Se supplementation. When a significant
interaction was detected, one-way analysis (ANOVA) with post hoc Turkey’s HSD
multiple comparison tests were employed to determine differences among dietary
treatments, but not for means of main effects. The linear regression analysis was used to
determine the relationship between dietary Se level and Se accumulation in the tissues.
The statistical significance was evaluated at P < 0.05.
57
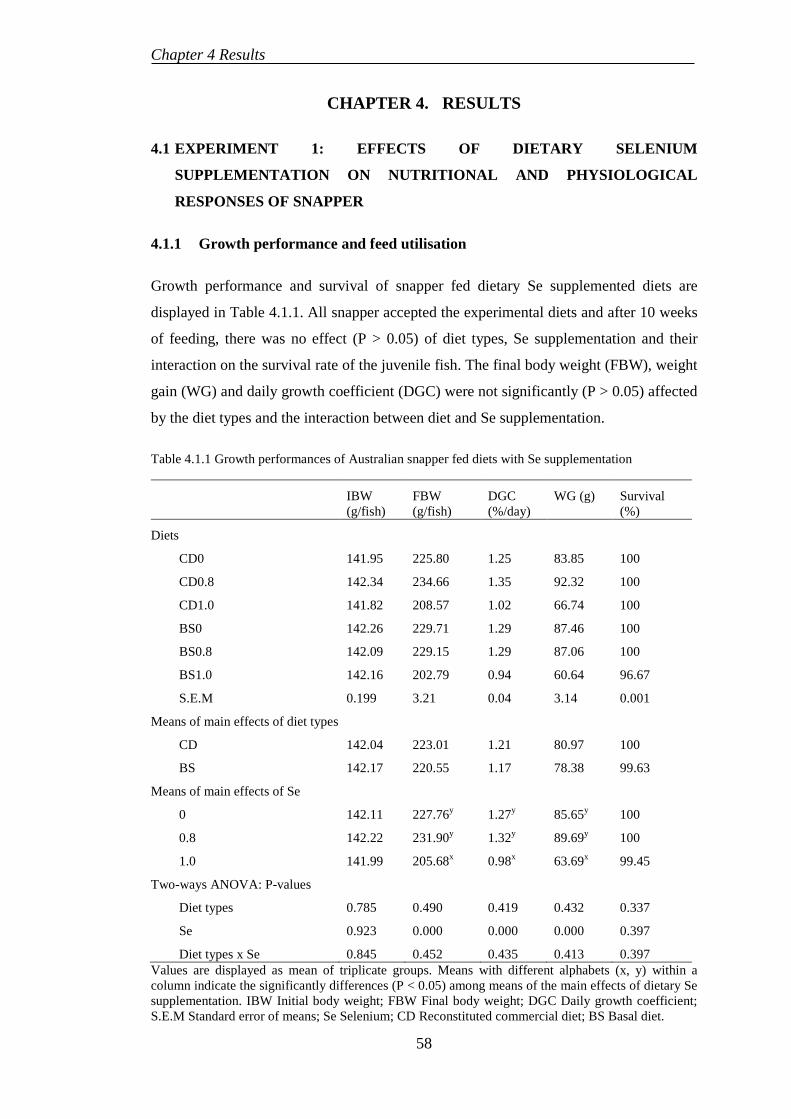
Chapter 4 Results
CHAPTER 4. RESULTS
4.1 EXPERIMENT 1: EFFECTS OF DIETARY SELENIUM
SUPPLEMENTATION ON NUTRITIONAL AND PHYSIOLOGICAL
RESPONSES OF SNAPPER
4.1.1 Growth performance and feed utilisation
Growth performance and survival of snapper fed dietary Se supplemented diets are
displayed in Table 4.1.1. All snapper accepted the experimental diets and after 10 weeks
of feeding, there was no effect (P > 0.05) of diet types, Se supplementation and their
interaction on the survival rate of the juvenile fish. The final body weight (FBW), weight
gain (WG) and daily growth coefficient (DGC) were not significantly (P > 0.05) affected
by the diet types and the interaction between diet and Se supplementation.
Table 4.1.1 Growth performances of Australian snapper fed diets with Se supplementation
IBW (g/fish)
FBW (g/fish)
DGC (%/day)
WG (g) Survival (%)
Diets
CD0 141.95 225.80 1.25 83.85 100
CD0.8 142.34 234.66 1.35 92.32 100
CD1.0 141.82 208.57 1.02 66.74 100
BS0 142.26 229.71 1.29 87.46 100
BS0.8 142.09 229.15 1.29 87.06 100
BS1.0 142.16 202.79 0.94 60.64 96.67
S.E.M 0.199 3.21 0.04 3.14 0.001
Means of main effects of diet types
CD 142.04 223.01 1.21 80.97 100
BS 142.17 220.55 1.17 78.38 99.63
Means of main effects of Se
0 142.11 227.76y 1.27y 85.65y 100
0.8 142.22 231.90y 1.32y 89.69y 100
1.0 141.99 205.68x 0.98x 63.69x 99.45
Two-ways ANOVA: P-values
Diet types 0.785 0.490 0.419 0.432 0.337
Se 0.923 0.000 0.000 0.000 0.397
Diet types x Se 0.845 0.452 0.435 0.413 0.397 Values are displayed as mean of triplicate groups. Means with different alphabets (x, y) within a column indicate the significantly differences (P < 0.05) among means of the main effects of dietary Se supplementation. IBW Initial body weight; FBW Final body weight; DGC Daily growth coefficient; S.E.M Standard error of means; Se Selenium; CD Reconstituted commercial diet; BS Basal diet.
58
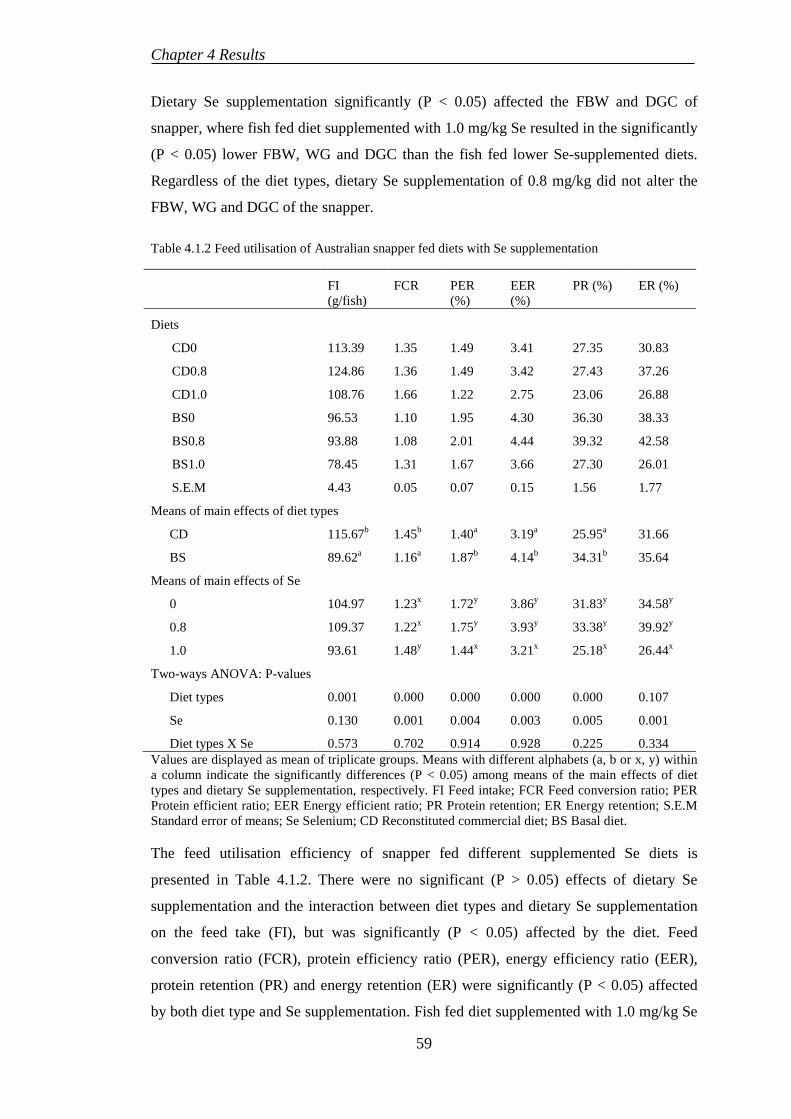
Chapter 4 Results
Dietary Se supplementation significantly (P < 0.05) affected the FBW and DGC of
snapper, where fish fed diet supplemented with 1.0 mg/kg Se resulted in the significantly
(P < 0.05) lower FBW, WG and DGC than the fish fed lower Se-supplemented diets.
Regardless of the diet types, dietary Se supplementation of 0.8 mg/kg did not alter the
FBW, WG and DGC of the snapper.
Table 4.1.2 Feed utilisation of Australian snapper fed diets with Se supplementation
FI (g/fish)
FCR PER (%)
EER (%)
PR (%) ER (%)
Diets
CD0 113.39 1.35 1.49 3.41 27.35 30.83
CD0.8 124.86 1.36 1.49 3.42 27.43 37.26
CD1.0 108.76 1.66 1.22 2.75 23.06 26.88
BS0 96.53 1.10 1.95 4.30 36.30 38.33
BS0.8 93.88 1.08 2.01 4.44 39.32 42.58
BS1.0 78.45 1.31 1.67 3.66 27.30 26.01
S.E.M 4.43 0.05 0.07 0.15 1.56 1.77
Means of main effects of diet types
CD 115.67b 1.45b 1.40a 3.19a 25.95a 31.66
BS 89.62a 1.16a 1.87b 4.14b 34.31b 35.64
Means of main effects of Se
0 104.97 1.23x 1.72y 3.86y 31.83y 34.58y
0.8 109.37 1.22x 1.75y 3.93y 33.38y 39.92y
1.0 93.61 1.48y 1.44x 3.21x 25.18x 26.44x
Two-ways ANOVA: P-values
Diet types 0.001 0.000 0.000 0.000 0.000 0.107
Se 0.130 0.001 0.004 0.003 0.005 0.001
Diet types X Se 0.573 0.702 0.914 0.928 0.225 0.334 Values are displayed as mean of triplicate groups. Means with different alphabets (a, b or x, y) within a column indicate the significantly differences (P < 0.05) among means of the main effects of diet types and dietary Se supplementation, respectively. FI Feed intake; FCR Feed conversion ratio; PER Protein efficient ratio; EER Energy efficient ratio; PR Protein retention; ER Energy retention; S.E.M Standard error of means; Se Selenium; CD Reconstituted commercial diet; BS Basal diet.
The feed utilisation efficiency of snapper fed different supplemented Se diets is
presented in Table 4.1.2. There were no significant (P > 0.05) effects of dietary Se
supplementation and the interaction between diet types and dietary Se supplementation
on the feed take (FI), but was significantly (P < 0.05) affected by the diet. Feed
conversion ratio (FCR), protein efficiency ratio (PER), energy efficiency ratio (EER),
protein retention (PR) and energy retention (ER) were significantly (P < 0.05) affected
by both diet type and Se supplementation. Fish fed diet supplemented with 1.0 mg/kg Se
59

Chapter 4 Results
attained significantly higher FCR than the fish fed lower Se-supplemented diets.
Conversely, snapper fed diets supplemented with 0 and 0.8 mg/kg Se resulted in
significantly (P > 0.05) higher PER, EER, PR and ER than the fish fed diet
supplemented with 1.0 mg/kg Se. Relative to CD diet, snapper fed BS diet had
significantly higher PER, EER, PR and lower FCR. There was no significant (P > 0.05)
interaction between diet types and Se supplementation on FI, FCR, PER, EER, PR and
ER in snapper.
4.1.2 Somatic indices
The somatic indices of snapper fed test diets are presented in Table 4.1.3. There were no
significant (P > 0.05) effects of diet types, Se supplementation and their interaction on
the viscerasomatic index (VSI) and condition factor (CF) of snapper after 10-weeks of
feeding. Snapper fed CD diet had significantly (P < 0.05) lower hepatosomatic index
(HSI) than the fish fed BS diet.
Table 4.1.3 Somatic indices and Se contents of Australian snapper fed diets with Se supplementation
VSI (%) HSI (%) CF (%) CV (%) TGC (day 1-70; 24.70 0C)
Diets
CD0 8.95 1.20 3.76 10.58 0.51
CD0.8 9.00 1.26 3.89 10.84 0.55
CD1.0 8.69 1.17 3.81 13.33 0.41
BS0 8.72 1.36 3.81 9.79 0.52
BS0.8 8.37 1.33 3.86 10.61 0.52
BS1.0 9.14 1.28 3.73 18.65 0.38
S.E.M 0.13 0.02 0.02 0.907 0.018
Means of main effects of diet types
CD 8.88 1.21a 3.82 11.58 0.49
BS 8.74 1.33b 3.80 13.02 0.47
Means of main effects of Se
0 8.34 1.28 3.78 10.19x 0.51y
0.8 8.68 1.30 3.88 10.73x 0.53y
1.0 8.91 1.23 3.77 15.99y 0.40x
Two-ways ANOVA: P-values
Diet types 0.619 0.021 0.661 0.274 0.572
Se 0.780 0.392 0.141 0.005 0.001
Diet types X Se 0.282 0.741 0.497 0.132 0.652
60
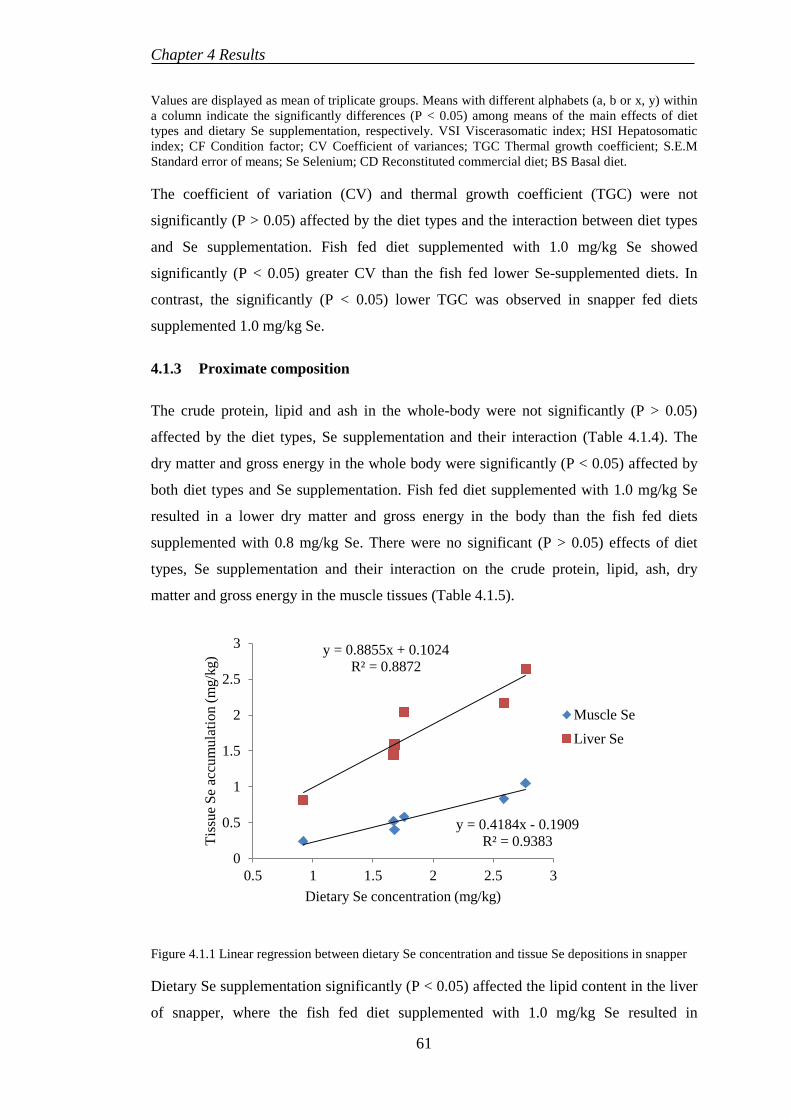
Chapter 4 Results
Values are displayed as mean of triplicate groups. Means with different alphabets (a, b or x, y) within a column indicate the significantly differences (P < 0.05) among means of the main effects of diet types and dietary Se supplementation, respectively. VSI Viscerasomatic index; HSI Hepatosomatic index; CF Condition factor; CV Coefficient of variances; TGC Thermal growth coefficient; S.E.M Standard error of means; Se Selenium; CD Reconstituted commercial diet; BS Basal diet.
The coefficient of variation (CV) and thermal growth coefficient (TGC) were not
significantly (P > 0.05) affected by the diet types and the interaction between diet types
and Se supplementation. Fish fed diet supplemented with 1.0 mg/kg Se showed
significantly (P < 0.05) greater CV than the fish fed lower Se-supplemented diets. In
contrast, the significantly (P < 0.05) lower TGC was observed in snapper fed diets
supplemented 1.0 mg/kg Se.
4.1.3 Proximate composition
The crude protein, lipid and ash in the whole-body were not significantly (P > 0.05)
affected by the diet types, Se supplementation and their interaction (Table 4.1.4). The
dry matter and gross energy in the whole body were significantly (P < 0.05) affected by
both diet types and Se supplementation. Fish fed diet supplemented with 1.0 mg/kg Se
resulted in a lower dry matter and gross energy in the body than the fish fed diets
supplemented with 0.8 mg/kg Se. There were no significant (P > 0.05) effects of diet
types, Se supplementation and their interaction on the crude protein, lipid, ash, dry
matter and gross energy in the muscle tissues (Table 4.1.5).
Figure 4.1.1 Linear regression between dietary Se concentration and tissue Se depositions in snapper
Dietary Se supplementation significantly (P < 0.05) affected the lipid content in the liver
of snapper, where the fish fed diet supplemented with 1.0 mg/kg Se resulted in
y = 0.4184x - 0.1909 R² = 0.9383
y = 0.8855x + 0.1024 R² = 0.8872
0
0.5
1
1.5
2
2.5
3
0.5 1 1.5 2 2.5 3
Tiss
ue S
e ac
cum
ulat
ion
(mg/
kg)
Dietary Se concentration (mg/kg)
Muscle SeLiver Se
61
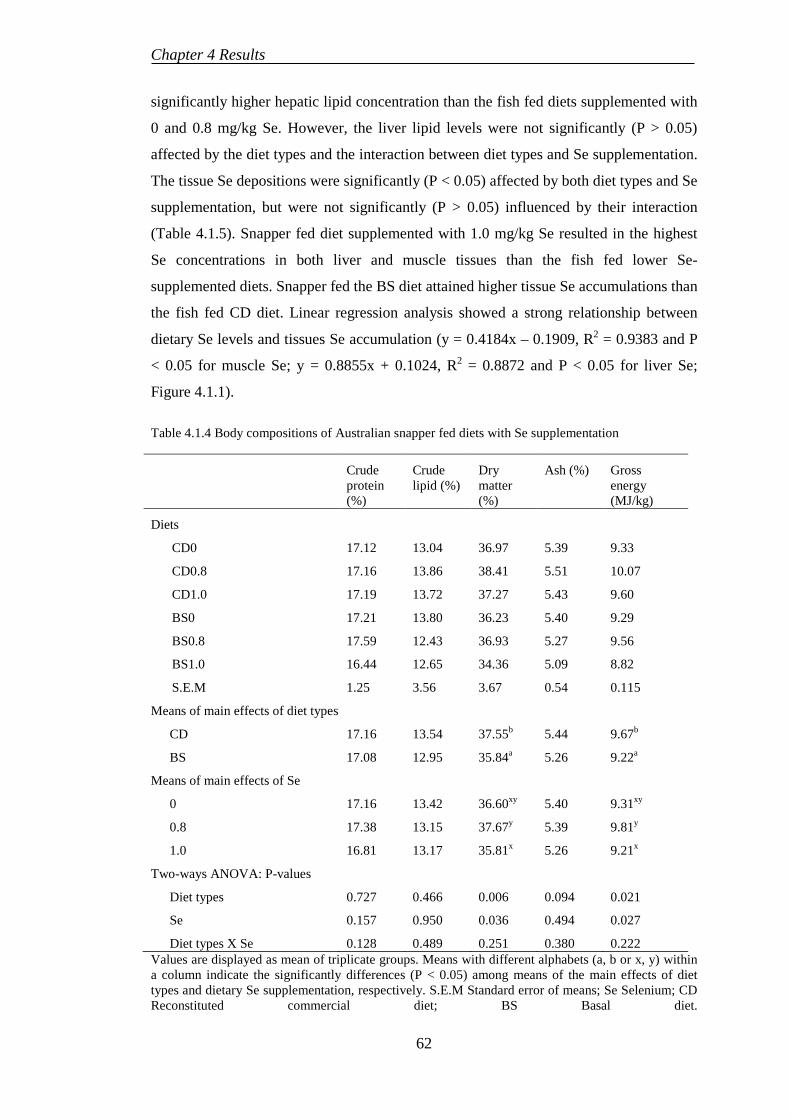
Chapter 4 Results
significantly higher hepatic lipid concentration than the fish fed diets supplemented with
0 and 0.8 mg/kg Se. However, the liver lipid levels were not significantly (P > 0.05)
affected by the diet types and the interaction between diet types and Se supplementation.
The tissue Se depositions were significantly (P < 0.05) affected by both diet types and Se
supplementation, but were not significantly (P > 0.05) influenced by their interaction
(Table 4.1.5). Snapper fed diet supplemented with 1.0 mg/kg Se resulted in the highest
Se concentrations in both liver and muscle tissues than the fish fed lower Se-
supplemented diets. Snapper fed the BS diet attained higher tissue Se accumulations than
the fish fed CD diet. Linear regression analysis showed a strong relationship between
dietary Se levels and tissues Se accumulation (y = 0.4184x – 0.1909, R2 = 0.9383 and P
< 0.05 for muscle Se; y = 0.8855x + 0.1024, R2 = 0.8872 and P < 0.05 for liver Se;
Figure 4.1.1).
Table 4.1.4 Body compositions of Australian snapper fed diets with Se supplementation
Crude protein (%)
Crude lipid (%)
Dry matter (%)
Ash (%) Gross energy (MJ/kg)
Diets
CD0 17.12 13.04 36.97 5.39 9.33
CD0.8 17.16 13.86 38.41 5.51 10.07
CD1.0 17.19 13.72 37.27 5.43 9.60
BS0 17.21 13.80 36.23 5.40 9.29
BS0.8 17.59 12.43 36.93 5.27 9.56
BS1.0 16.44 12.65 34.36 5.09 8.82
S.E.M 1.25 3.56 3.67 0.54 0.115
Means of main effects of diet types
CD 17.16 13.54 37.55b 5.44 9.67b
BS 17.08 12.95 35.84a 5.26 9.22a
Means of main effects of Se
0 17.16 13.42 36.60xy 5.40 9.31xy
0.8 17.38 13.15 37.67y 5.39 9.81y
1.0 16.81 13.17 35.81x 5.26 9.21x
Two-ways ANOVA: P-values
Diet types 0.727 0.466 0.006 0.094 0.021
Se 0.157 0.950 0.036 0.494 0.027
Diet types X Se 0.128 0.489 0.251 0.380 0.222 Values are displayed as mean of triplicate groups. Means with different alphabets (a, b or x, y) within a column indicate the significantly differences (P < 0.05) among means of the main effects of diet types and dietary Se supplementation, respectively. S.E.M Standard error of means; Se Selenium; CD Reconstituted commercial diet; BS Basal diet.
62
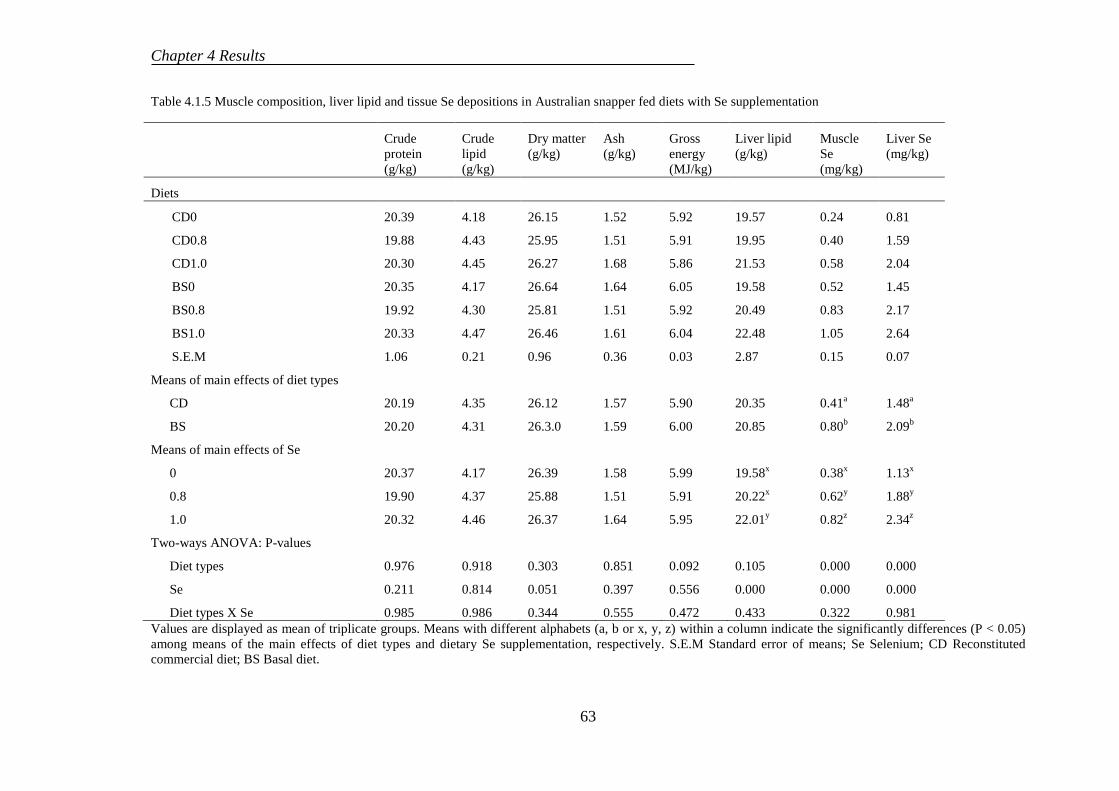
Chapter 4 Results
Table 4.1.5 Muscle composition, liver lipid and tissue Se depositions in Australian snapper fed diets with Se supplementation
Crude protein (g/kg)
Crude lipid (g/kg)
Dry matter (g/kg)
Ash (g/kg)
Gross energy (MJ/kg)
Liver lipid (g/kg)
Muscle Se (mg/kg)
Liver Se (mg/kg)
Diets
CD0 20.39 4.18 26.15 1.52 5.92 19.57 0.24 0.81
CD0.8 19.88 4.43 25.95 1.51 5.91 19.95 0.40 1.59
CD1.0 20.30 4.45 26.27 1.68 5.86 21.53 0.58 2.04
BS0 20.35 4.17 26.64 1.64 6.05 19.58 0.52 1.45
BS0.8 19.92 4.30 25.81 1.51 5.92 20.49 0.83 2.17
BS1.0 20.33 4.47 26.46 1.61 6.04 22.48 1.05 2.64
S.E.M 1.06 0.21 0.96 0.36 0.03 2.87 0.15 0.07
Means of main effects of diet types
CD 20.19 4.35 26.12 1.57 5.90 20.35 0.41a 1.48a
BS 20.20 4.31 26.3.0 1.59 6.00 20.85 0.80b 2.09b
Means of main effects of Se
0 20.37 4.17 26.39 1.58 5.99 19.58x 0.38x 1.13x
0.8 19.90 4.37 25.88 1.51 5.91 20.22x 0.62y 1.88y
1.0 20.32 4.46 26.37 1.64 5.95 22.01y 0.82z 2.34z
Two-ways ANOVA: P-values
Diet types 0.976 0.918 0.303 0.851 0.092 0.105 0.000 0.000
Se 0.211 0.814 0.051 0.397 0.556 0.000 0.000 0.000
Diet types X Se 0.985 0.986 0.344 0.555 0.472 0.433 0.322 0.981 Values are displayed as mean of triplicate groups. Means with different alphabets (a, b or x, y, z) within a column indicate the significantly differences (P < 0.05) among means of the main effects of diet types and dietary Se supplementation, respectively. S.E.M Standard error of means; Se Selenium; CD Reconstituted commercial diet; BS Basal diet.
63
Chapter 4 Results
4.1.4 Histological evaluation
Snapper fed reconstituted commercial diet with and without Se supplementation did not
show any histopathological lesions on the livers (Figure 4.1.2), whereas the increases in
lipid droplet accumulation were observed in livers of snapper fed the basal diet
supplemented with 0.8 and 1.0 mg/kg Se (Figure 4.1.3 and Figure 4.1.4).
Figure 4.1.2 Liver section of snapper fed reconstituted commercial diet without Se adding show normal hepatocytes.
Figure 4.1.3 The increased hepatic lipid accumulation in snapper fed the basal diet with 0.8 mg/kg Se supplementation (arrow).
64
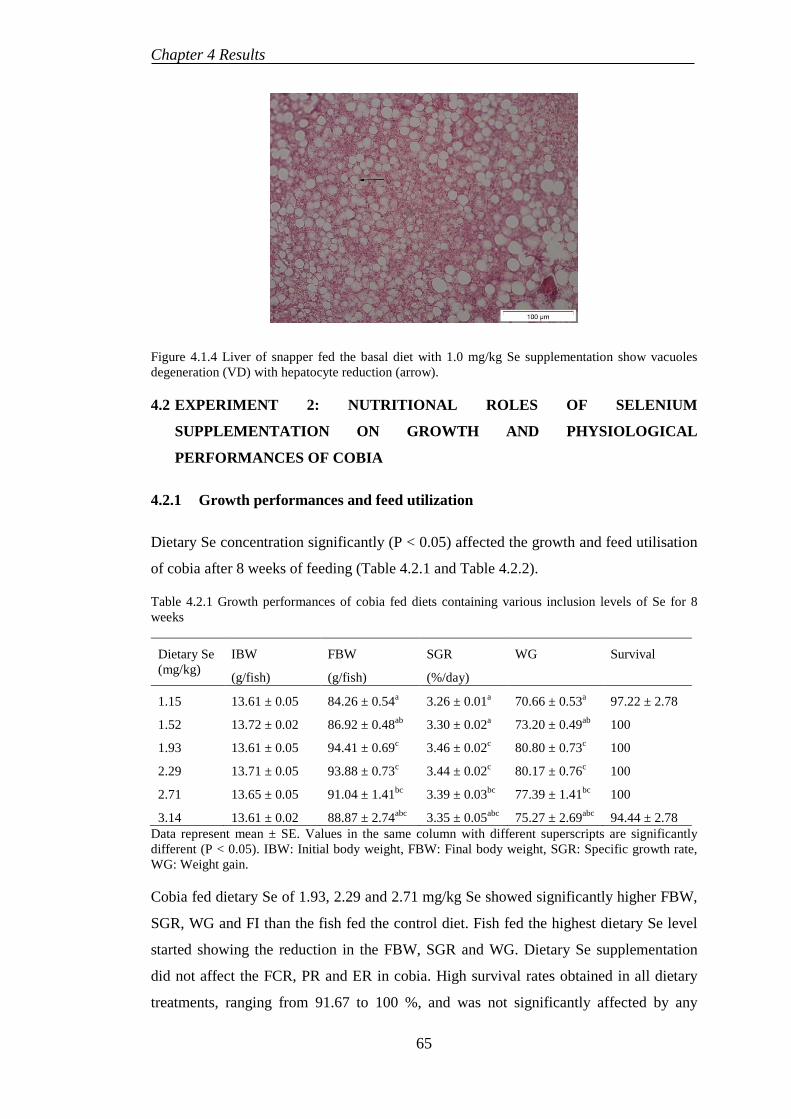
Chapter 4 Results
Figure 4.1.4 Liver of snapper fed the basal diet with 1.0 mg/kg Se supplementation show vacuoles degeneration (VD) with hepatocyte reduction (arrow).
4.2 EXPERIMENT 2: NUTRITIONAL ROLES OF SELENIUM
SUPPLEMENTATION ON GROWTH AND PHYSIOLOGICAL
PERFORMANCES OF COBIA
4.2.1 Growth performances and feed utilization
Dietary Se concentration significantly (P < 0.05) affected the growth and feed utilisation
of cobia after 8 weeks of feeding (Table 4.2.1 and Table 4.2.2).
Table 4.2.1 Growth performances of cobia fed diets containing various inclusion levels of Se for 8 weeks
Dietary Se (mg/kg)
IBW
(g/fish)
FBW
(g/fish)
SGR
(%/day)
WG Survival
1.15 13.61 ± 0.05 84.26 ± 0.54a 3.26 ± 0.01a 70.66 ± 0.53a 97.22 ± 2.78
1.52 13.72 ± 0.02 86.92 ± 0.48ab 3.30 ± 0.02a 73.20 ± 0.49ab 100
1.93 13.61 ± 0.05 94.41 ± 0.69c 3.46 ± 0.02c 80.80 ± 0.73c 100
2.29 13.71 ± 0.05 93.88 ± 0.73c 3.44 ± 0.02c 80.17 ± 0.76c 100
2.71 13.65 ± 0.05 91.04 ± 1.41bc 3.39 ± 0.03bc 77.39 ± 1.41bc 100
3.14 13.61 ± 0.02 88.87 ± 2.74abc 3.35 ± 0.05abc 75.27 ± 2.69abc 94.44 ± 2.78 Data represent mean ± SE. Values in the same column with different superscripts are significantly different (P < 0.05). IBW: Initial body weight, FBW: Final body weight, SGR: Specific growth rate, WG: Weight gain.
Cobia fed dietary Se of 1.93, 2.29 and 2.71 mg/kg Se showed significantly higher FBW,
SGR, WG and FI than the fish fed the control diet. Fish fed the highest dietary Se level
started showing the reduction in the FBW, SGR and WG. Dietary Se supplementation
did not affect the FCR, PR and ER in cobia. High survival rates obtained in all dietary
treatments, ranging from 91.67 to 100 %, and was not significantly affected by any
65
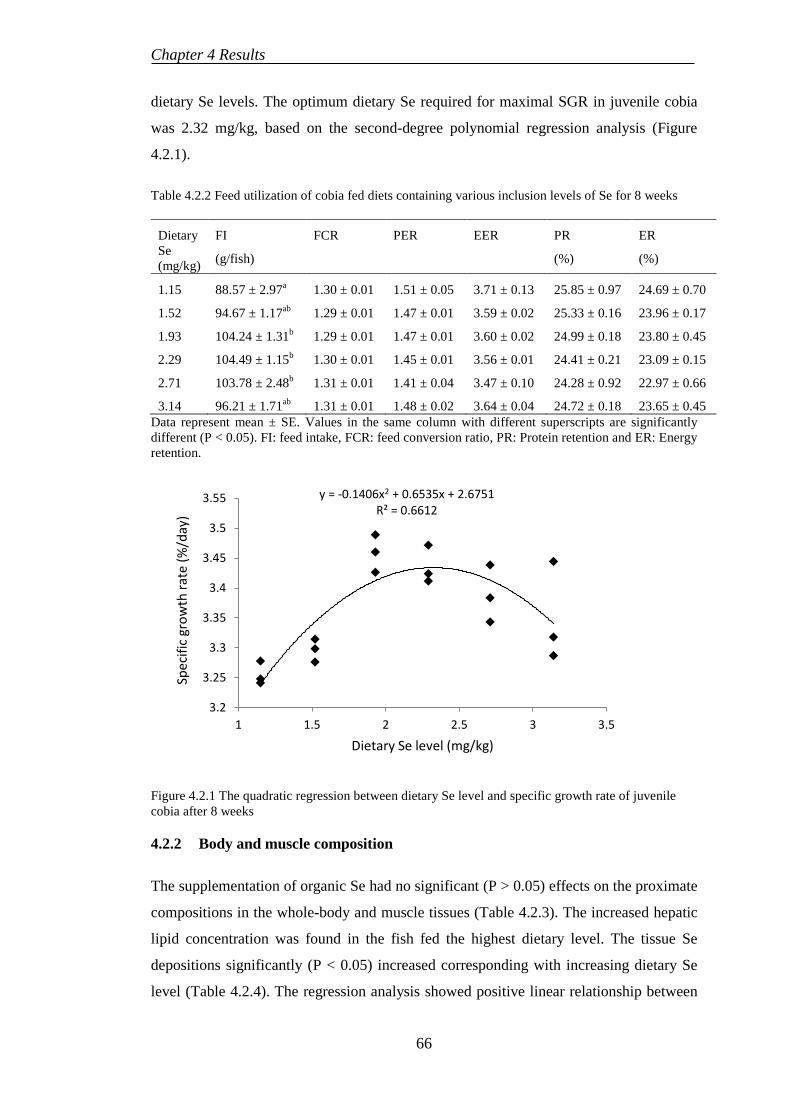
Chapter 4 Results
dietary Se levels. The optimum dietary Se required for maximal SGR in juvenile cobia
was 2.32 mg/kg, based on the second-degree polynomial regression analysis (Figure
4.2.1).
Table 4.2.2 Feed utilization of cobia fed diets containing various inclusion levels of Se for 8 weeks
Dietary Se (mg/kg)
FI
(g/fish)
FCR PER EER PR
(%)
ER
(%)
1.15 88.57 ± 2.97a 1.30 ± 0.01 1.51 ± 0.05 3.71 ± 0.13 25.85 ± 0.97 24.69 ± 0.70
1.52 94.67 ± 1.17ab 1.29 ± 0.01 1.47 ± 0.01 3.59 ± 0.02 25.33 ± 0.16 23.96 ± 0.17
1.93 104.24 ± 1.31b 1.29 ± 0.01 1.47 ± 0.01 3.60 ± 0.02 24.99 ± 0.18 23.80 ± 0.45
2.29 104.49 ± 1.15b 1.30 ± 0.01 1.45 ± 0.01 3.56 ± 0.01 24.41 ± 0.21 23.09 ± 0.15
2.71 103.78 ± 2.48b 1.31 ± 0.01 1.41 ± 0.04 3.47 ± 0.10 24.28 ± 0.92 22.97 ± 0.66
3.14 96.21 ± 1.71ab 1.31 ± 0.01 1.48 ± 0.02 3.64 ± 0.04 24.72 ± 0.18 23.65 ± 0.45 Data represent mean ± SE. Values in the same column with different superscripts are significantly different (P < 0.05). FI: feed intake, FCR: feed conversion ratio, PR: Protein retention and ER: Energy retention.
Figure 4.2.1 The quadratic regression between dietary Se level and specific growth rate of juvenile cobia after 8 weeks
4.2.2 Body and muscle composition
The supplementation of organic Se had no significant (P > 0.05) effects on the proximate
compositions in the whole-body and muscle tissues (Table 4.2.3). The increased hepatic
lipid concentration was found in the fish fed the highest dietary level. The tissue Se
depositions significantly (P < 0.05) increased corresponding with increasing dietary Se
level (Table 4.2.4). The regression analysis showed positive linear relationship between
y = -0.1406x2 + 0.6535x + 2.6751 R² = 0.6612
3.2
3.25
3.3
3.35
3.4
3.45
3.5
3.55
1 1.5 2 2.5 3 3.5
Spec
ific
grow
th ra
te (%
/day
)
Dietary Se level (mg/kg)
66
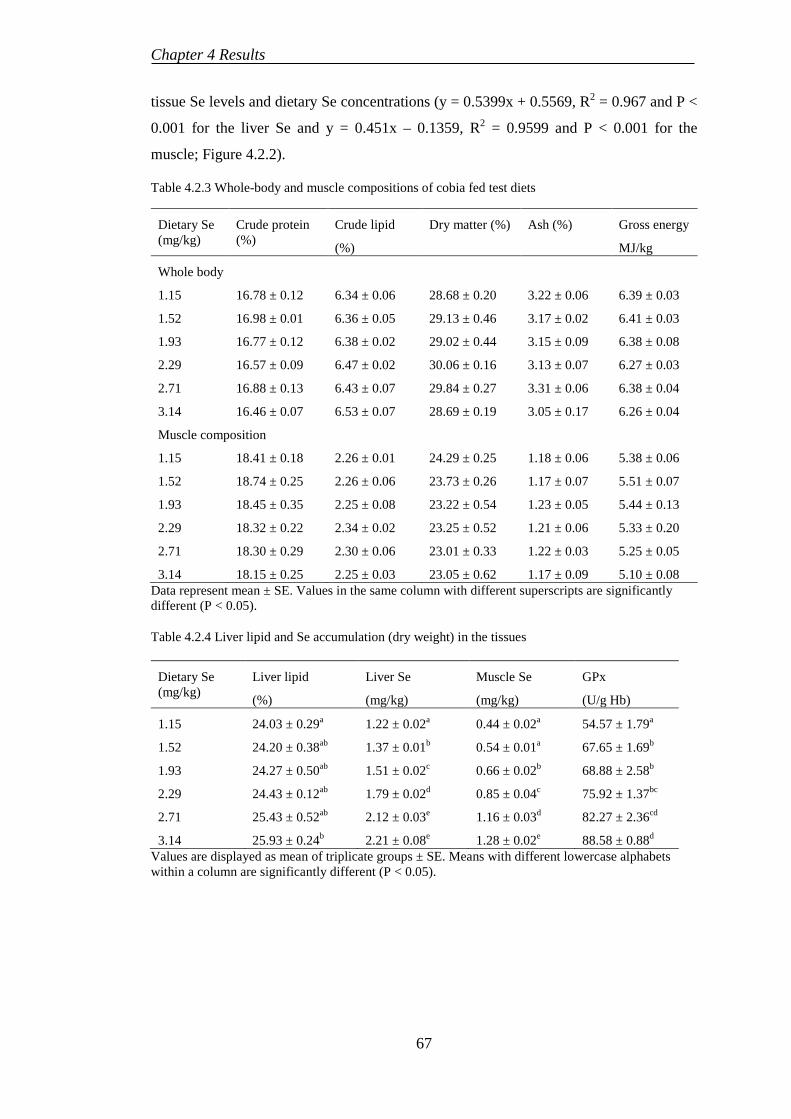
Chapter 4 Results
tissue Se levels and dietary Se concentrations (y = 0.5399x + 0.5569, R2 = 0.967 and P <
0.001 for the liver Se and y = 0.451x – 0.1359, R2 = 0.9599 and P < 0.001 for the
muscle; Figure 4.2.2).
Table 4.2.3 Whole-body and muscle compositions of cobia fed test diets
Dietary Se (mg/kg)
Crude protein (%)
Crude lipid
(%)
Dry matter (%) Ash (%) Gross energy
MJ/kg
Whole body
1.15 16.78 ± 0.12 6.34 ± 0.06 28.68 ± 0.20 3.22 ± 0.06 6.39 ± 0.03
1.52 16.98 ± 0.01 6.36 ± 0.05 29.13 ± 0.46 3.17 ± 0.02 6.41 ± 0.03
1.93 16.77 ± 0.12 6.38 ± 0.02 29.02 ± 0.44 3.15 ± 0.09 6.38 ± 0.08
2.29 16.57 ± 0.09 6.47 ± 0.02 30.06 ± 0.16 3.13 ± 0.07 6.27 ± 0.03
2.71 16.88 ± 0.13 6.43 ± 0.07 29.84 ± 0.27 3.31 ± 0.06 6.38 ± 0.04
3.14 16.46 ± 0.07 6.53 ± 0.07 28.69 ± 0.19 3.05 ± 0.17 6.26 ± 0.04
Muscle composition
1.15 18.41 ± 0.18 2.26 ± 0.01 24.29 ± 0.25 1.18 ± 0.06 5.38 ± 0.06
1.52 18.74 ± 0.25 2.26 ± 0.06 23.73 ± 0.26 1.17 ± 0.07 5.51 ± 0.07
1.93 18.45 ± 0.35 2.25 ± 0.08 23.22 ± 0.54 1.23 ± 0.05 5.44 ± 0.13
2.29 18.32 ± 0.22 2.34 ± 0.02 23.25 ± 0.52 1.21 ± 0.06 5.33 ± 0.20
2.71 18.30 ± 0.29 2.30 ± 0.06 23.01 ± 0.33 1.22 ± 0.03 5.25 ± 0.05
3.14 18.15 ± 0.25 2.25 ± 0.03 23.05 ± 0.62 1.17 ± 0.09 5.10 ± 0.08
Data represent mean ± SE. Values in the same column with different superscripts are significantly different (P < 0.05).
Table 4.2.4 Liver lipid and Se accumulation (dry weight) in the tissues
Dietary Se (mg/kg)
Liver lipid
(%)
Liver Se
(mg/kg)
Muscle Se
(mg/kg)
GPx
(U/g Hb)
1.15 24.03 ± 0.29a 1.22 ± 0.02a 0.44 ± 0.02a 54.57 ± 1.79a
1.52 24.20 ± 0.38ab 1.37 ± 0.01b 0.54 ± 0.01a 67.65 ± 1.69b
1.93 24.27 ± 0.50ab 1.51 ± 0.02c 0.66 ± 0.02b 68.88 ± 2.58b
2.29 24.43 ± 0.12ab 1.79 ± 0.02d 0.85 ± 0.04c 75.92 ± 1.37bc
2.71 25.43 ± 0.52ab 2.12 ± 0.03e 1.16 ± 0.03d 82.27 ± 2.36cd
3.14 25.93 ± 0.24b 2.21 ± 0.08e 1.28 ± 0.02e 88.58 ± 0.88d
Values are displayed as mean of triplicate groups ± SE. Means with different lowercase alphabets within a column are significantly different (P < 0.05).
67
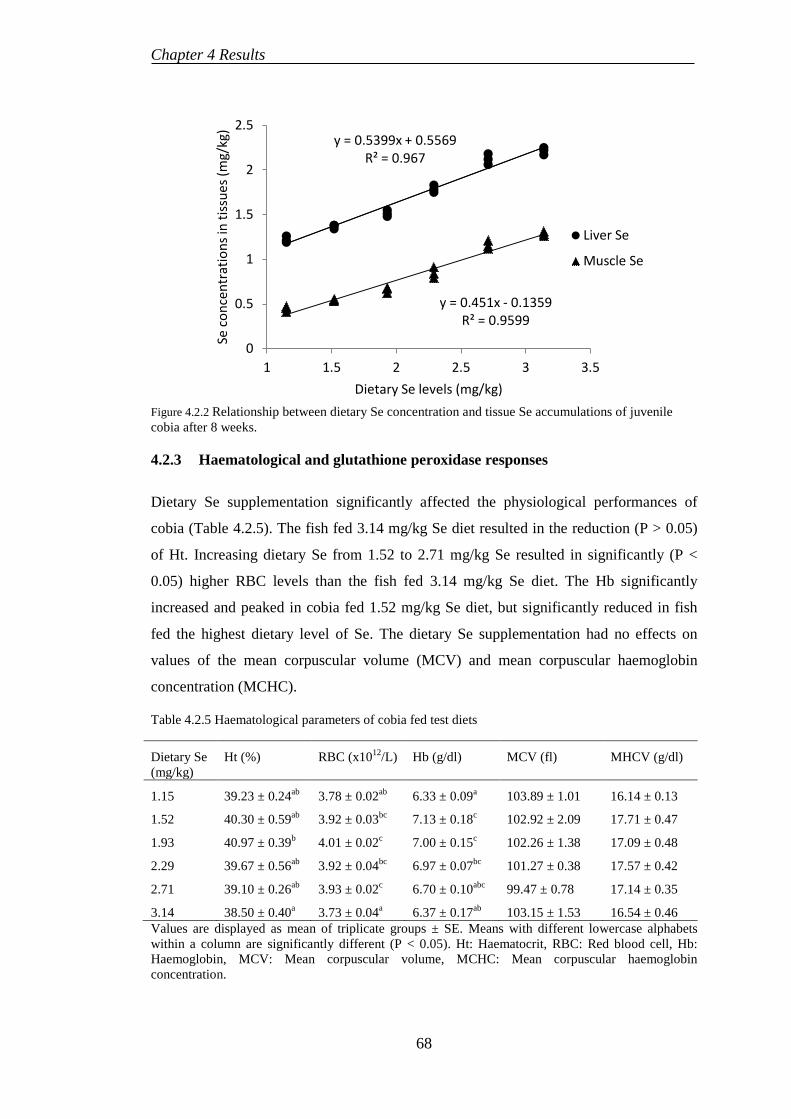
Chapter 4 Results
Figure 4.2.2 Relationship between dietary Se concentration and tissue Se accumulations of juvenile cobia after 8 weeks.
4.2.3 Haematological and glutathione peroxidase responses
Dietary Se supplementation significantly affected the physiological performances of
cobia (Table 4.2.5). The fish fed 3.14 mg/kg Se diet resulted in the reduction (P > 0.05)
of Ht. Increasing dietary Se from 1.52 to 2.71 mg/kg Se resulted in significantly (P <
0.05) higher RBC levels than the fish fed 3.14 mg/kg Se diet. The Hb significantly
increased and peaked in cobia fed 1.52 mg/kg Se diet, but significantly reduced in fish
fed the highest dietary level of Se. The dietary Se supplementation had no effects on
values of the mean corpuscular volume (MCV) and mean corpuscular haemoglobin
concentration (MCHC).
Table 4.2.5 Haematological parameters of cobia fed test diets
Dietary Se (mg/kg)
Ht (%) RBC (x1012/L) Hb (g/dl) MCV (fl) MHCV (g/dl)
1.15 39.23 ± 0.24ab 3.78 ± 0.02ab 6.33 ± 0.09a 103.89 ± 1.01 16.14 ± 0.13
1.52 40.30 ± 0.59ab 3.92 ± 0.03bc 7.13 ± 0.18c 102.92 ± 2.09 17.71 ± 0.47
1.93 40.97 ± 0.39b 4.01 ± 0.02c 7.00 ± 0.15c 102.26 ± 1.38 17.09 ± 0.48
2.29 39.67 ± 0.56ab 3.92 ± 0.04bc 6.97 ± 0.07bc 101.27 ± 0.38 17.57 ± 0.42
2.71 39.10 ± 0.26ab 3.93 ± 0.02c 6.70 ± 0.10abc 99.47 ± 0.78 17.14 ± 0.35
3.14 38.50 ± 0.40a 3.73 ± 0.04a 6.37 ± 0.17ab 103.15 ± 1.53 16.54 ± 0.46 Values are displayed as mean of triplicate groups ± SE. Means with different lowercase alphabets within a column are significantly different (P < 0.05). Ht: Haematocrit, RBC: Red blood cell, Hb: Haemoglobin, MCV: Mean corpuscular volume, MCHC: Mean corpuscular haemoglobin concentration.
y = 0.5399x + 0.5569 R² = 0.967
y = 0.451x - 0.1359 R² = 0.9599
0
0.5
1
1.5
2
2.5
1 1.5 2 2.5 3 3.5
Se c
once
ntra
tions
in ti
ssue
s (m
g/kg
)
Dietary Se levels (mg/kg)
Liver Se
Muscle Se
68
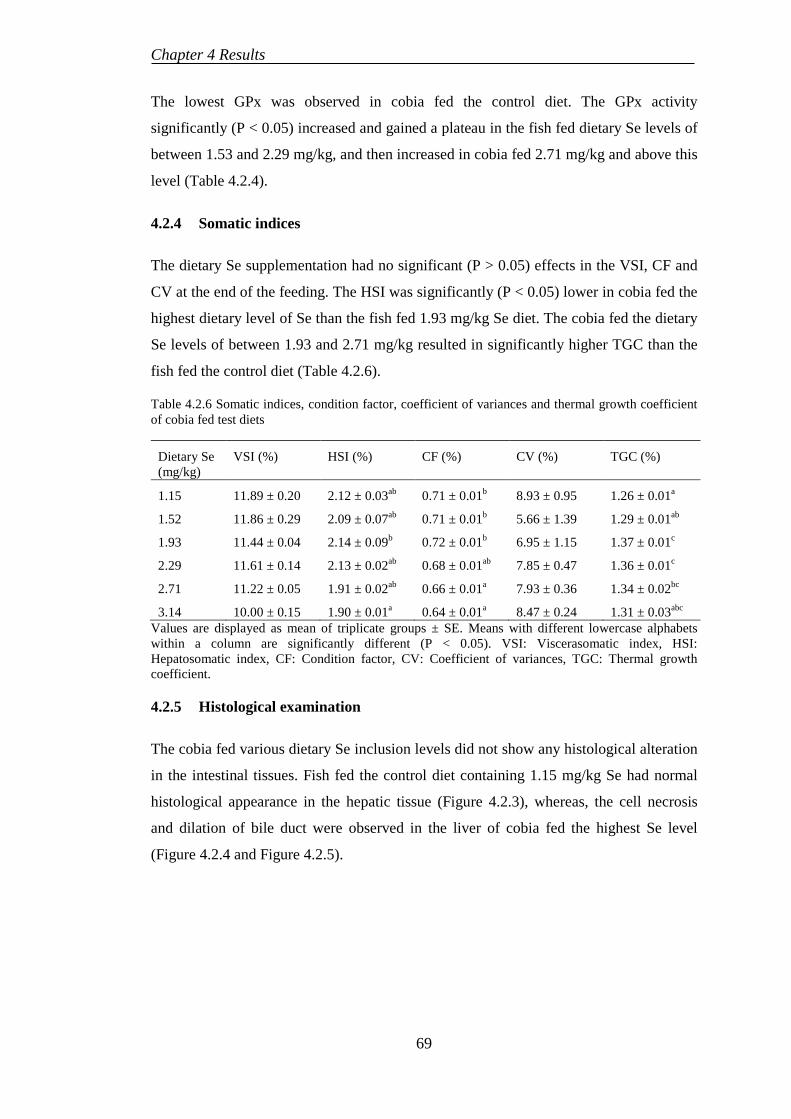
Chapter 4 Results
The lowest GPx was observed in cobia fed the control diet. The GPx activity
significantly (P < 0.05) increased and gained a plateau in the fish fed dietary Se levels of
between 1.53 and 2.29 mg/kg, and then increased in cobia fed 2.71 mg/kg and above this
level (Table 4.2.4).
4.2.4 Somatic indices
The dietary Se supplementation had no significant (P > 0.05) effects in the VSI, CF and
CV at the end of the feeding. The HSI was significantly (P < 0.05) lower in cobia fed the
highest dietary level of Se than the fish fed 1.93 mg/kg Se diet. The cobia fed the dietary
Se levels of between 1.93 and 2.71 mg/kg resulted in significantly higher TGC than the
fish fed the control diet (Table 4.2.6).
Table 4.2.6 Somatic indices, condition factor, coefficient of variances and thermal growth coefficient of cobia fed test diets
Dietary Se (mg/kg)
VSI (%) HSI (%) CF (%) CV (%) TGC (%)
1.15 11.89 ± 0.20 2.12 ± 0.03ab 0.71 ± 0.01b 8.93 ± 0.95 1.26 ± 0.01a
1.52 11.86 ± 0.29 2.09 ± 0.07ab 0.71 ± 0.01b 5.66 ± 1.39 1.29 ± 0.01ab
1.93 11.44 ± 0.04 2.14 ± 0.09b 0.72 ± 0.01b 6.95 ± 1.15 1.37 ± 0.01c
2.29 11.61 ± 0.14 2.13 ± 0.02ab 0.68 ± 0.01ab 7.85 ± 0.47 1.36 ± 0.01c
2.71 11.22 ± 0.05 1.91 ± 0.02ab 0.66 ± 0.01a 7.93 ± 0.36 1.34 ± 0.02bc
3.14 10.00 ± 0.15 1.90 ± 0.01a 0.64 ± 0.01a 8.47 ± 0.24 1.31 ± 0.03abc
Values are displayed as mean of triplicate groups ± SE. Means with different lowercase alphabets within a column are significantly different (P < 0.05). VSI: Viscerasomatic index, HSI: Hepatosomatic index, CF: Condition factor, CV: Coefficient of variances, TGC: Thermal growth coefficient.
4.2.5 Histological examination
The cobia fed various dietary Se inclusion levels did not show any histological alteration
in the intestinal tissues. Fish fed the control diet containing 1.15 mg/kg Se had normal
histological appearance in the hepatic tissue (Figure 4.2.3), whereas, the cell necrosis
and dilation of bile duct were observed in the liver of cobia fed the highest Se level
(Figure 4.2.4 and Figure 4.2.5).
69
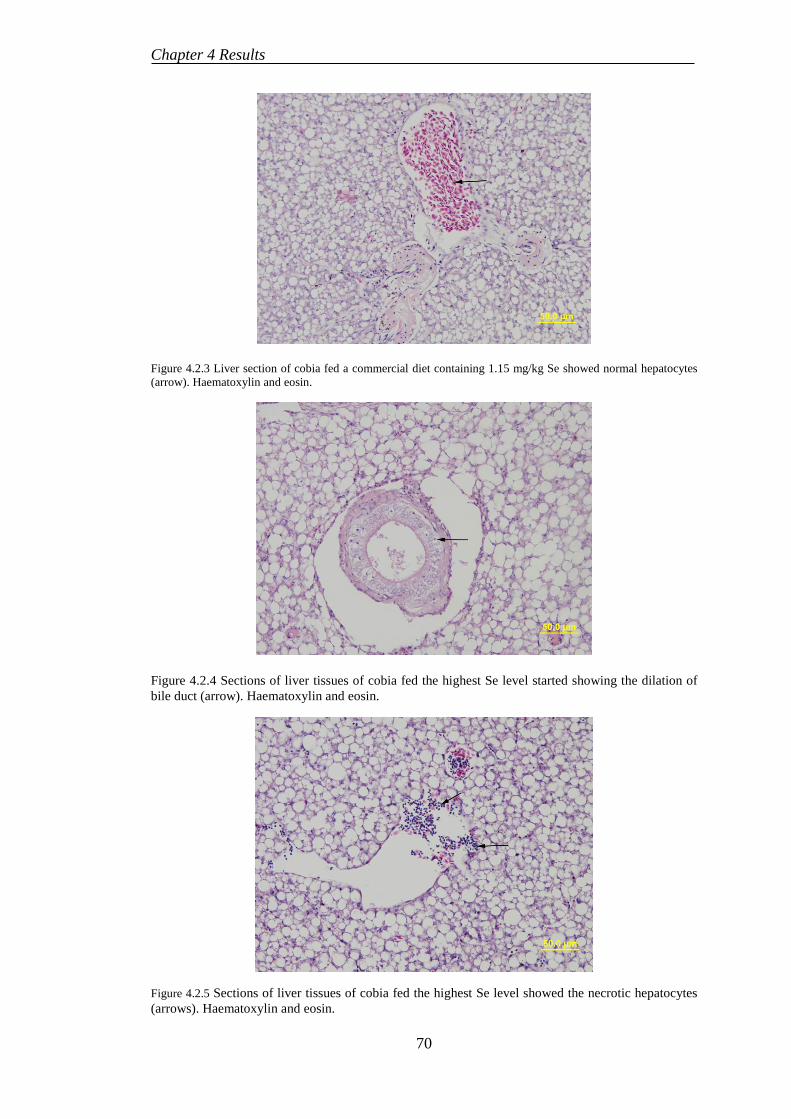
Chapter 4 Results
Figure 4.2.3 Liver section of cobia fed a commercial diet containing 1.15 mg/kg Se showed normal hepatocytes (arrow). Haematoxylin and eosin.
Figure 4.2.4 Sections of liver tissues of cobia fed the highest Se level started showing the dilation of bile duct (arrow). Haematoxylin and eosin.
Figure 4.2.5 Sections of liver tissues of cobia fed the highest Se level showed the necrotic hepatocytes (arrows). Haematoxylin and eosin.
70
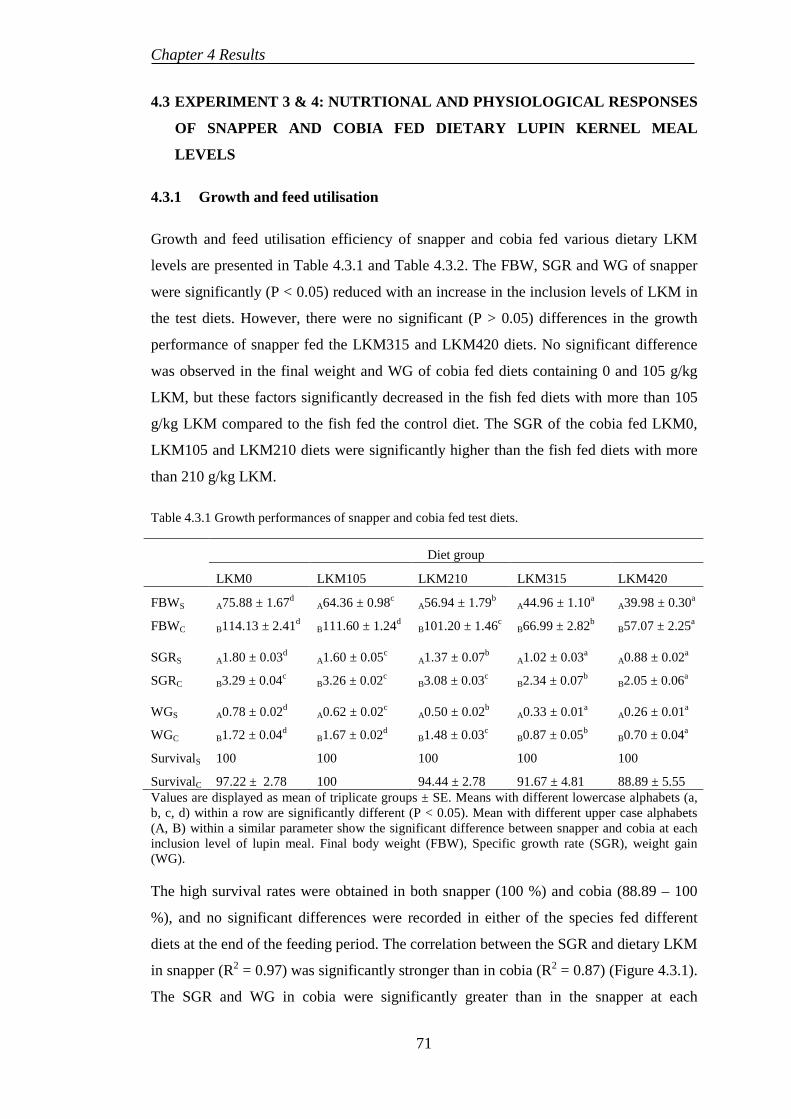
Chapter 4 Results
4.3 EXPERIMENT 3 & 4: NUTRTIONAL AND PHYSIOLOGICAL RESPONSES
OF SNAPPER AND COBIA FED DIETARY LUPIN KERNEL MEAL
LEVELS
4.3.1 Growth and feed utilisation
Growth and feed utilisation efficiency of snapper and cobia fed various dietary LKM
levels are presented in Table 4.3.1 and Table 4.3.2. The FBW, SGR and WG of snapper
were significantly (P < 0.05) reduced with an increase in the inclusion levels of LKM in
the test diets. However, there were no significant (P > 0.05) differences in the growth
performance of snapper fed the LKM315 and LKM420 diets. No significant difference
was observed in the final weight and WG of cobia fed diets containing 0 and 105 g/kg
LKM, but these factors significantly decreased in the fish fed diets with more than 105
g/kg LKM compared to the fish fed the control diet. The SGR of the cobia fed LKM0,
LKM105 and LKM210 diets were significantly higher than the fish fed diets with more
than 210 g/kg LKM.
Table 4.3.1 Growth performances of snapper and cobia fed test diets.
Diet group
LKM0 LKM105 LKM210 LKM315 LKM420
FBWS A75.88 ± 1.67d A64.36 ± 0.98c
A56.94 ± 1.79b A44.96 ± 1.10a
A39.98 ± 0.30a
FBWC B114.13 ± 2.41d B111.60 ± 1.24d
B101.20 ± 1.46c B66.99 ± 2.82b
B57.07 ± 2.25a
SGRS A1.80 ± 0.03d A1.60 ± 0.05c
A1.37 ± 0.07b A1.02 ± 0.03a
A0.88 ± 0.02a
SGRC B3.29 ± 0.04c B3.26 ± 0.02c
B3.08 ± 0.03c B2.34 ± 0.07b
B2.05 ± 0.06a
WGS A0.78 ± 0.02d A0.62 ± 0.02c
A0.50 ± 0.02b A0.33 ± 0.01a
A0.26 ± 0.01a
WGC B1.72 ± 0.04d B1.67 ± 0.02d
B1.48 ± 0.03c B0.87 ± 0.05b
B0.70 ± 0.04a
SurvivalS 100 100 100 100 100
SurvivalC 97.22 ± 2.78 100 94.44 ± 2.78 91.67 ± 4.81 88.89 ± 5.55 Values are displayed as mean of triplicate groups ± SE. Means with different lowercase alphabets (a, b, c, d) within a row are significantly different (P < 0.05). Mean with different upper case alphabets (A, B) within a similar parameter show the significant difference between snapper and cobia at each inclusion level of lupin meal. Final body weight (FBW), Specific growth rate (SGR), weight gain (WG).
The high survival rates were obtained in both snapper (100 %) and cobia (88.89 – 100
%), and no significant differences were recorded in either of the species fed different
diets at the end of the feeding period. The correlation between the SGR and dietary LKM
in snapper (R2 = 0.97) was significantly stronger than in cobia (R2 = 0.87) (Figure 4.3.1).
The SGR and WG in cobia were significantly greater than in the snapper at each
71
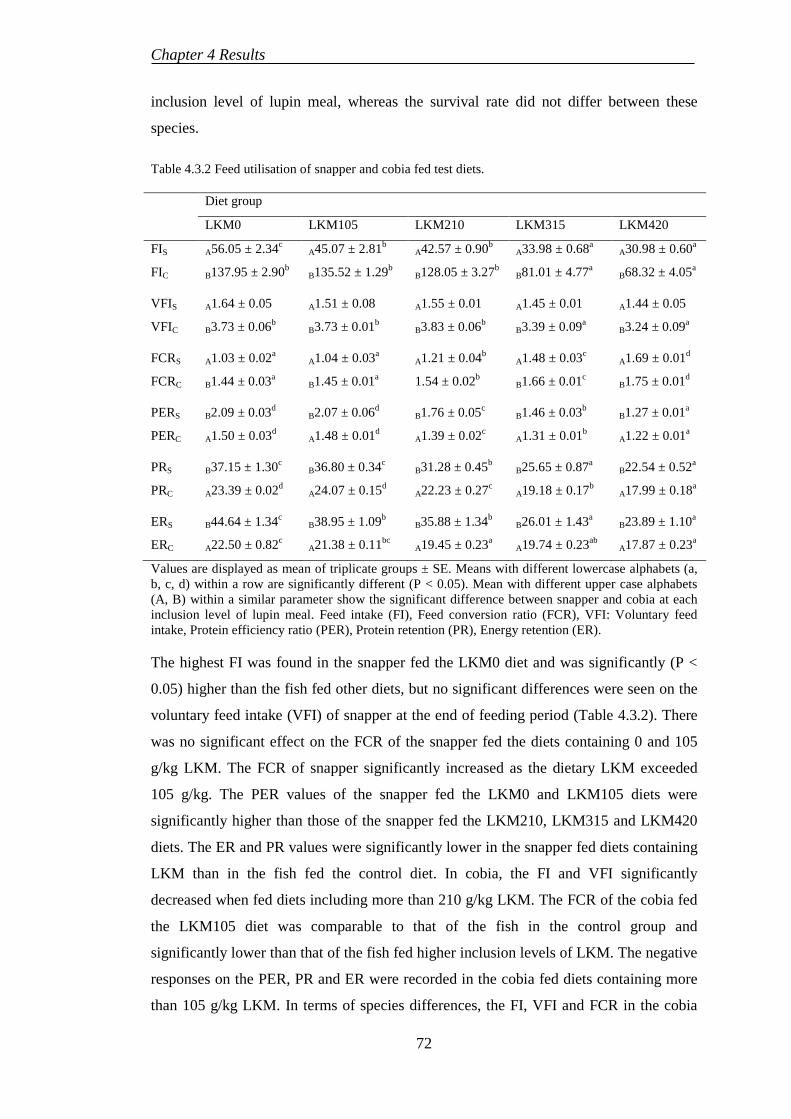
Chapter 4 Results
inclusion level of lupin meal, whereas the survival rate did not differ between these
species.
Table 4.3.2 Feed utilisation of snapper and cobia fed test diets.
Diet group
LKM0 LKM105 LKM210 LKM315 LKM420
FIS A56.05 ± 2.34c A45.07 ± 2.81b
A42.57 ± 0.90b A33.98 ± 0.68a
A30.98 ± 0.60a
FIC B137.95 ± 2.90b B135.52 ± 1.29b
B128.05 ± 3.27b B81.01 ± 4.77a
B68.32 ± 4.05a
VFIS A1.64 ± 0.05 A1.51 ± 0.08 A1.55 ± 0.01 A1.45 ± 0.01 A1.44 ± 0.05
VFIC B3.73 ± 0.06b B3.73 ± 0.01b
B3.83 ± 0.06b B3.39 ± 0.09a
B3.24 ± 0.09a
FCRS A1.03 ± 0.02a A1.04 ± 0.03a
A1.21 ± 0.04b A1.48 ± 0.03c
A1.69 ± 0.01d
FCRC B1.44 ± 0.03a B1.45 ± 0.01a
1.54 ± 0.02b B1.66 ± 0.01c
B1.75 ± 0.01d
PERS B2.09 ± 0.03d B2.07 ± 0.06d
B1.76 ± 0.05c B1.46 ± 0.03b
B1.27 ± 0.01a
PERC A1.50 ± 0.03d A1.48 ± 0.01d
A1.39 ± 0.02c A1.31 ± 0.01b
A1.22 ± 0.01a
PRS B37.15 ± 1.30c B36.80 ± 0.34c
B31.28 ± 0.45b B25.65 ± 0.87a
B22.54 ± 0.52a
PRC A23.39 ± 0.02d A24.07 ± 0.15d
A22.23 ± 0.27c A19.18 ± 0.17b
A17.99 ± 0.18a
ERS B44.64 ± 1.34c B38.95 ± 1.09b
B35.88 ± 1.34b B26.01 ± 1.43a
B23.89 ± 1.10a
ERC A22.50 ± 0.82c A21.38 ± 0.11bc
A19.45 ± 0.23a A19.74 ± 0.23ab
A17.87 ± 0.23a
Values are displayed as mean of triplicate groups ± SE. Means with different lowercase alphabets (a, b, c, d) within a row are significantly different (P < 0.05). Mean with different upper case alphabets (A, B) within a similar parameter show the significant difference between snapper and cobia at each inclusion level of lupin meal. Feed intake (FI), Feed conversion ratio (FCR), VFI: Voluntary feed intake, Protein efficiency ratio (PER), Protein retention (PR), Energy retention (ER).
The highest FI was found in the snapper fed the LKM0 diet and was significantly (P <
0.05) higher than the fish fed other diets, but no significant differences were seen on the
voluntary feed intake (VFI) of snapper at the end of feeding period (Table 4.3.2). There
was no significant effect on the FCR of the snapper fed the diets containing 0 and 105
g/kg LKM. The FCR of snapper significantly increased as the dietary LKM exceeded
105 g/kg. The PER values of the snapper fed the LKM0 and LKM105 diets were
significantly higher than those of the snapper fed the LKM210, LKM315 and LKM420
diets. The ER and PR values were significantly lower in the snapper fed diets containing
LKM than in the fish fed the control diet. In cobia, the FI and VFI significantly
decreased when fed diets including more than 210 g/kg LKM. The FCR of the cobia fed
the LKM105 diet was comparable to that of the fish in the control group and
significantly lower than that of the fish fed higher inclusion levels of LKM. The negative
responses on the PER, PR and ER were recorded in the cobia fed diets containing more
than 105 g/kg LKM. In terms of species differences, the FI, VFI and FCR in the cobia
72
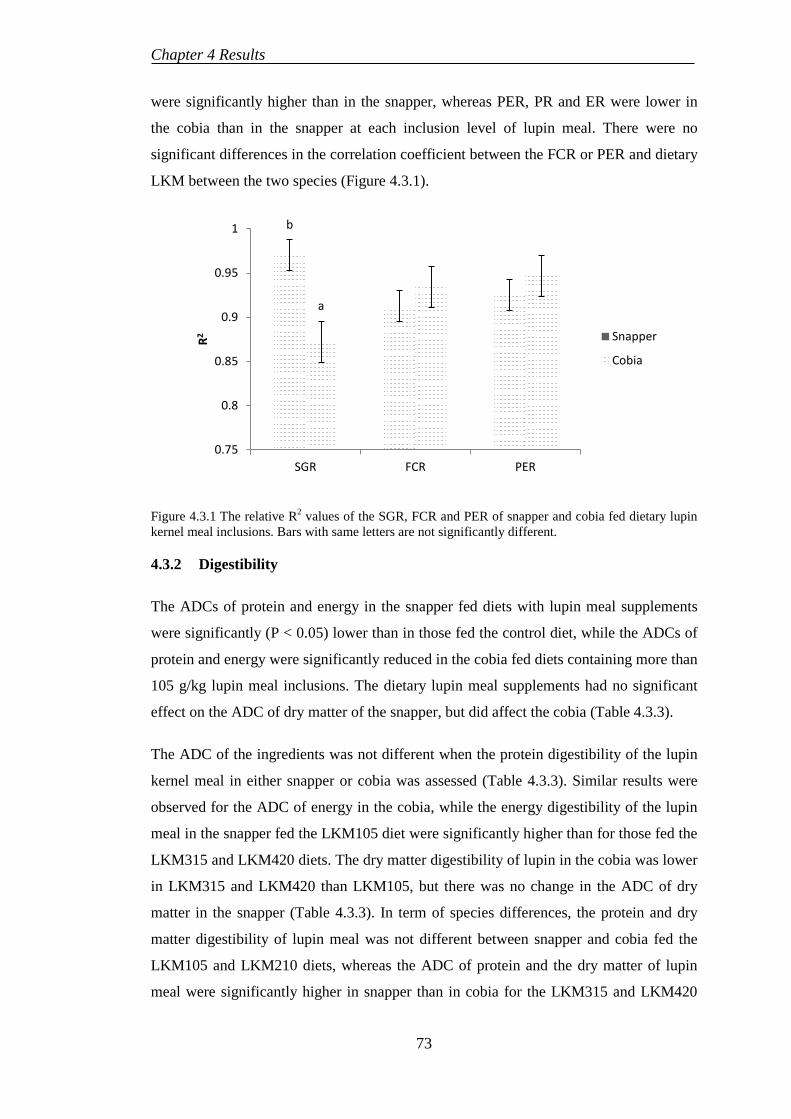
Chapter 4 Results
were significantly higher than in the snapper, whereas PER, PR and ER were lower in
the cobia than in the snapper at each inclusion level of lupin meal. There were no
significant differences in the correlation coefficient between the FCR or PER and dietary
LKM between the two species (Figure 4.3.1).
Figure 4.3.1 The relative R2 values of the SGR, FCR and PER of snapper and cobia fed dietary lupin kernel meal inclusions. Bars with same letters are not significantly different.
4.3.2 Digestibility
The ADCs of protein and energy in the snapper fed diets with lupin meal supplements
were significantly (P < 0.05) lower than in those fed the control diet, while the ADCs of
protein and energy were significantly reduced in the cobia fed diets containing more than
105 g/kg lupin meal inclusions. The dietary lupin meal supplements had no significant
effect on the ADC of dry matter of the snapper, but did affect the cobia (Table 4.3.3).
The ADC of the ingredients was not different when the protein digestibility of the lupin
kernel meal in either snapper or cobia was assessed (Table 4.3.3). Similar results were
observed for the ADC of energy in the cobia, while the energy digestibility of the lupin
meal in the snapper fed the LKM105 diet were significantly higher than for those fed the
LKM315 and LKM420 diets. The dry matter digestibility of lupin in the cobia was lower
in LKM315 and LKM420 than LKM105, but there was no change in the ADC of dry
matter in the snapper (Table 4.3.3). In term of species differences, the protein and dry
matter digestibility of lupin meal was not different between snapper and cobia fed the
LKM105 and LKM210 diets, whereas the ADC of protein and the dry matter of lupin
meal were significantly higher in snapper than in cobia for the LKM315 and LKM420
b
a
0.75
0.8
0.85
0.9
0.95
1
SGR FCR PER
R2 Snapper
Cobia
73
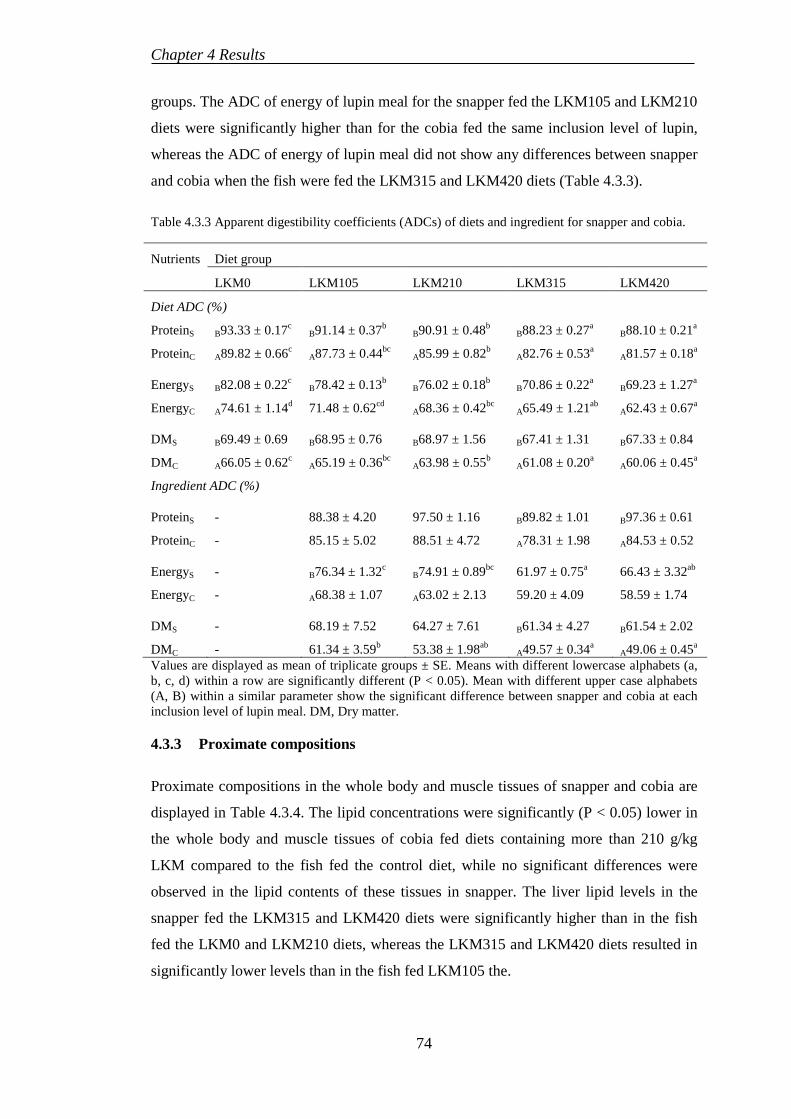
Chapter 4 Results
groups. The ADC of energy of lupin meal for the snapper fed the LKM105 and LKM210
diets were significantly higher than for the cobia fed the same inclusion level of lupin,
whereas the ADC of energy of lupin meal did not show any differences between snapper
and cobia when the fish were fed the LKM315 and LKM420 diets (Table 4.3.3).
Table 4.3.3 Apparent digestibility coefficients (ADCs) of diets and ingredient for snapper and cobia.
Nutrients Diet group
LKM0 LKM105 LKM210 LKM315 LKM420
Diet ADC (%)
ProteinS B93.33 ± 0.17c B91.14 ± 0.37b
B90.91 ± 0.48b B88.23 ± 0.27a
B88.10 ± 0.21a
ProteinC A89.82 ± 0.66c A87.73 ± 0.44bc
A85.99 ± 0.82b A82.76 ± 0.53a
A81.57 ± 0.18a
EnergyS B82.08 ± 0.22c B78.42 ± 0.13b
B76.02 ± 0.18b B70.86 ± 0.22a
B69.23 ± 1.27a
EnergyC A74.61 ± 1.14d 71.48 ± 0.62cd
A68.36 ± 0.42bc A65.49 ± 1.21ab
A62.43 ± 0.67a
DMS B69.49 ± 0.69 B68.95 ± 0.76 B68.97 ± 1.56 B67.41 ± 1.31 B67.33 ± 0.84
DMC A66.05 ± 0.62c A65.19 ± 0.36bc
A63.98 ± 0.55b A61.08 ± 0.20a
A60.06 ± 0.45a
Ingredient ADC (%)
ProteinS - 88.38 ± 4.20 97.50 ± 1.16 B89.82 ± 1.01 B97.36 ± 0.61
ProteinC - 85.15 ± 5.02 88.51 ± 4.72 A78.31 ± 1.98 A84.53 ± 0.52
EnergyS - B76.34 ± 1.32c B74.91 ± 0.89bc
61.97 ± 0.75a 66.43 ± 3.32ab
EnergyC - A68.38 ± 1.07 A63.02 ± 2.13 59.20 ± 4.09 58.59 ± 1.74
DMS - 68.19 ± 7.52 64.27 ± 7.61 B61.34 ± 4.27 B61.54 ± 2.02
DMC - 61.34 ± 3.59b 53.38 ± 1.98ab A49.57 ± 0.34a
A49.06 ± 0.45a
Values are displayed as mean of triplicate groups ± SE. Means with different lowercase alphabets (a, b, c, d) within a row are significantly different (P < 0.05). Mean with different upper case alphabets (A, B) within a similar parameter show the significant difference between snapper and cobia at each inclusion level of lupin meal. DM, Dry matter.
4.3.3 Proximate compositions
Proximate compositions in the whole body and muscle tissues of snapper and cobia are
displayed in Table 4.3.4. The lipid concentrations were significantly (P < 0.05) lower in
the whole body and muscle tissues of cobia fed diets containing more than 210 g/kg
LKM compared to the fish fed the control diet, while no significant differences were
observed in the lipid contents of these tissues in snapper. The liver lipid levels in the
snapper fed the LKM315 and LKM420 diets were significantly higher than in the fish
fed the LKM0 and LKM210 diets, whereas the LKM315 and LKM420 diets resulted in
significantly lower levels than in the fish fed LKM105 the.
74
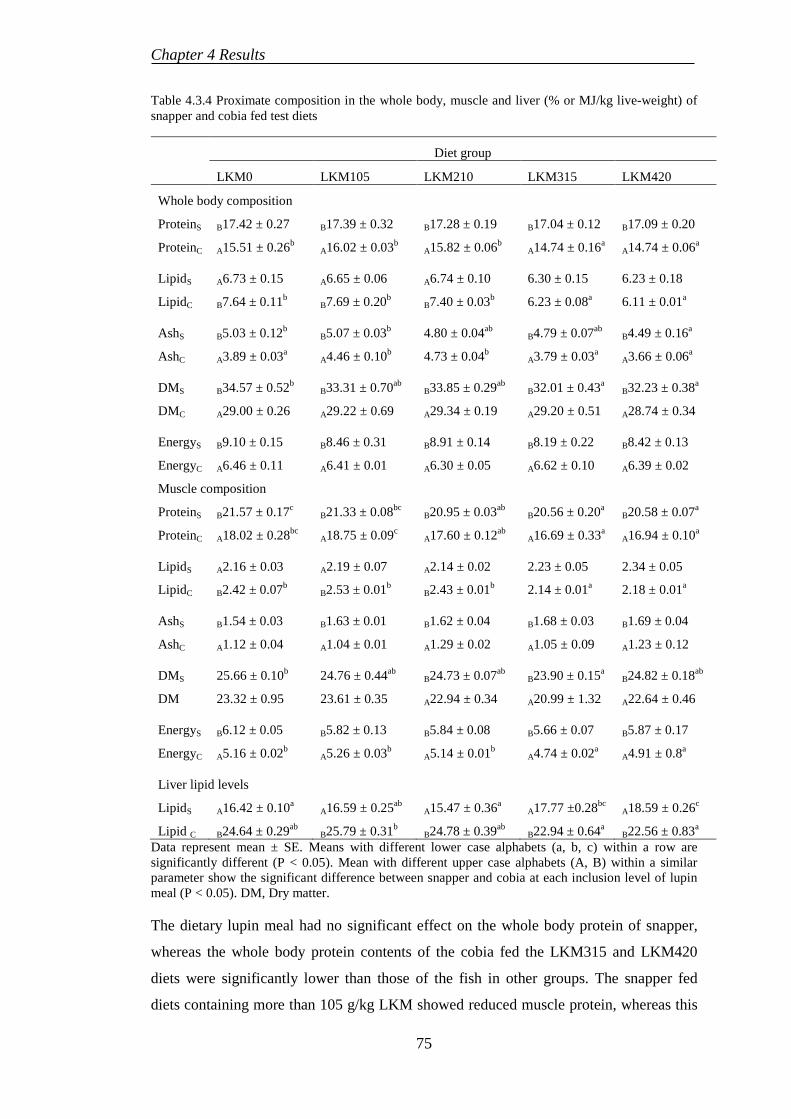
Chapter 4 Results
Table 4.3.4 Proximate composition in the whole body, muscle and liver (% or MJ/kg live-weight) of snapper and cobia fed test diets
Diet group
LKM0 LKM105 LKM210 LKM315 LKM420
Whole body composition
ProteinS B17.42 ± 0.27 B17.39 ± 0.32 B17.28 ± 0.19 B17.04 ± 0.12 B17.09 ± 0.20
ProteinC A15.51 ± 0.26b A16.02 ± 0.03b
A15.82 ± 0.06b A14.74 ± 0.16a
A14.74 ± 0.06a
LipidS A6.73 ± 0.15 A6.65 ± 0.06 A6.74 ± 0.10 6.30 ± 0.15 6.23 ± 0.18
LipidC B7.64 ± 0.11b B7.69 ± 0.20b
B7.40 ± 0.03b 6.23 ± 0.08a 6.11 ± 0.01a
AshS B5.03 ± 0.12b B5.07 ± 0.03b 4.80 ± 0.04ab
B4.79 ± 0.07ab B4.49 ± 0.16a
AshC A3.89 ± 0.03a A4.46 ± 0.10b 4.73 ± 0.04b
A3.79 ± 0.03a A3.66 ± 0.06a
DMS B34.57 ± 0.52b B33.31 ± 0.70ab
B33.85 ± 0.29ab B32.01 ± 0.43a
B32.23 ± 0.38a
DMC A29.00 ± 0.26 A29.22 ± 0.69 A29.34 ± 0.19 A29.20 ± 0.51 A28.74 ± 0.34
EnergyS B9.10 ± 0.15 B8.46 ± 0.31 B8.91 ± 0.14 B8.19 ± 0.22 B8.42 ± 0.13
EnergyC A6.46 ± 0.11 A6.41 ± 0.01 A6.30 ± 0.05 A6.62 ± 0.10 A6.39 ± 0.02
Muscle composition
ProteinS B21.57 ± 0.17c B21.33 ± 0.08bc
B20.95 ± 0.03ab B20.56 ± 0.20a
B20.58 ± 0.07a
ProteinC A18.02 ± 0.28bc A18.75 ± 0.09c
A17.60 ± 0.12ab A16.69 ± 0.33a
A16.94 ± 0.10a
LipidS A2.16 ± 0.03 A2.19 ± 0.07 A2.14 ± 0.02 2.23 ± 0.05 2.34 ± 0.05
LipidC B2.42 ± 0.07b B2.53 ± 0.01b
B2.43 ± 0.01b 2.14 ± 0.01a 2.18 ± 0.01a
AshS B1.54 ± 0.03 B1.63 ± 0.01 B1.62 ± 0.04 B1.68 ± 0.03 B1.69 ± 0.04
AshC A1.12 ± 0.04 A1.04 ± 0.01 A1.29 ± 0.02 A1.05 ± 0.09 A1.23 ± 0.12
DMS 25.66 ± 0.10b 24.76 ± 0.44ab B24.73 ± 0.07ab
B23.90 ± 0.15a B24.82 ± 0.18ab
DM 23.32 ± 0.95 23.61 ± 0.35 A22.94 ± 0.34 A20.99 ± 1.32 A22.64 ± 0.46
EnergyS B6.12 ± 0.05 B5.82 ± 0.13 B5.84 ± 0.08 B5.66 ± 0.07 B5.87 ± 0.17
EnergyC A5.16 ± 0.02b A5.26 ± 0.03b
A5.14 ± 0.01b A4.74 ± 0.02a
A4.91 ± 0.8a
Liver lipid levels
LipidS A16.42 ± 0.10a A16.59 ± 0.25ab A15.47 ± 0.36a A17.77 ±0.28bc A18.59 ± 0.26c
Lipid C B24.64 ± 0.29ab B25.79 ± 0.31b B24.78 ± 0.39ab B22.94 ± 0.64a B22.56 ± 0.83a Data represent mean ± SE. Means with different lower case alphabets (a, b, c) within a row are significantly different (P < 0.05). Mean with different upper case alphabets (A, B) within a similar parameter show the significant difference between snapper and cobia at each inclusion level of lupin meal (P < 0.05). DM, Dry matter.
The dietary lupin meal had no significant effect on the whole body protein of snapper,
whereas the whole body protein contents of the cobia fed the LKM315 and LKM420
diets were significantly lower than those of the fish in other groups. The snapper fed
diets containing more than 105 g/kg LKM showed reduced muscle protein, whereas this
75
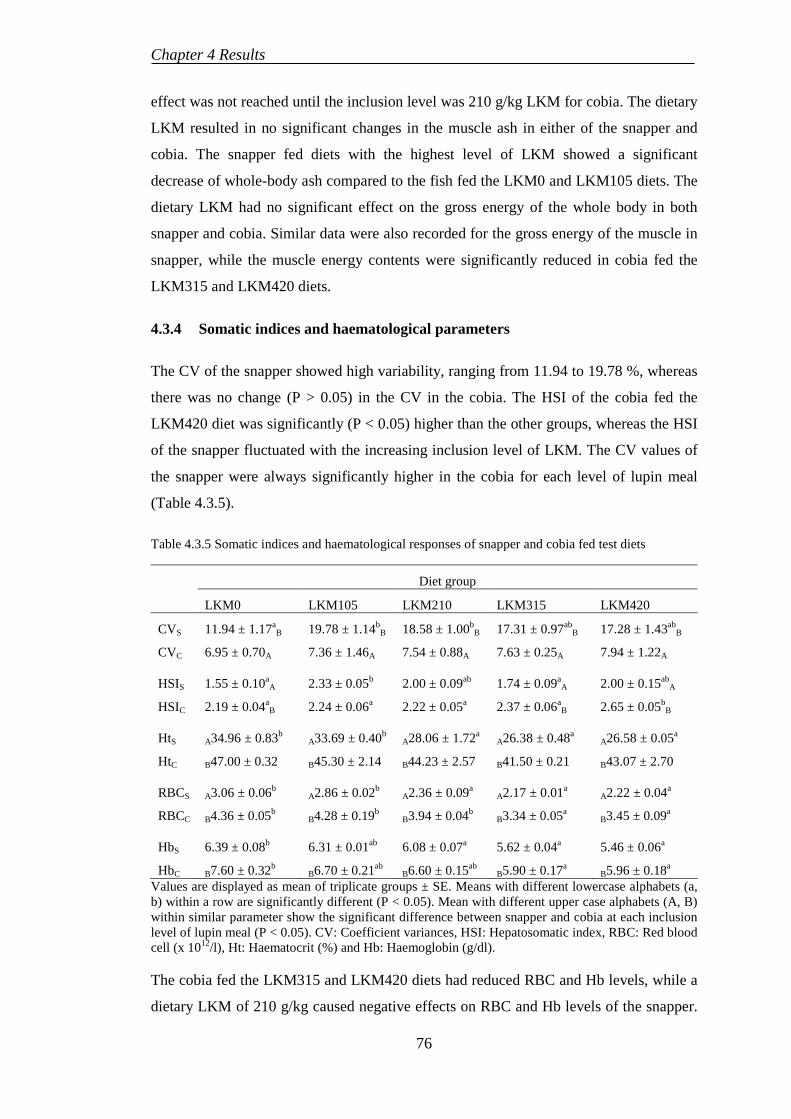
Chapter 4 Results
effect was not reached until the inclusion level was 210 g/kg LKM for cobia. The dietary
LKM resulted in no significant changes in the muscle ash in either of the snapper and
cobia. The snapper fed diets with the highest level of LKM showed a significant
decrease of whole-body ash compared to the fish fed the LKM0 and LKM105 diets. The
dietary LKM had no significant effect on the gross energy of the whole body in both
snapper and cobia. Similar data were also recorded for the gross energy of the muscle in
snapper, while the muscle energy contents were significantly reduced in cobia fed the
LKM315 and LKM420 diets.
4.3.4 Somatic indices and haematological parameters
The CV of the snapper showed high variability, ranging from 11.94 to 19.78 %, whereas
there was no change (P > 0.05) in the CV in the cobia. The HSI of the cobia fed the
LKM420 diet was significantly (P < 0.05) higher than the other groups, whereas the HSI
of the snapper fluctuated with the increasing inclusion level of LKM. The CV values of
the snapper were always significantly higher in the cobia for each level of lupin meal
(Table 4.3.5).
Table 4.3.5 Somatic indices and haematological responses of snapper and cobia fed test diets
Diet group
LKM0 LKM105 LKM210 LKM315 LKM420
CVS 11.94 ± 1.17aB 19.78 ± 1.14b
B 18.58 ± 1.00bB 17.31 ± 0.97ab
B 17.28 ± 1.43abB
CVC 6.95 ± 0.70A 7.36 ± 1.46A 7.54 ± 0.88A 7.63 ± 0.25A 7.94 ± 1.22A
HSIS 1.55 ± 0.10aA 2.33 ± 0.05b 2.00 ± 0.09ab 1.74 ± 0.09a
A 2.00 ± 0.15abA
HSIC 2.19 ± 0.04aB 2.24 ± 0.06a 2.22 ± 0.05a 2.37 ± 0.06a
B 2.65 ± 0.05bB
HtS A34.96 ± 0.83b A33.69 ± 0.40b
A28.06 ± 1.72a A26.38 ± 0.48a
A26.58 ± 0.05a
HtC B47.00 ± 0.32 B45.30 ± 2.14
B44.23 ± 2.57 B41.50 ± 0.21
B43.07 ± 2.70
RBCS A3.06 ± 0.06b A2.86 ± 0.02b
A2.36 ± 0.09a A2.17 ± 0.01a
A2.22 ± 0.04a
RBCC B4.36 ± 0.05b B4.28 ± 0.19b
B3.94 ± 0.04b B3.34 ± 0.05a
B3.45 ± 0.09a
HbS 6.39 ± 0.08b 6.31 ± 0.01ab 6.08 ± 0.07a 5.62 ± 0.04a 5.46 ± 0.06a
HbC B7.60 ± 0.32b B6.70 ± 0.21ab
B6.60 ± 0.15ab B5.90 ± 0.17a
B5.96 ± 0.18a
Values are displayed as mean of triplicate groups ± SE. Means with different lowercase alphabets (a, b) within a row are significantly different (P < 0.05). Mean with different upper case alphabets (A, B) within similar parameter show the significant difference between snapper and cobia at each inclusion level of lupin meal (P < 0.05). CV: Coefficient variances, HSI: Hepatosomatic index, RBC: Red blood cell (x 1012/l), Ht: Haematocrit (%) and Hb: Haemoglobin (g/dl).
The cobia fed the LKM315 and LKM420 diets had reduced RBC and Hb levels, while a
dietary LKM of 210 g/kg caused negative effects on RBC and Hb levels of the snapper.
76
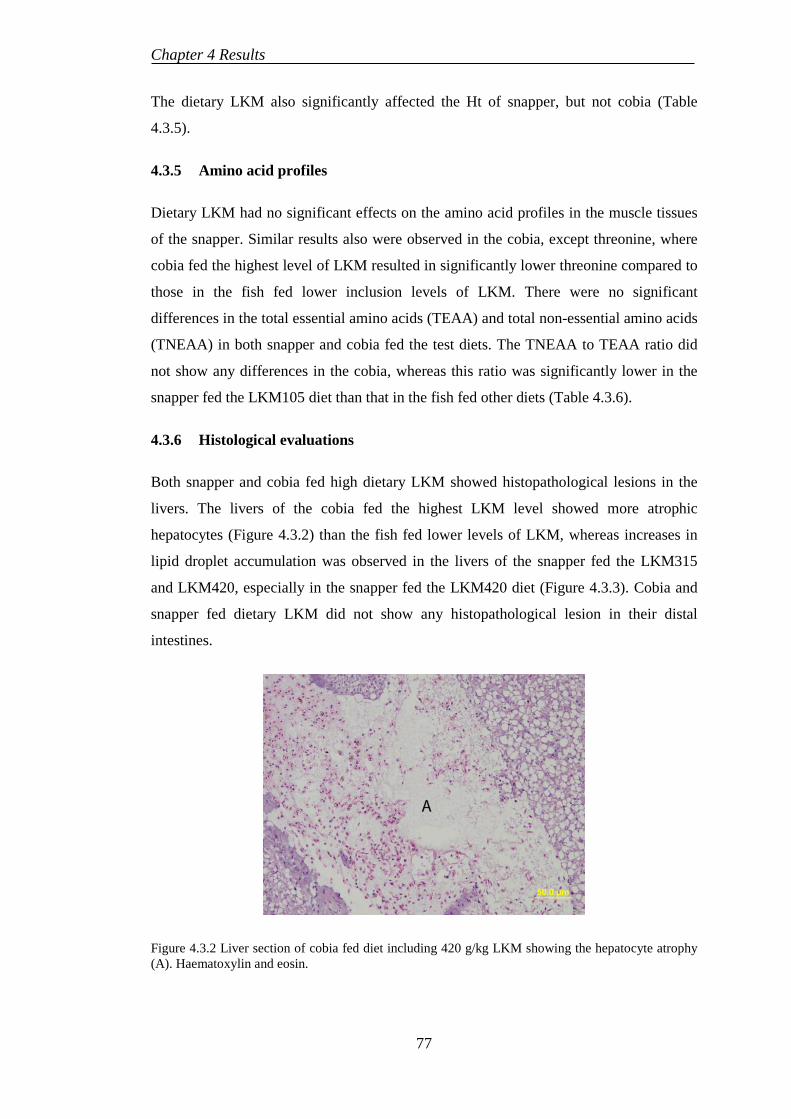
Chapter 4 Results
The dietary LKM also significantly affected the Ht of snapper, but not cobia (Table
4.3.5).
4.3.5 Amino acid profiles
Dietary LKM had no significant effects on the amino acid profiles in the muscle tissues
of the snapper. Similar results also were observed in the cobia, except threonine, where
cobia fed the highest level of LKM resulted in significantly lower threonine compared to
those in the fish fed lower inclusion levels of LKM. There were no significant
differences in the total essential amino acids (TEAA) and total non-essential amino acids
(TNEAA) in both snapper and cobia fed the test diets. The TNEAA to TEAA ratio did
not show any differences in the cobia, whereas this ratio was significantly lower in the
snapper fed the LKM105 diet than that in the fish fed other diets (Table 4.3.6).
4.3.6 Histological evaluations
Both snapper and cobia fed high dietary LKM showed histopathological lesions in the
livers. The livers of the cobia fed the highest LKM level showed more atrophic
hepatocytes (Figure 4.3.2) than the fish fed lower levels of LKM, whereas increases in
lipid droplet accumulation was observed in the livers of the snapper fed the LKM315
and LKM420, especially in the snapper fed the LKM420 diet (Figure 4.3.3). Cobia and
snapper fed dietary LKM did not show any histopathological lesion in their distal
intestines.
Figure 4.3.2 Liver section of cobia fed diet including 420 g/kg LKM showing the hepatocyte atrophy (A). Haematoxylin and eosin.
77
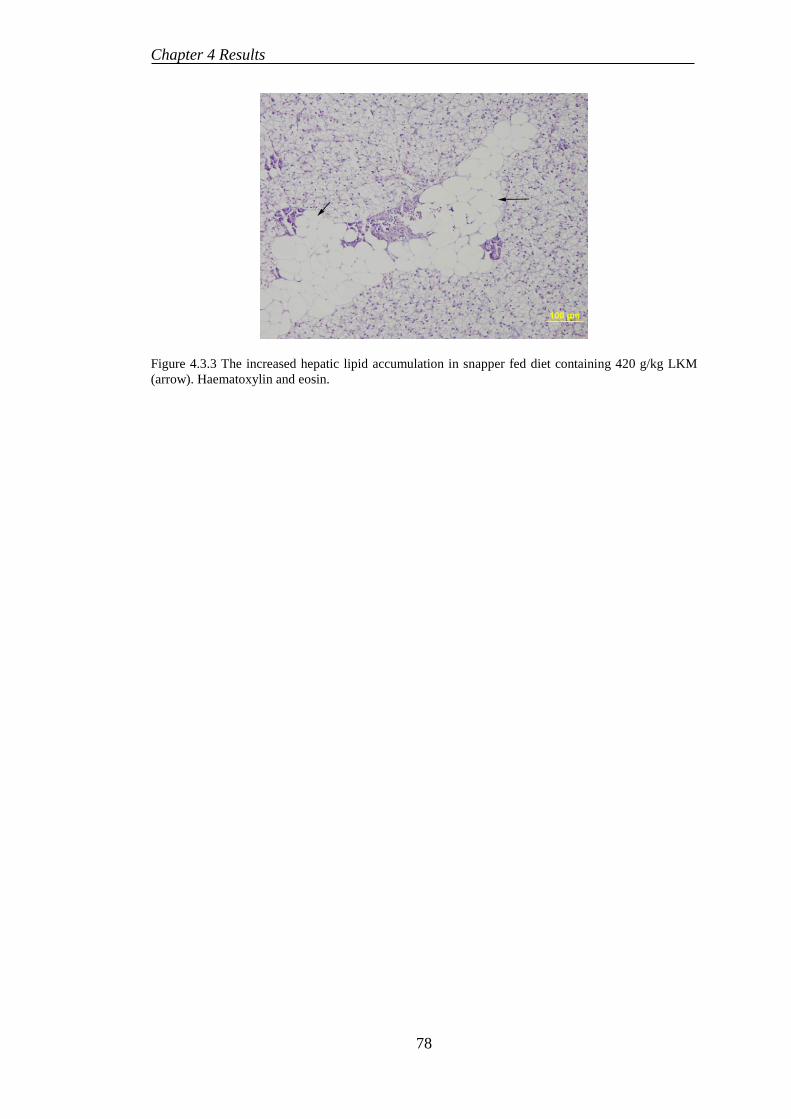
Chapter 4 Results
Figure 4.3.3 The increased hepatic lipid accumulation in snapper fed diet containing 420 g/kg LKM (arrow). Haematoxylin and eosin.
78
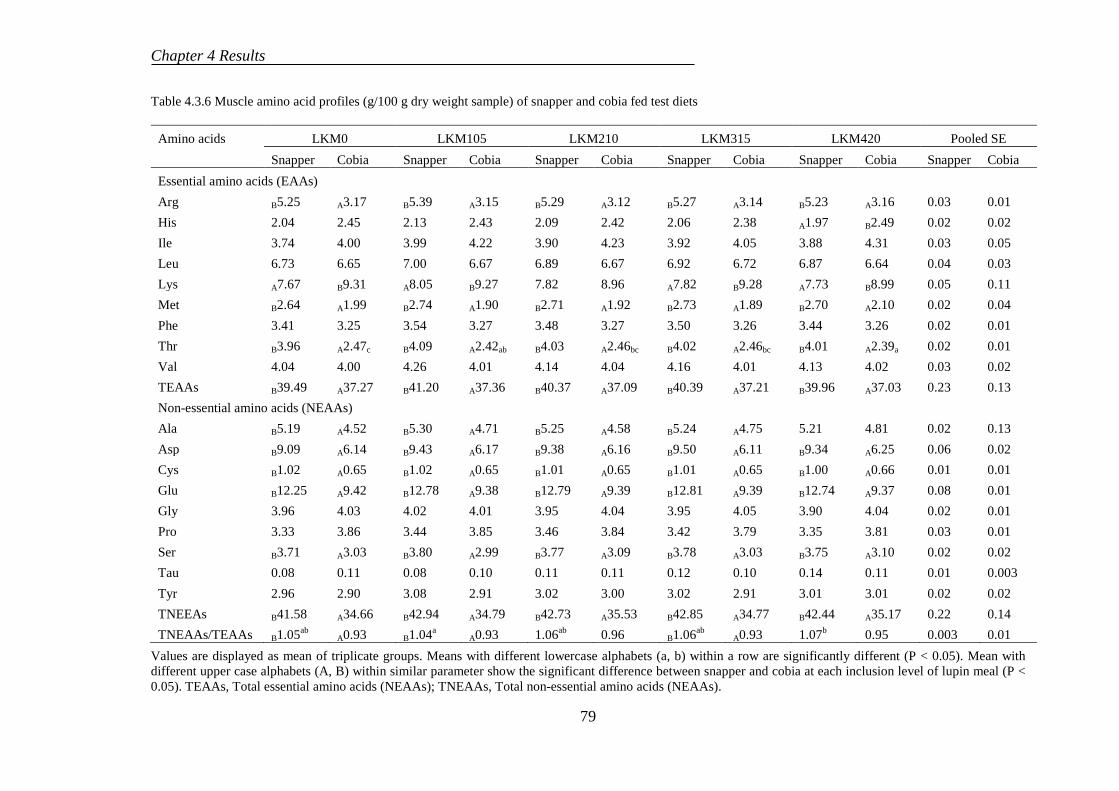
Chapter 4 Results
Table 4.3.6 Muscle amino acid profiles (g/100 g dry weight sample) of snapper and cobia fed test diets
Amino acids LKM0 LKM105 LKM210 LKM315 LKM420 Pooled SE Snapper Cobia Snapper Cobia Snapper Cobia Snapper Cobia Snapper Cobia Snapper Cobia
Essential amino acids (EAAs) Arg B5.25 A3.17 B5.39 A3.15 B5.29 A3.12 B5.27 A3.14 B5.23 A3.16 0.03 0.01 His 2.04 2.45 2.13 2.43 2.09 2.42 2.06 2.38 A1.97 B2.49 0.02 0.02 Ile 3.74 4.00 3.99 4.22 3.90 4.23 3.92 4.05 3.88 4.31 0.03 0.05 Leu 6.73 6.65 7.00 6.67 6.89 6.67 6.92 6.72 6.87 6.64 0.04 0.03 Lys A7.67 B9.31 A8.05 B9.27 7.82 8.96 A7.82 B9.28 A7.73 B8.99 0.05 0.11 Met B2.64 A1.99 B2.74 A1.90 B2.71 A1.92 B2.73 A1.89 B2.70 A2.10 0.02 0.04 Phe 3.41 3.25 3.54 3.27 3.48 3.27 3.50 3.26 3.44 3.26 0.02 0.01 Thr B3.96 A2.47c B4.09 A2.42ab B4.03 A2.46bc B4.02 A2.46bc B4.01 A2.39a 0.02 0.01 Val 4.04 4.00 4.26 4.01 4.14 4.04 4.16 4.01 4.13 4.02 0.03 0.02 TEAAs B39.49 A37.27 B41.20 A37.36 B40.37 A37.09 B40.39 A37.21 B39.96 A37.03 0.23 0.13 Non-essential amino acids (NEAAs) Ala B5.19 A4.52 B5.30 A4.71 B5.25 A4.58 B5.24 A4.75 5.21 4.81 0.02 0.13 Asp B9.09 A6.14 B9.43 A6.17 B9.38 A6.16 B9.50 A6.11 B9.34 A6.25 0.06 0.02 Cys B1.02 A0.65 B1.02 A0.65 B1.01 A0.65 B1.01 A0.65 B1.00 A0.66 0.01 0.01 Glu B12.25 A9.42 B12.78 A9.38 B12.79 A9.39 B12.81 A9.39 B12.74 A9.37 0.08 0.01 Gly 3.96 4.03 4.02 4.01 3.95 4.04 3.95 4.05 3.90 4.04 0.02 0.01 Pro 3.33 3.86 3.44 3.85 3.46 3.84 3.42 3.79 3.35 3.81 0.03 0.01 Ser B3.71 A3.03 B3.80 A2.99 B3.77 A3.09 B3.78 A3.03 B3.75 A3.10 0.02 0.02 Tau 0.08 0.11 0.08 0.10 0.11 0.11 0.12 0.10 0.14 0.11 0.01 0.003 Tyr 2.96 2.90 3.08 2.91 3.02 3.00 3.02 2.91 3.01 3.01 0.02 0.02 TNEEAs B41.58 A34.66 B42.94 A34.79 B42.73 A35.53 B42.85 A34.77 B42.44 A35.17 0.22 0.14 TNEAAs/TEAAs B1.05ab A0.93
B1.04a A0.93 1.06ab 0.96 B1.06ab A0.93 1.07b 0.95 0.003 0.01 Values are displayed as mean of triplicate groups. Means with different lowercase alphabets (a, b) within a row are significantly different (P < 0.05). Mean with different upper case alphabets (A, B) within similar parameter show the significant difference between snapper and cobia at each inclusion level of lupin meal (P < 0.05). TEAAs, Total essential amino acids (NEAAs); TNEAAs, Total non-essential amino acids (NEAAs).
79
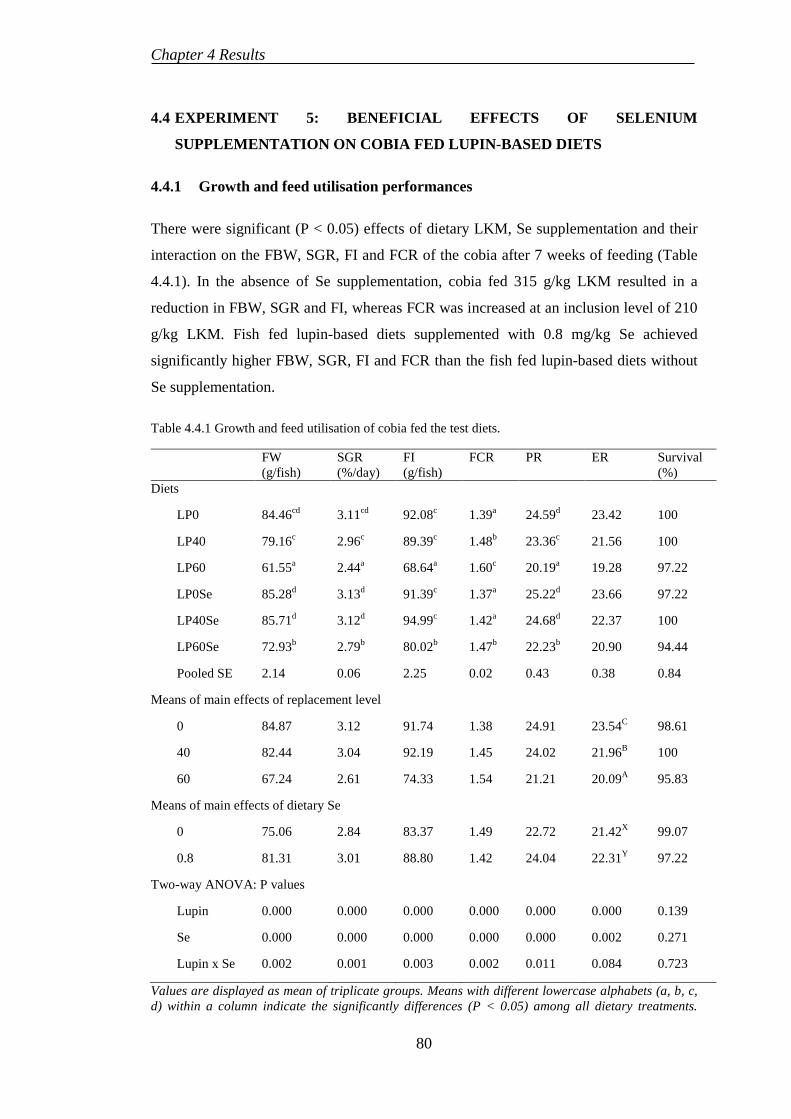
Chapter 4 Results
4.4 EXPERIMENT 5: BENEFICIAL EFFECTS OF SELENIUM
SUPPLEMENTATION ON COBIA FED LUPIN-BASED DIETS
4.4.1 Growth and feed utilisation performances
There were significant (P < 0.05) effects of dietary LKM, Se supplementation and their
interaction on the FBW, SGR, FI and FCR of the cobia after 7 weeks of feeding (Table
4.4.1). In the absence of Se supplementation, cobia fed 315 g/kg LKM resulted in a
reduction in FBW, SGR and FI, whereas FCR was increased at an inclusion level of 210
g/kg LKM. Fish fed lupin-based diets supplemented with 0.8 mg/kg Se achieved
significantly higher FBW, SGR, FI and FCR than the fish fed lupin-based diets without
Se supplementation.
Table 4.4.1 Growth and feed utilisation of cobia fed the test diets.
FW (g/fish)
SGR (%/day)
FI (g/fish)
FCR PR ER Survival (%)
Diets
LP0 84.46cd 3.11cd 92.08c 1.39a 24.59d 23.42 100
LP40 79.16c 2.96c 89.39c 1.48b 23.36c 21.56 100
LP60 61.55a 2.44a 68.64a 1.60c 20.19a 19.28 97.22
LP0Se 85.28d 3.13d 91.39c 1.37a 25.22d 23.66 97.22
LP40Se 85.71d 3.12d 94.99c 1.42a 24.68d 22.37 100
LP60Se 72.93b 2.79b 80.02b 1.47b 22.23b 20.90 94.44
Pooled SE 2.14 0.06 2.25 0.02 0.43 0.38 0.84
Means of main effects of replacement level
0 84.87 3.12 91.74 1.38 24.91 23.54C 98.61
40 82.44 3.04 92.19 1.45 24.02 21.96B 100
60 67.24 2.61 74.33 1.54 21.21 20.09A 95.83
Means of main effects of dietary Se
0 75.06 2.84 83.37 1.49 22.72 21.42X 99.07
0.8 81.31 3.01 88.80 1.42 24.04 22.31Y 97.22
Two-way ANOVA: P values
Lupin 0.000 0.000 0.000 0.000 0.000 0.000 0.139
Se 0.000 0.000 0.000 0.000 0.000 0.002 0.271
Lupin x Se 0.002 0.001 0.003 0.002 0.011 0.084 0.723
Values are displayed as mean of triplicate groups. Means with different lowercase alphabets (a, b, c, d) within a column indicate the significantly differences (P < 0.05) among all dietary treatments.
80
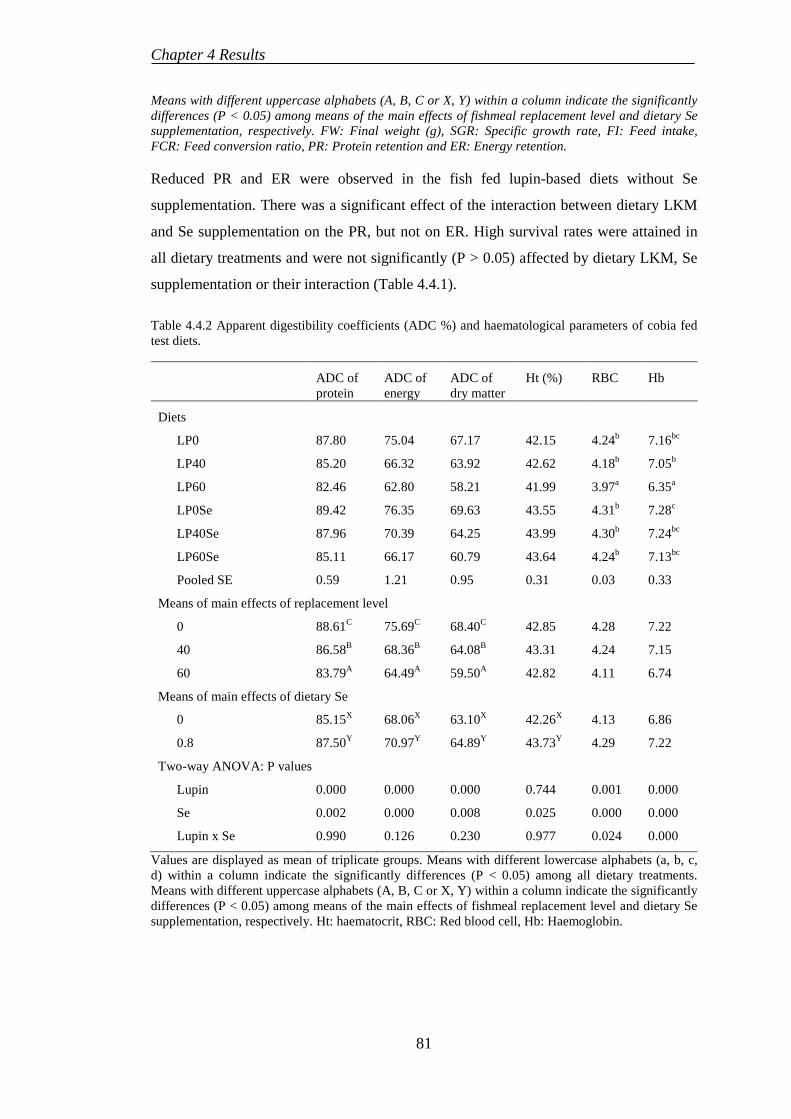
Chapter 4 Results
Means with different uppercase alphabets (A, B, C or X, Y) within a column indicate the significantly differences (P < 0.05) among means of the main effects of fishmeal replacement level and dietary Se supplementation, respectively. FW: Final weight (g), SGR: Specific growth rate, FI: Feed intake, FCR: Feed conversion ratio, PR: Protein retention and ER: Energy retention.
Reduced PR and ER were observed in the fish fed lupin-based diets without Se
supplementation. There was a significant effect of the interaction between dietary LKM
and Se supplementation on the PR, but not on ER. High survival rates were attained in
all dietary treatments and were not significantly (P > 0.05) affected by dietary LKM, Se
supplementation or their interaction (Table 4.4.1).
Table 4.4.2 Apparent digestibility coefficients (ADC %) and haematological parameters of cobia fed test diets.
ADC of protein
ADC of energy
ADC of dry matter
Ht (%) RBC Hb
Diets
LP0 87.80 75.04 67.17 42.15 4.24b 7.16bc
LP40 85.20 66.32 63.92 42.62 4.18b 7.05b
LP60 82.46 62.80 58.21 41.99 3.97a 6.35a
LP0Se 89.42 76.35 69.63 43.55 4.31b 7.28c
LP40Se 87.96 70.39 64.25 43.99 4.30b 7.24bc
LP60Se 85.11 66.17 60.79 43.64 4.24b 7.13bc
Pooled SE 0.59 1.21 0.95 0.31 0.03 0.33
Means of main effects of replacement level
0 88.61C 75.69C 68.40C 42.85 4.28 7.22
40 86.58B 68.36B 64.08B 43.31 4.24 7.15
60 83.79A 64.49A 59.50A 42.82 4.11 6.74
Means of main effects of dietary Se
0 85.15X 68.06X 63.10X 42.26X 4.13 6.86
0.8 87.50Y 70.97Y 64.89Y 43.73Y 4.29 7.22
Two-way ANOVA: P values
Lupin 0.000 0.000 0.000 0.744 0.001 0.000
Se 0.002 0.000 0.008 0.025 0.000 0.000
Lupin x Se 0.990 0.126 0.230 0.977 0.024 0.000
Values are displayed as mean of triplicate groups. Means with different lowercase alphabets (a, b, c, d) within a column indicate the significantly differences (P < 0.05) among all dietary treatments. Means with different uppercase alphabets (A, B, C or X, Y) within a column indicate the significantly differences (P < 0.05) among means of the main effects of fishmeal replacement level and dietary Se supplementation, respectively. Ht: haematocrit, RBC: Red blood cell, Hb: Haemoglobin.
81
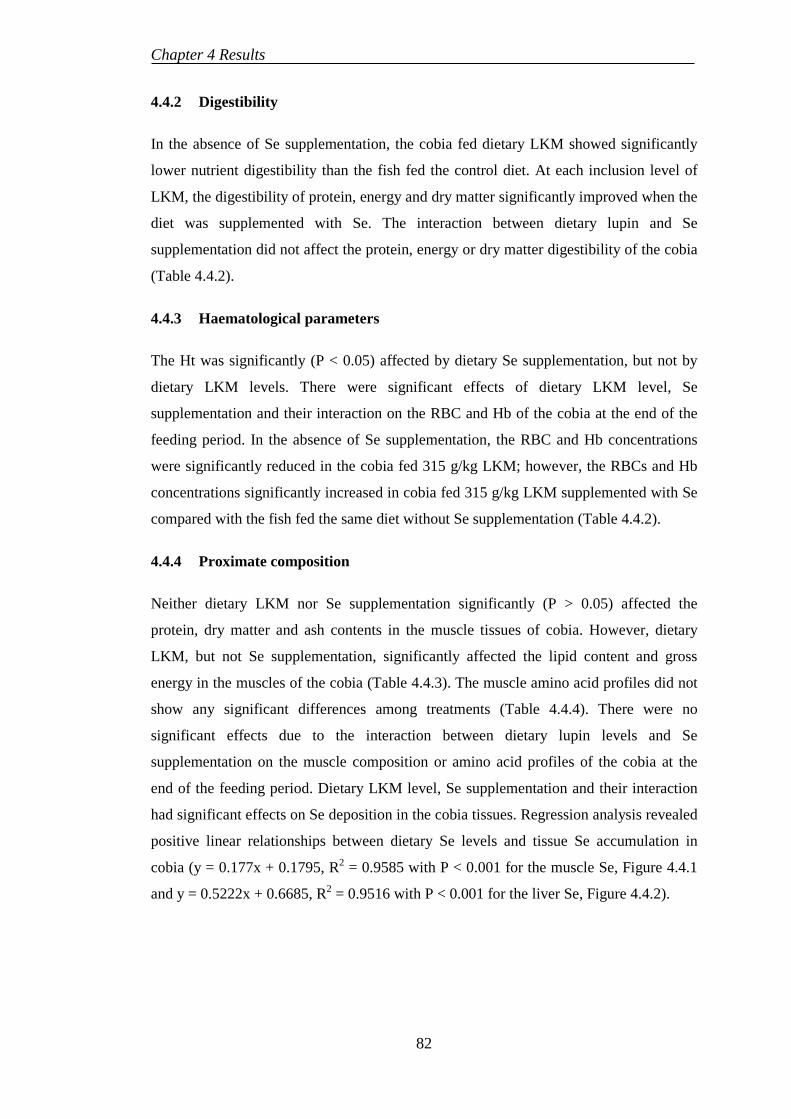
Chapter 4 Results
4.4.2 Digestibility
In the absence of Se supplementation, the cobia fed dietary LKM showed significantly
lower nutrient digestibility than the fish fed the control diet. At each inclusion level of
LKM, the digestibility of protein, energy and dry matter significantly improved when the
diet was supplemented with Se. The interaction between dietary lupin and Se
supplementation did not affect the protein, energy or dry matter digestibility of the cobia
(Table 4.4.2).
4.4.3 Haematological parameters
The Ht was significantly (P < 0.05) affected by dietary Se supplementation, but not by
dietary LKM levels. There were significant effects of dietary LKM level, Se
supplementation and their interaction on the RBC and Hb of the cobia at the end of the
feeding period. In the absence of Se supplementation, the RBC and Hb concentrations
were significantly reduced in the cobia fed 315 g/kg LKM; however, the RBCs and Hb
concentrations significantly increased in cobia fed 315 g/kg LKM supplemented with Se
compared with the fish fed the same diet without Se supplementation (Table 4.4.2).
4.4.4 Proximate composition
Neither dietary LKM nor Se supplementation significantly (P > 0.05) affected the
protein, dry matter and ash contents in the muscle tissues of cobia. However, dietary
LKM, but not Se supplementation, significantly affected the lipid content and gross
energy in the muscles of the cobia (Table 4.4.3). The muscle amino acid profiles did not
show any significant differences among treatments (Table 4.4.4). There were no
significant effects due to the interaction between dietary lupin levels and Se
supplementation on the muscle composition or amino acid profiles of the cobia at the
end of the feeding period. Dietary LKM level, Se supplementation and their interaction
had significant effects on Se deposition in the cobia tissues. Regression analysis revealed
positive linear relationships between dietary Se levels and tissue Se accumulation in
cobia (y = 0.177x + 0.1795, R2 = 0.9585 with P < 0.001 for the muscle Se, Figure 4.4.1
and y = 0.5222x + 0.6685, R2 = 0.9516 with P < 0.001 for the liver Se, Figure 4.4.2).
82
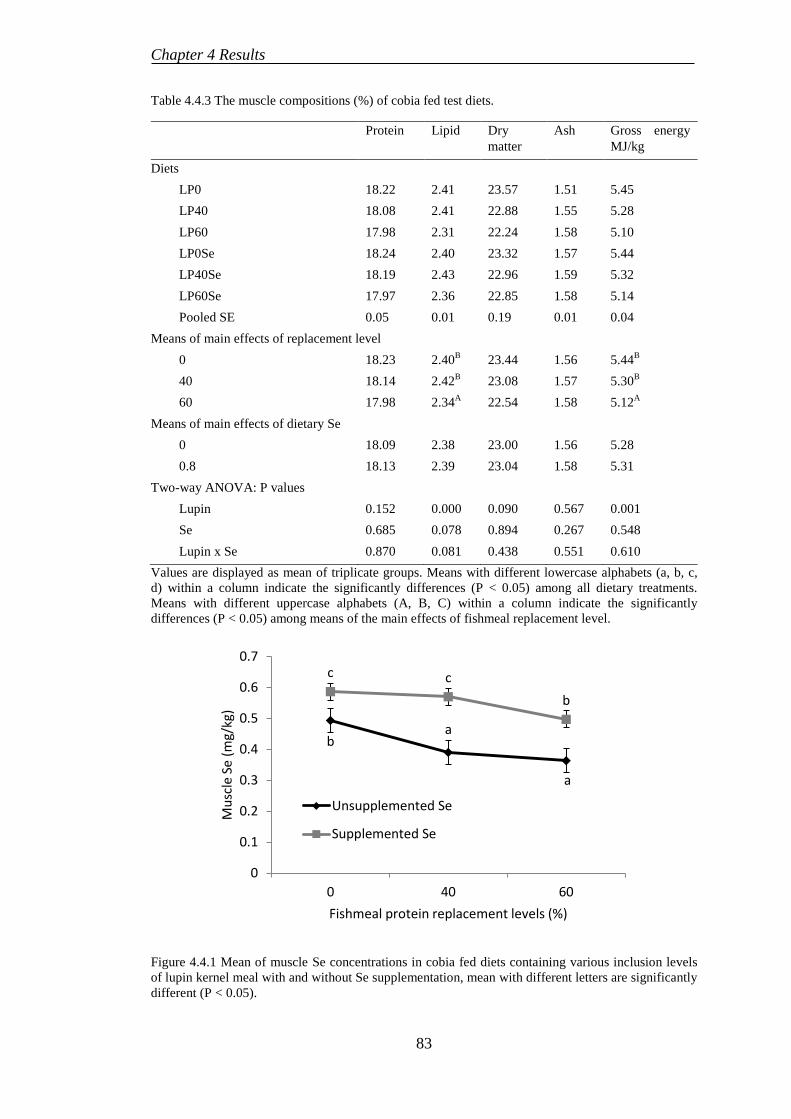
Chapter 4 Results
Table 4.4.3 The muscle compositions (%) of cobia fed test diets.
Protein Lipid Dry matter
Ash Gross energy MJ/kg
Diets LP0 18.22 2.41 23.57 1.51 5.45
LP40 18.08 2.41 22.88 1.55 5.28
LP60 17.98 2.31 22.24 1.58 5.10
LP0Se 18.24 2.40 23.32 1.57 5.44
LP40Se 18.19 2.43 22.96 1.59 5.32
LP60Se 17.97 2.36 22.85 1.58 5.14
Pooled SE 0.05 0.01 0.19 0.01 0.04 Means of main effects of replacement level
0 18.23 2.40B 23.44 1.56 5.44B
40 18.14 2.42B 23.08 1.57 5.30B
60 17.98 2.34A 22.54 1.58 5.12A
Means of main effects of dietary Se 0 18.09 2.38 23.00 1.56 5.28 0.8 18.13 2.39 23.04 1.58 5.31
Two-way ANOVA: P values Lupin 0.152 0.000 0.090 0.567 0.001 Se 0.685 0.078 0.894 0.267 0.548 Lupin x Se 0.870 0.081 0.438 0.551 0.610
Values are displayed as mean of triplicate groups. Means with different lowercase alphabets (a, b, c, d) within a column indicate the significantly differences (P < 0.05) among all dietary treatments. Means with different uppercase alphabets (A, B, C) within a column indicate the significantly differences (P < 0.05) among means of the main effects of fishmeal replacement level.
Figure 4.4.1 Mean of muscle Se concentrations in cobia fed diets containing various inclusion levels of lupin kernel meal with and without Se supplementation, mean with different letters are significantly different (P < 0.05).
b a
a
c c b
0
0.1
0.2
0.3
0.4
0.5
0.6
0.7
0 40 60
Mus
cle
Se (m
g/kg
)
Fishmeal protein replacement levels (%)
Unsupplemented Se
Supplemented Se
83
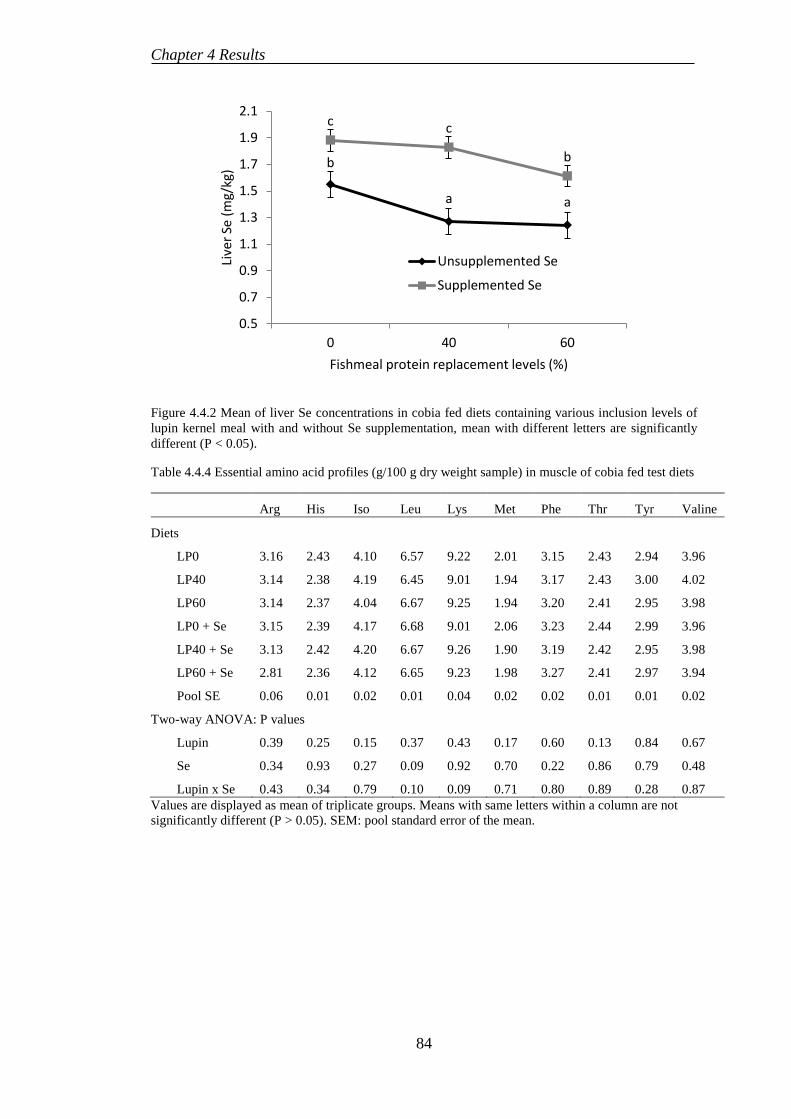
Chapter 4 Results
Figure 4.4.2 Mean of liver Se concentrations in cobia fed diets containing various inclusion levels of lupin kernel meal with and without Se supplementation, mean with different letters are significantly different (P < 0.05).
Table 4.4.4 Essential amino acid profiles (g/100 g dry weight sample) in muscle of cobia fed test diets
Arg His Iso Leu Lys Met Phe Thr Tyr Valine
Diets
LP0 3.16 2.43 4.10 6.57 9.22 2.01 3.15 2.43 2.94 3.96
LP40 3.14 2.38 4.19 6.45 9.01 1.94 3.17 2.43 3.00 4.02
LP60 3.14 2.37 4.04 6.67 9.25 1.94 3.20 2.41 2.95 3.98
LP0 + Se 3.15 2.39 4.17 6.68 9.01 2.06 3.23 2.44 2.99 3.96
LP40 + Se 3.13 2.42 4.20 6.67 9.26 1.90 3.19 2.42 2.95 3.98
LP60 + Se 2.81 2.36 4.12 6.65 9.23 1.98 3.27 2.41 2.97 3.94
Pool SE 0.06 0.01 0.02 0.01 0.04 0.02 0.02 0.01 0.01 0.02
Two-way ANOVA: P values
Lupin 0.39 0.25 0.15 0.37 0.43 0.17 0.60 0.13 0.84 0.67
Se 0.34 0.93 0.27 0.09 0.92 0.70 0.22 0.86 0.79 0.48
Lupin x Se 0.43 0.34 0.79 0.10 0.09 0.71 0.80 0.89 0.28 0.87 Values are displayed as mean of triplicate groups. Means with same letters within a column are not significantly different (P > 0.05). SEM: pool standard error of the mean.
b
a a
c c
b
0.5
0.7
0.9
1.1
1.3
1.5
1.7
1.9
2.1
0 40 60
Live
r Se
(mg/
kg)
Fishmeal protein replacement levels (%)
Unsupplemented Se
Supplemented Se
84
Chapter 5 Discussions
CHAPTER 5. DISCUSSIONS
5.1. INTRODUCTION
Se, a trace element was first explored by Jons Jacob Berzelius in 1817 (Terry &
Diamond, 2012). In periodic table of elements, Se is collocated between sulphur and
tellurium in Group Iva, and has atomic number and weight of 34 and 78.971,
respectively (Foster & Sumar, 1997). Se had been well known to be a toxic mineral for
animals during 1930 – 1940s (Terry & Diamond, 2012) before its beneficially biological
effect in preventing the hepatic necrosis in rats was discovered (Schwarz & Foltz, 1958).
As both Se and sulphur have similar chemical properties; Se can easily replace sulphur
to form different Se compounds (Barceloux, 1999). The incorporation of Se into proteins
was established by Rotruck et al. (1973), and more than ten selenoproteins in forms of
GPx and iodothyronine deiodinases have been identified (Luten et al., 2008).
The necessity of Se in maintaining normal growth and physiological functions have been
demonstrated in fish due to its important role as a cofactor in GPx enzyme, protecting
cell membranes against oxidative damage (Lin & Shiau, 2005; Watanabe et al., 1997).
The deficiency of Se can lead to reduced growth, feed utilisation (Lin & Shiau, 2005;
Liu et al., 2010) and health status (Liu et al., 2010) in farmed fish. Whereas fish fed
elevated dietary Se levels results in reduced feed utilisation and adverse effects on
physiological performance and impaired histology (Le & Fotedar, 2014b; Lee et al.,
2008; Lee et al., 2010; Tashjian et al., 2006; Teh et al., 2004). Due to the narrow gap
between deficiency, optimality and toxicity of Se level, it is imperative to find out the
exact dietary requirement, bioavailability and the source of dietary Se for any aquatic
species.
Due to the complexity of the Se availabilities in feedstuffs, past investigations have used
casein as a sole protein source in the purified or semi-purified diets to quantify dietary
Se requirement for fish (Hilton et al., 1980; Lee et al., 2008; Lin, 2014; Lin & Shiau,
2005; Liu et al., 2010). However, fish fed these diets generally requires relatively lower
dietary Se levels than for the fish fed commercial or formulated basal diets (Table 5.1.1).
The high cost of casein and the reduced growth in fish fed casein-based diets than
fishmeal-based diets make casein-based diet a non-practical under commercial culture
environment. Though, Watanabe et al. (1997) stated that the Se concentration in
fishmeal could provide adequate Se to meet the Se demand in fish but due to its
significantly lower digestibility than other organic Se forms (Bell & Cowey, 1989; Le &
85
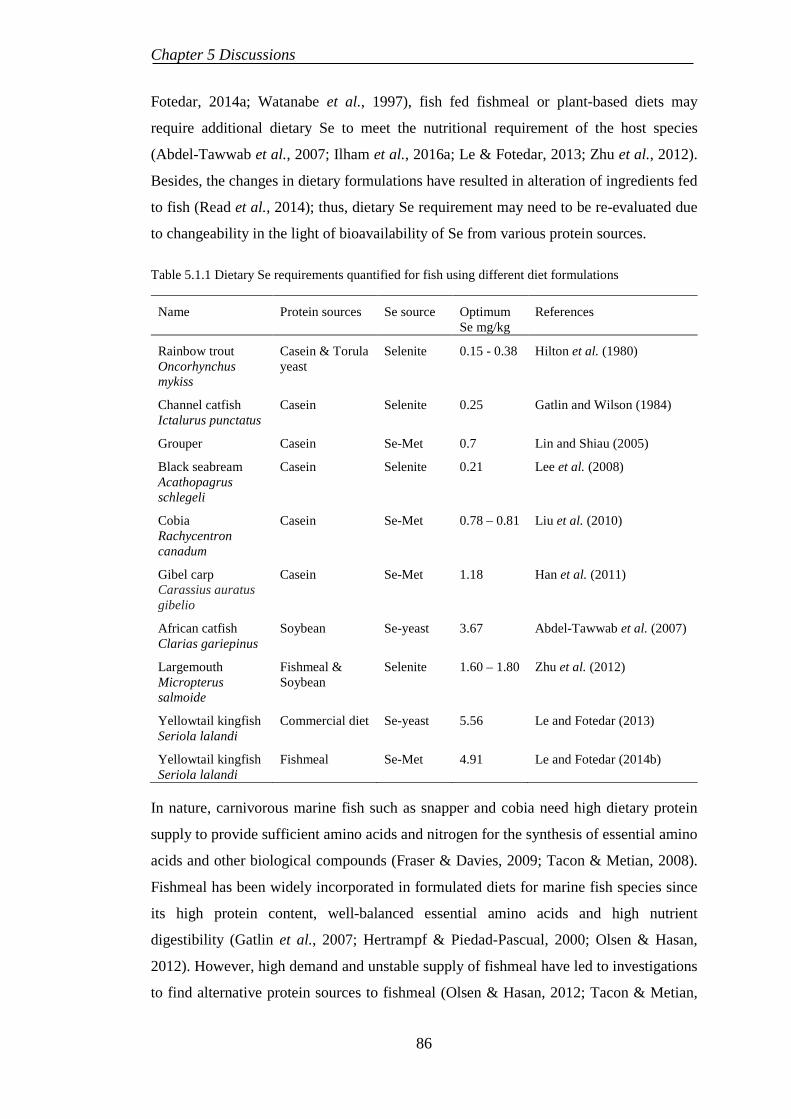
Chapter 5 Discussions
Fotedar, 2014a; Watanabe et al., 1997), fish fed fishmeal or plant-based diets may
require additional dietary Se to meet the nutritional requirement of the host species
(Abdel-Tawwab et al., 2007; Ilham et al., 2016a; Le & Fotedar, 2013; Zhu et al., 2012).
Besides, the changes in dietary formulations have resulted in alteration of ingredients fed
to fish (Read et al., 2014); thus, dietary Se requirement may need to be re-evaluated due
to changeability in the light of bioavailability of Se from various protein sources.
Table 5.1.1 Dietary Se requirements quantified for fish using different diet formulations
Name Protein sources Se source Optimum Se mg/kg
References
Rainbow trout Oncorhynchus mykiss
Casein & Torula yeast
Selenite 0.15 - 0.38 Hilton et al. (1980)
Channel catfish Ictalurus punctatus
Casein Selenite 0.25 Gatlin and Wilson (1984)
Grouper Casein Se-Met 0.7 Lin and Shiau (2005)
Black seabream Acathopagrus schlegeli
Casein Selenite 0.21 Lee et al. (2008)
Cobia Rachycentron canadum
Casein Se-Met 0.78 – 0.81 Liu et al. (2010)
Gibel carp Carassius auratus gibelio
Casein Se-Met 1.18 Han et al. (2011)
African catfish Clarias gariepinus
Soybean Se-yeast 3.67 Abdel-Tawwab et al. (2007)
Largemouth Micropterus salmoide
Fishmeal & Soybean
Selenite 1.60 – 1.80 Zhu et al. (2012)
Yellowtail kingfish Seriola lalandi
Commercial diet Se-yeast 5.56 Le and Fotedar (2013)
Yellowtail kingfish Seriola lalandi
Fishmeal Se-Met 4.91 Le and Fotedar (2014b)
In nature, carnivorous marine fish such as snapper and cobia need high dietary protein
supply to provide sufficient amino acids and nitrogen for the synthesis of essential amino
acids and other biological compounds (Fraser & Davies, 2009; Tacon & Metian, 2008).
Fishmeal has been widely incorporated in formulated diets for marine fish species since
its high protein content, well-balanced essential amino acids and high nutrient
digestibility (Gatlin et al., 2007; Hertrampf & Piedad-Pascual, 2000; Olsen & Hasan,
2012). However, high demand and unstable supply of fishmeal have led to investigations
to find alternative protein sources to fishmeal (Olsen & Hasan, 2012; Tacon & Metian,
86
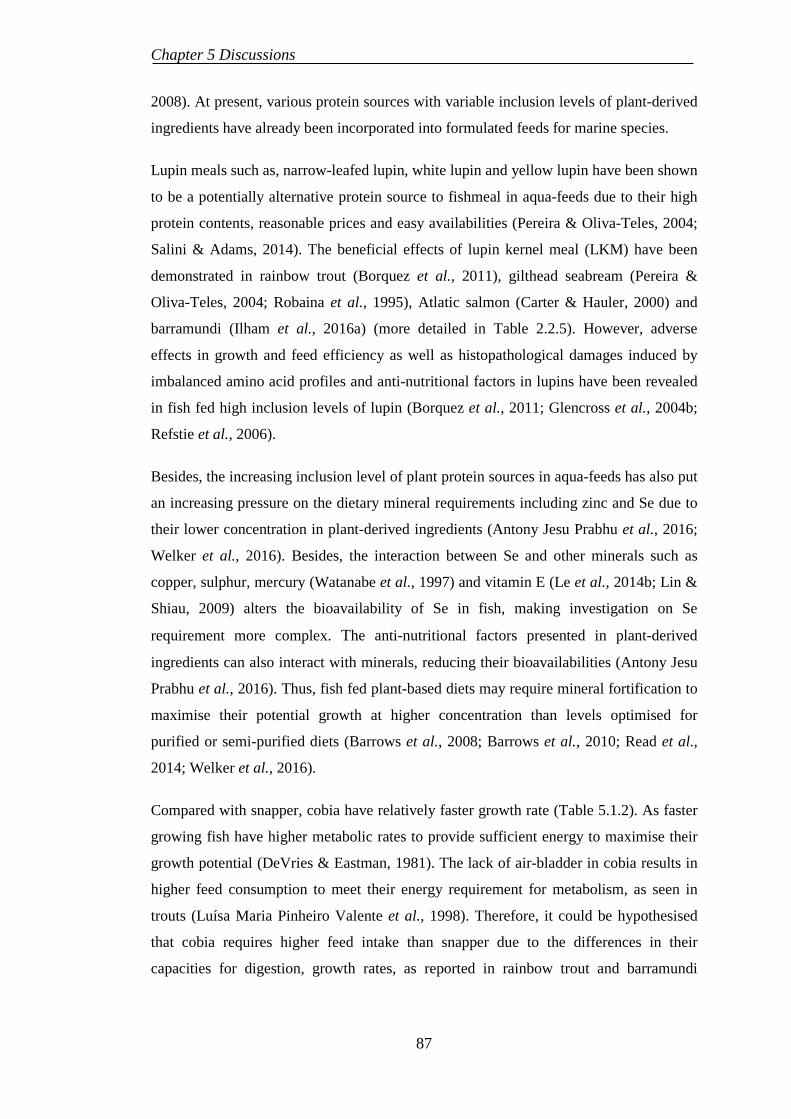
Chapter 5 Discussions
2008). At present, various protein sources with variable inclusion levels of plant-derived
ingredients have already been incorporated into formulated feeds for marine species.
Lupin meals such as, narrow-leafed lupin, white lupin and yellow lupin have been shown
to be a potentially alternative protein source to fishmeal in aqua-feeds due to their high
protein contents, reasonable prices and easy availabilities (Pereira & Oliva-Teles, 2004;
Salini & Adams, 2014). The beneficial effects of lupin kernel meal (LKM) have been
demonstrated in rainbow trout (Borquez et al., 2011), gilthead seabream (Pereira &
Oliva-Teles, 2004; Robaina et al., 1995), Atlatic salmon (Carter & Hauler, 2000) and
barramundi (Ilham et al., 2016a) (more detailed in Table 2.2.5). However, adverse
effects in growth and feed efficiency as well as histopathological damages induced by
imbalanced amino acid profiles and anti-nutritional factors in lupins have been revealed
in fish fed high inclusion levels of lupin (Borquez et al., 2011; Glencross et al., 2004b;
Refstie et al., 2006).
Besides, the increasing inclusion level of plant protein sources in aqua-feeds has also put
an increasing pressure on the dietary mineral requirements including zinc and Se due to
their lower concentration in plant-derived ingredients (Antony Jesu Prabhu et al., 2016;
Welker et al., 2016). Besides, the interaction between Se and other minerals such as
copper, sulphur, mercury (Watanabe et al., 1997) and vitamin E (Le et al., 2014b; Lin &
Shiau, 2009) alters the bioavailability of Se in fish, making investigation on Se
requirement more complex. The anti-nutritional factors presented in plant-derived
ingredients can also interact with minerals, reducing their bioavailabilities (Antony Jesu
Prabhu et al., 2016). Thus, fish fed plant-based diets may require mineral fortification to
maximise their potential growth at higher concentration than levels optimised for
purified or semi-purified diets (Barrows et al., 2008; Barrows et al., 2010; Read et al.,
2014; Welker et al., 2016).
Compared with snapper, cobia have relatively faster growth rate (Table 5.1.2). As faster
growing fish have higher metabolic rates to provide sufficient energy to maximise their
growth potential (DeVries & Eastman, 1981). The lack of air-bladder in cobia results in
higher feed consumption to meet their energy requirement for metabolism, as seen in
trouts (Luísa Maria Pinheiro Valente et al., 1998). Therefore, it could be hypothesised
that cobia requires higher feed intake than snapper due to the differences in their
capacities for digestion, growth rates, as reported in rainbow trout and barramundi
87
Chapter 5 Discussions
(Glencross et al., 2011), rainbow trout and Atlantic salmon (Glencross et al., 2004a;
Refstie et al., 2000) and between rainbow trout and snapper (Glencross et al., 2004c).
Table 5.1.2 A comparison on specific growth rate (SGR) of snapper and cobia
Snapper Cobia
FM in the control diet
SGR References FM in the control diet
SGR References
900 1.02 Booth et al. (2005) 560 2.03 Luo et al. (2012)
490 0.97 Booth et al. (2005) 494 2.39 Trushenski et al. (2011)
640 0.78 Quartararo et al. (1998a)
558 3.6 Romarheim et al. (2008)
420 1.69 Glencross et al. (2003b)
586 4.17 Lunger et al. (2007)
600 0.96 Booth et al. (2012) 253 2.50 Salze et al. (2010)
590 1.67 Glencross et al. (2003b)
455 3.29 Watson et al. (2014b)
Commercial diet
1.01 Booth et al. (2012) 230 3.49 Ren et al. (2014)
Commercial diet
3.54 Weirich et al. (2010)
FM: fishmeal, SGR: specific growth rate.
5.2. EFFECTS OF DIETARY ORGANIC SELENIUM SUPPLEMENTATION IN
SNAPPER
In Australia, the snapper industry is relatively small due to the regulatory restrictions in
farming of the species in coastal cages, the lack of a dedicated commercial diet,
confusion surrounding the nomenclature of the species and slower growth rates. The
species has otherwise shown positive attributes for farming including high market price
and important recreational and commercial fisheries (Booth et al., 2005; Fielder et al.,
2001). Currently, the snapper farming relies on the commercial feeds of other marine
fish (Booth et al., 2012). There are significant inconsistencies in the proximate
composition of the reference diets tested for snapper (Booth et al., 2005; Booth et al.,
2012; Booth et al., 2006; Glencross et al., 2003b; Glencross et al., 2003c; Glencross et
al., 2004c; Quartararo et al., 1998a) in which crude protein and lipids ranged from 50 -
70 %, and 6.8 – 16.4 %, respectively (Table 5.3.1), leading to a lack of nutrition
knowledge of macro and micro nutrient requirements, including Se.
88
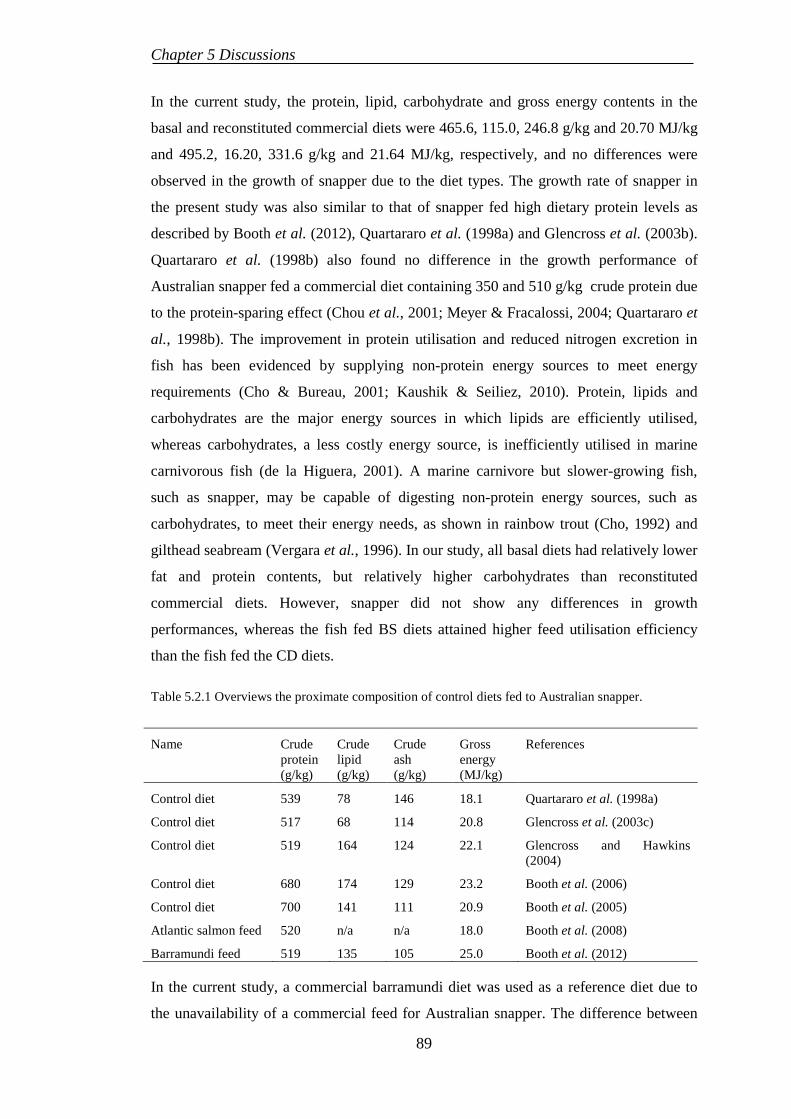
Chapter 5 Discussions
In the current study, the protein, lipid, carbohydrate and gross energy contents in the
basal and reconstituted commercial diets were 465.6, 115.0, 246.8 g/kg and 20.70 MJ/kg
and 495.2, 16.20, 331.6 g/kg and 21.64 MJ/kg, respectively, and no differences were
observed in the growth of snapper due to the diet types. The growth rate of snapper in
the present study was also similar to that of snapper fed high dietary protein levels as
described by Booth et al. (2012), Quartararo et al. (1998a) and Glencross et al. (2003b).
Quartararo et al. (1998b) also found no difference in the growth performance of
Australian snapper fed a commercial diet containing 350 and 510 g/kg crude protein due
to the protein-sparing effect (Chou et al., 2001; Meyer & Fracalossi, 2004; Quartararo et
al., 1998b). The improvement in protein utilisation and reduced nitrogen excretion in
fish has been evidenced by supplying non-protein energy sources to meet energy
requirements (Cho & Bureau, 2001; Kaushik & Seiliez, 2010). Protein, lipids and
carbohydrates are the major energy sources in which lipids are efficiently utilised,
whereas carbohydrates, a less costly energy source, is inefficiently utilised in marine
carnivorous fish (de la Higuera, 2001). A marine carnivore but slower-growing fish,
such as snapper, may be capable of digesting non-protein energy sources, such as
carbohydrates, to meet their energy needs, as shown in rainbow trout (Cho, 1992) and
gilthead seabream (Vergara et al., 1996). In our study, all basal diets had relatively lower
fat and protein contents, but relatively higher carbohydrates than reconstituted
commercial diets. However, snapper did not show any differences in growth
performances, whereas the fish fed BS diets attained higher feed utilisation efficiency
than the fish fed the CD diets.
Table 5.2.1 Overviews the proximate composition of control diets fed to Australian snapper.
Name Crude protein (g/kg)
Crude lipid (g/kg)
Crude ash (g/kg)
Gross energy (MJ/kg)
References
Control diet 539 78 146 18.1 Quartararo et al. (1998a)
Control diet 517 68 114 20.8 Glencross et al. (2003c)
Control diet 519 164 124 22.1 Glencross and Hawkins (2004)
Control diet 680 174 129 23.2 Booth et al. (2006)
Control diet 700 141 111 20.9 Booth et al. (2005)
Atlantic salmon feed 520 n/a n/a 18.0 Booth et al. (2008)
Barramundi feed 519 135 105 25.0 Booth et al. (2012)
In the current study, a commercial barramundi diet was used as a reference diet due to
the unavailability of a commercial feed for Australian snapper. The difference between
89
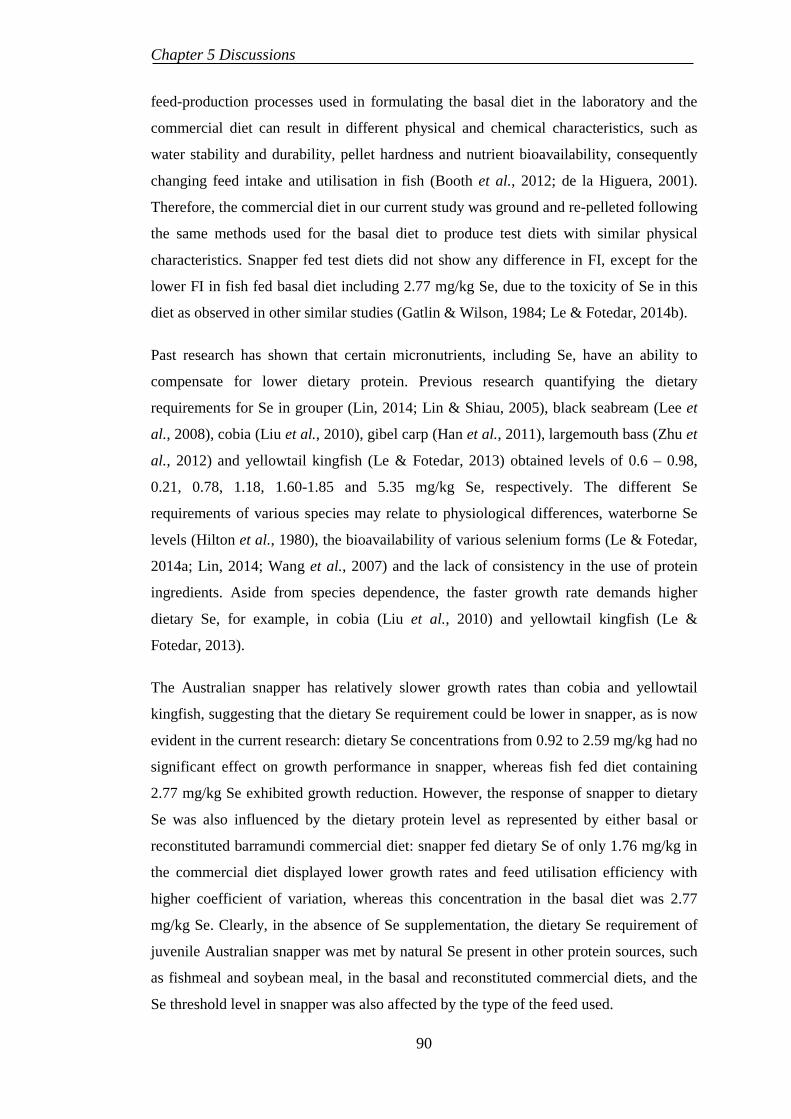
Chapter 5 Discussions
feed-production processes used in formulating the basal diet in the laboratory and the
commercial diet can result in different physical and chemical characteristics, such as
water stability and durability, pellet hardness and nutrient bioavailability, consequently
changing feed intake and utilisation in fish (Booth et al., 2012; de la Higuera, 2001).
Therefore, the commercial diet in our current study was ground and re-pelleted following
the same methods used for the basal diet to produce test diets with similar physical
characteristics. Snapper fed test diets did not show any difference in FI, except for the
lower FI in fish fed basal diet including 2.77 mg/kg Se, due to the toxicity of Se in this
diet as observed in other similar studies (Gatlin & Wilson, 1984; Le & Fotedar, 2014b).
Past research has shown that certain micronutrients, including Se, have an ability to
compensate for lower dietary protein. Previous research quantifying the dietary
requirements for Se in grouper (Lin, 2014; Lin & Shiau, 2005), black seabream (Lee et
al., 2008), cobia (Liu et al., 2010), gibel carp (Han et al., 2011), largemouth bass (Zhu et
al., 2012) and yellowtail kingfish (Le & Fotedar, 2013) obtained levels of 0.6 – 0.98,
0.21, 0.78, 1.18, 1.60-1.85 and 5.35 mg/kg Se, respectively. The different Se
requirements of various species may relate to physiological differences, waterborne Se
levels (Hilton et al., 1980), the bioavailability of various selenium forms (Le & Fotedar,
2014a; Lin, 2014; Wang et al., 2007) and the lack of consistency in the use of protein
ingredients. Aside from species dependence, the faster growth rate demands higher
dietary Se, for example, in cobia (Liu et al., 2010) and yellowtail kingfish (Le &
Fotedar, 2013).
The Australian snapper has relatively slower growth rates than cobia and yellowtail
kingfish, suggesting that the dietary Se requirement could be lower in snapper, as is now
evident in the current research: dietary Se concentrations from 0.92 to 2.59 mg/kg had no
significant effect on growth performance in snapper, whereas fish fed diet containing
2.77 mg/kg Se exhibited growth reduction. However, the response of snapper to dietary
Se was also influenced by the dietary protein level as represented by either basal or
reconstituted barramundi commercial diet: snapper fed dietary Se of only 1.76 mg/kg in
the commercial diet displayed lower growth rates and feed utilisation efficiency with
higher coefficient of variation, whereas this concentration in the basal diet was 2.77
mg/kg Se. Clearly, in the absence of Se supplementation, the dietary Se requirement of
juvenile Australian snapper was met by natural Se present in other protein sources, such
as fishmeal and soybean meal, in the basal and reconstituted commercial diets, and the
Se threshold level in snapper was also affected by the type of the feed used.
90
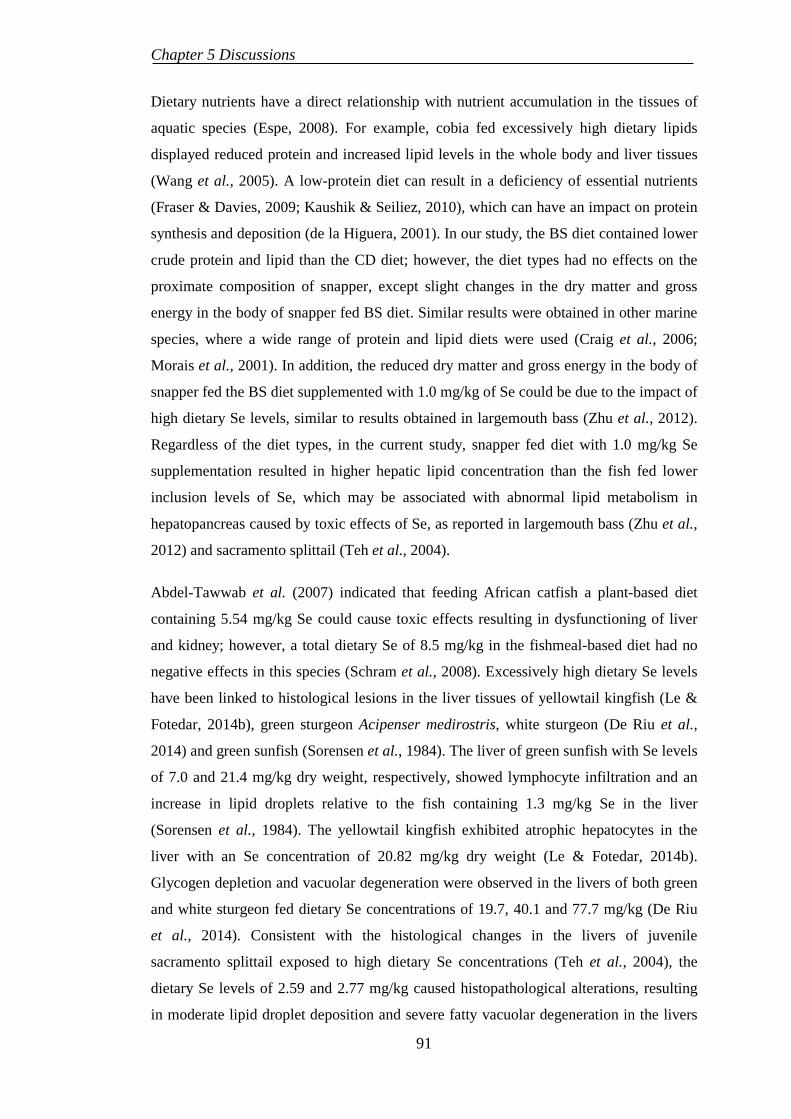
Chapter 5 Discussions
Dietary nutrients have a direct relationship with nutrient accumulation in the tissues of
aquatic species (Espe, 2008). For example, cobia fed excessively high dietary lipids
displayed reduced protein and increased lipid levels in the whole body and liver tissues
(Wang et al., 2005). A low-protein diet can result in a deficiency of essential nutrients
(Fraser & Davies, 2009; Kaushik & Seiliez, 2010), which can have an impact on protein
synthesis and deposition (de la Higuera, 2001). In our study, the BS diet contained lower
crude protein and lipid than the CD diet; however, the diet types had no effects on the
proximate composition of snapper, except slight changes in the dry matter and gross
energy in the body of snapper fed BS diet. Similar results were obtained in other marine
species, where a wide range of protein and lipid diets were used (Craig et al., 2006;
Morais et al., 2001). In addition, the reduced dry matter and gross energy in the body of
snapper fed the BS diet supplemented with 1.0 mg/kg of Se could be due to the impact of
high dietary Se levels, similar to results obtained in largemouth bass (Zhu et al., 2012).
Regardless of the diet types, in the current study, snapper fed diet with 1.0 mg/kg Se
supplementation resulted in higher hepatic lipid concentration than the fish fed lower
inclusion levels of Se, which may be associated with abnormal lipid metabolism in
hepatopancreas caused by toxic effects of Se, as reported in largemouth bass (Zhu et al.,
2012) and sacramento splittail (Teh et al., 2004).
Abdel-Tawwab et al. (2007) indicated that feeding African catfish a plant-based diet
containing 5.54 mg/kg Se could cause toxic effects resulting in dysfunctioning of liver
and kidney; however, a total dietary Se of 8.5 mg/kg in the fishmeal-based diet had no
negative effects in this species (Schram et al., 2008). Excessively high dietary Se levels
have been linked to histological lesions in the liver tissues of yellowtail kingfish (Le &
Fotedar, 2014b), green sturgeon Acipenser medirostris, white sturgeon (De Riu et al.,
2014) and green sunfish (Sorensen et al., 1984). The liver of green sunfish with Se levels
of 7.0 and 21.4 mg/kg dry weight, respectively, showed lymphocyte infiltration and an
increase in lipid droplets relative to the fish containing 1.3 mg/kg Se in the liver
(Sorensen et al., 1984). The yellowtail kingfish exhibited atrophic hepatocytes in the
liver with an Se concentration of 20.82 mg/kg dry weight (Le & Fotedar, 2014b).
Glycogen depletion and vacuolar degeneration were observed in the livers of both green
and white sturgeon fed dietary Se concentrations of 19.7, 40.1 and 77.7 mg/kg (De Riu
et al., 2014). Consistent with the histological changes in the livers of juvenile
sacramento splittail exposed to high dietary Se concentrations (Teh et al., 2004), the
dietary Se levels of 2.59 and 2.77 mg/kg caused histopathological alterations, resulting
in moderate lipid droplet deposition and severe fatty vacuolar degeneration in the livers
91

Chapter 5 Discussions
of snapper fed BS diet supplemented with 1.0 mg/kg Se. The cell necrosis in hepatocytes
can be explained by the gradual deterioration in synthesis of new structural and
metabolic component of the cell to restore the damages caused by toxic effects of Se,
resulting in cell death (Teh et al., 2004). Besides, glycogen depletion induced by
increasing glycogenolysis may also cause single cell necrosis and macrophage
aggregates in liver. Meanwhile, the lipid vacuolar degenerations in livers may be results
of the changing in protein turnover and lipid metabolism caused by Se toxicity,
consequently, resulting in incapacitation of liver in metabolism and excretion of
biochemicals (Teh et al., 2004).
The interactions between dietary micronutrients and the nature of dietary protein
ingredients can change the absorption and metabolism of nutrients (Read et al., 2014). In
the common carp, feeding a low-protein diet (250 g/kg) with magnesium (Mg)
supplementation resulted in significantly higher PER than feeding a higher protein diet
(440 g/kg) at the same level of Mg supplementation (Dabrowska et al., 1991). Increased
protein utilisation and protein metabolic enzyme activity have also been demonstrated in
African catfish fed a plant-based diet with organic Se supplementation (Abdel-Tawwab
et al., 2007). Similarly, the beneficial effect of dietary Se supplementation to improve
protein digestibility have been reported in barramundi (Ilham et al., 2016a), pigs
(Chaudhary et al., 2010; Tian et al., 2006) and sheep (Shi et al., 2011). In the current
study, Australian snapper fed BS diet attained higher PER and EER than fish fed CD diet
containing 0.92 mg/kg Se. This might be attributable to the increase in microbial
activity, the activity of digestive enzymes in the protein degradation process stimulated
by dietary Se, as reported in other animals (Chaudhary et al., 2010; Shi et al., 2011).
5.3. EFFECTS OF DIETARY SELENIUM SUPPLEMENTATION IN COBIA FED
COMMERCIALLY AVAILABLE DIET
The insignificant amount of Se in casein allows nutritionists to use lowest-Se control diet
to overcome the complication of the Se availabilities in feed ingredients. However, fish
fed purified or semi-purified diets have reduced growth and feed intakes than the fish fed
fishmeal-based diets (Hertrampf & Piedad-Pascual, 2000), thus, making the evaluation
of dietary Se requirement challenging and meaningless. Meanwhile, the variability in the
inclusion level of various protein sources in any commercial diet possess variations in
the bioavailability of Se due to the different Se absorption and metabolic pathways
adapted by differently sourced Se. These variations in the bioavailability of different
92
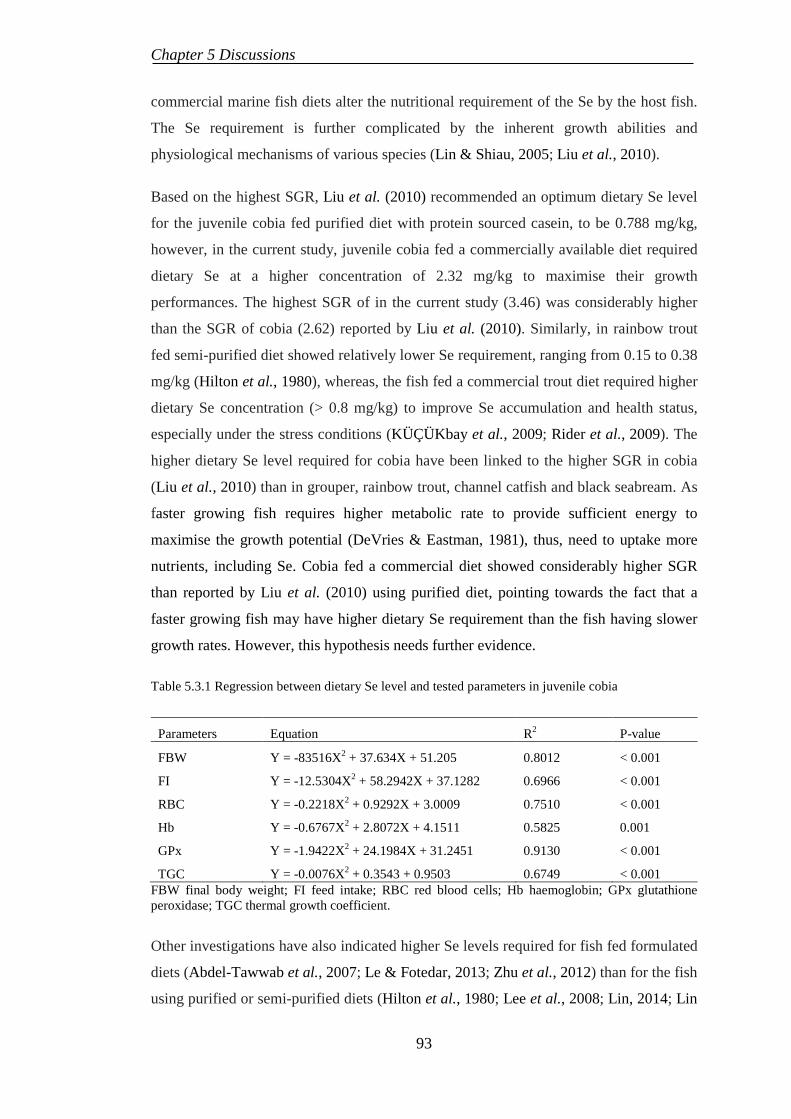
Chapter 5 Discussions
commercial marine fish diets alter the nutritional requirement of the Se by the host fish.
The Se requirement is further complicated by the inherent growth abilities and
physiological mechanisms of various species (Lin & Shiau, 2005; Liu et al., 2010).
Based on the highest SGR, Liu et al. (2010) recommended an optimum dietary Se level
for the juvenile cobia fed purified diet with protein sourced casein, to be 0.788 mg/kg,
however, in the current study, juvenile cobia fed a commercially available diet required
dietary Se at a higher concentration of 2.32 mg/kg to maximise their growth
performances. The highest SGR of in the current study (3.46) was considerably higher
than the SGR of cobia (2.62) reported by Liu et al. (2010). Similarly, in rainbow trout
fed semi-purified diet showed relatively lower Se requirement, ranging from 0.15 to 0.38
mg/kg (Hilton et al., 1980), whereas, the fish fed a commercial trout diet required higher
dietary Se concentration (> 0.8 mg/kg) to improve Se accumulation and health status,
especially under the stress conditions (KÜÇÜKbay et al., 2009; Rider et al., 2009). The
higher dietary Se level required for cobia have been linked to the higher SGR in cobia
(Liu et al., 2010) than in grouper, rainbow trout, channel catfish and black seabream. As
faster growing fish requires higher metabolic rate to provide sufficient energy to
maximise the growth potential (DeVries & Eastman, 1981), thus, need to uptake more
nutrients, including Se. Cobia fed a commercial diet showed considerably higher SGR
than reported by Liu et al. (2010) using purified diet, pointing towards the fact that a
faster growing fish may have higher dietary Se requirement than the fish having slower
growth rates. However, this hypothesis needs further evidence.
Table 5.3.1 Regression between dietary Se level and tested parameters in juvenile cobia
Parameters Equation R2 P-value
FBW Y = -83516X2 + 37.634X + 51.205 0.8012 < 0.001
FI Y = -12.5304X2 + 58.2942X + 37.1282 0.6966 < 0.001
RBC Y = -0.2218X2 + 0.9292X + 3.0009 0.7510 < 0.001
Hb Y = -0.6767X2 + 2.8072X + 4.1511 0.5825 0.001
GPx Y = -1.9422X2 + 24.1984X + 31.2451 0.9130 < 0.001
TGC Y = -0.0076X2 + 0.3543 + 0.9503 0.6749 < 0.001 FBW final body weight; FI feed intake; RBC red blood cells; Hb haemoglobin; GPx glutathione peroxidase; TGC thermal growth coefficient.
Other investigations have also indicated higher Se levels required for fish fed formulated
diets (Abdel-Tawwab et al., 2007; Le & Fotedar, 2013; Zhu et al., 2012) than for the fish
using purified or semi-purified diets (Hilton et al., 1980; Lee et al., 2008; Lin, 2014; Lin
93
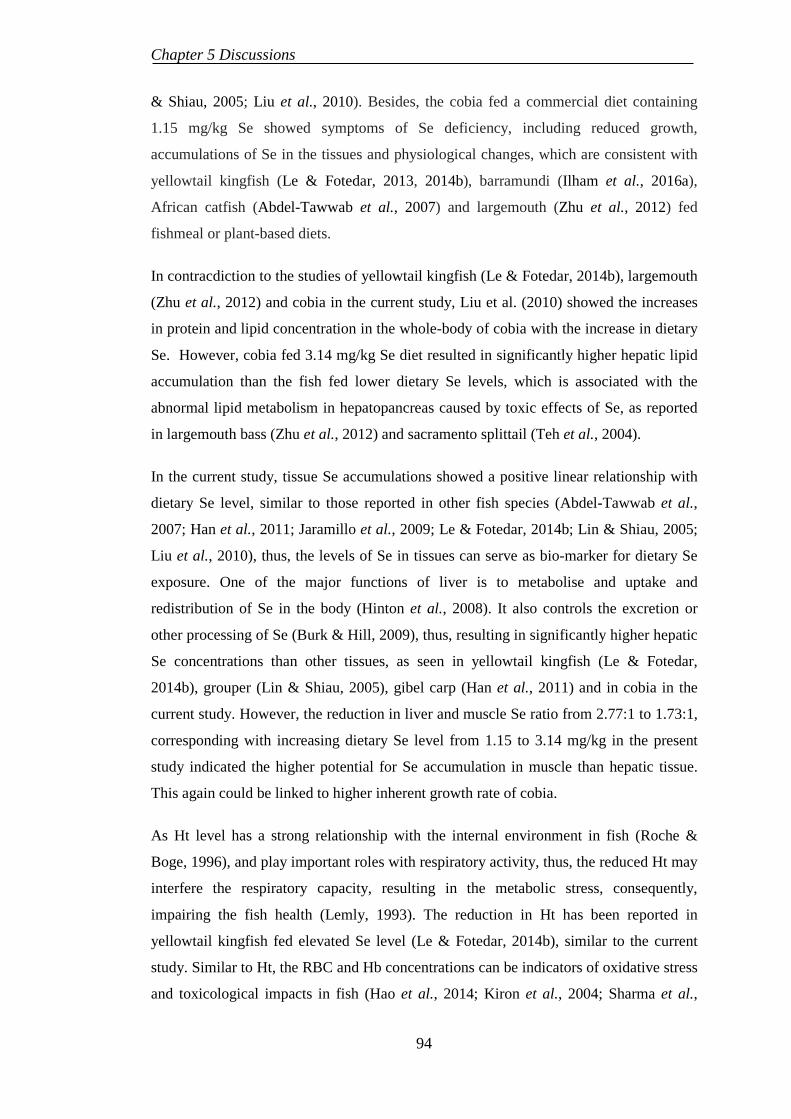
Chapter 5 Discussions
& Shiau, 2005; Liu et al., 2010). Besides, the cobia fed a commercial diet containing
1.15 mg/kg Se showed symptoms of Se deficiency, including reduced growth,
accumulations of Se in the tissues and physiological changes, which are consistent with
yellowtail kingfish (Le & Fotedar, 2013, 2014b), barramundi (Ilham et al., 2016a),
African catfish (Abdel-Tawwab et al., 2007) and largemouth (Zhu et al., 2012) fed
fishmeal or plant-based diets.
In contracdiction to the studies of yellowtail kingfish (Le & Fotedar, 2014b), largemouth
(Zhu et al., 2012) and cobia in the current study, Liu et al. (2010) showed the increases
in protein and lipid concentration in the whole-body of cobia with the increase in dietary
Se. However, cobia fed 3.14 mg/kg Se diet resulted in significantly higher hepatic lipid
accumulation than the fish fed lower dietary Se levels, which is associated with the
abnormal lipid metabolism in hepatopancreas caused by toxic effects of Se, as reported
in largemouth bass (Zhu et al., 2012) and sacramento splittail (Teh et al., 2004).
In the current study, tissue Se accumulations showed a positive linear relationship with
dietary Se level, similar to those reported in other fish species (Abdel-Tawwab et al.,
2007; Han et al., 2011; Jaramillo et al., 2009; Le & Fotedar, 2014b; Lin & Shiau, 2005;
Liu et al., 2010), thus, the levels of Se in tissues can serve as bio-marker for dietary Se
exposure. One of the major functions of liver is to metabolise and uptake and
redistribution of Se in the body (Hinton et al., 2008). It also controls the excretion or
other processing of Se (Burk & Hill, 2009), thus, resulting in significantly higher hepatic
Se concentrations than other tissues, as seen in yellowtail kingfish (Le & Fotedar,
2014b), grouper (Lin & Shiau, 2005), gibel carp (Han et al., 2011) and in cobia in the
current study. However, the reduction in liver and muscle Se ratio from 2.77:1 to 1.73:1,
corresponding with increasing dietary Se level from 1.15 to 3.14 mg/kg in the present
study indicated the higher potential for Se accumulation in muscle than hepatic tissue.
This again could be linked to higher inherent growth rate of cobia.
As Ht level has a strong relationship with the internal environment in fish (Roche &
Boge, 1996), and play important roles with respiratory activity, thus, the reduced Ht may
interfere the respiratory capacity, resulting in the metabolic stress, consequently,
impairing the fish health (Lemly, 1993). The reduction in Ht has been reported in
yellowtail kingfish fed elevated Se level (Le & Fotedar, 2014b), similar to the current
study. Similar to Ht, the RBC and Hb concentrations can be indicators of oxidative stress
and toxicological impacts in fish (Hao et al., 2014; Kiron et al., 2004; Sharma et al.,
94
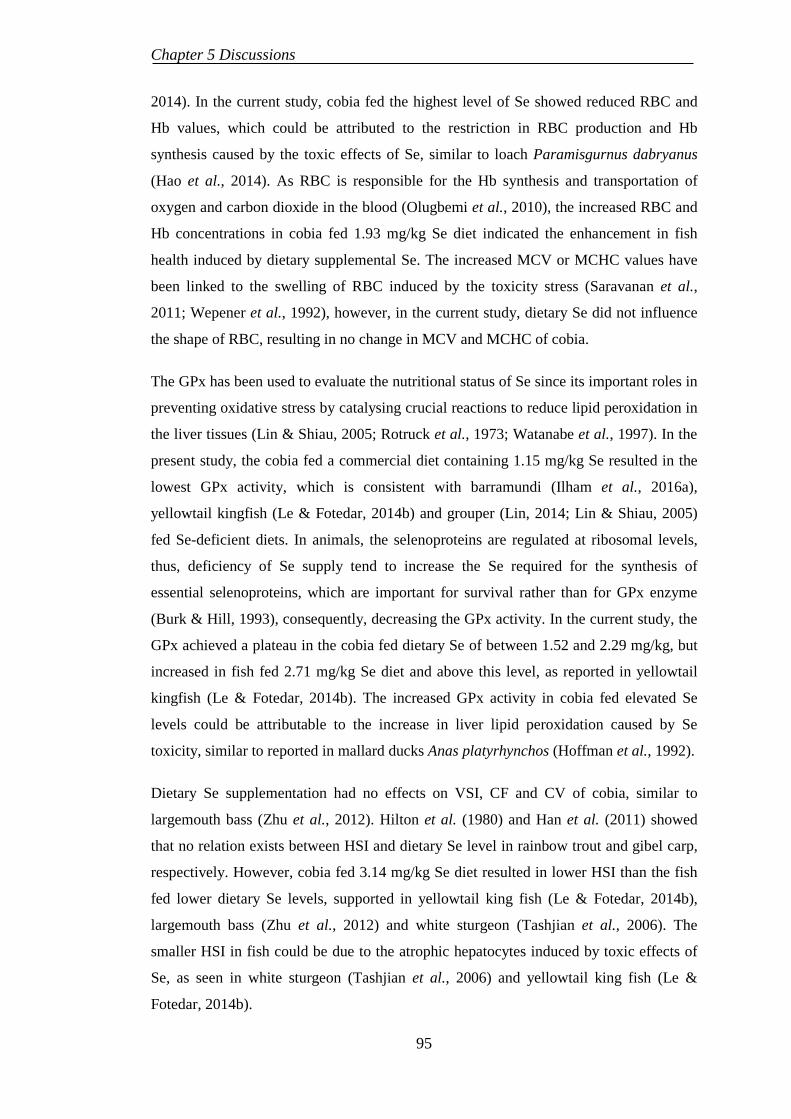
Chapter 5 Discussions
2014). In the current study, cobia fed the highest level of Se showed reduced RBC and
Hb values, which could be attributed to the restriction in RBC production and Hb
synthesis caused by the toxic effects of Se, similar to loach Paramisgurnus dabryanus
(Hao et al., 2014). As RBC is responsible for the Hb synthesis and transportation of
oxygen and carbon dioxide in the blood (Olugbemi et al., 2010), the increased RBC and
Hb concentrations in cobia fed 1.93 mg/kg Se diet indicated the enhancement in fish
health induced by dietary supplemental Se. The increased MCV or MCHC values have
been linked to the swelling of RBC induced by the toxicity stress (Saravanan et al.,
2011; Wepener et al., 1992), however, in the current study, dietary Se did not influence
the shape of RBC, resulting in no change in MCV and MCHC of cobia.
The GPx has been used to evaluate the nutritional status of Se since its important roles in
preventing oxidative stress by catalysing crucial reactions to reduce lipid peroxidation in
the liver tissues (Lin & Shiau, 2005; Rotruck et al., 1973; Watanabe et al., 1997). In the
present study, the cobia fed a commercial diet containing 1.15 mg/kg Se resulted in the
lowest GPx activity, which is consistent with barramundi (Ilham et al., 2016a),
yellowtail kingfish (Le & Fotedar, 2014b) and grouper (Lin, 2014; Lin & Shiau, 2005)
fed Se-deficient diets. In animals, the selenoproteins are regulated at ribosomal levels,
thus, deficiency of Se supply tend to increase the Se required for the synthesis of
essential selenoproteins, which are important for survival rather than for GPx enzyme
(Burk & Hill, 1993), consequently, decreasing the GPx activity. In the current study, the
GPx achieved a plateau in the cobia fed dietary Se of between 1.52 and 2.29 mg/kg, but
increased in fish fed 2.71 mg/kg Se diet and above this level, as reported in yellowtail
kingfish (Le & Fotedar, 2014b). The increased GPx activity in cobia fed elevated Se
levels could be attributable to the increase in liver lipid peroxidation caused by Se
toxicity, similar to reported in mallard ducks Anas platyrhynchos (Hoffman et al., 1992).
Dietary Se supplementation had no effects on VSI, CF and CV of cobia, similar to
largemouth bass (Zhu et al., 2012). Hilton et al. (1980) and Han et al. (2011) showed
that no relation exists between HSI and dietary Se level in rainbow trout and gibel carp,
respectively. However, cobia fed 3.14 mg/kg Se diet resulted in lower HSI than the fish
fed lower dietary Se levels, supported in yellowtail king fish (Le & Fotedar, 2014b),
largemouth bass (Zhu et al., 2012) and white sturgeon (Tashjian et al., 2006). The
smaller HSI in fish could be due to the atrophic hepatocytes induced by toxic effects of
Se, as seen in white sturgeon (Tashjian et al., 2006) and yellowtail king fish (Le &
Fotedar, 2014b).
95
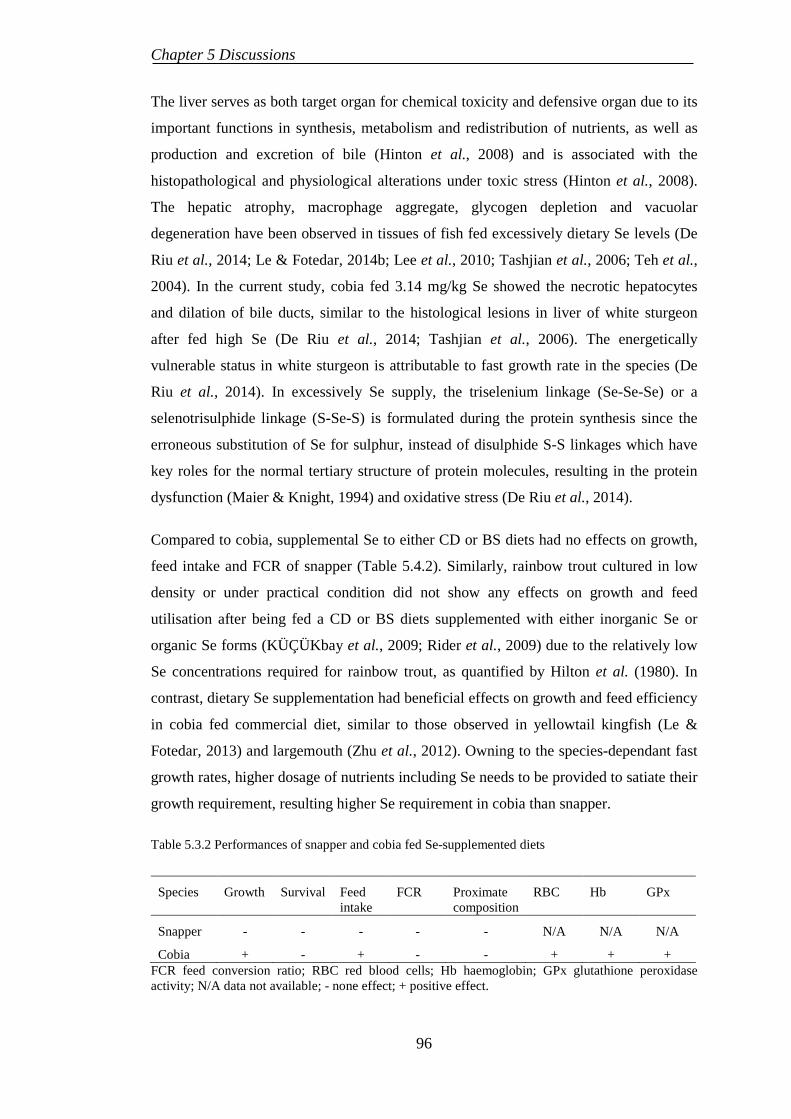
Chapter 5 Discussions
The liver serves as both target organ for chemical toxicity and defensive organ due to its
important functions in synthesis, metabolism and redistribution of nutrients, as well as
production and excretion of bile (Hinton et al., 2008) and is associated with the
histopathological and physiological alterations under toxic stress (Hinton et al., 2008).
The hepatic atrophy, macrophage aggregate, glycogen depletion and vacuolar
degeneration have been observed in tissues of fish fed excessively dietary Se levels (De
Riu et al., 2014; Le & Fotedar, 2014b; Lee et al., 2010; Tashjian et al., 2006; Teh et al.,
2004). In the current study, cobia fed 3.14 mg/kg Se showed the necrotic hepatocytes
and dilation of bile ducts, similar to the histological lesions in liver of white sturgeon
after fed high Se (De Riu et al., 2014; Tashjian et al., 2006). The energetically
vulnerable status in white sturgeon is attributable to fast growth rate in the species (De
Riu et al., 2014). In excessively Se supply, the triselenium linkage (Se-Se-Se) or a
selenotrisulphide linkage (S-Se-S) is formulated during the protein synthesis since the
erroneous substitution of Se for sulphur, instead of disulphide S-S linkages which have
key roles for the normal tertiary structure of protein molecules, resulting in the protein
dysfunction (Maier & Knight, 1994) and oxidative stress (De Riu et al., 2014).
Compared to cobia, supplemental Se to either CD or BS diets had no effects on growth,
feed intake and FCR of snapper (Table 5.4.2). Similarly, rainbow trout cultured in low
density or under practical condition did not show any effects on growth and feed
utilisation after being fed a CD or BS diets supplemented with either inorganic Se or
organic Se forms (KÜÇÜKbay et al., 2009; Rider et al., 2009) due to the relatively low
Se concentrations required for rainbow trout, as quantified by Hilton et al. (1980). In
contrast, dietary Se supplementation had beneficial effects on growth and feed efficiency
in cobia fed commercial diet, similar to those observed in yellowtail kingfish (Le &
Fotedar, 2013) and largemouth (Zhu et al., 2012). Owning to the species-dependant fast
growth rates, higher dosage of nutrients including Se needs to be provided to satiate their
growth requirement, resulting higher Se requirement in cobia than snapper.
Table 5.3.2 Performances of snapper and cobia fed Se-supplemented diets
Species Growth Survival Feed intake
FCR Proximate composition
RBC Hb GPx
Snapper - - - - - N/A N/A N/A
Cobia + - + - - + + + FCR feed conversion ratio; RBC red blood cells; Hb haemoglobin; GPx glutathione peroxidase activity; N/A data not available; - none effect; + positive effect.
96
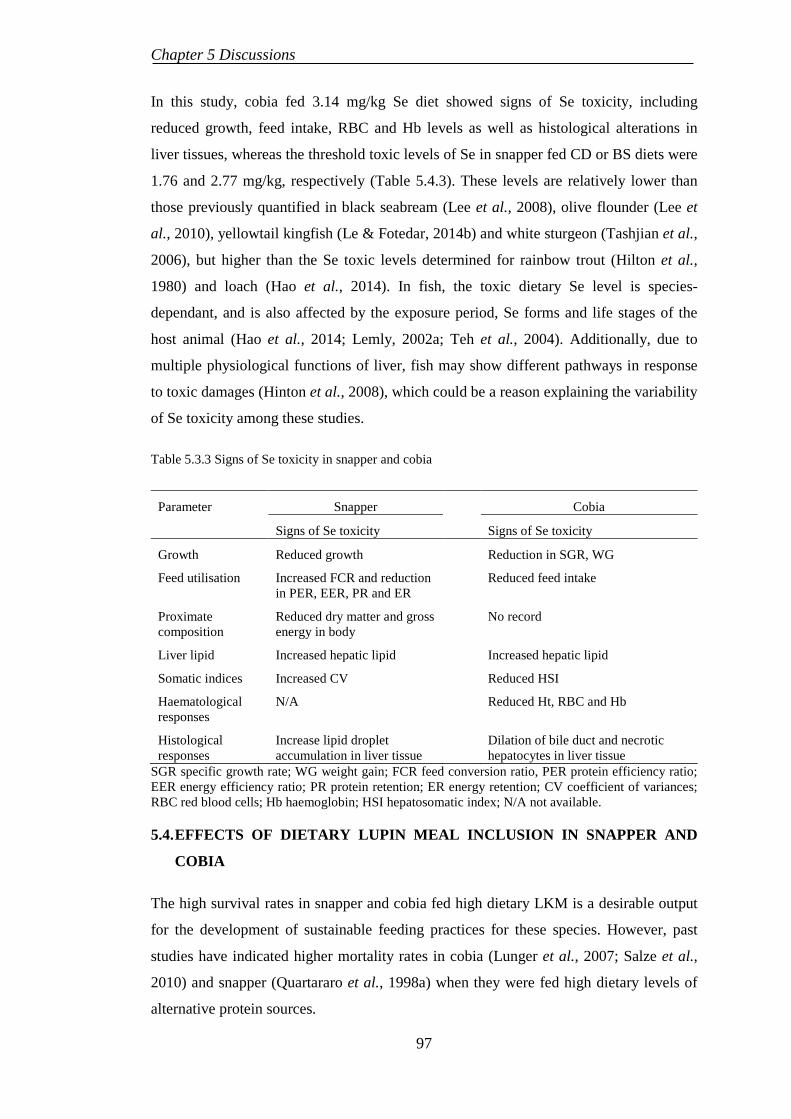
Chapter 5 Discussions
In this study, cobia fed 3.14 mg/kg Se diet showed signs of Se toxicity, including
reduced growth, feed intake, RBC and Hb levels as well as histological alterations in
liver tissues, whereas the threshold toxic levels of Se in snapper fed CD or BS diets were
1.76 and 2.77 mg/kg, respectively (Table 5.4.3). These levels are relatively lower than
those previously quantified in black seabream (Lee et al., 2008), olive flounder (Lee et
al., 2010), yellowtail kingfish (Le & Fotedar, 2014b) and white sturgeon (Tashjian et al.,
2006), but higher than the Se toxic levels determined for rainbow trout (Hilton et al.,
1980) and loach (Hao et al., 2014). In fish, the toxic dietary Se level is species-
dependant, and is also affected by the exposure period, Se forms and life stages of the
host animal (Hao et al., 2014; Lemly, 2002a; Teh et al., 2004). Additionally, due to
multiple physiological functions of liver, fish may show different pathways in response
to toxic damages (Hinton et al., 2008), which could be a reason explaining the variability
of Se toxicity among these studies.
Table 5.3.3 Signs of Se toxicity in snapper and cobia
Parameter Snapper Cobia
Signs of Se toxicity Signs of Se toxicity
Growth Reduced growth Reduction in SGR, WG
Feed utilisation Increased FCR and reduction in PER, EER, PR and ER
Reduced feed intake
Proximate composition
Reduced dry matter and gross energy in body
No record
Liver lipid Increased hepatic lipid Increased hepatic lipid
Somatic indices Increased CV Reduced HSI
Haematological responses
N/A Reduced Ht, RBC and Hb
Histological responses
Increase lipid droplet accumulation in liver tissue
Dilation of bile duct and necrotic hepatocytes in liver tissue
SGR specific growth rate; WG weight gain; FCR feed conversion ratio, PER protein efficiency ratio; EER energy efficiency ratio; PR protein retention; ER energy retention; CV coefficient of variances; RBC red blood cells; Hb haemoglobin; HSI hepatosomatic index; N/A not available.
5.4. EFFECTS OF DIETARY LUPIN MEAL INCLUSION IN SNAPPER AND
COBIA
The high survival rates in snapper and cobia fed high dietary LKM is a desirable output
for the development of sustainable feeding practices for these species. However, past
studies have indicated higher mortality rates in cobia (Lunger et al., 2007; Salze et al.,
2010) and snapper (Quartararo et al., 1998a) when they were fed high dietary levels of
alternative protein sources.
97
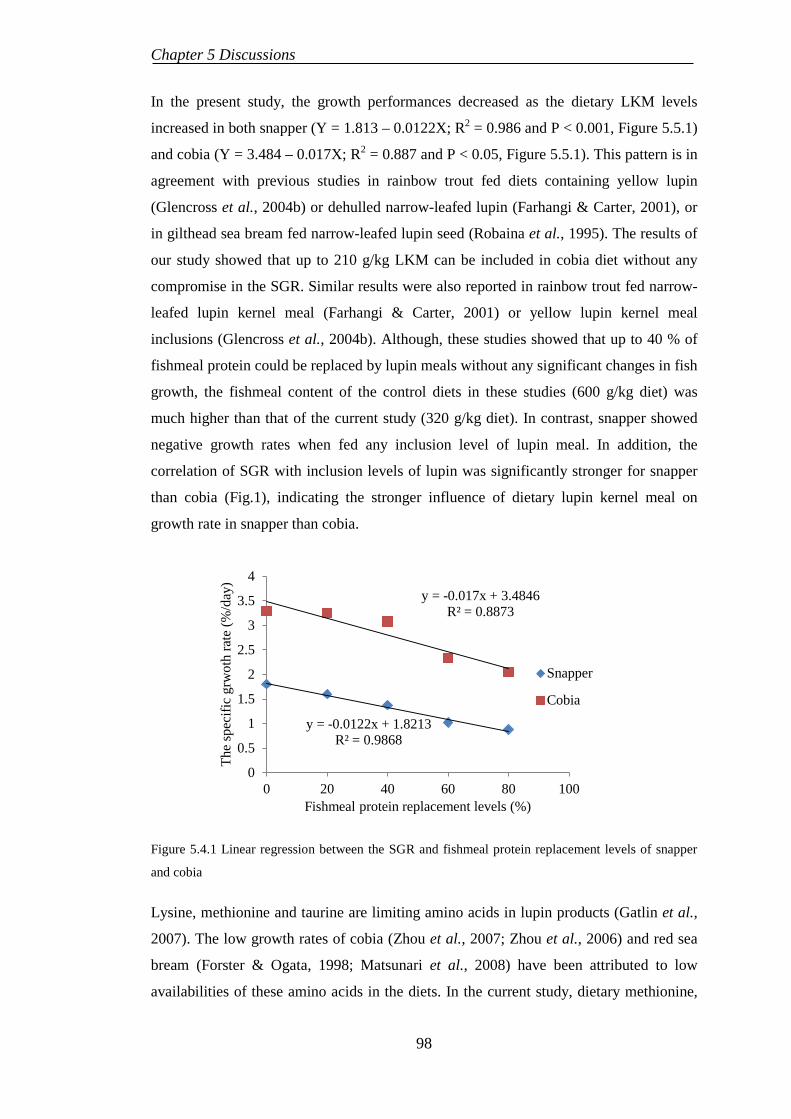
Chapter 5 Discussions
In the present study, the growth performances decreased as the dietary LKM levels
increased in both snapper (Y = 1.813 – 0.0122X; R2 = 0.986 and P < 0.001, Figure 5.5.1)
and cobia (Y = 3.484 – 0.017X; R2 = 0.887 and P < 0.05, Figure 5.5.1). This pattern is in
agreement with previous studies in rainbow trout fed diets containing yellow lupin
(Glencross et al., 2004b) or dehulled narrow-leafed lupin (Farhangi & Carter, 2001), or
in gilthead sea bream fed narrow-leafed lupin seed (Robaina et al., 1995). The results of
our study showed that up to 210 g/kg LKM can be included in cobia diet without any
compromise in the SGR. Similar results were also reported in rainbow trout fed narrow-
leafed lupin kernel meal (Farhangi & Carter, 2001) or yellow lupin kernel meal
inclusions (Glencross et al., 2004b). Although, these studies showed that up to 40 % of
fishmeal protein could be replaced by lupin meals without any significant changes in fish
growth, the fishmeal content of the control diets in these studies (600 g/kg diet) was
much higher than that of the current study (320 g/kg diet). In contrast, snapper showed
negative growth rates when fed any inclusion level of lupin meal. In addition, the
correlation of SGR with inclusion levels of lupin was significantly stronger for snapper
than cobia (Fig.1), indicating the stronger influence of dietary lupin kernel meal on
growth rate in snapper than cobia.
Figure 5.4.1 Linear regression between the SGR and fishmeal protein replacement levels of snapper
and cobia
Lysine, methionine and taurine are limiting amino acids in lupin products (Gatlin et al.,
2007). The low growth rates of cobia (Zhou et al., 2007; Zhou et al., 2006) and red sea
bream (Forster & Ogata, 1998; Matsunari et al., 2008) have been attributed to low
availabilities of these amino acids in the diets. In the current study, dietary methionine,
y = -0.0122x + 1.8213 R² = 0.9868
y = -0.017x + 3.4846 R² = 0.8873
0
0.5
1
1.5
2
2.5
3
3.5
4
0 20 40 60 80 100
The
spec
ific
grw
oth
rate
(%/d
ay)
Fishmeal protein replacement levels (%)
Snapper
Cobia
98
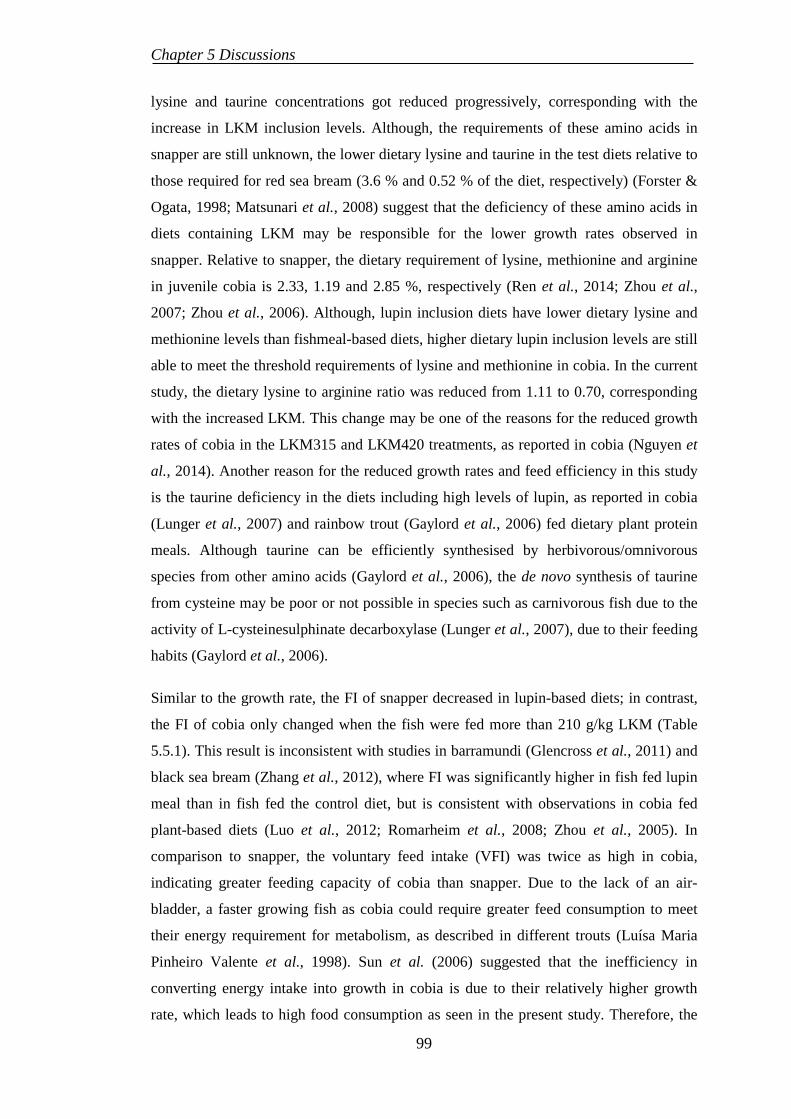
Chapter 5 Discussions
lysine and taurine concentrations got reduced progressively, corresponding with the
increase in LKM inclusion levels. Although, the requirements of these amino acids in
snapper are still unknown, the lower dietary lysine and taurine in the test diets relative to
those required for red sea bream (3.6 % and 0.52 % of the diet, respectively) (Forster &
Ogata, 1998; Matsunari et al., 2008) suggest that the deficiency of these amino acids in
diets containing LKM may be responsible for the lower growth rates observed in
snapper. Relative to snapper, the dietary requirement of lysine, methionine and arginine
in juvenile cobia is 2.33, 1.19 and 2.85 %, respectively (Ren et al., 2014; Zhou et al.,
2007; Zhou et al., 2006). Although, lupin inclusion diets have lower dietary lysine and
methionine levels than fishmeal-based diets, higher dietary lupin inclusion levels are still
able to meet the threshold requirements of lysine and methionine in cobia. In the current
study, the dietary lysine to arginine ratio was reduced from 1.11 to 0.70, corresponding
with the increased LKM. This change may be one of the reasons for the reduced growth
rates of cobia in the LKM315 and LKM420 treatments, as reported in cobia (Nguyen et
al., 2014). Another reason for the reduced growth rates and feed efficiency in this study
is the taurine deficiency in the diets including high levels of lupin, as reported in cobia
(Lunger et al., 2007) and rainbow trout (Gaylord et al., 2006) fed dietary plant protein
meals. Although taurine can be efficiently synthesised by herbivorous/omnivorous
species from other amino acids (Gaylord et al., 2006), the de novo synthesis of taurine
from cysteine may be poor or not possible in species such as carnivorous fish due to the
activity of L-cysteinesulphinate decarboxylase (Lunger et al., 2007), due to their feeding
habits (Gaylord et al., 2006).
Similar to the growth rate, the FI of snapper decreased in lupin-based diets; in contrast,
the FI of cobia only changed when the fish were fed more than 210 g/kg LKM (Table
5.5.1). This result is inconsistent with studies in barramundi (Glencross et al., 2011) and
black sea bream (Zhang et al., 2012), where FI was significantly higher in fish fed lupin
meal than in fish fed the control diet, but is consistent with observations in cobia fed
plant-based diets (Luo et al., 2012; Romarheim et al., 2008; Zhou et al., 2005). In
comparison to snapper, the voluntary feed intake (VFI) was twice as high in cobia,
indicating greater feeding capacity of cobia than snapper. Due to the lack of an air-
bladder, a faster growing fish as cobia could require greater feed consumption to meet
their energy requirement for metabolism, as described in different trouts (Luísa Maria
Pinheiro Valente et al., 1998). Sun et al. (2006) suggested that the inefficiency in
converting energy intake into growth in cobia is due to their relatively higher growth
rate, which leads to high food consumption as seen in the present study. Therefore, the
99
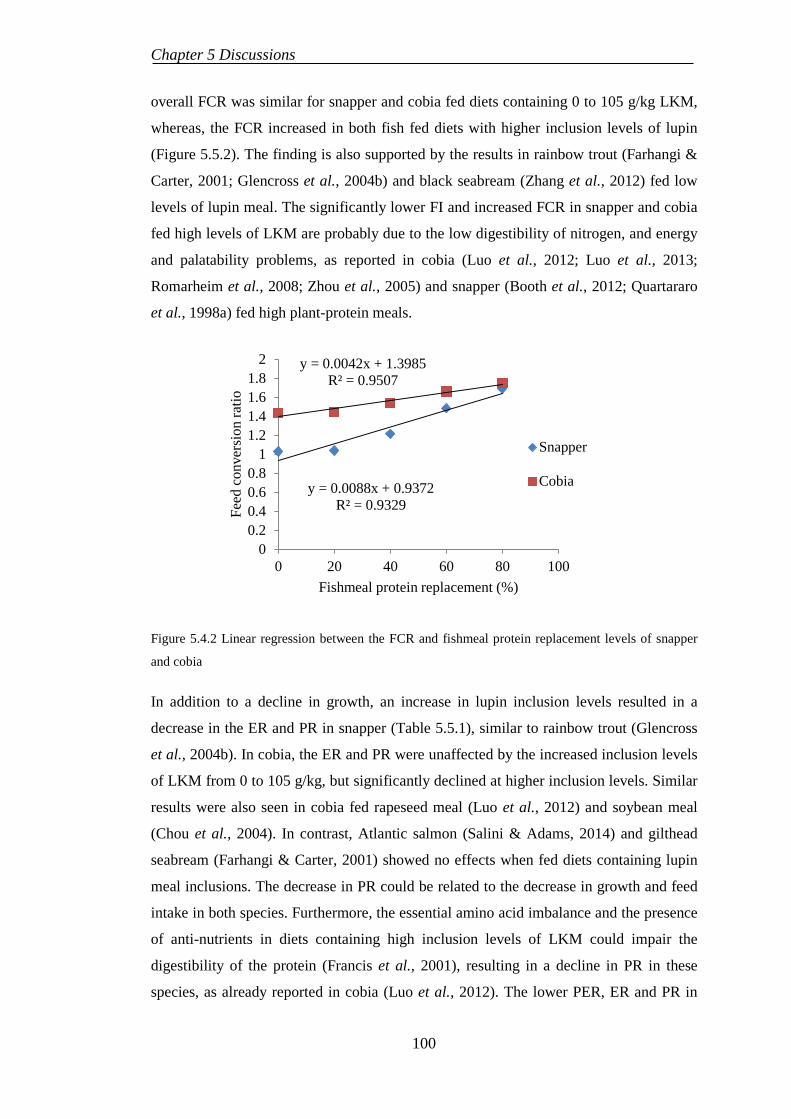
Chapter 5 Discussions
overall FCR was similar for snapper and cobia fed diets containing 0 to 105 g/kg LKM,
whereas, the FCR increased in both fish fed diets with higher inclusion levels of lupin
(Figure 5.5.2). The finding is also supported by the results in rainbow trout (Farhangi &
Carter, 2001; Glencross et al., 2004b) and black seabream (Zhang et al., 2012) fed low
levels of lupin meal. The significantly lower FI and increased FCR in snapper and cobia
fed high levels of LKM are probably due to the low digestibility of nitrogen, and energy
and palatability problems, as reported in cobia (Luo et al., 2012; Luo et al., 2013;
Romarheim et al., 2008; Zhou et al., 2005) and snapper (Booth et al., 2012; Quartararo
et al., 1998a) fed high plant-protein meals.
Figure 5.4.2 Linear regression between the FCR and fishmeal protein replacement levels of snapper
and cobia
In addition to a decline in growth, an increase in lupin inclusion levels resulted in a
decrease in the ER and PR in snapper (Table 5.5.1), similar to rainbow trout (Glencross
et al., 2004b). In cobia, the ER and PR were unaffected by the increased inclusion levels
of LKM from 0 to 105 g/kg, but significantly declined at higher inclusion levels. Similar
results were also seen in cobia fed rapeseed meal (Luo et al., 2012) and soybean meal
(Chou et al., 2004). In contrast, Atlantic salmon (Salini & Adams, 2014) and gilthead
seabream (Farhangi & Carter, 2001) showed no effects when fed diets containing lupin
meal inclusions. The decrease in PR could be related to the decrease in growth and feed
intake in both species. Furthermore, the essential amino acid imbalance and the presence
of anti-nutrients in diets containing high inclusion levels of LKM could impair the
digestibility of the protein (Francis et al., 2001), resulting in a decline in PR in these
species, as already reported in cobia (Luo et al., 2012). The lower PER, ER and PR in
y = 0.0088x + 0.9372 R² = 0.9329
y = 0.0042x + 1.3985 R² = 0.9507
00.20.40.60.8
11.21.41.61.8
2
0 20 40 60 80 100
Feed
con
vers
ion
ratio
Fishmeal protein replacement (%)
Snapper
Cobia
100
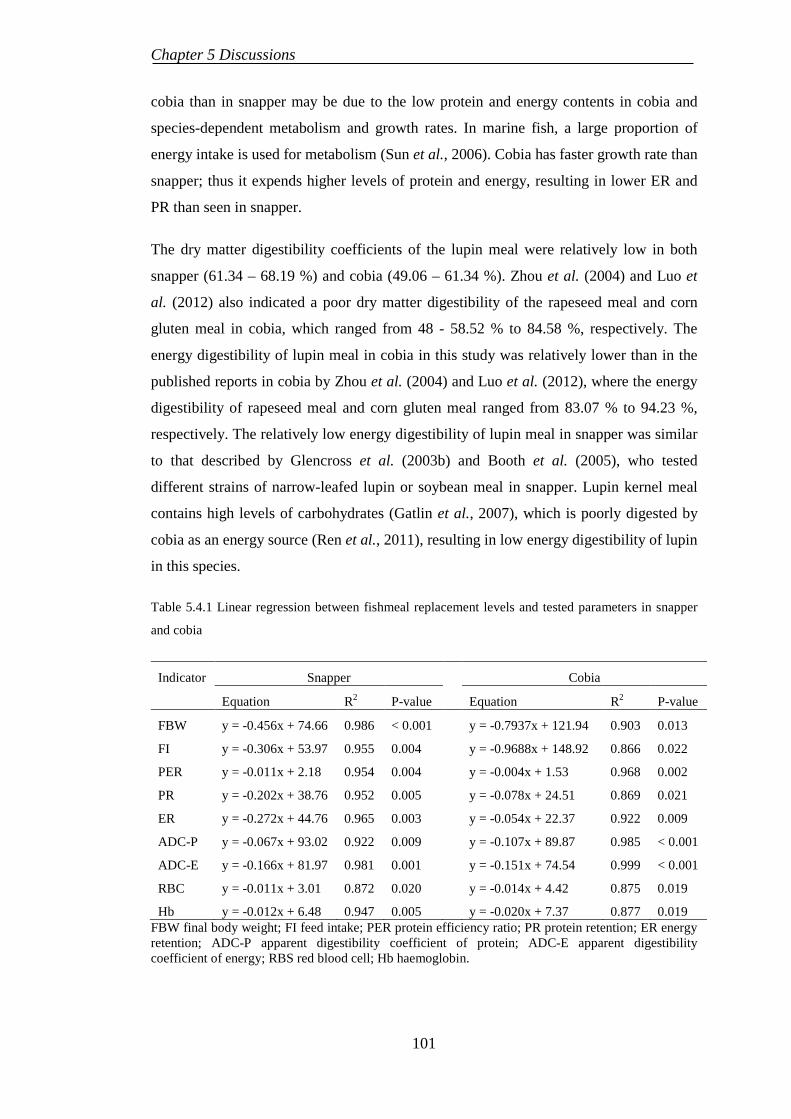
Chapter 5 Discussions
cobia than in snapper may be due to the low protein and energy contents in cobia and
species-dependent metabolism and growth rates. In marine fish, a large proportion of
energy intake is used for metabolism (Sun et al., 2006). Cobia has faster growth rate than
snapper; thus it expends higher levels of protein and energy, resulting in lower ER and
PR than seen in snapper.
The dry matter digestibility coefficients of the lupin meal were relatively low in both
snapper (61.34 – 68.19 %) and cobia (49.06 – 61.34 %). Zhou et al. (2004) and Luo et
al. (2012) also indicated a poor dry matter digestibility of the rapeseed meal and corn
gluten meal in cobia, which ranged from 48 - 58.52 % to 84.58 %, respectively. The
energy digestibility of lupin meal in cobia in this study was relatively lower than in the
published reports in cobia by Zhou et al. (2004) and Luo et al. (2012), where the energy
digestibility of rapeseed meal and corn gluten meal ranged from 83.07 % to 94.23 %,
respectively. The relatively low energy digestibility of lupin meal in snapper was similar
to that described by Glencross et al. (2003b) and Booth et al. (2005), who tested
different strains of narrow-leafed lupin or soybean meal in snapper. Lupin kernel meal
contains high levels of carbohydrates (Gatlin et al., 2007), which is poorly digested by
cobia as an energy source (Ren et al., 2011), resulting in low energy digestibility of lupin
in this species.
Table 5.4.1 Linear regression between fishmeal replacement levels and tested parameters in snapper
and cobia
Indicator Snapper Cobia
Equation R2 P-value Equation R2 P-value
FBW y = -0.456x + 74.66 0.986 < 0.001 y = -0.7937x + 121.94 0.903 0.013
FI y = -0.306x + 53.97 0.955 0.004 y = -0.9688x + 148.92 0.866 0.022
PER y = -0.011x + 2.18 0.954 0.004 y = -0.004x + 1.53 0.968 0.002
PR y = -0.202x + 38.76 0.952 0.005 y = -0.078x + 24.51 0.869 0.021
ER y = -0.272x + 44.76 0.965 0.003 y = -0.054x + 22.37 0.922 0.009
ADC-P y = -0.067x + 93.02 0.922 0.009 y = -0.107x + 89.87 0.985 < 0.001
ADC-E y = -0.166x + 81.97 0.981 0.001 y = -0.151x + 74.54 0.999 < 0.001
RBC y = -0.011x + 3.01 0.872 0.020 y = -0.014x + 4.42 0.875 0.019
Hb y = -0.012x + 6.48 0.947 0.005 y = -0.020x + 7.37 0.877 0.019 FBW final body weight; FI feed intake; PER protein efficiency ratio; PR protein retention; ER energy retention; ADC-P apparent digestibility coefficient of protein; ADC-E apparent digestibility coefficient of energy; RBS red blood cell; Hb haemoglobin.
101
Chapter 5 Discussions
The protein synthesis and degradation are strongly associated with balanced amino acids
(Langar et al., 1993). In this study, fishmeal was replaced by lupin kernel meal without
EAAs supplementation, resulting in imbalanced amino acids in the test diets. The
significantly reduced protein content in muscles of snapper and cobia fed high inclusion
levels of LKM might be due to an imbalance of amino acid in these diets impacting the
protein metabolism. The muscle and whole body protein contents were relatively lower
in cobia than snapper due to the differences between protein synthesis and degradation in
these species. In fish, the synthesised protein proportion used for the growth increases
with an increase in the growth rate, as quantified in Atlantic cod (Houlihan et al., 1988).
As cobia has a relatively faster growth rate than snapper, more synthesised protein is
used to meet its growth potential, resulting in lower protein depositions in cobia. In the
current study, the reduced lipid concentrations in the whole-body and muscles were
observed in cobia fed diets including more than 210 g/kg LKM, similar to results
reported for cobia when fed soybean meal (Zhou et al., 2005), rapeseed meal and corn
gluten meal (Luo et al., 2012); Luo et al. (2013). This change can be attributed to the
low energy intake caused by a low feed intake and energy digestibility. Another reason
for the reduced lipid depositions in tissues of cobia can be the taurine deficiency in diets
including high levels of lupin due to the important role of taurine in lipid metabolism
and oxidative stress responses (Watson et al., 2013). Taurine has been shown to be
conditionally indispensable in carnivorous marine fish (Gaylord et al., 2006; Lunger et
al., 2007), and taurine supplementation into plant-based diets prevents the reduction of
lipid accumulation in tissues of cobia (Lunger et al., 2007). In contrast, the dietary LKM
did not show any effects on the lipid contents of the whole-body and muscles of snapper.
This pattern is supported by rainbow trout (Borquez et al., 2011), gilthead sea bream
(Pereira & Oliva-Teles, 2004) and black sea bream (Zhang et al., 2012). In fish, lipid
accumulation occurs in major sites, such as perivisceral fat, muscles and liver tissues,
varying among different fish species (Weil et al., 2013). Faster-growing fish generally
have greater lipid accumulation (Nortvedt & Tuene, 1998). These reasons might all
contribute to explaining the different lipid deposits in different tissues with relatively
greater hepatic fat accumulation in cobia than snapper in this study.
The CV of the snapper fed dietary LKM was higher than in the fish fed the control diet
because the quantity and quality of food have a strong impact on the size (Fuiman,
2002). In contrast, there was no change in the CV of cobia fed the tested diets. A high
CV can be explained as a difficulty in acclimatising to the rearing conditions (Le
Boucher et al., 2011). In this study, both snapper and cobia at the same sizes were
102
Chapter 5 Discussions
collected for feeding trials after acclimation to experimental systems in 2 weeks and
feeding available commercial diets to minimise size distributions. Thus, the change in
CV of snapper at the end of feeding trial could be attributable to the difficulty in
adapting to the test diets. The significantly higher CV of snapper than that of cobia at
each inclusion level of lupin also indicated a greater adaptability to dietary inclusion of
LKM in cobia than in snapper.
The different changes in haematological characteristics can be useful indicator in
evaluating the physiological condition and health of any fish (Kader et al., 2010). Zhou
et al. (2005) and Sharma et al. (2014) demonstrated the relationship between high values
of Hb and RBC and good health because Hb and RBC play important roles in oxygen
and carbon dioxide transportations in the blood and haemoglobin synthesis (Olugbemi et
al., 2010). In this study, the Hb and RBC of cobia were significantly reduced when fed
dietary inclusion levels of LKM in excess of 210 g/kg, while this threshold level in
snapper was only 105 g/kg LKM (Table 5.5.1). This pattern is consistent with results
from cobia (Zhou et al., 2005) and coho salmon Oncorhynchus kisutchi (Twibell et al.,
2012) fed diets containing high levels of plant-protein meals. Thus, the reduced Hb and
RBC concentrations might be a consequence of significantly lower growth performances
in snapper and cobia when fed to high dietary LKM in this study.
The intestinal morphology can reflect the physiological adaptation of fish fed different
diets (Omnes et al., 2015). In our study, snapper and cobia fed diets including LKM did
not show any alterations in the distal intestines. This is consistent with the results of
cobia fed soybean-based diets (Romarheim et al., 2008) and rainbow trout fed yellow
lupin (Glencross et al., 2004b) or narrow-leafed lupin (Farhangi & Carter, 2001).
However, this result is inconsistent with the increment of fat deposits in digestive tracts
of Atlantic salmon fed 200 g/kg lupin meal (Gu et al., 2014) or rainbow trout fed 400 –
500 g/kg inclusion of whole grain white lupin (Borquez et al., 2011), probably due to the
deficiency of phosphatidylcholine, a major component of the polar lipoprotein surface
which plays important role in lipid exporting from the intestinal mucosa to the
circulatory system (Gu et al., 2014). The excessive lipid droplet accumulation in the
livers of snapper fed high dietary LKM was similar to that reported in mangrove red
snapper Lutjanus argentimaculatus (Catacutan & Pagador, 2004), Atlantic salmon (Gu et
al., 2014) and gilthead seabream (Robaina et al., 1995) fed dietary plant meals due to an
increase in lipolysis from adipose tissue, as explained for Atlantic salmon (Gu et al.,
2014) and gilthead seabream (Bouraoui et al., 2011). Conversely, Glencross et al.
103
Chapter 5 Discussions
(2004b) observed a decrease in lipid droplets in the liver tissues of rainbow trout fed a 50
% yellow lupin inclusion, which could be associated with the reduced energy retention
of the diet. In contrast to snapper, cobia fed a LKM420 diet displayed atrophic
hepatocytes. Hepatic atrophy in fish caused by mineral toxicity have been shown in
yellowtail kingfish (Le & Fotedar, 2014b). However, the reason for the symptom
induced by dietary LKM in cobia is not clear and needs further study. Although toxic
effects of anti-nutrient factors such as lupinine, sparteine and gramine in lupin products
have been demonstrated in animals (Flores-Soto et al., 2006; Olver & Jonker, 1997), the
increasing dietary inclusion levels of lupinine or spartein up to 5000 mg/kg did not cause
any histopathological alterations in the intestine, liver and kidney of rainbow trout
(Serrano et al., 2012; Serrano et al., 2011). In addition, selective breeding has reduced
the alkaloids concentration in lupins to insignificant levels (less than 20 mg/kg), and the
meal could be readily used by livestock (Duke, 1981). Further, the concentrations of
phytic acid, tannin and trypsin inhibitor presented in narrow-leafed lupin kernel meal at
the level of 0.50 %, 0.17 % and 0.12 mg/g (Petterson et al., 1997; Pham et al., 2016; Vo
et al., 2015) are relatively lower compared to soybean meal and rapeseed meal
(Glencross, 2001; Luo et al., 2012), indicating that the ANFs in the diet including 210
g/kg LKM is unlikely to cause any histopathological changes in the digestive tissues of
either snapper or cobia.
5.5. ROLES OF MINERAL SUPPLEMENTATION IN FISH FED PLANT-BASED
DIETS
Compared with plant-derived ingredients, fishmeal has been shown to be excellent
source of not only protein, essential amino acids, but also macro-nutrients and micro-
nutrients in fish diets (Hertrampf & Piedad-Pascual, 2000). Therefore, the substitution of
fishmeal with plant protein sources in aqua-feeds can change the nutritional composition,
altering the uptake and digestion of minerals, consequently changing the nutritional
requirements of the fish (Antony Jesu Prabhu et al., 2016; Barrows et al., 2010; Read et
al., 2014). Besides, the anti-nutritional factors, such as phytic acid and tannin presented
in plant-derived ingredients have been reported to be involved the reduction of mineral
bioavailability in fish (Antony Jesu Prabhu et al., 2016) due to their disruptions in
digestion and metabolism of minerals (Antony Jesu Prabhu et al., 2016). Thus, fish fed
high inclusion levels of plant feedstuffs may require mineral supplementation to
diminish the negative impacts of ANFs, meanwhile improve the growth and feed
utilisation.
104
Chapter 5 Discussions
Barrows et al. (2008) demonstrated that rainbow trout fed plant-based diet required
premix vitamin supplementation to improve growth and feed utilisation at a higher
concentration than those previously determined for purified diet. Similarly, the dietary
minerals, such as zinc and copper supplementation were essential for the trout fed plant-
based diets (Barrows et al., 2010; Read et al., 2014; Welker et al., 2016). The authors
also reported that quantitative mineral requirements recommend by the NRC (1993) and
NRC (2011) may result in the nutrient deficiency in the trout fed plant-derived diets.
Although the fishmeal-based diets have been reported to contain adequate Se
concentration to meet the nutritional requirement in fish, however, the increase in its
price, the high demand for animal feeds and limiting of its availability have led to efforts
to reduce the fishmeal reliance by increasing of cost-effective alternative protein
ingredients in marine fish diets (Olsen & Hasan, 2012; Welker et al., 2016). The
percentage of fishmeal in marine fish diet rapidly dropped from 50% in 1995 to only 26
% in 2010 and had been predicted to continuously reduce to 12 % in 2020 (Olsen &
Hasan, 2012). Besides, due to the significantly lower Se digestibility from fishmeal
(38.48 – 47 %) than from SeMet or Se-yeast (89.48 – 92 %) (Bell & Cowey, 1989; Le &
Fotedar, 2014a; Watanabe et al., 1997), the relatively lower Se concentration in plant-
derived ingredients compared to fishmeal (Antony Jesu Prabhu et al., 2016; Welker et
al., 2016) as well the interaction between Se and other minerals such as copper, sulphur,
mercury (Watanabe et al., 1997) and vitamin E (Le et al., 2014b; Lin & Shiau, 2009),
thus, fish fed high inclusion levels of plant-derived ingredients may require dietary Se
fortification to meet their nutritional requirement (Abdel-Tawwab et al., 2007; Ilham et
al., 2016a; Le & Fotedar, 2013; Zhu et al., 2012).
Recently, the beneficial effects of Se supplementation have been also demonstrated in
fish fed plant-based diets (Abdel-Tawwab et al., 2007; Ilham et al., 2016a; Ilham et al.,
2016b), in which African catfish and barramundi showed improved growth and feed
utilisation efficiency after being fed plant-based diets supplemented with organic Se.
Besides, barramundi fed Se-supplemental plant-based diets also demonstrated the
improvement in histopathological performances (Ilham et al., 2016a). The reason for this
can be due to the increased quantity and activities of digestive enzymes (Chaudhary et
al., 2010) as well as the enhancement in health status of fish (Abdel-Tawwab et al.,
2007; Le et al., 2014a) stimulated by dietary Se supplementation.
105
Chapter 5 Discussions
5.6. EFFECTS OF DIETARY ORGANIC SELENIUM SUPPLEMENTATION IN
COBIA FED LUPIN-BASED DIETS
In the absence of Se supplementation, cobia fed high dietary levels of LKM showed
reduced FBW, SGR, FI and nutrient digestibility, corresponding to increased FCR. This
was consistent when cobia were fed soybean meal (Chou et al., 2004; Zhou et al., 2005)
and rapeseed meal (Luo et al., 2012). The reduced growth rates in cobia fed 315 g/kg
LKM can be linked to the depression in FI as FI is directly related to weight gain (Espe
et al., 2012). Therefore, it is essential to maintain an equal feed acceptability in order to
evaluate the performance of the fishmeal-substituted diets (Espe et al., 2012).
The suppression of FI has been attributed to the deficiency of essential amino acids in
lupin-based diets (Jobling et al., 2007), probably due to low concentrations of lysine and
methionine in lupin products (Gatlin et al., 2007) as shown by relatively lower growth
and feed efficiency in cobia by Zhou et al. (2006) and Zhou et al. (2007). The dietary
requirements for lysine and methionine of juvenile cobia are 2.33 % and 1.05 %,
respectively (Zhou et al., 2007; Zhou et al., 2006). Although lupin inclusion diets
contain lower dietary lysine and methionine concentrations than fishmeal-based diets,
however, the higher dietary lupin inclusion levels in the current study are still able to
meet the threshold requirement of lysine and methionine for juvenile cobia.
The high inclusion levels of dietary plant-derived ingredients in aqua-feeds also result in
an increased proportion of dietary anti-nutrients (Francis et al., 2001; Gatlin et al.,
2007). The interactions between anti-nutritional factors presented in protein ingredients
and micronutrients can also impact the absorption and metabolism of these
micronutrients (Read et al., 2014). The molecules in phytate can strongly attach to
minerals such as calcium, zinc, copper, iron, manganese, nickel and Se to form insoluble
compounds, reducing the bioavailability of these minerals (Francis et al., 2001). The
chelation between phytate and cation groups in protein, amino acids and lipid can also
result in a reduction in the digestibility of these nutrients (Francis et al., 2001).
Meanwhile, the metabolism of minerals in fish might also be compromised due to the
presence of other anti-nutritional factors, such as tannin, saponin, glucosinolates and
gossypol (Antony Jesu Prabhu et al., 2016), consequently depressing the growth, feed
utilisation and mineral absorption in fish, as observed in Atlantic salmon (Storebakken et
al., 1998) and channel catfish (Satoh et al., 1989). However, there could be beneficial
effects of phytate at low concentrations on growth and feed intake when fed to blue
106
Chapter 5 Discussions
tilapia Oreochromis aureus (McClain & Gatlin, 1988) and Atlantic salmon (Carter &
Hauler, 2000). Relative to other plant ingredients, narrow-leafed LKM contains
insignificant levels of phytic acid (0.53 %) and tannins (0.16 %), resulting in low dietary
phytic acid and tannin concentrations in the test diets. In addition, the saponins, trypsin
and chymotrypsin inhibitors found in the narrow-leafed LKM at low concentrations
(574, 0.12 and 0.6 mg/kg, respectively) are unlikely to interfere with the uptake and
absorption of nutrients in fish (Petterson, 2000).
One possible reason for the reduced nutrient digestibility in cobia fed lupin-based diets
could be the presence of oligosaccharides in the diets. The narrow-leafed LKM contains
relatively high levels of oligosaccharides in the forms of raffinose, stachyose and
verbascose (Glencross, 2001; Petterson, 2000), which interact with the digestion of other
nutrients (van Barneveld, 1999) and prevent the activity of digestive enzymes and
substrate transportation in the intestine (Francis et al., 2001), thus reducing nutrient
digestibility as seen in rainbow trout (Glencross et al., 2003a) and Atlantic salmon
(Refstie et al., 1998). Lupin meal also contains a significant amount of carbohydrates
(Gatlin et al., 2007), which are poorly digested by cobia as an energy source (Ren et al.,
2011), resulting in low energy digestibility. In contrast, cobia fed dietary LKM
supplemented with organic Se showed improved growth, feed efficiency and nutrient
digestibility compared with the fish fed diets lacking Se supplementation. A positive
relationship between nutrient digestibility and dietary Se supplementation has been
demonstrated in pigs (Chaudhary et al., 2010) and sheep (Shi et al., 2011), due to the
increased quantity and activities of digestive enzymes induced by dietary Se (Chaudhary
et al., 2010). However, the effects of interaction between dietary Se and plant-derived
protein on feed efficiency and nutrient digestibility has been reported in only one study,
where barramundi showed increased protein digestibility after being fed Se-
supplemented lupin-based diets (Ilham et al., 2016a). In the case of soybean, African
catfish fed plant-based diets with supplemented Se demonstrated increased activities of
protein metabolism enzymes and FI (Abdel-Tawwab et al., 2007). This could be
indirectly associated with the complex mechanism of amino acid-chelated Se (AAC-Se)
ingestion, resulting in increased essential trace element sources when high AAC-Se is
absorbed into mucosal tissues (Ilham et al., 2016a). These elements act as a cofactor in
the synthesis of hydrolytic enzymes, such as gastro-intestinal GPx, which plays
important roles in defending the intestinal mucosal integrity (Lindh, 2013), stimulating
nutrient digestion in fish (Ilham et al., 2016a).
107
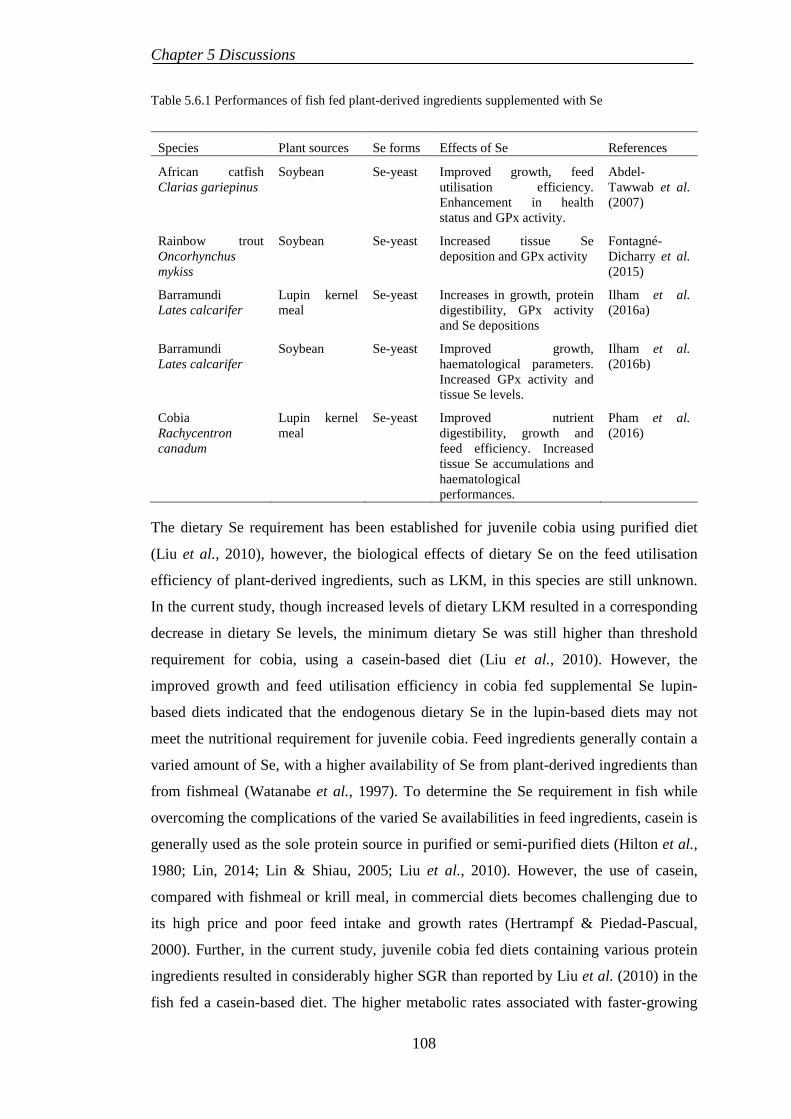
Chapter 5 Discussions
Table 5.6.1 Performances of fish fed plant-derived ingredients supplemented with Se
Species Plant sources Se forms Effects of Se References
African catfish Clarias gariepinus
Soybean Se-yeast Improved growth, feed utilisation efficiency. Enhancement in health status and GPx activity.
Abdel-Tawwab et al. (2007)
Rainbow trout Oncorhynchus mykiss
Soybean Se-yeast Increased tissue Se deposition and GPx activity
Fontagné-Dicharry et al. (2015)
Barramundi Lates calcarifer
Lupin kernel meal
Se-yeast Increases in growth, protein digestibility, GPx activity and Se depositions
Ilham et al. (2016a)
Barramundi Lates calcarifer
Soybean Se-yeast Improved growth, haematological parameters. Increased GPx activity and tissue Se levels.
Ilham et al. (2016b)
Cobia Rachycentron canadum
Lupin kernel meal
Se-yeast Improved nutrient digestibility, growth and feed efficiency. Increased tissue Se accumulations and haematological performances.
Pham et al. (2016)
The dietary Se requirement has been established for juvenile cobia using purified diet
(Liu et al., 2010), however, the biological effects of dietary Se on the feed utilisation
efficiency of plant-derived ingredients, such as LKM, in this species are still unknown.
In the current study, though increased levels of dietary LKM resulted in a corresponding
decrease in dietary Se levels, the minimum dietary Se was still higher than threshold
requirement for cobia, using a casein-based diet (Liu et al., 2010). However, the
improved growth and feed utilisation efficiency in cobia fed supplemental Se lupin-
based diets indicated that the endogenous dietary Se in the lupin-based diets may not
meet the nutritional requirement for juvenile cobia. Feed ingredients generally contain a
varied amount of Se, with a higher availability of Se from plant-derived ingredients than
from fishmeal (Watanabe et al., 1997). To determine the Se requirement in fish while
overcoming the complications of the varied Se availabilities in feed ingredients, casein is
generally used as the sole protein source in purified or semi-purified diets (Hilton et al.,
1980; Lin, 2014; Lin & Shiau, 2005; Liu et al., 2010). However, the use of casein,
compared with fishmeal or krill meal, in commercial diets becomes challenging due to
its high price and poor feed intake and growth rates (Hertrampf & Piedad-Pascual,
2000). Further, in the current study, juvenile cobia fed diets containing various protein
ingredients resulted in considerably higher SGR than reported by Liu et al. (2010) in the
fish fed a casein-based diet. The higher metabolic rates associated with faster-growing
108
Chapter 5 Discussions
fish require sufficient energy to maximize their growth potential (DeVries & Eastman,
1981), resulting in a need to take up more nutrients, including Se. The optimum dietary
Se concentrations quantified for most fish species fed casein-based diets ranged from
0.15 to 0.98 mg/kg (Hilton et al., 1980; Lin, 2014; Lin & Shiau, 2005; Liu et al., 2010),
whereas fish fed fishmeal or plant meal-based diets resulted in relatively higher dietary
Se requirement levels, ranging from 1.62 to 5.35 mg/kg (Abdel-Tawwab et al., 2007; Le
& Fotedar, 2013; Zhu et al., 2012). Even though, fishmeal-based diets can provide
adequate Se to meet the nutritional requirements of some species (Watanabe et al.,
1997), the significantly lower Se digestibility from fishmeal (38.48 – 47 %) compared
with SeMet or Se-yeast (89.48 – 92 %) (Le & Fotedar, 2014a; Watanabe et al., 1997)
and relatively lower concentration of Se in lupin kernel meal (0.35 mg/kg) than fishmeal
(4.37 mg/kg) may result in Se deficiency when fishmeal protein is replaced with lupin
kernel protein, as seen in barramundi (Ilham et al., 2016a) and cobia as in the current
study. Moreover, Barrows et al. (2010) and Read et al. (2014) also reported improved
weight gain in rainbow trout fed plant-based diets supplemented with dietary macro-
minerals and inositol and/or dietary copper and zinc at higher levels than those
previously quantified by the NRC (1993) for the species. Similarly, the beneficial effects
of Se fortification were also observed in African catfish fed soybean-based diets (Abdel-
Tawwab et al., 2007) and barramundi fed plant-based diets (Ilham et al., 2016a), which
may be, in part, a reason for the enhancement of growth and feed utilisation
performances in the current study (Table 5.7.1).
The values of RBC and Hb can provide useful information about oxidative stress and
toxicological impacts in fish as RBCs membranes may be damaged by free radicals
produced in erythrocytes, thus, changing the integrity, size and quantity of RBC, and
finally altering fish health (Kiron et al., 2004). In this study, reduced Hb and RBCs
concentrations was shown in cobia fed dietary lupin meal without Se supplementation,
consistent with a previous report in cobia (Zhou et al., 2005) fed soybean-based diets.
The restriction on RBCs production and Hb synthesis imposed by adverse effects of anti-
nutrients, as previously reported in cobia (Zhou et al., 2005), could constitute the reason.
Conversely, cobia fed dietary lupin meal supplemented with Se did not show any
significant differences in haematological performance compared with fish fed the control
diet. Increased RBC and Hb have been linked to improved health status in fish (Abdel-
Tawwab et al., 2007), due to their important roles in oxygen and carbon dioxide
transportation in the blood and haemoglobin synthesis (Olugbemi et al., 2010). The
increases in the RBC and Hb values in the cobia fed lupin-based diets supplemented with
109
Chapter 5 Discussions
Se can be attributed to the enhancement of fish health stimulated by Se supplementation,
as described in other fish species (Abdel-Tawwab et al., 2007; Ilham et al., 2016a).
In the current study, dietary LKM did not have any effects on protein, ash and dry matter
levels in the muscles of cobia, irrespective of Se supplementation. This is consistent with
the study in gilthead sea bream (Pereira & Oliva-Teles, 2004) and black sea bream
(Zhang et al., 2012) when fed lupin inclusion diets. A deficiency of taurine in plant-
based diets has been linked to the reduced lipid deposition in the tissues of cobia (Lunger
et al., 2007). However, in this study, taurine was added at 5 g/kg to satisfy the nutritional
needs of cobia as quantified by Watson et al. (2014a). Thus, the reduced muscle lipid
contents of cobia fed 315 g/kg LKM diet in the current study might be due to the low
energy intake and energy digestibility, similar to those reported in cobia fed soybean
meal (Zhou et al., 2005), rapeseed meal or corn gluten meal (Luo et al., 2012; Luo et al.,
2013). The Se depositions in cobia tissues had a strong linear relationship with dietary
Se levels, which can be used as a biomarker of dietary Se delineation, as reported in
other carnivorous marine fish (Ilham et al., 2016a; Le & Fotedar, 2014b).
In this study, cobia showed less susceptible to dietary LKM than snapper, where up to
210 mg/kg LKM could be incorporated in diet without compromising growth and feed
intake of cobia. However, the increased FCR and reduced RBC and Hb also were
observed in cobia fed this diet. Besides, the results in this study indicated that cobia, but
not snapper fed a commercial diet containing different protein sources required Se
supplementation to improve their potential growth and feed utilisation efficiency at a
higher concentration than previously determined for purified diet. Thus, it was proposed
that dietary Se supplementation could improve the beneficial effects of lupin meal
inclusion in cobia, but not for snapper due to their relatively low Se requirement.
110
Chapter 6 Conclusions, limitation and recommendations
CHAPTER 6. CONCLUSIONS, RESEARCH LIMITATION AND RECOMMENDATIONS
6.1 CONCLUSIONS
The following points display major conclusions based on the results achieved from the
current study:
• Australian snapper requires a lower concentration of dietary protein than the
currently used diets for barramundi diet.
• Se requirements of Australian snapper are low and can be met by endogenous
Se in the feed ingredients.
• The dietary Se levels of 1.76 and 2.77 mg/kg in the commercial and basal diets,
respectively, can be growth retardant and toxic to the Australian snapper.
• Cobia fed a commercially available feed containing 1.15 mg/kg Se shows signs
of Se deficiency, resulting in reduced growth, feed intake and GPx activities.
• Dietary Se of 3.14 mg/kg has negative effects on the physiological and
histological performances of juvenile cobia.
• The optimal dietary Se level required for juvenile cobia fed a commercial diet is
2.32 mg/kg based on maximal specific growth rate (SGR) using quadratic
regression analysis.
• Cobia shows less susceptibility to dietary lupin kernel meal than snapper. The
snapper responds negatively to any levels of LKM inclusion, while the dietary
inclusion level of 105 g/kg LKM do not impair the growth rates and feed
efficiency, digestibility and health of cobia.
• Up to 210 g/kg LKM can be incorporated in cobia diet without compromising
growth and feed intake.
• Cobia and snapper are capable to digest protein from LKM. Cobia fed diets
including more than 210 g/kg LKM results in the reduced nutrient depositions
and distinct haematological characteristics, whereas this level is only 105 g/kg in
snapper.
• Dietary LKM of 420 g/kg results in the histopathological lesions in the livers of
both snapper and cobia.
• Dietary Se supplementation in lupin-based diet enhances growth and feed
utilisation of juvenile cobia. Up to 40 % of fishmeal protein replaced with
111
Chapter 6 Conclusions, limitation and recommendations
narrow-leafed lupin kernel meal protein with Se supplementation do not cause
any effects on the FW, SGR, FI and FCR of cobia.
• The dietary Se supplementation has no beneficial effects on the muscle
composition and amino acid profiles of cobia, but significantly improves the
haematological parameters and nutrient digestibility of cobia.
6.2 LIMITATIONS
Though the major objectives have been achieved in this study, some limitations are
unavoidable. First, due to the lack of small juvenile snapper, the first feeding trial was
conducted with snapper at larger size than anticipated. As the bigger fish may be less
sensitive to dietary Se than the small one, thus dietary Se supplementation may have
different effects in juvenile snapper. Though, the LKM used in this study contains
relatively lower phytic acid and tannins concentrations, which is unlikely to impair
nutritional and physiological performances of snapper and cobia fed lupin-based diets;
however, the levels of other ANFs such as oligosaccharides and alkaloids have not
determined in this study. Third, based on the results attained in the first experiment, it
was proposed that the endogenous Se presented in various protein ingredients in the
basal diet or commercial marine fish diets could provide sufficient Se to meet nutritional
requirement in snapper. Thus, no experiment was carried out to evaluate the effects of
dietary Se supplementation in snapper fed various inclusion levels of lupin kernel meal.
However, the findings in cobia indicated that there was significant interaction between
dietary Se and lupin on the growth and feed utilisation. Though, the dietary Se
requirement is low in snapper, there is a possibility that the interaction of Se and plant-
derived proteins may enhance the growth and physiological performances when snapper
are fed to a plant-based diet.
6.3 RECOMMENDATIONS
Based on the results and the limitations from this research, the following
recommendations are made for future research.
• The effects of dietary Se supplementation should be evaluated in smaller sized
snapper.
• As the toxicity of Se may be dependent on fish size and feed formulations, the
future research needs to be conducted on different life stages of both snapper and
cobia to investigate the toxicity of Se.
112
Chapter 6 Conclusions, limitation and recommendations
• The interactive effects of organic Se supplementation and plant based diet on the
physiology of snapper.
• The results in this study should be carried out in a commercial fish farming
environment to validate these results.
113
References
REFERENCES
Abdel-Tawwab, M., Mousa, M. A. A., & Abbass, F. E. (2007). Growth performance and physiological response of African catfish, Clarias gariepinus (B.) fed organic selenium prior to the exposure to environmental copper toxicity. Aquaculture, 272(1–4), 335-345.
Antony Jesu Prabhu, P., Schrama, J. W., & Kaushik, S. J. (2016). Mineral requirements of fish: a systematic review. Reviews in Aquaculture, 8(2), 172-219.
AOAC. (1990). Official methods of analysis of the Association of Official Analytical Chemists (15th ed ed.). Arlington, Virginia, USA. The Association of Official Analytical Chemists, 1298 pp
Arteel, G. E., & Sies, H. (2001). The biochemistry of selenium and the glutathione system. Environmental Toxicology and Pharmacology, 10(4), 153-158.
Barceloux, D. G. (1999). Selenium. Journal of Toxicology: Clinical Toxicology, 37(2), 145-172.
Barrows, F. T., Gaylord, T. G., Sealey, W. M., Porter, L., & Smith, C. E. (2008). The effect of vitamin premix in extruded plant-based and fish meal based diets on growth efficiency and health of rainbow trout, Oncorhynchus mykiss. Aquaculture, 283(1–4), 148-155.
Barrows, F. T., Gaylord, T. G., Sealey, W. M., Smith, C. E., & Porter, L. (2010). Supplementation of plant-based diets for rainbow trout (Oncorhynchus mykiss) with macro-minerals and inositol. Aquaculture Nutrition, 16(6), 654-661.
Battaglene, S. C. (1996). Hatchery production of juvenile snapper and mulloway. In N. Quartararo (Ed.), Marine finfish farming. New South Wales: NSW Fisheries Research Institute pp. 9-36
Battaglene, S. C., & Talbot, R. B. (1992). Induced spawning and larval rearing of snapper, Pagrus auratus (Pisces: Sparidae), from Australian waters. New Zealand Journal of Marine and Freshwater Research, 26(2), 179-185.
Becker, K., & Makkar, H. P. S. (1999). Effects of dietary tannic acid and quebracho tannin on growth performance and metabolic rates of common carp (Cyprinus carpio L.). Aquaculture, 175(3–4), 327-335.
Bell, J., & Cowey, C. B. (1989). Digestibility and bioavailability of dietary selenium from fishmeal, selenite, selenomethionine and selenocystine in Atlantic salmon (Salmo salar). Aquaculture, 81(1), 61-68.
Bell, J., Quartararo, N., & Henry, G. W. (1991). Growth of snapper, Pagrus auratus, from south‐eastern Australia in captivity. New Zealand Journal of Marine and Freshwater Research, 25(2), 117-121.
Block, E., Glass, R. S., Jacobsen, N. E., Johnson, S., Kahakachchi, C., Kamiński, R., . . . Uden, P. C. (2004). Identification and Synthesis of a Novel
114
References
Selenium−Sulfur Amino Acid Found in Selenized Yeast: Rapid Indirect Detection NMR Methods for Characterizing Low-Level Organoselenium Compounds in Complex Matrices. Journal of Agricultural and Food Chemistry, 52(12), 3761-3771.
Bolin, D. W., King, R. P., & Klosterman, E. W. (1952). A simplified method for the determination of chromic oxide (Cr 2O3) when used as an index substance. Science, 116(3023), 634-635.
Booth, M. A., Allan, G. L., & Anderson, A. J. (2005). Investigation of the nutritional requirements of Australian snapper Pagrus auratus (Bloch & Schneider, 1801): apparent digestibility of protein and energy sources. Aquaculture Research, 36(4), 378-390.
Booth, M. A., Allan, G. L., & Anderson, A. J. (2007). Investigation of the nutritional requirements of Australian snapper Pagrus auratus (Bloch & Schneider, 1801): effects of digestible energy content on utilization of digestible protein. Aquaculture Research, 38(4), 429-440.
Booth, M. A., Allan, G. L., & Anderson, A. J. (2012). Influence of poultry meal, meat meal or soybean meal inclusion on weight gain and production characteristics of Australian snapper Pagrus auratus. Aquaculture International, 20(1), 99-115.
Booth, M. A., Anderson, A. J., & Allan, G. L. (2006). Investigation of the nutritional requirements of Australian snapper Pagrus auratus (Bloch & Schneider 1801): digestibility of gelatinized wheat starch and clearance of an intra-peritoneal injection of d-glucose. Aquaculture Research, 37(10), 975-985.
Booth, M. A., Tucker, B. J., Allan, G. L., & Fielder, D. S. (2008). Effect of feeding regime and fish size on weight gain, feed intake and gastric evacuation in juvenile Australian snapper Pagrus auratus. Aquaculture, 282(1–4), 104-110.
Borquez, A., Serrano, E., Dantagnan, P., Carrasco, J., & Hernandez, A. (2011). Feeding high inclusion of whole grain white lupin (Lupinus albus) to rainbow trout (Oncorhynchus mykiss): effects on growth, nutrient digestibility, liver and intestine histology and muscle fatty acid composition. Aquaculture Research, 42(8), 1067-1078.
Bouraoui, L., SÁNchez-Gurmaches, J., Cruz-Garcia, L., GutiÉRrez, J., Benedito-Palos, L., PÉRez-SÁNchez, J., & Navarro, I. (2011). Effect of dietary fish meal and fish oil replacement on lipogenic and lipoprotein lipase activities and plasma insulin in gilthead sea bream (Sparus aurata). Aquaculture Nutrition, 17(1), 54-63.
Briggs, J. C. (1960). Fishes of worldwide (circumtropical) distribution. Copeia, 3, 71 - 180.
Brown - Peterson , N. J., Overstreet , R. M., Lotz , J. M., Franks , J. S., & Burns , K. M. (2001). Reproductive biology of cobia, Rachycentron canadum, from coastal waters of the southern United States. Fisheries Bulletin, 99, 15 - 28.
115
References
Bügel, S., Larsen, E. H., Sloth, J. J., Flytlie, K., Overvad, K., Steenberg, L. C., & Moesgaard, S. (2008). Absorption, excretion, and retention of selenium from a high selenium yeast in men with a high intake of selenium. Food & Nutrition Research, 52, 10.3402/fnr.v3452i3400.1642.
Bureau, D. P., Kaushik, S. J., & Cho, C. Y. (2002). Bioenergetics. In J. E. Halver & R. W. Hardy (Eds.), Fish Nutrition (3rd ed.). New York, USA: Academic Press, Elsevier Science. pp. 1-59
Burk, R. F. (1976). Selenium in man. In A. S. Prasad (Ed.), Trace elements in human health and disease. London: Academic Press. pp. 105-133
Burk, R. F., & Hill, K. E. (1993). Regulation of Selenoproteins. Annual Review of Nutrition, 13(1), 65-81.
Burk, R. F., & Hill, K. E. (2009). Selenoprotein P—Expression, functions, and roles in mammals. Biochimica et Biophysica Acta (BBA) - General Subjects, 1790(11), 1441-1447.
Burk, R. F., Hill, K. E., Awad, J. A., Morrow, J. D., & Lyons, P. R. (1995). Liver and kidney necrosis in selenium-deficient rats depleted of glutathione. Laboratory Investigation, 72(6), 723-730.
Carter, C. G., & Hauler, R. C. (2000). Fish meal replacement by plant meals in extruded feeds for Atlantic salmon, Salmo salar L. Aquaculture, 185(3–4), 299-311.
Catacutan, M. R., & Pagador, G. E. (2004). Partial replacement of fishmeal by defatted soybean meal in formulated diets for the mangrove red snapper, Lutjanus argentimaculatus (Forsskal 1775). Aquaculture Research, 35(3), 299-306.
Chaudhary, M., Garg, A. K., Mittal, G. K., & Mudgal, V. (2010). Effect of organic selenium supplementation on growth, Se uptake, and nutrient utilization in Guinea pigs. Biological Trace Element Research, 133(2), 217-226.
Cho, C. Y. (1992). Feeding systems for rainbow trout and other salmonids with reference to current estimates of energy and protein requirements. Aquaculture, 100(1), 107-123.
Cho, C. Y., & Bureau, D. P. (2001). A review of diet formulation strategies and feeding systems to reduce excretory and feed wastes in aquaculture. Aquaculture Research, 32, 349-360.
Cho, C. Y., Slinger, S. J., & Bayley, H. S. (1982). Bioenergetics of salmonid fishes: Energy intake, expenditure and productivity. Comparative Biochemistry and Physiology Part B: Comparative Biochemistry, 73(1), 25-41.
Chou, R. L., Her, B. Y., Su, M. S., Hwang, G., Wu, Y. H., & Chen, H. Y. (2004). Substituting fish meal with soybean meal in diets of juvenile cobia Rachycentron canadum. Aquaculture, 229(1–4), 325-333.
116
References
Chou, R. L., Su, M. S., & Chen, H. Y. (2001). Optimal dietary protein and lipid levels for juvenile cobia (Rachycentron canadum). Aquaculture, 193(1–2), 81-89.
Cotter, P. A. (2006). Selenium nutrition of hybrid striped bass. Virginia Polytechnic Institute and State University, Blacksburg, Virginia
Cotter, P. A., Craig, S. R., & McLean, E. (2008). Hyperaccumulation of selenium in hybrid striped bass: a functional food for aquaculture? Aquaculture Nutrition, 14(3), 215-222.
Craig, S. R., Schwarz, M. H., & McLean, E. (2006). Juvenile cobia (Rachycentron canadum) can utilize a wide range of protein and lipid levels without impacts on production characteristics. Aquaculture, 261(1), 384-391.
Dabrowska, H., Meyer-Burgdorff, K. H., & Gunther, K.-D. (1991). Magnesium status in freshwater fish, common carp (Cyprinus carpio, L.) and the dietary protein-magnesium interaction. Fish Physiology and Biochemistry, 9(2), 165-172.
Dang, F., & Wang, W.-X. (2011). Antagonistic interaction of mercury and selenium in a marine fish is dependent on their chemical species. Environmental Science & Technology, 45(7), 3116-3122.
de la Higuera, M. (2001). Effects of nutritional factors and feed characteristics on feed intake. In D. Houlihan, T. Boujard, & M. Jobling (Eds.), Food intake in fish. Oxford, UK: Blackwell Science. pp. 250-268
De Riu, N., Lee, J.-W., Huang, S. S. Y., Moniello, G., & Hung, S. S. O. (2014). Effect of dietary selenomethionine on growth performance, tissue burden, and histopathology in green and white sturgeon. Aquatic Toxicology, 148(0), 65-73.
Department of Fisheries. (2011). Fisheries fact sheets: Pink snapper http://www.fish.wa.gov.au/Documents/recreational_fishing/fact_sheets/fact_sheet_pink_snapper.pdf (accessed 4 April 2016).
DeVries, A. L., & Eastman, J. T. (1981). Physiology and ecology of notothenioid fishes of the Ross Sea. Journal of Royal Society of New Zealand, 11(4), 329-340.
Duke, J. A. (1981). Handbook of legumes of world economic importance. New York, USA: Plenum Presspp
Egerer-Sieber, C., Herl, V., Müller-Uri, F., Kreis, W., & Muller, Y. A. (2006). Crystallization and preliminary crystallographic analysis of selenomethionine-labelled progesterone 5β-reductase from Digitalis lanata Ehrh. Acta Crystallographica Section F: Structural Biology and Crystallization Communications, 62(Pt 3), 186-188.
Embaby, H. E. S. (2011). Effect of heat treatments on certain antinutrients and in vitro protein digestibility of peanut and sesame seeds. Food Science and Technology Research, 17(1), 31-38.
117
References
Espe, M. (2008). 9 - Understanding factors affecting flesh quality in farmed fish A2 - Lie, Øyvind Improving Farmed Fish Quality and Safety: Woodhead Publishing. pp. 241-264
Espe, M., El-Mowafi, A., & Ruohonen, K. (2012). Replacement of Fishmeal with Plant Protein Ingredients in Diets to Atlantic Salmon (Salmo salar) – Effects on Weight Gain and Accretion. In Z. A. Muchlisin (Ed.), Aquaculture (pp. 43-58): InTech.
FAO. (2012). The state of world fisheries and aquaculture 2012. FAO Fisheries and Aquaculture Department. Rome. pp. 147
Farhangi, M., & Carter, C. G. (2001). Growth, physiological and immunological responses of rainbow trout (Oncorhynchus mykiss) to different dietary inclusion levels of dehulled lupin (Lupinus angustifolius). Aquaculture Research, 32(s1), 329-340.
Felton, S. P., Landolt, M. L., Grace, R., & Palmisano, A. (1996). Effects of selenium dietary enhancement on hatchery-reared coho salmon, Oncorhynchus kisutch (Walbaum), when compared with wild coho: hepatic enzymes and seawater adaptation evaluated. Aquaculture Research, 27(2), 135-142.
Fielder, D. S., Bardsley, W. J., & Allan, G. L. (2001). Survival and growth of Australian snapper, Pagrus auratus, in saline groundwater from inland New South Wales, Australia. Aquaculture, 201(1–2), 73-90.
Fish, B. C., & Thompson, L. U. (1991). Lectin-tannin interactions and their influence on pancreatic amylase activity and starch digestibility. Journal of Agricultural and Food Chemistry, 39(4), 727-731.
Flores-Soto, M. E., Bañuelos-Pineda, J., Orozco-Suárez, S., Schliebs, R., & Beas-Zárate, C. (2006). Neuronal damage and changes in the expression of muscarinic acetylcholine receptor subtypes in the neonatal rat cerebral cortical upon exposure to sparteine, a quinolizidine alkaloid. International Journal of Developmental Neuroscience, 24(6), 401-410.
Fontagné-Dicharry, S., Godin, S., Liu, H., Antony Jesu Prabhu, P., Bouyssière, B., Bueno, M., . . . Kaushik, S. J. (2015). Influence of the forms and levels of dietary selenium on antioxidant status and oxidative stress-related parameters in rainbow trout (Oncorhynchus mykiss) fry. British Journal of Nutrition, 113(12), 1876-1887.
Forster, I., & Ogata, H. Y. (1998). Lysine requirement of juvenile Japanese flounder Paralichthys olivaceus and juvenile red sea bream Pagrus major. Aquaculture, 161(1–4), 131-142.
Foster, L. H., & Sumar, S. (1997). Selenium in health and disease: A review. Critical Reviews in Food Science and Nutrition, 37(3), 211-228.
Francis, G., Makkar, H. P. S., & Becker, K. (2001). Antinutritional factors present in plant-derived alternate fish feed ingredients and their effects in fish. Aquaculture, 199(3–4), 197-227.
118
References
Franks, J. S., Warren, J. R., & Buchanan, M. V. (1999). Age and growth of cobia, Rachycentron canadum, from the northeastern Gulf of Mexico. Fishery Bulletin, 97(3), 459-471.
Fraser, T. W. K., & Davies, S. J. (2009). Nutritional requirements of cobia, Rachycentron canadum (Linnaeus): a review. Aquaculture Research, 40(11), 1219-1234.
Freeland, W. J., Calcott, P. H., & Anderson, L. R. (1985). Tannins and saponin: Interaction in herbivore diets. Biochemical Systematics and Ecology, 13(2), 189-193.
Fuiman, L. A. (2002). Special considerations of fish eggs and larvae (R. G. Werner & L. A. Fuiman Eds.): Malden, MA : Blackwell Science pp
Gatlin, D. M., Barrows, F. T., Brown, P., Dabrowski, K., Gaylord, T. G., Hardy, R. W., . . . Wurtele, E. (2007). Expanding the utilization of sustainable plant products in aquafeeds: a review. Aquaculture Research, 38(6), 551-579.
Gatlin, D. M., Poe, W. E., & Wilson, R. P. (1986). Effects of singular and combined dietary deficiencies of selenium and vitamin E on fingerling channel catfish (Ictalurus punctatus). The Journal of Nutrition, 116(6), 1061-1067.
Gatlin, D. M., & Wilson, R. P. (1984). Dietary selenium requirement of fingerling channel catfish. Journal of Nutrition, 114(3), 627-633.
Gaylord, T. G., Teague, A. M., & Barrows, F. T. (2006). Taurine Supplementation of All-plant Protein Diets for Rainbow Trout (Oncorhynchus mykiss). Journal of the World Aquaculture Society, 37(4), 509-517.
Glencross, B. (2001). Feeding lupins to fish : a review of the nutritional and biological value of lupins in aquaculture feeds. North Beach, W.A: Dept. of Fisheries, Research Division.117 pp
Glencross, B., Boujard, T., & Kaushik, S. (2003a). Influence of oligosaccharides on the digestibility of lupin meals when fed to rainbow trout, Oncorhynchus mykiss. Aquaculture, 219(1–4), 703-713.
Glencross, B., Carter, C., Duijster, N., Evans, D., Dods, K., McCafferty, P., . . . Sipsas, S. (2004a). A comparison of the digestibility of a range of lupin and soybean protein products when fed to either Atlantic salmon (Salmo salar) or rainbow trout (Oncorhynchus mykiss). Aquaculture, 237(1–4), 333-346.
Glencross, B., Curnow, J., Hawkins, W., Kissil, G. W. M., & Peterson, D. (2003b). Evaluation of the feed value of a transgenic strain of the narrow-leaf lupin (Lupinus angustifolius) in the diet of the marine fish, Pagrus auratus. Aquaculture Nutrition, 9(3), 197-206.
Glencross, B., Evans, D., Hawkins, W., & Jones, B. (2004b). Evaluation of dietary inclusion of yellow lupin (Lupinus luteus) kernel meal on the growth, feed utilisation and tissue histology of rainbow trout (Oncorhynchus mykiss). Aquaculture, 235(1–4), 411-422.
119
References
Glencross, B., & Hawkins, W. (2004). A comparison of the digestibility of lupin (Lupinus sp.) kernel meals as dietary protein resources when fed to either, rainbow trout, Oncorhynchus mykiss or red seabream, Pagrus auratus. Aquaculture Nutrition, 10(2), 65-73.
Glencross, B., Hawkins, W., & Curnow, J. (2003c). Evaluation of canola oils as alternative lipid resources in diets for juvenile red seabream, Pagrus auratus. Aquaculture Nutrition, 9(5), 305-315.
Glencross, B., Hawkins, W., & Curnow, J. (2004c). Nutritional assessment of Australian canola meals. I. Evaluation of canola oil extraction method and meal processing conditions on the digestible value of canola meals fed to the red seabream (Pagrus auratus, Paulin). Aquaculture Research, 35(1), 15-24.
Glencross, B., Hawkins, W., & Curnow, J. (2004d). Nutritional assessment of Australian canola meals. II. Evaluation of the influence of the canola oil extraction method on the protein value of canola meals fed to the red seabream (Pagrus auratus, Paulin). Aquaculture Research, 35(1), 25-34.
Glencross, B., Rutherford, N., & Jones, B. (2011). Evaluating options for fishmeal replacement in diets for juvenile barramundi (Lates calcarifer). Aquaculture Nutrition, 17(3), e722-e732.
Glencross, B., Sweetingham, M., & Hawkins, W. (2010). A digestibility assessment of pearl lupin (Lupinus mutabilis) meals and protein concentrates when fed to rainbow trout (Oncorhynchus mykiss). Aquaculture, 303(1–4), 59-64.
Goldstein, W. S., & Spencer, K. C. (1985). Inhibition of Cyanogenesis by tannins. Journal of Chemical Ecology, 11(7), 847-858.
Gómez-Requeni, P., Mingarro, M., Calduch-Giner, J. A., Médale, F., Martin, S. A. M., Houlihan, D. F., . . . Pérez-Sánchez, J. (2004). Protein growth performance, amino acid utilisation and somatotropic axis responsiveness to fish meal replacement by plant protein sources in gilthead sea bream (Sparus aurata). Aquaculture, 232(1–4), 493-510.
Gu, M., Kortner, T. M., Penn, M., Hansen, A. K., & Krogdahl, Å. (2014). Effects of dietary plant meal and soya-saponin supplementation on intestinal and hepatic lipid droplet accumulation and lipoprotein and sterol metabolism in Atlantic salmon (Salmo salar L.). British Journal of Nutrition, 111(03), 432-444.
Haddad, J., Greiner, R., & Allaf, K. (2007). Effect of instantaneous controlled pressure drop on the phytate content of lupin. LWT - Food Science and Technology, 40(3), 448-453.
Han, D., Xie, S., Liu, M., Xiao, X., Liu, H., Zhu, X., & Yang, Y. (2011). The effects of dietary selenium on growth performances, oxidative stress and tissue selenium concentration of gibel carp (Carassius auratus gibelio). Aquaculture Nutrition, 17(3), e741-e749.
120
References
Hao, X., Ling, Q., & Hong, F. (2014). Effects of dietary selenium on the pathological changes and oxidative stress in loach (Paramisgurnus dabryanus). Fish Physiology and Biochemistry, 40(5), 1313-1323.
Haratake, M., Hongoh, M., Miyauchi, M., Hirakawa, R., Ono, M., & Nakayama, M. (2008). Albumin-Mediated Selenium Transfer by a Selenotrisulfide Relay Mechanism. Inorganic Chemistry, 47(14), 6273-6280.
Hardy, R. W. (2010). Utilization of plant proteins in fish diets: effects of global demand and supplies of fishmeal. Aquaculture Research, 41(5), 770-776.
Hemre, G. I., Mommsen, T. P., & Krogdahl, Å. (2002). Carbohydrates in fish nutrition: effects on growth, glucose metabolism and hepatic enzymes. Aquaculture Nutrition, 8(3), 175-194.
Hertrampf, J. W., & Piedad-Pascual, F. (2000). Handbook on ingredients for aquaculture feeds. Netherlands: Kluwer Academic Publishserpp
Hilton, J. W., Hodson, P. V., & Slinger, S. J. (1980). The requirement and toxicity of selenium in rainbow trout (Salmo Gairdneri). The Journal of Nutrition, 110(12), 2527-2535.
Hilton, J. W., Hodson, P. V., & Slinger, S. J. (1982). Absorption, distribution, half-life and possible routes of elimination of dietary selenium in juvenile rainbow trout (Salmo gairdneri). Comparative Biochemistry and Physiology Part C: Comparative Pharmacology, 71(1), 49-55.
Hinton, D. E., Segner, H., Au, D. T., Kullman, S. W., & Hardman, R. C. (2008). Liver toxicity. In R. T. Di Giulio & D. E. Hinton (Eds.), The toxicology of fishes (pp. 327-400): CRC Press.
Hodson, P. V., & Hilton, J. W. (1983). The Nutritional Requirements and Toxicity to Fish of Dietary and Waterborne Selenium. Ecological Bulletins(35), 335-340.
Hoffman, D., Sanderson, C., LeCaptain, L., Cromartie, E., & Pendleton, G. (1992). Interactive effects of arsenate, selenium, and dietary protein on survival, growth, and physiology in mallard ducklings. Archives of Environmental Contamination and Toxicology, 22(1), 55-62.
Houlihan, D. F., Hall, S. J., Gray, C., & Noble, B. S. (1988). Growth rates and protein turnover in Atlantic cod, Gadus morhua. Canadian Journal of Fisheries and Aquatic Sciences, 45(6), 951-964.
Huang, S. S. Y., Oo, A. N., Higgs, D. A., Brauner, C. J., & Satoh, S. (2007). Effect of dietary canola oil level on the growth performance and fatty acid composition of juvenile red sea bream, Pagrus major. Aquaculture, 271(1–4), 420-431.
Ilham, Fotedar, R., & Munilkumar, S. (2016a). Effects of organic selenium supplementation on growth, glutathione peroxidase activity and histopathology in juvenile barramundi (Lates calcarifer Bloch 1970) fed high lupin meal-based diets. Aquaculture, 457, 15-23.
121
References
Ilham, I., Siddik, M. A. B., & Fotedar, R. (2016b). Effects of organic selenium supplementation on growth, accumulation, haematology and histopathology of juvenile barramundi (Lates calcarifer) fed high soybean meal diets. Biological Trace Element Research, 1-12.
Janz, D. M., DeForest, D. K., Brooks, M. L., Chapman, P. M., Gilron, G., Hoff, D., . . . Wayland, M. (2010). Selenium toxicity to aquatic organisms. In W. J. A. P.M. Chapman, M.L. Brooks, C.G. Delos, S.N. Luoma, W.A. Maher, H.M. Ohlendorf, T.S. Presser and & D. P.Shaw (Eds.), Ecological assessment of selenium in the aquatic environment. Florida, USA: CRC Press. pp. 141-231
Jaramillo, J. F., Peng, L., & Gatlin, I., D. M. (2009). Selenium nutrition of hybrid striped bass (Morone chrysops × M. saxatilis) bioavailability, toxicity and interaction with vitamin e. Aquaculture Nutrition, 15(2), 160-165.
Jobling, M., Covés, D., Damsgård, B., Kristiansen, H. R., Koskela, J., Petursdottir, T. E., . . . Gudmundsson, O. (2007). Techniques for measuring feed intake. In D. Houlihan, T. Boujard, & M. Jobling (Eds.), Food Intake in Fish: Blackwell Science Ltd. pp. 49-87
Jovanovic, A., Grubor‐Lajsic, G., Djukic, N., Gardinovacki, G., Matic, A., Spasic, M., & Pritsos, C. A. (1997). The effect of selenium on antioxidant system in erythrocytes and liver of the carp (Cyprinus carpio L.). Critical Reviews in Food Science and Nutrition, 37(5), 443-448.
Kader, M. A., Koshio, S., Ishikawa, M., Yokoyama, S., & Bulbul, M. (2010). Supplemental effects of some crude ingredients in improving nutritive values of low fishmeal diets for red sea bream, Pagrus major. Aquaculture, 308(3–4), 136-144.
Kaiser, J. B., & Holt, G. J. (2005). Species profile cobia. SRAC Publication No. 7202.
Kaushik, S. J., & Hemre, G. I. (2008). 12 - Plant proteins as alternative sources for fish feed and farmed fish quality. In Ø. Lie (Ed.), Improving Farmed Fish Quality and Safety: Woodhead Publishing. pp. 300-327
Kaushik, S. J., & Seiliez, I. (2010). Protein and amino acid nutrition and metabolism in fish: current knowledge and future needs. Aquaculture Research, 41(3), 322-332.
Kim, J.-D., Tibbetts, S. M., Milley, J. E., & Lall, S. P. (2007). Effect of the incorporation level of dehulled soybean meal into test diet on apparent digestibility coefficients for protein and energy by juvenile haddock, Melanogrammus aeglefinus L. Aquaculture, 267(1–4), 308-314.
Kiron, V., Puangkaew, J., Ishizaka, K., Satoh, S., & Watanabe, T. (2004). Antioxidant status and nonspecific immune responses in rainbow trout (Oncorhynchus mykiss) fed two levels of vitamin E along with three lipid sources. Aquaculture, 234(1–4), 361-379.
122
References
KÜÇÜKbay, F. Z., Yazlak, H., Karaca, I., Sahin, N., Tuzcu, M., Cakmak, M. N., & Sahin, K. (2009). The effects of dietary organic or inorganic selenium in rainbow trout (Oncorhynchus mykiss) under crowding conditions. Aquaculture Nutrition, 15(6), 569-576.
Kumar, V., Sinha, A. K., Makkar, H. P. S., De Boeck, G., & Becker, K. (2012). Phytate and phytase in fish nutrition. Journal of Animal Physiology and Animal Nutrition, 96(3), 335-364.
Langar, H., Guillaume, J., Metailler, R., & Fauconneau, B. (1993). Augmentation of Protein Synthesis and Degradation by Poor Dietary Amino Acid Balance in European Sea Bass (Dicentrarchus labrax). The Journal of Nutrition, 123(10), 1754-1761.
Le Boucher, R., Quillet, E., Vandeputte, M., Lecalvez, J. M., Goardon, L., Chatain, B., . . . Dupont-Nivet, M. (2011). Plant-based diet in rainbow trout (Oncorhynchus mykiss Walbaum): Are there genotype-diet interactions for main production traits when fish are fed marine vs. plant-based diets from the first meal? Aquaculture, 321(1–2), 41-48.
Le, K. T., Dao, T. T., Fotedar, R., & Partrigde, G. (2014a). Effects of variation in dietary contents of selenium and vitamin E on growth and physiological and haematological responses of yellowtail kingfish, Seriola lalandi. Aquaculture International, 22(2), 435-446.
Le, K. T., & Fotedar, R. (2013). Dietary selenium requirement of yellowtail kingfish (Seriola lalandi). Agricultural Science, 4(6A), 68-75.
Le, K. T., & Fotedar, R. (2014a). Bioavailability of selenium from different dietary sources in yellowtail kingfish (Seriola lalandi). Aquaculture, 420–421, 57-62.
Le, K. T., & Fotedar, R. (2014b). Toxic effects of excessive levels of dietary selenium in juvenile yellowtail kingfish (Seriola lalandi). Aquaculture, 433, 229-234.
Le, K. T., Fotedar, R., & Partridge, G. (2014b). Selenium and vitamin E interaction in the nutrition of yellowtail kingfish (Seriola lalandi): physiological and immune responses. Aquaculture Nutrition, 20(3), 303-313.
Lee, S., Lee, J.-H., & Bai, S. C. (2008). A Preliminary Study on Effects of Different Dietary Selenium (Se) Levels on Growth Performance and Toxicity in Juvenile Black Seabream, Acathopagrus schlegeli (Bleeker) Asian-Australasian Journal of Animal Sciences, 21(12), 1794-1799.
Lee, S., Lee, J.-H., Bai, S. C., & Hung, S. S. O. (2010). Evaluation of the Dietary Toxic Level of Selenium (Se) in Juvenile Olive Flounder, Paralichthys olivaceus. Journal of the World Aquaculture Society, 41, 245-254.
Lemly, A. D. (2002a). Selenium Assessment in Aquatic Ecosystems: A Guide for Hazard Evaluation and Water Quality Criteria. New York: Springer.161 pp
123
References
Lemly, A. D. (2002b). Symptoms and implications of selenium toxicity in fish: the Belews Lake case example. Aquatic Toxicology, 57(1–2), 39-49.
Lemly, D. A. (1993). Metabolic stress during winter increases the toxicity of selenium to fish. Aquatic Toxicology, 27(1–2), 133-158.
Levander, O. A., Alfthan, G., Arvilommi, H., Gref, C. G., Huttunen, J. K., Kataja, M., . . . Pikkarainen, J. (1983). Bioavailability of selenium to Finnish men as assessed by platelet glutathione peroxidase activity and other blood parameters. The American Journal of Clinical Nutrition, 37(6), 887-897.
Liao, I. C., Huang, T.-S., Tsai, W.-S., Hsueh, C.-M., Chang, S.-L., & Leaño, E. M. (2004). Cobia culture in Taiwan: current status and problems. Aquaculture, 237(1–4), 155-165.
Lin, Y.-H. (2014). Effects of dietary organic and inorganic selenium on the growth, selenium concentration and meat quality of juvenile grouper Epinephelus malabaricus. Aquaculture, 430, 114-119.
Lin, Y.-H., & Shiau, S.-Y. (2005). Dietary selenium requirements of juvenile grouper, Epinephelus malabaricus. Aquaculture, 250(1–2), 356-363.
Lin, Y.-H., & Shiau, S.-Y. (2009). Mutual sparing of dietary requirements for alpha-tocopherol and selenium in grouper, Epinephelus malabaricus. Aquaculture, 294(3–4), 242-245.
Lindh, U. (2013). Biological Functions of the Elements. In O. Selinus (Ed.), Essentials of Medical Geology: Revised Edition. Dordrecht: Springer Netherlands. pp. 129-177
Liu, G., Zheng, L., Duzgoren-Aydin, N., Gao, L., Liu, J., & Peng, Z. (2007). Health Effects of Arsenic, Fluorine, and Selenium from Indoor Burning of Chinese Coal. In D. Whitacre, G. Ware, H. Nigg, D. Doerge, L. Albert, P. de Voogt, C. Gerba, O. Hutzinger, J. Knaak, F. Mayer, D. P. Morgan, D. Park, R. Tjeerdema, R. H. Yang, & F. Gunther (Eds.), Reviews of Environmental Contamination and Toxicology (Vol. 189): Springer New York. pp. 89-106
Liu, K., Wang, X. J., Ai, Q., Mai, K., & Zhang, W. (2010). Dietary selenium requirement for juvenile cobia, Rachycentron canadum L. Aquaculture Research, 41(10), e594-e601.
Lorentzen, Maage, & Julshamn. (1998). Supplementing copper to a fish meal based diet fed to Atlantic salmon parr affects liver copper and selenium concentrations. Aquaculture Nutrition, 4(1), 67-72.
Lorentzen, M., Maage, A., & Julshamn, K. (1994). Effects of dietary selenite or selenomethionine on tissue selenium levels of Atlantic salmon (Salmo salar). Aquaculture, 121(4), 359-367.
Luísa Maria Pinheiro Valente, n., Fauconneau, B., & Emídio Ferreira dos Santos Gomes, n. (1998). Voluntary feed intake, feed and nutrient utilisation in slow
124
References
and fast growing rainbow trout strains. Aquatic Living Resources, 11(02), 93-99.
Lunger, A. N., Craig, S. R., & McLean, E. (2006). Replacement of fish meal in cobia (Rachycentron canadum) diets using an organically certified protein. Aquaculture, 257(1–4), 393-399.
Lunger, A. N., McLean, E., Gaylord, T. G., Kuhn, D., & Craig, S. R. (2007). Taurine supplementation to alternative dietary proteins used in fish meal replacement enhances growth of juvenile cobia (Rachycentron canadum). Aquaculture, 271(1–4), 401-410.
Luo, Y., Ai, Q., Mai, K., Zhang, W., Xu, W., & Zhang, Y. (2012). Effects of dietary rapeseed meal on growth performance, digestion and protein metabolism in relation to gene expression of juvenile cobia (Rachycentron canadum). Aquaculture, 368–369(0), 109-116.
Luo, Y., Ai, Q., Mai, K., Zhang, W., Xu, W., Zhang, Y., & Liufu, Z. (2013). Effects of dietary corn gluten meal on growth performance and protein metabolism in relation to IGF-I and TOR gene expression of juvenile cobia (Rachycentron canadum). Journal of Ocean University of China, 12(3), 418-426.
Luten, J., Schram, E., & Elvevoll, E. (2008). 14 - Tailor-made functional seafood for consumers: dietary modulation of selenium and taurine in farmed fish. In Ø. Lie (Ed.), Improving Farmed Fish Quality and Safety: Woodhead Publishing. pp. 343-362
Mai, K., Xiao, L., Ai, Q., Wang, X., Xu, W., Zhang, W., . . . Ren, M. (2009). Dietary choline requirement for juvenile cobia, Rachycentron canadum. Aquaculture, 289(1–2), 124-128.
Maier, K. J., & Knight, A. W. (1994). Ecotoxicology of selenium in freshwater systems. In G. War (Ed.), Reviews of Environmental Contamination and Toxicology. New York, USA: Springer. pp. 31-48
Matsunari, H., Yamamoto, T., Kim, S.-K., Goto, T., & Takeuchi, T. (2008). Optimum dietary taurine level in casein-based diet for juvenile red sea bream Pagrus major. Fisheries Science, 74(2), 347-353.
McClain, W. R., & Gatlin, D. M. (1988). Dietary zinc requirement of Oreochromis aureus and effects of dietary calcium and phytate on zinc bioavailability. Journal of the World Aquaculture Society, 19(2), 103-108.
Mechaly, A., Teplitsky, A., Belakhov, V., Baasov, T., Shoham, G., & Shoham, Y. (2000). Overproduction and characterization of seleno-methionine xylanase T-6. Journal of Biotechnology, 78(1), 83-86.
Meyer, G., & Fracalossi, D. M. (2004). Protein requirement of jundia fingerlings, Rhamdia quelen, at two dietary energy concentrations. Aquaculture, 240(1–4), 331-343.
125
References
Meyer, G. H., & Franks, J. S. (1996). Food of cobia, Rachycentron canadum, from the Northcentral Gulf of Mexico Gulf Research Reports, 9(3), 161-167.
Molvig, L., Tabe, L. M., Eggum, B. O., Moore, A. E., Craig, S., Spencer, D., & Higgins, T. J. V. (1997). Enhanced methionine levels and increased nutritive value of seeds of transgenic lupins (Lupinus angustifolius L.) expressing a sunflower seed albumin gene. Proceedings of the National Academy of Sciences of the United States of America, 94(16), 8393-8398.
Morais, S., Bell, J. G., Robertson, D. A., Roy, W. J., & Morris, P. C. (2001). Protein/lipid ratios in extruded diets for Atlantic cod (Gadus morhua L.): effects on growth, feed utilisation, muscle composition and liver histology. Aquaculture, 203(1–2), 101-119.
Nguyen, H. Q., Tran, T. M., Reinertsen, H., & Kjørsvik, E. (2010). Effects of dietary essential fatty acid levels on broodstock spawning performance and egg fatty acid composition of cobia, Rachycentron canadum. Journal of the World Aquaculture Society, 41(5), 687-699.
Nguyen, M. V., Rønnestad, I., Buttle, L., Van Lai, H., & Espe, M. (2014). Imbalanced lysine to arginine ratios reduced performance in juvenile cobia (Rachycentron canadum) fed high plant protein diets. Aquaculture Nutrition, 20(1), 25-35.
Nhu, V. C., Nguyen, H. Q., Le, T. L., Tran, M. T., Sorgeloos, P., Dierckens, K., . . . Svennevig, N. (2011). Cobia Rachycentron canadum aquaculture in Vietnam: Recent developments and prospects. Aquaculture, 315(1–2), 20-25.
Nortvedt, R., & Tuene, S. (1998). Body composition and sensory assessment of three weight groups of Atlantic halibut (Hippoglossus hippoglossus) fed three pellet sizes and three dietary fat levels. Aquaculture, 161(1–4), 295-313.
NRC, N. R. C. (1993). Nutrient Requirements of Fish. Washington, DC, USA: National Academies Presspp
NRC, N. R. C. (2011). Nutrient requirements of fish and shrimp. Washington, DC: National Academy Presspp
Olsen, R. L., & Hasan, M. R. (2012). A limited supply of fishmeal: Impact on future increases in global aquaculture production. Trends in Food Science & Technology, 27(2), 120-128.
Olugbemi, T. S., Mutayoba, S. K., & Lekule, F. P. (2010). Effect of Moringa (Moringa oleifera) inclusion in cassava based diets fed to broiler chickens. International Journal of Poultry Science, 9(4), 363-367.
Olver, M. D., & Jonker, A. (1997). Effect of sweet, bitter and soaked micronised bitter lupins on broiler performance. British Poultry Science, 38(2), 203-208.
Omnes, M. H., Silva, F. C. P., Moriceau, J., Aguirre, P., Kaushik, S., & Gatesoupe, F. J. (2015). Influence of lupin and rapeseed meals on the integrity of digestive
126
References
tract and organs in gilthead seabream (Sparus aurata L.) and goldfish (Carassius auratus L.) juveniles. Aquaculture Nutrition, 21(2), 223-233.
Papatryphon, E., Howell, R. A., & Soares, J. H. (1999). Growth and mineral absorption by striped bass Morone saxatilis fed a plant feedstuff based diet supplemented with phytase. Journal of the World Aquaculture Society, 30(2), 161-173.
Paripatananont, T., & Lovell, R. T. (1997). Comparative net absorption of chelated and inorganic trace minerals in channel catfish Ictalurus punctatus diets. Journal of the World Aquaculture Society, 28(1), 62-67.
Partridge, G. J., Jenkins, G. I., & Frankish, K. R. (2003). Hatchery manual for the production of snapper (Pagrus auratus) and black bream (Acanthopagrus butcheri). South Metropolitan College of TAFE: Aquaculture Development Unit.152 pp
Patridge, G., & Jenkins, G. (2003). Snapper culture-the WA perspective G. Allan (Ed.) Proceedings of the Aquafin CRC Snapper Workshop held on 26 September 2002 at the Airport Motel & Convention Centre, Melbourne (Aquafin CRC 2001/208) (pp. 34-37).
Paulin, C. D. (1990). Pagrus auratus, a new combination for the species known as “snapper” in Australasian waters (Pisces: Sparidae). New Zealand Journal of Marine and Freshwater Research, 24(2), 259-265.
Pereira, T. G., & Oliva-Teles, A. (2004). Evaluation of micronized lupin seed meal as an alternative protein source in diets for gilthead sea bream Sparus aurata L. juveniles. Aquaculture Research, 35(9), 828-835.
Petterson, D. S. (2000). The use of lupins in feeding systems - review. Asian-Australasian Journal of Animal Sciences, 13(6), 861-882.
Petterson, D. S., Sipsa, S., & Mackintosh, J. B. (1997). The Chemical Composition and Nutritive Value of Australian Pulses. Grains Research and Development Corporation. Canberra, Australia pp
Pham, H., D, Fotedar, R., Nguyen, C. M., & Siddik, M., AB. (2016). Feed utilisation efficiency of lupin inclusion in cobia: role of dietary organic selenium supplementation. Modern Applied Science, 10(10), 180-192.
Quartararo, N., Allan, G. L., & Bell, J. D. (1998a). Replacement of fish meal in diets for Australian snapper, Pagrus auratus. Aquaculture, 166(3–4), 279-295.
Quartararo, N., Bell, J. D., & Allan, G. L. (1998b). Substitution of fishmeal in a diet for the carnovorous marine fish Pagrus auratus (Bloch and Schneider) from Southeastern Australia. Asian Fisheries Science, 10, 269-279.
Rahimnejad, S., & Lee, K.-J. (2013). Dietary valine requirement of juvenile red sea bream Pagrus major. Aquaculture, 416–417(0), 212-218.
127
References
Read, E. S., Barrows, F. T., Gibson Gaylord, T., Paterson, J., Petersen, M. K., & Sealey, W. M. (2014). Investigation of the effects of dietary protein source on copper and zinc bioavailability in fishmeal and plant-based diets for rainbow trout. Aquaculture, 432, 97-105.
Refstie, S., Glencross, B., Landsverk, T., Sørensen, M., Lilleeng, E., Hawkins, W., & Krogdahl, Å. (2006). Digestive function and intestinal integrity in Atlantic salmon (Salmo salar) fed kernel meals and protein concentrates made from yellow or narrow-leafed lupins. Aquaculture, 261(4), 1382-1395.
Refstie, S., Korsøen, Ø. J., Storebakken, T., Baeverfjord, G., Lein, I., & Roem, A. J. (2000). Differing nutritional responses to dietary soybean meal in rainbow trout (Oncorhynchus mykiss) and Atlantic salmon (Salmo salar). Aquaculture, 190(1–2), 49-63.
Refstie, S., Storebakken, T., & Roem, A. J. (1998). Feed consumption and conversion in Atlantic salmon (Salmo salar) fed diets with fish meal, extracted soybean meal or soybean meal with reduced content of oligosaccharides, trypsin inhibitors, lectins and soya antigens. Aquaculture, 162(3–4), 301-312.
Regost, C., Arzel, J., & Kaushik, S. J. (1999). Partial or total replacement of fish meal by corn gluten meal in diet for turbot (Psetta maxima). Aquaculture, 180(1–2), 99-117.
Ren, M., Ai, Q., & Mai, K. (2014). Dietary arginine requirement of juvenile cobia ( Rachycentron canadum). Aquaculture Research, 45(2), 225-233.
Ren, M., Ai, Q., Mai, K., Ma, H., & Wang, X. (2011). Effect of dietary carbohydrate level on growth performance, body composition, apparent digestibility coefficient and digestive enzyme activities of juvenile cobia, Rachycentron canadum L. Aquaculture Research, 42(10), 1467-1475.
Rey Vázquez, G., & Guerrero, G. A. (2007). Characterization of blood cells and hematological parameters in Cichlasoma dimerus (Teleostei, Perciformes). Tissue and Cell, 39(3), 151-160.
Rider, S. A., Davies, S. J., Jha, A. N., Fisher, A. A., Knight, J., & Sweetman, J. W. (2009). Supra-nutritional dietary intake of selenite and selenium yeast in normal and stressed rainbow trout (Oncorhynchus mykiss): Implications on selenium status and health responses. Aquaculture, 295(3–4), 282-291.
Robaina, L., Izquierdo, M. S., Moyano, F. J., Socorro, J., Vergara, J. M., Montero, D., & Fernández-Palacios, H. (1995). Soybean and lupin seed meals as protein sources in diets for gilthead seabream (Sparus aurata): nutritional and histological implications. Aquaculture, 130(2–3), 219-233.
Roche, H., & Boge, G. (1996). Fish blood parameters as a potential tool for identification of stress caused by environmental factors and chemical intoxication. Marine Environmental Research, 41(1), 27-43.
Romarheim, O. H., Zhang, C., Penn, M., Liu, Y. J., Tian, L. X., Skrede, A., . . . Storebakken, T. (2008). Growth and intestinal morphology in cobia
128
References
(Rachycentron canadum) fed extruded diets with two types of soybean meal partly replacing fish meal. Aquaculture Nutrition, 14(2), 174-180.
Rotruck, J. T., Pope, A. L., Ganther, H. E., Swanson, A. B., Hafeman, D. G., & Hoekstra, W. G. (1973). Selenium: Biochemical role as a component of glatathione peroxidase. Science, 179(4073), 588-590.
Salini, M. J., & Adams, L. R. (2014). Growth performance, nutrient utilisation and digestibility by Atlantic salmon (Salmo salar L.) fed Tasmanian grown white (Lupinus albus) and narrow-leafed (L. angustifolius) lupins. Aquaculture, 426–427, 296-303.
Salze, G., McLean, E., Battle, P. R., Schwarz, M. H., & Craig, S. R. (2010). Use of soy protein concentrate and novel ingredients in the total elimination of fish meal and fish oil in diets for juvenile cobia, Rachycentron canadum. Aquaculture, 298(3–4), 294-299.
Salze, G., McLean, E., & Craig, S. R. (2012). Dietary taurine enhances growth and digestive enzyme activities in larval cobia. Aquaculture, 362–363, 44-49.
Saravanan, M., Prabhu Kumar, K., & Ramesh, M. (2011). Haematological and biochemical responses of freshwater teleost fish Cyprinus carpio (Actinopterygii: Cypriniformes) during acute and chronic sublethal exposure to lindane. Pesticide Biochemistry and Physiology, 100(3), 206-211.
Sargent, J., McEvoy, L., Estevez, A., Bell, G., Bell, M., Henderson, J., & Tocher, D. (1999). Lipid nutrition of marine fish during early development: current status and future directions. Aquaculture, 179(1–4), 217-229.
Satoh, S., Poe, W. E., & Wilson, R. P. (1989). Effect of supplemental phytate and/or tricalcium phosphate on weight gain, feed efficiency and zinc content in vertebrae of channel catfish. Aquaculture, 80(1), 155-161.
Schram, E., Pedrero, Z., Cámara, C., Van Der Heul, J. W., & Luten, J. B. (2008). Enrichment of African catfish with functional selenium originating from garlic. Aquaculture Research, 39(8), 850-860.
Schrauzer, G. N. (2006). Selenium yeast: Composition, quality, analysis, and safety. Pure and Applied Chemistry, 78(1), 105-109.
Schwarz, K., & Foltz, C. M. (1958). Factor 3 Activity of Selenium Compounds. Journal of Biological Chemistry, 233(1), 245-251.
Serrano, E., Storebakken, T., Borquez, A., Penn, M., Shearer, K. D., Dantagnan, P., & Mydland, L. T. (2012). Histology and growth performance in rainbow trout (Oncorhynchus mykiss) in response to increasing dietary concentration of sparteine, a common alkaloid in lupins. Aquaculture Nutrition, 18(3), 313-320.
Serrano, E., Storebakken, T., Penn, M., Øverland, M., Hansen, J. Ø., & Mydland, L. T. (2011). Responses in rainbow trout (Oncorhynchus mykiss) to increasing dietary doses of lupinine, the main quinolizidine alkaloid found in yellow lupins (Lupinus luteus). Aquaculture, 318(1–2), 122-127.
129
References
Sharma, B. B., Saha, R. K., & Saha, H. (2014). Effects of feeding detoxified rubber seed meal on growth performance and haematological indices of Labeo rohita (Hamilton) fingerlings. Animal Feed Science and Technology, 193(0), 84-92.
Shi, L., Xun, W., Yue, W., Zhang, C., Ren, Y., Liu, Q., . . . Shi, L. (2011). Effect of elemental nano-selenium on feed digestibility, rumen fermentation, and purine derivatives in sheep. Animal Feed Science and Technology, 163(2–4), 136-142.
Sorensen, E. B., Cumbie, P., Bauer, T., Bell, J., & Harlan, C. (1984). Histopathological, hematological, condition-factor, and organ weight changes associated with selenium accumulation in fish from Belews Lake, North Carolina. Archives of Environmental Contamination and Toxicology, 13(2), 153-162.
Spallholz, J. E., & Hoffman, D. J. (2002). Selenium toxicity: cause and effects in aquatic birds. Aquatic Toxicology, 57(1–2), 27-37.
Species 2000 & ITIS Catalogue of Life. (2013a). Pagrus auratus http://eol.org/pages/344840/overview (accessed 14 Jan 2016).
Species 2000 & ITIS Catalogue of Life. (2013b). Rachycentron canadum http://eol.org/pages/2794949/hierarchy_entries/44730243/overview (accessed 14 Jan 2016).
Stadtman, T. C. (1996). Selenocysteine. Annual Review of Biochemistry, 65(1), 83-100.
Statistics, A. B. o. (2013). Agricultural Commodities, Australia, 2011-12. http://www.abs.gov.au/ausstats/[email protected]/Lookup/7121.0main+features62011-12 (acessed 14 March, 2016).
Storebakken, T., Shearer, K. D., & Roem, A. J. (1998). Availability of protein, phosphorus and other elements in fish meal, soy-protein concentrate and phytase-treated soy-protein-concentrate-based diets to Atlantic salmon, Salmo salar. Aquaculture, 161(1–4), 365-379.
Suarez, J. A., Tudela, C., Davis, D., Daugherty, Z., Taynor, M., Glass, L., . . . Benetti, D. D. (2013). Replacement of fish meal by a novel non-GM variety of soybean meal in cobia, Rachycentron canadum: Ingredient nutrient digestibility and growth performance. Aquaculture, 416–417(0), 328-333.
Sugiura, S. H., Dong, F. M., Rathbone, C. K., & Hardy, R. W. (1998). Apparent protein digestibility and mineral availabilities in various feed ingredients for salmonid feeds. Aquaculture, 159(3–4), 177-202.
Sun, L., Chen, H., Huang, L., Wang, Z., & Yan, Y. (2006). Growth and energy budget of juvenile cobia (Rachycentron canadum) relative to ration. Aquaculture, 257(1–4), 214-220.
Suzuki, K. T., Kurasaki, K., Okazaki, N., & Ogra, Y. (2005). Selenosugar and trimethylselenonium among urinary Se metabolites: dose- and age-related changes. Toxicology and Applied Pharmacology, 206(1), 1-8.
130
References
Sweetman, J. W., Torrecillas, S., Dimitroglou, A., Rider, S., Davies, S. J., & Izquierdo, M. S. (2010). Enhancing the natural defences and barrier protection of aquaculture species. Aquaculture Research, 41(3), 345-355.
Tabata, K., & Taniguchi, N. (2000). Differences between Pagrus major and Pagrus auratus through mainly mtDNA control region analysis. Fisheries Science, 66(1), 9-18.
Tabrett, S., Blyth, D., Bourne, N., & Glencross, B. (2012). Digestibility of Lupinus albus lupin meals in barramundi (Lates calcarifer). Aquaculture, 364–365, 1-5.
Tacon, A. G. J., & Metian, M. (2008). Global overview on the use of fish meal and fish oil in industrially compounded aquafeeds: Trends and future prospects. Aquaculture, 285(1–4), 146-158.
Tashjian, D. H., Teh, S. J., Sogomonyan, A., & Hung, S. S. O. (2006). Bioaccumulation and chronic toxicity of dietary l-selenomethionine in juvenile white sturgeon (Acipenser transmontanus). Aquatic Toxicology, 79(4), 401-409.
Teh, S. J., Deng, X., Deng, D.-F., Teh, F.-C., Hung, S. S. O., Fan, T. W. M., . . . Higashi, R. M. (2004). Chronic Effects of Dietary Selenium on Juvenile Sacramento Splittail (Pogonichthys macrolepidotus). Environmental Science & Technology, 38(22), 6085-6093.
Terry, E. N., & Diamond, A. M. (2012). Selenium Present Knowledge in Nutrition: Wiley-Blackwell. pp. 568-585
Tian, J. Z., Yun, M. S., Ju, W. S., Long, H. F., Kim, J. H., Kil, D. Y., . . . Han, I. K. (2006). Effects of dietary selenium supplementation on growth performance, selenium retention in tissues and nutrient digestibility in growing-finishing pigs. Asian-Australasian Journal of Animal Sciences, 19(1), 55-60.
Trushenski, J., Laporte, J., Lewis, H., Schwarz, M., Delbos, B., Takeuchi, R., & Sampaio, L. A. (2011). Fish meal replacement with soy-derived protein in feeds for juvenile cobia: Influence of replacement level and attractant supplementation. Journal of the World Aquaculture Society, 42(3), 435-443.
Twibell, R. G., Gannam, A. L., Hyde, N. M., Holmes, J. S. A., & Poole, J. B. (2012). Effects of fish meal- and fish oil-free diets on growth responses and fatty acid composition of juvenile coho salmon (Oncorhynchus kisutch). Aquaculture, 360–361(0), 69-77.
Ueda, R., Sugita, H., & Deguchi, Y. (1999). Effect of transportation on the serum bactericidal activity of Penaeus japonicus and Ovalipes punctatus. Aquaculture, 171(3–4), 221-225.
Usmani, N., & Jafri, A. K. (2002). Influence of dietary phytic acid on the growth, conversion efficiency, and carcass composition of mrigal Cirrhinus mrigala (Hamilton) fry. Journal of the World Aquaculture Society, 33(2), 199-204.
131
References
van Barneveld, R. J. (1999). Understanding the nutritional chemistry of lupin (Lupinus spp.) seed to improve livestock production efficiency. Nutrition Research Reviews, 12(02), 203-230.
van der Velde, T. D., Griffiths, S. P., & Fry, G. C. (2010). Reproductive biology of the commercially and recreationally important cobia Rachycentron canadum in northeastern Australia. Fisheries Science, 76(1), 33-43.
Vergara, J. M., Robainà, L., Izquierdo, M., & De La Higuera, M. (1996). Protein sparing effect of lipids in diets for fingerlings of gilthead sea bream. Fisheries Science, 62(4), 624-628.
Vo, B., V, Bui, D. P., Nguyen, H. Q., & Fotedar, R. (2015). Optimized fermented lupin (Lupinus angustifolius) inclusion in juvenile barramundi (Lates calcarifer) diets. Aquaculture, 444, 62-69.
Wang, C., & Lovell, R. T. (1997). Organic selenium sources, selenomethionine and selenoyeast, have higher bioavailability than an inorganic selenium source, sodium selenite, in diets for channel catfish (Ictalurus punctatus). Aquaculture, 152(1–4), 223-234.
Wang, J., Liu, Y. J., Tian, L. X., Mai, K.-S., Du, Z.-Y., Wang, Y., & Yang, H.-J. (2005). Effect of dietary lipid level on growth performance, lipid deposition, hepatic lipogenesis in juvenile cobia (Rachycentron canadum). Aquaculture, 249(1–4), 439-447.
Wang, K., Peng, C. Z., Huang, J. L., Huang, Y. D., Jin, M. C., & Geng, Y. (2013). The pathology of selenium deficiency in Cyprinus carpio L. Journal of Fish Diseases, 36(7), 609-615.
Wang, Y., Han, J., Li, W., & Xu, Z. (2007). Effect of different selenium source on growth performances, glutathione peroxidase activities, muscle composition and selenium concentration of allogynogenetic crucian carp (Carassius auratus gibelio). Animal Feed Science and Technology, 134(3–4), 243-251.
Watanabe, T., Aoki, H., Watanabe, K., Maita, M., Yamagata, Y., & Satoh, S. (2001). Quality evaluation of different types of non-fish meal diets for yellowtail. Fisheries Science, 67(3), 461-469.
Watanabe, T., Kiron, V., & Satoh, S. (1997). Trace minerals in fish nutrition. Aquaculture, 151(1–4), 185-207.
Watson, A., Barrows, F., & Place, A. (2013). Taurine Supplementation of Plant Derived Protein and n-3 Fatty Acids are Critical for Optimal Growth and Development of Cobia, Rachycentron canadum. Lipids, 48(9), 899-913.
Watson, A. M., Barrows, F. T., & Place, A. R. (2014a). Effects of Graded Taurine Levels on Juvenile Cobia. North American Journal of Aquaculture, 76(3), 190-200.
Watson, A. M., Buentello, A., & Place, A. R. (2014b). Partial replacement of fishmeal, poultry by-product meal and soy protein concentrate with two non-
132
References
genetically modified soybean cultivars in diets for juvenile cobia, Rachycentron canadum. Aquaculture, 434(0), 129-136.
Weil, C., Lefèvre, F., & Bugeon, J. (2013). Characteristics and metabolism of different adipose tissues in fish. Reviews in Fish Biology and Fisheries, 23(2), 157-173.
Weirich, C. R., Wills, P. S., Baptiste, R. M., & Riche, M. A. (2010). Production Characteristics and Body Composition of Juvenile Cobia Fed Three Different Commercial Diets in Recirculating Aquaculture Systems. North American Journal of Aquaculture, 72(1), 43-49.
Welker, T., Barrows, F., Overturf, K., Gaylord, G., & Sealey, W. (2016). Optimizing zinc supplementation levels of rainbow trout (Oncorhynchus mykiss) fed practical type fishmeal- and plant-based diets. Aquaculture Nutrition, 22(1), 91-108.
Wepener, V., van Vuren, J. H. J., & Du Preez, H. H. (1992). The effect of hexavalent chromium at different pH values on the haematology of Tilapia sparrmanii (Cichlidae). Comparative Biochemistry and Physiology. Part C, Comparative, 101(2), 375-381.
William, M., Anthony, R., Martina, D., Teresa, F., Simon, F., Reid, G., . . . Dirk, W. g. (2010). Environmental Sources, Speciation, and Partitioning of Selenium Ecological Assessment of Selenium in the Aquatic Environment: CRC Press. pp. 47-92
Wolke, R. E. (1992). Piscine macrophage aggregates: A review. Annual Review of Fish Diseases, 2, 91-108.
Yeh, J.-Y., Vendeland, S. C., Gu, Q.-p., Butler, J. A., Ou, B.-R., & Whanger, P. D. (1997). Dietary Selenium Increases Selenoprotein W Levels in Rat Tissues. The Journal of Nutrition, 127(11), 2165-2172.
Zhang, Y., & Moore, J. N. (1997). Environmental Conditions Controlling Selenium Volatilization from a Wetland System. Environmental Science & Technology, 31(2), 511-517.
Zhang, Y., Øverland, M., Xie, S., Dong, Z., Lv, Z., Xu, J., & Storebakken, T. (2012). Mixtures of lupin and pea protein concentrates can efficiently replace high-quality fish meal in extruded diets for juvenile black sea bream (Acanthopagrus schlegeli). Aquaculture, 354–355(0), 68-74.
Zhou, Q. C., Mai, K. S., Tan, B. P., & Liu, Y. J. (2005). Partial replacement of fishmeal by soybean meal in diets for juvenile cobia (Rachycentron canadum). Aquaculture Nutrition, 11(3), 175-182.
Zhou, Q. C., Tan, B. P., Mai, K. S., & Liu, Y. J. (2004). Apparent digestibility of selected feed ingredients for juvenile cobia Rachycentron canadum. Aquaculture, 241(1–4), 441-451.
133
References
Zhou, Q. C., Wang, L., Wang, H., Xie, F., & Wang, T. (2012). Effect of dietary vitamin C on the growth performance and innate immunity of juvenile cobia (Rachycentron canadum). Fish and Shellfish Immunology, 32(6), 969-975.
Zhou, Q. C., Wu, Z. H., Chi, S. Y., & Yang, Q. H. (2007). Dietary lysine requirement of juvenile cobia (Rachycentron canadum). Aquaculture, 273(4), 634-640.
Zhou, Q. C., Wu, Z. H., Tan, B. P., Chi, S. Y., & Yang, Q. H. (2006). Optimal dietary methionine requirement for Juvenile Cobia (Rachycentron canadum). Aquaculture, 258(1–4), 551-557.
Zhou, Q. C., Zhao, J., Li, P., Wang, H. L., & Wang, L. G. (2011). Evaluation of poultry by-product meal in commercial diets for juvenile cobia (Rachycentron canadum). Aquaculture, 322–323, 122-127.
Zhou, X., Wang, Y., Gu, Q., & Li, W. (2009). Effects of different dietary selenium sources (selenium nanoparticle and selenomethionine) on growth performance, muscle composition and glutathione peroxidase enzyme activity of crucian carp (Carassius auratus gibelio). Aquaculture, 291(1–2), 78-81.
Zhu, Y., Chen, Y., Liu, Y., Yang, H., Liang, G., & Tian, L. (2012). Effect of dietary selenium level on growth performance, body composition and hepatic glutathione peroxidase activities of largemouth bass Micropterus salmoide. Aquaculture Research, 43(11), 1660-1668.
Every reasonable effort has been made to acknowledge the owners of copyright material. I would be pleased to hear from any copyright owner who has been omitted or incorrectly acknowledged.
134


![Francis Murray Institute of Aquaculture, University of ... Basa [Pangasius bocourti] Pangasius Tra [P. hypophthalmus] Rainbow trout [Oncorhynchus mykiss] Red Porgy [Pagrus pagrus]](https://static.fdocuments.net/doc/165x107/5af259657f8b9aa916903c17/francis-murray-institute-of-aquaculture-university-of-basa-pangasius-bocourti.jpg)