Growth and Investment - finance.gov.pk · Growth and Investment ... (iii) State-owned...
12
Chapter 1 Growth and Investment Pakistan’s economy continued to maintain its growth momentum which has been building up since FY 2014. The GDP growth had reached the lowest level of 0.36 percent in FY 2009 and thereafter it remained volatile with an average of 2.82 percent between FY 2008 and FY 2013. Since FY 2014 Pakistan’s economy has been witnessing an impressive turnaround with GDP growth crossing 4 percent in a challenging environment. Despite these challenges, the government remained committed to achieve higher, inclusive and sustainable growth and adopted wide ranging structural reforms in all sectors of the economy. Consequently, the growth momentum started picking up and the economy started expanding with broad based growth across different sectors. During first three years of the present government, real GDP growth remained above 4 percent while for last two consecutive years, it remained above 5 percent. The government has focused on a number of initiatives to enhance productivity in all sectors of the economy. For agriculture, efforts were made to provide better supply of quality seeds including hybrid and high yielding varieties along with timely availability of agriculture inputs including fertilizer, pesticides. Further, there was a 197.6 percent growth in credit to agriculture sector, which reached Rs 1,001 billion (budget estimate) in FY 2018, compared to Rs 336.3 billion in FY 2013 along with, relief of Rs 341 billion provided to the farmers under Prime Minister’s Kissan Package. All these measures helped in achieving 13 years high growth of 3.8 percent in agricultural sector during 2017-18. The government had also shown commitment to industrial sector including manufacturing by providing undisrupted energy supply, higher infrastructure spending, ample liquidity in the banking sector and investment friendly low interest rates. Efforts were made to develop vibrant and competitive markets in order to accelerate and sustain economic growth through productivity, competitiveness, innovation and entrepreneurship. These were some of factors that fuelled for accelerating growth of large scale manufacturing (LSM) in particular and industry in general. During FY 2018, Large Scale Manufacturing (LSM) recorded an impressive growth of 6.13 percent which is the highest in eleven years. On the back of it, overall industrial sector growth improved by 5.8 percent which is highest in ten years. Over the last four decades, the composition of Pakistan’s GDP has undergone considerable change as the share of services sector in GDP has increased. The government remained committed in providing business friendly environment in order to attract foreign investment in the country, China-Pakistan Economic Corridor (CPEC) is a milestone in this regard. In 2017-18, services sector maintained the growth momentum by recording a growth of 6.43 percent. (Fig-1).
Transcript of Growth and Investment - finance.gov.pk · Growth and Investment ... (iii) State-owned...

Chapter 1
Growth and Investment
Pakistan’s economy continued to maintain its growth momentum which has been building up since FY 2014. The GDP growth had reached the lowest level of 0.36 percent in FY 2009 and thereafter it remained volatile with an average of 2.82 percent between FY 2008 and FY 2013. Since FY 2014 Pakistan’s economy has been witnessing an impressive turnaround with GDP growth crossing 4 percent in a challenging environment. Despite these challenges, the government remained committed to achieve higher, inclusive and sustainable growth and adopted wide ranging structural reforms in all sectors of the economy. Consequently, the growth momentum started picking up and the economy started expanding with broad based growth across different sectors. During first three years of the present government, real GDP growth remained above 4 percent while for last two consecutive years, it remained above 5 percent.
The government has focused on a number of initiatives to enhance productivity in all sectors of the economy. For agriculture, efforts were made to provide better supply of quality seeds including hybrid and high yielding varieties along with timely availability of agriculture inputs including fertilizer, pesticides. Further, there was a 197.6 percent growth in credit to agriculture sector, which reached Rs 1,001 billion (budget estimate) in FY 2018, compared to Rs 336.3 billion in FY 2013 along with, relief of Rs 341 billion provided to the farmers
under Prime Minister’s Kissan Package. All these measures helped in achieving 13 years high growth of 3.8 percent in agricultural sector during 2017-18.
The government had also shown commitment to industrial sector including manufacturing by providing undisrupted energy supply, higher infrastructure spending, ample liquidity in the banking sector and investment friendly low interest rates. Efforts were made to develop vibrant and competitive markets in order to accelerate and sustain economic growth through productivity, competitiveness, innovation and entrepreneurship. These were some of factors that fuelled for accelerating growth of large scale manufacturing (LSM) in particular and industry in general. During FY 2018, Large Scale Manufacturing (LSM) recorded an impressive growth of 6.13 percent which is the highest in eleven years. On the back of it, overall industrial sector growth improved by 5.8 percent which is highest in ten years.
Over the last four decades, the composition of Pakistan’s GDP has undergone considerable change as the share of services sector in GDP has increased. The government remained committed in providing business friendly environment in order to attract foreign investment in the country, China-Pakistan Economic Corridor (CPEC) is a milestone in this regard. In 2017-18, services sector maintained the growth momentum by recording a growth of 6.43 percent. (Fig-1).

Pakistan Economic Survey 201
2
There was strong domestic demand due to contained inflation and supply remained adequate due to existing production capacities of the economy. As shown in Box2014, Potential Output is continuously rising which also implies that output gap (percentage
Fig
Source: MTBF and EA Wing’s working
Potential output (PO) is the maximum GDP that can be produced at normal rate of utilization of all the resources within the country’s existent production capacities of the economy. Whereas, output gap (OG) by definition is the difference between the actual GDP or actual output and the potential output. More precisely, the percentage deviation of the observed output from its potential output path of the economy refers to output gap.
OG is primarily the cyclical indicator used or negative. A positive OG shows that actual GDP is higher than the potential output, implying demand is greater than supply by using resources beyond its potential, and hence would be a leaA negative OG shows underutilization of the existing resources, resulting into lower actual GDP than potential output level of the economy.
200
5-06
200
6-07
200
7-08
200
8-09
Source: Pakistan Bureau of Statistics
Fig
-3.0
-1.0
1.0
3.0
5.0
7.0
9.0
11.0
198
51
987
198
91
991
199
31
995
199
71
999
200
12
003
200
5
Potential Output
Pakistan Economic Survey 2017-18
There was strong domestic demand due to supply remained
production capacities . As shown in Box-I, since FY
is continuously rising which also implies that output gap (percentage
deviation of actual GDP with respect topotential output) is shrinking. On the basis of both indicators (Potential Gap), it can be seen that that overall capacity of country is improving and moving towards stabilization (Fig
Fig - 1.2:- Potential Output and Output Gap
Source: MTBF and EA Wing’s working
Box-I Potential Output and Output Gap
Potential output (PO) is the maximum GDP that can be produced at normal rate of utilization of all the resources within the country’s existent production capacities of the economy. Whereas, output gap (OG) by
he difference between the actual GDP or actual output and the potential output. More precisely, the percentage deviation of the observed output from its potential output path of the economy refers to output
OG is primarily the cyclical indicator used to represent the stabilization of the economy. OG may be positive or negative. A positive OG shows that actual GDP is higher than the potential output, implying demand is greater than supply by using resources beyond its potential, and hence would be a leading indicator of inflation. A negative OG shows underutilization of the existing resources, resulting into lower actual GDP than potential
200
9-10
201
0-11
201
1-12
201
2-13
201
3-14
201
4-15
201
5-16
Source: Pakistan Bureau of Statistics
Fig-1.1: Performance of Economy since 2005-06
Agricultural Sector Industrial Sector
Large Scale Services Sectors
GDP Growth Rate
200
52
007
200
92
011
201
32
015
201
7
Potential Output
-6.0-5.0-4.0-3.0-2.0-1.00.01.02.03.0
1986
1988
1990
1992
1994
1996
1998
2000
2002
Output Gap
deviation of actual GDP with respect to ) is shrinking. On the basis of
otential Output and Output that that overall productive
is improving and it is stabilization (Fig-1.2).
Potential output (PO) is the maximum GDP that can be produced at normal rate of utilization of all the resources within the country’s existent production capacities of the economy. Whereas, output gap (OG) by
he difference between the actual GDP or actual output and the potential output. More precisely, the percentage deviation of the observed output from its potential output path of the economy refers to output
the stabilization of the economy. OG may be positive or negative. A positive OG shows that actual GDP is higher than the potential output, implying demand is
ding indicator of inflation. A negative OG shows underutilization of the existing resources, resulting into lower actual GDP than potential
201
5-16
201
6-17
201
7-18
Industrial Sector
Services Sectors
2002
2004
2006
2008
2010
2012
2014
2016
2018
Output Gap

Growth and Investment
3
PO reflects the supply side of the economy and is an essential concept in terms of government fiscal operations because it allows to calculate the structural fiscal balance (after removing cyclical influences). On the other hand, OG is an important indicator for monetary policy, which has also some amplifying effects on the economy in case of greater demand resulting into high inflation or may yield into disinflationary pressures over the economy in case of excess supply by underutilization of the spare resources.
The PO of the economy depends on a number of factors with the supply side conditions, being at the foremost primarily in terms of key inputs labor, capital and total factor productivity. Forecasting the supply side through the concept of PO, we need the path of total gross fixed capital formation (TGFCF) which itself is the overall sum of; (i) Public gross fixed capital formation; (ii)Private gross fixed capital formation; (iii) State-owned enterprises’ gross fixed capital formation; and (iv) CPEC induced gross fixed capital formation.
The basic equation for calculating/forecasting PO (potential GDP) is given below in the most simplified form after translating it from its econometric version:
���� = �. ��� ∗ ��� ��� ∗ ����� ������ + . ���� ∗ ����� − �. ���� ∗ ������
Where GFCG is Gross Fixed Capital Formation and GDP is Gross Value Addition
So it is evident from the above equation that the long run positive relationship between PO and TGFCF does exist with its trend value of 0.31 percent. It implies that every rupee increase in the TGFCF has added 0.140 Rupee to PO in previous fiscal year 2016-17 and 0.143 Rupee to PO in current fiscal year.
Since 2014-15 the growth rate of potential output is on the rising trend after a long term high volatility pattern and uncertain movements observed in the past. The positive rising trend of PO growth rate shows the overall growth capacity of country in the long-term perspective.
During the past five years, the economy continued to benefit from growth oriented initiatives, including higher development spending, low inflation, vigilant monetary policy, and CPEC related investment providing impetus for economic recovery. On the external side, export growth is improving and the extension of the GSP plus status for next two years by the EU is a positive development. Exports growth during nine months of current year maintained positive trend. Similarly worker’s remittances not only stabilized but also recorded a positive growth. Likewise, FDI continued to show encouraging growth.
Global developments had positive spill over effects on the economy. The outgoing year witnessed a global recovery and the future outlook remains optimistic. However, in this era, economies have become more interrelated, thus failure of one presents greater risks to all. Therefore, the adverse effect can be mitigated only through timely comprehensive adjustable policies. To keep the economy on growth
trajectory, supportive policies including better governance, rule of law, higher productivity through investment in human capital, reducing cost of doing business and accelerating domestic savings are required to mitigate against adverse effects of external and domestic vulnerabilities, which may rise due to unfavorable international environment.
Sectoral Growth Analysis:-
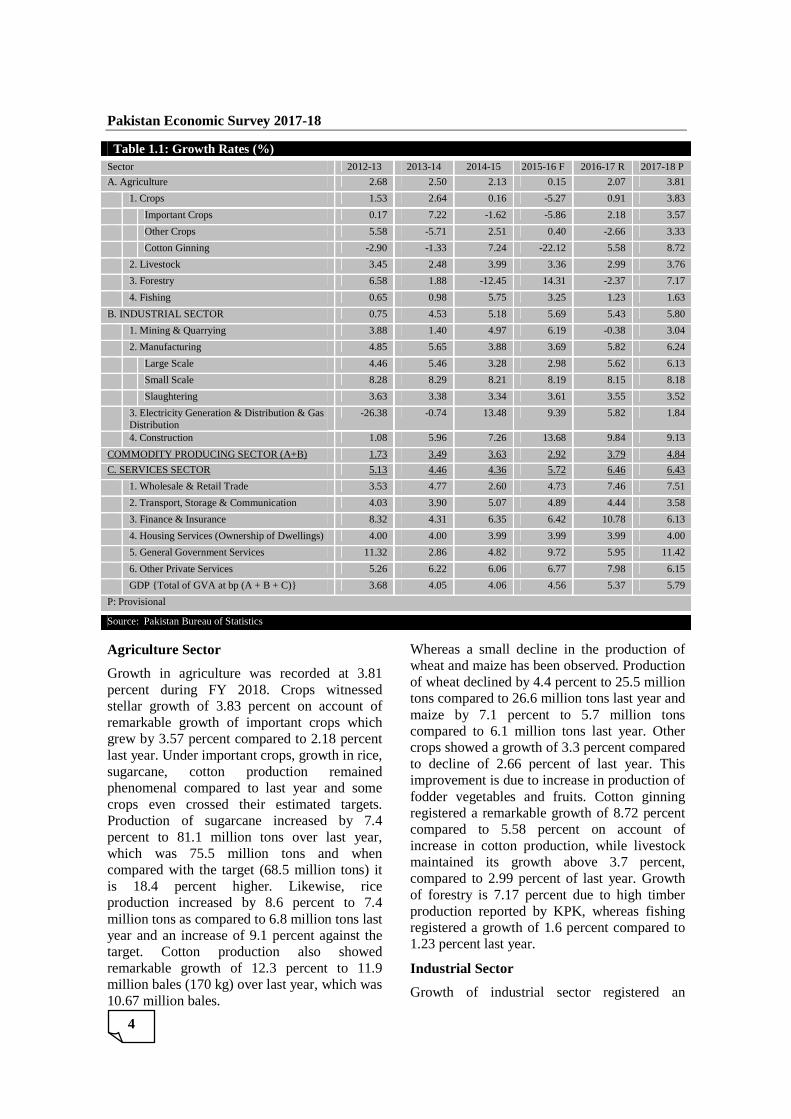
The key feature of 2017-18 is the high and broad based growth in agriculture, industrial and services sectors. Agriculture grew by 3.81 percent compared to 2.07 percent last year while industrial sector showed growth of 5.80 percent compared to 5.43 percent of last year and services sector almost remained at par 6.43 percent compared to 6.46 percent last year. Commodities producing sector, comprising agriculture and industrial sector contributed a growth of 4.84 percent compared to 3.79 percent recorded last year. The table presented below gives the detail breakup of growth of real GDP.
Pakistan Economic Survey 2017-18
4
Table 1.1: Growth Rates (%) Sector 2012-13 2013-14 2014-15 2015-16 F 2016-17 R 2017-18 P
A. Agriculture 2.68 2.50 2.13 0.15 2.07 3.81
1. Crops 1.53 2.64 0.16 -5.27 0.91 3.83
Important Crops 0.17 7.22 -1.62 -5.86 2.18 3.57
Other Crops 5.58 -5.71 2.51 0.40 -2.66 3.33
Cotton Ginning -2.90 -1.33 7.24 -22.12 5.58 8.72
2. Livestock 3.45 2.48 3.99 3.36 2.99 3.76
3. Forestry 6.58 1.88 -12.45 14.31 -2.37 7.17
4. Fishing 0.65 0.98 5.75 3.25 1.23 1.63
B. INDUSTRIAL SECTOR 0.75 4.53 5.18 5.69 5.43 5.80
1. Mining & Quarrying 3.88 1.40 4.97 6.19 -0.38 3.04
2. Manufacturing 4.85 5.65 3.88 3.69 5.82 6.24
Large Scale 4.46 5.46 3.28 2.98 5.62 6.13
Small Scale 8.28 8.29 8.21 8.19 8.15 8.18
Slaughtering 3.63 3.38 3.34 3.61 3.55 3.52
3. Electricity Generation & Distribution & Gas Distribution
-26.38 -0.74 13.48 9.39 5.82 1.84
4. Construction 1.08 5.96 7.26 13.68 9.84 9.13
COMMODITY PRODUCING SECTOR (A+B) 1.73 3.49 3.63 2.92 3.79 4.84
C. SERVICES SECTOR 5.13 4.46 4.36 5.72 6.46 6.43
1. Wholesale & Retail Trade 3.53 4.77 2.60 4.73 7.46 7.51
2. Transport, Storage & Communication 4.03 3.90 5.07 4.89 4.44 3.58
3. Finance & Insurance 8.32 4.31 6.35 6.42 10.78 6.13
4. Housing Services (Ownership of Dwellings) 4.00 4.00 3.99 3.99 3.99 4.00
5. General Government Services 11.32 2.86 4.82 9.72 5.95 11.42
6. Other Private Services 5.26 6.22 6.06 6.77 7.98 6.15
GDP {Total of GVA at bp (A + B + C)} 3.68 4.05 4.06 4.56 5.37 5.79
P: Provisional
Source: Pakistan Bureau of Statistics
Agriculture Sector
Growth in agriculture was recorded at 3.81 percent during FY 2018. Crops witnessed stellar growth of 3.83 percent on account of remarkable growth of important crops which grew by 3.57 percent compared to 2.18 percent last year. Under important crops, growth in rice, sugarcane, cotton production remained phenomenal compared to last year and some crops even crossed their estimated targets. Production of sugarcane increased by 7.4 percent to 81.1 million tons over last year, which was 75.5 million tons and when compared with the target (68.5 million tons) it is 18.4 percent higher. Likewise, rice production increased by 8.6 percent to 7.4 million tons as compared to 6.8 million tons last year and an increase of 9.1 percent against the target. Cotton production also showed remarkable growth of 12.3 percent to 11.9 million bales (170 kg) over last year, which was 10.67 million bales.
Whereas a small decline in the production of wheat and maize has been observed. Production of wheat declined by 4.4 percent to 25.5 million tons compared to 26.6 million tons last year and maize by 7.1 percent to 5.7 million tons compared to 6.1 million tons last year. Other crops showed a growth of 3.3 percent compared to decline of 2.66 percent of last year. This improvement is due to increase in production of fodder vegetables and fruits. Cotton ginning registered a remarkable growth of 8.72 percent compared to 5.58 percent on account of increase in cotton production, while livestock maintained its growth above 3.7 percent, compared to 2.99 percent of last year. Growth of forestry is 7.17 percent due to high timber production reported by KPK, whereas fishing registered a growth of 1.6 percent compared to 1.23 percent last year.
Industrial Sector
Growth of industrial sector registered an

increase of 5.80 percent provisionally on the back of growth of mining and quarrying percent compared to negative growth of 0.38 percent last year. The Production of coal and lime stone increased by 5.7 percent and 13.4 percent and bauxites 37.2 percent
Manufacturing grew by 6.24 to 5.82 percent last year. InLSM registered a growth of 6.13 percent compared to 5.62 percent last year. The major contributor to this growth are petroleum products which increased by 10.26 percent, cement 11.05 percent, automobile 19.5 percent, iron and steel products 13.85 percent and electronics 38.79 percent while SME maintained the growth of last year percent and slaughtering also maintained the growth of last year, i.e., 3.52 percent.
Services sector has witnessed a growth of 6 percent for last two consecutive years. The reason is that in Pakistan, services sector has still great potential to grow and the government is making best efforts to provide enabli
Fig-1.4: Composition and Performance of Sub
Services Sectors54%
1999-2000
Finance & Insurance
6%
Housing Services (OD)
11%
General Government
Services13%
Other Private Services
17%
Share in Services FY2018(P)
Growth and Investment
se of 5.80 percent provisionally on the back of growth of mining and quarrying of 3.04 percent compared to negative growth of 0.38
roduction of coal and lime stone increased by 5.7 percent and 13.4 percent and bauxites 37.2 percent respectively.
percent compared In manufacturing,
LSM registered a growth of 6.13 percent compared to 5.62 percent last year. The major contributor to this growth are petroleum products which increased by 10.26 percent,
cent, automobile 19.5 percent, 13.85 percent and
electronics 38.79 percent while SME maintained the growth of last year of above 8 percent and slaughtering also maintained the
3.52 percent.
Electricity generation and gas distribution witnessed a low growth of 1.84 percent compared to the higher growth of 5.8 percent last year whereas the construction activities increased by 9.13 percent.
Services Sector
For quite some time, Pakistan’s GDP has undergone considerable change not only in termsalso in terms of its performancecommodity producing sectorcontinued in FY 2018 as well. The commodity sector recorded a growth of 4.84 percengrowth in services sector remainedpercent. Thus, the share of the services sector GDP reached 60.23 percent in FY 201
Fig-1.3: Sectoral Share in GDP
Source: Pakistan Bureau of Statistics
Services sector has witnessed a growth of above 6 percent for last two consecutive years. The
services sector has great potential to grow and the government
is making best efforts to provide enabling
environment to economic agents to tap its potential. Therefore, the pservices sector remained broad based, as all components of services positively
1.4: Composition and Performance of Sub-Sectors in Services Sector
Source: Pakistan Bureau of Statistics
Agricultural Sector 27%
Industrial Sector19%
2000
Services Sectors60%
2017-18 (P)
Wholesale & Retail trade
31%
Transport, Storage &
Communication
22%
Share in Services FY2018(P)
0.0
2.0
4.0
6.0
8.0
10.0
12.0
Who
lesa
le &
Ret
ail t
rade
Tra
nspo
rt, S
tora
ge &
C
omm
unic
atio
n
Fin
ance
& In
sura
nce
Growth Comparison
Growth and Investment
5
lectricity generation and gas distribution witnessed a low growth of 1.84 percent compared to the higher growth of 5.8 percent
the construction activities increased by 9.13 percent.
For quite some time, the composition of Pakistan’s GDP has undergone considerable
s of share in GDP but of its performance compared to
commodity producing sector. This trend as well. The commodity
sector recorded a growth of 4.84 percent while growth in services sector remained at 6.43
share of the services sector in percent in FY 2018.
environment to economic agents to tap its . Therefore, the performance of
services sector remained broad based, as all positively contributed.
in Services Sector
Agricultural Sector 19%
Industrial Sector21%
18 (P)
Hou
sing
Ser
vice
s (O
D)
Gen
eral
Gov
ernm
ent
Ser
vice
s
Oth
er P
rivat
e S
ervi
ces
Growth Comparison
2016-17
2017-18

Pakistan Economic Survey 2017-18
6
Wholesale and retail trade is the largest subsector of services. Wholesale and retail trade is based on the margins taken by traders on the transactions of commodities traded so it is highly dependent on the performance of commodity sector. This sub-sector maintained the growth of 7.5 percent as it did last year, which is highest since FY 2007. Contained inflation, improved energy situation and GSP Plus status are contributing in the uplift of this sub-sector. Transport, Storage and Communication (TS&C) component of services sector is based primarily on the profits and losses of Pakistan Railways, Pakistan International Airlines and other airlines, Pakistan Post and courier services, Pak Telecom and motors vehicles of different kinds on the road. The government remained engaged in developing and modernizing the sector through high public expenditure on transportation projects. The performance of Pakistan Railways has been improved through a number of initiatives taken by the government. However, during FY 2018 there were a 73 percent decline in gross fixed capital formation (GFCF) by General Government in railways due to which gross fixed capital formation (GFCF) in Transport & Communication sector declined by 13.1 percent, while private sector gross fixed capital formation (GFCF) in Transport & Communication sub-sector increased by 0.4 percent in 2017-18 to Rs 472.1 billion from Rs 470.0 billion in 2016-17. Thus, during FY 2018, the growth in Transport,
Storage and Communication remained at 3.58 percent compared to 4.44 percent last year. Likewise, Finance and Insurance recorded a growth of 6.13 percent during FY 2018 compared to 10.77 percent last year, mainly due to decline in gross fixed capital formation by General Government and private sector. Housing Services recorded the same pace of growth of 4.0 percent as it performed last year. General Government Services recorded a growth 11.42 percent during FY 2018 compared to 5.95 percent last year. Finally, during FY 2018, Other Private Services recorded a growth 6.15 percent compared to 7.98 percent last year on account of social work by various non-government organizations and other stakeholders including private sector.
During FY 2018, GDP growth of 5.79 percent is shared between the services and commodity producing (agriculture and industry) sectors of the economy. Both components (agriculture & industry) of commodity producing sectors have shown improvement in contributing in overall economic growth. Out of the commodity producing sector, agriculture sector shared 0.73 percentage points to overall GDP growth as compared to 0.41 percentage points last year, while industrial sector contributed 1.21 percentage points in FY 2018 as compared to 1.14 percentage points of last year. During FY 2018, services sector contributed 3.85 percent points compared to 3.83 percentage points last year. (Table 1.2)
Table 1.2: Sectoral Contribution to the GDP growth (% Points)
Sector 2012-13 2013-14 2014-15 2015-16 2016-17 R 2017-18 P Agriculture 0.58 0.53 0.45 0.03 0.41 0.73 Industry 0.16 0.92 1.06 1.18 1.14 1.21 - Manufacturing 0.64 0.76 0.53 0.5 0.78 0.84 Services 2.95 2.6 2.55 3.35 3.83 3.85 Real GDP (Fc) 3.65 4.05 4.06 4.56 5.37 5.79
Source: Pakistan Bureau of Statistics Contribution to Real GDP Growth
(Aggregate Demand Analysis)
When analysed from demand side perspective consumption is the largest followed by investment and net exports are the major components of aggregate demand. Historically, Pakistani society behavior is like a consumption oriented society similar to other developing
countries. Thus, it is expected that with increased income, the economic agents would decide to consume more. During FY 2018, households' average propensity to consume remained fairly constant at around 85.5% at constant prices and at around 82% in current prices. This means that the growth rate of private consumption was about the same as the growth rate of GDP both in constant and in

current prices. Further, low interest rates encouraged more consumption as people are tempted to purchase durables during when relatively cheap money is availabl
Table-1.3: Composition of Aggregate Demand As percent of GDP (mp) Private Consumption
Public Consumption
Total Consumption [C] Gross Fixed Investment
Private Investment
Public Investment
Changes in Stock
Total Investment [I] Exports (Goods & Services) [X]
Imports (Goods & Services) [M]
Net Exports [X-M] Aggregate Demand [C + I + X] Domestic Demand [C + I]
Source: Pakistan Bureau of Statistics Saving and Investment
Due to contained inflation there was increase in consumption both by private agentGeneral Government. For Julycurrent account deficit remained US $billion and it is expected that for it will be approximately US $
Investment National Saving
Domestic Saving
2005-06 1,588 1,252
2006-07 1,736 1,290
2007-08 2,043 1,175
2008-09 2,316 1,590
2009-10 2,350 2,019
2010-11 2,581 2,599
2011-12 3,022 2,607
2012-13 3,348 3,107
2013-14 3,684 3,362
2014-15 4,310 4,027
2015-16 4,561 4,054
2016-17 5,144 3,842
2017-18(P) 5,649 3,916
Source: EA Wing and Ministry of Planning, Development
Growth and Investment
ow interest rates more consumption as people are
to purchase durables during periods when relatively cheap money is available. In
General Government final expenditure, there was 18.3 percent increase during FY 2018 compared to expenditure last year.
1.3: Composition of Aggregate Demand
2013-14 2014-15 2015-16 F 2016
81.0 79.8 80.0
10.8 11.0 11.3
91.8 90.7 91.3 13.0 14.1 14.1
9.9 10.4 10.3
3.2 3.7 3.8
1.6 1.6 1.6
14.6 15.7 15.7 12.2 10.6 9.1
18.7 17.1 16.2
-6.4 -6.4 -7.0 118.7 117.1 116.2
106.4 106.4 107.0
Source: Pakistan Bureau of Statistics
there was increase in consumption both by private agents and
overnment. For July-March FY 2018, current account deficit remained US $ 12.0 billion and it is expected that for complete year,
US $ 15.7 billion i.e.,
5.0 percent of GDP. Thus for FY 2018, national saving and domestic saving GDP remained almost at similaryear. This implies that remained less than expenditures2018 when compared with FY 2017 which resulted in increase in Saving
Fig-1.5: Saving-Investment Gap
Domestic Saving
Foreign Saving
Saving-Investment
Gap
1,102 337 (337)
1,132 446 (446)
966 868 (868)
1,243 727 (727)
1,453 331 (331)
1,779 -18 18
1,571 416 (416)
1,945 241 (241)
1,933 322 (322)
2,353 283 (283)
2,271 507 (507)
2,097 1,302 (1,302)
2,099 1,733 (1,733)
A Wing and Ministry of Planning, Development and Reform
(2,000)
(1,800)
(1,600)
(1,400)
(1,200)
(1,000)
(800)
(600)
(400)
(200)
-
200
2005
-06
2006
-07
2007
-08
2008
-09
2009
-10
2010
-11
2011
-12
Saving-Investment GapSaving-Investment Gap as % of GDP
Growth and Investment
7
overnment final consumption , there was 18.3 percent increase
during FY 2018 compared to consumption
2016-17 R 2017-18 P
82.0 82.1
11.3 12.4
93.2 94.5 14.5 14.8
10.0 9.8
4.5 5.0
1.6 1.6
16.1 16.4 8.2 8.5
17.6 19.4
-9.3 -10.9 117.6 119.4 109.3 110.9
ent of GDP. Thus for FY 2018, national and domestic saving as percentage of
almost at similar level of last that national income
than expenditures during FY 2018 when compared with FY 2017 which
in increase in Saving-Investment gap.
and Reform
-9%
-8%
-7%
-6%
-5%
-4%
-3%
-2%
-1%
0%
1%
2011
-12
2012
-13
2013
-14
2014
-15
2015
-16
2016
-17
2017
-18(
P)
Investment GapInvestment Gap as % of GDP

Pakistan Economic Survey 2017-18
8
Increase in Saving-Investment gap in turn resulted in higher current-account deficit. During FY 2018, current account deficit remained higher than FY 2017 which resulted in increased borrowing from the external sources.
During FY 2018 Gross Fixed Capital Formation (GFCF), considered as fixed investment, stood at Rs 5,099.1 billion compared to Rs 4,632.8 billion last year posting a growth of 10.1 percent. Private sector Gross Fixed Capital Formation (GFCF) posted a growth 5.2 percent as it increased to Rs 3,371.2 billion compared to 3,205.5 billion last year while the public sector GFCF increased to Rs 373.3 billion compared to 339.5 billion last year showing a growth of 9.9 percent.
Estimates of GFCF in the General Government sector are based on budgetary data of federal, provincial and districts governments. Estimates for the year FY 2018 are placed at Rs 1,354.6 billion against Rs 1,087.7 billion in last year, which are higher by 24.5 percent. The expenditure on GFCF incurred by federal, provincial and district governments has increased by 23.9 percent, 22.1 percent and 45.7 percent, respectively.
At current prices, in public sector, major positive contribution in GFCF remained in agriculture (257 percent) which increased from Rs 122 million to Rs 435 million followed by electricity & gas (70.9 percent) which increased from Rs 138.5 to 236.7 billion. While others in transport & communication (71.2 percent) (Pakistan National Shipping Corporation increased from Rs 0.6 billion to Rs 5.5 billion, Port Qasim Authority increased from Rs 0.5 billion to Rs 9.2 billion, PARCO increased from Rs 0.07 billon to Rs 12.8 billion). Some industries in public sector have witnessed negative growth including mining & quarrying (57.1 percent), which decreased from Rs 64.2 billion to Rs 27.6 billion due to OGDC (Plant & Machinery declined from Rs 48.4 billion to 12.7 billion), LSM (39.1 percent) due to National Refinery Limited (Rs 28.1 billion vs 0.37 billion). Railways in transport & communication declined by 72.9 percent (Rs 39.4 billion to Rs 10.7 billion) and finance & insurance decline by 35.1 percent due to EOBI
(Rs 9.8 billion to 4.9 billion).
In private sector, at current prices, the estimates of GFCF in agriculture sector stands at Rs 1000.2 billion during FY 2018 against Rs 928.9 billion last year showing a growth of 7.7 percent mainly due to increase in domestic agriculture machinery (from Rs 39.7 billion to Rs 57.0 billion) and value of stock in the livestock (from Rs 730.5 billion to 776.0 billion). Estimates of GFCF in mining and quarrying sector during FY 2018 are estimated at Rs 50.1 billion against Rs 49.8 billion last year registering a nominal growth of 0.6 percent due to less expenditure in exploration costs.
Estimate of private sector GFCFin wholesale & retail trade sub-sector has grown by 10.4 percent during 2017-18. The private sector GFCF in Transport & Communication sector has increased by 0.4 percent in FY 2018 to Rs 472.1 billion from Rs 470.0 billion last year. Mobile phone companies have reported provisional GFCF conservatively. Moreover, remaining sub-sectors such as housing services and other private services have registered GFCF growth of 8.3 percent and 10.9 percent during 2017-18 respectively.
In the large scale manufacturing (LSM) sector, GFCF in private sector is composed of in-production and under-construction units. Estimates of in-production units have been derived on the basis of census/survey of listed and non-listed companies. Estimates of GFCF in respect of under-construction manufacturing units are based on financial assistance of industrial investment disbursed by the Developmental Financial Institutions (DFIs), special banks, scheduled banks, modarbas& leasing companies based data from all sources. GFCF for private large scale manufacturing sector for the year FY 2018 is estimated at Rs 481.9 billion against Rs 479.5 billion during last year showing a modest increase of 0.5 percent. Conservative reporting of provisional capital formation by private companies is the main reason behind this slow rate of increase. Expenditures on GFCF for Electricity Generation & Distribution and Gas Distribution sector stands at Rs 6.3 billion during FY 2018 against Rs 9.2 billion last year registering a

decline of 31.2 percent mainly because of lower expenditure reported by IPPs.construction sector for the year estimated as Rs 69.4 billion against billion last year, which is 16.2 percent lower. This is due to lower imported construction machinery which declined from last year to Rs 42.6 billion current yearin finance & insurance industry by 0.4 percent during 2017conserve reporting by commercial banks and insurance companies.
Per Capita Income
Per capita income is one of the most widely used measures of the general welleconomy. It is computed by dividing National Income (GNI) by population while
Fig-1.6: Per Capita Income in Rupees and in Dollars
Global Development
Global economic activity continued to strengthen since 2016 and global output is estimated to have grown by 3.8 This broad based momentum is investment recovery in advanced economies, continued strong growth in emerging Asia, a notable upswing in emerging Europe, and signs of recovery in several commodiGlobal output is projected to further increase by 3.9 percent for 2018 and 2019by strong momentum, favorable market sentiment, accommodative financial conditions, and the domestic and international repercussions of expansionary fiscal policy in
0
20,000
40,000
60,000
80,000
100,000
120,000
140,000
160,000
180,000
200,000
2005
-06
2006
-07
2007
-08
2008
-09
2009
-10
2010
-11
2011
-12
2012
-13
Per Capita Income(Rs)
Growth and Investment
decline of 31.2 percent mainly because of lower expenditure reported by IPPs. GFCF in construction sector for the year FY 2018 is
69.4 billion against Rs 82.9 last year, which is 16.2 percent lower.
r imported construction machinery which declined from Rs 50.4 billion
current year. GFCF in finance & insurance industry also decreased by 0.4 percent during 2017-18 because of conserve reporting by commercial banks and
is one of the most widely used measures of the general well-being in an
computed by dividing Gross National Income (GNI) by population while
GNI is obtained by adding Net Factor Income from Abroad in GDP at market price.
Net factor income from abroad increased by 4.17 percent in FY 2018 compared to FY 2017. This is taken as investment net of income receipts Royalties/ Traderemittances. There is 44.8 percent growth in receipts of Royalties/ Trade2018 compared to FY 2017.
During FY2018, per capita income increased by 0.5 percent to $1,641. As per PBS, pincome during 2016-17 is based on provisional figures of Population Census 2017 held in March 2017207,774,520. The revised series of per capita income will be compiled after finalization of 6th Housing & Population Census results.
1.6: Per Capita Income in Rupees and in Dollars
Source: Pakistan Bureau of Statistics
Global economic activity continued to strengthen since 2016 and global output is estimated to have grown by 3.8 percent in 2017. This broad based momentum is driven by an investment recovery in advanced economies, continued strong growth in emerging Asia, a notable upswing in emerging Europe, and signs of recovery in several commodity exporters.
projected to further increase by for 2018 and 2019 that is supported
by strong momentum, favorable market sentiment, accommodative financial conditions, and the domestic and international repercussions of expansionary fiscal policy in
the United States. The partial recovery in commodity prices should allocommodity exporters to gradually improve.
Across advanced economies, the pickup in growth in 2017 is explained almost entirely by investment spending, which remained weak since the 2008–09 global financial crisis and was particularly subdued in 2016.
Across emerging marketeconomies, pickup in growth during 2017 came primarily from an acceleration in private consumption. Growth in China and India last year was supported by resurgent net exports and
2012
-13
2013
-14
2014
-15
2015
-16
(A)
2016
-17
(R)
2017
-18
(P)
Per Capita Income(Rs)
0
200
400
600
800
1,000
1,200
1,400
1,600
1,800
2005
-06
2006
-07
2007
-08
2008
-09
2009
-10
2010
-11
2011
-12
2012
-13
Per Capita Income(US $)
Growth and Investment
9
GNI is obtained by adding Net Factor Income Abroad in GDP at market price.
Net factor income from abroad increased by 4.17 percent in FY 2018 compared to FY 2017. This is taken as investment net of income receipts Royalties/ Trade-mark and worker’s remittances. There is 44.8 percent growth in
pts of Royalties/ Trade-mark during FY 2018 compared to FY 2017.
During FY2018, per capita income increased As per PBS, per capita
17 is Rs 162,230 ($1,641) based on provisional figures of Population
7 held in March 2017, i.e., 207,774,520. The revised series of per capita income will be compiled after finalization of 6th Housing & Population Census results.
the United States. The partial recovery in commodity prices should allow conditions in commodity exporters to gradually improve.
Across advanced economies, the pickup in growth in 2017 is explained almost entirely by investment spending, which remained weak
09 global financial crisis and ed in 2016.
Across emerging markets and developing economies, pickup in growth during 2017 came primarily from an acceleration in private
Growth in China and India last year was supported by resurgent net exports and
2012
-13
2013
-14
2014
-15
201
5-1
6 (A
)
201
6-17
(R
)
201
7-1
8 (P
)
Per Capita Income(US $)

Pakistan Economic Survey 2017-18
10
strong private consumption, respectively, while investment growth slowed down.
Advanced economies are projected to grow at 2.5 percent in 2018 and 2.2 percent in 2019. Growth projection in advanced economies reflecting stronger prospects for the euro-zone area and Japan and especially the projected domestic and spill over effects of expansionary fiscal policy in the United States. In the United States, growth is expected to rise from 2.3 percent in 2017 to 2.9 percent in 2018, before moderating slightly to 2.7 percent in 2019. The upward revision reflects stronger-than-expected activity in 2017, firmer external demand, and the expected macroeconomic impact of the December 2017 tax reform. Fiscal policy changes are projected to add to growth through 2020, so that US real GDP is 1.2 percent higher by 2020 than in a projection without the tax policy changes.
The growth trend of the euro-zone area and Japan-important contributors to the long-awaited strengthening of economic activity in advanced economies—are expected to continue during 2018–19. The recovery in the euro-zone area is projected to pick up slightly from 2.3 percent in 2017 to 2.4 percent this year, before moderating to 2 percent in 2019. The forecasting is reflecting stronger-than-expected domestic demand across the currency area, supportive monetary policy, and improved external demand prospects.
Japan’s growth is projected to moderate to 1.2 percent in 2018 before slowing further to 0.9 percent in 2019. The growth projection reflects more favorable external demand prospects, rising private investment, and the supplementary budget for 2018. Japan’s medium-term prospects, however, remain weak, owing largely to a shrinking labor force.
Growth in emerging markets and developing economies is expected to increase further—from 4.8 percent in 2017 to 4.9 percent in 2018 and 5.1 percent in 2019. Although the high growth rate reflects primarily continued strong economic performance in emerging Asia, the projected pickup in growth reflects improved
prospects for commodity exporters after three years of very weak economic activity.
Emerging Asia, which is forecast to continue growing at about 6.5 percent during 2018–19, remains the most important engine of global growth. In China, growth is projected to soften slightly from 6.9 percent in 2017 to 6.6 percent in 2018 and 6.4 percent in 2019. The forecast is reflecting an improved external demand outlook. Over the medium term, the economy is projected to continue rebalancing away from investment toward private consumption and from industry to services, but non-financial debt is expected to continue rising as a share of GDP, and the accumulation of vulnerabilities clouds the medium-term outlook.
Growth in emerging and developing Europe, now estimated at close to 6 percent in 2017, is projected to moderate to 4.3 percent in 2018 and 3.7 percent in 2019, supported by a favorable external environment with easy financial conditions and stronger export demand from the euro-zone area and, for Turkey, an accommodative policy stance.
Growth in the Middle East, North Africa, Afghanistan, and Pakistan region is also expected to pick up in 2018 and 2019, but will remain subdued at about 3.5 percent. While stronger oil prices are helping recovery in domestic demand in oil exporters, including Saudi Arabia, the fiscal adjustment that is still needed is projected to weigh considerably on growth prospects.
According to World Bank report “South Asia Economic Focus Spring 2018”, the world economy continued its recovery and global growth increased to 3.3 percent in the last two quarters of 2017. Growth in the United States accelerated to 2.3 percent in the third quarter of last year and further to 2.6 percent in the fourth quarter. In the Eurozone, growth accelerated to 2.8 percent while developing countries grew slightly slowly last year than in 2016, but their growth picked up to 6.6 percent in the last quarter of 2017. However, South Asia is again the fastest growing region in the world, albeit not by a wide margin. The growth rate in India

Growth and Investment
11
picked up in the second half of 2017 after five consecutive quarters of deceleration. Despite an acceleration of economic growth in destination markets, export performance remains disappointing throughout the region, while imports increased rapidly. Although remittances were recovering, however, current account
deficits continued to widen. The widening of current account deficit resulted in currency depreciation. Thus, not only Pakistani rupee but also Indian rupee depreciated. However, it is expected that this depreciation of currency will support improvement in external balance.
Table-:Real GDP Growth Rates (%)
Country Group Name 2011 2012 2013 2014 2015 2016 2017 2018 2019 2020 World 4.3 3.5 3.5 3.6 3.5 3.2 3.8 3.9 3.9 3.8 Euro area 1.6 -0.9 -0.2 1.3 2.1 1.8 2.3 2.4 2.0 1.7 United States 1.6 2.2 1.7 2.6 2.9 1.5 2.3 2.9 2.7 1.9 Canada 3.1 1.7 2.5 2.9 1.0 1.4 3.0 2.1 2.0 1.8 United Kingdom 1.5 1.5 2.1 3.1 2.3 1.9 1.8 1.6 1.5 1.5 Germany 3.7 0.7 0.6 1.9 1.5 1.9 2.5 2.5 2.0 1.5 Emerging Market and Developing Economies
6.4 5.4 5.1 4.7 4.3 4.4 4.8 4.9 5.1 5.1
China 9.5 7.9 7.8 7.3 6.9 6.7 6.9 6.6 6.4 6.3 Hong Kong SAR 4.8 1.7 3.1 2.8 2.4 2.1 3.8 3.6 3.2 3.1 Singapore 6.4 4.1 5.1 3.9 2.2 2.4 3.6 2.9 2.7 2.6 Turkey 11.1 4.8 8.5 5.2 6.1 3.2 7.0 4.4 4.0 3.6 Russia 5.1 3.7 1.8 0.7 -2.5 -0.2 1.5 1.7 1.5 1.5 Japan -0.1 1.5 2.0 0.4 1.4 0.9 1.7 1.2 0.9 0.3 Korea 3.7 2.3 2.9 3.3 2.8 2.8 3.1 3.0 2.9 2.8
ASEAN Indonesia 6.2 6.0 5.6 5.0 4.9 5.0 5.1 5.3 5.5 5.6 Thailand 0.8 7.2 2.7 1.0 3.0 3.3 3.9 3.9 3.8 3.6 Malaysia 5.3 5.5 4.7 6.0 5.0 4.2 5.9 5.3 5.0 4.9 Philippines 3.7 6.7 7.1 6.1 6.1 6.9 6.7 6.7 6.8 6.9
South Asia India 6.6 5.5 6.4 7.4 8.2 7.1 6.7 7.4 7.8 7.9 Bangladesh 6.5 6.3 6.0 6.3 6.8 7.2 7.1 7 7 7.0 Sri Lanka 8.4 9.1 3.4 5.0 5.0 4.5 3.1 4.0 4.5 4.7 Pakistan* 3.6 3.8 3.7 4.1 4.1 4.5 5.3 5.6 4.7 4.9
Middle East Saudi Arabia 10.3 5.4 2.7 3.7 4.1 1.7 -0.7 1.7 1.9 1.9 Kuwait 10.9 7.9 0.4 0.6 -1.0 2.2 -2.5 1.3 3.8 3.9 Islamic Republic of Iran 3.1 -7.7 -0.3 3.2 -1.6 12.5 4.3 4.0 4.0 4.1 Qatar 13.4 4.7 4.4 4.0 3.6 2.2 2.1 2.6 2.7 2.6 United Arab Emirates 6.4 5.1 5.8 3.3 3.8 3.0 0.5 2.0 3.0 3.2 Egypt 1.8 2.2 3.3 2.9 4.4 4.3 4.2 5.2 5.5 5.8
Africa Algeria 2.8 3.4 2.8 3.8 3.7 3.3 2.0 3.0 2.7 1.8 Morocco 5.2 3.0 4.5 2.7 4.6 1.2 4.2 3.1 4.0 4.2 Vietnam 6.2 5.2 5.4 6.0 6.7 6.2 6.8 6.6 6.5 6.5 South Africa 3.3 2.2 2.5 1.8 1.3 0.6 1.3 1.5 1.7 1.8 Kenya 6.1 4.6 5.9 5.4 5.7 5.8 4.8 5.5 6.0 6.2 Tunisia -1.9 3.9 2.4 2.3 1.1 1 1.9 2.4 2.9 3.4 *As per National Accounts Meeting, GDP growth rate in Pakistan remained 4.6 %, 5.4% and 5.8 % for 2015-16, 2016-17 and 2017-18 respectively
International Monetary Fund, World Economic Outlook Database, April 2018

Pakistan Economic Survey 2017-18
12
In South Asian countries, economic activity in Pakistan is expected to remain robust as GDP growth is now at higher trajectory. It is also expected that economic activity will be supported by a pickup in exports and rising investment demand, which is expected to benefit from an improved business sentiment, China-Pakistan Economic Corridor (CPEC) and other infrastructure initiatives. However, a rising current account deficit coupled with a higher fiscal account deficit remain our major
challenges. Thus a vigilant policy is needed domestically and internationally to cope with changing international environment.
Conclusion The economy is presently on a high growth trajectory. With the right economic and fiscal policies by the present government during the last five years, the economy has been placed on strong foundations. All the fundamentals are in the positive territory.