Growth And Accumulation
42
1 GROWTH AND ACCUMULATION MD Siyam Hossain MD Siyam Hossain Bangladesh Institute of Business & Bangladesh Institute of Business & Technology. Technology. Narayangonj,Dhaka Narayangonj,Dhaka Dhaka,Bangladesh Dhaka,Bangladesh www.facebook.com/mdsiyamhossain
-
Upload
md-siyam-hossain -
Category
Economy & Finance
-
view
62 -
download
3
Transcript of Growth And Accumulation
11
GROWTH AND ACCUMULATION
MD Siyam HossainMD Siyam Hossain Bangladesh Institute of Business & Technology.Bangladesh Institute of Business & Technology. Narayangonj,DhakaNarayangonj,Dhaka Dhaka,BangladeshDhaka,Bangladesh www.facebook.com/mdsiyamhossain
22
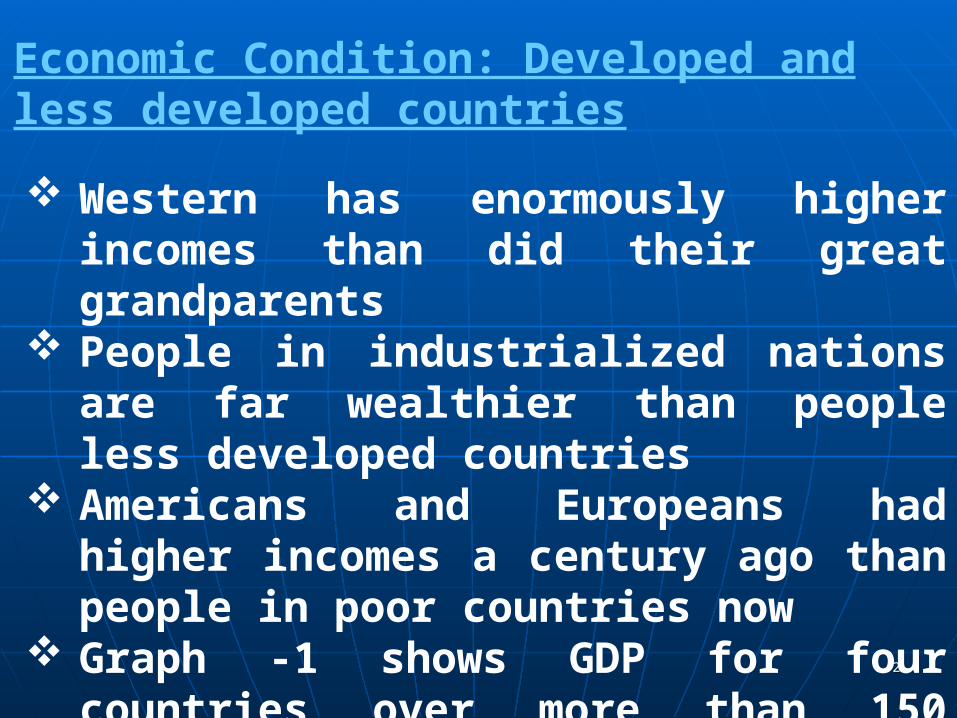
Economic Condition: Developed and less developed countries
Western has enormously higher incomes than did their great grandparents
People in industrialized nations are far wealthier than people less developed countries
Americans and Europeans had higher incomes a century ago than people in poor countries now
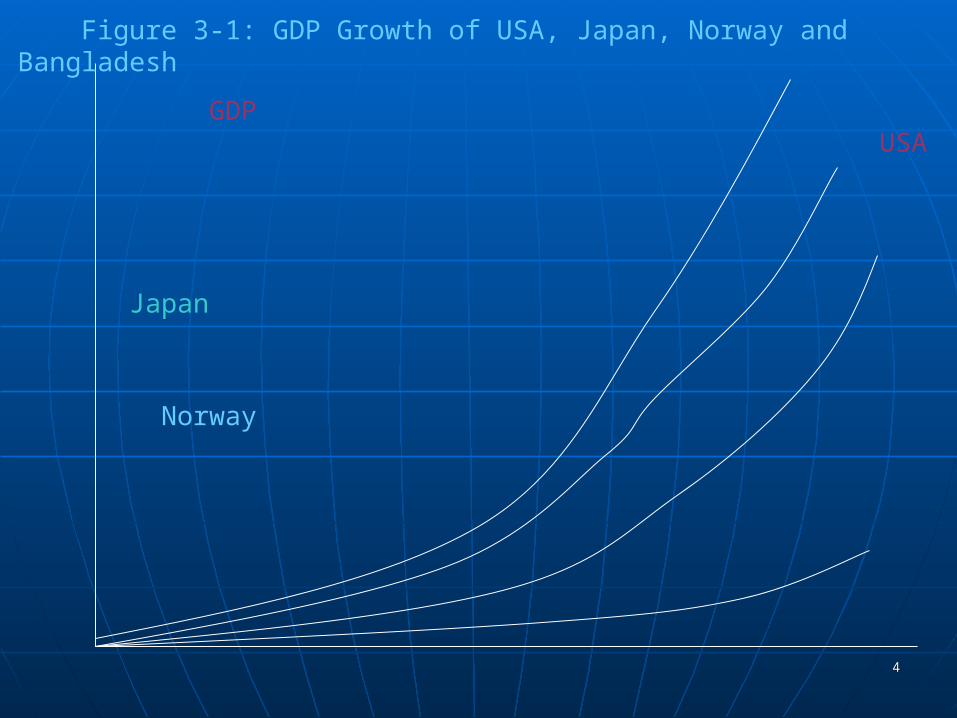
Graph -1 shows GDP for four countries over more than 150 years
33
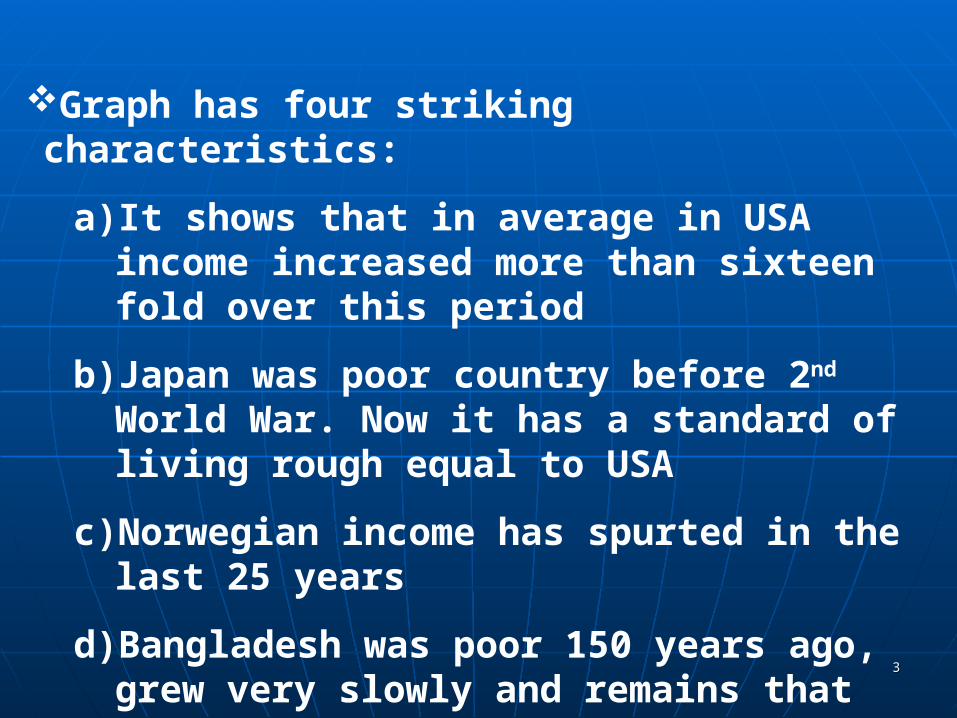
Graph has four striking characteristics:
a) It shows that in average in USA income increased more than sixteen fold over this period
b) Japan was poor country before 2nd World War. Now it has a standard of living rough equal to USA
c) Norwegian income has spurted in the last 25 years
d) Bangladesh was poor 150 years ago, grew very slowly and remains that way today
44
Figure 3-1: GDP Growth of USA, Japan, Norway and Bangladesh
GDP USA
Japan
Norway
Bangladesh
1860 2000 (Year)
55
Question is: What accounts for these differences? And What will determine our standard of living in future? The answer of these questions are given by: (i) Growth accounting and (ii) Growth theory Growth Accounting Growth accounting explains what part of growth in
total output is due to growth in different factors of production (capital, labour, technology, etc.)
Growth Theory Growth theory explains how economic decisions
control the accumulation of factors of production Or, how rate of saving today affects stock of capital in
future
66
1. GROWTH ACCOUNTING
General Explanation of GrowthOutput grows through increases in:
(i) Inputs (K and N) and(ii) Productivity due to (a) improved technology and (b) a more able work force
Production Function Production function (I) provides a quantitative link
between inputs and outputs It relates level of output to level of inputs and level of
technology
Y = A(K, N) (1)
Equation (1) is the functional equation of GDP Equation (1) is also called production function
77
Where: N = Labour Force K = Capital (K) and A = Level of TechnologyEquation (I) shows that output (Y) is a function of:
(i) Inputs (K and N) and (ii) Level of technology (A)
Inputs More input means more output Increase in labour force (one input) increases output
(marginal product of labour/MPN) Increase in capital, the other input increases output
(marginal product of capital/MPK)
88
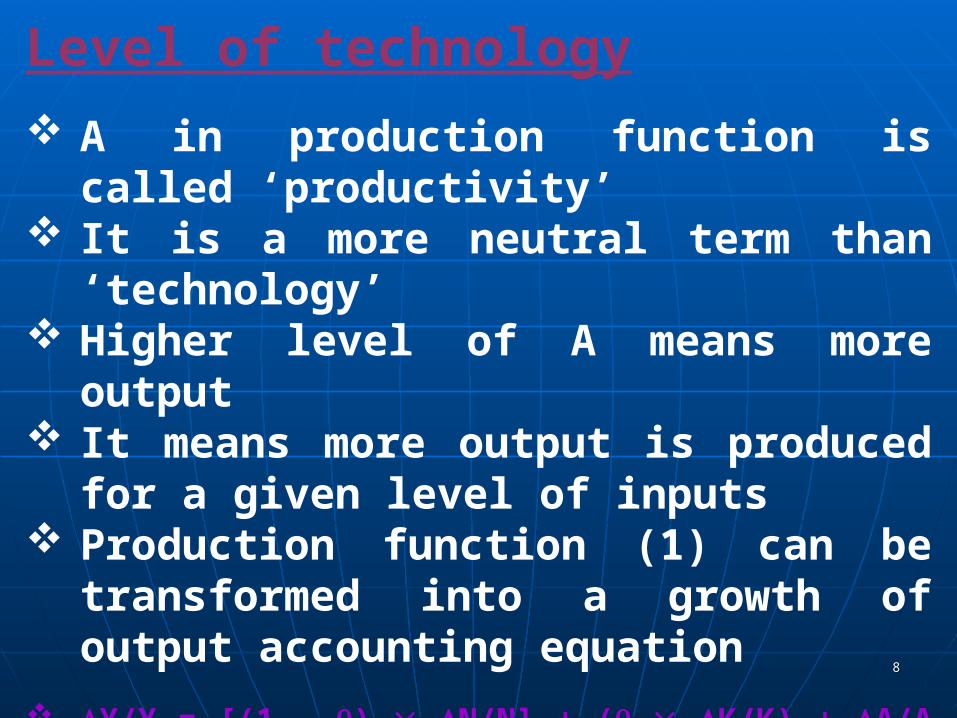
Level of technology
A in production function is called ‘productivity’
It is a more neutral term than ‘technology’ Higher level of A means more output It means more output is produced for a given
level of inputs Production function (1) can be transformed
into a growth of output accounting equation
Y/Y = [(1 - ) N/N] + ( K/K) + A/A (2)
It is called growth accounting equation
99
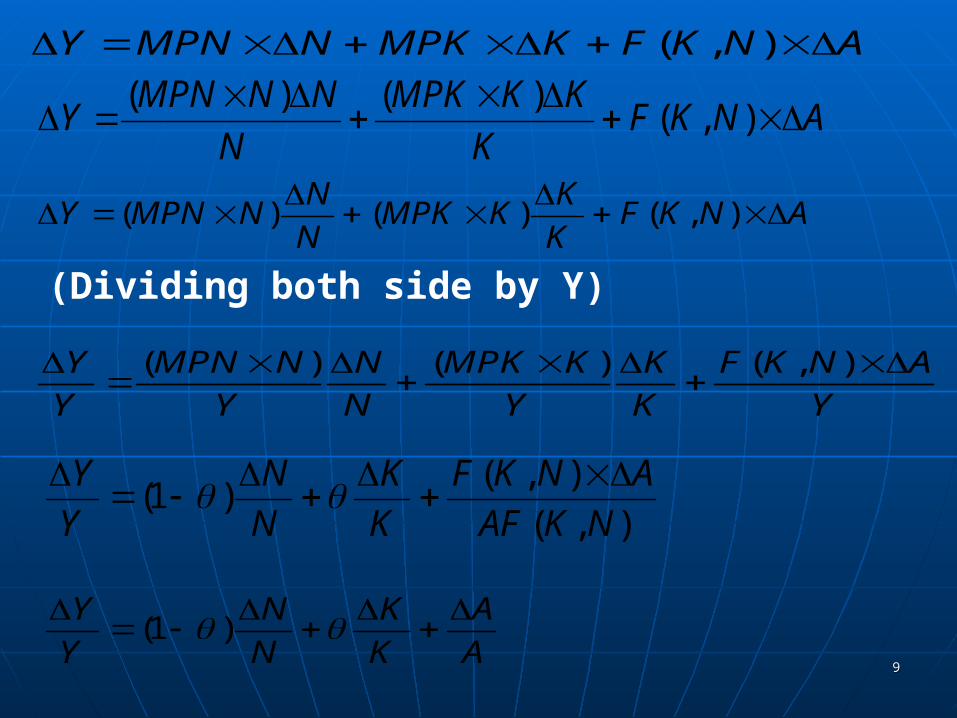
(Dividing both side by Y)
ANKFKMPKNMPNY ),(
ANKFK
KKMPK
N
NNMPNY
),()()(
Y
ANKF
K
K
Y
KMPK
N
N
Y
NMPN
Y
Y
),()()(
),(
),()1(
NKAF
ANKF
K
K
N
N
Y
Y
A
A
K
K
N
N
Y
Y )1(
ANKFK
KKMPK
N
NNMPNY
),(
)()(
1010
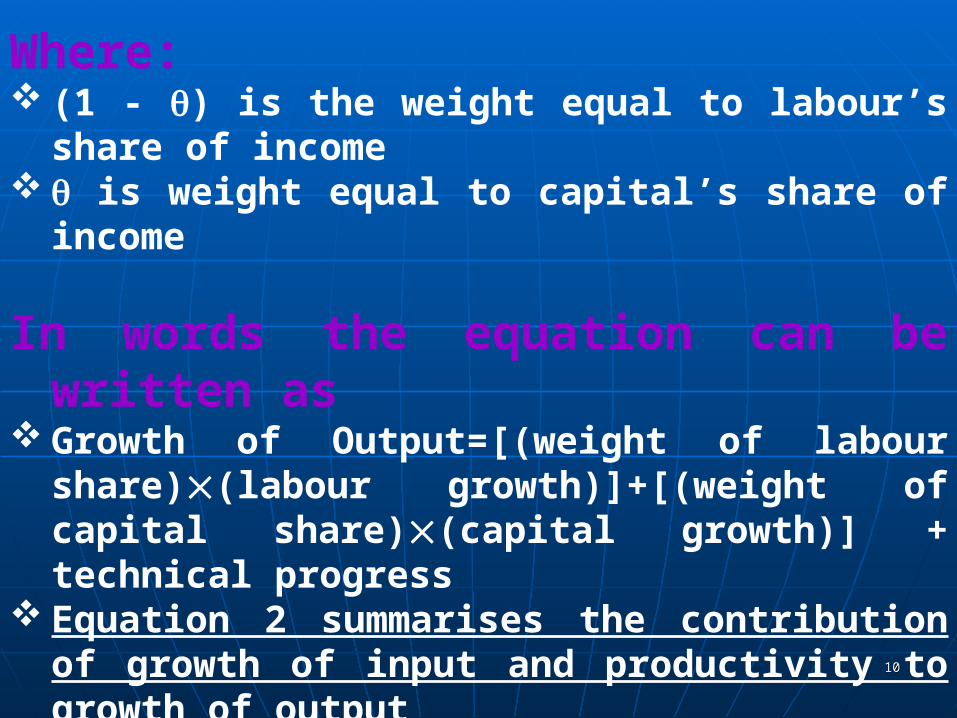
Where: (1 - ) is the weight equal to labour’s share of income is weight equal to capital’s share of income
In words the equation can be written as Growth of Output=[(weight of labour share)(labour
growth)]+[(weight of capital share)(capital growth)] + technical progress
Equation 2 summarises the contribution of growth of input and productivity to growth of output
It also says There is growth in total factor productivity, when we
get more output from same factors of production
1111
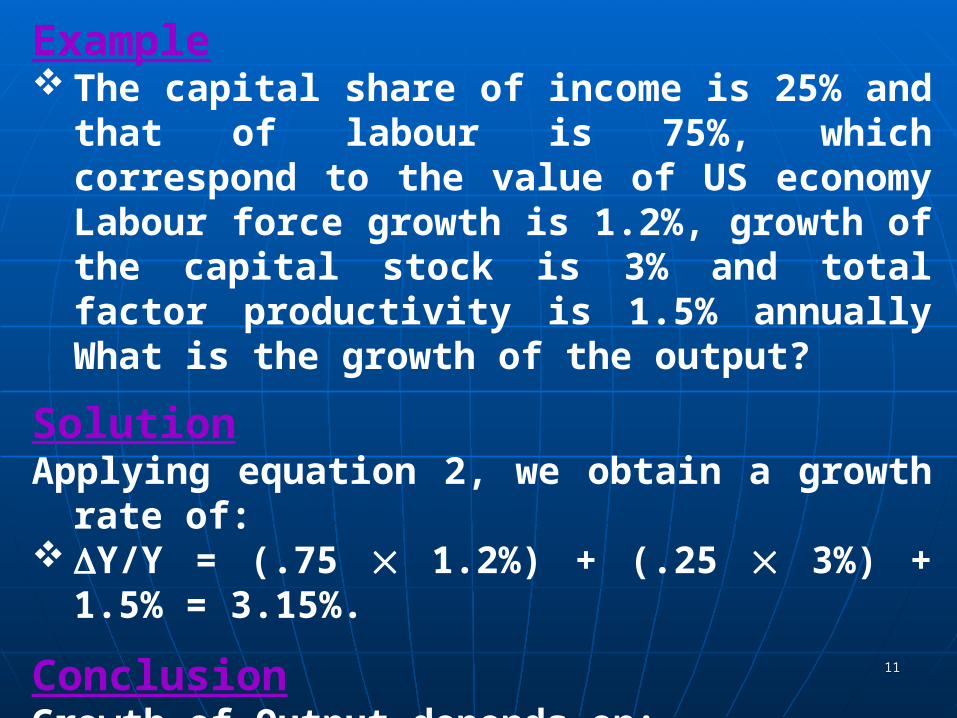
Example The capital share of income is 25% and that of labour
is 75%, which correspond to the value of US economy Labour force growth is 1.2%, growth of the capital stock is 3% and total factor productivity is 1.5% annually What is the growth of the output?
SolutionApplying equation 2, we obtain a growth rate of: Y/Y = (.75 1.2%) + (.25 3%) + 1.5% = 3.15%.
ConclusionGrowth of Output depends on:
(i) Kapital(ii) Labour, and (iii) Level of over all Technological Progress
1212
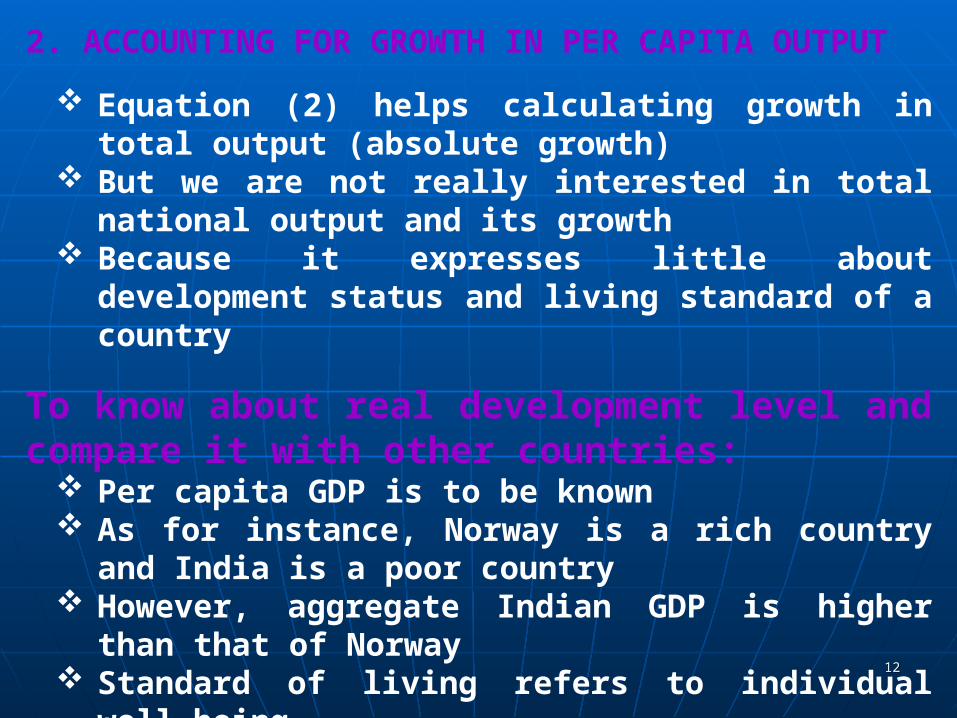
2. ACCOUNTING FOR GROWTH IN PER CAPITA OUTPUT
Equation (2) helps calculating growth in total output (absolute growth)
But we are not really interested in total national output and its growth
Because it expresses little about development status and living standard of a country
To know about real development level and compare it with other countries:
Per capita GDP is to be known As for instance, Norway is a rich country and India is a poor
country However, aggregate Indian GDP is higher than that of
Norway Standard of living refers to individual well-being Per capita GDP is the ratio of GDP to population
1313
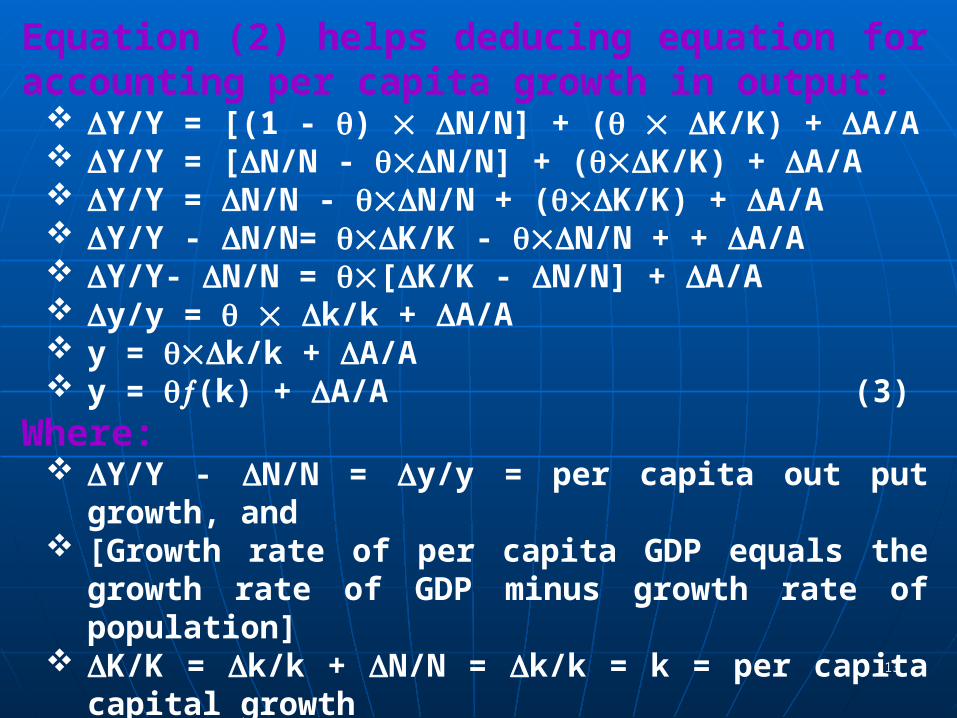
Equation (2) helps deducing equation for accounting per capita growth in output:
Y/Y = [(1 - ) N/N] + ( K/K) + A/A Y/Y = [N/N - N/N] + (K/K) + A/A Y/Y = N/N - N/N + (K/K) + A/A Y/Y - N/N= K/K - N/N + + A/A Y/Y- N/N = [K/K - N/N] + A/A y/y = k/k + A/A y = k/k + A/A y = (k) + A/A (3)
Where: Y/Y - N/N = y/y = per capita out put growth, and [Growth rate of per capita GDP equals the growth rate of
GDP minus growth rate of population] K/K = k/k + N/N = k/k = k = per capita capital growth [Growth rate of capital equals growth rate of per capita plus
growth rate of the population]
1414
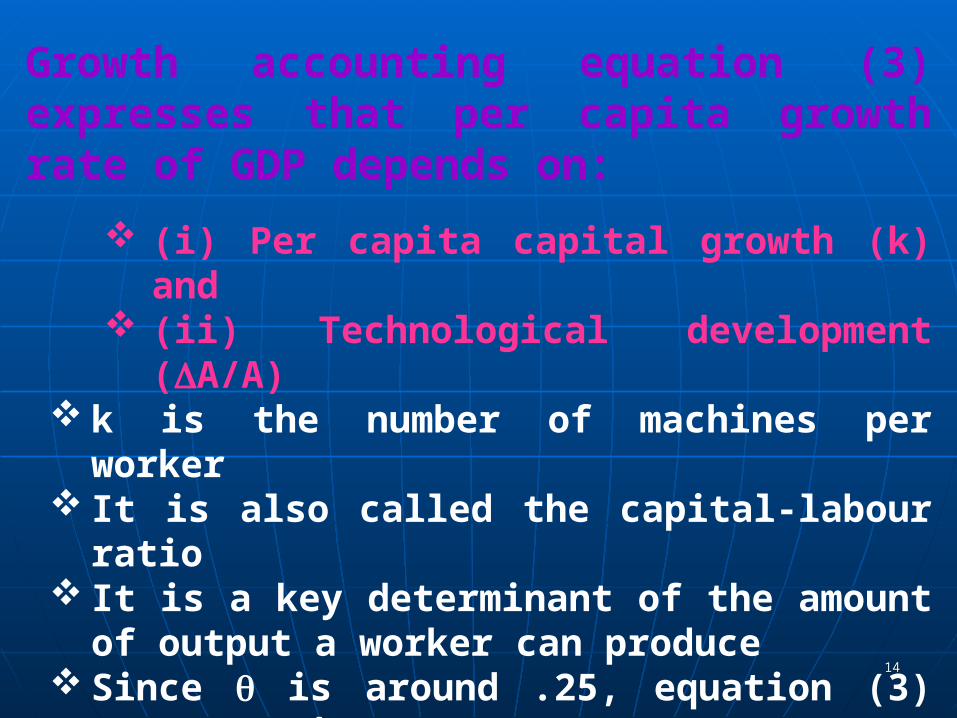
Growth accounting equation (3) expresses that per capita growth rate of GDP depends on:
(i) Per capita capital growth (k) and (ii) Technological development (A/A)
k is the number of machines per worker It is also called the capital-labour ratio It is a key determinant of the amount of output a
worker can produce Since is around .25, equation (3) suggests that:
1% increase in amount of labour increases only a quarter of 1% of per capita output
In other word, to increase 1% of per capita output (y), GDP, 4% capital has to be employed
1515
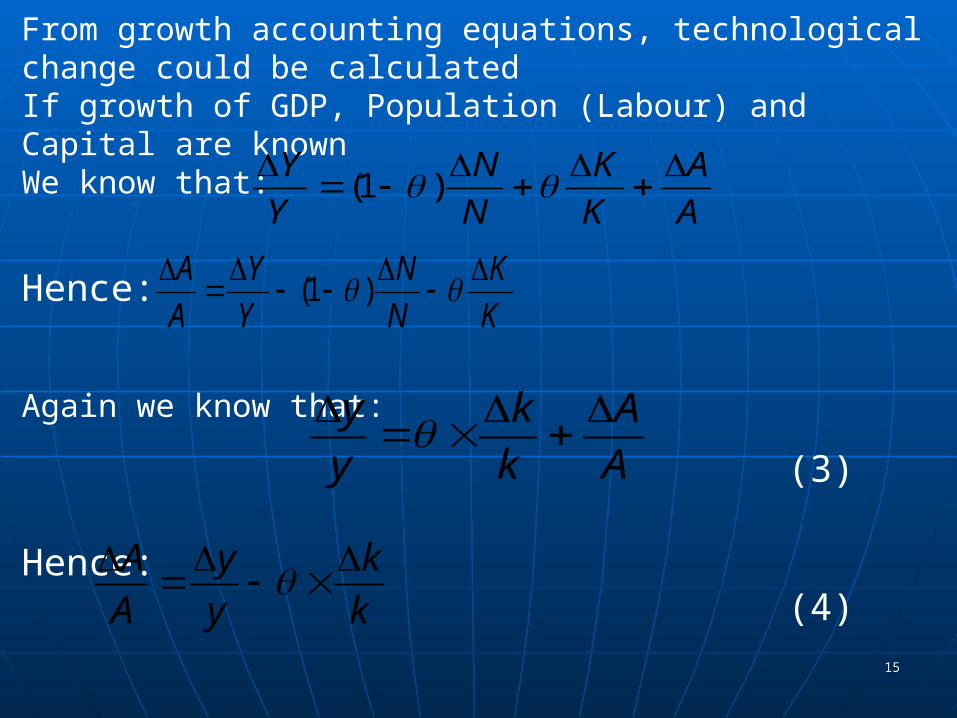
From growth accounting equations, technological change could be calculatedIf growth of GDP, Population (Labour) and Capital are knownWe know that:
Hence:
Again we know that:
(3)
Hence:(4)
A
A
K
K
N
N
Y
Y
)1(
K
K
N
N
Y
Y
A
A
)1(
A
A
k
k
y
y
k
k
y
y
A
A
1616
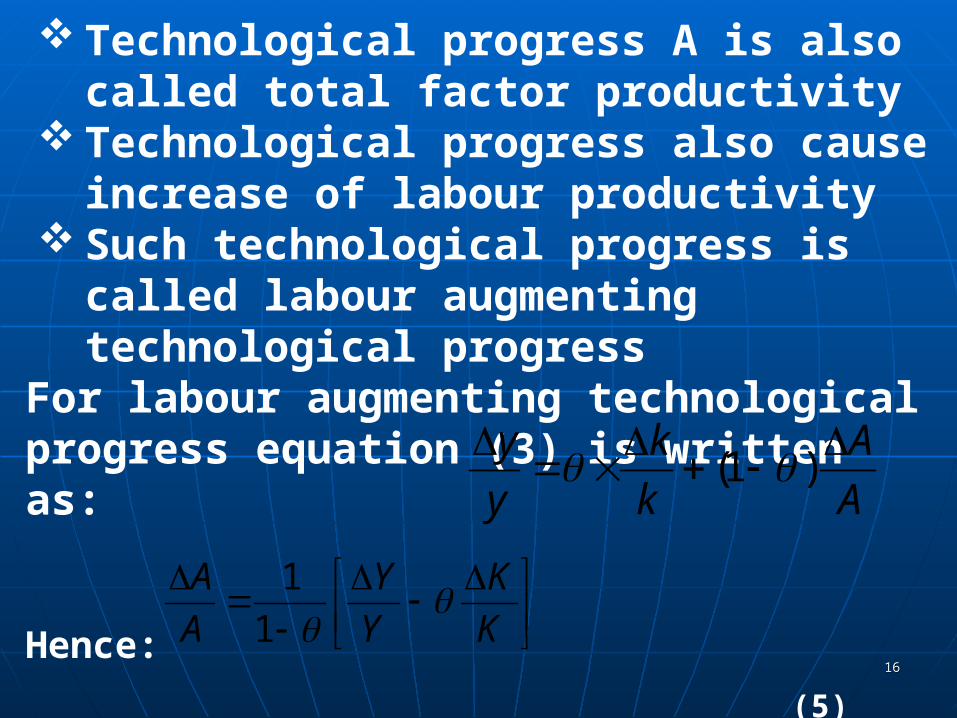
Technological progress A is also called total factor productivity
Technological progress also cause increase of labour productivity
Such technological progress is called labour augmenting technological progress
For labour augmenting technological progress equation (3) is written as:
Hence:
(5)
A
A
k
k
y
y
)1(
K
K
Y
Y
A
A 1
1
1717
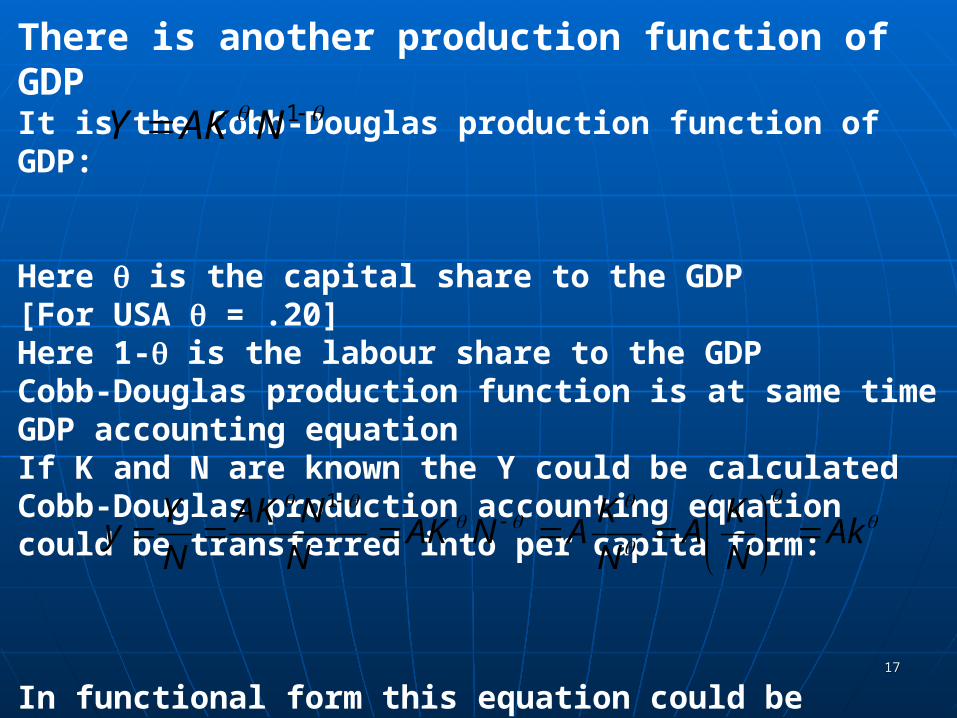
There is another production function of GDPIt is the Cobb-Douglas production function of GDP:
Here is the capital share to the GDP [For USA = .20]Here 1- is the labour share to the GDPCobb-Douglas production function is at same time GDP accounting equationIf K and N are known the Y could be calculatedCobb-Douglas production accounting equation could be transferred into per capita form:
In functional form this equation could be written as:y = (k)
1NAKY
AkN
KA
N
KANAK
N
NAK
N
Yy
1
1818
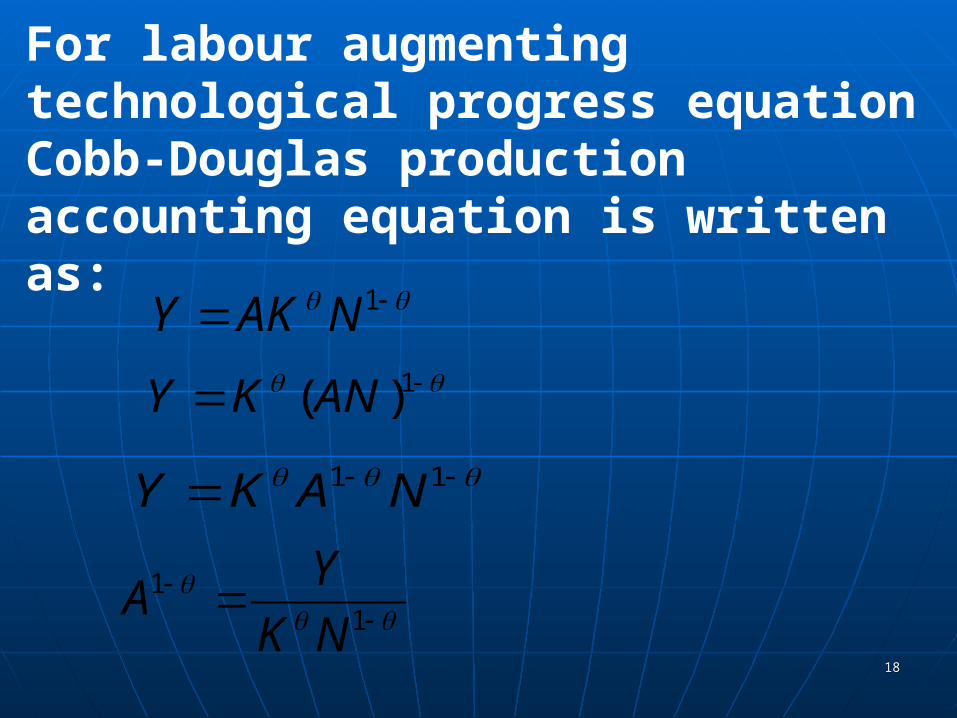
For labour augmenting technological progress equation Cobb-Douglas production accounting equation is written as:
1)(ANKY
1NAKY
11 NAKY
11
NK
YA
1919
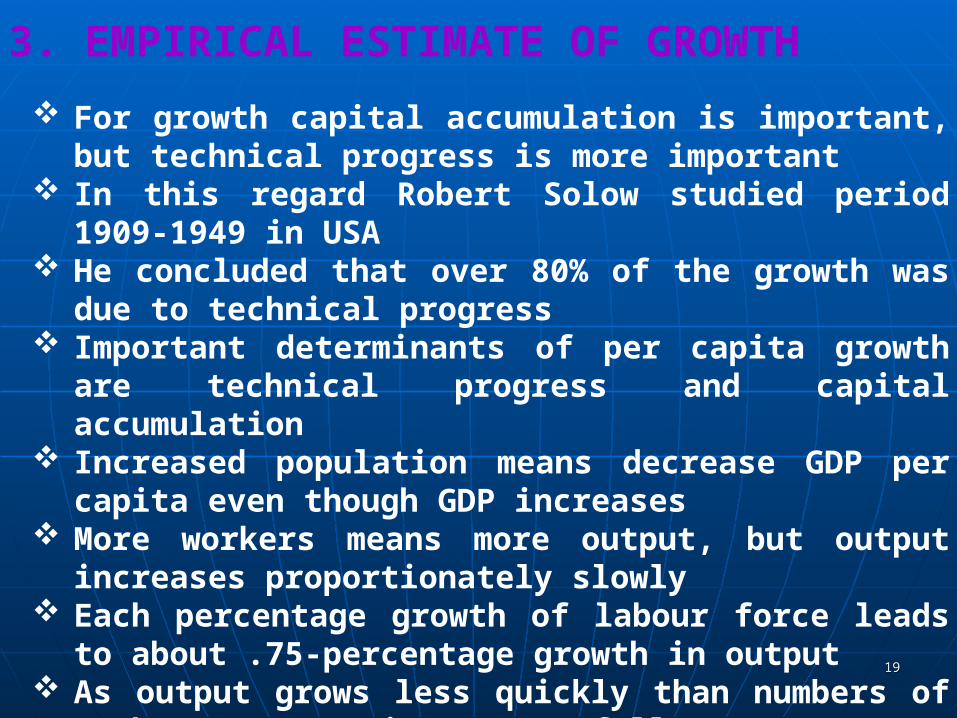
3. EMPIRICAL ESTIMATE OF GROWTH
For growth capital accumulation is important, but technical progress is more important
In this regard Robert Solow studied period 1909-1949 in USA He concluded that over 80% of the growth was due to technical
progress Important determinants of per capita growth are technical
progress and capital accumulation Increased population means decrease GDP per capita even
though GDP increases More workers means more output, but output increases
proportionately slowly Each percentage growth of labour force leads to about .75-
percentage growth in output As output grows less quickly than numbers of workers, per
capita output falls
2020
4. FACTORS OTHER THAN CAPITAL AND LABOR
Besides capital and labour other important inputs for growth are:(i) Natural resources and (ii) Human capital
Natural Resource Early prosperity of the US was due to abundant fertile From 1820 to 1870 arable land of USA grew at 1.41% annually Recent example of importance of natural resources is sharp
increase in Norwegian GDP From 1970-1990 Norway's per capita GDP rose from 61% to
77% of US per capita GDP This was due to the discovery and development of massive oil
reserves However, some empirical evidence suggests that: Countries with more natural resources generally do worse Explanation is: Some such countries squander their wealth
2121
Human Capital
High investment leads to high income Question is, is there any relationship between human
capital and output In industrialized countries, qualified workers is more
important than unqualified labour Stock of unqualified workers could be increased by
investment in human capital
Adding human capital (H), production function could be written as:
Y = AF(K,H,N) (4) Human capital is difficult to measure precisely However, length of schooling can serve as a proxy
for human capital
2222
Impact of Immigration Immigration boosts per capital output when skilled
workers enter the country From immigration USA has frequently benefited In USA qualified workers immigrated
Impact of Refugees Immigration consisting of refugees depresses per
capita output in the short run A factor of production adds to output growth only
when supply of this factor grows
2323
5. GROWTH THEORY - THE NEOCLASSICAL MODEL
There have been two periods of intense work on growth theory:
(i) Late 1950s and 1960s and (ii) Late 1980s and early 1990s
Research in the first period produced neoclassical growth theory
This theory focuses on capital accumulation and its link to savings
The other theory that focuses on the determinants of technological progress is called:
Endogenous growth theoryThis theory is studied in the next chapter
2424
Neo-classical growth theory
Neo-classical growth theory begins with a simplification of assumption
It predicts that there is no technological progress in the long run
This implies that economy reaches a long-run level of output and capital
It is called the steady-state equilibrium
2525
Steady-state equilibrium
Steady-state equilibrium is the combination of per capita GDP and per capita capital where economy remains at rest
It means in the steady state: Per capita economic variables are no longer changing
That is in steady state equilibrium: Per capita GDP does not grow [y = 0] Per capita capital does not grow [y = 0]
2626
Scope of Neo-classical growth theory
Neo-classical growth theory studies transition economy from its current position to steady state
It assumes that ultimately:
There will no technological progress and Per capital GDP will remain unchanged Hence it develops first the growth model for steady
state and As a final step adds technological progress to the
model
2727
We know that
Production function in per capita terms for classical model is written as:
y = (k) + A/A If technological progress A/A = 0 and = 0, then:
y = (k) (5) Here k is the capital-labour ratio
Considering technological progress; production function can be expressed as:
y = ak or Y = aK
2828
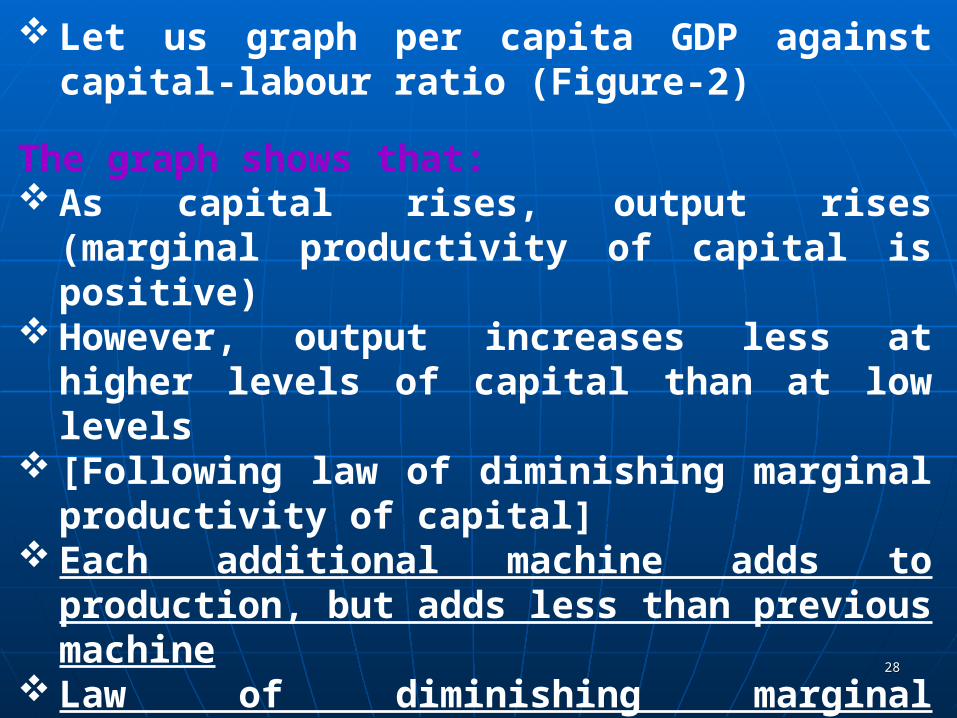
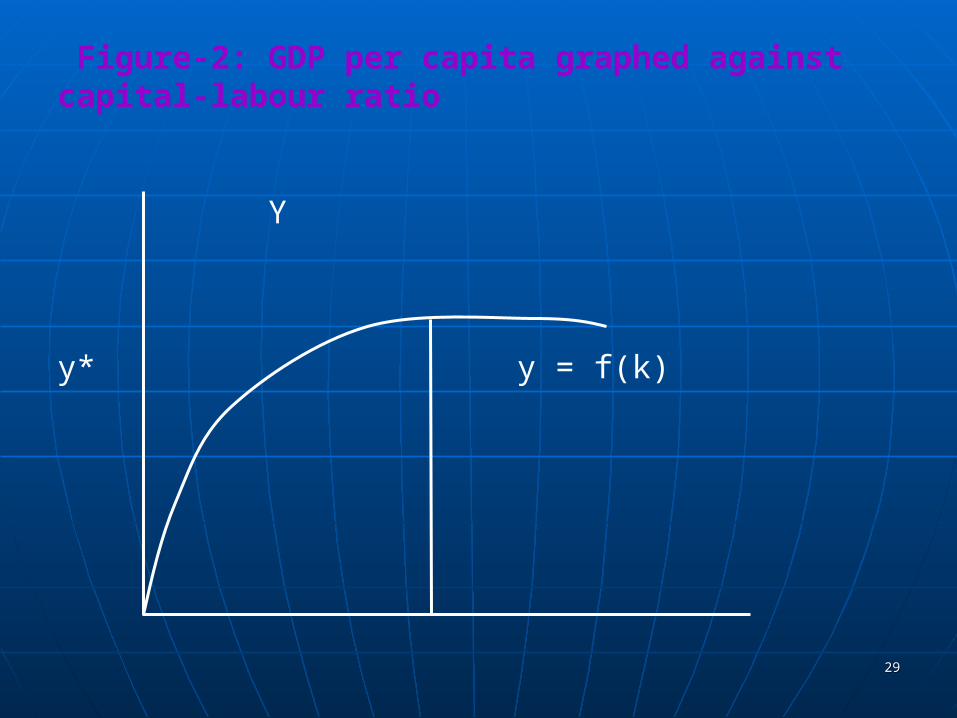
Let us graph per capita GDP against capital-labour ratio (Figure-2)
The graph shows that: As capital rises, output rises (marginal productivity of
capital is positive) However, output increases less at higher levels of
capital than at low levels [Following law of diminishing marginal productivity
of capital] Each additional machine adds to production, but adds
less than previous machine Law of diminishing marginal productivity is the key
explanation why the economy reaches a steady state rather than growing endlessly
2929
Figure-2: GDP per capita graphed against capital-labour ratio
Y
y* y = f(k)
k* K
3030
5.1 Steady State
An economy is in a steady state:
When per capita income and per capita capital are constant (Figure-2)
In steady state per capita income cannot be increased more
Steady-state value of per capita income = y* Steady-state value of per capita capital = k* At steady-state capital required for new workers and
machines worn out is just equal to saving generated by economy
At steady state levels of output saving and re-investment balance
3131
Explaining the situation before steady state
Before steady state: Per capita output, y, could be increased Per capita capital, k, could be increased If saving is greater than investment requirement,
capital per worker and output rise If saving is less than investment requirement, capital
per worker and hence output fall
ConclusionHave we: Steady-state value of per capita income, y*, and Steady-state value of per capita capital, k* We can examine transition path of economy from any
arbitrary point to steady state
3232
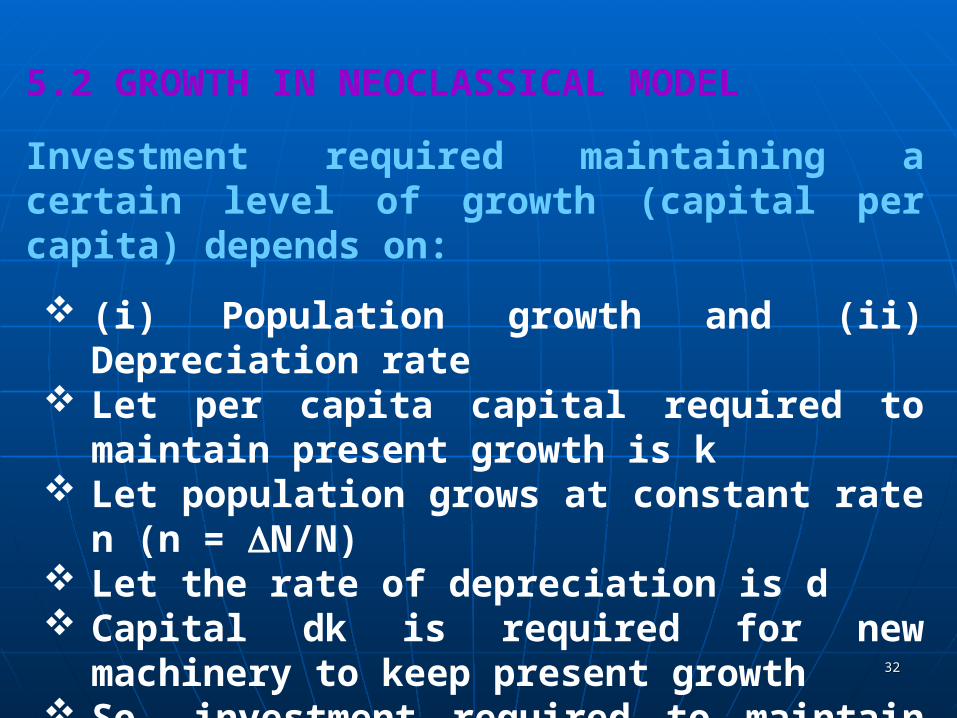
5.2 GROWTH IN NEOCLASSICAL MODEL
Investment required maintaining a certain level of growth (capital per capita) depends on:
(i) Population growth and (ii) Depreciation rate Let per capita capital required to maintain present
growth is k Let population grows at constant rate n (n = N/N) Let the rate of depreciation is d Capital dk is required for new machinery to keep
present growth So, investment required to maintain level of growth
is (n + d) k
3333
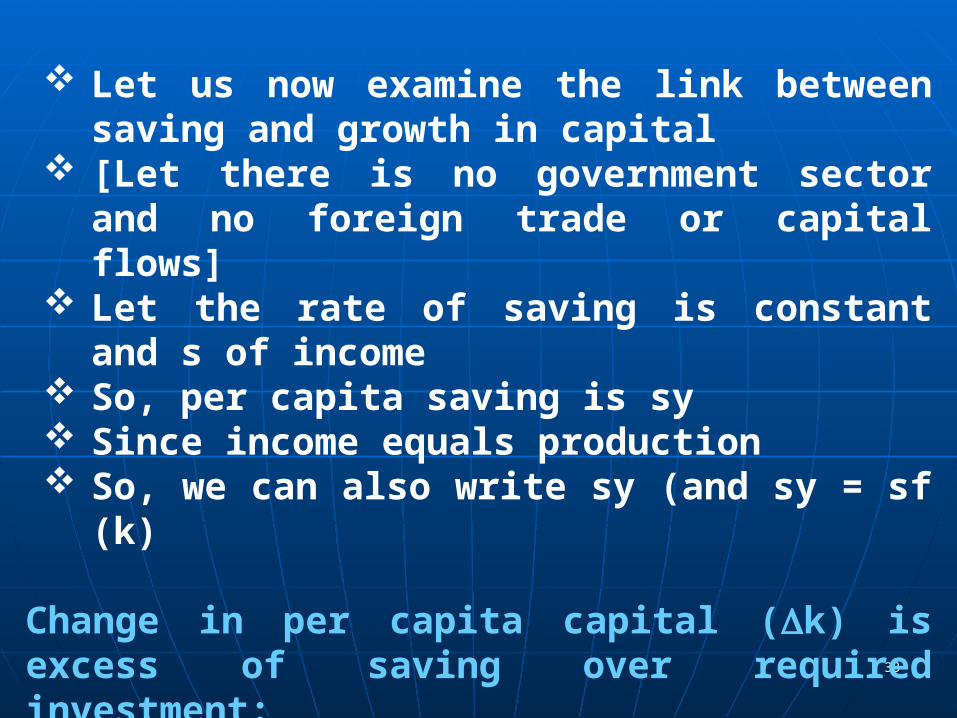
Let us now examine the link between saving and growth in capital
[Let there is no government sector and no foreign trade or capital flows]
Let the rate of saving is constant and s of income So, per capita saving is sy Since income equals production So, we can also write sy (and sy = sf (k)
Change in per capita capital (k) is excess of saving over required investment:
k = sy - (n + d)k (6)
3434
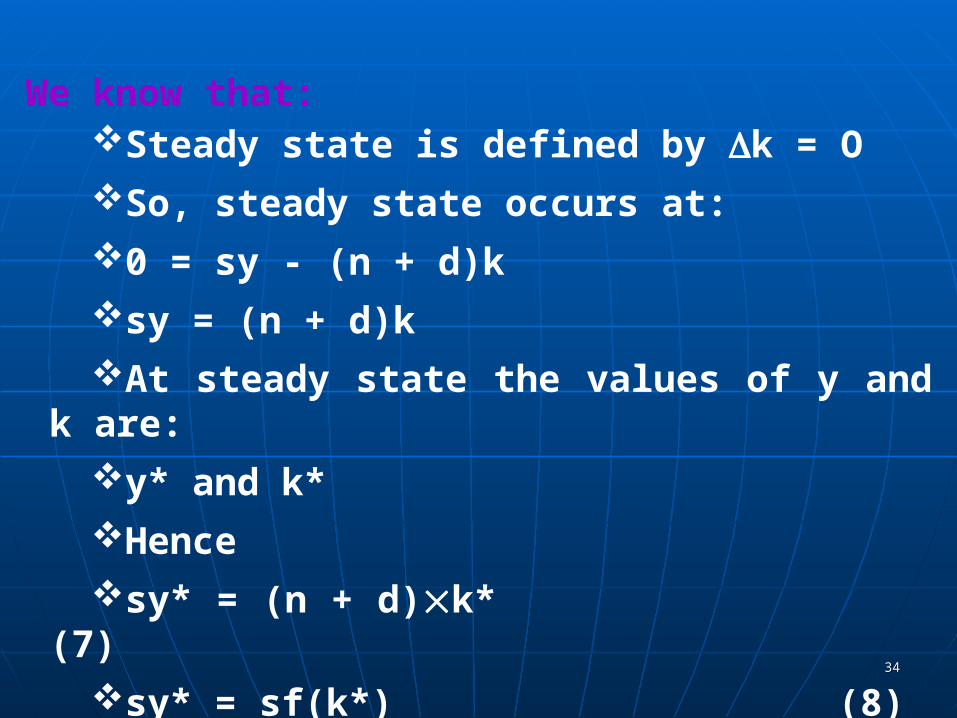
We know that:Steady state is defined by k = O
So, steady state occurs at:
0 = sy - (n + d)k
sy = (n + d)k
At steady state the values of y and k are:
y* and k*
Hence
sy* = (n + d)k* (7)
sy* = sf(k*) (8)
3535
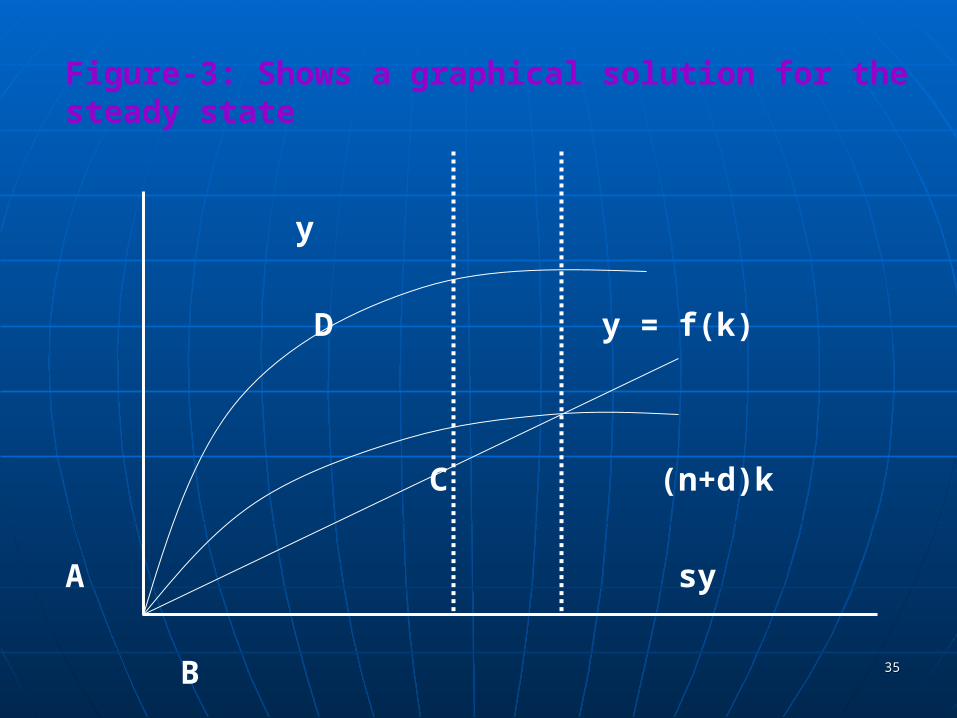
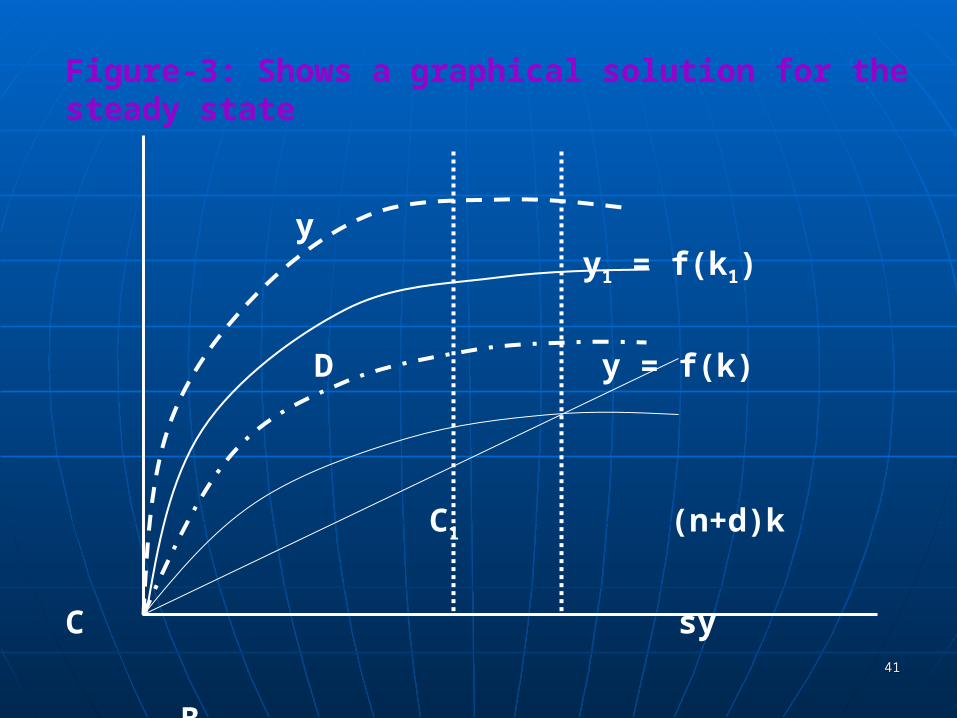
Figure-3: Shows a graphical solution for the steady state
y
D y = f(k)
C (n+d)k
A sy
B
k0 k* k
3636
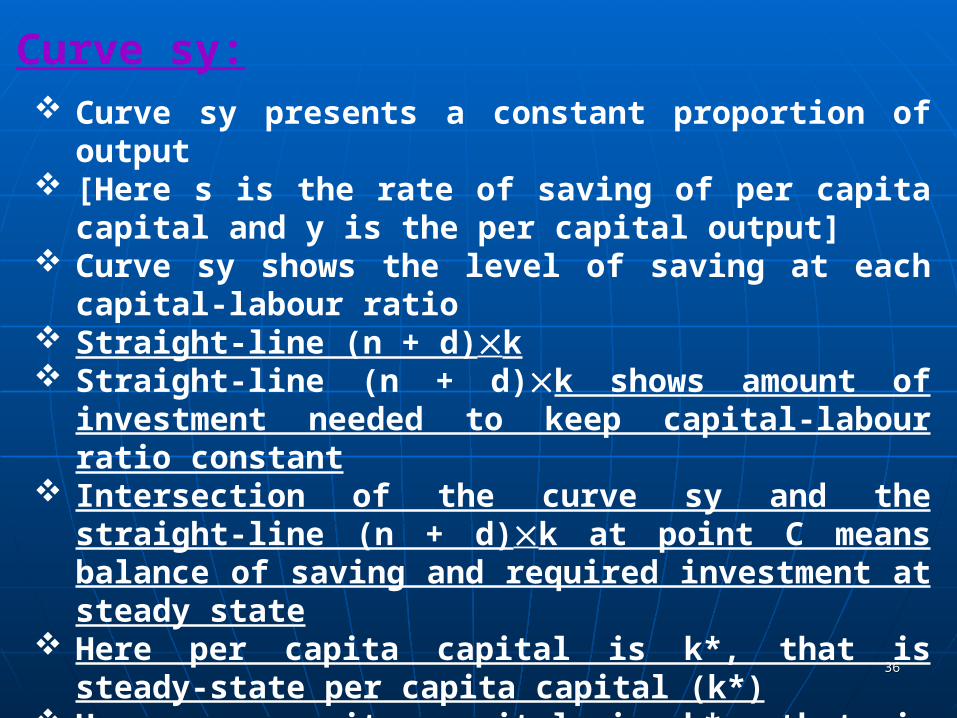
Curve sy: Curve sy presents a constant proportion of output [Here s is the rate of saving of per capita capital and y is the
per capital output] Curve sy shows the level of saving at each capital-labour ratio Straight-line (n + d)k Straight-line (n + d)k shows amount of investment needed to
keep capital-labour ratio constant Intersection of the curve sy and the straight-line (n + d)k at
point C means balance of saving and required investment at steady state
Here per capita capital is k*, that is steady-state per capita capital (k*)
Here per capita capital is k*, that is steady-state saving rate (k*)
Steady-state income (output) is read off the production function at point D
3737
5.3 THE GROWTH PROCESS
Let us study the adjustment process that leads the economy:
From a initial capital-labour ratio to steady state (Figure-3)
Critical element in this transition process is:
Rate of saving (s),
Investment (k),
Rate of depreciation (d), and
Population growth (n)
3838
Key to the neoclassical growth model is the saving, sy When sy exceeds the investment requirement (to
maintain running growth), k increases [When sy exceeds (n+d)k, k increases] So, over time the economy grows (Figure-3)
Let economy the starts at capital-output ratio ko
(Figure -3)
At capital-output ratio ko investment at B is needed to
maintain current growth rate However, more is saved at point A,
So, capital-output ratio increases and greater than ko
Hence, the economy growths and shifts left
3939
End of the Growth
Adjustment process comes to a halt at point C Here the capital-labour ratio, k*, match the
investment requirement Beyond this point capital-labour ratio cannot be
more increased by saving And per capita output cannot also be increased more At this point so is saved as the growth rate demand If population increases, investment increases, but per
capita capital labour ratio remain constant At steady state, both k and y are constant At steady state growth rate is not affected by the
savings rate It is one of key results of neoclassical growth theory
4040
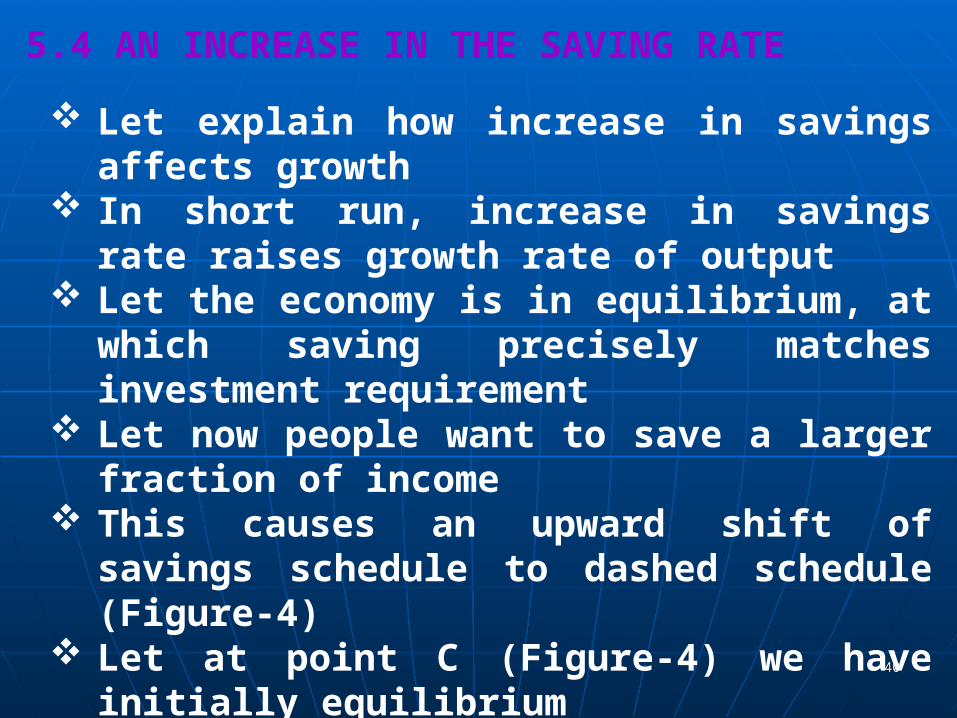
5.4 AN INCREASE IN THE SAVING RATE
Let explain how increase in savings affects growth In short run, increase in savings rate raises growth
rate of output Let the economy is in equilibrium, at which saving
precisely matches investment requirement Let now people want to save a larger fraction of
income This causes an upward shift of savings schedule to
dashed schedule (Figure-4) Let at point C (Figure-4) we have initially
equilibrium Let now more is saved than is required to maintain
capital per head constant
4141
Figure-3: Shows a graphical solution for the steady state
y y1 = f(k1)
D y = f(k)
C1 (n+d)k
C sy
B
k0 k* k
4242
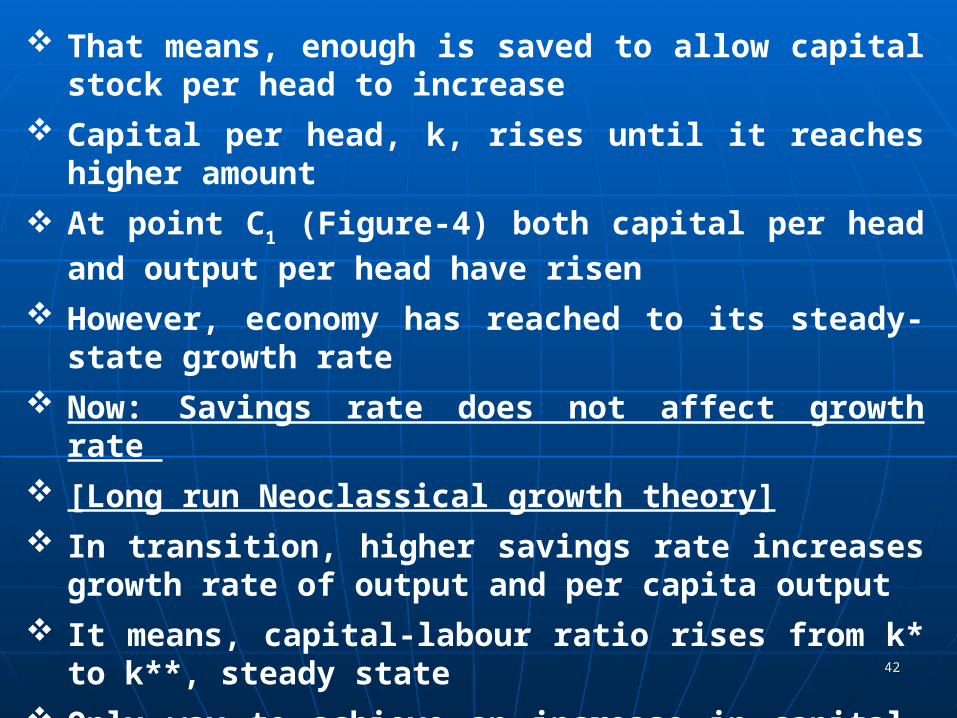
That means, enough is saved to allow capital stock per head to increase
Capital per head, k, rises until it reaches higher amount
At point C1 (Figure-4) both capital per head and output per
head have risen
However, economy has reached to its steady-state growth rate
Now: Savings rate does not affect growth rate
[Long run Neoclassical growth theory]
In transition, higher savings rate increases growth rate of output and per capita output
It means, capital-labour ratio rises from k* to k**, steady state
Only way to achieve an increase in capital-labour ratio is:
Capital stock has to grow faster than the labour force and depreciation