GROWING WATER RISK RESILIENCE
44
GROWING WATER RISK RESILIENCE: AN INVESTOR GUIDE ON AGRICULTURAL SUPPLY CHAINS An investor initiative in partnership with UNEP Finance Initiative and UN Global Compact In partnership with WWF
Transcript of GROWING WATER RISK RESILIENCE
GROWING WATER RISK RESILIENCE:
AN INVESTOR GUIDE ON AGRICULTURAL SUPPLY CHAINS
An investor initiative in partnership with UNEP Finance Initiative and UN Global Compact
In partnership with WWF
2
PREAMBLE TO THE PRINCIPLESAs institutional investors, we have a duty to act in the best long-term interests of our beneficiaries. In this fiduciary role, we believe that environmental, social, and governance (ESG) issues can affect the performance of investment portfolios (to varying degrees across companies, sectors, regions, asset classes and through time). We also recognise that applying these Principles may better align investors with broader objectives of society. Therefore, where consistent with our fiduciary responsibilities, we commit to the following:
THE SIX PRINCIPLES
We will incorporate ESG issues into investment analysis and decision-making processes.1We will be active owners and incorporate ESG issues into our ownership policies and practices.2We will seek appropriate disclosure on ESG issues by the entities in which we invest.3We will promote acceptance and implementation of the Principles within the investment industry.4We will work together to enhance our effectiveness in implementing the Principles.5We will each report on our activities and progress towards implementing the Principles.6
The information contained in this report is meant for the purposes of information only and is not intended to be investment, legal, tax or other advice, nor is it intended to be relied upon in making an investment or other decision. This report is provided with the understanding that the authors and publishers are not providing advice on legal, economic, investment or other professional issues and services. PRI Association is not responsible for the content of websites and information resources that may be referenced in the report. The access provided to these sites or the provision of such information resources does not constitute an endorsement by PRI Association of the information contained therein. Unless expressly stated otherwise, the opinions, recommendations, findings, interpretations and conclusions expressed in this report are those of the various contributors to the report and do not necessarily represent the views of PRI Association or the signatories to the Principles for Responsible Investment. The inclusion of company examples does not in any way constitute an endorsement of these organisations by PRI Association or the signatories to the Principles for Responsible Investment. While we have endeavoured to ensure that the information contained in this report has been obtained from reliable and up-to-date sources, the changing nature of statistics, laws, rules and regulations may result in delays, omissions or inaccuracies in information contained in this report. PRI Association is not responsible for any errors or omissions, or for any decision made or action taken based on information contained in this report or for any loss or damage arising from or caused by such decision or action. All information in this report is provided “as-is”, with no guarantee of completeness, accuracy, timeliness or of the results obtained from the use of this information, and without warranty of any kind, expressed or implied.
PRI DISCLAIMER
PRI's MISSIONWe believe that an economically efficient, sustainable global financial system is a necessity for long-term value creation. Such a system will reward long-term, responsible investment and benefit the environment and society as a whole.
The PRI will work to achieve this sustainable global financial system by encouraging adoption of the Principles and collaboration on their implementation; by fostering good governance, integrity and accountability; and by addressing obstacles to a sustainable financial system that lie within market practices, structures and regulation.
GROWING WATER RISK RESILIENCE | 2018
3
The PRI would like to thank the following members of the PRI Water Risks Engagement Group who contributed to this report:
■ Andrew Mason, Aberdeen Standard Investments ■ Sophie Rahm, Aberdeen Standard Investments ■ Kristel Verhoef, ACTIAM ■ Emma Lupton, BMO Global Asset Management ■ Constantina Bichta, Boston Common Asset
Management ■ Marcela Pinilla, Christian Brothers Investment Services ■ Emma Berntman, Hermes Investment Management ■ George Birch, Janus Henderson ■ David Sheasby, Martin Currie ■ Magdelena Kettis, Nordea ■ Pensions Caixa 30 FP ■ Piet Klop, PGGM ■ Peter van der Werf, Robeco ■ Carly Greenberg, Walden Asset Management
We would also like to thank:
■ Siobhan Collins, Ceres ■ Louise Dudley, Hermes Investment Management ■ Tim Goodman, Hermes EOS ■ Nadira Narine, Interfaith Centre on Corporate
Responsibility ■ Sakis Kotsantonis and Thomas Cobti, KKS Advisors ■ Jeff Marsh, MFS Investment Management ■ Rob Wilson, MFS Investment Management ■ Mai-Lan Ha, Pacific Institute and CEO Water Mandate ■ Tien Shiao, Pacific Institute and CEO Water Mandate ■ Cora Kammeyer, Pacific Institute and CEO Water
Mandate ■ Mary Beth Gallagher, Tri-State Coalition for Responsible
Investment
ACKNOWLEDGEMENTS
At WWF, we want a world with a future where people and wildlife can thrive. We’re finding ways to help transform the future for the world’s wildlife, rivers, forests and seas in areas we regard as particular priorities. We’re pushing for the reduction in carbon emissions needed to avoid catastrophic climate change. And we’re pressing for measures to help people live sustainably, within the means of our one amazing planet. We’ve been working for many years in many parts of the world to improve the way rivers, lakes, wetlands and aquifers are managed. Ensuring water security for people and nature remains one of our key priorities.
4
CONTENTS
EXECUTIVE SUMMARY
INTRODUCTION
WHAT IS AGRICULTURAL SUPPLY CHAIN WATER RISK?
AN ENGAGEMENT FRAMEWORK FOR INVESTORS
FOSTER WATER AWARENESS – DEVELOPING KNOWLEDGE OF IMPACTS AND WATER RISKS
PROMOTE INTERNAL AND SUPPLY CHAIN ACTION
ENCOURAGE COLLECTIVE ACTION
INFLUENCE GOVERNANCE OF WATER
CHALLENGES FOR ENGAGEMENT
HOW DO INVESTORS USE WATER RISK DATA?
RECOMMENDATIONS FOR FUTURE ENGAGEMENT
APPENDIX: RESULTS OF THE PRI-COORDINATED COLLABORATIVE ENGAGEMENT ON WATER RISKS
5
6
7
14
15
18
21
23
25
27
40
41
GROWING WATER RISK RESILIENCE | 2018
5
EXECUTIVE SUMMARY
Global investor portfolios are increasingly exposed to water-related risk. Companies with direct operations and supply chains that are dependent on agriculture, the world’s largest user of water, are exposed to water risks. Those companies that appropriately mitigate these risks and demonstrate good water stewardship characteristics will create value for their shareholders.
However, it is difficult to obtain an accurate and robust dataset on which companies are most exposed through their supply chains and are reliant on crops that are the most water-intensive and grown in high water risk basins. Many companies do not have full traceability of their own supply chains and water risk exposure is difficult to gauge for companies with multiple tiers and multiple raw materials to consider, as this level of granular data is not available. Data on how a site responds to water risk is also not readily available. Best practice involves first determining which commodities are most material to a company and then assessing water risk and water stewardship response using a geographically weighted average of production. Enhanced input data means that companies can generate better water risk assessments.
Investors expect companies to identify and disclose agricultural supply chain water risk; integrate water risk into governance oversight and business strategy; implement actions to mitigate and minimise the risks; engage with stakeholders; and monitor and publicly report on progress, including against time-sensitive goals and targets.
Taking the lessons learnt from a PRI-coordinated engagement which saw 84% of 32 companies benchmarked to improve their disclosure of managing water risks in agricultural supply chains in 2017, this guide outlines why and how investors engage on agricultural supply chain water risk. The engagement framework is structured around four categories:
■ Foster water awareness – developing knowledge of impact and risk
■ Promote internal and supply chain action ■ Encourage collective action ■ Influence governance of water
It provides indicators that investors can use to assess companies as well as tried and tested questions to encourage food, beverage and apparel companies to mitigate water risks in agricultural supply chains. Examples of good practice are also provided.
Three challenges that investors have encountered through engagement on the topic have been identified:
1. Making the internal business case for action2. Supply chain traceability3. Company’s sphere of control
Solutions for overcoming the challenges and having effective engagement are suggested.
The complex and localised nature of water and the mix of qualitative and quantitative information available makes it difficult for investors to integrate water risk data into their company analyses. Some of the techniques that investors are using to integrate water data into listed equity analysis are outlined from page 27 and are illustrated with case studies.
Finally, to encourage further company improvement, the guide recommends future investor engagement in the following areas:
■ focus intensive engagement on laggard companies to take their performance up to the level of their leading peers;
■ encourage all companies to take collective action and a catchment-based approach; and
■ continue to encourage all companies to improve disclosure on water risks in agricultural supply chains.
6
INTRODUCTION
Global investor portfolios are increasingly exposed to water-related risk. The World Economic Forum1 highlights water as a top global risk with associated climate, weather, economic, social, competition and infrastructure impacts. Investors should expect water risk to intensify as the impacts of climate change become more prominent2 and demand grows for freshwater, driven by population and income growth3. The result is higher demand for food, energy and water, all of which need stable water supplies. Competition for water will increase in the many areas already facing water scarcity.
The sixth of the 17 Sustainable Development Goals (SDGs) addresses water and access to water, which is a human right. The Financial Stability Board’s Task Force on Climate-related Financial Disclosures (FSB TCFD) has also issued recommendations for financial companies to disclose climate-related risk exposure, including exposure to water stress. Financial institutions will be required to disclose and mitigate climate-related risks in the coming years – many of which are water-related4.
Companies with direct operations and supply chains that are dependent on agriculture, the world’s largest user of water5, are exposed to water risks. Those companies that appropriately mitigate these risks and demonstrate good water stewardship characteristics will create value for their shareholders.
Based on lessons learned from a two-year PRI-coordinated collaborative engagement6, and building on expert input from institutional investors and WWF, this document:
■ outlines investor exposure to water risk in agricultural supply chains;
■ discusses why investors should engage on the topic and some of the challenges that they may face during the process;
■ provides a framework for investors to engage with companies on managing water risk in agricultural supply chains;
■ suggests engagement questions to help investors understand and mitigate water risk in agricultural supply chains; and
■ highlights how some investors are integrating water data into their financial analysis.
1 World Economic Forum. (2017) The Global Risks Report 2017. [Accessed February 2018]. 2 For further details, see Future Climate Changes Risks and Impacts in IPCC. (2014) Climate Change 2014: Synthesis Report. Contribution of Working Groups I, II and III to the Fifth
Assessment Report of the Intergovernmental Panel on Climate Change [Core Writing Team, R.K. Pachauri and L.A. Meyer (eds.)]. IPCC, Geneva, Switzerland, 151 pp.3 Kundzewicz, Z. W., Mata L. J., Arnell N. W., Döll P., Jimenez B., Miller K., Oki T., Şen Z., and Shiklomanov I. (2008) The implications of projected climate change for freshwater resources
and their management. Hydrological Sciences Journal. 53(1), 3–10.4 France and Sweden have publicly endorsed the TCFD recommendations, while the DNB, the Dutch financial regulator, has announced that it will demand disclosure and risk mitigation
by Financial Institutions in the future. See DNB. (2017) Waterproof? An exploration of climate-related risks for the Dutch financial sector.5 OECD. (2017) Water Risk Hotspots for Agriculture. OECD Publishing, Paris.6 See Appendix for more information.
GROWING WATER RISK RESILIENCE | 2018
7
WHAT IS AGRICULTURAL SUPPLY CHAIN WATER RISK?
While it is widely recognised that agriculture is the largest global user of water7, supply of and demand for water by basin and crop vary considerably. Companies that rely on a variety of raw material inputs from agricultural commodities such as cotton, wheat and sugar are subject to different water risks depending on local context and crop production practices. Basin water risk is not only linked to how a producer could affect others downstream (impacts) but how reliant they are on others upstream (dependencies).
Water risk comes in several forms. A company can be exposed to physical, regulatory and reputational water risks through its agricultural operations and supply chains, which can manifest in financial impact.
Physical water risks in agricultural supply chains occur when there is insufficient water for growing crops or the quality of the water is too poor for irrigation. Overabundance (including flooding and inundation) can also cause crop failure in some regions. Water scarcity risks can derive from arid conditions (generally or during periods of drought) or supply and demand imbalances.
Regulatory risk can create restrictions (prioritising water for one user over another), unanticipated or arbitrary changes to water allocations or effluent discharge limits. For example, a regulatory decision to develop new irrigation schemes upstream could divert water away or negatively affect the water quality of existing supply chain sourcing areas. Poorly implemented regulation over pollution and poor water quality can generate unforeseen costs and create additional physical and reputational risks. Effective policy and regulatory frameworks are essential for addressing water risks from river basin conditions. In basins where water is managed well, unexpected changes are less likely, as flows and quality are more consistent, predictable and, therefore, less risky.
Reputational water risks and reputational damage occur when companies, including their supply chains, are associated with negative impacts of poor water management on communities or ecosystems. Conversely, companies can gain positive reputational benefits from proactive measures to reduce impacts or contribute to improved local water security. Reputational damage can impact brand value and product sales. It can also result in political pressure and lobbying, which can lead to regulatory risks. For some companies, reputational damage is limited to local communities and political processes. However, reputational damage can extend across countries and create a global backlash for multinational companies with strong brand identities or those operating in contentious sectors.
WATER RISK EXPOSURE IN AGRICULTURE Agriculture withdraws 70% of the world’s freshwater. Research by the PRI, WWF and PwC in 20149 found that the food, beverage and apparel sectors are reliant on agricultural commodity raw materials from regions facing high levels of water stress. Agricultural products, food retail, packaged foods and meats, and soft drink companies were found to be the highest users of water-scarce regions. This prompted investors to be concerned about water dependency and the risks impacting company supply chains. For example, Heineken NV disclosed that 90% of the water used to make its product stems from its agricultural supply chain10. This is a significant physical risk for companies that are dependent on raw commodities from specific regions.
DEFINING WATER RISKAgricultural exposure to water risk can be assessed through different lenses. Investors often refer to water risk in the context of water stress or scarcity only. Before analysing agricultural exposure to water risk, it is important to understand the following terms:
■ Water risk: The possibility of an entity experiencing a water-related challenge (e.g. water scarcity, water stress, flooding, infrastructure decay, drought). The extent of risk is a function of the likelihood of a specific challenge occurring and the severity of the impact created. The severity of impact depends on the intensity of the challenge, as well as the vulnerability of the actor.
■ Water scarcity: The volumetric abundance, or lack thereof, of freshwater resources. Scarcity is a function of the volume of human water consumption relative to the volume of water resources in a given area.
■ Water stress: The ability, or lack thereof, to meet human and ecological demand for freshwater. Water stress is a more inclusive and broader concept than water scarcity. It considers several physical aspects related to water resources including availability, quality and accessibility (i.e. whether people are able to make use of available water supplies), which is often dependent on infrastructure and the affordability of water, among other factors.
Source: CEO Water Mandate (2014)8
7 The FAO AQUASTAT states that agriculture is 70% of all global withdrawals. See FAO. (2016) AQUASTAT. [Accessed February 2018]. 8 The CEO Water Mandate. (2014) Corporate Water Disclosure Guideline.9 PRI. (2014) PRI-coordinated engagement on water risks in agricultural supply chains: Investor guidance document.10 CDP Water 2016 Information Request – Heineken NV.
8
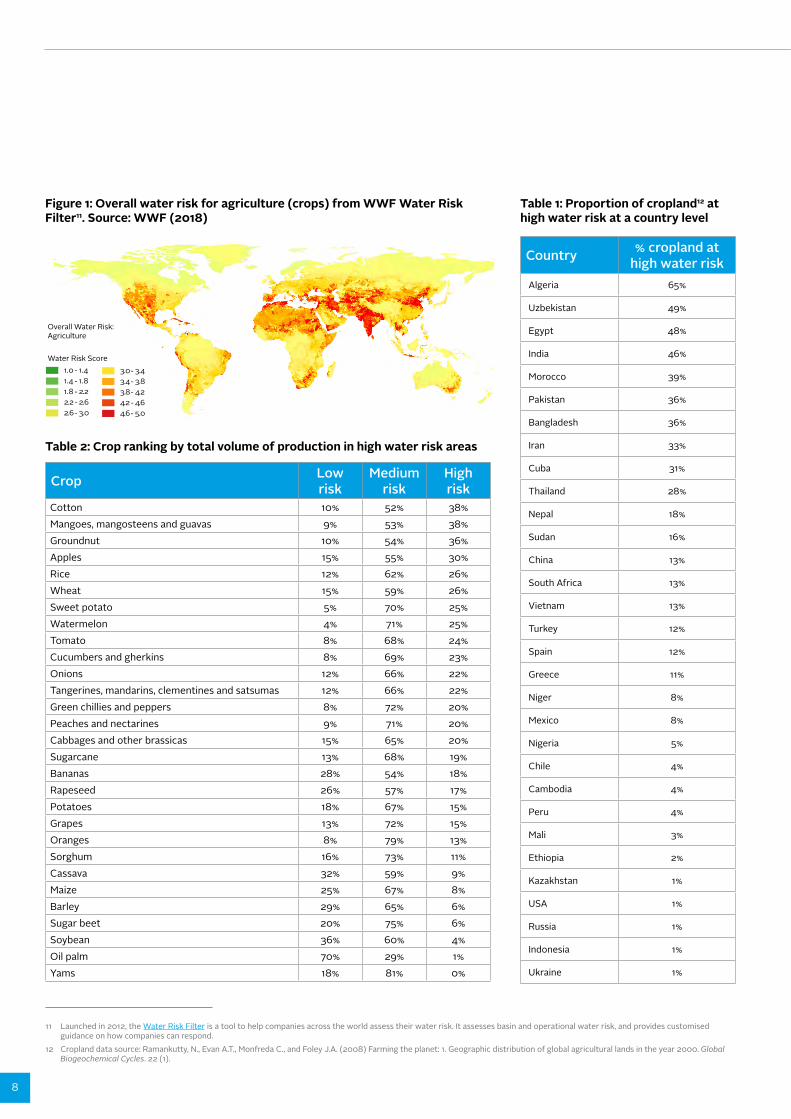
Figure 1: Overall water risk for agriculture (crops) from WWF Water Risk Filter11. Source: WWF (2018)
1.0 - 1.4 1.4 - 1.8 1.8 - 2.2 2.2 - 2.6 2.6 - 3.0
3.0 - 3.4 3.4 - 3.8 3.8 - 4.2 4.2 - 4.6 4.6 - 5.0
Overall Water Risk:Agriculture
Water Risk Score
Country % cropland at high water risk
Algeria 65%
Uzbekistan 49%
Egypt 48%
India 46%
Morocco 39%
Pakistan 36%
Bangladesh 36%
Iran 33%
Cuba 31%
Thailand 28%
Nepal 18%
Sudan 16%
China 13%
South Africa 13%
Vietnam 13%
Turkey 12%
Spain 12%
Greece 11%
Niger 8%
Mexico 8%
Nigeria 5%
Chile 4%
Cambodia 4%
Peru 4%
Mali 3%
Ethiopia 2%
Kazakhstan 1%
USA 1%
Russia 1%
Indonesia 1%
Ukraine 1%
Table 1: Proportion of cropland12 at high water risk at a country level
Crop Low risk
Medium risk
High risk
Cotton 10% 52% 38%Mangoes, mangosteens and guavas 9% 53% 38%Groundnut 10% 54% 36%Apples 15% 55% 30%Rice 12% 62% 26%Wheat 15% 59% 26%Sweet potato 5% 70% 25%Watermelon 4% 71% 25%Tomato 8% 68% 24%Cucumbers and gherkins 8% 69% 23%Onions 12% 66% 22%Tangerines, mandarins, clementines and satsumas 12% 66% 22%Green chillies and peppers 8% 72% 20%Peaches and nectarines 9% 71% 20%Cabbages and other brassicas 15% 65% 20%Sugarcane 13% 68% 19%Bananas 28% 54% 18%Rapeseed 26% 57% 17%Potatoes 18% 67% 15%Grapes 13% 72% 15%Oranges 8% 79% 13%Sorghum 16% 73% 11%Cassava 32% 59% 9%Maize 25% 67% 8%Barley 29% 65% 6%Sugar beet 20% 75% 6%Soybean 36% 60% 4%Oil palm 70% 29% 1%Yams 18% 81% 0%
Table 2: Crop ranking by total volume of production in high water risk areas
11 Launched in 2012, the Water Risk Filter is a tool to help companies across the world assess their water risk. It assesses basin and operational water risk, and provides customised guidance on how companies can respond.
12 Cropland data source: Ramankutty, N., Evan A.T., Monfreda C., and Foley J.A. (2008) Farming the planet: 1. Geographic distribution of global agricultural lands in the year 2000. Global Biogeochemical Cycles. 22 (1).
GROWING WATER RISK RESILIENCE | 2018
9
13 FAO. (2016) AQUASTAT. [Accessed October 2017].14 Using data from the WWF Water Risk Filter.15 Ramankutty, N., A.T. Evan, C. Monfreda, and J.A. Foley (2008), Farming the planet: 1. Geographic distribution of global agricultural lands in the year 2000. Global Biogeochemical Cycles
22, GB1003, doi:10.1029/2007GB002952.16 The assessment framework has been aligned with the Ceres Water Risk Dashboard.17 More information on water footprinting can be found at the Water Footprint Network.18 Mekonnen, M.M. and Hoekstra, A.Y. (2010) The green, blue and grey water footprint of crops and derived crop products. UNESCO-IHE Institute for Water Education. Value of Water
Research Report Series. Report number: 47.19 See Page 26 for more information on supply chain traceability challenges and links for tools that are being developed.
Both irrigated and rainfed agriculture are exposed to water risk. With water stress levels expected to rise globally, pressure will increase on companies that rely on agricultural inputs. As of 2012, irrigated land accounted for 20% of arable land and 40% of all food production13. The other 80% of rainfed cropland that produces 60% of the world’s food could experience rainfall variability – timing, locational shifts and temperature changes. Crop yields may be affected by water stress, flooding or pollution, which could exacerbate non-physical water risks (e.g. increased regulatory water risk). Figure 1 shows how overall water risk for crops varies globally14.
The countries with the most cropland at high water risk are presented in Table 1. The analysis overlays the agricultural risk score within the Water Risk Filter with global cropland extent15. It identifies the proportion of total cropland area that is at high water risk by country. The overall risk score is a combination of weighted physical, regulatory and reputational risk factors to reflect the specific risk in the agriculture sector. On a scale of one to five, low risk is defined as ≤2.33, medium risk is >2.33 and < 3.66 and high risk is ≥ 3.66.
Only countries that cumulatively account for 95% of total global production of crops (in tonnes, source: FAOSTAT) were included in the analysis; countries with almost 0% cropland at high water risk were excluded. The water risk data represents the long-term condition in catchments, with some influence from recent droughts, so does not reflect the extent or severity of current droughts. As it is calculated at a country level, countries with some high water risk areas, but which only account for a near-zero proportion of total cropland, are not represented in the table (e.g. Brazil and Australia).
A comprehensive assessment16 of a company’s agricultural supply chain water risk requires understanding a company’s:
■ Water dependence: Operational and financial risk exposure from company reliance on water resources, including through crop varieties, water use intensity of the crop and the type of water delivery (irrigated versus rainfed).
■ Geographic water security: Where it is grown (i.e., its context – whether it is located in a high water risk basin); and the physical, regulatory and reputational risks that may affect current and future water use.
■ Management response: What mitigation actions have been taken at the farm and basin levels; and what actions have been taken at the corporate level to support supply chain awareness and resilience/capacity building.
Some of the most significant global crops (such as wheat, rice and cotton) with high economic trade value or production volumes are grown in countries exposed to high water risk (see Table 2). The global average of the world’s cropland estimated to be at high water risk is 7%. Therefore, crops with over 7% of production in high water risk areas are disproportionately exposed to water risks. A crop’s water footprint consists of the quantity of water required for producing the commodity and the amount of water required to dilute the pollution produced17 - but the broader context of water availability and quality in the basin in which it is grown must also be considered. It is important to note that the water footprint and water intensity for the same crop will differ depending on where and how it is grown, as will yields18.
It is difficult to obtain an accurate and robust dataset on which companies are most exposed through their supply chains and are reliant on crops that are the most water-intensive and grown in high water risk basins. Many companies do not have full traceability of their own supply chains and water risk exposure is difficult to gauge for companies with multiple tiers and multiple raw materials to consider, as this level of granular data is not available19. Data on how a site responds to water risk is also not readily available. Best practice involves first determining which commodities are most material to a company and then assessing water risk and water stewardship response using a geographically weighted average of production. Enhanced input data means that companies can generate better water risk assessments.
10
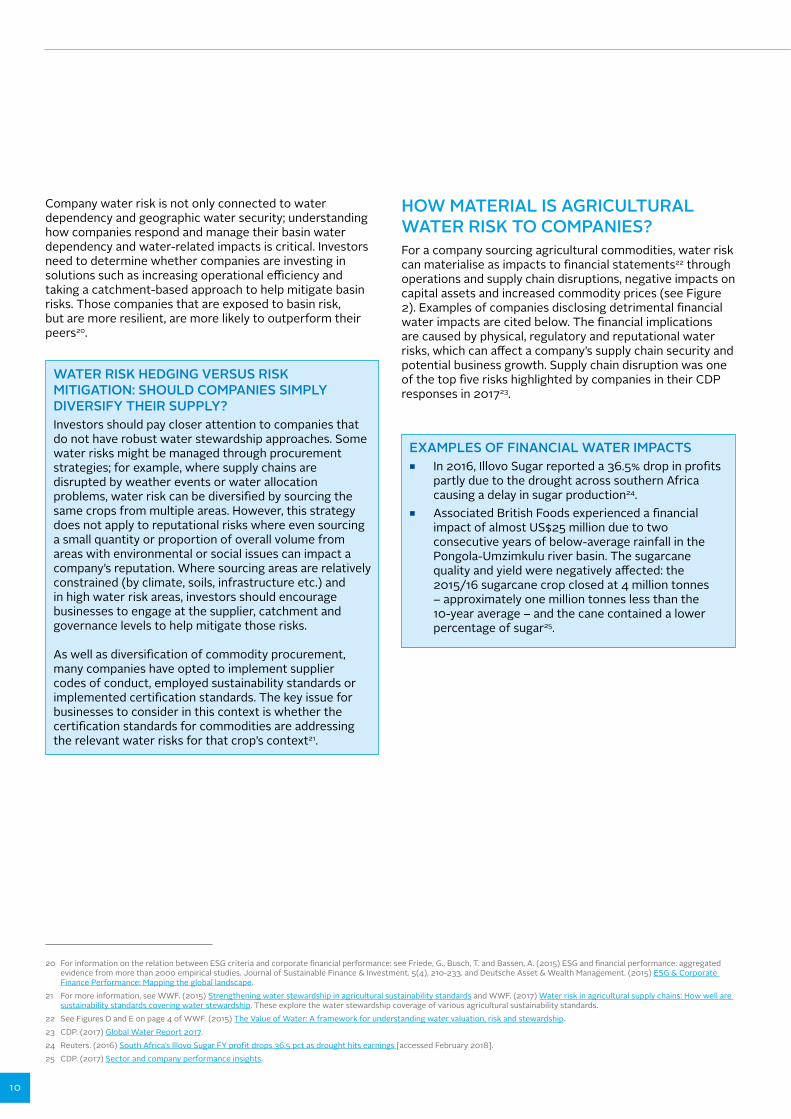
HOW MATERIAL IS AGRICULTURAL WATER RISK TO COMPANIES?For a company sourcing agricultural commodities, water risk can materialise as impacts to financial statements22 through operations and supply chain disruptions, negative impacts on capital assets and increased commodity prices (see Figure 2). Examples of companies disclosing detrimental financial water impacts are cited below. The financial implications are caused by physical, regulatory and reputational water risks, which can affect a company’s supply chain security and potential business growth. Supply chain disruption was one of the top five risks highlighted by companies in their CDP responses in 201723.
WATER RISK HEDGING VERSUS RISK MITIGATION: SHOULD COMPANIES SIMPLY DIVERSIFY THEIR SUPPLY? Investors should pay closer attention to companies that do not have robust water stewardship approaches. Some water risks might be managed through procurement strategies; for example, where supply chains are disrupted by weather events or water allocation problems, water risk can be diversified by sourcing the same crops from multiple areas. However, this strategy does not apply to reputational risks where even sourcing a small quantity or proportion of overall volume from areas with environmental or social issues can impact a company’s reputation. Where sourcing areas are relatively constrained (by climate, soils, infrastructure etc.) and in high water risk areas, investors should encourage businesses to engage at the supplier, catchment and governance levels to help mitigate those risks.
As well as diversification of commodity procurement, many companies have opted to implement supplier codes of conduct, employed sustainability standards or implemented certification standards. The key issue for businesses to consider in this context is whether the certification standards for commodities are addressing the relevant water risks for that crop’s context21.
Company water risk is not only connected to water dependency and geographic water security; understanding how companies respond and manage their basin water dependency and water-related impacts is critical. Investors need to determine whether companies are investing in solutions such as increasing operational efficiency and taking a catchment-based approach to help mitigate basin risks. Those companies that are exposed to basin risk, but are more resilient, are more likely to outperform their peers20.
EXAMPLES OF FINANCIAL WATER IMPACTS ■ In 2016, Illovo Sugar reported a 36.5% drop in profits
partly due to the drought across southern Africa causing a delay in sugar production24.
■ Associated British Foods experienced a financial impact of almost US$25 million due to two consecutive years of below-average rainfall in the Pongola-Umzimkulu river basin. The sugarcane quality and yield were negatively affected: the 2015/16 sugarcane crop closed at 4 million tonnes – approximately one million tonnes less than the 10-year average – and the cane contained a lower percentage of sugar25.
20 For information on the relation between ESG criteria and corporate financial performance: see Friede, G., Busch, T. and Bassen, A. (2015) ESG and financial performance: aggregated evidence from more than 2000 empirical studies. Journal of Sustainable Finance & Investment. 5(4), 210-233. and Deutsche Asset & Wealth Management. (2015) ESG & Corporate Finance Performance: Mapping the global landscape.
21 For more information, see WWF. (2015) Strengthening water stewardship in agricultural sustainability standards and WWF. (2017) Water risk in agricultural supply chains: How well are sustainability standards covering water stewardship. These explore the water stewardship coverage of various agricultural sustainability standards.
22 See Figures D and E on page 4 of WWF. (2015) The Value of Water: A framework for understanding water valuation, risk and stewardship.23 CDP. (2017) Global Water Report 2017.24 Reuters. (2016) South Africa’s Illovo Sugar FY profit drops 36.5 pct as drought hits earnings [accessed February 2018].25 CDP. (2017) Sector and company performance insights.
GROWING WATER RISK RESILIENCE | 2018
11
Corporate water stewardship
Site water stewardship
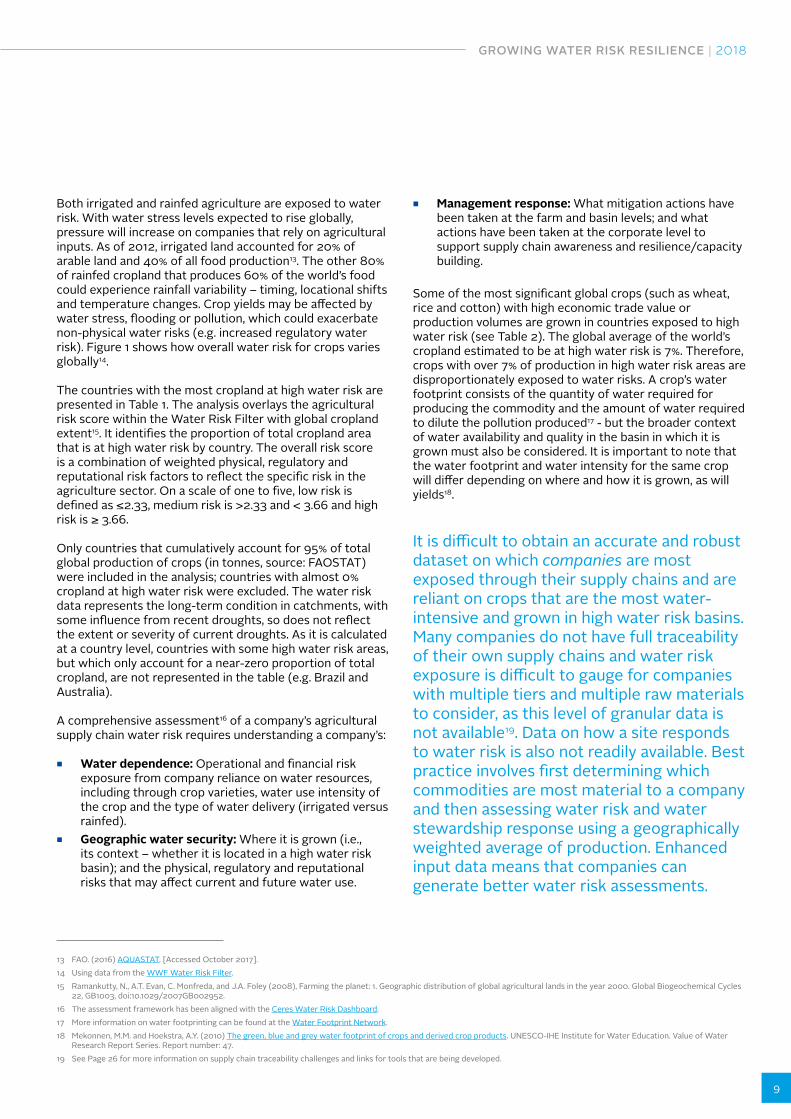
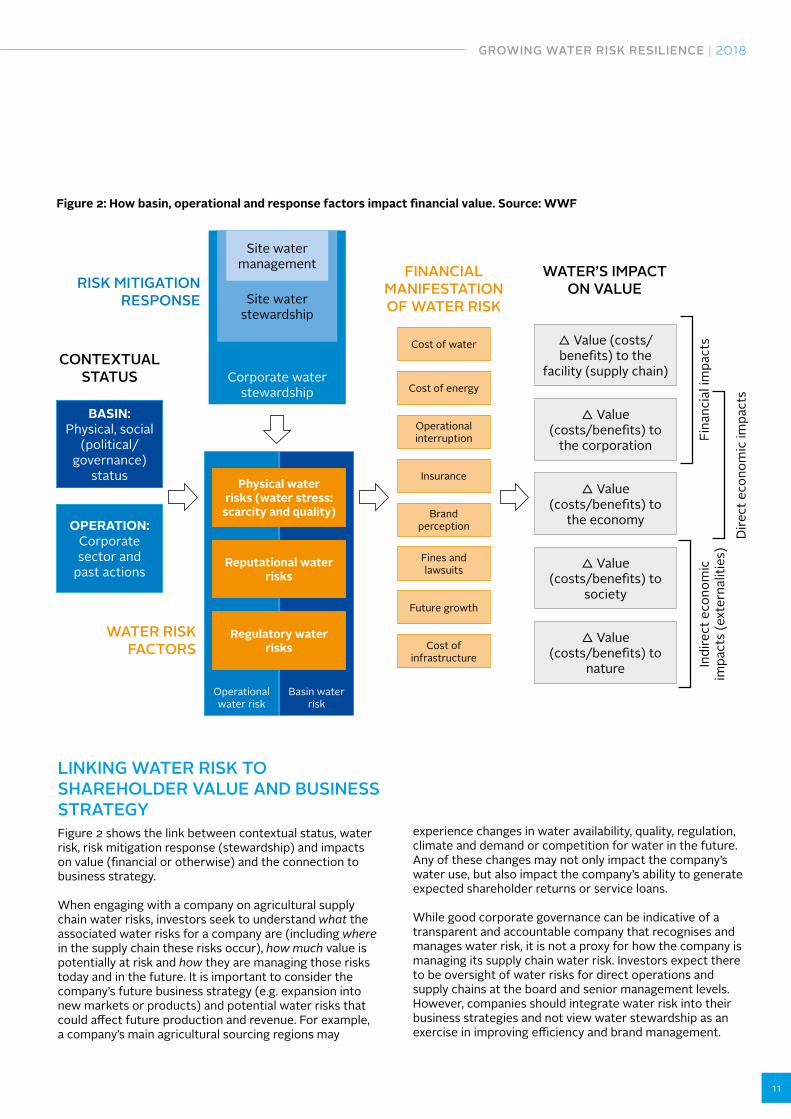
Figure 2: How basin, operational and response factors impact financial value. Source: WWF
LINKING WATER RISK TO SHAREHOLDER VALUE AND BUSINESS STRATEGYFigure 2 shows the link between contextual status, water risk, risk mitigation response (stewardship) and impacts on value (financial or otherwise) and the connection to business strategy.
When engaging with a company on agricultural supply chain water risks, investors seek to understand what the associated water risks for a company are (including where in the supply chain these risks occur), how much value is potentially at risk and how they are managing those risks today and in the future. It is important to consider the company’s future business strategy (e.g. expansion into new markets or products) and potential water risks that could affect future production and revenue. For example, a company’s main agricultural sourcing regions may
experience changes in water availability, quality, regulation, climate and demand or competition for water in the future. Any of these changes may not only impact the company’s water use, but also impact the company’s ability to generate expected shareholder returns or service loans.
While good corporate governance can be indicative of a transparent and accountable company that recognises and manages water risk, it is not a proxy for how the company is managing its supply chain water risk. Investors expect there to be oversight of water risks for direct operations and supply chains at the board and senior management levels. However, companies should integrate water risk into their business strategies and not view water stewardship as an exercise in improving efficiency and brand management.
BASIN: Physical, social
(political/governance)
status
OPERATION: Corporate sector and
past actions
Site water management
Operational water risk
Basin water risk
Cost of water
Cost of energy
Operational interruption
Insurance
Brand perception
Fines and lawsuits
Future growth
Cost of infrastructure
∆ Value (costs/benefits) to the
facility (supply chain)
∆ Value (costs/benefits) to
the corporation
∆ Value (costs/benefits) to
the economy
∆ Value (costs/benefits) to
society
∆ Value (costs/benefits) to
nature
Regulatory water risks
Physical water risks (water stress:
scarcity and quality)
Reputational water risks
Fina
ncia
l im
pact
s
Dire
ct e
cono
mic
impa
cts
Indi
rect
eco
nom
ic
impa
cts
(ext
erna
litie
s)
RISK MITIGATION RESPONSE
WATER RISK FACTORS
FINANCIAL MANIFESTATION OF WATER RISK
WATER’S IMPACT ON VALUE
CONTEXTUAL STATUS
12
WHY SHOULD INVESTORS ENGAGE ON WATER RISK?Water is a material risk to companies and reasons for why investors should care are articulated in the PRI’s investor guidance on water risks in agricultural supply chains26. The topic is material to all investors with holdings in companies in the food, beverage, apparel and retail sectors due to their heavy reliance on water through direct and indirect operations27. Investors holding these companies directly (for example, through public and private equity or bonds) are exposed to water risk.
However, investors with long-term and diversified portfolios are also exposed as universal owners28. This means their portfolios are exposed to the wider environmental externalities caused by other companies in the same or different sectors. Through this broader market exposure, investors may be concerned about a company operating in a specific basin with poor water management practices. This may have an impact on other businesses operating in the region, which are directly or indirectly linked to investor portfolios.
Recent academic research based on collaborative engagements coordinated by the PRI shows that successful engagement improves company profitability and that unsuccessful engagements experience no change in return on assets or in shareholding29. Structured engagements with companies can help reduce risks and create opportunities for those directly held by investors through encouragement to improve corporate water management and disclosure of long-term water risk in agricultural supply chains. Engagement can also reduce risks at the basin level, a positive outcome for universal owners exposed to that region.
PRI-COORDINATED COLLABORATIVE ENGAGEMENT The PRI-coordinated collaborative engagement on water risks in agricultural supply chains was launched in 2014, with 41 global investors representing US$5.7 trillion in AUM. The investors engaged with 32 companies in the food, beverage and apparel sectors on their water risk management and disclosure of agricultural supply chains. This included three agricultural product companies, 21 food and beverage companies30, four apparel and luxury goods companies, and four retailers.
A public disclosure benchmark was conducted in 2015 and 2017 using 25 indicators developed by the PRI Water Risk Advisory Committee. The indicators reflected a company’s awareness and acknowledgement of water risk in agricultural supply chains, assessment of impact, policies and strategies, and disclosure. The results showed that31:
■ 84% of the 32 companies benchmarked improved their disclosure of water risks in agricultural supply chains in 2017;
■ the company that made the most progress boosted its disclosure score by 44%32; and
■ Retailers were the biggest laggards in terms of disclosure, with one company seeing its score drop by 71%.
For more examples of investor engagement, see case studies 4A and 4B on page 38-39.
26 PRI. (2014) PRI-coordinated engagement on water risks in agricultural supply chains: investor guidance document.27 See SASB’s Materiality Map.28 UNEP FI and PRI. (2011) Universal Ownership: Why environmental externalities matter to institutional investors.29 More information can be found in RI Quarterly – Local leads, backed by global scale: the drivers of successful engagement.30 Includes two companies that are food, beverage, textiles and luxury goods.31 See Appendix for further details.32 This company scored a total of 3 points in 2015 and improved its disclosure score to 14 in 2017.
GROWING WATER RISK RESILIENCE | 2018
13
OTHER RELEVANT INVESTOR INITIATIVES AND RESOURCES
■ CDP Global Water Report33 is an annual analysis of the CDP water response data from large publicly-listed companies. It presents key trends and company actions to address water security.
■ Ceres Investor Water Toolkit34 is a resource to evaluate and act on water risks in investment portfolios. It includes links to resources, databases, case studies and other tools for all investors to use, from pension funds to endowments and asset managers.
■ Ceres: Feeding Ourselves Thirsty35 is a report that benchmarks over 40 companies in the packaged food, beverage, agricultural products and meat sectors on how they are responding to water risks. The first benchmark was conducted in 2015 and progress was assessed again in 2017. Four categories of water management were used to assess the companies. This report has also been used by a Ceres-WWF led initiative called the AgWater Challenge36 that has sought to recognise agricultural supply chain water commitments.
■ Ceres Aqua Gauge37 is a tool for investors to score a company’s water management activities against leading practice for direct operations and supply chains. It allows investors to interpret and evaluate the information provided by companies across different sectors on their management of water issues.
■ Interfaith Center on Corporate Responsibility (ICCR)38 is a faith and values-driven investor membership organisation. It has a water engagement program with high-impact sectors including food and agri-business, energy production, automotive, mining, apparel and chemical companies.
■ GES Water Stewardship Engagement: Benchmarking Report39 is an investor engagement and associated research report covering the food, beverage, mining and apparel sectors. The benchmark indicators cover direct operations and supply chain.
33 CDP. (2017) CDP Global Water Report 2017.34 Ceres Investor Water Toolkit. 35 Ceres. (2017) Feeding Ourselves Thirsty. [Accessed February 2018].36 AgWater Challenge.37 Ceres. (2011) Ceres Aqua Gauge. [Accessed February 2018]. 38 ICCR’s membership consists of faith-based institutions, socially responsible asset management companies, unions, pension funds and colleges and universities. More information on
their water stewardship program can be found here.39 GES. (2017) Water Stewardship Engagement – Benchmarking report.
14
AN ENGAGEMENT FRAMEWORK FOR INVESTORS
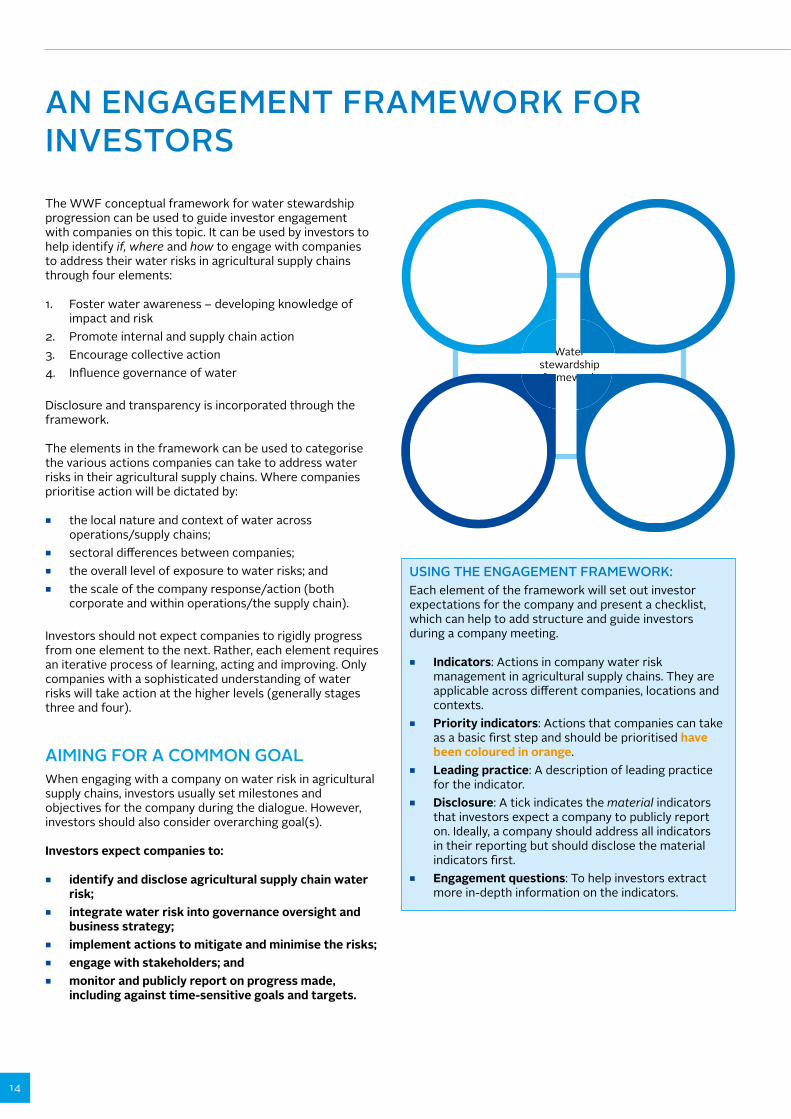
The WWF conceptual framework for water stewardship progression can be used to guide investor engagement with companies on this topic. It can be used by investors to help identify if, where and how to engage with companies to address their water risks in agricultural supply chains through four elements:
1. Foster water awareness – developing knowledge of impact and risk
2. Promote internal and supply chain action3. Encourage collective action4. Influence governance of water
Disclosure and transparency is incorporated through the framework.
The elements in the framework can be used to categorise the various actions companies can take to address water risks in their agricultural supply chains. Where companies prioritise action will be dictated by:
■ the local nature and context of water across operations/supply chains;
■ sectoral differences between companies; ■ the overall level of exposure to water risks; and ■ the scale of the company response/action (both
corporate and within operations/the supply chain). Investors should not expect companies to rigidly progress from one element to the next. Rather, each element requires an iterative process of learning, acting and improving. Only companies with a sophisticated understanding of water risks will take action at the higher levels (generally stages three and four).
AIMING FOR A COMMON GOALWhen engaging with a company on water risk in agricultural supply chains, investors usually set milestones and objectives for the company during the dialogue. However, investors should also consider overarching goal(s).
Investors expect companies to:
■ identify and disclose agricultural supply chain water risk;
■ integrate water risk into governance oversight and business strategy;
■ implement actions to mitigate and minimise the risks; ■ engage with stakeholders; and ■ monitor and publicly report on progress made,
including against time-sensitive goals and targets.
USING THE ENGAGEMENT FRAMEWORK:Each element of the framework will set out investor expectations for the company and present a checklist, which can help to add structure and guide investors during a company meeting.
■ Indicators: Actions in company water risk management in agricultural supply chains. They are applicable across different companies, locations and contexts.
■ Priority indicators: Actions that companies can take as a basic first step and should be prioritised have been coloured in orange.
■ Leading practice: A description of leading practice for the indicator.
■ Disclosure: A tick indicates the material indicators that investors expect a company to publicly report on. Ideally, a company should address all indicators in their reporting but should disclose the material indicators first.
■ Engagement questions: To help investors extract more in-depth information on the indicators.
Waterstewardshipframework
Water awareness – developing knowledge of
impact and risk
Internal and supply chain action
In�uence governance
of water
Collectiveaction
GROWING WATER RISK RESILIENCE | 2018
15
As with each element in the framework, developing an awareness of water issues and, over time, an in-depth understanding of the complex and unique nature of water issues facing the company is an ongoing and iterative process. The aim of this stage is to develop awareness of: the water context of operational and supplier locations and input or revenue dependencies paired with potential water risks; and company impacts and dependencies on freshwater and the implications for its sector. Awareness also encompasses how the company is perceived by others, including basin stakeholders, the media and consumers. Awareness should not be siloed within sustainability teams. It needs to extend to marketing/sales, procurement and finance – from the board to operations.
A company needs to understand its impact on water and how it is impacted by water to develop appropriate responses to risk. For agricultural supply chains, understanding where a company’s footprint is, where suppliers and growers are located and what dependencies they have on water is essential to understanding risk and impact. The initial mapping of key suppliers can be difficult, particularly when working through large commodity traders.
Companies should look beyond their direct operations and at the local contexts of their supply chains to understand water use and impact across the business, such as manufacturing and growing. It is challenging to obtain quantitative data on supply chain water impacts, but qualitative data can be collected by identifying impacts of cotton growing practices on water quality and how they are managed in sourcing areas, for example. Companies should know the geographic locations of their supply chains and conduct a water risk hotspot analysis using a recognised tool such as the WWF Water Risk Filter40.
FOSTER WATER AWARENESS – DEVELOPING KNOWLEDGE OF IMPACTS AND WATER RISKS
Investors expect companies to:
■ have board-level oversight of water risk and integrate water into strategy, environmental policies, business planning activities and investment decision making;
■ understand potential water-related financial impacts, the water context of operations and supply chains and implications for the sector;
■ understand what sector leaders are doing, as well as the external perception of the company and investor expectations;
■ trace supply chains, identifying the location of operations and suppliers;
■ identify high-risk hotspots from stress, scarcity and risk perspectives;
■ understand the impact of operations and supply chain activities on people and the environment;
■ understand current and future risk and opportunities to protect and secure water resources in the future; and
■ publicly report on: agricultural supply chain water risks, the processes involved and factors considered to identify risk; and how the company has performed through company reports and its website or through recognised reporting and disclosure initiatives such as CDP Water and Global Reporting Initiative.
40 Other tools that can be used are: Aqueduct Commodities; FAO Statistics; and Water Footprint Assessment Tool for different commodities.
16
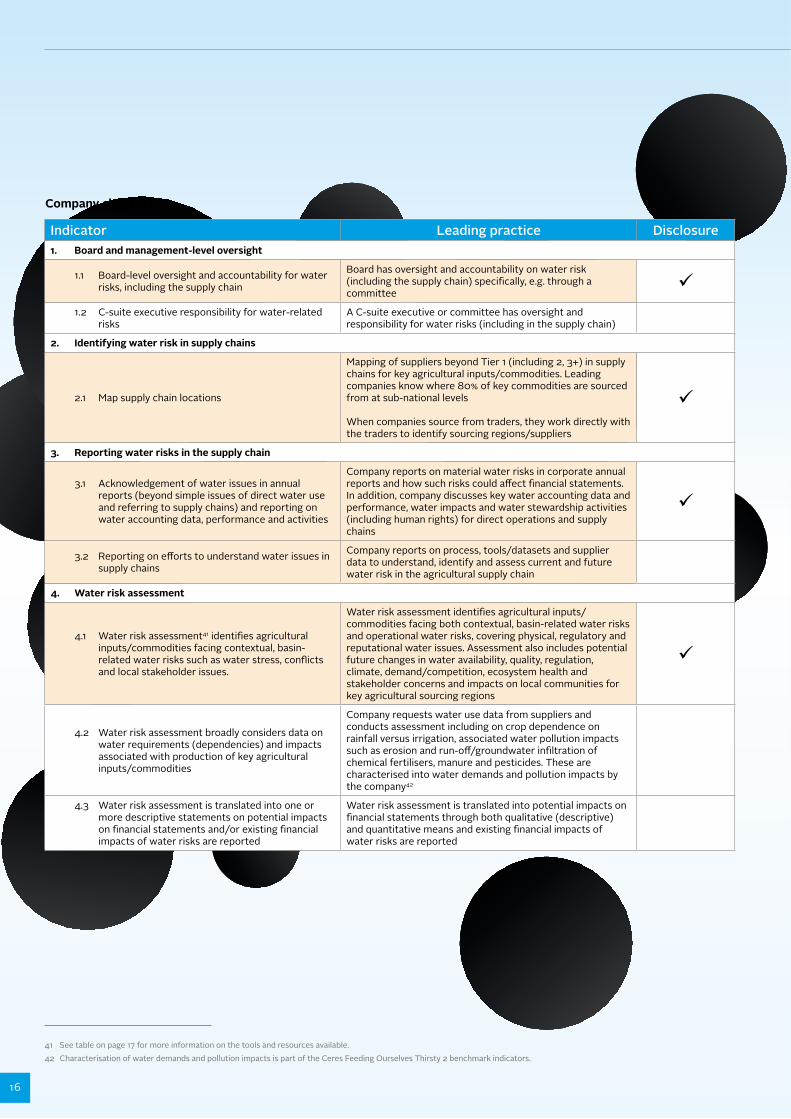
Indicator Leading practice Disclosure 1. Board and management-level oversight
1.1 Board-level oversight and accountability for water risks, including the supply chain
Board has oversight and accountability on water risk (including the supply chain) specifically, e.g. through a committee
ü1.2 C-suite executive responsibility for water-related
risksA C-suite executive or committee has oversight and responsibility for water risks (including in the supply chain)
2. Identifying water risk in supply chains
2.1 Map supply chain locations
Mapping of suppliers beyond Tier 1 (including 2, 3+) in supply chains for key agricultural inputs/commodities. Leading companies know where 80% of key commodities are sourced from at sub-national levels
When companies source from traders, they work directly with the traders to identify sourcing regions/suppliers
ü
3. Reporting water risks in the supply chain
3.1 Acknowledgement of water issues in annual reports (beyond simple issues of direct water use and referring to supply chains) and reporting on water accounting data, performance and activities
Company reports on material water risks in corporate annual reports and how such risks could affect financial statements. In addition, company discusses key water accounting data and performance, water impacts and water stewardship activities (including human rights) for direct operations and supply chains
ü
3.2 Reporting on efforts to understand water issues in supply chains
Company reports on process, tools/datasets and supplier data to understand, identify and assess current and future water risk in the agricultural supply chain
4. Water risk assessment
4.1 Water risk assessment41 identifies agricultural inputs/commodities facing contextual, basin-related water risks such as water stress, conflicts and local stakeholder issues.
Water risk assessment identifies agricultural inputs/commodities facing both contextual, basin-related water risks and operational water risks, covering physical, regulatory and reputational water issues. Assessment also includes potential future changes in water availability, quality, regulation, climate, demand/competition, ecosystem health and stakeholder concerns and impacts on local communities for key agricultural sourcing regions
ü
4.2 Water risk assessment broadly considers data on water requirements (dependencies) and impacts associated with production of key agricultural inputs/commodities
Company requests water use data from suppliers and conducts assessment including on crop dependence on rainfall versus irrigation, associated water pollution impacts such as erosion and run-off/groundwater infiltration of chemical fertilisers, manure and pesticides. These are characterised into water demands and pollution impacts by the company42
4.3 Water risk assessment is translated into one or more descriptive statements on potential impacts on financial statements and/or existing financial impacts of water risks are reported
Water risk assessment is translated into potential impacts on financial statements through both qualitative (descriptive) and quantitative means and existing financial impacts of water risks are reported
Company checklist
41 See table on page 17 for more information on the tools and resources available. 42 Characterisation of water demands and pollution impacts is part of the Ceres Feeding Ourselves Thirsty 2 benchmark indicators.
GROWING WATER RISK RESILIENCE | 2018
17
Good practice example: Nestlé
The Nestlé in Society Board is chaired by the CEO and seeks to implement shared value, environmental sustainability and compliance. The Water Task Force sits under this umbrella and ensures the integration of water stewardship throughout the company and operations. The Board of Directors are regularly briefed on water and water risk issues via the Nestlé in Society Board43.
The Nestlé in society: Creating Shared Value 2016 annual report outlines commitments to: achieve water efficiency and sustainability; advocate effective water policies and stewardship; treat discharged water; engage with suppliers; raise awareness on water conservation; and improve access to water and sanitation across the value chain. The company reports on the activities to meet these commitments44.
EXAMPLE ENGAGEMENT QUESTIONS ■ What is the highest level of oversight for water risk
issues within the business? ■ To what extent do you know your (producer and/or
manufacturer) supplier locations down to the farm level or nearest town?
■ For commodities, do you know the key growing areas in the countries you source from?
■ What are the water risks in your key sourcing/operating areas (e.g. drought occurrence, flood occurrence, local stakeholder perceptions, changes in regulations and status of water management institutions)?
■ Are you aware of other demands for water competing with your supply chains in key sourcing/operating areas (e.g. other agriculture sectors, industry, energy and communities)?
■ Have you conducted a water risk assessment down to the individual farm/operational levels in your supply chains using a recognised water risk tool?
■ What tools do you use to assess high-risk areas? ■ Have you assessed the key drivers of risks you are
exposed to in high water risk areas such as over-abstraction and poor water management? If so, what are they?
■ Have you considered future water risk amid the physical impacts of climate change on your inputs/commodities?
■ Does this risk assessment account for the volume and financial value from each supplier and supplier cluster?
■ Does the water risk assessment account for concentration of supply – a high proportion of products coming from one area, for example?
■ Have you considered the reputational and regulatory issues associated with sourcing locations?
■ Do you know the impact of your suppliers and/or producers on water quality?
■ Do you know the water use or consumption of your suppliers relative to other water users in the area?
■ Do you check the legality of suppliers with respect to water abstractions and use of pesticides and fertilisers?
■ What actions do you take if suppliers are found to be acting illegally?
RESOURCES AND TOOLS AVAILABLE TO COMPANIES
Tool Purpose
WWF Water Risk FilterMapping, basin and site operational risk assessment (tool), valuation and response
WRI Aqueduct Water Risk Atlas
Mapping and basin risk assessment (tool)
GRI Guidelines Disclosure
CDP Water Disclosure
Ceres Aqua Gauge Corporate operational risk assessment (framework)
WBCSD Global Water Tool Mapping
Alliance for Water Stewardship standard
Basin and site operational risk assessment (framework) and response
GEMI Local Water Tool Site operational risk assessment (tool)
Veolia True Cost of Water Tool Financial valuation
Ecolab Trucost Microsoft Water Risk Monetizer 2.0 Financial valuation
43 Nestlé. (2017) Environmental Sustainability and Water [Accessed February 2018].44 Nestlé. (2016) Nestlé in society: Creating Shared Value and meeting our commitments 2016.45 H&M. (n.d.) Supplier List [Accessed February 2018].
Good practice example: H&M
H&M publicly discloses a list of suppliers by the supplier type and geographic location. The names and locations of mills that provide Tier 1 suppliers with fabrics and yarns are shown. These Tier 2 mills make about 60% of the items produced for H&M45.
18
Once a company’s water impacts and risks are understood, a response and risk mitigation strategy should be developed and implemented. Action within the company’s own operations is an easy first step, such as outlining targets and plans. It can also boost awareness through the company. Water efficiency and accounting, reporting on water quantity and quality, and a reduction of pollution are all potential aspects of internal action. Targets should be set at the site level and account for the water scarcity and water quality circumstances in the catchments in which they are located, and should reflect the size and influence of the business46.
Companies should begin to engage their suppliers through conferences, dialogues and contracting processes, and assess how they can take action. For example, companies with direct relationships with growers will find it easier to engage them on water issues compared to those sourcing traded commodities. This is a critical stage for companies with higher indirect water use (via their supply chain) than through their direct operations. External stakeholder engagement throughout all elements is important as information received from different organisations may influence policies and processes to manage agricultural supply chain water risk.
PROMOTE INTERNAL AND SUPPLY CHAIN ACTION
Investors expect companies to:
■ establish a corporate water stewardship policy and implementation plan, including goals with time-bound, contextual targets, actions to mitigate water risks in the supply chain and a monitoring and evaluation plan;
■ cover water issues comprehensively, including water governance, water consumption, water quality, and freshwater habitats/special cultural areas;
■ identify key suppliers that can be influenced at the grower level (e.g. where growers are at Tier 1 or Tier 2 of the supply chain);
■ for commodity supply chains, ensure that, where applicable/required, these are certified to recognised standards (e.g. Better Cotton Initiative, Roundtable on Responsible Soy, Roundtable on Sustainable Palm Oil, Bonsucro, Rainforest Alliance);
■ ensure suppliers are at least fully compliant with relevant local legislation. For countries where legislation and regulation is poor, external certification, standards and auditing should be the baseline;
■ share lessons from water projects with all relevant suppliers; and
■ implement procurement standards, incentives and awareness programmes to encourage suppliers to mitigate water risks.
46 Standards, such as the Alliance for Water Stewardship (AWS), are a mechanism to drive internal actions that also offer confidence of implementation through independent 3rd party verification. For more details on the coverage of water stewardship by different agricultural sustainability standards, see WWF. (2017) Water risk in agricultural supply chains: How well are sustainability standards covering water stewardship.
GROWING WATER RISK RESILIENCE | 2018
19
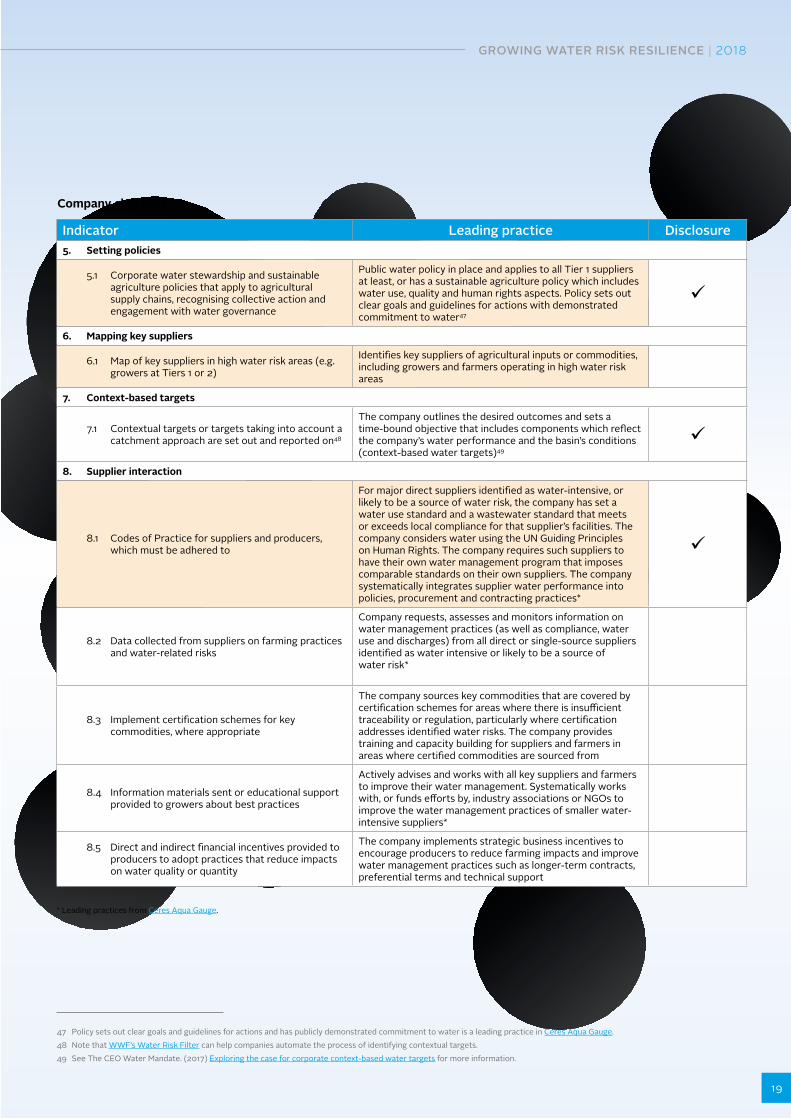
Indicator Leading practice Disclosure 5. Setting policies
5.1 Corporate water stewardship and sustainable agriculture policies that apply to agricultural supply chains, recognising collective action and engagement with water governance
Public water policy in place and applies to all Tier 1 suppliers at least, or has a sustainable agriculture policy which includes water use, quality and human rights aspects. Policy sets out clear goals and guidelines for actions with demonstrated commitment to water47
ü
6. Mapping key suppliers
6.1 Map of key suppliers in high water risk areas (e.g. growers at Tiers 1 or 2)
Identifies key suppliers of agricultural inputs or commodities, including growers and farmers operating in high water risk areas
7. Context-based targets
7.1 Contextual targets or targets taking into account a catchment approach are set out and reported on48
The company outlines the desired outcomes and sets a time-bound objective that includes components which reflect the company’s water performance and the basin’s conditions (context-based water targets)49
ü
8. Supplier interaction
8.1 Codes of Practice for suppliers and producers, which must be adhered to
For major direct suppliers identified as water-intensive, or likely to be a source of water risk, the company has set a water use standard and a wastewater standard that meets or exceeds local compliance for that supplier’s facilities. The company considers water using the UN Guiding Principles on Human Rights. The company requires such suppliers to have their own water management program that imposes comparable standards on their own suppliers. The companysystematically integrates supplier water performance into policies, procurement and contracting practices*
ü
8.2 Data collected from suppliers on farming practices and water-related risks
Company requests, assesses and monitors information onwater management practices (as well as compliance, water use and discharges) from all direct or single-source suppliers identified as water intensive or likely to be a source ofwater risk*
8.3 Implement certification schemes for key commodities, where appropriate
The company sources key commodities that are covered by certification schemes for areas where there is insufficient traceability or regulation, particularly where certification addresses identified water risks. The company provides training and capacity building for suppliers and farmers in areas where certified commodities are sourced from
8.4 Information materials sent or educational support provided to growers about best practices
Actively advises and works with all key suppliers and farmers to improve their water management. Systematically works with, or funds efforts by, industry associations or NGOs to improve the water management practices of smaller water-intensive suppliers*
8.5 Direct and indirect financial incentives provided to producers to adopt practices that reduce impacts on water quality or quantity
The company implements strategic business incentives to encourage producers to reduce farming impacts and improve water management practices such as longer-term contracts, preferential terms and technical support
Company checklist
* Leading practices from Ceres Aqua Gauge.
47 Policy sets out clear goals and guidelines for actions and has publicly demonstrated commitment to water is a leading practice in Ceres Aqua Gauge.48 Note that WWF’s Water Risk Filter can help companies automate the process of identifying contextual targets.49 See The CEO Water Mandate. (2017) Exploring the case for corporate context-based water targets for more information.
20
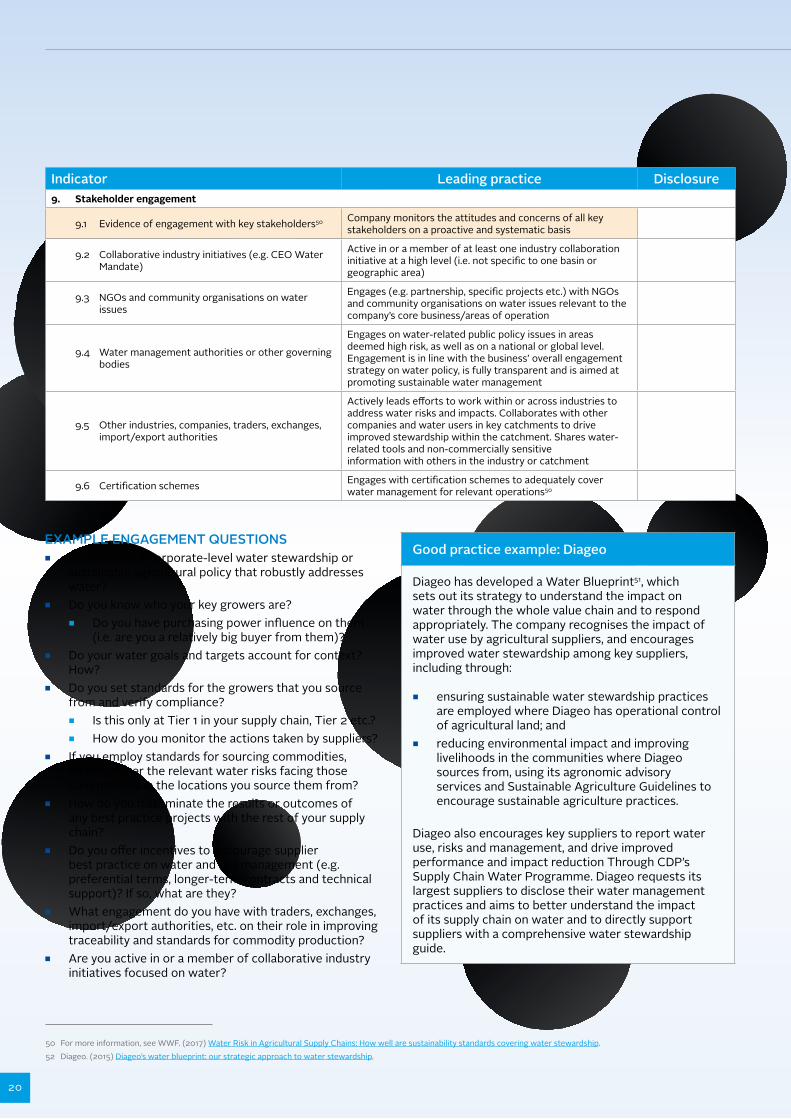
Indicator Leading practice Disclosure 9. Stakeholder engagement
9.1 Evidence of engagement with key stakeholders50 Company monitors the attitudes and concerns of all key stakeholders on a proactive and systematic basis
9.2 Collaborative industry initiatives (e.g. CEO Water Mandate)
Active in or a member of at least one industry collaboration initiative at a high level (i.e. not specific to one basin or geographic area)
9.3 NGOs and community organisations on water issues
Engages (e.g. partnership, specific projects etc.) with NGOs and community organisations on water issues relevant to the company’s core business/areas of operation
9.4 Water management authorities or other governing bodies
Engages on water-related public policy issues in areas deemed high risk, as well as on a national or global level. Engagement is in line with the business’ overall engagement strategy on water policy, is fully transparent and is aimed at promoting sustainable water management
9.5 Other industries, companies, traders, exchanges, import/export authorities
Actively leads efforts to work within or across industries to address water risks and impacts. Collaborates with other companies and water users in key catchments to drive improved stewardship within the catchment. Shares water-related tools and non-commercially sensitiveinformation with others in the industry or catchment
9.6 Certification schemes Engages with certification schemes to adequately cover water management for relevant operations50
50 For more information, see WWF. (2017) Water Risk in Agricultural Supply Chains: How well are sustainability standards covering water stewardship.52 Diageo. (2015) Diageo’s water blueprint: our strategic approach to water stewardship.
EXAMPLE ENGAGEMENT QUESTIONS ■ Do you have a corporate-level water stewardship or
sustainable agricultural policy that robustly addresses water?
■ Do you know who your key growers are? ■ Do you have purchasing power influence on them
(i.e. are you a relatively big buyer from them)? ■ Do your water goals and targets account for context?
How? ■ Do you set standards for the growers that you source
from and verify compliance? ■ Is this only at Tier 1 in your supply chain, Tier 2 etc.? ■ How do you monitor the actions taken by suppliers?
■ If you employ standards for sourcing commodities, do they cover the relevant water risks facing those commodities in the locations you source them from?
■ How do you disseminate the results or outcomes of any best practice projects with the rest of your supply chain?
■ Do you offer incentives to encourage supplier best practice on water and soil management (e.g. preferential terms, longer-term contracts and technical support)? If so, what are they?
■ What engagement do you have with traders, exchanges, import/export authorities, etc. on their role in improving traceability and standards for commodity production?
■ Are you active in or a member of collaborative industry initiatives focused on water?
Good practice example: Diageo
Diageo has developed a Water Blueprint51, which sets out its strategy to understand the impact on water through the whole value chain and to respond appropriately. The company recognises the impact of water use by agricultural suppliers, and encourages improved water stewardship among key suppliers, including through:
■ ensuring sustainable water stewardship practices are employed where Diageo has operational control of agricultural land; and
■ reducing environmental impact and improving livelihoods in the communities where Diageo sources from, using its agronomic advisory services and Sustainable Agriculture Guidelines to encourage sustainable agriculture practices.
Diageo also encourages key suppliers to report water use, risks and management, and drive improved performance and impact reduction Through CDP’s Supply Chain Water Programme. Diageo requests its largest suppliers to disclose their water management practices and aims to better understand the impact of its supply chain on water and to directly support suppliers with a comprehensive water stewardship guide.
GROWING WATER RISK RESILIENCE | 2018
21
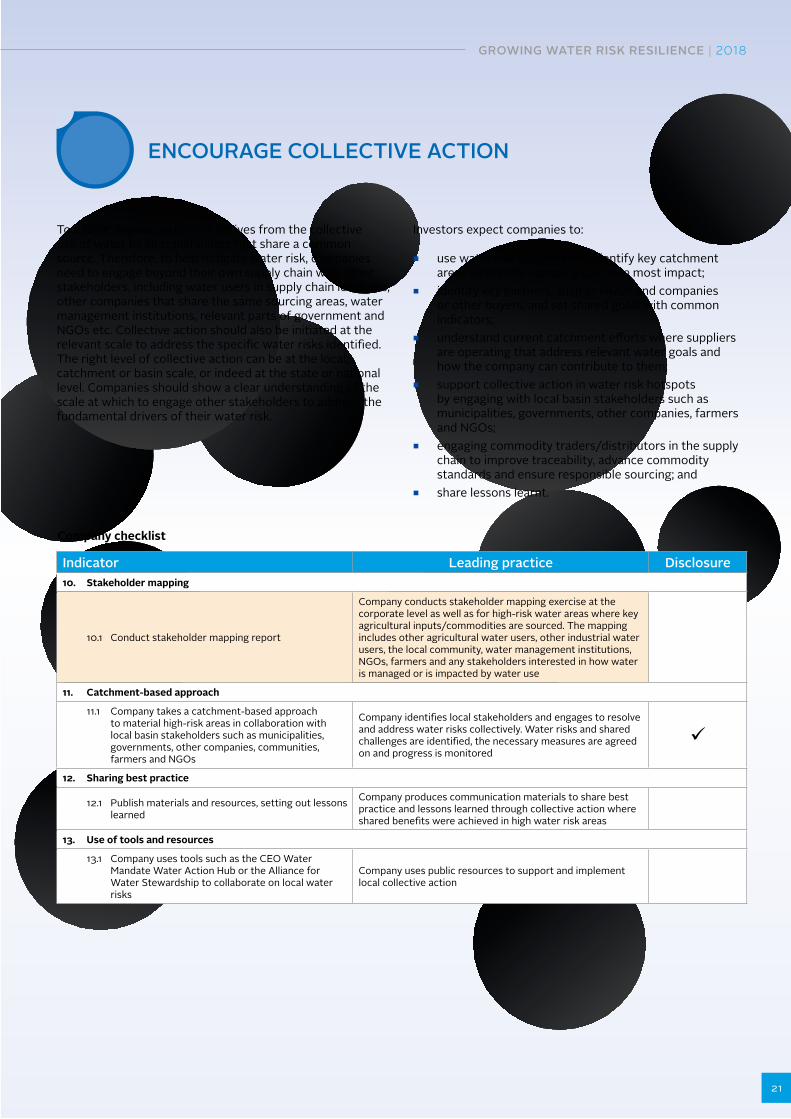
To a large degree, water risk derives from the collective use of water by all stakeholders that share a common source. Therefore, to help mitigate water risk, companies need to engage beyond their own supply chain with other stakeholders, including water users in supply chain locations, other companies that share the same sourcing areas, water management institutions, relevant parts of government and NGOs etc. Collective action should also be initiated at the relevant scale to address the specific water risks identified. The right level of collective action can be at the local, catchment or basin scale, or indeed at the state or national level. Companies should show a clear understanding of the scale at which to engage other stakeholders to address the fundamental drivers of their water risk.
ENCOURAGE COLLECTIVE ACTION
Investors expect companies to:
■ use water risk hotspots and identify key catchment areas where the company can have most impact;
■ identify key partners, such as NGOs and companies or other buyers, and set shared goals with common indicators;
■ understand current catchment efforts where suppliers are operating that address relevant water goals and how the company can contribute to them;
■ support collective action in water risk hotspots by engaging with local basin stakeholders such as municipalities, governments, other companies, farmers and NGOs;
■ engaging commodity traders/distributors in the supply chain to improve traceability, advance commodity standards and ensure responsible sourcing; and
■ share lessons learnt.
Indicator Leading practice Disclosure 10. Stakeholder mapping
10.1 Conduct stakeholder mapping report
Company conducts stakeholder mapping exercise at the corporate level as well as for high-risk water areas where key agricultural inputs/commodities are sourced. The mapping includes other agricultural water users, other industrial water users, the local community, water management institutions, NGOs, farmers and any stakeholders interested in how water is managed or is impacted by water use
11. Catchment-based approach
11.1 Company takes a catchment-based approach to material high-risk areas in collaboration with local basin stakeholders such as municipalities, governments, other companies, communities, farmers and NGOs
Company identifies local stakeholders and engages to resolve and address water risks collectively. Water risks and shared challenges are identified, the necessary measures are agreed on and progress is monitored
ü
12. Sharing best practice
12.1 Publish materials and resources, setting out lessons learned
Company produces communication materials to share best practice and lessons learned through collective action where shared benefits were achieved in high water risk areas
13. Use of tools and resources
13.1 Company uses tools such as the CEO Water Mandate Water Action Hub or the Alliance for Water Stewardship to collaborate on local water risks
Company uses public resources to support and implement local collective action
Company checklist
22
EXAMPLE ENGAGEMENT QUESTIONS ■ Have you identified the key water stakeholders in your
areas of high water risk? If so, how? ■ What process have you employed to understand your
impact on local water stakeholders? ■ What existing initiatives in your high water risk areas
take a multi-stakeholder approach? ■ Have you identified how your company can contribute
to these existing projects/initiatives? ■ How do you support collective action among water
stakeholders in your high water risk supplier locations? ■ Do you publish information on your engagement with
others on water issues?
Good practice example: Marks and Spencer (M&S)
In partnership with WWF, M&S has assessed its global fresh produce supply chains to identify key water risk locations for the company: areas with a concentration of suppliers in high water risk areas that supply a significant proportion of key crops. M&S has engaged in its key sourcing areas using a stewardship approach to reduce risk and impact. Examples of the actions the company has taken to date on collective action include:
■ testing the Alliance for Water Stewardship standards with growers in the Western Cape, South Africa52 – a key sourcing region;
■ working with civil society groups in supply areas in South Africa to address water quality issues and facilitate removal of water-thirsty alien invasive vegetation;
■ convening sector peers to catalyse collective action on water in shared sourcing areas; and
■ taking a leadership role in the SAI Platform Doñana Berry Project53.
52 WWF and M&S. (2014) Case study: Freshwater stewardship.53 Sustainable Agriculture Initiative Platform. (n.d.) Doñana Berry Project. [Accessed February 2018].
GROWING WATER RISK RESILIENCE | 2018
23
Influencing the governance of water (i.e. the rules and institutions, both formal and informal, which determine how water is managed) is essential in addressing water risks. Shared water sources need to be managed sustainably for all or any water savings or reductions in pollution by one company can be offset by increases from others, resulting in no net change in overall risk for the company that has improved practices.
The cumulative use of water in a river basin and the social, political and environmental contexts which surround it contribute to a company’s exposure to water risk. A highly water-efficient company operating in a water-stressed catchment, where others continue to manage water poorly, remains exposed to water risks.
INFLUENCE GOVERNANCE OF WATER
Depending on the context, the governance of water may need to be influenced at various scales from local (e.g. Water User Associations) to basin (e.g. basin management organisations), regional (e.g. state government) or national (e.g. Ministry of Water/Environment).
Investors expect companies to:
■ understand the policy landscape; and ■ build coalitions of support with other organisations and
develop shared policy advocacy positions in key water risk areas.
Indicator Leading practice Disclosure 14. Water regulation and policy analysis
14.1 Analysis completed of the policies relevant to water, water management institutions and how they operate, and underlying water risk drivers in key water risk areas as a result of the policies
The company develops an understanding of the regulatory environment that they are operating in at the national and local level. The company also analyses the policies of water management institutions operating in high water risk supply chain areas and the policies that may impact the business and the water quantity and quality in the local context. It demonstrates an understanding of the root causes of water risks in water management and governance.
15. Public policy position
15.1 Public material stating advocacy positions and actions
The company’s public policy positions and lobbying are consistent with its own stated water stewardship goals and with internationally-recognised water stewardship and development goals. It also works to encourage wider industry adoption of policy positions consistent with internationally-recognised water stewardship and development goals54.
Company checklist
54 Leading practice from Ceres Aqua Gauge. 55 Sustainable Agriculture Initiative Platform. (2016) Doñana Strawberry and Sustainable Water Management Group: Position statement.56 Members of the group consist of Albert Heijn, Coop, Edeka, innocent, The Coca-Cola Company, Marks & Spencer, Migros, Sainsbury, SVZ and Unilever.
EXAMPLE ENGAGEMENT QUESTIONS ■ Have you investigated the underlying legislation, policy
and institutional water management drivers for the water issues in your high water risk areas?
■ Do you engage in advocacy with water management institutions to improve water management policy and practice?
■ Does your advocacy work adhere to recognised principles for responsible engagement with policy makers (e.g. CEO Water Mandate principles)?
24
Good practice example: Lake Naivasha water allocation regime
Kenya’s Lake Naivasha is significant to the national economy; it supports horticulture and floriculture, energy production, power generation, tourism and livestock production. Abstraction was unlimited and human activities caused the clearing of lakeside vegetation, nutrient loading from the upper catchment and loss of aquatic vegetation57. International media drew attention to concerns around the lake’s future and the high water usage of flower production for western consumers. In response, European retailers, WWF and other NGOs brought stakeholders together to develop a plan for the lake. The Lake Naivasha Grower’s Group developed a Water Allocation Plan (WAP), which now guides water use in the basin58. Several Water User Associations were established, which work together to implement water conservation measures and sustainable livelihood strategies in their catchments. The WAP was adopted by the Water Resources Management Authority and developed further through stakeholder consultation.
57 M&S and WWF. (2010) Good water stewardship: guidance for agricultural suppliers.58 Lake Naivasha Growers Group.
Good practice example: Doñana Strawberry and Sustainable Water Management Group
In March 2016, the Doñana Strawberry and Sustainable Water Management Group supported the Land Use Plan (Plan de Ordenación de la Corona Forestal Doñana) issued by the Government of Andalucía, calling for its urgent implementation55. The group56 was concerned about the continued pressure on the quantity and quality of the water resources in the region. The Land Use Plan offered legal certainty to adopt sustainable and efficient water management practices by businesses in the area.
GROWING WATER RISK RESILIENCE | 2018
25
CHALLENGES FOR ENGAGEMENT
Investors face numerous challenges when engaging with companies on this topic to understand the extent of their water dependency, security and management response.
These include:
1. MAKING THE INTERNAL BUSINESS CASE FOR ACTIONInvestors may need to make the business case to the company to secure a dialogue, as some companies may be reluctant to engage for several reasons. The table below provides some tips for investors to encourage companies to engage in dialogue.
Company response Potential solutionWhy are investors engaging on corporate social responsibility (CSR) or sustainability issues? We should focus on more material issues to investors
For companies with an agricultural supply chain, water risk is indeed likely to be financially material. The argument is illustrated by statistics from the annual reports issued by CDP Water, peer comparisons within the sector and external benchmark/rankings. Investors may want to understand the sustainability and productivity of supply chains, including the continuity and quality of inputs in areas of high water risk, to evaluate water risk response and identify investment opportunities that are likely to outperform. Companies could be asked if they understand their value at risk. Employing water valuation tools (see Table 6) can help companies explore how their finances could be affected.
Our priorities lie elsewhere in the business
Before starting a dialogue with a company, investors should research where the company’s water risk exposure lies and which commodities are most at risk. Having an idea of the business and supply chain structure (including its forward-looking plans and strategy) will help the investor identify priorities and highlight relevant risks to the company.
We are capacity and resource-constrained
Investors can start a dialogue by understanding the company’s starting point on managing water risks in the supply chain and mapping this against the framework outlined in this document. Begin with early steps, such as discussing the number of suppliers and volume of supplies at risk before moving on to water risk assessments for the supply chain. This will help the dialogue seem manageable. The requests of the company can become more advanced as the conversation matures. Tools, guidance support materials and collective action initiatives that can help bridge capacity and resource constraints59 can also be highlighted.
We do not have the internal expertise to address this issue
Investors can point to solutions, share knowledge, share good practice examples from other companies and direct companies to resources. There are also many collective action initiatives, consultancies and NGOs with expertise that can assist if internal expertise is lacking.
We are uncomfortable with engaging with a large group of investors on this issue
In cases of collaborative engagement, lead investors can offer to host a call/meeting with a smaller group of investors and send a list of investor names and questions to help the company prepare.
We are uncomfortable with publicly disclosing this issue
Investors can encourage companies to disclose material indicators by explaining to companies how the data is used and that it is an opportunity for the company to author its own story. Without company data, third parties will provide analyses and interpretations for investors. Investors can also point to peers to show how other companies are disclosing.
Table 3: Potential company responses and solutions
59 Tools, guidance, support materials, and collective action initiatives include Courtauld 2025 for UK companies, Water Risk Filter and CEO Water Mandate Water Stewardship Toolbox. See the Toolbox on page 17 for additional resources.
26
2. SUPPLY CHAIN TRACEABILITYUnderstanding supply chains can be complex, and traceability can be particularly challenging. Companies do not often have visibility of their supply chains beyond Tiers 1 or 2 and, consequently, cannot identify what raw materials they are sourcing from where. While some companies have direct ownership or contracts with the farms where crops are grown and sourced (vertical integration), others may have many tiers in their supply chain and source via traders, exchanges and cooperatives.
Traders and cooperatives may change their suppliers frequently, making it difficult for the company to influence farming practices or to demand certain levels of data. For example, barley may be grown on a farm, but the same farm may not grow it the following year. Also, a mix of bulk commodities sourced by traders and cooperatives make traceability and data accessibility challenging. This opaque agricultural supply chain makes it difficult for a company to assess its own risk exposure.
Before engagement, investors need to understand a company’s supply chain structure to help them determine where to steer the dialogue.
Investors could respond to the challenge by:
■ requesting a map or list of a company’s suppliers (Tier 1, 2, 3+). If unavailable, request a list of priority commodities for the company (as commodities can be mapped against water risks);
■ using mapping tools such as The Sustainability Consortium’s supply chain mapping tool60 and emerging tools like TRASE61;
■ once companies know their suppliers, encouraging companies to adopt incentives for applying water stewardship practices – via codes of conduct or sustainability standards that address relevant water risks, longer-term contracts and pricing structures, for example;
■ where most of the crop is sourced from traders, encouraging companies to work with traders to identify sourcing regions/suppliers, align codes of conduct/standards and pass along tools/guidance to drive best practice through supply chains; and
■ encouraging companies to participate in sectoral initiatives to map suppliers and/or implement unified supplier requirements (performance and data).
3. COMPANY’S SPHERE OF CONTROLThe company’s sphere of control is linked to its supply chain leverage. Companies have the greatest level of control over their own direct operations. They can increase operational water efficiency and take actions internally to reduce their water impact. Further along their supply chains, companies have less control over the actions taken to reduce water impacts, although they can still influence suppliers’ actions. The amount of influence a company has within its supply chain varies depending on several factors including type of business, size of the supply chain and relationship with suppliers.
Investors should not expect that corporate water risk can be completely mitigated through short-term individual company actions; understanding the local context of the company’s operations and supply chain is required. It is important to note that while a company’s own operations may have an impact on the environment and other stakeholders in the same catchment – generating water risks – the company is also exposed to risks outside of its control. These are referred to as shared water challenges and require collective action with other stakeholders to achieve basin goals62. This will help to ensure actions taken at the facility and basin levels are sufficient to mitigate water risks that would otherwise be impossible to deliver as a single company acting alone.
Therefore, investors should note that there is a range of measures that companies can take when managing water risk – from simple internal actions by the company to more complex collective action measures; for more information, see the CEO Water Mandate 2013 Guide to Water-Related Collective Action. This includes engagement with relevant institutions, water users and stakeholders in a catchment to understand the formal and informal dynamics of water use. Collective action and influencing the governance of water is required for a company to mitigate risk.
60 The Sustainability Consortium’s Commodity Mapping Tool.61 TRASE.62 The CEO Water Mandate. (2017) Exploring the Case for Corporate Context-Based Water Targets.
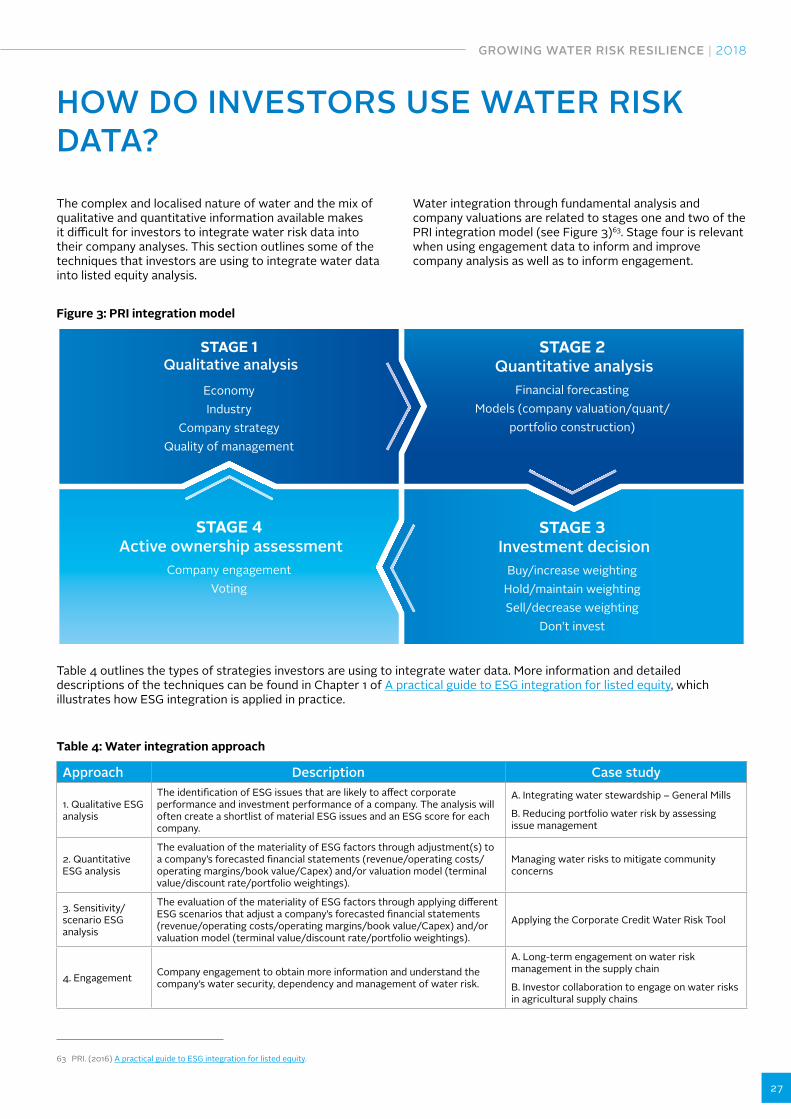
GROWING WATER RISK RESILIENCE | 2018
27
HOW DO INVESTORS USE WATER RISK DATA?
The complex and localised nature of water and the mix of qualitative and quantitative information available makes it difficult for investors to integrate water risk data into their company analyses. This section outlines some of the techniques that investors are using to integrate water data into listed equity analysis.
Water integration through fundamental analysis and company valuations are related to stages one and two of the PRI integration model (see Figure 3)63. Stage four is relevant when using engagement data to inform and improve company analysis as well as to inform engagement.
Figure 3: PRI integration model
STAGE 1 Qualitative analysis
EconomyIndustry
Company strategyQuality of management
STAGE 2 Quantitative analysis
Financial forecastingModels (company valuation/quant/
portfolio construction)
STAGE 4 Active ownership assessment
Company engagementVoting
STAGE 3 Investment decision
Buy/increase weightingHold/maintain weightingSell/decrease weighting
Don’t invest
Table 4 outlines the types of strategies investors are using to integrate water data. More information and detailed descriptions of the techniques can be found in Chapter 1 of A practical guide to ESG integration for listed equity, which illustrates how ESG integration is applied in practice.
Approach Description Case study
1. Qualitative ESG analysis
The identification of ESG issues that are likely to affect corporate performance and investment performance of a company. The analysis will often create a shortlist of material ESG issues and an ESG score for each company.
A. Integrating water stewardship – General Mills
B. Reducing portfolio water risk by assessing issue management
2. Quantitative ESG analysis
The evaluation of the materiality of ESG factors through adjustment(s) to a company’s forecasted financial statements (revenue/operating costs/operating margins/book value/Capex) and/or valuation model (terminal value/discount rate/portfolio weightings).
Managing water risks to mitigate community concerns
3. Sensitivity/scenario ESG analysis
The evaluation of the materiality of ESG factors through applying different ESG scenarios that adjust a company’s forecasted financial statements (revenue/operating costs/operating margins/book value/Capex) and/or valuation model (terminal value/discount rate/portfolio weightings).
Applying the Corporate Credit Water Risk Tool
4. Engagement Company engagement to obtain more information and understand the company’s water security, dependency and management of water risk.
A. Long-term engagement on water risk management in the supply chain
B. Investor collaboration to engage on water risks in agricultural supply chains
Table 4: Water integration approach
63 PRI. (2016) A practical guide to ESG integration for listed equity.
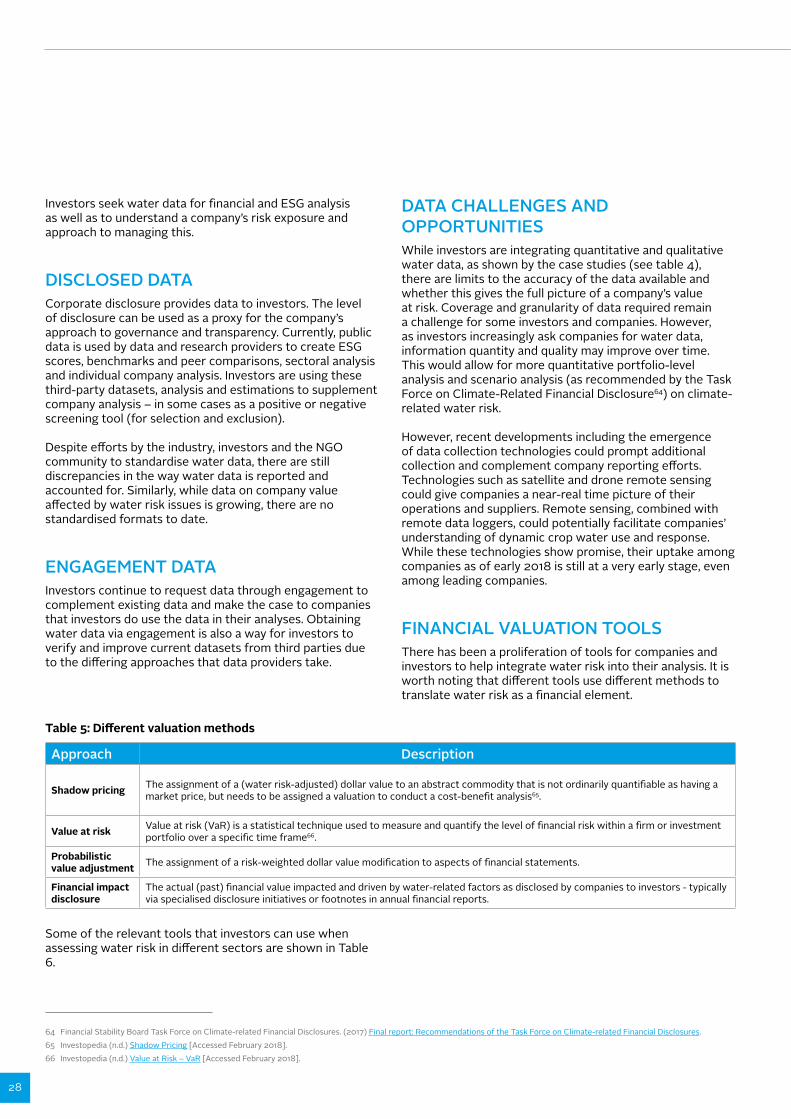
28
Investors seek water data for financial and ESG analysis as well as to understand a company’s risk exposure and approach to managing this.
DISCLOSED DATACorporate disclosure provides data to investors. The level of disclosure can be used as a proxy for the company’s approach to governance and transparency. Currently, public data is used by data and research providers to create ESG scores, benchmarks and peer comparisons, sectoral analysis and individual company analysis. Investors are using these third-party datasets, analysis and estimations to supplement company analysis – in some cases as a positive or negative screening tool (for selection and exclusion).
Despite efforts by the industry, investors and the NGO community to standardise water data, there are still discrepancies in the way water data is reported and accounted for. Similarly, while data on company value affected by water risk issues is growing, there are no standardised formats to date.
ENGAGEMENT DATAInvestors continue to request data through engagement to complement existing data and make the case to companies that investors do use the data in their analyses. Obtaining water data via engagement is also a way for investors to verify and improve current datasets from third parties due to the differing approaches that data providers take.
DATA CHALLENGES AND OPPORTUNITIESWhile investors are integrating quantitative and qualitative water data, as shown by the case studies (see table 4), there are limits to the accuracy of the data available and whether this gives the full picture of a company’s value at risk. Coverage and granularity of data required remain a challenge for some investors and companies. However, as investors increasingly ask companies for water data, information quantity and quality may improve over time. This would allow for more quantitative portfolio-level analysis and scenario analysis (as recommended by the Task Force on Climate-Related Financial Disclosure64) on climate-related water risk.
However, recent developments including the emergence of data collection technologies could prompt additional collection and complement company reporting efforts. Technologies such as satellite and drone remote sensing could give companies a near-real time picture of their operations and suppliers. Remote sensing, combined with remote data loggers, could potentially facilitate companies’ understanding of dynamic crop water use and response. While these technologies show promise, their uptake among companies as of early 2018 is still at a very early stage, even among leading companies.
FINANCIAL VALUATION TOOLSThere has been a proliferation of tools for companies and investors to help integrate water risk into their analysis. It is worth noting that different tools use different methods to translate water risk as a financial element.
Approach Description
Shadow pricing The assignment of a (water risk-adjusted) dollar value to an abstract commodity that is not ordinarily quantifiable as having a market price, but needs to be assigned a valuation to conduct a cost-benefit analysis65.
Value at risk Value at risk (VaR) is a statistical technique used to measure and quantify the level of financial risk within a firm or investment portfolio over a specific time frame66.
Probabilistic value adjustment The assignment of a risk-weighted dollar value modification to aspects of financial statements.
Financial impact disclosure
The actual (past) financial value impacted and driven by water-related factors as disclosed by companies to investors - typically via specialised disclosure initiatives or footnotes in annual financial reports.
Table 5: Different valuation methods
64 Financial Stability Board Task Force on Climate-related Financial Disclosures. (2017) Final report: Recommendations of the Task Force on Climate-related Financial Disclosures.65 Investopedia (n.d.) Shadow Pricing [Accessed February 2018]. 66 Investopedia (n.d.) Value at Risk – VaR [Accessed February 2018].
Some of the relevant tools that investors can use when assessing water risk in different sectors are shown in Table 6.
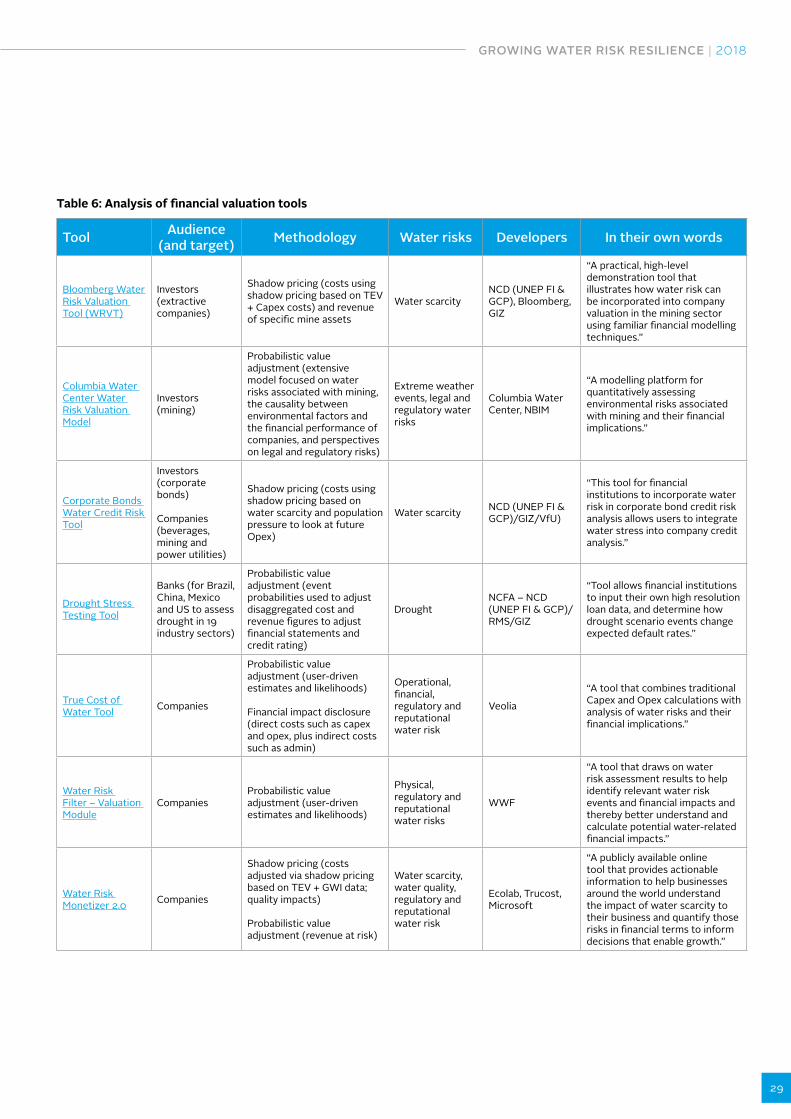
GROWING WATER RISK RESILIENCE | 2018
29
Tool Audience (and target) Methodology Water risks Developers In their own words
Bloomberg Water Risk Valuation Tool (WRVT)
Investors (extractive companies)
Shadow pricing (costs using shadow pricing based on TEV + Capex costs) and revenue of specific mine assets
Water scarcityNCD (UNEP FI & GCP), Bloomberg, GIZ
“A practical, high-level demonstration tool that illustrates how water risk can be incorporated into company valuation in the mining sector using familiar financial modelling techniques.”
Columbia Water Center Water Risk Valuation Model
Investors (mining)
Probabilistic value adjustment (extensive model focused on water risks associated with mining, the causality between environmental factors and the financial performance of companies, and perspectives on legal and regulatory risks)
Extreme weather events, legal and regulatory water risks
Columbia Water Center, NBIM
“A modelling platform for quantitatively assessing environmental risks associated with mining and their financial implications.”
Corporate Bonds Water Credit Risk Tool
Investors (corporate bonds)
Companies (beverages, mining and power utilities)
Shadow pricing (costs using shadow pricing based on water scarcity and population pressure to look at future Opex)
Water scarcity NCD (UNEP FI & GCP)/GIZ/VfU)
“This tool for financial institutions to incorporate water risk in corporate bond credit risk analysis allows users to integrate water stress into company credit analysis.”
Drought Stress Testing Tool
Banks (for Brazil, China, Mexico and US to assess drought in 19 industry sectors)
Probabilistic value adjustment (event probabilities used to adjust disaggregated cost and revenue figures to adjust financial statements and credit rating)
DroughtNCFA – NCD (UNEP FI & GCP)/RMS/GIZ
“Tool allows financial institutions to input their own high resolution loan data, and determine how drought scenario events change expected default rates.”
True Cost of Water Tool Companies
Probabilistic value adjustment (user-driven estimates and likelihoods)
Financial impact disclosure (direct costs such as capex and opex, plus indirect costs such as admin)
Operational, financial, regulatory and reputational water risk
Veolia
“A tool that combines traditional Capex and Opex calculations with analysis of water risks and their financial implications.”
Water Risk Filter – Valuation Module
CompaniesProbabilistic value adjustment (user-driven estimates and likelihoods)
Physical, regulatory and reputational water risks
WWF
“A tool that draws on water risk assessment results to help identify relevant water risk events and financial impacts and thereby better understand and calculate potential water-related financial impacts.”
Water Risk Monetizer 2.0 Companies
Shadow pricing (costs adjusted via shadow pricing based on TEV + GWI data; quality impacts)
Probabilistic value adjustment (revenue at risk)
Water scarcity, water quality, regulatory and reputational water risk
Ecolab, Trucost, Microsoft
“A publicly available online tool that provides actionable information to help businesses around the world understand the impact of water scarcity to their business and quantify those risks in financial terms to inform decisions that enable growth.”
Table 6: Analysis of financial valuation tools
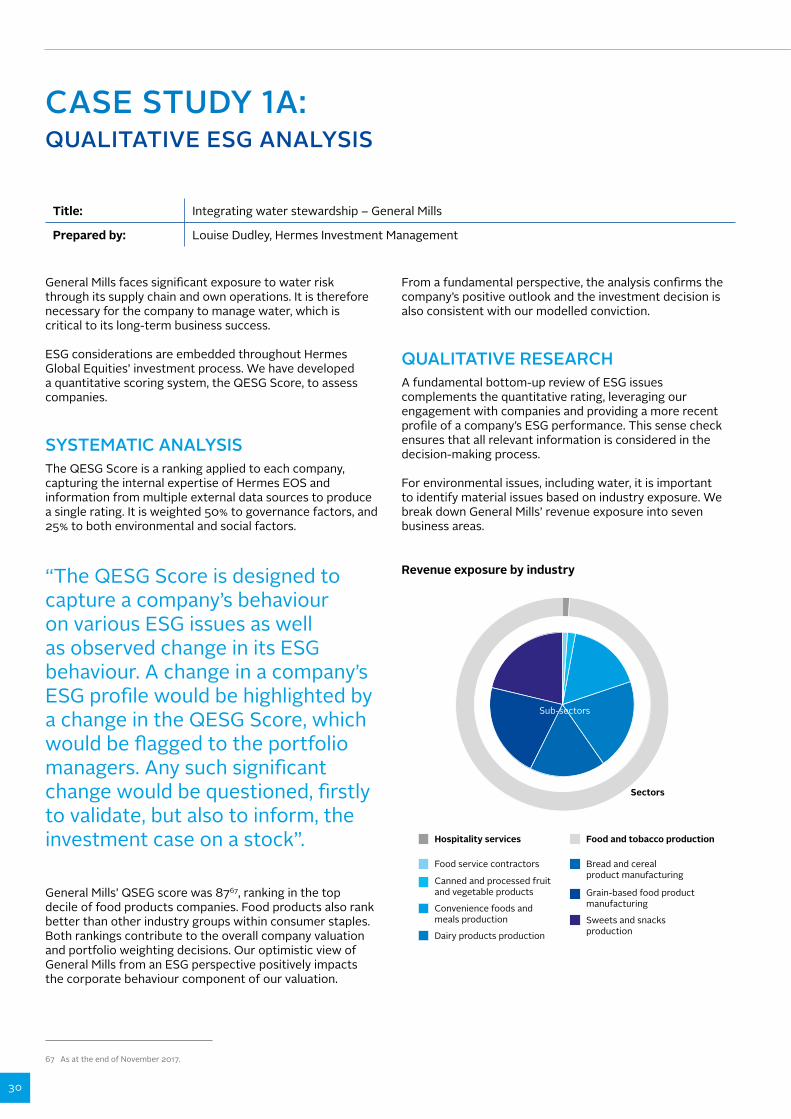
30
CASE STUDY 1A: QUALITATIVE ESG ANALYSIS
Title: Integrating water stewardship – General Mills
Prepared by: Louise Dudley, Hermes Investment Management
General Mills faces significant exposure to water risk through its supply chain and own operations. It is therefore necessary for the company to manage water, which is critical to its long-term business success.
ESG considerations are embedded throughout Hermes Global Equities’ investment process. We have developed a quantitative scoring system, the QESG Score, to assess companies.
SYSTEMATIC ANALYSISThe QESG Score is a ranking applied to each company, capturing the internal expertise of Hermes EOS and information from multiple external data sources to produce a single rating. It is weighted 50% to governance factors, and 25% to both environmental and social factors.
“The QESG Score is designed to capture a company’s behaviour on various ESG issues as well as observed change in its ESG behaviour. A change in a company’s ESG profile would be highlighted by a change in the QESG Score, which would be flagged to the portfolio managers. Any such significant change would be questioned, firstly to validate, but also to inform, the investment case on a stock”.
General Mills’ QSEG score was 8767, ranking in the top decile of food products companies. Food products also rank better than other industry groups within consumer staples. Both rankings contribute to the overall company valuation and portfolio weighting decisions. Our optimistic view of General Mills from an ESG perspective positively impacts the corporate behaviour component of our valuation.
From a fundamental perspective, the analysis confirms the company’s positive outlook and the investment decision is also consistent with our modelled conviction.
QUALITATIVE RESEARCH A fundamental bottom-up review of ESG issues complements the quantitative rating, leveraging our engagement with companies and providing a more recent profile of a company’s ESG performance. This sense check ensures that all relevant information is considered in the decision-making process.
For environmental issues, including water, it is important to identify material issues based on industry exposure. We break down General Mills’ revenue exposure into seven business areas.
Hospitality services Food and tobacco production
Food service contractors
Canned and processed fruit and vegetable products
Convenience foods and meals production
Dairy products production
Bread and cereal product manufacturing
Grain-based food product manufacturing
Sweets and snacks production
Sectors
Sub-sectors
Revenue exposure by industry
67 As at the end of November 2017.
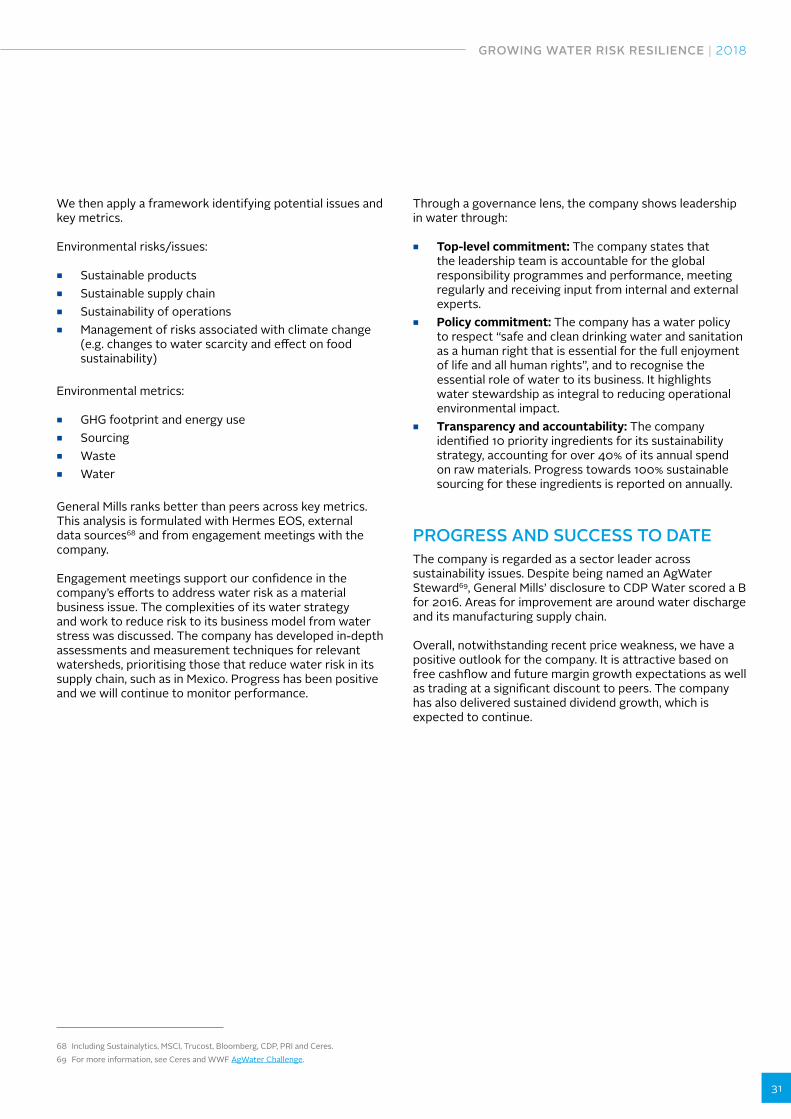
GROWING WATER RISK RESILIENCE | 2018
31
We then apply a framework identifying potential issues and key metrics.
Environmental risks/issues:
■ Sustainable products ■ Sustainable supply chain ■ Sustainability of operations ■ Management of risks associated with climate change
(e.g. changes to water scarcity and effect on food sustainability)
Environmental metrics:
■ GHG footprint and energy use ■ Sourcing ■ Waste ■ Water
General Mills ranks better than peers across key metrics. This analysis is formulated with Hermes EOS, external data sources68 and from engagement meetings with the company.
Engagement meetings support our confidence in the company’s efforts to address water risk as a material business issue. The complexities of its water strategy and work to reduce risk to its business model from water stress was discussed. The company has developed in-depth assessments and measurement techniques for relevant watersheds, prioritising those that reduce water risk in its supply chain, such as in Mexico. Progress has been positive and we will continue to monitor performance.
Through a governance lens, the company shows leadership in water through:
■ Top-level commitment: The company states that the leadership team is accountable for the global responsibility programmes and performance, meeting regularly and receiving input from internal and external experts.
■ Policy commitment: The company has a water policy to respect “safe and clean drinking water and sanitation as a human right that is essential for the full enjoyment of life and all human rights”, and to recognise the essential role of water to its business. It highlights water stewardship as integral to reducing operational environmental impact.
■ Transparency and accountability: The company identified 10 priority ingredients for its sustainability strategy, accounting for over 40% of its annual spend on raw materials. Progress towards 100% sustainable sourcing for these ingredients is reported on annually.
PROGRESS AND SUCCESS TO DATEThe company is regarded as a sector leader across sustainability issues. Despite being named an AgWater Steward69, General Mills’ disclosure to CDP Water scored a B for 2016. Areas for improvement are around water discharge and its manufacturing supply chain.
Overall, notwithstanding recent price weakness, we have a positive outlook for the company. It is attractive based on free cashflow and future margin growth expectations as well as trading at a significant discount to peers. The company has also delivered sustained dividend growth, which is expected to continue.
68 Including Sustainalytics, MSCI, Trucost, Bloomberg, CDP, PRI and Ceres.69 For more information, see Ceres and WWF AgWater Challenge.
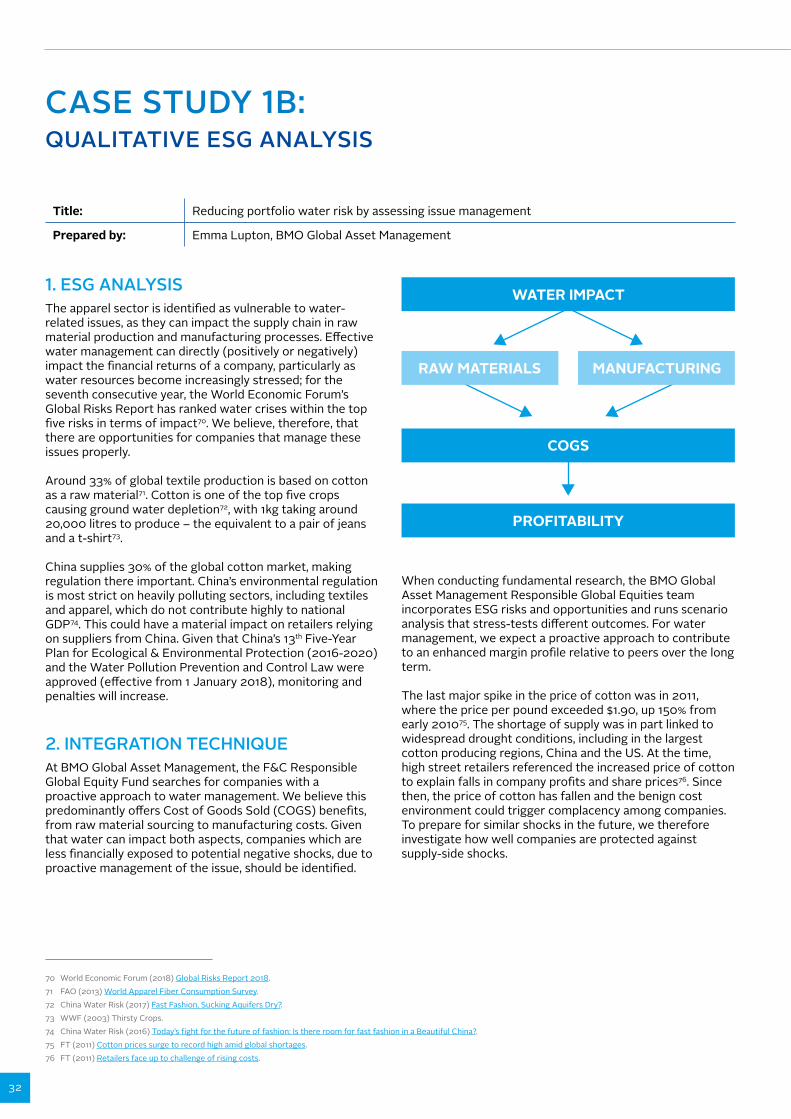
32
CASE STUDY 1B: QUALITATIVE ESG ANALYSIS
Title: Reducing portfolio water risk by assessing issue management
Prepared by: Emma Lupton, BMO Global Asset Management
1. ESG ANALYSIS The apparel sector is identified as vulnerable to water-related issues, as they can impact the supply chain in raw material production and manufacturing processes. Effective water management can directly (positively or negatively) impact the financial returns of a company, particularly as water resources become increasingly stressed; for the seventh consecutive year, the World Economic Forum’s Global Risks Report has ranked water crises within the top five risks in terms of impact70. We believe, therefore, that there are opportunities for companies that manage these issues properly.
Around 33% of global textile production is based on cotton as a raw material71. Cotton is one of the top five crops causing ground water depletion72, with 1kg taking around 20,000 litres to produce – the equivalent to a pair of jeans and a t-shirt73.
China supplies 30% of the global cotton market, making regulation there important. China’s environmental regulation is most strict on heavily polluting sectors, including textiles and apparel, which do not contribute highly to national GDP74. This could have a material impact on retailers relying on suppliers from China. Given that China’s 13th Five-Year Plan for Ecological & Environmental Protection (2016-2020) and the Water Pollution Prevention and Control Law were approved (effective from 1 January 2018), monitoring and penalties will increase.
2. INTEGRATION TECHNIQUE At BMO Global Asset Management, the F&C Responsible Global Equity Fund searches for companies with a proactive approach to water management. We believe this predominantly offers Cost of Goods Sold (COGS) benefits, from raw material sourcing to manufacturing costs. Given that water can impact both aspects, companies which are less financially exposed to potential negative shocks, due to proactive management of the issue, should be identified.
When conducting fundamental research, the BMO Global Asset Management Responsible Global Equities team incorporates ESG risks and opportunities and runs scenario analysis that stress-tests different outcomes. For water management, we expect a proactive approach to contribute to an enhanced margin profile relative to peers over the long term.
The last major spike in the price of cotton was in 2011, where the price per pound exceeded $1.90, up 150% from early 201075. The shortage of supply was in part linked to widespread drought conditions, including in the largest cotton producing regions, China and the US. At the time, high street retailers referenced the increased price of cotton to explain falls in company profits and share prices76. Since then, the price of cotton has fallen and the benign cost environment could trigger complacency among companies. To prepare for similar shocks in the future, we therefore investigate how well companies are protected against supply-side shocks.
70 World Economic Forum (2018) Global Risks Report 2018. 71 FAO (2013) World Apparel Fiber Consumption Survey.72 China Water Risk (2017) Fast Fashion, Sucking Aquifers Dry?. 73 WWF (2003) Thirsty Crops. 74 China Water Risk (2016) Today’s fight for the future of fashion: Is there room for fast fashion in a Beautiful China?.75 FT (2011) Cotton prices surge to record high amid global shortages. 76 FT (2011) Retailers face up to challenge of rising costs.
WATER IMPACT
RAW MATERIALS
COGS
PROFITABILITY
MANUFACTURING
GROWING WATER RISK RESILIENCE | 2018
33
77 VF Corporation (2017) Making cotton more sustainable.78 CDP| Water. 79 CDP (2017) 2017 Company response status and score.
3. IMPACT OF ESG INTEGRATION When the cotton price is high, companies decide whether to pass on this higher cost of raw materials to price-sensitive consumers or internalise the impact to COGS. During the supply shortage in 2011, VF Corporation (VF) passed on around half the cost to consumers and absorbed the rest into its margins.
With VF-owned within BMO Global Asset Management’s F&C Responsible Global Equity Fund, we analyse its water management practices closely. VF purchases around 1% of the world’s cotton annually for its denim brands77 and water-related issues can have a material financial impact on the company. When cotton prices were high, the company’s detailed knowledge of customers facilitated its decision on what costs could be passed onto customers, and what costs should be internalised. A progressive water management strategy contributes to our positive view of VF, meaning greater confidence in VF’s long-term profit margin profile relative to peers.
Through the CDP78 water programme in 2017, VF – which scored a B79 - disclosed that it is undertaking company-wide risk assessments – at a river basin level, across existing and new facilities, and within its own operations and supply chain. Working with Deloitte, VF assesses the potential financial value of water risk. Water impacts related to the success of its growth strategy are also evaluated.
For new facilities, water availability and flow rates are assessed on current and future operating conditions. Where water-intensive manufacturing facilities are located in high water-stressed regions, reverse osmosis water treatment plants reduce risk, as almost 100% of water is recycled at these sites.
Our analysis positively views the company’s acknowledgement of water risks and mitigation through strong management of the issue. VF is developing a comprehensive water strategy with WWF, including a review of strategic opportunities, water implications on key raw materials, scenario analysis of water quality and quantity, and tariff/regulatory changes. We are therefore engaging with the company and monitoring progress.
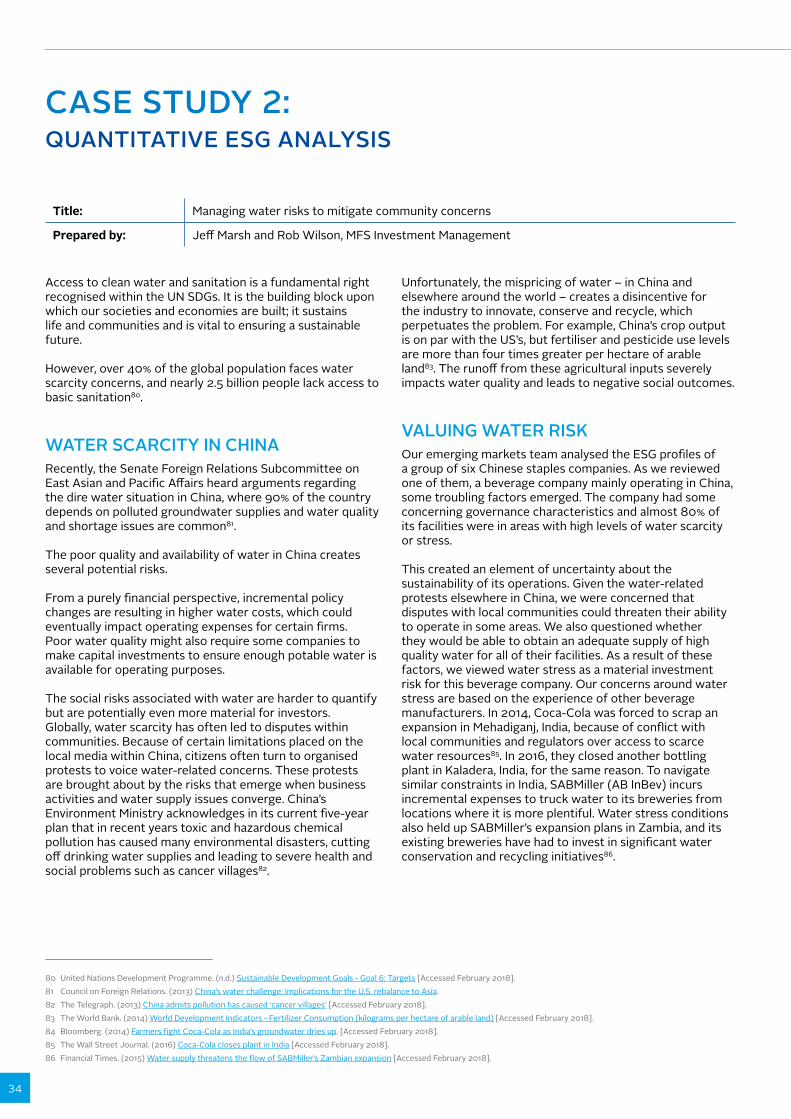
34
CASE STUDY 2: QUANTITATIVE ESG ANALYSIS
Title: Managing water risks to mitigate community concerns
Prepared by: Jeff Marsh and Rob Wilson, MFS Investment Management
Access to clean water and sanitation is a fundamental right recognised within the UN SDGs. It is the building block upon which our societies and economies are built; it sustains life and communities and is vital to ensuring a sustainable future.
However, over 40% of the global population faces water scarcity concerns, and nearly 2.5 billion people lack access to basic sanitation80.
WATER SCARCITY IN CHINARecently, the Senate Foreign Relations Subcommittee on East Asian and Pacific Affairs heard arguments regarding the dire water situation in China, where 90% of the country depends on polluted groundwater supplies and water quality and shortage issues are common81.
The poor quality and availability of water in China creates several potential risks.
From a purely financial perspective, incremental policy changes are resulting in higher water costs, which could eventually impact operating expenses for certain firms. Poor water quality might also require some companies to make capital investments to ensure enough potable water is available for operating purposes.
The social risks associated with water are harder to quantify but are potentially even more material for investors. Globally, water scarcity has often led to disputes within communities. Because of certain limitations placed on the local media within China, citizens often turn to organised protests to voice water-related concerns. These protests are brought about by the risks that emerge when business activities and water supply issues converge. China’s Environment Ministry acknowledges in its current five-year plan that in recent years toxic and hazardous chemical pollution has caused many environmental disasters, cutting off drinking water supplies and leading to severe health and social problems such as cancer villages82.
Unfortunately, the mispricing of water – in China and elsewhere around the world – creates a disincentive for the industry to innovate, conserve and recycle, which perpetuates the problem. For example, China’s crop output is on par with the US’s, but fertiliser and pesticide use levels are more than four times greater per hectare of arable land83. The runoff from these agricultural inputs severely impacts water quality and leads to negative social outcomes.
VALUING WATER RISKOur emerging markets team analysed the ESG profiles of a group of six Chinese staples companies. As we reviewed one of them, a beverage company mainly operating in China, some troubling factors emerged. The company had some concerning governance characteristics and almost 80% of its facilities were in areas with high levels of water scarcity or stress.
This created an element of uncertainty about the sustainability of its operations. Given the water-related protests elsewhere in China, we were concerned that disputes with local communities could threaten their ability to operate in some areas. We also questioned whether they would be able to obtain an adequate supply of high quality water for all of their facilities. As a result of these factors, we viewed water stress as a material investment risk for this beverage company. Our concerns around water stress are based on the experience of other beverage manufacturers. In 2014, Coca-Cola was forced to scrap an expansion in Mehadiganj, India, because of conflict with local communities and regulators over access to scarce water resources85. In 2016, they closed another bottling plant in Kaladera, India, for the same reason. To navigate similar constraints in India, SABMiller (AB InBev) incurs incremental expenses to truck water to its breweries from locations where it is more plentiful. Water stress conditions also held up SABMiller’s expansion plans in Zambia, and its existing breweries have had to invest in significant water conservation and recycling initiatives86.
80 United Nations Development Programme. (n.d.) Sustainable Development Goals - Goal 6: Targets [Accessed February 2018].81 Council on Foreign Relations. (2013) China’s water challenge: Implications for the U.S. rebalance to Asia. 82 The Telegraph. (2013) China admits pollution has caused ‘cancer villages’ [Accessed February 2018].83 The World Bank. (2014) World Development Indicators - Fertilizer Consumption (kilograms per hectare of arable land) [Accessed February 2018].84 Bloomberg. (2014) Farmers fight Coca-Cola as India’s groundwater dries up. [Accessed February 2018].85 The Wall Street Journal. (2016) Coca-Cola closes plant in India [Accessed February 2018].86 Financial Times. (2015) Water supply threatens the flow of SABMiller’s Zambian expansion [Accessed February 2018].
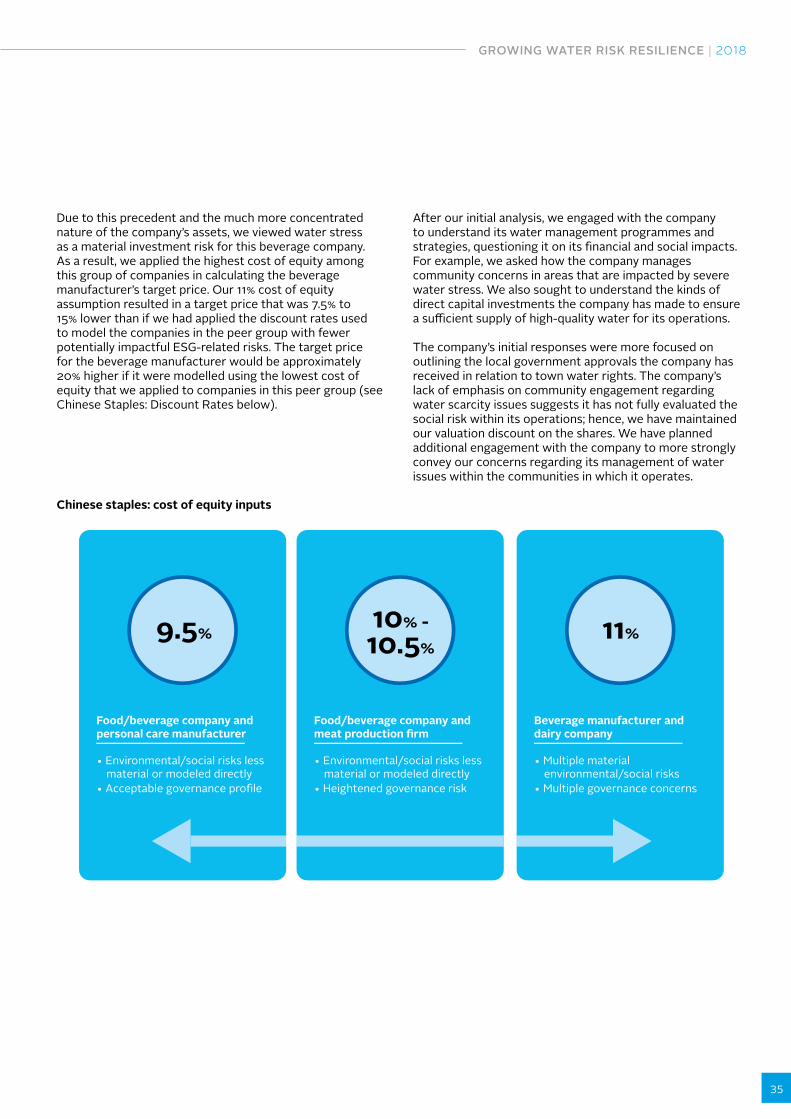
GROWING WATER RISK RESILIENCE | 2018
35
Due to this precedent and the much more concentrated nature of the company’s assets, we viewed water stress as a material investment risk for this beverage company. As a result, we applied the highest cost of equity among this group of companies in calculating the beverage manufacturer’s target price. Our 11% cost of equity assumption resulted in a target price that was 7.5% to 15% lower than if we had applied the discount rates used to model the companies in the peer group with fewer potentially impactful ESG-related risks. The target price for the beverage manufacturer would be approximately 20% higher if it were modelled using the lowest cost of equity that we applied to companies in this peer group (see Chinese Staples: Discount Rates below).
After our initial analysis, we engaged with the company to understand its water management programmes and strategies, questioning it on its financial and social impacts. For example, we asked how the company manages community concerns in areas that are impacted by severe water stress. We also sought to understand the kinds of direct capital investments the company has made to ensure a sufficient supply of high-quality water for its operations.
The company’s initial responses were more focused on outlining the local government approvals the company has received in relation to town water rights. The company’s lack of emphasis on community engagement regarding water scarcity issues suggests it has not fully evaluated the social risk within its operations; hence, we have maintained our valuation discount on the shares. We have planned additional engagement with the company to more strongly convey our concerns regarding its management of water issues within the communities in which it operates.
Chinese staples: cost of equity inputs
Food/beverage company and personal care manufacturer
• Environmental/social risks less material or modeled directly
• Acceptable governance pro�le
9.5%
Beverage manufacturer and dairy company
• Multiple material environmental/social risks
• Multiple governance concerns
11%
Food/beverage company and meat production �rm
• Environmental/social risks less material or modeled directly
• Heightened governance risk
10% -10.5%
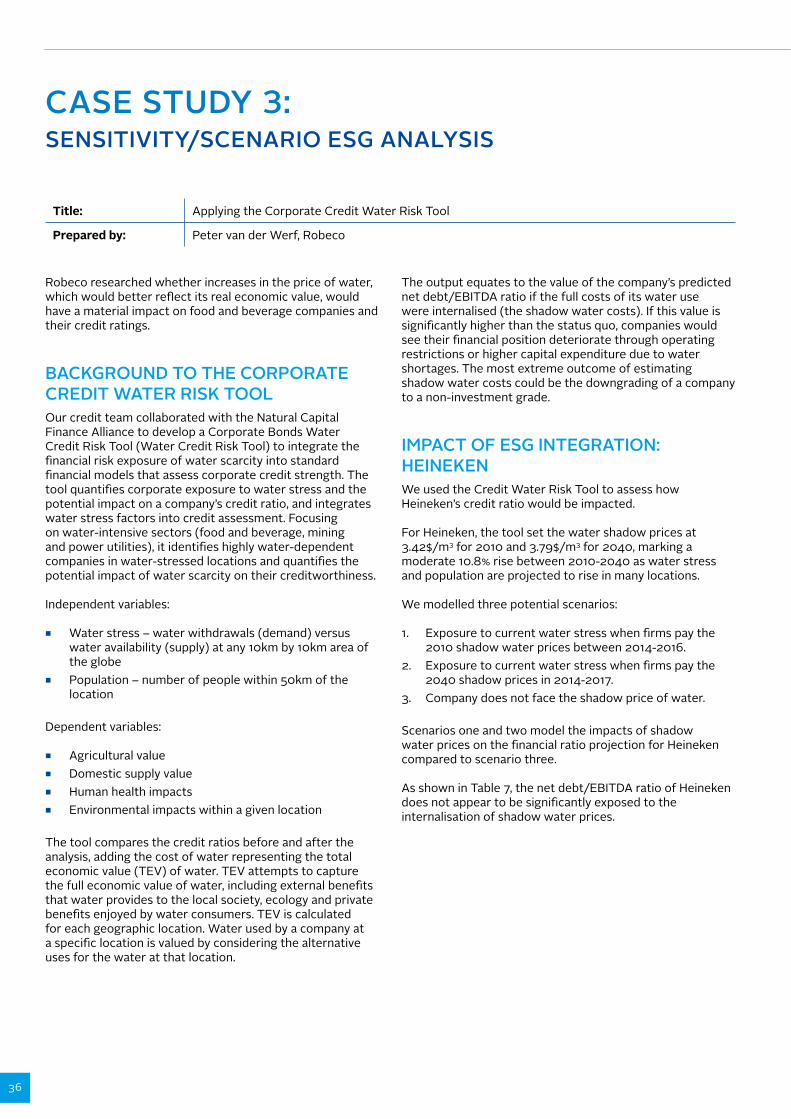
36
CASE STUDY 3: SENSITIVITY/SCENARIO ESG ANALYSIS
Title: Applying the Corporate Credit Water Risk Tool
Prepared by: Peter van der Werf, Robeco
Robeco researched whether increases in the price of water, which would better reflect its real economic value, would have a material impact on food and beverage companies and their credit ratings.
BACKGROUND TO THE CORPORATE CREDIT WATER RISK TOOLOur credit team collaborated with the Natural Capital Finance Alliance to develop a Corporate Bonds Water Credit Risk Tool (Water Credit Risk Tool) to integrate the financial risk exposure of water scarcity into standard financial models that assess corporate credit strength. The tool quantifies corporate exposure to water stress and the potential impact on a company’s credit ratio, and integrates water stress factors into credit assessment. Focusing on water-intensive sectors (food and beverage, mining and power utilities), it identifies highly water-dependent companies in water-stressed locations and quantifies the potential impact of water scarcity on their creditworthiness. Independent variables:
■ Water stress – water withdrawals (demand) versus water availability (supply) at any 10km by 10km area of the globe
■ Population – number of people within 50km of the location
Dependent variables:
■ Agricultural value ■ Domestic supply value ■ Human health impacts ■ Environmental impacts within a given location
The tool compares the credit ratios before and after the analysis, adding the cost of water representing the total economic value (TEV) of water. TEV attempts to capture the full economic value of water, including external benefits that water provides to the local society, ecology and private benefits enjoyed by water consumers. TEV is calculated for each geographic location. Water used by a company at a specific location is valued by considering the alternative uses for the water at that location.
The output equates to the value of the company’s predicted net debt/EBITDA ratio if the full costs of its water use were internalised (the shadow water costs). If this value is significantly higher than the status quo, companies would see their financial position deteriorate through operating restrictions or higher capital expenditure due to water shortages. The most extreme outcome of estimating shadow water costs could be the downgrading of a company to a non-investment grade.
IMPACT OF ESG INTEGRATION: HEINEKENWe used the Credit Water Risk Tool to assess how Heineken’s credit ratio would be impacted.
For Heineken, the tool set the water shadow prices at 3.42$/m3 for 2010 and 3.79$/m3 for 2040, marking a moderate 10.8% rise between 2010-2040 as water stress and population are projected to rise in many locations.
We modelled three potential scenarios:
1. Exposure to current water stress when firms pay the 2010 shadow water prices between 2014-2016.
2. Exposure to current water stress when firms pay the 2040 shadow prices in 2014-2017.
3. Company does not face the shadow price of water.
Scenarios one and two model the impacts of shadow water prices on the financial ratio projection for Heineken compared to scenario three.
As shown in Table 7, the net debt/EBITDA ratio of Heineken does not appear to be significantly exposed to the internalisation of shadow water prices.
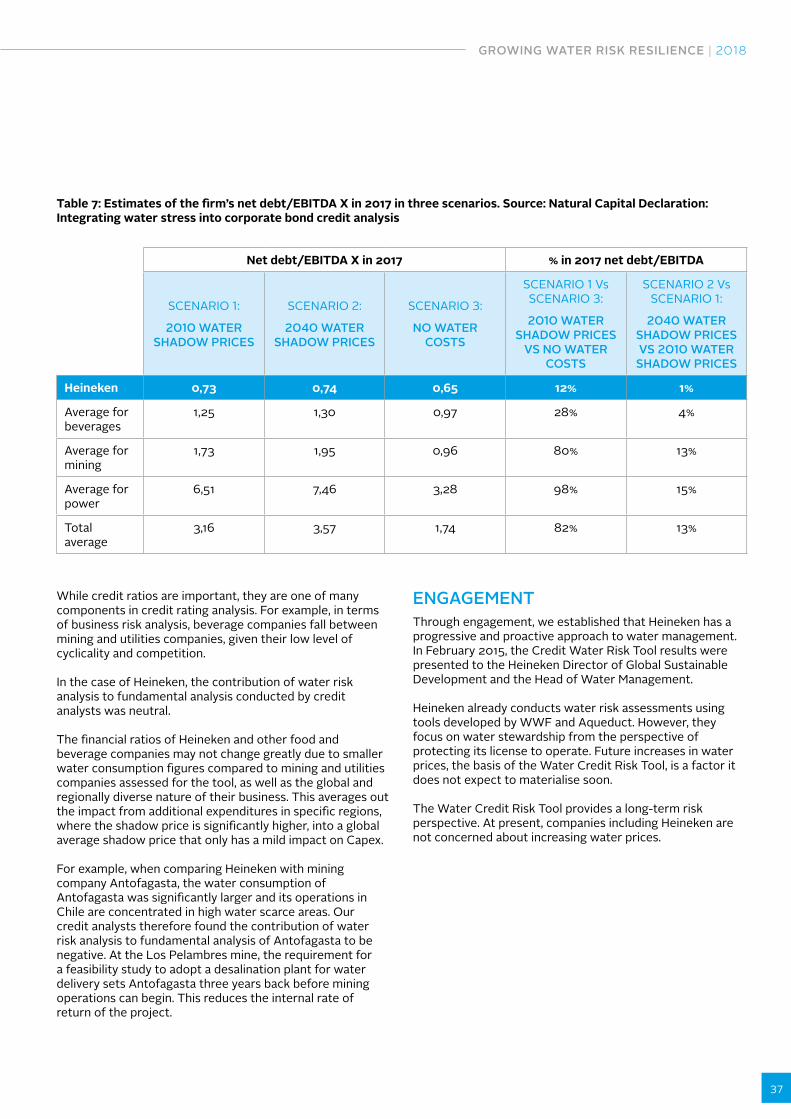
GROWING WATER RISK RESILIENCE | 2018
37
While credit ratios are important, they are one of many components in credit rating analysis. For example, in terms of business risk analysis, beverage companies fall between mining and utilities companies, given their low level of cyclicality and competition.
In the case of Heineken, the contribution of water risk analysis to fundamental analysis conducted by credit analysts was neutral.
The financial ratios of Heineken and other food and beverage companies may not change greatly due to smaller water consumption figures compared to mining and utilities companies assessed for the tool, as well as the global and regionally diverse nature of their business. This averages out the impact from additional expenditures in specific regions, where the shadow price is significantly higher, into a global average shadow price that only has a mild impact on Capex.
For example, when comparing Heineken with mining company Antofagasta, the water consumption of Antofagasta was significantly larger and its operations in Chile are concentrated in high water scarce areas. Our credit analysts therefore found the contribution of water risk analysis to fundamental analysis of Antofagasta to be negative. At the Los Pelambres mine, the requirement for a feasibility study to adopt a desalination plant for water delivery sets Antofagasta three years back before mining operations can begin. This reduces the internal rate of return of the project.
ENGAGEMENTThrough engagement, we established that Heineken has a progressive and proactive approach to water management. In February 2015, the Credit Water Risk Tool results were presented to the Heineken Director of Global Sustainable Development and the Head of Water Management.
Heineken already conducts water risk assessments using tools developed by WWF and Aqueduct. However, they focus on water stewardship from the perspective of protecting its license to operate. Future increases in water prices, the basis of the Water Credit Risk Tool, is a factor it does not expect to materialise soon.
The Water Credit Risk Tool provides a long-term risk perspective. At present, companies including Heineken are not concerned about increasing water prices.
Table 7: Estimates of the firm’s net debt/EBITDA X in 2017 in three scenarios. Source: Natural Capital Declaration: Integrating water stress into corporate bond credit analysis
Net debt/EBITDA X in 2017 % in 2017 net debt/EBITDA
SCENARIO 1:
2010 WATER SHADOW PRICES
SCENARIO 2:
2040 WATER SHADOW PRICES
SCENARIO 3:
NO WATER COSTS
SCENARIO 1 Vs SCENARIO 3:
2010 WATER SHADOW PRICES
VS NO WATER COSTS
SCENARIO 2 Vs SCENARIO 1:
2040 WATER SHADOW PRICES VS 2010 WATER
SHADOW PRICES
Heineken 0,73 0,74 0,65 12% 1%
Average for beverages
1,25 1,30 0,97 28% 4%
Average for mining
1,73 1,95 0,96 80% 13%
Average for power
6,51 7,46 3,28 98% 15%
Total average
3,16 3,57 1,74 82% 13%
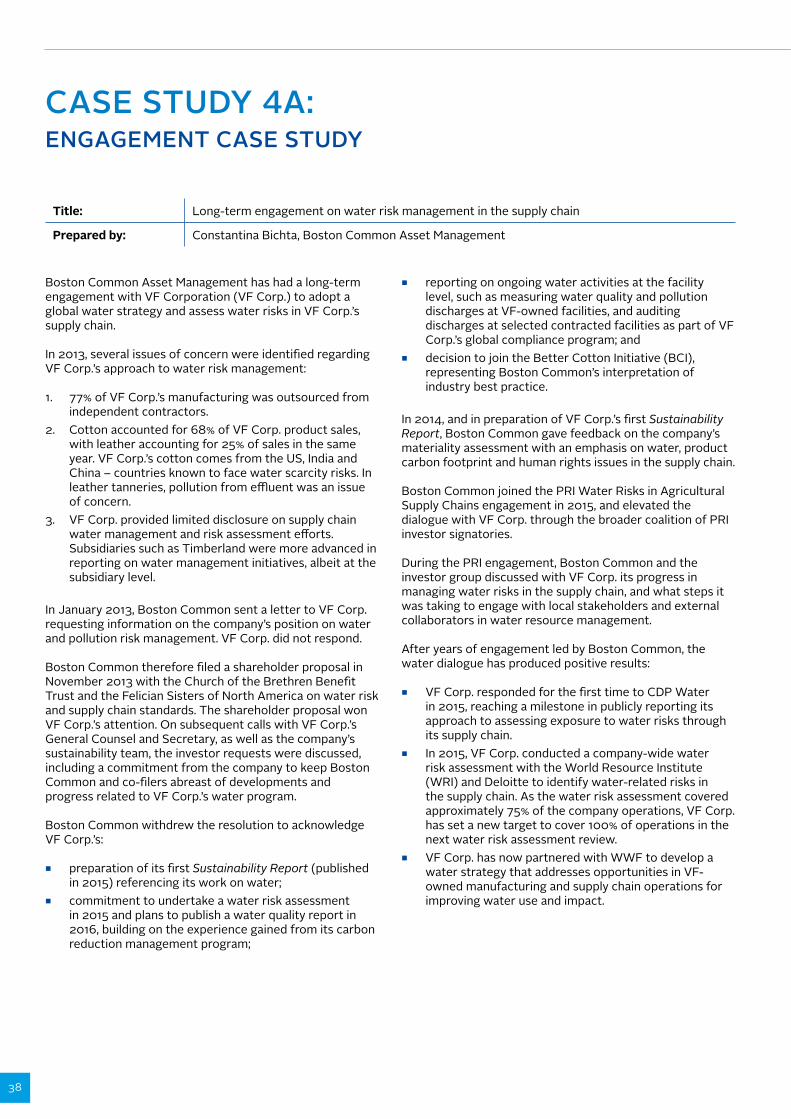
38
CASE STUDY 4A: ENGAGEMENT CASE STUDY
Title: Long-term engagement on water risk management in the supply chain
Prepared by: Constantina Bichta, Boston Common Asset Management
Boston Common Asset Management has had a long-term engagement with VF Corporation (VF Corp.) to adopt a global water strategy and assess water risks in VF Corp.’s supply chain.
In 2013, several issues of concern were identified regarding VF Corp.’s approach to water risk management:
1. 77% of VF Corp.’s manufacturing was outsourced from independent contractors.
2. Cotton accounted for 68% of VF Corp. product sales, with leather accounting for 25% of sales in the same year. VF Corp.’s cotton comes from the US, India and China – countries known to face water scarcity risks. In leather tanneries, pollution from effluent was an issue of concern.
3. VF Corp. provided limited disclosure on supply chain water management and risk assessment efforts. Subsidiaries such as Timberland were more advanced in reporting on water management initiatives, albeit at the subsidiary level.
In January 2013, Boston Common sent a letter to VF Corp. requesting information on the company’s position on water and pollution risk management. VF Corp. did not respond.
Boston Common therefore filed a shareholder proposal in November 2013 with the Church of the Brethren Benefit Trust and the Felician Sisters of North America on water risk and supply chain standards. The shareholder proposal won VF Corp.’s attention. On subsequent calls with VF Corp.’s General Counsel and Secretary, as well as the company’s sustainability team, the investor requests were discussed, including a commitment from the company to keep Boston Common and co-filers abreast of developments and progress related to VF Corp.’s water program.
Boston Common withdrew the resolution to acknowledge VF Corp.’s:
■ preparation of its first Sustainability Report (published in 2015) referencing its work on water;
■ commitment to undertake a water risk assessment in 2015 and plans to publish a water quality report in 2016, building on the experience gained from its carbon reduction management program;
■ reporting on ongoing water activities at the facility level, such as measuring water quality and pollution discharges at VF-owned facilities, and auditing discharges at selected contracted facilities as part of VF Corp.’s global compliance program; and
■ decision to join the Better Cotton Initiative (BCI), representing Boston Common’s interpretation of industry best practice.
In 2014, and in preparation of VF Corp.’s first Sustainability Report, Boston Common gave feedback on the company’s materiality assessment with an emphasis on water, product carbon footprint and human rights issues in the supply chain.
Boston Common joined the PRI Water Risks in Agricultural Supply Chains engagement in 2015, and elevated the dialogue with VF Corp. through the broader coalition of PRI investor signatories.
During the PRI engagement, Boston Common and the investor group discussed with VF Corp. its progress in managing water risks in the supply chain, and what steps it was taking to engage with local stakeholders and external collaborators in water resource management.
After years of engagement led by Boston Common, the water dialogue has produced positive results:
■ VF Corp. responded for the first time to CDP Water in 2015, reaching a milestone in publicly reporting its approach to assessing exposure to water risks through its supply chain.
■ In 2015, VF Corp. conducted a company-wide water risk assessment with the World Resource Institute (WRI) and Deloitte to identify water-related risks in the supply chain. As the water risk assessment covered approximately 75% of the company operations, VF Corp. has set a new target to cover 100% of operations in the next water risk assessment review.
■ VF Corp. has now partnered with WWF to develop a water strategy that addresses opportunities in VF-owned manufacturing and supply chain operations for improving water use and impact.
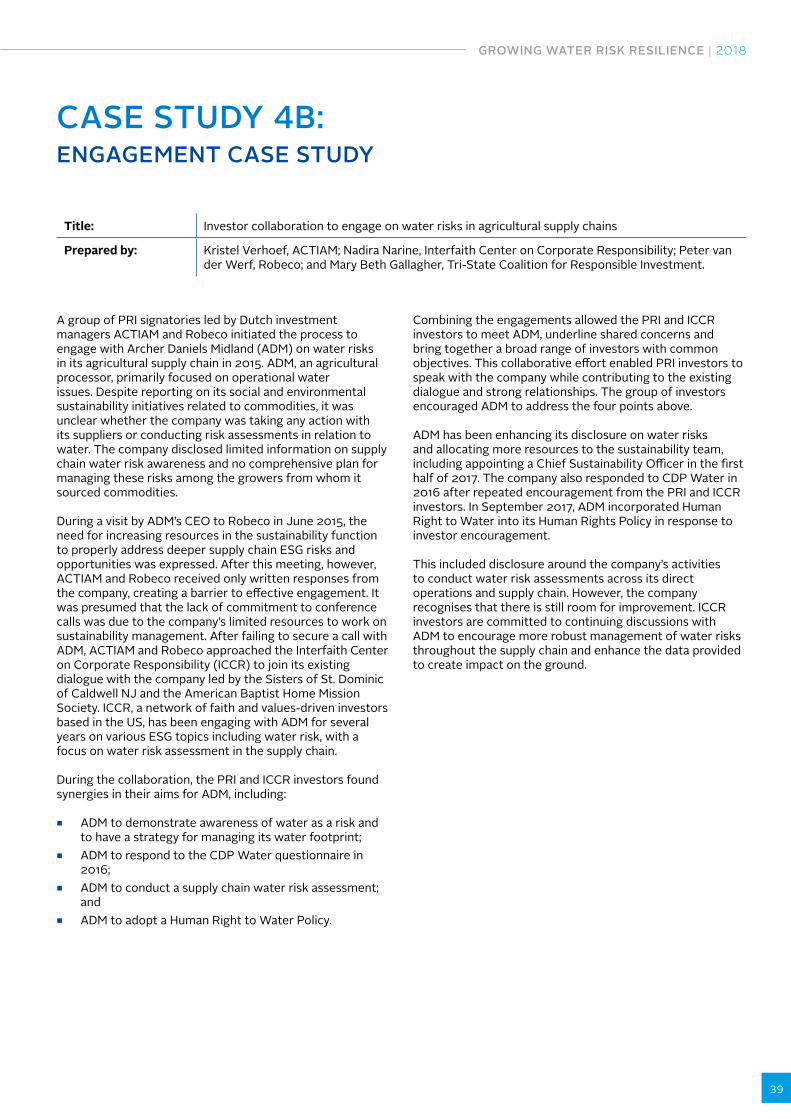
GROWING WATER RISK RESILIENCE | 2018
39
CASE STUDY 4B: ENGAGEMENT CASE STUDY
Title: Investor collaboration to engage on water risks in agricultural supply chains
Prepared by: Kristel Verhoef, ACTIAM; Nadira Narine, Interfaith Center on Corporate Responsibility; Peter van der Werf, Robeco; and Mary Beth Gallagher, Tri-State Coalition for Responsible Investment.
A group of PRI signatories led by Dutch investment managers ACTIAM and Robeco initiated the process to engage with Archer Daniels Midland (ADM) on water risks in its agricultural supply chain in 2015. ADM, an agricultural processor, primarily focused on operational water issues. Despite reporting on its social and environmental sustainability initiatives related to commodities, it was unclear whether the company was taking any action with its suppliers or conducting risk assessments in relation to water. The company disclosed limited information on supply chain water risk awareness and no comprehensive plan for managing these risks among the growers from whom it sourced commodities.
During a visit by ADM’s CEO to Robeco in June 2015, the need for increasing resources in the sustainability function to properly address deeper supply chain ESG risks and opportunities was expressed. After this meeting, however, ACTIAM and Robeco received only written responses from the company, creating a barrier to effective engagement. It was presumed that the lack of commitment to conference calls was due to the company’s limited resources to work on sustainability management. After failing to secure a call with ADM, ACTIAM and Robeco approached the Interfaith Center on Corporate Responsibility (ICCR) to join its existing dialogue with the company led by the Sisters of St. Dominic of Caldwell NJ and the American Baptist Home Mission Society. ICCR, a network of faith and values-driven investors based in the US, has been engaging with ADM for several years on various ESG topics including water risk, with a focus on water risk assessment in the supply chain.
During the collaboration, the PRI and ICCR investors found synergies in their aims for ADM, including:
■ ADM to demonstrate awareness of water as a risk and to have a strategy for managing its water footprint;
■ ADM to respond to the CDP Water questionnaire in 2016;
■ ADM to conduct a supply chain water risk assessment; and
■ ADM to adopt a Human Right to Water Policy.
Combining the engagements allowed the PRI and ICCR investors to meet ADM, underline shared concerns and bring together a broad range of investors with common objectives. This collaborative effort enabled PRI investors to speak with the company while contributing to the existing dialogue and strong relationships. The group of investors encouraged ADM to address the four points above.
ADM has been enhancing its disclosure on water risks and allocating more resources to the sustainability team, including appointing a Chief Sustainability Officer in the first half of 2017. The company also responded to CDP Water in 2016 after repeated encouragement from the PRI and ICCR investors. In September 2017, ADM incorporated Human Right to Water into its Human Rights Policy in response to investor encouragement.
This included disclosure around the company’s activities to conduct water risk assessments across its direct operations and supply chain. However, the company recognises that there is still room for improvement. ICCR investors are committed to continuing discussions with ADM to encourage more robust management of water risks throughout the supply chain and enhance the data provided to create impact on the ground.
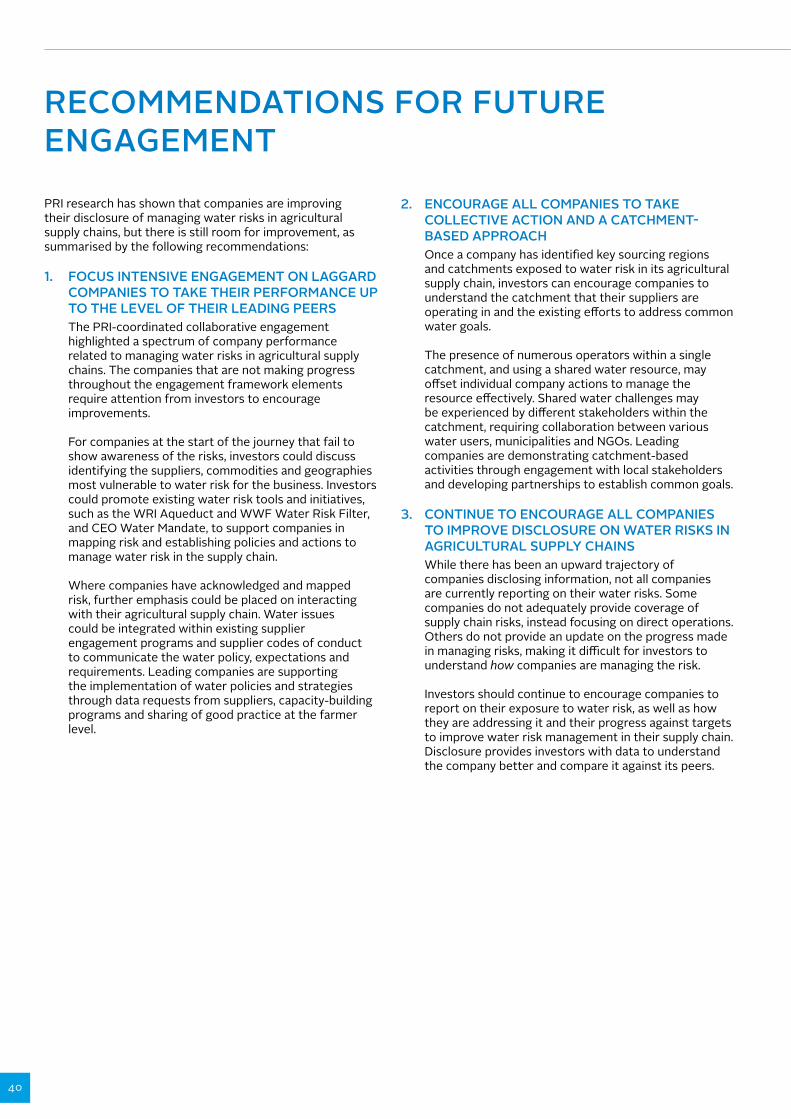
40
RECOMMENDATIONS FOR FUTURE ENGAGEMENT
PRI research has shown that companies are improving their disclosure of managing water risks in agricultural supply chains, but there is still room for improvement, as summarised by the following recommendations:
1. FOCUS INTENSIVE ENGAGEMENT ON LAGGARD COMPANIES TO TAKE THEIR PERFORMANCE UP TO THE LEVEL OF THEIR LEADING PEERS
The PRI-coordinated collaborative engagement highlighted a spectrum of company performance related to managing water risks in agricultural supply chains. The companies that are not making progress throughout the engagement framework elements require attention from investors to encourage improvements.
For companies at the start of the journey that fail to show awareness of the risks, investors could discuss identifying the suppliers, commodities and geographies most vulnerable to water risk for the business. Investors could promote existing water risk tools and initiatives, such as the WRI Aqueduct and WWF Water Risk Filter, and CEO Water Mandate, to support companies in mapping risk and establishing policies and actions to manage water risk in the supply chain.
Where companies have acknowledged and mapped risk, further emphasis could be placed on interacting with their agricultural supply chain. Water issues could be integrated within existing supplier engagement programs and supplier codes of conduct to communicate the water policy, expectations and requirements. Leading companies are supporting the implementation of water policies and strategies through data requests from suppliers, capacity-building programs and sharing of good practice at the farmer level.
2. ENCOURAGE ALL COMPANIES TO TAKE COLLECTIVE ACTION AND A CATCHMENT-BASED APPROACH
Once a company has identified key sourcing regions and catchments exposed to water risk in its agricultural supply chain, investors can encourage companies to understand the catchment that their suppliers are operating in and the existing efforts to address common water goals.
The presence of numerous operators within a single catchment, and using a shared water resource, may offset individual company actions to manage the resource effectively. Shared water challenges may be experienced by different stakeholders within the catchment, requiring collaboration between various water users, municipalities and NGOs. Leading companies are demonstrating catchment-based activities through engagement with local stakeholders and developing partnerships to establish common goals.
3. CONTINUE TO ENCOURAGE ALL COMPANIES TO IMPROVE DISCLOSURE ON WATER RISKS IN AGRICULTURAL SUPPLY CHAINS
While there has been an upward trajectory of companies disclosing information, not all companies are currently reporting on their water risks. Some companies do not adequately provide coverage of supply chain risks, instead focusing on direct operations. Others do not provide an update on the progress made in managing risks, making it difficult for investors to understand how companies are managing the risk.
Investors should continue to encourage companies to report on their exposure to water risk, as well as how they are addressing it and their progress against targets to improve water risk management in their supply chain. Disclosure provides investors with data to understand the company better and compare it against its peers.
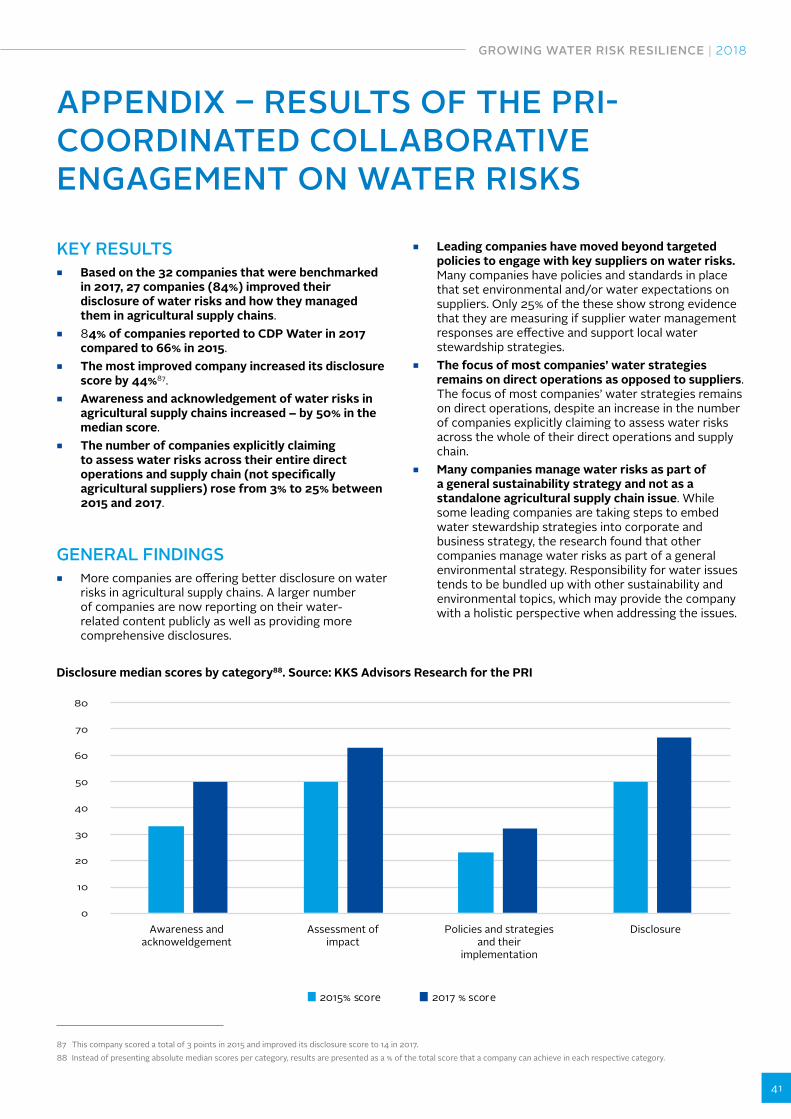
GROWING WATER RISK RESILIENCE | 2018
41
APPENDIX – RESULTS OF THE PRI-COORDINATED COLLABORATIVE ENGAGEMENT ON WATER RISKS
KEY RESULTS ■ Based on the 32 companies that were benchmarked
in 2017, 27 companies (84%) improved their disclosure of water risks and how they managed them in agricultural supply chains.
■ 84% of companies reported to CDP Water in 2017 compared to 66% in 2015.
■ The most improved company increased its disclosure score by 44%87.
■ Awareness and acknowledgement of water risks in agricultural supply chains increased – by 50% in the median score.
■ The number of companies explicitly claiming to assess water risks across their entire direct operations and supply chain (not specifically agricultural suppliers) rose from 3% to 25% between 2015 and 2017.
GENERAL FINDINGS ■ More companies are offering better disclosure on water
risks in agricultural supply chains. A larger number of companies are now reporting on their water-related content publicly as well as providing more comprehensive disclosures.
■ Leading companies have moved beyond targeted policies to engage with key suppliers on water risks. Many companies have policies and standards in place that set environmental and/or water expectations on suppliers. Only 25% of the these show strong evidence that they are measuring if supplier water management responses are effective and support local water stewardship strategies.
■ The focus of most companies’ water strategies remains on direct operations as opposed to suppliers. The focus of most companies’ water strategies remains on direct operations, despite an increase in the number of companies explicitly claiming to assess water risks across the whole of their direct operations and supply chain.
■ Many companies manage water risks as part of a general sustainability strategy and not as a standalone agricultural supply chain issue. While some leading companies are taking steps to embed water stewardship strategies into corporate and business strategy, the research found that other companies manage water risks as part of a general environmental strategy. Responsibility for water issues tends to be bundled up with other sustainability and environmental topics, which may provide the company with a holistic perspective when addressing the issues.
Disclosure median scores by category88. Source: KKS Advisors Research for the PRI
0
10
20
30
40
50
60
70
80
Awareness and acknoweldgement
2015% score 2017 % score
Assessment of impact
Policies and strategies and their
implementation
Disclosure
87 This company scored a total of 3 points in 2015 and improved its disclosure score to 14 in 2017. 88 Instead of presenting absolute median scores per category, results are presented as a % of the total score that a company can achieve in each respective category.
42
CREDITS
Authors: Gemma James (PRI) and Conor Linstead (WWF UK).
Contributions were made by: Justin Sloggett, Tom Barron, (PRI) and Alexis Morgan, Sarah Wade (WWF)
Editor: Eliane Chavagnon
Design: Alessandro Boaretto


The PRI is an investor initiative in partnership withUNEP Finance Initiative and the UN Global Compact.
United Nations Global Compact
The United Nations Global Compact is a call to companies everywhere to align their operations and strategies with ten universally accepted principles in the areas of hu-man rights, labour, environment and anti-corruption, and to take action in support of UN goals and issues embodied in the Sustainable Development Goals. The UN Global Compact is a leadership platform for the development, implementation and disclosure of responsible corporate practices. Launched in 2000, it is the largest cor-porate sustainability initiative in the world, with more than 8,800 companies and 4,000 non-business signatories based in over 160 countries, and more than 80 Local Networks.
More information: www.unglobalcompact.org
United Nations Environment Programme Finance Initiative (UNEP FI)
UNEP FI is a unique partnership between the United Nations Environment Programme (UNEP) and the global financial sector. UNEP FI works closely with over 200 financial institutions that are signatories to the UNEP FI Statement on Sustainable Development, and a range of partner organisations, to develop and promote linkages between sustainability and financial performance. Through peer-to-peer networks, research and training, UNEP FI carries out its mission to identify, promote, and realise the adoption of best environmental and sustainability practice at all levels of financial institution operations.
More information: www.unepfi.org
The Principles for Responsible Investment (PRI)
The PRI works with its international network of signatories to put the six Principles for Responsible Investment into practice. Its goals are to understand the investment implications of environmental, social and governance (ESG) issues and to support signatories in integrating these issues into investment and ownership decisions. The PRI acts in the long-term interests of its signatories, of the financial markets and economies in which they operate and ultimately of the environment and society as a whole.
The six Principles for Responsible Investment are a voluntary and aspirational set of investment principles that offer a menu of possible actions for incorporating ESG is-sues into investment practice. The Principles were developed by investors, for inves-tors. In implementing them, signatories contribute to developing a more sustainable global financial system.
More information: www.unpri.org