Growing Local Philanthropy 2009 Survey - Aspen Institute
70
Growing Local Philanthropy 2009 Survey Community Foundations and Geographic Affiliates Community Strategies Group
Transcript of Growing Local Philanthropy 2009 Survey - Aspen Institute

Growing Local Philanthropy
2009 Survey
Community Foundations and Geographic Affiliates
Community Strategies Group

Copyright © 2011 by The Aspen Institute
The Aspen Institute encourages the quotation or use of material from this report in publications or for
other professional purposes. However, we do ask that all material be properly credited, that a copy of
any publication in which this report is quoted be sent to the Institute, and that the Institute be informed
of any other professional use of material from this report.
Community Strategies Group
One Dupont Circle NW, Suite 700
Washington, DC 20036
202-736-5804 Fax:202-293-0525
www.aspencsg.org/rdp
Growing Local Philanthropy
2009 Survey
Community Foundations and
Geographic Affiliates
Report on the results of 2009 survey of the U.S. community foundation field
Conducted by the Aspen Institute Community Strategies Group
Published July 2011


Contents
Section 1: Introduction 1.1
Survey Objectives 1.2
Key Definitions 1.3
Survey Methods and Procedures 1.4
Acknowledgements 1.6
For More on the Survey 1.7
Section 2: Lead Findings 2.1
Incidence and Growth of Geographic Affiliates 2.2
Asset Development in Geographic Affiliates 2.3
Organization and Governance of Geographic Affiliates within Lead Foundations 2.3
Supporting the Growth and Work of Geographic Affiliates 2.4
Impact of Geographic Affiliates – The Geographic Affiliate Difference 2.5
Section 3: Profile of Responding Community Foundations 3.1
Geographic Location 3.2
Service Area 3.3
Total Assets 3.4
Endowed Assets 3.4
Foundation Age 3.5
Compliance with National Standards for U.S. Community Foundations™ 3.5
Rural Coverage 3.5
Section 4: Incidence and Growth of Geographic Affiliates 4.1
How many foundations have geographic affiliates? 4.2
How many geographic affiliates are there – and is that number increasing 4.2
What is the regional distribution of geographic affiliates? 4.3
Which foundations currently have geographic affiliates 4.4
When did all these geographic affiliates get started? 4.5
In what types of territory do geographic affiliates develop? 4.7
How are geographic affiliates concentrated? 4.8
Will there be more geographic affiliates in the future? 4.10
Section 5: Asset Development and Geographic Affiliates 5.1
How much do geographic affiliates hold in assets? 5.2
What proportion of geographic affiliate assets are endowed or non-endowed? 5.4
How are geographic affiliate fund assets organized? 5.4
Section 6: Organization and Governance of Geographic Affiliates 6.1
Which starts the action – the geographic affiliate or the lead foundation 6.2
What is the origin of geographic affiliates? 6.3
What names do lead staff and board use for their geographic affiliates? 6.4
What criteria, policies and governance structures do lead foundations have for 6.5
geographic affiliates?
Do community foundations and affiliate(s) define their relationship and roles? 6.6
How do geographic affiliates identify with their lead community foundation? 6.7
Do lead foundations allow their geographic affiliates to disaffiliate? 6.8
How many geographic affiliates have separate nonprofit status? 6.9
Are community foundations with affiliates in compliance with National Standards? 6.9
Section 7: Staffing the Growth and Work of Geographic Affiliates 7.1
Who is responsible for developing and administering geographic affiliates? 7.2
Do any geographic affiliates have their own staff? 7.3
How do lead foundations fund their affiliate work? 7.4
What level of effort do lead foundations devote to geographic affiliates? 7.5
Section 8: Rural Coverage 8.1
Are community foundations with geographic affiliates more rural? 8.2
Are geographic affiliates located in rural areas? 8.4
Section 9: The Geographic Affiliate Difference 9.1
What significant impacts do geographic affiliates have in their communities? 9.2
What challenges geographic affiliates the most? 9.3
What benefits do geographic affiliates offer a lead foundation? 9.3
What challenges do lead foundations face in developing geographic affiliates? 9.4
What measures help lead foundations gauge geographic affiliate progress? 9.5
Why do foundations without affiliates want to develop geographic affiliates? 9.6
Would lead foundations with affiliates do it again? 9.6

Aspen Institute Community Strategies Group | Growing Local Philanthropy 2009 Survey 1.1
1. SURVEY DESIGN, PROCESS AND
ACKNOWLEDGEMENTS

1.2 Growing Local Philanthropy 2009 Survey | Aspen Institute Community Strategies Group
1. SURVEY DESIGN, PROCESS AND ACKNOWLEDGEMENTS
This report presents findings from a survey of community foundations across the United States,
conducted in the summer of 2009 by the Aspen Institute Community Strategies Group (CSG). The survey
was designed to learn about emerging trends in the incidence of and experience with geographic
affiliates of community foundations in the United States. The Aspen Institute Community Strategies
Group conducted this survey with the assistance of a national advisory group of community foundation,
research and association leaders from across the country – including urban and rural, large and small
foundations. A complete list of the advisory group is in the Acknowledgements section.
In 2004, CSG conducted a similar groundbreaking survey which produced the first hard data for the field
illustrating the rapid growth in the number, size and reach of geographic affiliates.1 What we were able
to learn from this 2009 survey offers the field a five-year update on that data and more fully explores
the conditions, challenges and benefits of serving geographic affiliates.2
SURVEY OBJECTIVES
In recent years, observers have noticed two growing trends among community foundations. The first
trend is an apparent growth of community foundations and community foundation endowments
focused on rural areas and issues. The second trend is the emergence of geographic affiliates – that is,
funds or collections of funds within “lead” or “host” community foundations that:
Are dedicated to serving specific geographic areas or communities contained within and/or
different from the lead foundation’s service area.
Include fund development, grantmaking, community leadership and/or other activities guided
by a local advisory group drawn from the geographic area.
Except for the 2004 CSG survey, scant reliable nationwide data exists about these geographically
targeted affiliates of community foundations, and no “roadmap” shows how to establish, organize and
sustain them. Little documentation exists even to answer the most basic questions, such as:
How many geographic affiliates currently exist?
What types of community foundations house them?
How many are contemplated for the future?
How and why do lead foundations decide to establish geographic affiliates?
How are geographic affiliates staffed?
How does their coverage of rural and metropolitan areas compare?
How are geographic affiliates organized?
What is their overall and average asset value?
1 Growing Local Philanthropy: The Role and Reach of Community Foundations. Aspen Institute Community Strategies Group:
2004. http://www.aspencsg.org/rdp/_documents/resources/survey2b.pdf
2 A preliminary draft of the partial 2009 survey findings was distributed, initially at the October 2009 Fall Conference for
Community Foundations in San Antonio, Texas, and through a range of networks since. This report covers additional topics not included in that summary, updates the data analysis, and contains more complete analytic detail.
Aspen Institute Community Strategies Group | Growing Local Philanthropy 2009 Survey 1.3
“A geographic affiliate is a component fund (or collection of funds)
established within a “lead” community foundation
that serves a defined geographic area –
and is advised or governed by a group of people from the area it serves.
In short, a geographic affiliate is simply our universal term for a common
phenomenon that goes by many names in the field. They might be called
affiliates, area funds, regions, divisions, county funds, community funds,
geographic component funds, or something else entirely.”
“It is often said that you know rural when you see it.
So, for this survey, “rural” means those places that are outside a
major metropolitan area – meaning places that lie beyond
an urban city center and its surrounding ring of suburbs.”
This report, Growing Local Philanthropy 2009 Survey: Community Foundations and Geographic Affiliates,
addresses these questions, and provides from-the-ground data that offers some answers and perhaps
raises more questions. As a five-year follow up to CSG’s 2004 survey, it updates the current status and
further documents clear trends related to geographic affiliates in the U.S. community foundation field.
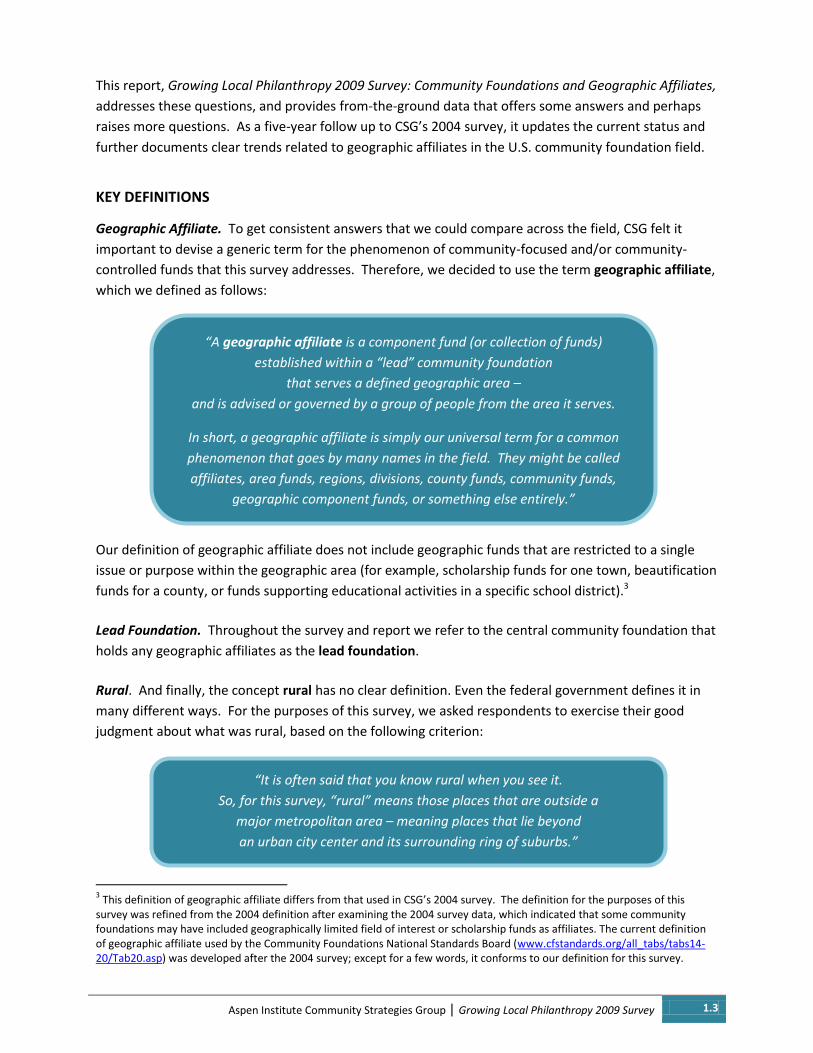
KEY DEFINITIONS
Geographic Affiliate. To get consistent answers that we could compare across the field, CSG felt it
important to devise a generic term for the phenomenon of community-focused and/or community-
controlled funds that this survey addresses. Therefore, we decided to use the term geographic affiliate,
which we defined as follows:
Our definition of geographic affiliate does not include geographic funds that are restricted to a single
issue or purpose within the geographic area (for example, scholarship funds for one town, beautification
funds for a county, or funds supporting educational activities in a specific school district).3
Lead Foundation. Throughout the survey and report we refer to the central community foundation that
holds any geographic affiliates as the lead foundation.
Rural. And finally, the concept rural has no clear definition. Even the federal government defines it in
many different ways. For the purposes of this survey, we asked respondents to exercise their good
judgment about what was rural, based on the following criterion:
3 This definition of geographic affiliate differs from that used in CSG’s 2004 survey. The definition for the purposes of this
survey was refined from the 2004 definition after examining the 2004 survey data, which indicated that some community foundations may have included geographically limited field of interest or scholarship funds as affiliates. The current definition of geographic affiliate used by the Community Foundations National Standards Board (www.cfstandards.org/all_tabs/tabs14-20/Tab20.asp) was developed after the 2004 survey; except for a few words, it conforms to our definition for this survey.
1.4 Growing Local Philanthropy 2009 Survey | Aspen Institute Community Strategies Group
SURVEY METHODS AND PROCEDURES
Developing the Survey
The survey questions and resulting trends of CSG’s 2004 Growing Local Philanthropy: The Role and
Reach of Community Foundations Survey provided a basis for the framework for the Growing Local
Philanthropy 2009 Survey. In addition, knowledge gleaned from over fifteen years of CSG’s involvement
in community foundation initiatives informed the survey tool.
CSG also closely worked with an advisory committee (listed in the Acknowledgements section) to refine
the questions and scope of the survey. The advisory committee also helped beta-test the survey and
provided feedback before the survey was finalized and released in the field.
The summer 2004 survey asked foundations to report data as of the end of calendar year 2003, and the
2009 survey asked for data as of close of calendar year 2008, signifying a five-year follow-up. But
because the specific respondents for the 2004 and 2009 surveys differed, direct comparison of 2004 and
2009 respondents’ data is not possible. Therefore CSG asked 2009 respondents to report their own
historic data in order to produce comparative data in the survey analysis: The 2009 survey included
several questions about a foundation’s state of affairs concerning geographic affiliates at specific dates –
including December 31, 1998; December 31, 2004; and December 31, 2008.
Fielding the Survey
Aspen CSG conducted the internet-based survey of community foundations across the United States in
the summer of 2009 to obtain information on the characteristics of geographic affiliates – both factual
“hard data” and experience-based perceptions and opinions.4 To produce as high a level of response as
possible, CSG engaged in a series of reinforcing contacts with all identified community foundations in
the United States, which numbered 743 at the time of the survey.5
The process for distributing the survey and collecting the results was as follows:
CSG first sent an email letter with a link to the survey’s URL to all foundation lead contacts with
email addresses, inviting them to participate in the 2009 survey. (If the research team knew of
someone else in the foundation better situated to be the designated respondent in the survey,
the contact was made with that individual instead of the CEO.)
CSG next sent a letter by regular U.S. post to the same contact at each of the foundations – and
to any contacts on the overall community foundation list who lacked email addresses –
requesting participation in the web-based survey if they had not yet completed it. CSG also
provided the option of completing the survey over the phone if access to internet was not
readily available. (No foundation ended up utilizing this last option.)
4 The survey was conducted from July 30 to September 25, 2009. See the complete survey questionnaire at:
http://www.aspencsg.org/survey/AspenCSG2009SurveyQuestions.pdf 5 CSG used the best available list of community foundations from the Council on Foundations, the Columbus Foundation’s
annual survey list, and the COF community foundation locator as its base to construct this list, augmenting it with additional or updated contact information available through CSG’s contacts and lists developed over 15 years of managing and working on a variety of community foundation initiatives.
Aspen Institute Community Strategies Group | Growing Local Philanthropy 2009 Survey 1.5
Along with every form of the invitation letter, CSG provided a Cheat Sheet for Survey Takers. To
help respondents more quickly and accurately respond to the survey, the Cheat Sheet included
important definitions used in the survey and listed the information survey takers might need
(depending on the community foundation’s situation) to answer some of the survey questions.
As an additional incentive, every foundation that answered the survey was entered in a drawing
for a $1000 contribution to their foundation that they could use as they wish. The Community
Foundation of Charles County in Maryland won the drawing.
CSG sent out regular reminders about completing the survey to the community foundation key
contacts for which it had email addresses – weeding out those who had completed the survey.
In the closing weeks, as time permitted, CSG staff contacted a targeted list of remaining non-
responding foundations by telephone and/or email to encourage cooperation and increase the
survey completion rate.
Finally CSG extended the initial survey deadline (the initial deadline was scheduled for August
21, 2009) several times to encourage as much participation from community foundations as
possible. The last survey response was submitted on September 25, 2009.
Only lead foundations are included in these survey results. While some geographic affiliates did
answer the survey, they were identified by the survey tool and eliminated from this analysis.
As a result of these efforts, of the 743 community foundations invited to participate, 270 responded6 – a
solid completion rate of 36%. That is the same completion rate – though a different set of responding
foundations – as CSG’s Growing Local Philanthropy 2004 survey.
Since a main objective of this research was to document the growth and characteristics of geographic
affiliates, the foundations reporting that they do not have geographic affiliates or do not have one yet
(133 out of 270, or 49%) were asked a shorter set of questions.7 As a result, much of the report is based
on the subsample of responding foundations that have at least one geographic affiliate (n=137).
The data presented in this report are not weighted. Adjusting via weighting was considered but rejected
because the research is regarded as exploratory, and because either it was unclear which available
variables would be the best basis for weighting or the relevant variable information simply did not exist.
Nevertheless, with a few exceptions (noted in the Profile of Responding Community Foundations), the
responding community foundations are reasonably representative of the larger community foundation
field in the United States.
6 Readers are urged to be mindful of the limitations of survey research methods and of “sampling error,” which is the range of
expected variation in results due to interviewing a random sample rather than an entire population. In this survey, questions answered by the full sample of 270 community foundations are subject to a margin of error of plus or minus approximately 5 percentage points at the 95 percent level of confidence. When the answers of subgroups are reported, the margin of error is higher. Because of other sources of possible error inherent in all surveys, the sampling variance alone is apt to understate the actual extent to which survey results differ from true population values. While every effort was made to identify such errors, they are often difficult or impossible to identify and quantify. 7 It should be clear from the text which foundations a particular statistic is based upon (for example, all foundations in the
sample, those with affiliates, those without affiliates, or subsets of these primary segments). Whenever there might be any ambiguity, the sample base is specified.

1.6 Growing Local Philanthropy 2009 Survey | Aspen Institute Community Strategies Group
ACKNOWLEDGEMENTS
Survey Originators and Analysts. The Growing Local Philanthropy: 2009 Survey was developed and
conducted by the staff of the Aspen Institute Community Strategies Group (CSG) during the summer of
2009. The Aspen Institute Community Strategies Group staff team that developed and fielded the
survey included:
Kelly Malone. Program Associate
John Molinaro. Co-Director
Elsa Noterman. Communication and Research Associate
Janet Topolsky. Co-Director
The survey analysis and report were prepared and authored by Elsa Noterman, with assistance from
Janet Topolsky and John Molinaro.
Survey Advisory Committee. CSG conducted this survey with the assistance of a national advisory
committee of community foundation, research and association leaders from across the country. This
group helped develop and hone the survey questions, “beta tested” the survey, and offered insight,
analysis and suggestions for this survey results report. We thank them for their wisdom and for their
valuable critique, which helped sharpen the wording, logic, focus and order of the survey and the results
presentation.
Sheryl Colclough, Affiliate Director, Arkansas Community Foundation
Angela Dethlefs-Trettin, Director, Iowa Council of Foundations
Carolyn Doelling. Director of Philanthropic Services, East Bay Community Foundation (CA)
Renee Irvin, Department of Planning, Public Policy and Management, University of Oregon
Gary LaPlant, Executive Director, Community Foundation of the Upper Peninsula (MI)
Elizabeth Myrick, Director, Community Giving Resource/SmartLink.org (DC)
Darcy Oman, President and CEO, The Community Foundation Serving Richmond and Central
Virginia
Carla Roberts, President & CEO, Fremont Area Community Foundation (MI) (In 2009: Vice
President of Affiliates, Arizona Community Foundation)
Heather Scott, Managing Director, Community Foundation Services, Council on Foundations (VA)
(In 2009: Director, Community Foundation Services, Council on Foundations)
Judy Sjostedt, Executive Director, Parkersburg Area Community Foundation & the Regional
Affiliates (WV)
Peter Taylor, Vice President, Program Development & Grantmaking Services, Maine Community
Foundation
Jeff Yost, President and CEO, Nebraska Community Foundation
Survey Publication. The survey was funded by the Aspen Institute Community Strategies Group with
partial support from the Program on Philanthropy and Social Innovation at the Aspen Institute.
Aspen Institute Community Strategies Group | Growing Local Philanthropy 2009 Survey 1.7
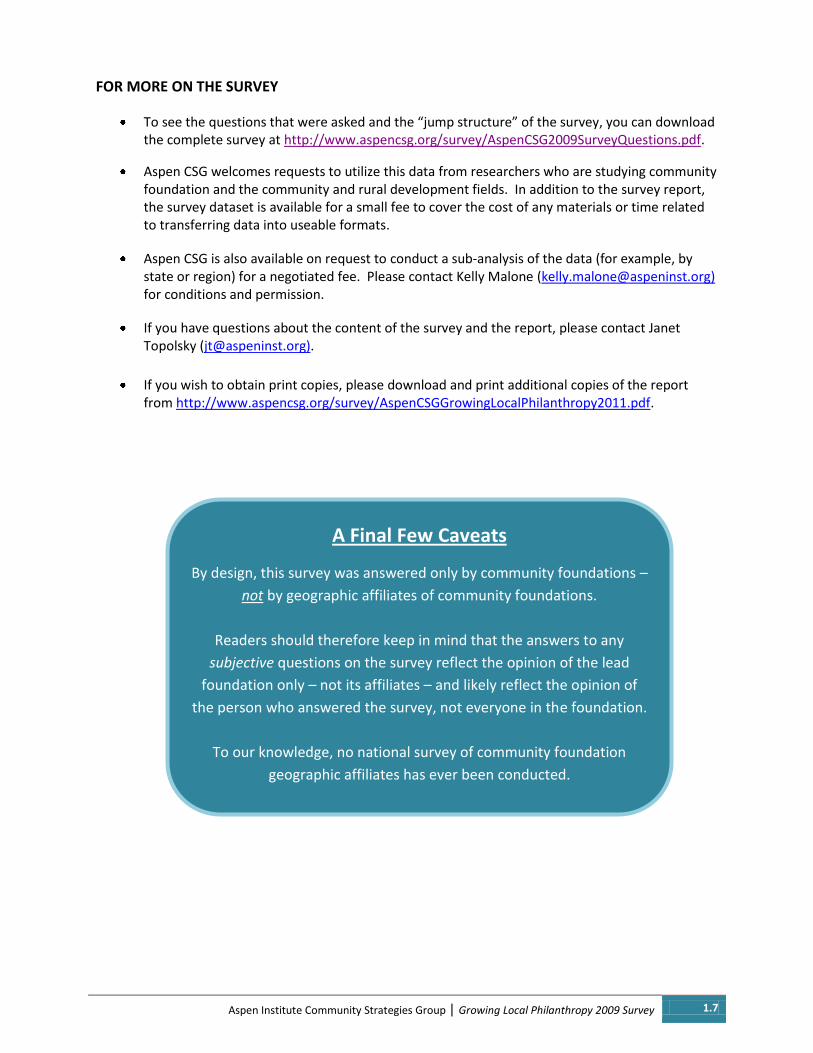
A Final Few Caveats
By design, this survey was answered only by community foundations –
not by geographic affiliates of community foundations.
Readers should therefore keep in mind that the answers to any
subjective questions on the survey reflect the opinion of the lead
foundation only – not its affiliates – and likely reflect the opinion of
the person who answered the survey, not everyone in the foundation.
To our knowledge, no national survey of community foundation
geographic affiliates has ever been conducted.
FOR MORE ON THE SURVEY
To see the questions that were asked and the “jump structure” of the survey, you can download the complete survey at http://www.aspencsg.org/survey/AspenCSG2009SurveyQuestions.pdf.
Aspen CSG welcomes requests to utilize this data from researchers who are studying community foundation and the community and rural development fields. In addition to the survey report, the survey dataset is available for a small fee to cover the cost of any materials or time related to transferring data into useable formats.
Aspen CSG is also available on request to conduct a sub-analysis of the data (for example, by state or region) for a negotiated fee. Please contact Kelly Malone ([email protected]) for conditions and permission.
If you have questions about the content of the survey and the report, please contact Janet Topolsky ([email protected]).
If you wish to obtain print copies, please download and print additional copies of the report from http://www.aspencsg.org/survey/AspenCSGGrowingLocalPhilanthropy2011.pdf.

Aspen Institute | Growing Local Philanthropy 2009 Survey 2.1
2. LEAD FINDINGS
2.2 Growing Local Philanthropy 2009 Survey | Aspen Institute Community Strategies Group
2. LEAD FINDINGS
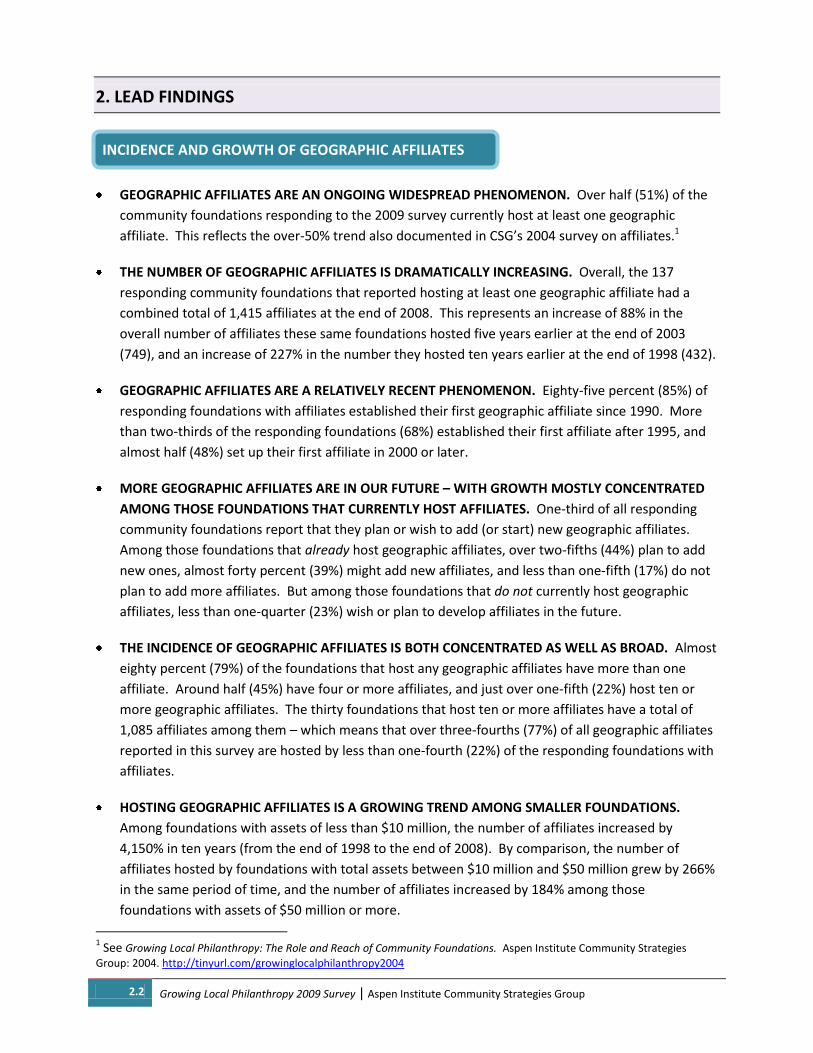
GEOGRAPHIC AFFILIATES ARE AN ONGOING WIDESPREAD PHENOMENON. Over half (51%) of the
community foundations responding to the 2009 survey currently host at least one geographic
affiliate. This reflects the over-50% trend also documented in CSG’s 2004 survey on affiliates.1
THE NUMBER OF GEOGRAPHIC AFFILIATES IS DRAMATICALLY INCREASING. Overall, the 137
responding community foundations that reported hosting at least one geographic affiliate had a
combined total of 1,415 affiliates at the end of 2008. This represents an increase of 88% in the
overall number of affiliates these same foundations hosted five years earlier at the end of 2003
(749), and an increase of 227% in the number they hosted ten years earlier at the end of 1998 (432).
GEOGRAPHIC AFFILIATES ARE A RELATIVELY RECENT PHENOMENON. Eighty-five percent (85%) of
responding foundations with affiliates established their first geographic affiliate since 1990. More
than two-thirds of the responding foundations (68%) established their first affiliate after 1995, and
almost half (48%) set up their first affiliate in 2000 or later.
MORE GEOGRAPHIC AFFILIATES ARE IN OUR FUTURE – WITH GROWTH MOSTLY CONCENTRATED
AMONG THOSE FOUNDATIONS THAT CURRENTLY HOST AFFILIATES. One-third of all responding
community foundations report that they plan or wish to add (or start) new geographic affiliates.
Among those foundations that already host geographic affiliates, over two-fifths (44%) plan to add
new ones, almost forty percent (39%) might add new affiliates, and less than one-fifth (17%) do not
plan to add more affiliates. But among those foundations that do not currently host geographic
affiliates, less than one-quarter (23%) wish or plan to develop affiliates in the future.
THE INCIDENCE OF GEOGRAPHIC AFFILIATES IS BOTH CONCENTRATED AS WELL AS BROAD. Almost
eighty percent (79%) of the foundations that host any geographic affiliates have more than one
affiliate. Around half (45%) have four or more affiliates, and just over one-fifth (22%) host ten or
more geographic affiliates. The thirty foundations that host ten or more affiliates have a total of
1,085 affiliates among them – which means that over three-fourths (77%) of all geographic affiliates
reported in this survey are hosted by less than one-fourth (22%) of the responding foundations with
affiliates.
HOSTING GEOGRAPHIC AFFILIATES IS A GROWING TREND AMONG SMALLER FOUNDATIONS.
Among foundations with assets of less than $10 million, the number of affiliates increased by
4,150% in ten years (from the end of 1998 to the end of 2008). By comparison, the number of
affiliates hosted by foundations with total assets between $10 million and $50 million grew by 266%
in the same period of time, and the number of affiliates increased by 184% among those
foundations with assets of $50 million or more.
1 See Growing Local Philanthropy: The Role and Reach of Community Foundations. Aspen Institute Community Strategies
Group: 2004. http://tinyurl.com/growinglocalphilanthropy2004
INCIDENCE AND GROWTH OF GEOGRAPHIC AFFILIATES

Aspen Institute | Growing Local Philanthropy 2009 Survey 2.3
HOSTING GEOGRAPHIC AFFILIATES IS A GROWING TREND AMONG NEWER FOUNDATIONS.
Community foundations vary considerably as to when during their organizational lifetime they
established their first geographic affiliate. Older foundations took significantly longer to establish
their first geographic affiliate than newer foundations. Community foundations established 30 or
more years ago hosted their first geographic affiliate at an average age of 38 years. Newer
foundations – those established 10 to 29 years ago and those established less than 10 years ago –
set up their first affiliate an at average of nine years and five years of age, respectively. Of course,
younger foundations may have been more likely to do so because it is now a known phenomenon.
SMALLER FOUNDATIONS HOLD A GREATER PERCENTAGE OF THEIR ENDOWED ASSETS IN
GEOGRAPHIC AFFILIATES. Geographic affiliates of foundations with assets of $50 million or more
constitute 11% of these foundations’ total endowed assets. By comparison, geographic affiliates
account for 28% of the endowed assets of lead foundations with under $10 million in endowment.
NEWER FOUNDATIONS HOLD A GREATER PERCENTAGE OF THEIR ENDOWED ASSETS IN
GEOGRAPHIC AFFILIATES. Older foundations generally have a smaller percentage of their endowed
assets in geographic affiliates. The affiliates of foundations established 30 or more years ago
account for an average of 14% of the lead foundations total endowed assets. In comparison those
foundations established less than 10 years ago hold an average of almost half (49%) of their
endowed assets is their affiliates.
GEOGRAPHIC AFFILIATES BUILD MORE ENDOWED THAN NON-ENDOWED ASSETS. The majority of
the responding community foundations report that their geographic affiliates had endowed dollars
at the end of 2008. Over seventy percent (71%) of the foundations say that most of their geographic
affiliates consist of more endowed than non-endowed assets, while around twenty percent (21%) of
the foundations report that most of their affiliates have a preponderance of non-endowed assets.
GEOGRAPHIC AFFILIATES ARE SEEKING NEW DONORS. Of the total number of affiliates hosted by
the responding community foundations, over four-fifths (82%) are reported to be currently seeking
new donors, while less than one-sixth (16%) are reported to not be seeking new donors.
MANY COMMUNITY FOUNDATIONS ACTIVELY DEVELOP GEOGRAPHIC AFFILIATES. Almost three-
fifths (58%) of the community foundations with affiliates currently have, or have had in the past, a
specific outreach program to develop geographic affiliates. Nearly two-fifths (39%) of the
foundations have never had a specific outreach program and are willing to develop affiliates only
when local groups approach them. Foundations with a current outreach program for developing
geographic affiliates average a higher number of affiliates than those without a program.
ASSET DEVELOPMENT IN GEOGRAPHIC AFFILIATES
ORGANIZATION AND GOVERNANCE OF GEOGRAPHIC AFFILIATES
WITHIN LEAD FOUNDATIONS

2.4 Growing Local Philanthropy 2009 Survey | Aspen Institute Community Strategies Group
MOST GEOGRAPHIC AFFILIATES ORIGINATED FROM GROUP EFFORT RATHER THAN A SINGLE
DONOR. Nearly three-fourths (71%) of the total affiliates reported were set up by a group of people
– rather than by a single donor (21%), by a conversion of assets (6%) or by other means (2%).
COMMUNITY FOUNDATIONS DO NOT HAVE A NAMING CONVENTION FOR WHAT WE CALL
“GEOGRAPHIC AFFILIATES.” Community foundations use a wide diversity of names for what
qualifies as a geographic affiliate – there is no one dominant name in the field.
LEAD FOUNDATIONS ARE SETTING THRESHOLD CRITERIA FOR GEOGRAPHIC AFFILIATES. About
half (52%) of the community foundations with affiliates report that they have some criteria for
establishing geographic affiliates. The most important criteria include: 1) a sufficient number of
actively involved local leaders (67%); 2) an ample upfront local financial commitment (56%); and 3)
clear local philanthropic potential (56%).
LEAD FOUNDATIONS ARE CREATING GEOGRAPHIC AFFILIATE START-UP AND DISAFFILIATION
POLICIES. About half (49%) of the responding foundations with affiliates say that they have an
agreed-upon written process and set of procedures for starting and developing geographic affiliates.
If geographic affiliates ever wish to separate from the lead foundation, almost half (49%) of the
foundations with affiliates allow their affiliates to disaffiliate.
LEAD FOUNDATIONS ARE FORMALIZING THEIR RELATIONSHIPS WITH GEOGRAPHIC AFFILIATES.
Seventy percent (70%) of community foundations with geographic affiliates have a formalized set of
expectations and responsibilities that delineate respective roles for the lead foundation and affiliate.
Over four-fifths (84%) of the responding foundations with affiliates utilize some form of signed
agreement to define the relationship between the lead foundation and a geographic affiliate.
MANY GEOGRAPHIC AFFILIATES HAVE NONPROFIT STATUS. Over one-third (35%) of the
community foundations with affiliates reported that one or more of their geographic affiliates had
independent 501(c)(3) status. Among those community foundations that reported any affiliates
with 501(c)(3) status, an average of 42% of their affiliates have that status. Twelve percent (173) of
the total geographic affiliates reported in the survey had 501(c)(3) status at the end of 2008.
COMMUNITY FOUNDATIONS WITH GEOGRAPHIC AFFILIATES ARE MORE LIKELY TO HAVE
ACHIEVED COMPLIANCE WITH NATIONAL STANDARDS THAN THOSE WITHOUT AFFILIATES. While
nine-tenths (90%) of the responding foundations with affiliates reported that they had received
confirmation of compliance with National Standards for U.S. Community Foundations ™, less than
seven-tenths (68%) of those foundations without affiliates had received confirmation of compliance.
GEOGRAPHIC AFFILIATES ARE BEGINNING TO STAFF LOCALLY. Almost one third (32%) of the
community foundations with geographic affiliates report that at least one of their affiliates currently
has its own full- or part-time staff member who works directly for the affiliate board or advisory
committee. In these cases half (50%) the affiliates pay for their own staff members.
SUPPORTING THE GROWTH AND WORK OF GEOGRAPHIC AFFILIATES

Aspen Institute | Growing Local Philanthropy 2009 Survey 2.5
LEAD FOUNDATIONS FACE TIME AND FINANCIAL RESOURCE CHALLENGES IN ESTABLISHING AND
DEVELOPING GEOGRAPHIC AFFILIATES. Foundations with affiliates report that their top two
organizational challenges in establishing and developing affiliates are: 1) the lack of foundation time
to focus on affiliates (57%); and 2) the lack of foundation financial resources (44%).
GEOGRAPHIC AFFILIATE COMMUNITIES INITIALLY FIND IT DIFFICULT TO GRASP “ENDOWMENT.”
Over two-fifths (43%) of the foundations with affiliates report that affiliate communities experience
significant difficulty in grasping the concept of endowment – which emerges as one leading
challenge for affiliate leaders in establishing and developing geographic affiliates.
COMMUNITY FOUNDATIONS ARE BEGINNING TO USE FORMAL MEASURES OTHER THAN ASSET
SIZE TO EVALUATE THEIR GEOGRAPHIC AFFILIATES. Thirty-six percent (36%) of the responding
community foundations with affiliates use formal measures besides asset size to periodically gauge
the progress and success of their affiliates. The top measures besides asset size include grantmaking
measures (number of grants made, impact of grants, etc.), as well as giving, donor and fund activity
measures (number of gifts, donor engagement, etc.).
GEOGRAPHIC AFFILIATES OFFER BOTH ASSET BUILDING AND COMMUNITY LEADERSHIP BENEFITS
TO THE LEAD FOUNDATION. The most important benefits to lead foundations of having geographic
affiliates that the responding foundations identified are: 1) they build locally controlled
philanthropic assets in places with few or none (50%); and 2) they help communities address their
local needs and issues (40%).
MANY COMMUNITY FOUNDATIONS CREDIT AFFILIATES WITH INCREASES IN SOCIAL CAPITAL IN
THEIR COMMUNITIES. When asked for the top three most significant impacts geographic affiliates
have had in their communities, around one-fifth (19%) of the community foundations with affiliates
reported that their affiliates have built social capital within the affiliate community. Almost three-
fifths (57%) of the community foundations that have no current geographic affiliates but hope to
develop some, expect that developing affiliates will build social capital within the region.
GROWTH IN GEOGRAPHIC AFFILIATES RESPRESENTS GROWTH IN RURAL PHILANTHROPY. The
majority (75%) of the geographic affiliates reported by the sample community foundations in the
survey serve rural areas.
LEAD FOUNDATIONS WITH AFFILIATES WOULD DO IT AGAIN IF THEY WERE STARTING OVER. More
than nine out of ten (91%) of the responding community foundations currently with affiliates
reported that if their foundation was starting out again, knowing what they now know, they would
still seek to have and/or agree to host geographic affiliates.
IMPACT OF GEOGRAPHIC AFFILIATES – THE GEOGRAPHIC AFFILIATE DIFFERENCE


Aspen Institute Community Strategies Group | Growing Local Philanthropy 2009 Survey 3.1
3. PROFILE OF RESPONDING COMMUNITY
FOUNDATIONS

3.2 Growing Local Philanthropy 2009 Survey | Aspen Institute Community Strategies Group
3. PROFILE OF RESPONDING COMMUNITY FOUNDATIONS
GEOGRAPHIC LOCATION
Figure 3.1 illustrates the states in each of the U.S. Census regions referred to in this report and shows
the proportion of the responding community foundations from each one. Among the responding
foundations, 14% are located in the Northeast, 43% in the Midwest, 26% in the South, and 17% in the
West.
Figure 3.1
Regional distribution of sample
The survey sample includes community foundations located in every U.S. state except for Utah, New Jersey, Rhode Island and Delaware.
The responding community foundations are fairly representative, in their regional distribution, of the
entire population of community foundations in the United States. There is, however, a slight
overrepresentation of community foundations in the South and underrepresentation of the Midwest
regions among the responding foundations, compared to the total population of community
foundations. See Figure 3.2.
17%
26%
14%
43%
This section presents some key characteristics of the sample of foundations that participated
in the survey study.
Profile Summary: We advise readers to be aware of the profile of foundations that
participated in the survey as you review the results: More than one third (36%) of all 744
U.S. community foundations that existed in 2008 are represented, and that sample of 270
community foundations encompasses considerable size, age and geographic diversity.
When compared to the distribution of all community foundations, the foundations that
responded tend to be larger than average (in terms of assets), slightly less likely to be
based in the Midwest, and slightly more likely to be in the South.

Aspen Institute Community Strategies Group | Growing Local Philanthropy 2009 Survey 3.3
* Figure 3.2
Regional distribution of sample compared to total community foundation population*
* Figure 3.2 is a regional distribution comparison with the 743 identified community foundations in the U.S. in 2009.
1
SERVICE AREA
Almost two-fifths (38%) of the responding community foundations report that their service area is a
subregion within one state (e.g., a small town or city with surrounding rural area, multiple counties
within one state, etc.), more than one-third (35%) cover a countywide (one county) area, 7% serve a
metropolitan area (major city and suburbs), 7% serve a region that includes pieces of more than one
state, 7% serve an entire state, and 5% serve only one city or town. See Figure 3.3.
Figure 3.3
Type of area the foundation serves
1 CSG used the best available list of community foundations from the Council on Foundations, the Columbus Foundation’s
annual survey list, and the COF community foundation locator as its base to construct this list, augmenting it with additional or
updated contact information available through CSG’s contacts and lists developed over 15 years of managing and working on a
variety of community foundation initiatives.
0.04%
13%
17%
24%
45%
0%
14%
17%
26%
43%
0% 10% 20% 30% 40% 50%
U.S. Territory
Northeast
West
South
Midwest
Sample % U.S. Community Foundation population %
1%
7%
7%
38%
7%
35%
5%
0% 5% 10% 15% 20% 25% 30% 35% 40%
Other
Statewide
Region including pieces of more thanone state
Subregion within one state
Metropolitan Area (major city &suburbs)
Countywide (one county)
City/town only (one city or town)

3.4 Growing Local Philanthropy 2009 Survey | Aspen Institute Community Strategies Group
TOTAL ASSETS
The average (mean) asset size of the responding community foundations at the end of 2008 was almost
$82 million. The median was $18 million. With no comparable 2008 data for all community foundations
available at the time of this analysis, the survey sample is compared with 2007 data. See Figure 3.4.
* Figure 3.4
Amount of total assets held by responding foundations compared to total U.S. community foundation population at the end of 2008
Note: Figure 3.4 is a comparison in total assets with The Foundation Center 2007 data on U.S. community foundations – there was no comparable data available for 2008. * 269 out of 270 responding foundations answered this question.
ENDOWED ASSETS
The average (mean) amount of endowed assets for responding foundations was almost $50 million, and
the median $12 million, at the end of 2008. Over one-half (54%) of the respondents reported that at
least three-fourths (75%) of their total assets were endowed at the end of 2008. Just under one-fourth
(24%) of the responding foundations reported having less than one-half their assets in endowed funds at
the end of 2008. See Figure 3.5. We could find no comparable data on all U.S. community foundations.
* Figure 3.5
Amount of endowed assets held by responding foundations at the end of 2008
* 264 out of 270 responding foundations answered this question.
11%
20%
14%
31%
17%
5%
2%
6%
15%
15%
37%
19%
7%
1%
0% 5% 10% 15% 20% 25% 30% 35% 40%
Less than $1M
$1M - <$5M
$5m - <$10M
$10M - <$50M
$50M - <$250M
$250M - <$1B
$1B or more
Survey Sample U.S. Community Foundations (2007)
18%
12%
14%
22%
12%
11%
6%
5%
0% 5% 10% 15% 20% 25%
Less than $2.5M
$2.5M - < $5.0M
$5M - <$10M
$10M - <$25M
$25M - <$50M
$50M - <$100M
$100M - <$200M
$200M or more

Aspen Institute Community Strategies Group | Growing Local Philanthropy 2009 Survey 3.5
FOUNDATION AGE
Ten percent of the foundations in the sample were established less than ten years ago, 55% are 10-29
years old, and the remaining 35% are thirty years or older. Most of the responding community
foundations (65%) were established in the 1980s or later, with the average age of the responding
foundations being 28 years old. See Figure 3.6. We could find no comparable data on all community
foundations.
* Figure 3.6
Age of community foundations
* 269 out of the 270 responding foundations answered this question.
COMPLIANCE WITH NATIONAL STANDARDS FOR U.S. COMMUNITY FOUNDATIONS ™2
Almost four-fifths (79%) of the responding community foundations report that they have received
confirmation of compliance with National Standards for U.S. Community Foundations ™. Another 2%
have submitted their record book and application for review – and confirmation of their compliance is
pending. An additional 13% of the responding community foundations intend to comply with National
Standards, but have not yet applied. Only six percent have no plans to comply.
RURAL COVERAGE
As shown in Figure 3.7a on the next page, nine in ten of the responding community foundations report
that their service area includes at least some rural area. Compared to foundations in other regions,
foundations serving rural areas appear to be located more in the Midwest and South and less in the
Northeast. Foundations serving rural areas also tend to be smaller in terms of asset size, especially in
size of endowed assets. Among all the foundations serving at least some rural areas, three-fourths
report that 50% or more of their service area is rural. Nearly two-fifths (37%) report that 90% of their
service area is rural. See Figure 3.7b on the next page.
2 The National Standards for U.S. Community Foundations™ were approved by the Council on Foundations and adopted by the
community foundation field in 2000. To find out more about the Standards, see: http://bestpractices.cof.org/community/index.cfm
10%
55%
35% Less than 10 years old
10-29 years old
30 years or older

3.6 Growing Local Philanthropy 2009 Survey | Aspen Institute Community Strategies Group
Figure 3.7a
Community foundations and rural service area
* Figure 3.7b
Percentage of foundation service area that is rural (for those foundations that serve any rural area)
* 269 of the 270 responding foundations answered this question.
90%
10%
Service area includessome rural area
Service area does notinclude any rural area
37% 20% 18% 10% 10% 5%
90% or more 75%-89% 50-74% 25-49% 10-24% Less than 10%
50% or more of the service
area is rural
75% or more of service
area is rural

Aspen Institute Community Strategies Group | Growing Local Philanthropy 2009 Survey 4.1
4. INCIDENCE AND GROWTH OF
GEOGRAPHIC AFFILIATES

4.2 Growing Local Philanthropy 2009 Survey | Aspen Institute Community Strategies Group
4. INCIDENCE AND GROWTH OF GEOGRAPHIC AFFILIATES
HOW MANY FOUNDATIONS HAVE GEOGRAPHIC COMPONENT FUNDS?
Just over one-half (51%) of the 270 community foundations that answered the survey have at least one
geographic affiliate. The number of community foundations with geographic affiliates in each U.S.
region closely corresponds to the number of responding foundations from each region. See Figure 4.1.
Figure 4.1
Regional distribution of community foundations with geographic affiliates compared to total survey sample
HOW MANY GEOGRAPHIC AFFILIATES ARE THERE – AND IS THAT NUMBER INCREASING?
Overall, the 137 responding community foundations that reported holding geographic affiliates held a
combined total of 1,415 geographic affiliates by the end of 2008 – which represents an increase of 227%
in the number of affiliates in ten years among these community foundations. The same community
foundations reported holding only 432 affiliates at the end of 1998, and 749 in 2004. See Figure 4.2.
Figure 4.2
Total number of geographic affiliates by year (among sample community foundations)
15%
44%
13%
28%
17%
43%
14%
26%
0% 10% 20% 30% 40% 50%
West
Midwest
Northeast
South
Total Survey Sample Sample Community Foundations with Affiliates
432
749
1415
0 500 1000 1500
Total geographic affiliates at the endof 1998
Total geographic affiliates at the endof 2004
Total geographic affiliates at the endof 2008
+89%
+73
+227%
Geographic affiliates are an ongoing, growing and widespread phenomenon.
The number of geographic affiliates is increasing dramatically around the country,
and hosting affiliates is an emerging trend among smaller and newer foundations.
Aspen Institute Community Strategies Group | Growing Local Philanthropy 2009 Survey 4.3
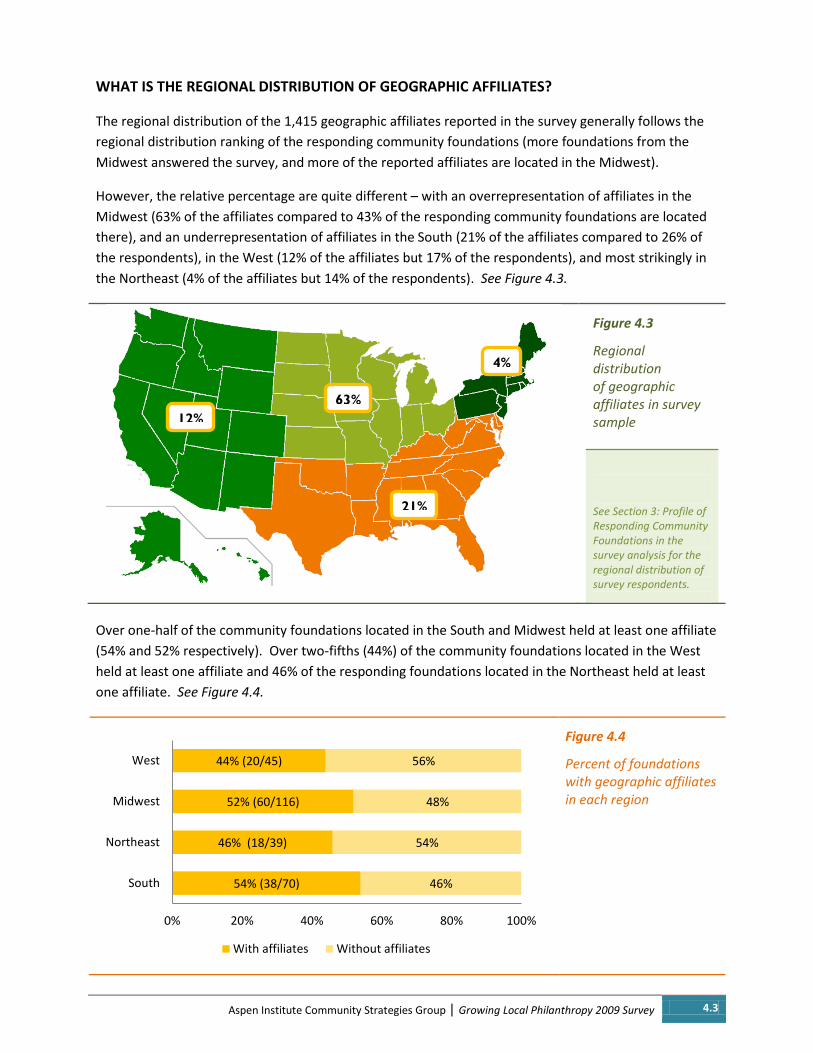
WHAT IS THE REGIONAL DISTRIBUTION OF GEOGRAPHIC AFFILIATES?
The regional distribution of the 1,415 geographic affiliates reported in the survey generally follows the
regional distribution ranking of the responding community foundations (more foundations from the
Midwest answered the survey, and more of the reported affiliates are located in the Midwest).
However, the relative percentage are quite different – with an overrepresentation of affiliates in the
Midwest (63% of the affiliates compared to 43% of the responding community foundations are located
there), and an underrepresentation of affiliates in the South (21% of the affiliates compared to 26% of
the respondents), in the West (12% of the affiliates but 17% of the respondents), and most strikingly in
the Northeast (4% of the affiliates but 14% of the respondents). See Figure 4.3.
Figure 4.3
Regional distribution of geographic affiliates in survey sample
See Section 3: Profile of Responding Community Foundations in the survey analysis for the regional distribution of survey respondents.
Over one-half of the community foundations located in the South and Midwest held at least one affiliate
(54% and 52% respectively). Over two-fifths (44%) of the community foundations located in the West
held at least one affiliate and 46% of the responding foundations located in the Northeast held at least
one affiliate. See Figure 4.4.
Figure 4.4
Percent of foundations with geographic affiliates in each region
54% (38/70)
46% (18/39)
52% (60/116)
44% (20/45)
46%
54%
48%
56%
0% 20% 40% 60% 80% 100%
South
Northeast
Midwest
West
With affiliates Without affiliates
12%
21%
4%
63%

4.4 Growing Local Philanthropy 2009 Survey | Aspen Institute Community Strategies Group
The average number of affiliates held in community foundations located in the West is 9 affiliates
(median of 3 and mode of 3), in the Midwest the average is 15 affiliates (median of 5 and mode of 1), in
the Northeast the average is 3 (median 2 and mode of 2), and in the South the average is 8 (median of 3
and mode of 1).
Geographic affiliates are prevalent among community foundations with rural service areas.
Community foundations that serve rural areas tend to host affiliates more than those that do not have
affiliates. Around 96% of the responding community foundations with affiliates have a service area that
includes rural areas (whereas 90% of all responding foundations have a service area that includes rural
areas). Or to look at it another way, over one-half (54%) of the responding community foundations that
report their service area includes rural areas reported currently holding geographic affiliates. However,
less than one-fifth (19%) of those foundations that do not serve any rural areas report having affiliates.
WHICH FOUNDATIONS CURRENTLY HAVE GEOGRAPHIC AFFILIATES?
Community foundations that are older and larger are more likely to have established geographic
affiliates than other foundations. Larger foundations (in terms of asset size) are more likely to have
developed geographic affiliates than smaller foundations: 81% of those foundations with $50 million or
more in total assets (and 87% of those with $100 million or more) have geographic affiliates, compared
to 57% of those foundations with assets between $10 million and $50 million, and 23% of those with
less than $10 million in assets. Similarly, older foundations – which also tend to have larger assets – are
also more likely to have affiliates than younger foundations: 64% of those foundations 30 or more years
old have affiliates, while 48% of foundations 10-29 years old and 19% of foundations less than 10 years
old have affiliates. See Figure 4.5.
Figure 4.5 Characteristics of community foundations and incidence of geographic affiliates
Community foundation characteristic
Percent with geographic affiliates
Number with geographic affiliates
Asset Size
<$10 million
$10-49.9 million
$50 million or more
Age
Less than 10 years
10-29 years
30 years or more
81%
57%
23%
58
57
22
64%
48%
19%
60
71
5
Aspen Institute Community Strategies Group | Growing Local Philanthropy 2009 Survey 4.5
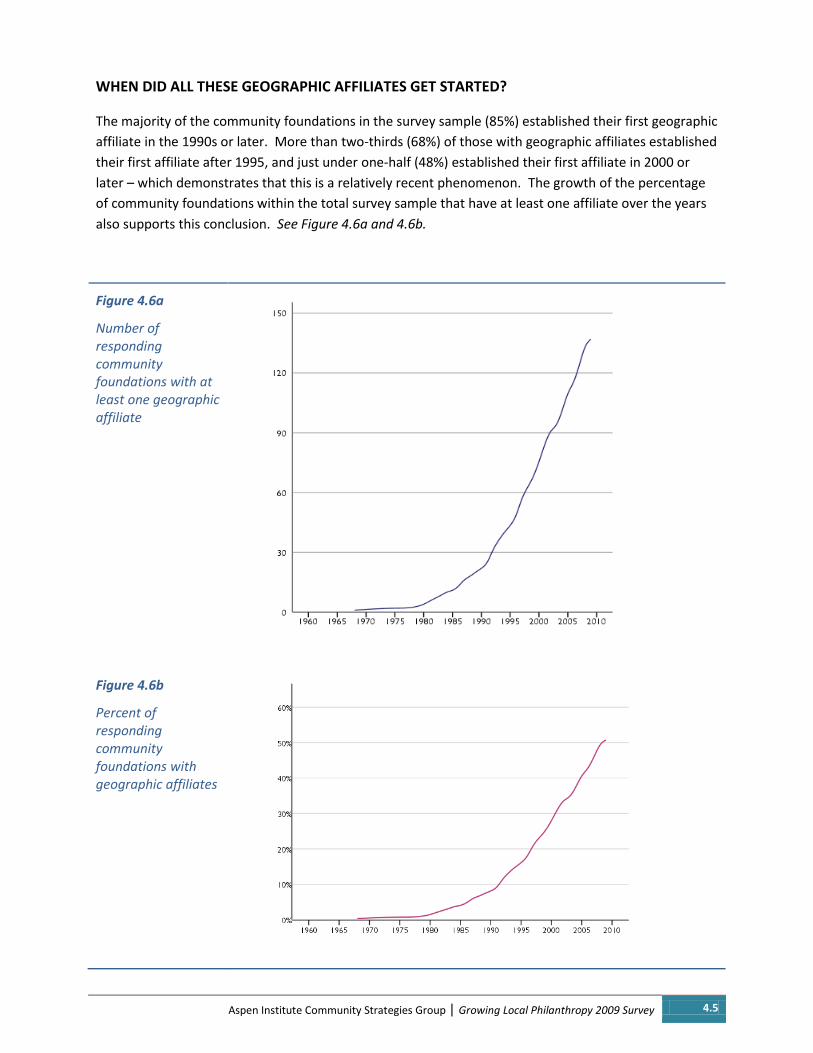
WHEN DID ALL THESE GEOGRAPHIC AFFILIATES GET STARTED?
The majority of the community foundations in the survey sample (85%) established their first geographic
affiliate in the 1990s or later. More than two-thirds (68%) of those with geographic affiliates established
their first affiliate after 1995, and just under one-half (48%) established their first affiliate in 2000 or
later – which demonstrates that this is a relatively recent phenomenon. The growth of the percentage
of community foundations within the total survey sample that have at least one affiliate over the years
also supports this conclusion. See Figure 4.6a and 4.6b.
Figure 4.6a
Number of responding community foundations with at least one geographic affiliate
Figure 4.6b
Percent of responding community foundations with geographic affiliates
4.6 Growing Local Philanthropy 2009 Survey | Aspen Institute Community Strategies Group
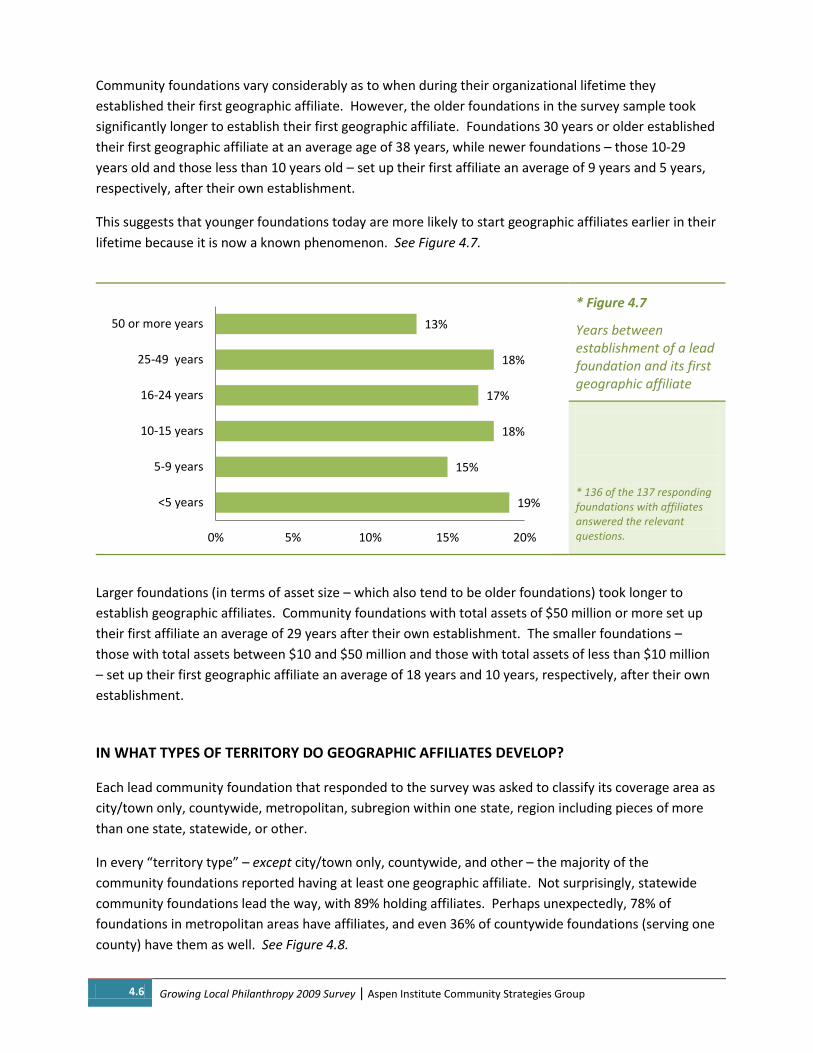
Community foundations vary considerably as to when during their organizational lifetime they
established their first geographic affiliate. However, the older foundations in the survey sample took
significantly longer to establish their first geographic affiliate. Foundations 30 years or older established
their first geographic affiliate at an average age of 38 years, while newer foundations – those 10-29
years old and those less than 10 years old – set up their first affiliate an average of 9 years and 5 years,
respectively, after their own establishment.
This suggests that younger foundations today are more likely to start geographic affiliates earlier in their
lifetime because it is now a known phenomenon. See Figure 4.7.
* Figure 4.7
Years between establishment of a lead foundation and its first geographic affiliate
* 136 of the 137 responding foundations with affiliates answered the relevant questions.
Larger foundations (in terms of asset size – which also tend to be older foundations) took longer to
establish geographic affiliates. Community foundations with total assets of $50 million or more set up
their first affiliate an average of 29 years after their own establishment. The smaller foundations –
those with total assets between $10 and $50 million and those with total assets of less than $10 million
– set up their first geographic affiliate an average of 18 years and 10 years, respectively, after their own
establishment.
IN WHAT TYPES OF TERRITORY DO GEOGRAPHIC AFFILIATES DEVELOP?
Each lead community foundation that responded to the survey was asked to classify its coverage area as
city/town only, countywide, metropolitan, subregion within one state, region including pieces of more
than one state, statewide, or other.
In every “territory type” – except city/town only, countywide, and other – the majority of the
community foundations reported having at least one geographic affiliate. Not surprisingly, statewide
community foundations lead the way, with 89% holding affiliates. Perhaps unexpectedly, 78% of
foundations in metropolitan areas have affiliates, and even 36% of countywide foundations (serving one
county) have them as well. See Figure 4.8.
19%
15%
18%
17%
18%
13%
0% 5% 10% 15% 20%
<5 years
5-9 years
10-15 years
16-24 years
25-49 years
50 or more years

Aspen Institute Community Strategies Group | Growing Local Philanthropy 2009 Survey 4.7
Figure 4.8
Percent of different “territory types” of lead community foundations that hold affiliates
HOW ARE GEOGRAPHIC AFFILIATES CONCENTRATED?
Almost four-fifths (79%) of the foundations that have any geographic affiliates have more than one.
Around one-half (45%) have four or more affiliates, and just over one-fifth (22%) hold ten or more
geographic affiliates. See Figure 4.9.
Figure 4.9 Number of affiliates held by sample community foundations with geographic affiliates
Percent of foundations that host geographic affiliates
Aggregate number of geographic affiliates in community foundations
10 or more affiliates
4 to 9 affiliates
2 or 3 affiliates
Only one affiliate
A large number of affiliates are concentrated in a relatively small number of community foundations.
Thirteen of the responding foundations report that they have 30 or more affiliates. The thirty
foundations in the sample having ten or more affiliates host a total of 1,085 among them. This means
that over three-fourths (77%) of all geographic affiliates in this sample reside in less than one-fourth
(22%) of the sample foundations with affiliates.
WHERE ARE GEOGRAPIC AFFILIATES GROWING?
Reflecting the trend illustrated in Figure 4.2 (page 4.2), geographic affiliates have increased everywhere
in leaps and bounds over the last ten years. The number of geographic affiliates reported in the survey
increased in every region by more than 100% between 1998 and 2008 – and in every region but the
Northeast by near 200% or much more!
20%
89%
72%
60%
78%
36%
7%
0% 50% 100%
Other
Statewide
Region including pieces of more than one state
Subregion within one state
Metropolitan area
Countywide
City/town only
21%
34%
23%
22%
28
112
190
1085

4.8 Growing Local Philanthropy 2009 Survey | Aspen Institute Community Strategies Group
Since 1998, community foundations in the Midwest have experienced the largest increase in the number
of geographic affiliates, with the number of affiliates rising from 256 in 1998 to 888 by the end of 2008 –
an increase of 247%.
Figure 4.10 shows the distribution of affiliates across regions and the percent increase in the number of
affiliates in each region from 1998 to the end of 2008.
Figure 4.10 Number of affiliates and percent increase between 1998 and 2004, by region
Number of affiliates at end of 2008 Percent increase in affiliates since 1998
West
Midwest
Northeast
South
Similarly, for sample community foundations in every asset class, the number of geographic affiliates
they hosted increased by more than 150%.
Foundations with assets of less than $10 million increased their numbers of affiliates from 2 in 1998 to
85 at the end of 2008, an increase of 4150%1. By comparison, the number of affiliates among
foundations with total assets between $10 million and $50 million rose from 131 in 1998 to 480 at the
end of 2008 (+266%). Among foundations with assets of $50 million or more, the number grew from
299 in 1998 to 850 by the end of 2008 (+184%).
Affiliates occur in rural areas – but also in urban, suburban and mixed areas. While three-fourths of
geographic affiliates reported by community foundations in the survey are located in rural areas, it is
noteworthy that 12% are located in a suburban area, 10% in an urban area, 3% in a mixed area
(rural/urban), and 0.3% in another type of area. See Figure 4.11.
* Figure 4.11
Service area of sample foundations’ geographic affiliates
* 1,402 of the total 1,415 affiliates are included here. The locations of 13 affiliates were not reported on the survey.
1 A number of these small foundations were founded after 1998, slightly skewing the results.
293
63
888
171
222%
142%
247%
190%
3%
12%
75%
10%
0.3%
Urban
Suburban
Rural
Mix
Other

Aspen Institute Community Strategies Group | Growing Local Philanthropy 2009 Survey 4.9
Examining the location focus of the lead foundations’ geographic affiliates within the four U.S.
geographic regions, reveals some differences in the percentage of affiliates covering each type of service
area. Three-fourths (75%) of all the reported affiliates are located in rural areas nationwide, but
surprisingly, less than one-half (47%) of those geographic affiliates held by community foundations
located in the West serve rural areas. Those foundations in the West also reported the highest
percentage of their affiliates in urban areas (12%) than in other regions. See Figure 4.13.
* Figure 4.12
Service area of foundations’ geographic affiliates by region
* 1,402 of the total 1,415 affiliates are included here. The locations of 13 affiliates were not reported on the survey.
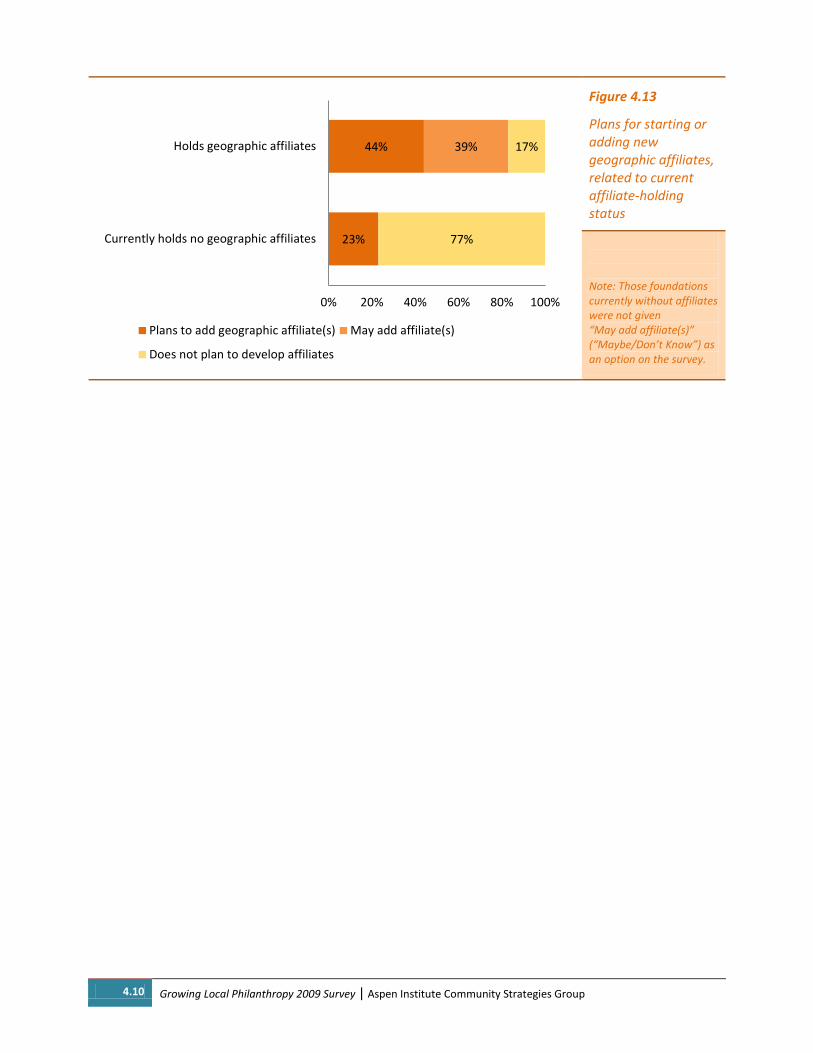
WILL THERE BE MORE GEOGRAPHIC AFFILIATES IN THE FUTURE?
One-third (33%) of the responding community foundations report that they plan or wish to add (or start)
new geographic affiliates. Of those foundations that already have geographic affiliates, 44% plan to add
new ones, 39% might add new affiliates, and only 17% do not plan to add more affiliates. Of those
foundations that do not currently have geographic affiliates, only 23% wish or plan to develop affiliates
in the future. In short, the survey results suggest that there will be continued growth in the number of
geographic affiliates, but that growth will likely concentrate in foundations that already have affiliates.
See Figure 4.7.
Only 4% of the responding community foundations that currently have affiliates are less than 10 years
old, but 60% of these foundations wish or plan to add more geographic affiliates. However, nearly one-
third (30%) of the foundations 30 years or older that have affiliates wish or plan to add more affiliates
(even though 44% of the foundations with affiliates are 30 years or older). This suggests that future
growth will likely be in younger community foundations. It also may be that older community
foundations, which have had more time to work in their locations, are more likely to have already
saturated their markets with affiliates.
15%
22%
7%
17%
10%
80%
60%
79%
47%
75%
4%
10%
13%
24%
12%
1%
8%
1%
12%
3%
0% 20% 40% 60% 80% 100%
South
Northeast
Midwest
West
Nationwide
Urban Suburban Rural Mixed
4.10 Growing Local Philanthropy 2009 Survey | Aspen Institute Community Strategies Group
Figure 4.13
Plans for starting or adding new geographic affiliates, related to current affiliate-holding status
Note: Those foundations currently without affiliates were not given “May add affiliate(s)” (“Maybe/Don’t Know”) as an option on the survey.
23%
44% 39%
77%
17%
0% 20% 40% 60% 80% 100%
Currently holds no geographic affiliates
Holds geographic affiliates
Plans to add geographic affiliate(s) May add affiliate(s)
Does not plan to develop affiliates
Aspen Institute Community Strategies Group | Growing Local Philanthropy 2009 Survey 5.1
5. ASSET DEVELOPMENT AND
GEOGRAPHIC AFFILIATES
5.2 Growing Local Philanthropy 2009 Survey | Aspen Institute Community Strategies Group
5. ASSET DEVELOPMENT AND GEOGRAPHIC AFFILIATES
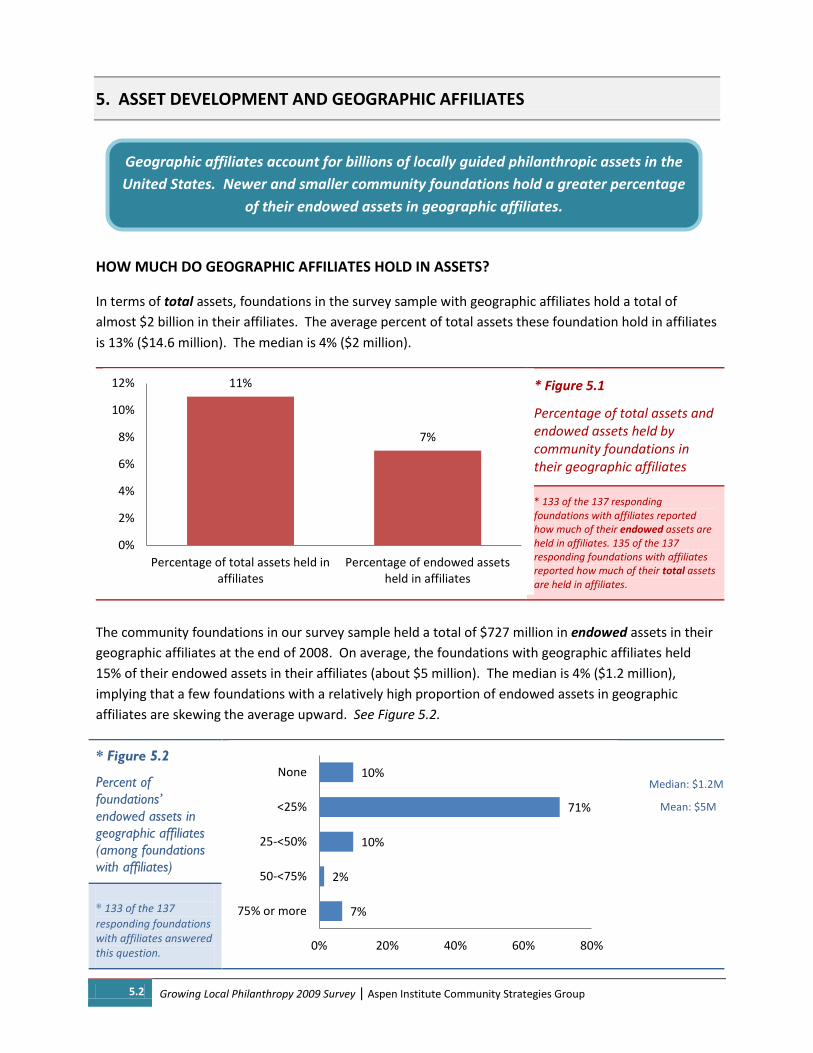
HOW MUCH DO GEOGRAPHIC AFFILIATES HOLD IN ASSETS?
In terms of total assets, foundations in the survey sample with geographic affiliates hold a total of
almost $2 billion in their affiliates. The average percent of total assets these foundation hold in affiliates
is 13% ($14.6 million). The median is 4% ($2 million).
* Figure 5.1
Percentage of total assets and endowed assets held by community foundations in their geographic affiliates
* 133 of the 137 responding foundations with affiliates reported how much of their endowed assets are held in affiliates. 135 of the 137 responding foundations with affiliates reported how much of their total assets are held in affiliates.
The community foundations in our survey sample held a total of $727 million in endowed assets in their
geographic affiliates at the end of 2008. On average, the foundations with geographic affiliates held
15% of their endowed assets in their affiliates (about $5 million). The median is 4% ($1.2 million),
implying that a few foundations with a relatively high proportion of endowed assets in geographic
affiliates are skewing the average upward. See Figure 5.2.
* Figure 5.2
Percent of
foundations’
endowed assets in
geographic affiliates
(among foundations
with affiliates)
* 133 of the 137
responding foundations with affiliates answered this question.
11%
7%
0%
2%
4%
6%
8%
10%
12%
Percentage of total assets held inaffiliates
Percentage of endowed assetsheld in affiliates
7%
2%
10%
71%
10%
0% 20% 40% 60% 80%
75% or more
50-<75%
25-<50%
<25%
NoneMedian: $1.2M
Mean: $5M
Geographic affiliates account for billions of locally guided philanthropic assets in the
United States. Newer and smaller community foundations hold a greater percentage
of their endowed assets in geographic affiliates.

Aspen Institute Community Strategies Group | Growing Local Philanthropy 2009 Survey 5.3
Even though larger foundations – in terms of asset size – tend to count a larger aggregate amount of
endowed assets in their geographic affiliates, these foundations hold a smaller percentage of their
endowed assets in geographic affiliates. As Figure 5.3 shows, the geographic affiliates in foundations
with total assets of $50 million or more account for an average of $9.7 million in their lead foundations’
endowed assets. However, in percentage terms, this amount represents only 11% of these foundations’
total endowed assets. In comparison, geographic affiliates in foundations with assets of less than $10
million hold an average of $300,000 in endowed assets in affiliates – representing 28% of the lead
foundation’s endowed assets.
* Figure 5.3 Amount of foundations’ endowed assets in geographic affiliates by foundation size and age
Community foundation characteristic
Average percent of endowed assets in geographic affiliates
Average dollar amount (in millions) in geographic affiliates
Asset size
<$10 million
$10-49.9 million
$50 million or more
Age
Less than 10 years
10-29 years
30 years or more
Overall 15% $5 million
* 135 of the 137 responding foundations with affiliates answered the relevant questions.
Similarly older foundations also generally have a smaller percentage of their endowed assets in
geographic affiliates. The affiliates of foundations that were established 30 or more years ago hold an
average of $9.5 million, which is just 14% of these foundations’ total endowed assets. However, those
foundations that were established less than 10 years ago hold an average of 49% of their endowed
assets in geographic affiliates, but this percentage only amounts to an average of $2.9 million dollars.
In short, younger and smaller foundations hold a larger percentage of their endowed assets in
geographic affiliates. This seems to underline the evidence – reported in Section 4: Incidence and
Growth of Geographic Affiliates of this survey analysis – that younger and newer foundations are
developing geographic affiliates earlier in their lifespans than older foundations did.
11%
15%
28%
$9.7
$3.0
$0.3
14%
15%
49%
$9.5
$2.1
$2.9
5.4 Growing Local Philanthropy 2009 Survey | Aspen Institute Community Strategies Group
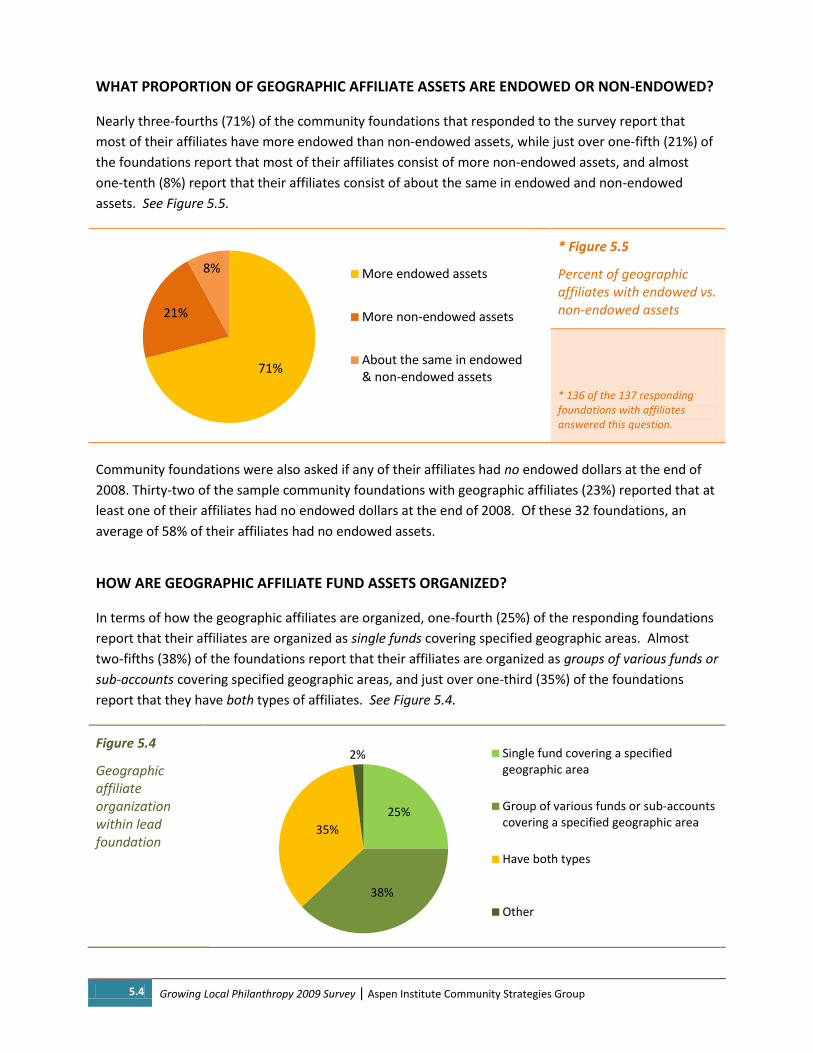
WHAT PROPORTION OF GEOGRAPHIC AFFILIATE ASSETS ARE ENDOWED OR NON-ENDOWED?
Nearly three-fourths (71%) of the community foundations that responded to the survey report that
most of their affiliates have more endowed than non-endowed assets, while just over one-fifth (21%) of
the foundations report that most of their affiliates consist of more non-endowed assets, and almost
one-tenth (8%) report that their affiliates consist of about the same in endowed and non-endowed
assets. See Figure 5.5.
* Figure 5.5
Percent of geographic affiliates with endowed vs. non-endowed assets
* 136 of the 137 responding foundations with affiliates answered this question.
Community foundations were also asked if any of their affiliates had no endowed dollars at the end of
2008. Thirty-two of the sample community foundations with geographic affiliates (23%) reported that at
least one of their affiliates had no endowed dollars at the end of 2008. Of these 32 foundations, an
average of 58% of their affiliates had no endowed assets.
HOW ARE GEOGRAPHIC AFFILIATE FUND ASSETS ORGANIZED?
In terms of how the geographic affiliates are organized, one-fourth (25%) of the responding foundations
report that their affiliates are organized as single funds covering specified geographic areas. Almost
two-fifths (38%) of the foundations report that their affiliates are organized as groups of various funds or
sub-accounts covering specified geographic areas, and just over one-third (35%) of the foundations
report that they have both types of affiliates. See Figure 5.4.
Figure 5.4
Geographic affiliate organization within lead foundation
71%
21%
8% More endowed assets
More non-endowed assets
About the same in endowed& non-endowed assets
25%
38%
35%
2% Single fund covering a specifiedgeographic area
Group of various funds or sub-accountscovering a specified geographic area
Have both types
Other

Aspen Institute Community Strategies Group | Growing Local Philanthropy 2009 Survey 6.1
6. ORGANIZATION AND GOVERNANCE
OF GEOGRAPHIC AFFILIATES
WITHIN LEAD FOUNDATIONS

6.2 Growing Local Philanthropy 2009 Survey | Aspen Institute Community Strategies Group
6. ORGANIZATION AND GOVERNANCE OF GEOGRAPHIC AFFILIATES WITHIN LEAD FOUNDATIONS
WHICH STARTS THE ACTION – THE GEOGRAPHIC AFFILIATE OR THE LEAD FOUNDATION?
Some community foundations have programs to support the development of geographic affiliates –
many do not. In this survey sample, over one-half (58%) of the foundations either currently have or
have had a specific outreach program to develop geographic affiliates. But that includes only about one-
third (34%) of the foundations with affiliates that currently have an outreach program and one-quarter
(25%) that had a program in the past to develop geographic affiliates but no longer do.
The vast majority (around four-fifths, or 82%) of the responding community foundations with affiliates
are willing to develop affiliates when local groups approach them. Just over two-fifths (41%) of the
with-affiliates foundations are only willing to develop affiliates when local groups approach them (that
is, they have no affiliate outreach program). See Figure 6.1.
The responses to this question suggest that the rapid increase in the numbers of geographic affiliate is
largely driven by demand from local leaders – that is, it is in no small part a response to a ground-up
phenomenon of groups of local leaders wanting to set up affiliates.
* Figure 6.1
Lead foundation approach to establishing or bringing on geographic affiliates
* 133 of the 137 responding foundations with affiliates answered this question
6%
19%
22%
41%
12%
0% 20% 40% 60%
HAD outreach program, but no longer do & nolonger willing to develop affiliates
HAD outreach program, but no longer do - willingto develop affiliates when groups approach them
Have a specific outreach program & also developaffiliates when groups approach them
Develop affiliates only when local groups approachthem
Have specific outreach program to developaffiliates
Many lead foundations are analyzing and formalizing more of their processes and
procedures and roles in relation to geographic affiliates – but a wide range of policy
and practice options are still simmering in the affiliate soup.

Aspen Institute Community Strategies Group | Growing Local Philanthropy 2009 Survey 6.3
However, outreach programs do make a difference. Foundations that currently have a specific outreach
program for developing geographic affiliates have a higher average number of affiliates per foundation
than those without a specific program. Taken together, the foundations in the two categories of lead
foundations that currently operate a specific program to develop affiliates have an average of 14.3
affiliates each. By comparison, foundations that take a responsive approach and only develop affiliates
when groups approach them (whether or not they have an outreach program in the past) only average
8.9 affiliates. See Figure 6.2.
Figure 6.2 Process by which community foundations establish geographic affiliates
Process * Percent of
foundations
** Total number of affiliates
** Average number of affiliates/foundation
Have specific outreach program
Only develop when approached by local groups
Have specific outreach program & develop when approached
Had outreach program (no longer do), develop when approached
Had outreach program (no longer do) and no longer develop affiliates
* 134 of the 137 responding foundations with affiliates answered this question.
** 133 of the 137 responding foundations with affiliates answered these questions.
WHAT IS THE ORIGIN OF GEOGRAPHIC AFFILIATES?
The foundations with affiliates were asked how each of their affiliates was set up – in terms of who set it
up, and with what affiliate-building intent. Most of the geographic affiliates reported in this survey –
more than three-fifths (64%) – were set up by a group of people from the affiliate’s geographic area and
are seeking new donors. Thirteen percent of the affiliates in the survey sample were set up by one
donor and are seeking new donors; five percent were set up by a conversion of assets and are seeking
new donors. The foundations reported fewer affiliates as not seeking donors: 8% were set up by one
donor and are not seeking donors; 7% were set up by a group and are not seeking donors; and 1% were
set up by a conversion of assets and are not seeking donors. See Figure 6.3.
6%
19%
22%
41%
12%
37
182
464
514
194
4.6
7.3
15.5
9.7
12.1

6.4 Growing Local Philanthropy 2009 Survey | Aspen Institute Community Strategies Group
* Figure 6.3
Origin and development intentions of geographic affiliates
* 1373 of the total 1415 affiliates are represented in these results – the rest were not included in any category.
WHAT NAMES DO LEAD STAFF AND BOARD USE FOR THEIR GEOGRAPHIC AFFILIATES?
Community foundations with affiliates reported many different names that their staff and board use for
what we call “geographic affiliates.” The most common label is “affiliate” or “affiliate funds,” which are
used by almost two-fifths (39%) of the responding foundations with affiliates. (This might explain why
affiliate is the general term the community field uses – even though affiliates structures and situations
vary widely from foundation to foundation.) Almost one-fifth (18%) reported using “community funds.”
The remaining diversity of names illustrates the plurality in the field – in fact, 7% of the responding
foundations use more than one name for their geographic affiliates! It seems that there simply is no
current naming convention nor likely to be anytime soon. See Figure 6.4
Figure 6.4
General name community foundations use for their “geographic affiliates”
86%
91%
63%
14%
9%
37%
0% 20% 40% 60% 80% 100%
Set up by conversion of assets
Set up by group of people
Set up by one donor
Seeking donors Not seeking donors
(67) (11)
(902) (93)
(189) (111) 22% of affiliates
72% of affiliates
6% of affiliates
1%
1%
1%
1%
2%
2%
3%
4%
4%
4%
6%
7%
7%
18%
39%
0% 10% 20% 30% 40% 50%
Local Funds
County Funds
County Affiliates
Community Affiliates
Divisions
Donor Advised Funds
Geographic Funds/Affiliates
Use other name
Community Foundations
Regions or Regional Affiliates
Component Funds
Use more than one name
Area Funds
Community Funds
Affiliates or Affiliate Funds
Aspen Institute Community Strategies Group | Growing Local Philanthropy 2009 Survey 6.5
WHAT CRITERIA, POLICIES AND GOVERNANCE STRUCTURES DO LEAD FOUNDATIONS HAVE
FOR GEOGRAPHIC AFFILIATES?
It appears that community foundations are becoming more intentional about policies, procedures and
systems related to their work with geographic affiliates. What is the evidence?
First, one half1 of the foundations with affiliates reported that developing geographic affiliates
was in their foundation’s strategic plan when they brought on their first affiliate.
Second, almost one-half (49%)2 of the responding foundations with affiliates have an agreed-
upon written process and set of procedures for starting and developing geographic affiliates.
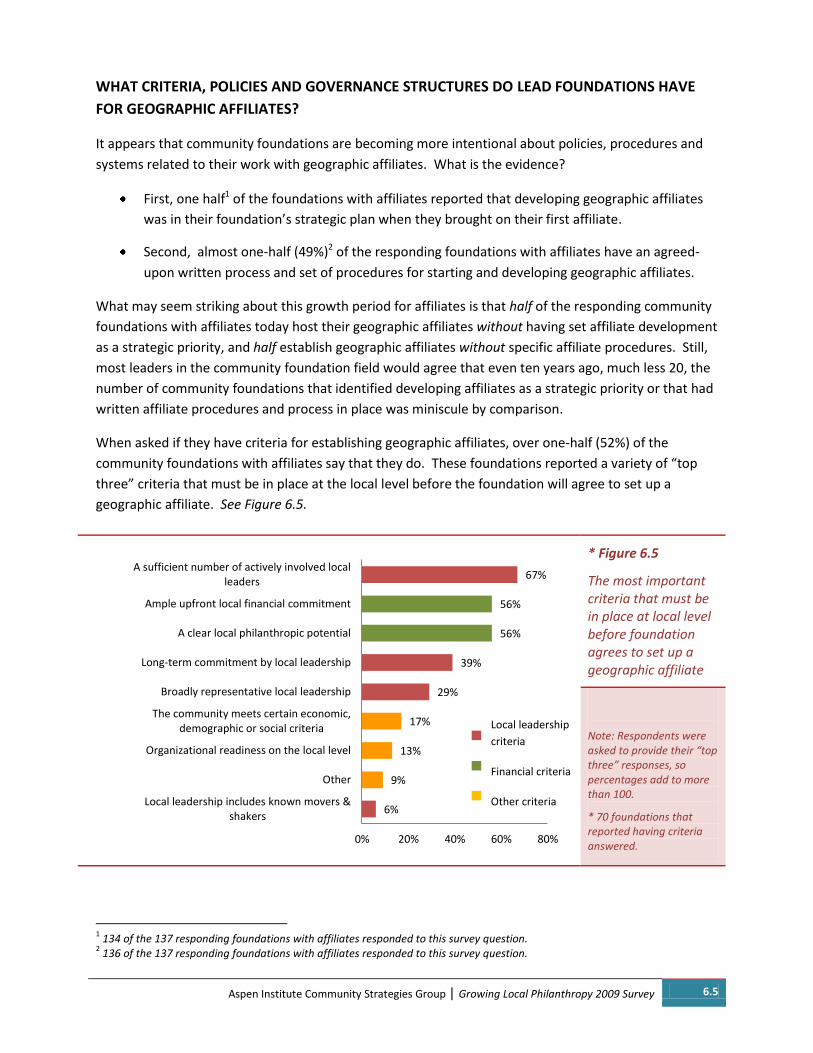
What may seem striking about this growth period for affiliates is that half of the responding community
foundations with affiliates today host their geographic affiliates without having set affiliate development
as a strategic priority, and half establish geographic affiliates without specific affiliate procedures. Still,
most leaders in the community foundation field would agree that even ten years ago, much less 20, the
number of community foundations that identified developing affiliates as a strategic priority or that had
written affiliate procedures and process in place was miniscule by comparison.
When asked if they have criteria for establishing geographic affiliates, over one-half (52%) of the
community foundations with affiliates say that they do. These foundations reported a variety of “top
three” criteria that must be in place at the local level before the foundation will agree to set up a
geographic affiliate. See Figure 6.5.
* Figure 6.5
The most important criteria that must be in place at local level before foundation agrees to set up a geographic affiliate
Note: Respondents were asked to provide their “top three” responses, so percentages add to more than 100.
* 70 foundations that reported having criteria answered.
1 134 of the 137 responding foundations with affiliates responded to this survey question.
2 136 of the 137 responding foundations with affiliates responded to this survey question.
6%
9%
13%
17%
29%
39%
56%
56%
67%
0% 20% 40% 60% 80%
Local leadership includes known movers &shakers
Other
Organizational readiness on the local level
The community meets certain economic,demographic or social criteria
Broadly representative local leadership
Long-term commitment by local leadership
A clear local philanthropic potential
Ample upfront local financial commitment
A sufficient number of actively involved localleaders
Local leadership
criteria
Financial criteria
Other criteria

6.6 Growing Local Philanthropy 2009 Survey | Aspen Institute Community Strategies Group
The most important criteria, mentioned by over half the responding foundations, are a sufficient
number of actively involved local leaders (67%); an ample upfront local financial commitment (56%);
and clear local philanthropic potential (56%). Other criteria that respondents cite are long-term
commitment by local leadership (39%); broadly representative local leadership (29%); that the
community meets certain economic, demographic or social criteria (17%); organizational readiness on
the local level (13%); and that the local leadership includes the known movers and shakers (6%).
Another 9% of the respondents listed other criteria.
It is striking, but not surprising, that one-half of the eight (not counting “Other”) factors identified as top
criteria needed in place before establishing a geographic affiliate have to do with the quantity,
composition and commitment of local leadership (represented by red bars in Figure 6.5). By contrast,
only two of the top criteria cited by respondents are financial (represented by green in Figure 6.5).
DO COMMUNITY FOUNDATIONS AND AFFILIATE(S) DEFINE THEIR RELATIONSHIP AND ROLES?
Nearly three-fourths (70%) of the lead community foundations with geographic affiliates have a
formalized set of expectations and responsibilities that delineate the respective roles of the lead
foundation and geographic affiliate (30% do not).
More than four-fifths (84%) of the responding foundations with affiliates utilize some form of signed
agreement to define the relationship between the lead foundation and a geographic affiliate (16% do
not).3 However, the form of that agreement varies widely from foundation to foundation. Even so, just
as with the trend toward written procedures and strategic priorities, the formalizing of affiliate
agreements – especially with guidelines, policies, memoranda of understanding (MOUs) and agreements
that are now specialized for geographic affiliates – seems to be a growing trend. See Figure 6.6.
* Figure 6.6
Type of formalized affiliate agreement
Note: Respondents could provide more than one type, so percentages add up to more than 100.
* 90 of the 114 foundations with a signed agreement indicated what type of agreement they use.
3 135 out of 137 of the responding foundations answered this question.
1%
1%
2%
3%
6%
8%
14%
17%
21%
36%
0% 20% 40%
Supporting organization agreement
Trust agreement
Agency fund agreement
Field of Interest fund agreement
Signed Policies and/or Guidelines
Gift, donor or donor advised fund agreement
Other agreement or contract (type not specified)
Affiliate fund agreement
Memorandum or letter of understanding
Fund agreement (type not specified)

Aspen Institute Community Strategies Group | Growing Local Philanthropy 2009 Survey 6.7
HOW DO GEOGRAPHIC AFFILIATES IDENTIFY WITH THEIR LEAD COMMUNITY FOUNDATION?
In terms of how geographic affiliates associate themselves with the name and identity of lead
foundations, responding foundations reported a variety of practices. The issues of branding and identity
typically occupy significant conversation and negotiation between affiliates and lead foundations that do
not have policies set at the outset of establishing an affiliate.
Over three-fifths (64%) of the foundations with affiliates that responded to the survey reported that
their affiliates regularly identify themselves with the lead foundation in most presentations and written
materials. Two-fifths (40%) reported that their affiliates regularly use lead foundation materials as their
own, or in combination with some of their local material. Only about two-fifths (37%) say that the
geographic affiliates and lead foundation use common graphic design elements (e.g., logos, brochure
formats with name drop-ins, etc.). Even fewer – one-third (33%) of the community foundations with
affiliates – report that the names of the geographic affiliates include the lead foundation’s name.
Ten percent (10%) detailed that no shared name, identity or branding exists between the lead
foundation and affiliates. And 15% of the responding foundations say practices vary widely among their
own affiliates. See Figure 6.7.
* Figure 6.7
How affiliates associate with name & identity of lead foundation
Note: Respondents checked all that applied, so percentages add to over 100.
* 134 foundations answered this question.
ARE AFFILIATES REPRESENTED ON LEAD FOUNDATIONS’ CENTRAL GOVERNING BOARDS?
Lead foundations are equally split between those who have one or more representatives of their
affiliates on the lead foundation’s central governing board (49%) and those who have no affiliate
representation (49%). Fourteen percent (14%) of the responding foundations with affiliates have a
formal requirement to have one or more representatives of affiliates on the lead foundation’s central
governing board. Over one-third (35%) of the responding foundations have no formal requirement, but
do have affiliate representation on the central governing board. See Figure 6.8.
5%
10%
15%
18%
33%
37%
40%
64%
0% 50% 100%
Affiliates association with foundation in other ways
No shared name, identity or branding
Widely varies among affiliates
Affiliates & foundation use same tag line
Names of affiliates include foundation's name
Affiliates & foundation use common graphic design elements
Affiliates use foundation's materials as their own
Affiliates identify with foundation in presentations/materials

6.8 Growing Local Philanthropy 2009 Survey | Aspen Institute Community Strategies Group
* Figure 6.8
Affiliate representation on lead foundation’s central governing board
* 136 of the 137 responding foundations answered this question.
DO LEAD FOUNDATIONS ALLOW THEIR GEOGRAPHIC AFFILIATES TO DISAFFILIATE?
If geographic affiliates ever wish to separate from the lead foundation, almost one-half (49%) of the
foundations with affiliates allow their affiliates to disaffiliate. Another 32% are uncertain if they would
allow disaffiliation or have never considered the disaffiliation question, and 19% of the foundations do
not allow affiliates to disaffiliate. See Figure 6.9.
When asked whether they have formalized policies and/or procedures for affiliates that seek to
disaffiliate, 47% of the responding foundations that allow affiliates to disaffiliate say that they do, while
53% do not have such a policy.
Less than one-fifth (18%) of the foundations with affiliates responded that any of their geographic
affiliates have sought to disaffiliate from their foundation. Of that 18%, 20 foundations (or 80%) have
actually had an affiliate disaffiliate (20% have not).
* Figure 6.9
Whether foundations allow their geographic affiliates to disaffiliate
* 136 out of 137 of the responding foundations with affiliates answered this question.
2%
49%
35%
14%
0% 20% 40% 60%
Other
No affiliate representation on leadfoundation's central governing board
One or more representatives of affiliatesare on central governing board, butaffiliate representation not required
Formal requirement to have one or morerepresentatives of affiliates on lead
foundation's central governing board
49%
19%
32%
Allow affiliates todisaffiliate
Do not allow affiliatesto disaffiliate
Uncertain or havenever considered
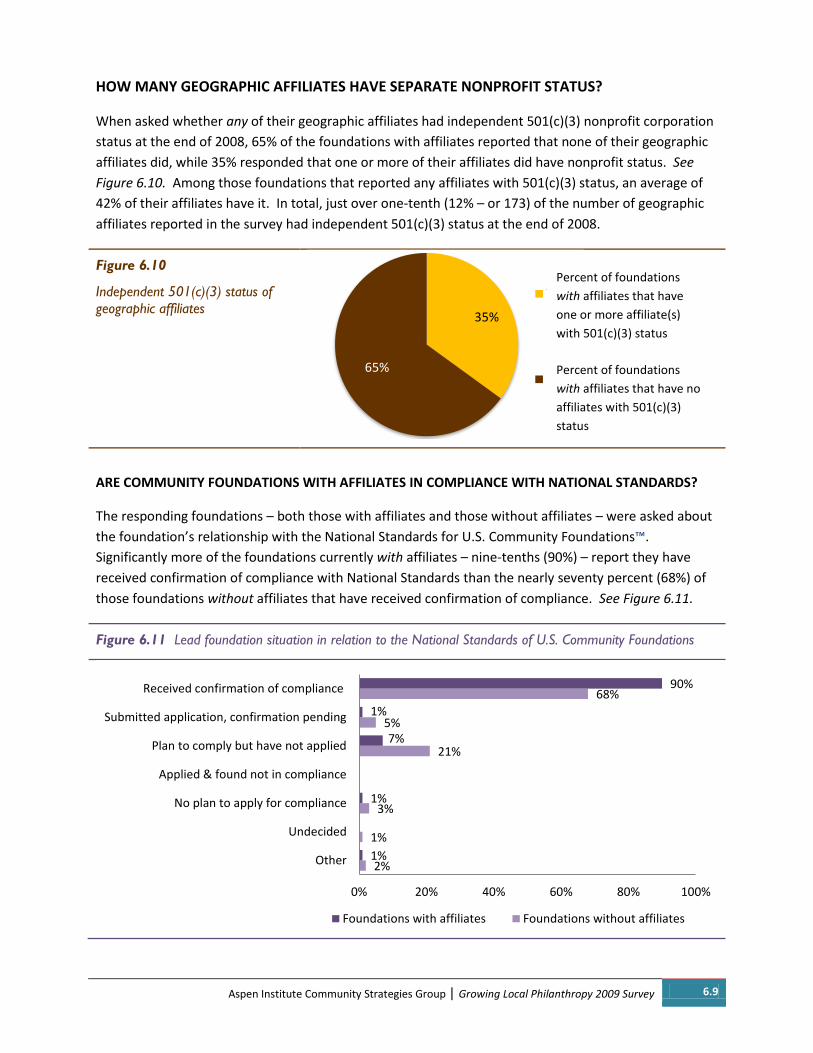
Aspen Institute Community Strategies Group | Growing Local Philanthropy 2009 Survey 6.9
HOW MANY GEOGRAPHIC AFFILIATES HAVE SEPARATE NONPROFIT STATUS?
When asked whether any of their geographic affiliates had independent 501(c)(3) nonprofit corporation
status at the end of 2008, 65% of the foundations with affiliates reported that none of their geographic
affiliates did, while 35% responded that one or more of their affiliates did have nonprofit status. See
Figure 6.10. Among those foundations that reported any affiliates with 501(c)(3) status, an average of
42% of their affiliates have it. In total, just over one-tenth (12% – or 173) of the number of geographic
affiliates reported in the survey had independent 501(c)(3) status at the end of 2008.
Figure 6.10
Independent 501(c)(3) status of
geographic affiliates
ARE COMMUNITY FOUNDATIONS WITH AFFILIATES IN COMPLIANCE WITH NATIONAL STANDARDS?
The responding foundations – both those with affiliates and those without affiliates – were asked about
the foundation’s relationship with the National Standards for U.S. Community Foundations™.
Significantly more of the foundations currently with affiliates – nine-tenths (90%) – report they have
received confirmation of compliance with National Standards than the nearly seventy percent (68%) of
those foundations without affiliates that have received confirmation of compliance. See Figure 6.11.
Figure 6.11 Lead foundation situation in relation to the National Standards of U.S. Community Foundations
35%
65%
Yes
No
2%
1%
3%
21%
5%
68%
1%
1%
7%
1%
90%
0% 20% 40% 60% 80% 100%
Other
Undecided
No plan to apply for compliance
Applied & found not in compliance
Plan to comply but have not applied
Submitted application, confirmation pending
Received confirmation of compliance
Foundations with affiliates Foundations without affiliates
Percent of foundations
with affiliates that have
one or more affiliate(s)
with 501(c)(3) status
Percent of foundations
with affiliates that have no
affiliates with 501(c)(3)
status


Aspen Institute Community Strategies Group | Growing Local Philanthropy 2009 Survey 7.1
7. STAFFING THE GROWTH AND WORK OF
GEOGRAPHIC AFFILIATES

7.2 Growing Local Philanthropy 2009 Survey | Aspen Institute Community Strategies Group
7. STAFFING THE GROWTH AND WORK OF GEOGRAPHIC AFFILIATES
WHO IS RESPONSIBLE FOR DEVELOPING AND ADMINISTERING GEOGRAPHIC AFFILIATES?
In the survey, those foundations with affiliates were asked who – the lead foundation or the geographic
affiliate or both – has the primary responsibility to conduct certain typical tasks and activities related to
their geographic affiliates’ development and work in their communities. It is worth noting that in the
case of geographic affiliates, the vast majority have no staff, so this question was focused for many
foundations on whether the lead foundation’s staff or an affiliate’s volunteer advisory board or
committee bears the most responsibility.
The activity that geographic affiliates most shoulder on their own is grant decision-making for their
affiliate funds (71%). Another 20% of the responding foundations reported that their affiliates have at
least equally shared responsibility for affiliate grant decision-making – making the total over ninety
percent (91%) for foundations with affiliates that have equal or greater responsibility for that task.
Not surprisingly, lead foundations bear the most – in fact, almost all – responsibility for back office
administration and investing affiliate assets; both activities weighed in at 95% or more. See Figure 7.1.
* Figure 7.1 Lead foundation and geographic affiliate responsibilities *n=133 of 137
1%
8%
10%
13%
19%
19%
41%
53%
58%
71%
3%
4%
9%
16%
36%
11%
28%
21%
29%
19%
20%
97%
95%
33%
73%
40%
57%
51%
36%
15%
16%
9%
50%
1%
11%
13%
2%
2%
3%
7%
0% 10% 20% 30% 40% 50% 60% 70% 80% 90% 100%
Investment of Affiliate Assets
Back Office Admin
Affiliate Staff Training
Affiliate Grants Admin & Reporting
Meetings & Presentations to Professional Advisors
Affiliate Board Training
Ongoing Affiliate Donor Service
Affiliate Grant Application Process
Donor Identification & Development for Affiliate(s)
Fundraising for Affiliate Operations
Affiliate Grant Decision-Making
Affiliate has most responsibility Equally shared responsibility Lead Foundation has most responsibility N/A
Community foundations use a variety of staffing and funding strategies to support
the growth and work of their geographic affiliates. While some geographic affiliates
are beginning to staff locally, lead foundations maintain significant responsibility and
commit lead staff time for many affiliate-related tasks.

Aspen Institute Community Strategies Group | Growing Local Philanthropy 2009 Survey 7.3
DO ANY GEOGRAPHIC AFFILIATES HAVE THEIR OWN STAFF?
About one-third (32% – or 44 foundations) of the lead community foundations with geographic affiliates
report that at least one of their geographic affiliates currently has its own full- or part-time staff that
work directly for the affiliate board or advisory committee.
However, only one-tenth (9% – or 129) of the entire sample of 1,415 geographic affiliates reported in
this survey currently have their own staff members that work directly for the affiliate board or advisory
committee.
Half (50%) of the responding foundations with staffed geographic affiliates report that these staff
members are paid for by the geographic affiliates, 14% report the lead foundation pays for them; 4%
report that a third party covers the staff cost; almost one-fifth (18%) report that it varies from affiliate to
affiliate; and 14% offered another response. See Figure 7.2.
Figure 7.2
Who pays the costs for affiliate staff members in the cases where geographic affiliates have their own staff members that work directly for the affiliate board or advisory committee
Among those foundations who reported that their geographic affiliates have their own staff members
that work directly for the affiliate board or advisory committee, almost half (48%) report that the lead
foundation is the formal employer of record or contractor for these staff members. About a third (34%)
report that the geographic affiliate is the formal employer, a third party is listed by seven percent (7%)
of the foundations and seven percent report that it varies from affiliate to affiliate. See Figure 7.3.
Figure 7.3
Who employs affiliate staff members in the cases where geographic affiliates have their own staff members that work directly for the affiliate board or advisory committee
14%
50% 4%
18%
14% The lead foundation
The geographic affiliate(s)
A third party
It varies from affiliate toaffiliate
Other
48%
34%
7% 7%
4% The lead foundation
The geographic affiliate(s)
A third party
It varies from affiliate toaffiliate
Other

7.4 Growing Local Philanthropy 2009 Survey | Aspen Institute Community Strategies Group
HOW DO LEAD FOUNDATIONS FUND THEIR AFFILIATE WORK?
Every lead foundation has to figure out a way to support its work with affiliates. The survey asked
foundations to indicate the top three sources of current funding they use to support their affiliate effort
– as well as their top three sources over the history of their work with affiliates.
As Figure 7.4 below indicates, community foundations today use a wide range of funding sources to
cover staff and program costs related to their affiliate efforts – ranging from the fees on affiliated funds,
which is predictably the leading source of funding, to dedicating unrestricted funds to the effort, to
targeted fundraising from other organizations and donors, to special fees on affiliate funds and
transactions.
Almost half (49%) of the lead foundations in the survey reported that they currently use fees on other
(non-affiliate) foundation funds to support their affiliate efforts – in fact, it is the second leading source
of support they tap. Thirty-two percent add in some of their own unrestricted funds, and 10% conduct
special fundraising to support affiliate efforts. Affiliates themselves provide significant financial support
for the effort, by generating a range of fee revenue for the lead foundation through the fees it levies on
affiliate fund activity, and through special fundraising conducted by the affiliate.
When compared to those sources of funding used over the entire course of the foundations’ work with
affiliates, not a lot has changed. However, more of the responding foundations reported special
fundraising by affiliates as a source of funding to support affiliates today (15%) than historically (9%).
Fewer foundations reported support from other organizations as a source of funding today (16%) than in
the past (22%). See Figure 7.4.
* Figure 7.4
Sources of funding to support lead foundation affiliate effort
Note: Respondents were asked for their top three responses, so percentages total more than 100. * 136 of the 137 responding foundations with affiliates reported current sources of funding, and only 135 reported historic sources of funding.
7%
9%
11%
13%
9%
22%
33%
30%
47%
61%
6%
6%
10%
11%
15%
16%
32%
32%
49%
63%
0% 20% 40% 60% 80%
Other sources
Significant gift(s) from major donor(s)
Special fundraising by lead foundation
Fees on affiliate fund transactions
Special fundraising by affiliates
Support from other organizations
Unrestricted funds of lead foundation
Annual fixed fee on affiliate funds
Fees on other funds to subsidize affiliate work
Interest/percentage fees on affiliate funds
Current sources of funding Historic sources of funding
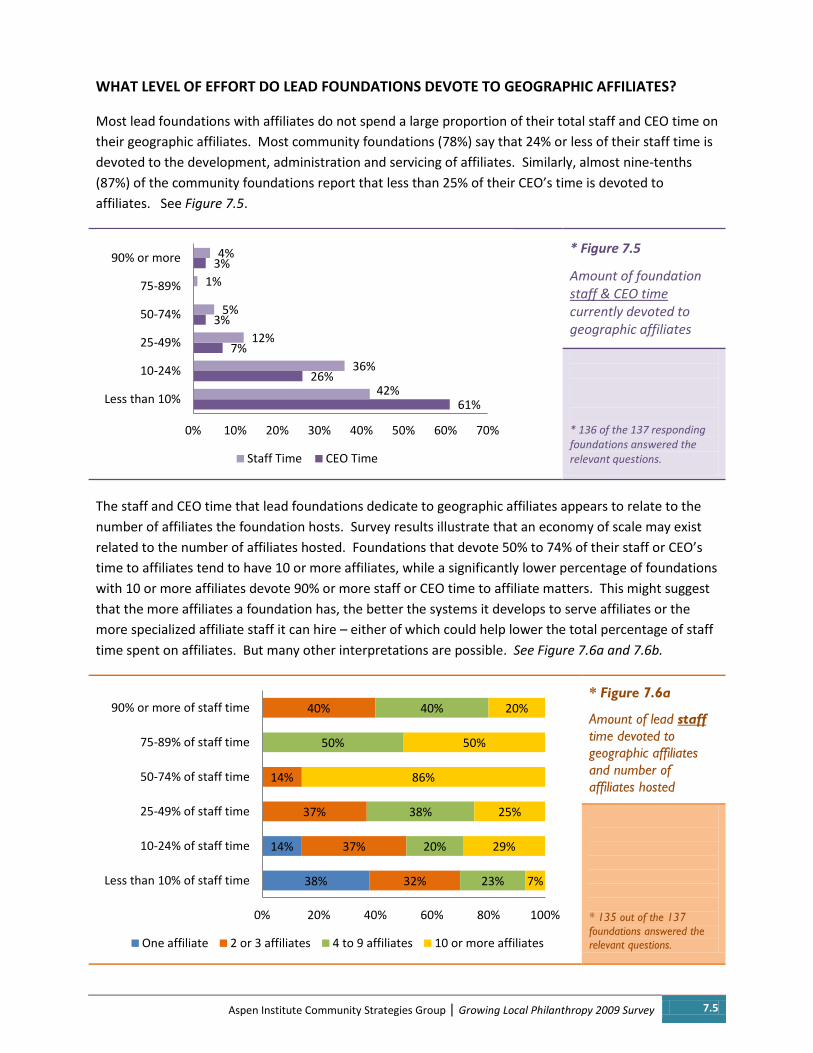
Aspen Institute Community Strategies Group | Growing Local Philanthropy 2009 Survey 7.5
WHAT LEVEL OF EFFORT DO LEAD FOUNDATIONS DEVOTE TO GEOGRAPHIC AFFILIATES?
Most lead foundations with affiliates do not spend a large proportion of their total staff and CEO time on
their geographic affiliates. Most community foundations (78%) say that 24% or less of their staff time is
devoted to the development, administration and servicing of affiliates. Similarly, almost nine-tenths
(87%) of the community foundations report that less than 25% of their CEO’s time is devoted to
affiliates. See Figure 7.5.
* Figure 7.5
Amount of foundation staff & CEO time currently devoted to geographic affiliates
* 136 of the 137 responding foundations answered the relevant questions.
The staff and CEO time that lead foundations dedicate to geographic affiliates appears to relate to the
number of affiliates the foundation hosts. Survey results illustrate that an economy of scale may exist
related to the number of affiliates hosted. Foundations that devote 50% to 74% of their staff or CEO’s
time to affiliates tend to have 10 or more affiliates, while a significantly lower percentage of foundations
with 10 or more affiliates devote 90% or more staff or CEO time to affiliate matters. This might suggest
that the more affiliates a foundation has, the better the systems it develops to serve affiliates or the
more specialized affiliate staff it can hire – either of which could help lower the total percentage of staff
time spent on affiliates. But many other interpretations are possible. See Figure 7.6a and 7.6b.
* Figure 7.6a
Amount of lead staff
time devoted to
geographic affiliates
and number of
affiliates hosted
* 135 out of the 137
foundations answered the relevant questions.
61%
26%
7%
3%
3%
42%
36%
12%
5%
1%
4%
0% 10% 20% 30% 40% 50% 60% 70%
Less than 10%
10-24%
25-49%
50-74%
75-89%
90% or more
Staff Time CEO Time
38%
14%
32%
37%
37%
14%
40%
23%
20%
38%
50%
40%
7%
29%
25%
86%
50%
20%
0% 20% 40% 60% 80% 100%
Less than 10% of staff time
10-24% of staff time
25-49% of staff time
50-74% of staff time
75-89% of staff time
90% or more of staff time
One affiliate 2 or 3 affiliates 4 to 9 affiliates 10 or more affiliates
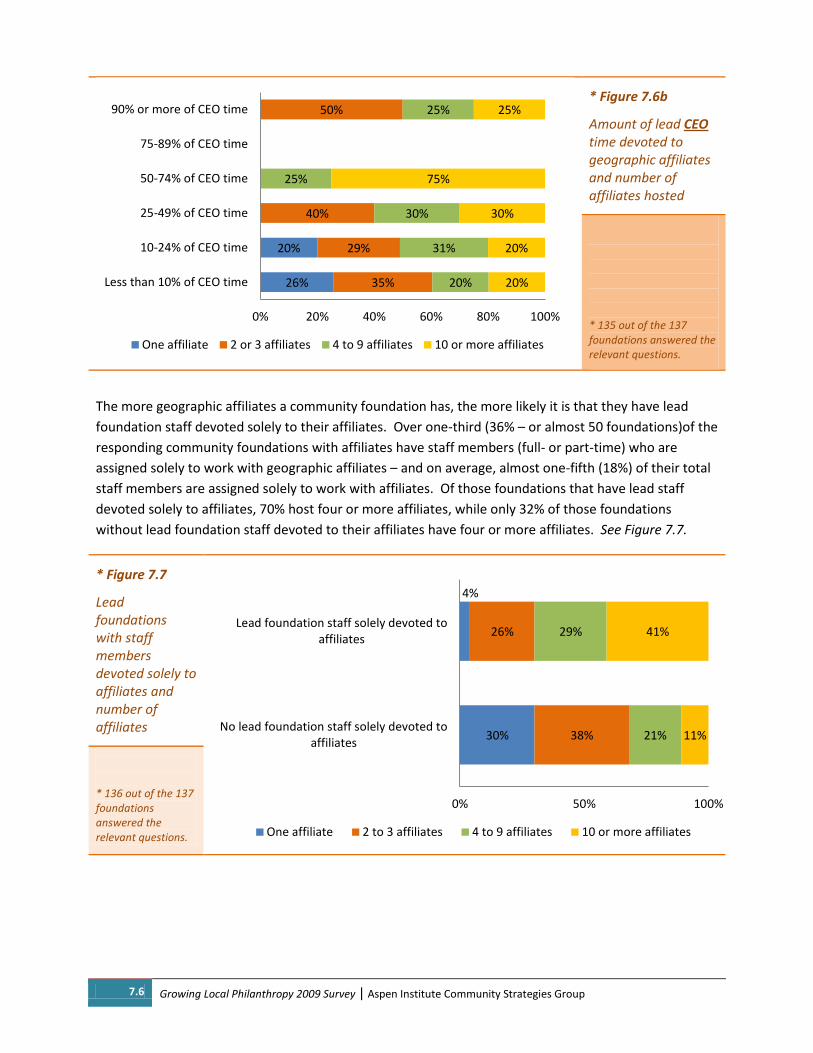
7.6 Growing Local Philanthropy 2009 Survey | Aspen Institute Community Strategies Group
* Figure 7.6b
Amount of lead CEO time devoted to geographic affiliates and number of affiliates hosted
* 135 out of the 137 foundations answered the relevant questions.
The more geographic affiliates a community foundation has, the more likely it is that they have lead
foundation staff devoted solely to their affiliates. Over one-third (36% – or almost 50 foundations)of the
responding community foundations with affiliates have staff members (full- or part-time) who are
assigned solely to work with geographic affiliates – and on average, almost one-fifth (18%) of their total
staff members are assigned solely to work with affiliates. Of those foundations that have lead staff
devoted solely to affiliates, 70% host four or more affiliates, while only 32% of those foundations
without lead foundation staff devoted to their affiliates have four or more affiliates. See Figure 7.7.
* Figure 7.7
Lead foundations with staff members devoted solely to affiliates and number of affiliates
* 136 out of the 137 foundations answered the relevant questions.
26%
20%
35%
29%
40%
50%
20%
31%
30%
25%
25%
20%
20%
30%
75%
25%
0% 20% 40% 60% 80% 100%
Less than 10% of CEO time
10-24% of CEO time
25-49% of CEO time
50-74% of CEO time
75-89% of CEO time
90% or more of CEO time
One affiliate 2 or 3 affiliates 4 to 9 affiliates 10 or more affiliates
30%
4%
38%
26%
21%
29%
11%
41%
0% 50% 100%
No lead foundation staff solely devoted toaffiliates
Lead foundation staff solely devoted toaffiliates
One affiliate 2 to 3 affiliates 4 to 9 affiliates 10 or more affiliates

Aspen Institute Community Strategies Group | Growing Local Philanthropy 2009 Survey 8.1
8. RURAL COVERAGE

8.2 Growing Local Philanthropy 2009 Survey | Aspen Institute Community Strategies Group
8. RURAL COVERAGE
ARE COMMUNITY FOUNDATIONS WITH GEOGRAPHIC AFFILIATES MORE RURAL?
The vast majority of the community foundations that participated in the survey serve rural areas. Ninety
percent (90%) of the 270 community foundations that responded to the survey reported that their
service area includes territory that qualifies under the survey’s definition of “rural.” 1 Notably,
foundations that serve no rural areas were four times more likely not to have affiliates than those that
serve any amount of rural territory. Just four percent (4%) of the community foundations with affiliates
do not serve any rural territory, while 16% of the foundations without affiliates serve no rural territory.
See Figure 8.1.
Figure 8.1
Foundations with and without affiliates and rural coverage
The survey also examined roughly what portion of their service territory responding foundations
consider “rural.” When comparing foundations with and without affiliates, we noted a potentially
puzzling pattern with regard to the amount of rural territory covered. While we previously established
that foundations that serve no rural areas are four times more likely not to have affiliates, we found no
clear pattern that related the amount of rural territory served to the likelihood that a foundation has
1 For this survey, respondents were asked to self-identify the portions of their territory that are “rural” using this definition: “It
is often said that you know rural when you see it. So, for this survey, “rural” means those places that are outside a major metropolitan area – meaning places that lie beyond an urban city center and its surrounding ring of suburbs.”
16%
84%
4%
96%
0% 50% 100%
Service area does not include ruralareas
Service area includes rural areas
Foundations with affiliates Foundations without affiliates
The surge in geographic affiliates represents major growth in rural philanthropy.
But plenty of geographic affiliates also call urban, suburban and mixed areas home.
And even foundations with scant rural territory are hosting geographic affiliates.
And

Aspen Institute Community Strategies Group | Growing Local Philanthropy 2009 Survey 8.3
geographic affiliates. In fact, the foundations that answered the survey with territories that are 90% or
more rural were more likely not to have affiliates. Similarly, foundations that serve a territory that is
less than 10% rural were more likely to have affiliates. Such counterintuitive patterns persist
throughout the various breakouts of “percent of rural territory in the service area.” See Figure 8.2a.
This might be explained by further analysis of the geographic size and territory type of the foundations
in each rural-coverage category. For example, it may be that many of the community foundations with
90% or more rural territory serve only one small town or community, and thus have no need for
geographic affiliates as a tool for organizing community philanthropy in their region.
Interestingly, foundations whose territory is predominantly rural – that is, more than 50% of their
territory is rural – are about equally likely to have or not have affiliates. Once again, geographic size and
territory type may have a great deal to do with this. But the data does highlight the fact that any
foundation might utilize geographic affiliates in their mix – and it underlines that whether or not to host
geographic affiliates can be a matter of choice and strategy for any foundation. See Figure 8.2b.
Figure 8.2a
Foundations with and without affiliates and the percentage of their service area that is rural
Figure 8.2b
Foundations with and without affiliates and the percentage of their service area that is rural
4%
8%
16%
11%
19%
42%
7%
11%
6%
23%
20%
33%
0% 10% 20% 30% 40% 50%
Less than 10%
10-24%
25-49%
50-74%
75-89%
90% or more
Foundations with affiliates Foundations without affiliates
28%
24%
72%
76%
0% 20% 40% 60% 80% 100%
Foundations without affiliates
Foundations with affiliates
Less than 50% rural 50% or more rural

8.4 Growing Local Philanthropy 2009 Survey | Aspen Institute Community Strategies Group
ARE GEOGRAPHIC AFFILIATES LOCATED IN RURAL AREAS?
The majority (75%) of affiliates reported in the survey are located in rural areas. It is worth noting that
among the 25% that are not in rural areas: 12% are located in a suburban area, 10% in an urban area,
3% in a mixed area (rural/urban), and 0.3% in another type of area. See Figure 8.3.
* Figure 8.3
Location of foundations’ geographic affiliates
* 1,402 of the total 1,415 affiliates are included here. The locations of 13 affiliates were not reported on the survey.
The survey results also show the foundations that host the most geographic affiliates are concentrated
in rural areas. Almost four-fifths (79%) of the responding foundations that have 10 or more affiliates
report that their service area is 75% or more rural. Foundations with one affiliate, however, are about
half as likely (40% vs. 79%) to serve areas that are 75% or more rural. See Figure 8.4.
* Figure 8.4
Service area of foundations and number of geographic affiliates
* 130 out of the 137 community foundations with affiliates answered the relevant questions. Percentages may not add up to 100 due to rounding.
3%
12%
75%
10%
0.3%
Urban
Suburban
Rural
Mix
Other
11%
7%
7%
3%
14%
9%
14%
7%
7%
9%
7%
29%
32%
17%
10%
11%
16%
24%
31%
29%
27%
31%
48%
0% 20% 40% 60% 80% 100%
One affiliate
2 or 3 affiliates
4 to 9 affiliates
10 or more affiliates
Less than 10% rural 10-24% rural 25-49% rural
50-74% rural 75-89% rural 90% or more rural

Aspen Institute Community Strategies Group | Growing Local Philanthropy 2009 Survey 8.5
Examining the location of the lead foundations’ geographic affiliates by region reveals some differences
in the percentage of affiliates in each type of location. For example, although three-quarters (75%) of all
the reported affiliates are located in rural areas, less than half (47%) of those affiliates located in the
very rural West are in rural areas. Those foundations in the West also reported a high percentage of
their affiliates in urban areas (12%) than in other regions. See Figure 8.5.
Several possibilities might explain the lower percentage of rural affiliates in the West. In general, the
community foundation movement is younger in several of the interior Western states, which means
some foundations may not yet be ready or willing to host affiliates. The Western states also tend to be
the largest and most spread out, which lends itself to establishing more free-standing small foundations
than it does to having a lead foundation serve a vast territory through an affiliate system. Time will
likely tell if one of these or another factor changes or explains the West’s lower proportion of
geographic affiliates.
* Figure 8.5
Location of foundations’ geographic affiliates by region
* 1,402 of the total 1,415 affiliates are included here. The locations of 13 affiliates were not reported on the survey.
47%
60%
75%
79%
80%
17%
22%
10%
7%
15%
36%
18%
15%
14%
5%
0% 20% 40% 60% 80% 100%
West
Northeast
Nationwide
Midwest
South
Rural Mixed Urban/Suburban


Aspen Institute Community Strategies Group | Growing Local Philanthropy 2009 Survey 9.1
9. THE GEOGRAPHIC AFFILIATE
DIFFERENCE
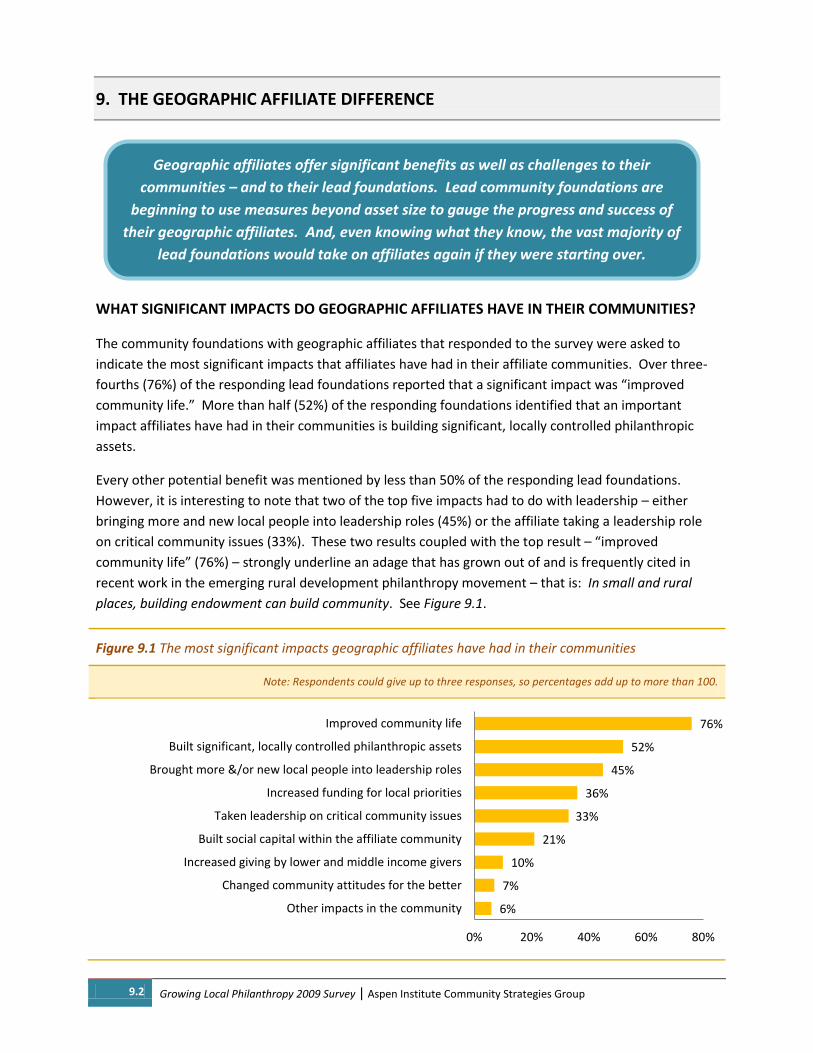
9.2 Growing Local Philanthropy 2009 Survey | Aspen Institute Community Strategies Group
9. THE GEOGRAPHIC AFFILIATE DIFFERENCE
WHAT SIGNIFICANT IMPACTS DO GEOGRAPHIC AFFILIATES HAVE IN THEIR COMMUNITIES?
The community foundations with geographic affiliates that responded to the survey were asked to
indicate the most significant impacts that affiliates have had in their affiliate communities. Over three-
fourths (76%) of the responding lead foundations reported that a significant impact was “improved
community life.” More than half (52%) of the responding foundations identified that an important
impact affiliates have had in their communities is building significant, locally controlled philanthropic
assets.
Every other potential benefit was mentioned by less than 50% of the responding lead foundations.
However, it is interesting to note that two of the top five impacts had to do with leadership – either
bringing more and new local people into leadership roles (45%) or the affiliate taking a leadership role
on critical community issues (33%). These two results coupled with the top result – “improved
community life” (76%) – strongly underline an adage that has grown out of and is frequently cited in
recent work in the emerging rural development philanthropy movement – that is: In small and rural
places, building endowment can build community. See Figure 9.1.
Figure 9.1 The most significant impacts geographic affiliates have had in their communities
Note: Respondents could give up to three responses, so percentages add up to more than 100.
6%
7%
10%
21%
33%
36%
45%
52%
76%
0% 20% 40% 60% 80%
Other impacts in the community
Changed community attitudes for the better
Increased giving by lower and middle income givers
Built social capital within the affiliate community
Taken leadership on critical community issues
Increased funding for local priorities
Brought more &/or new local people into leadership roles
Built significant, locally controlled philanthropic assets
Improved community life
Geographic affiliates offer significant benefits as well as challenges to their
communities – and to their lead foundations. Lead community foundations are
beginning to use measures beyond asset size to gauge the progress and success of
their geographic affiliates. And, even knowing what they know, the vast majority of
lead foundations would take on affiliates again if they were starting over.
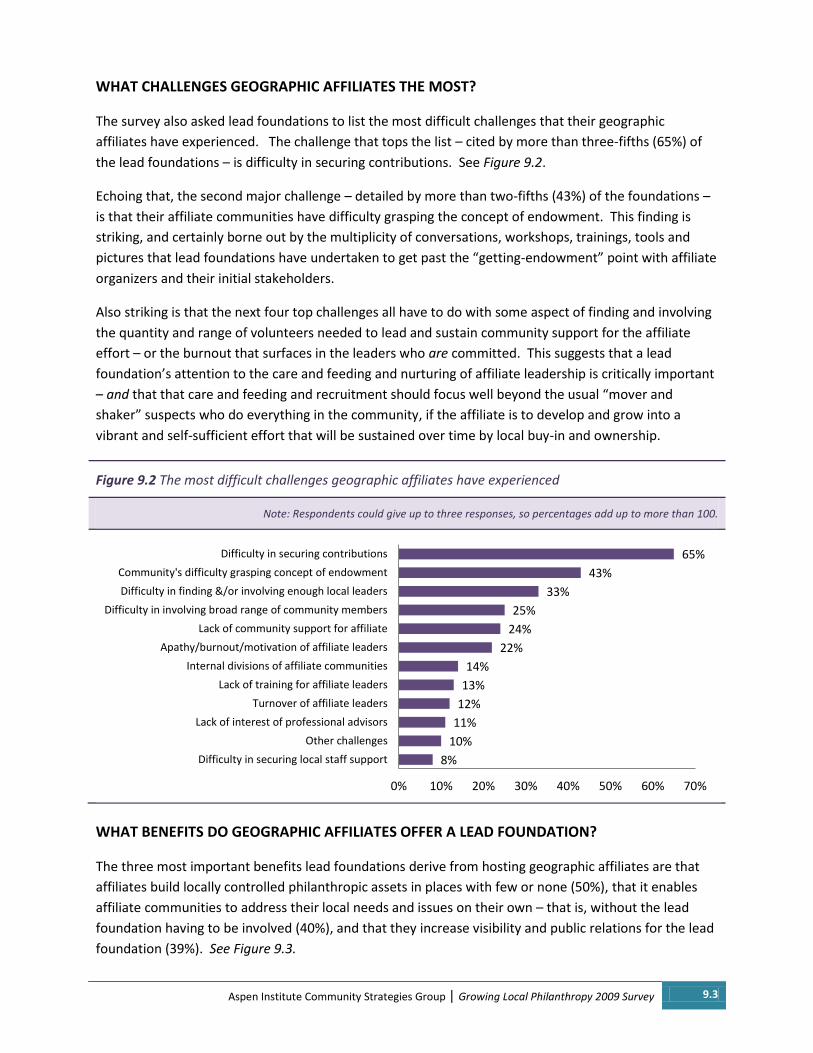
Aspen Institute Community Strategies Group | Growing Local Philanthropy 2009 Survey 9.3
WHAT CHALLENGES GEOGRAPHIC AFFILIATES THE MOST?
The survey also asked lead foundations to list the most difficult challenges that their geographic
affiliates have experienced. The challenge that tops the list – cited by more than three-fifths (65%) of
the lead foundations – is difficulty in securing contributions. See Figure 9.2.
Echoing that, the second major challenge – detailed by more than two-fifths (43%) of the foundations –
is that their affiliate communities have difficulty grasping the concept of endowment. This finding is
striking, and certainly borne out by the multiplicity of conversations, workshops, trainings, tools and
pictures that lead foundations have undertaken to get past the “getting-endowment” point with affiliate
organizers and their initial stakeholders.
Also striking is that the next four top challenges all have to do with some aspect of finding and involving
the quantity and range of volunteers needed to lead and sustain community support for the affiliate
effort – or the burnout that surfaces in the leaders who are committed. This suggests that a lead
foundation’s attention to the care and feeding and nurturing of affiliate leadership is critically important
– and that that care and feeding and recruitment should focus well beyond the usual “mover and
shaker” suspects who do everything in the community, if the affiliate is to develop and grow into a
vibrant and self-sufficient effort that will be sustained over time by local buy-in and ownership.
Figure 9.2 The most difficult challenges geographic affiliates have experienced
Note: Respondents could give up to three responses, so percentages add up to more than 100.
WHAT BENEFITS DO GEOGRAPHIC AFFILIATES OFFER A LEAD FOUNDATION?
The three most important benefits lead foundations derive from hosting geographic affiliates are that
affiliates build locally controlled philanthropic assets in places with few or none (50%), that it enables
affiliate communities to address their local needs and issues on their own – that is, without the lead
foundation having to be involved (40%), and that they increase visibility and public relations for the lead
foundation (39%). See Figure 9.3.
8%
10%
11%
12%
13%
14%
22%
24%
25%
33%
43%
65%
0% 10% 20% 30% 40% 50% 60% 70%
Difficulty in securing local staff support
Other challenges
Lack of interest of professional advisors
Turnover of affiliate leaders
Lack of training for affiliate leaders
Internal divisions of affiliate communities
Apathy/burnout/motivation of affiliate leaders
Lack of community support for affiliate
Difficulty in involving broad range of community members
Difficulty in finding &/or involving enough local leaders
Community's difficulty grasping concept of endowment
Difficulty in securing contributions

9.4 Growing Local Philanthropy 2009 Survey | Aspen Institute Community Strategies Group
Perhaps most interesting is the top two benefits that lead foundations claim they gain for themselves
from hosting geographic affiliates are also benefits for the affiliate communities. This may partially
explain why geographic affiliates are an increasingly popular form of organizing community philanthropy
– they offer and can create a win/win proposition both to lead foundations and the affiliate community.
Figure 9.3 The most important benefits to lead foundations of having geographic affiliates
Note: Respondents could give up to three responses, so percentages add up to more than 100.
WHAT CHALLENGES DO LEAD FOUNDATIONS FACE IN DEVELOPING GEOGRAPHIC AFFILIATES?
Of course, despite the benefits, lead foundations can also struggle with their affiliate work. The survey
asked foundations with geographic affiliates to list the most difficult organizational challenges they have
experienced in establishing and developing geographic affiliates. Far and away the lead challenge is the
lack of foundation time to focus on affiliates, cited by almost three-fifths (57%) of these foundations. On
that challenge’s heels is money, with 45% reporting a lack of foundation financial resources to support
their affiliate effort. See Figure 9.4.
Notably, more than one-quarter (27%) of the lead community foundations claimed they experienced
difficulty with questions of control and/or trust with their affiliates – and 10% also cited a lack of defined
responsibilities between the lead and its affiliates. These challenges may explain the move, cited in
Section 6 of this survey report, toward lead foundations establishing more formal written agreements,
policies and procedures with their affiliates.
One final highlight in these findings is the twin challenges of training affiliate leaders (37%), and
difficulty in meeting day-to-day affiliate needs (24%) – which could clearly have a connection. These
again suggest that devoting adequate attention and developing excellent systems to skill-up affiliate
leaders may have a pay-off for both the lead foundation and its affiliates.
1%
4%
8%
16%
19%
21%
22%
23%
28%
30%
39%
40%
50%
0% 20% 40% 60%
Other benefits fo the foundation
Address competition from other community foundations
Allow to assist places outside defined service area
Increase ability to serve hard-to-serve, isolated &/or diverse pop.
Build social capital within foundation's region
Bring new donors to the lead foundation
Help address/increase impact on issues affecting service area
Help address/increase impact on local issues
Provide better service to part of lead foundation's service area
Build lead foundation's assets
Increase visibility & public relations for foundation
Help communities address local needs & issues
Build locally controlled philanthropic assets in places with few or none

Aspen Institute Community Strategies Group | Growing Local Philanthropy 2009 Survey 9.5
Figure 9.4 The most difficult organizational challenges lead foundations have experienced in establishing and
developing geographic affiliates
Note: Respondents could give up to three responses, so percentages add up to more than 100.
WHAT MEASURES HELP LEAD FOUNDATIONS GAUGE GEOGRAPHIC AFFILIATE PROGRESS?
Thirty-six percent (36% – or 49 foundations) of the responding community foundations with affiliates
use formal measures besides asset size to periodically gauge the progress and success of geographic
affiliates. Of these foundations, more (46%) use grantmaking measures than other kinds of measures –
for example, the number of grants made, impact of grants, and quality of grantmaking process. Giving,
donor and fund activity measures (e.g., number of gifts, donor engagement) were listed by 39% of the
foundations, while 35% include advisory board activity and capacity measures (effective advisory board
governance, advisor attendance at training, etc.) to gauge the progress and success of their affiliates.
Some foundations (28%) are even using community participation and results measures (for example,
community leadership, community participation) – which are probably the most difficult measures to
undertake, but likely the most important. See Figure 9.5.
* Figure 9.5
The top measures besides asset size foundations use to gauge affiliate progress/success
Note: Respondents could give up to two responses, so percentages add to more than 100.
* 46 out of 49 foundations with affiliates who use formal measures besides asset size reported on what those measures are.
7%
10%
10%
12%
15%
24%
27%
36%
37%
44%
57%
0% 20% 40% 60%
Lack of documents, materials, etc. to work with affiliates
Lack of defined responsibilities btw foundation & affiliates(s)
Difficulty training or finding lead foundation staff to assist affiliates
Difficulty mantaining board interest in/commitment to affiliates
Other organizational challenges
Difficulty meeting day-to-day affiliate needs
Questions of control &/or trust btw foundation & affiliate(s)
Difficulty prospecting donors for affiliates
Training affiliate leaders
Lack of foundation financial resources
Lack of foundation time to focus on affiliates
11%
28%
35%
39%
46%
0% 10% 20% 30% 40% 50%
Other
Community Participation andResults Measures
Advisory Board Activity andCapacity Measures
Giving, Donor and Fund ActivityMeasures
Grantmaking Measures

9.6 Growing Local Philanthropy 2009 Survey | Aspen Institute Community Strategies Group
WHY DO FOUNDATIONS WITHOUT AFFILIATES WANT TO DEVELOP GEOGRAPHIC AFFILIATES?
The foundations that reported not having geographic affiliates at the time of the survey were asked if
they wish or plan to develop affiliates in the future, and if so, why. About one-quarter (23%) of the
foundations without affiliates responded that they wish or plan to develop geographic affiliates in the
future. When asked the top three reasons they wish or plan to develop affiliates, over half (57%) of
these foundations responded that it was because an affiliate program will build social capital within the
region. Half (50%) of these same foundations also identified that an affiliate program will build locally
controlled philanthropic assets in places that have few or none, whereas two-fifths (40%) said that they
wish or plan to develop affiliates because it will build the lead foundation’s assets. See Figure 9.6.
Figure 9.6
The top three reasons foundations currently without affiliates wish to or plan to develop affiliates
Note: Respondents could give up to three responses, so percentages add up to more than 100.
WOULD LEAD FOUNDATIONS WITH AFFILIATES DO IT AGAIN?
One of the most definitive findings in this study was that – despite the challenges experienced by
community foundations with affiliates – more than nine out of ten say they would do it again. Ninety-
one percent of the responding community foundations currently with affiliates reported that if their
foundation was starting all over again, knowing what they know now, they would still seek to have
and/or agree to hold geographic affiliates. See Figure 9.8.
* Figure 9.8
Whether or not community foundations with affiliates – knowing what they do now – would still seek to host affiliates
* 131 of the 137 responding foundations answered this question.
40%
50%
57%
0% 20% 40% 60%
It will build lead foundation's assets
It will build locally controlledphilanthropic assets in places that
have few or none
It will build social capital withinregion
91%
9%
Would still seek to hostaffiliates
Would NOT seek to hostaffiliates

Community Strategies Group
One Dupont Circle NW, Suite 700
Washington, DC 20036 202-736-5804 Fax:202-293-0525
www.aspencsg.org/rdp