GAO-07-403 Natural Hazard Mitigation: Various Mitigation ...
1Power for All by 2012
India: Growing Energy Needs
and
Mitigation Options
Gireesh B. Pradhan, IASAdditional Secretary,
Ministry of Power, Government of India.5th May 2008
2Power for All by 2012
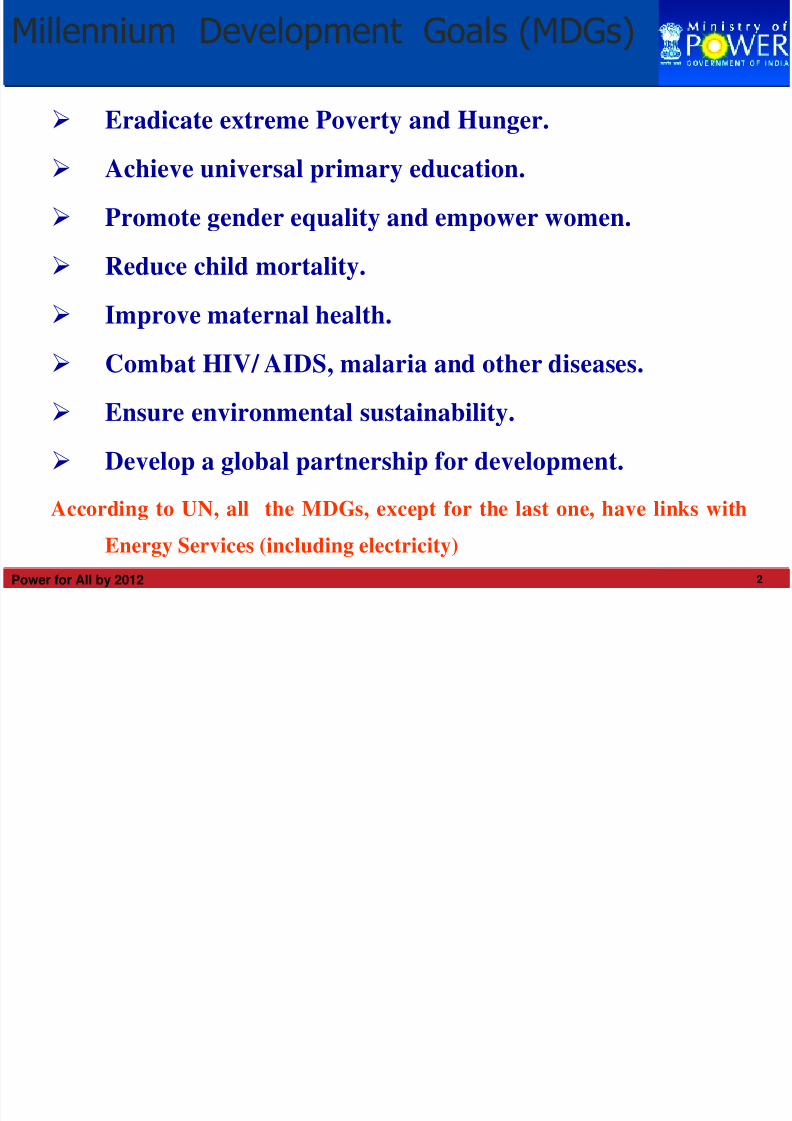
Eradicate extreme Poverty and Hunger.
Achieve universal primary education.
Promote gender equality and empower women.
Reduce child mortality.
Improve maternal health.
Combat HIV/ AIDS, malaria and other diseases.
Ensure environmental sustainability.
Develop a global partnership for development.
According to UN, all the MDGs, except for the last one, have links with
Energy Services (including electricity)
Millennium Development Goals (MDGs)
3Power for All by 2012
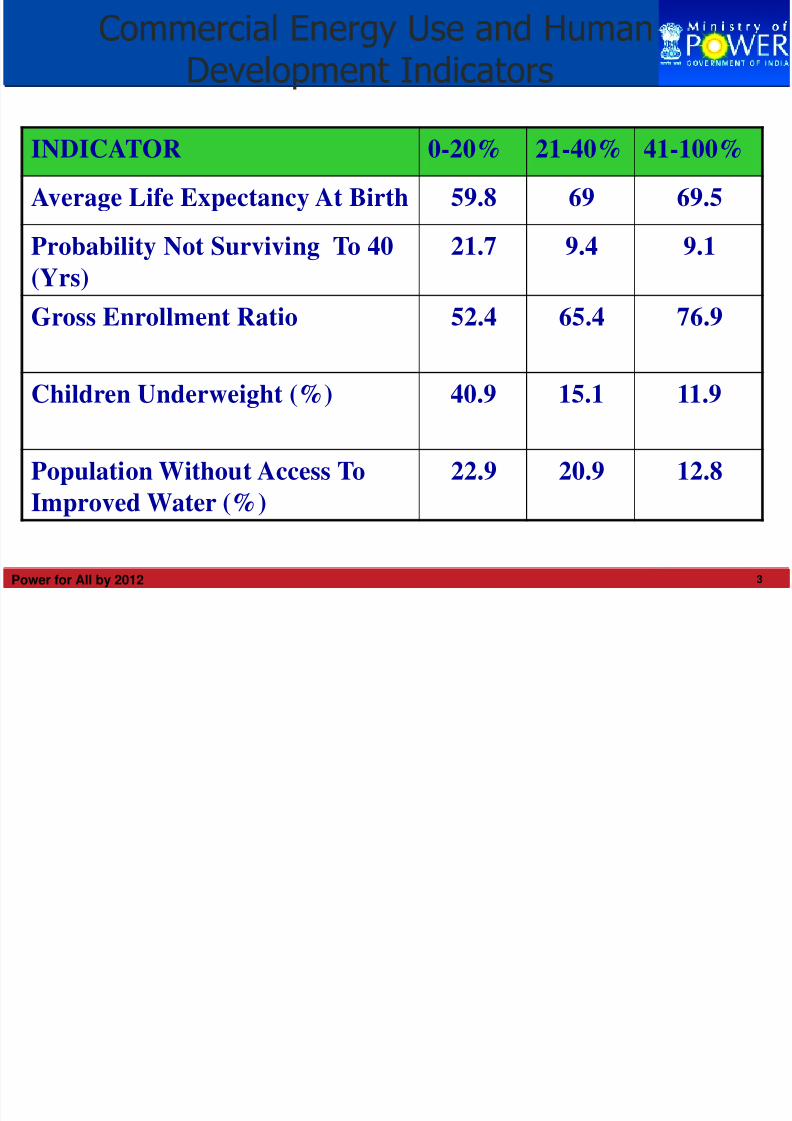
Commercial Energy Use and HumanDevelopment Indicators
INDICATOR 0-20% 21-40% 41-100%
Average Life Expectancy At Birth 59.8 69 69.5
Probability Not Surviving To 40
(Yrs)
21.7 9.4 9.1
Gross Enrollment Ratio 52.4 65.4 76.9
Children Underweight (%) 40.9 15.1 11.9
Population Without Access To
Improved Water (%)
22.9 20.9 12.8
4Power for All by 2012
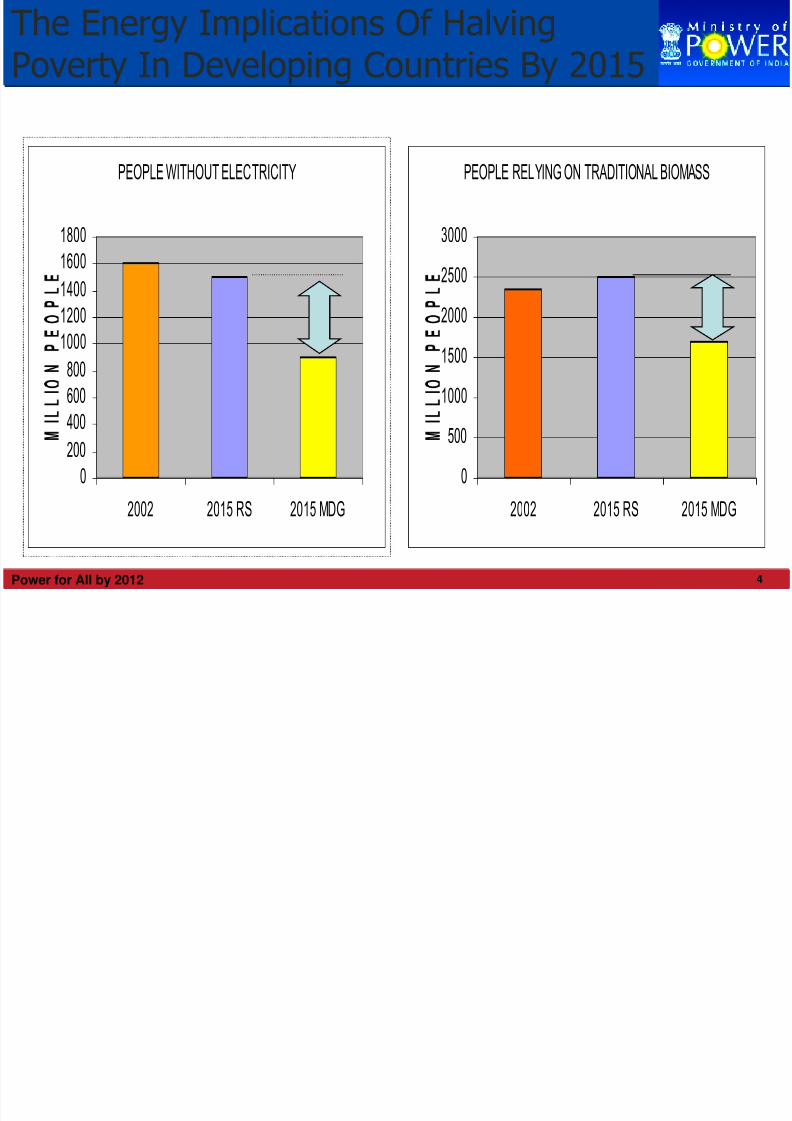
The Energy Implications Of HalvingPoverty In Developing Countries By 2015
PEOPLE WITHOUT ELECTRICITY
0
200
400
600
800
1000
1200
1400
1600
1800
2002 2015 RS 2015 MDG
PEOPLE RELYING ON TRADITIONAL BIOMASS
0
500
1000
1500
2000
2500
3000
2002 2015 RS 2015 MDG
5Power for All by 2012
India has been able to achieve an economic growth rate of 8%
per annum during last few years; and after achieving 8.7 %
growth during 2007-08, could aim at a double digit growth
rate.
Growth of Industrial sector recorded 9% in the last 3 years
and has touched a growth rate of 9.4% in 2007-08.
Gross domestic saving rate rising and reached about 35%.
There has been phenomenal growth in gross domestic
investment which has reached 33.8%.
Foreign exchange reserves are at a very comfortable level of
about USD 200 billion.
Strengths of Indian Economy
6Power for All by 2012
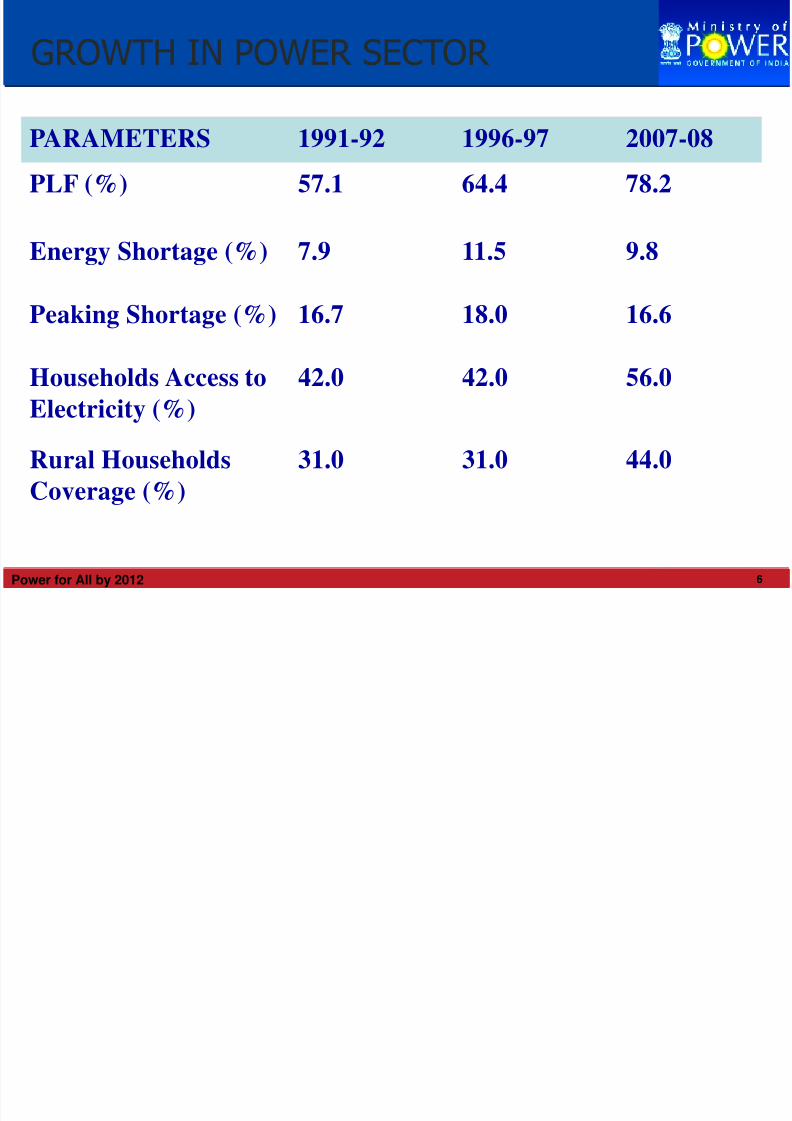
PARAMETERS 1991-92 1996-97 2007-08
PLF (%) 57.1 64.4 78.2
Energy Shortage (%) 7.9 11.5 9.8
Peaking Shortage (%) 16.7 18.0 16.6
Households Access to
Electricity (%)
42.0 42.0 56.0
Rural Households
Coverage (%)
31.0 31.0 44.0
GROWTH IN POWER SECTOR
7Power for All by 2012
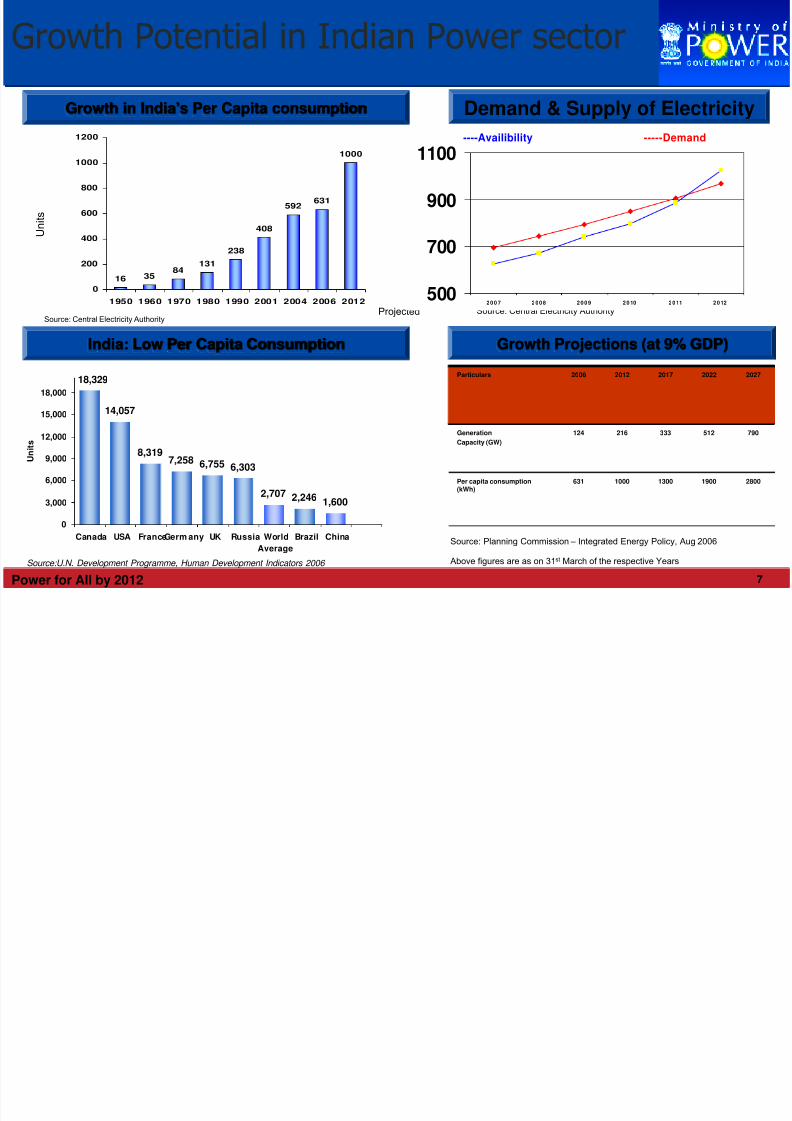
Growth Potential in Indian Power sector
16 3584
131
238
408
592631
1000
0
200
400
600
800
1000
1200
1 95 0 1 96 0 1 97 0 1 98 0 1 99 0 2 00 1 2 00 4 2 00 6 2 01 2
14,057
8,3197,258 6,755 6,303
2,246 1,6002,707
18,329
0
3,000
6,000
9,000
12,000
15,000
18,000
Canada USA FranceGerm any UK Russia World
Average
Brazil China
U n i t s
India: Low Per Capita Consumption
Growth in India’s Per Capita consumption
Projected
U n
i t s
Demand & Supply of Electricity
Growth Projections (at 9% GDP)
Particulars 2006 2012 2017 2022 2027
Generation
Capacity (GW)
124 216 333 512 790
Per capita consumption(kWh)
631 1000 1300 1900 2800
Source: Central Electricity Authority
Above figures are as on 31st March of the respective Years
Source: Planning Commission – Integrated Energy Policy, Aug 2006
Source:U.N. Development Programme, Human Development Indicators 2006
Source: Central Electricity Authority
500
700
900
1100
2007 2008 2009 2010 2011 2012
----Availibility -----Demand
8Power for All by 2012
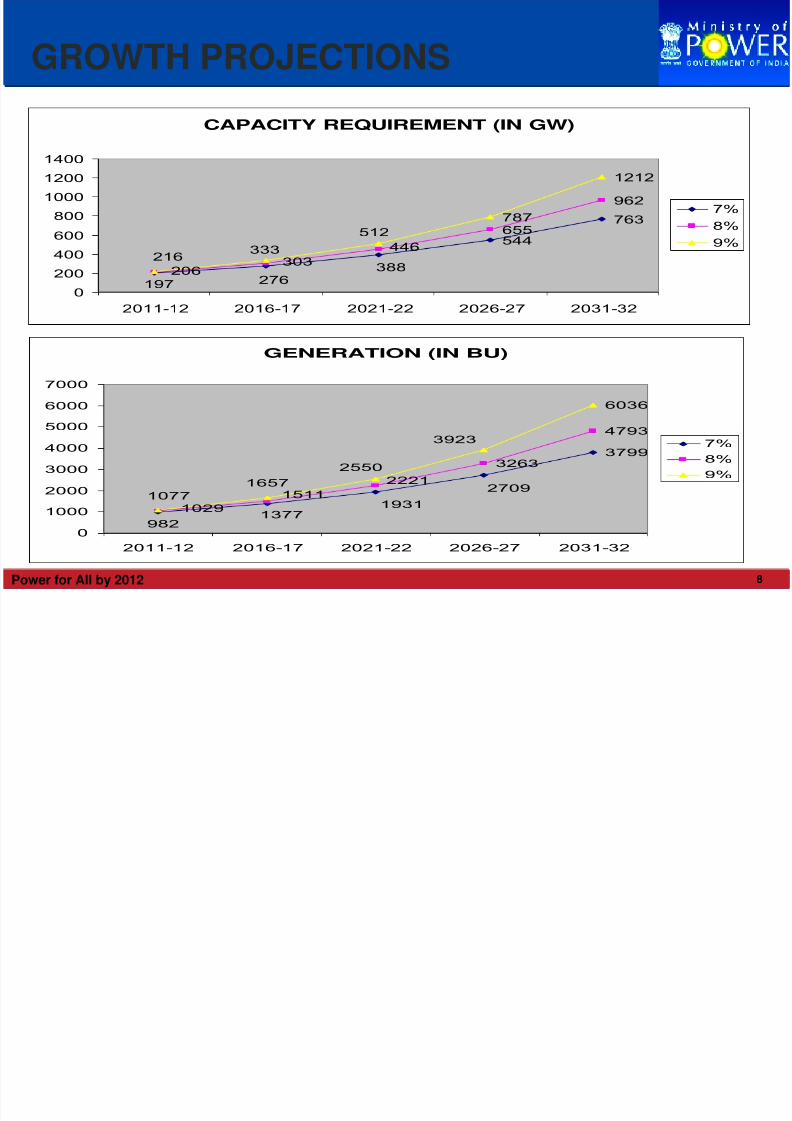
GROWTH PROJECTIONS
CAPACITY REQUIREMENT (IN GW)
544
763655
962
1212
388
276197
446
303206
512
787
333216
0
200
400
600
800
1000
1200
1400
2011-12 2016-17 2021-22 2026-27 2031-32
7%
8%
9%
GENERATION (IN BU)
3799
3263
4793
6036
1377
2709
1931
982
1511
2221
1029
1657
2550
3923
1077
0
1000
2000
3000
4000
5000
6000
7000
2011-12 2016-17 2021-22 2026-27 2031-32
7%
8%
9%
9Power for All by 2012
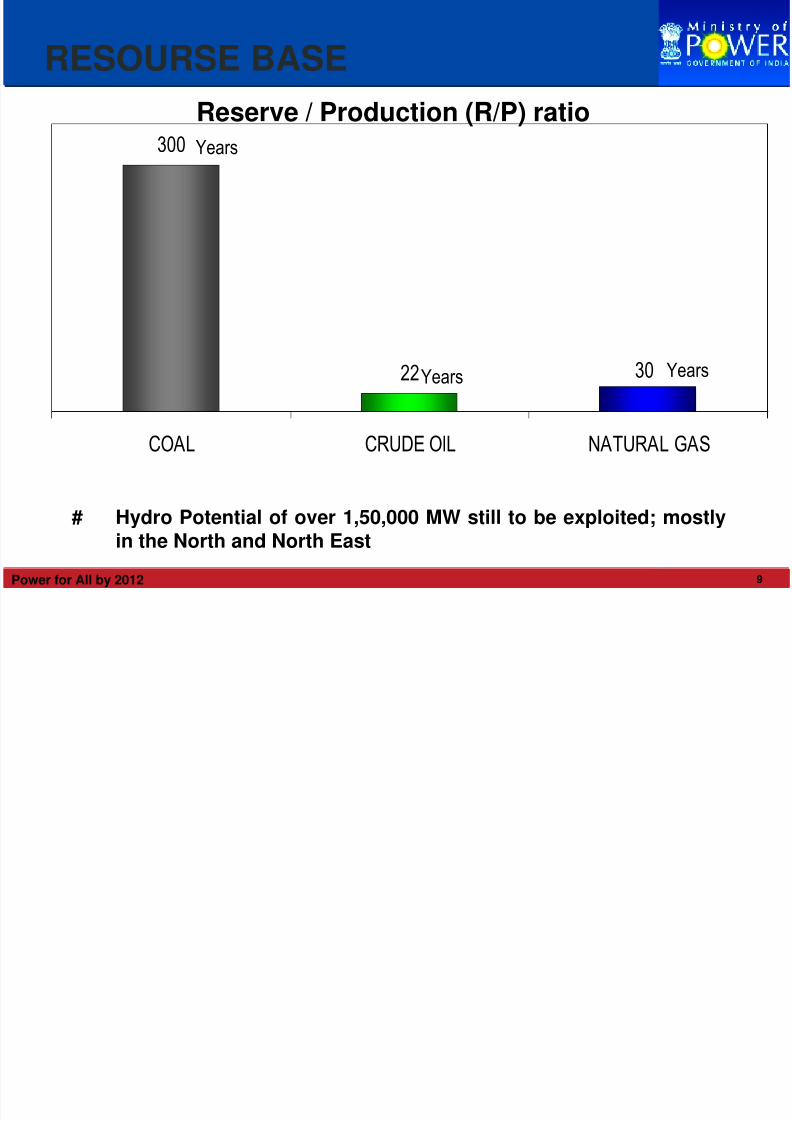
300
22 30
COAL CRUDE OIL NATURAL GAS
Years
Years Years
# Hydro Potential of over 1,50,000 MW still to be exploited; mostly
in the North and North East
Reserve / Production (R/P) ratio
RESOURSE BASE

10Power for All by 2012
INDIA AND THE REST OF THE WORLD
PARAMETERS INDIA OECD WORLD
Energy Supply
(Mtoe)
537.31 5548 11434
Energy Intensity
(Kgoe/$PPP GDP)
0.16 0.20 0.32
Per Capita Electricity
Consumption (kWh)
672 8365 2596
Per Capita CO2
Emissions (Tonnes)
1.05 11.02 4.22
Mtoe : Million tons of oil equivalent, Kgoe : Kilo gram oil equivalent
11Power for All by 2012
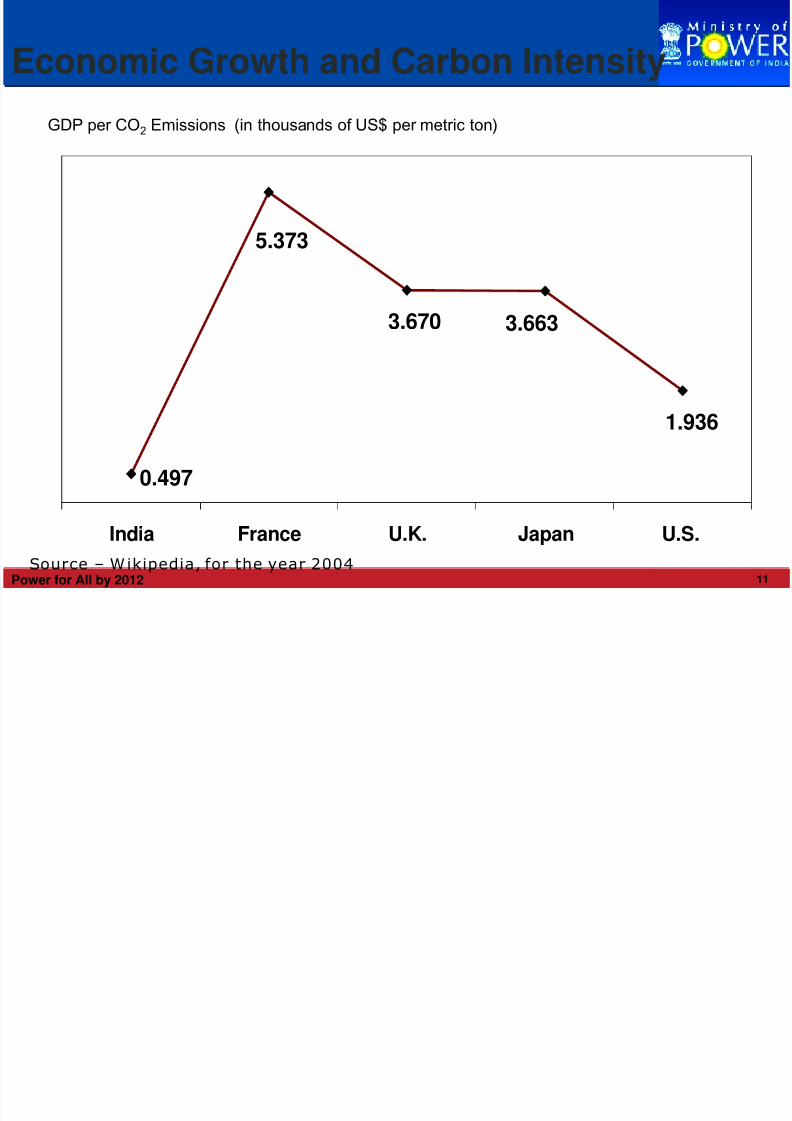
Economic Growth and Carbon Intensity
Source – Wikipedia, for the year 2004
GDP per CO2 Emissions (in thousands of US$ per metric ton)
1.936
0.497
5.373
3.670 3.663
India France U.K. Japan U.S.
12Power for All by 2012
Currently, India’s per-capita GHG emissions are 24% of global
average, 5% of the US, 12% of EU, 11% of Japan.
In cumulative terms,, India has 2% of global GHG emissions.
According to World Energy Outlook’s projections, China’s
share in cumulative emissions between 1900 to 2030 would rise
to 16% approaching that of the US (25%) and the EU (18%).
India’s cumulative emissions are projected to reach 4% which
would be comparable to those of Japan.
Our GHG emissions now, and for many decades to come will
remain within any reasonable measure of our legitimate
environmental space.
India’s Overall Perspective
13Power for All by 2012
Overarching Principles of the UNFCCC:
Article 4.7 of the UNFCCC recognizes that economic and social
development and poverty eradication are the first and
overriding priorities of the developing country Parties.
The Preamble also recognizes that the share of global emissions
originating in developing countries will grow to meet their social
and development needs, and that their per-capita emissions are
still relatively low.
Non-negotiated initiatives outside the UNFCCC process in
which all Parties are not necessarily represented cannot furnish
inputs to the UNFCCC process : Reference is to “Renewables
Initiative” (Germany), “Energy Initiative” (UK), etc.
India’s Overall Perspective: Cont..
14Power for All by 2012
India’s per-capita consumption of electricity and per capita CO2
emissions amongst the lowest in the world.
A large proportion of the country’s population lives below
poverty line (BPL).
Over 50% of population without access to electricity. Some 70
households use traditional biomass for cooking.
India is at the early stages of industrialization and the economic
development – Convergence in per capita income level, energy
consumption and CO2 emission would happen as development
reaches the level of OECD countries.
India’s Overall Perspective: Cont..
Contd…
15Power for All by 2012
Feasible hydro potential shall be fully developed. All hydro
irrespective of size is renewable. We have negotiated hard
against narrower definition which excludes large hydro.
Strong programme for development of other renewable and
non- conventional sources also. Good achievement in exploiting
wind energy potential – Fourth largest in the world.
Electricity Act gives preferential treatment to energy from non-
conventional resources.
Access to fuel remains the key issue for development of nuclear
India’s Overall Perspective: Cont..
Contd…
16Power for All by 2012
Dependence on fossil fuels would remain in the short and
medium term - IEA also projects this.
Availability and pricing issues for usage of gas.
Abundant coal reserves, future electricity needs to be met
primarily from coal.
Usage of clean coal technologies if cost effective. (IGCC)
Energy efficiency is being promoted vigorously.
Super Critical Technology : NTPC, UMPP.
Tariff Policy lays down road - map for reduction of cross
subsidies.
India’s Overall Perspective: Cont..
17Power for All by 2012
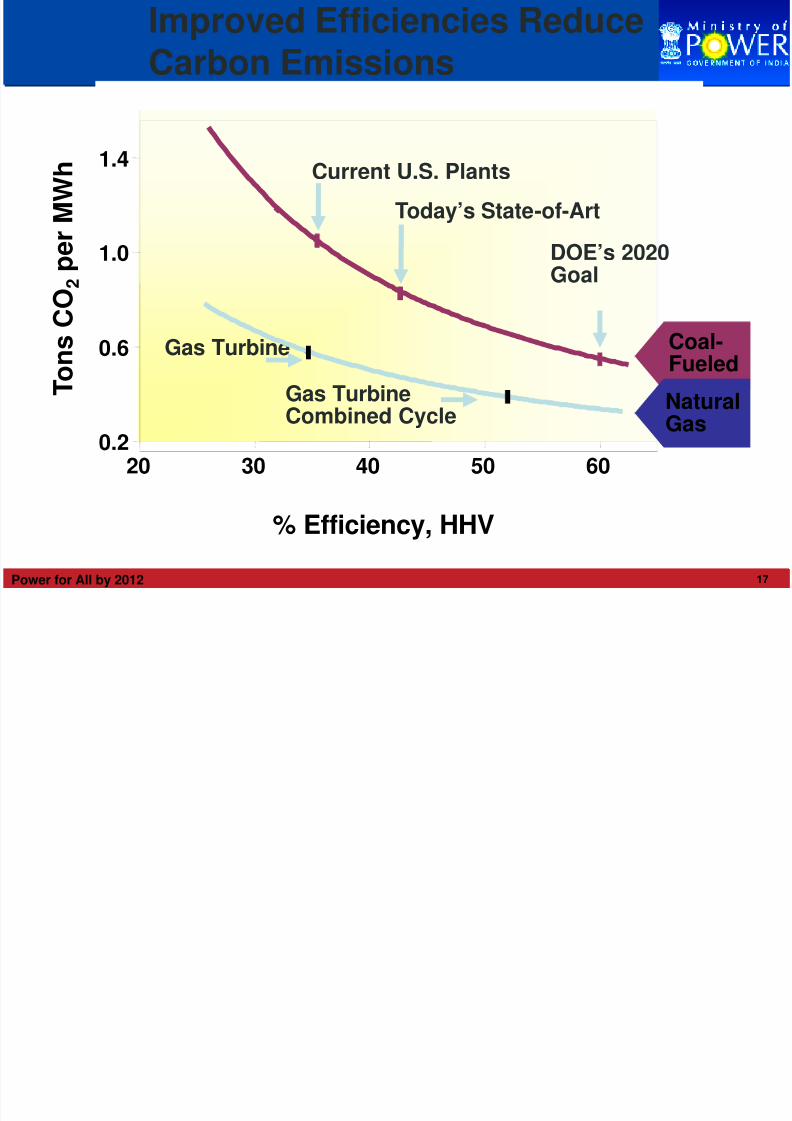
Improved Efficiencies ReduceCarbon Emissions
Current U.S. Plants
Today’s State-of-Art
DOE’s 2020Goal
Gas Turbine
Gas TurbineCombined Cycle
% Efficiency, HHV
T o n s C O
2 p e r M W h
0.2
0.6
1.0
1.4
20 30 40 50 60
Coal-Fueled
NaturalGas
18Power for All by 2012
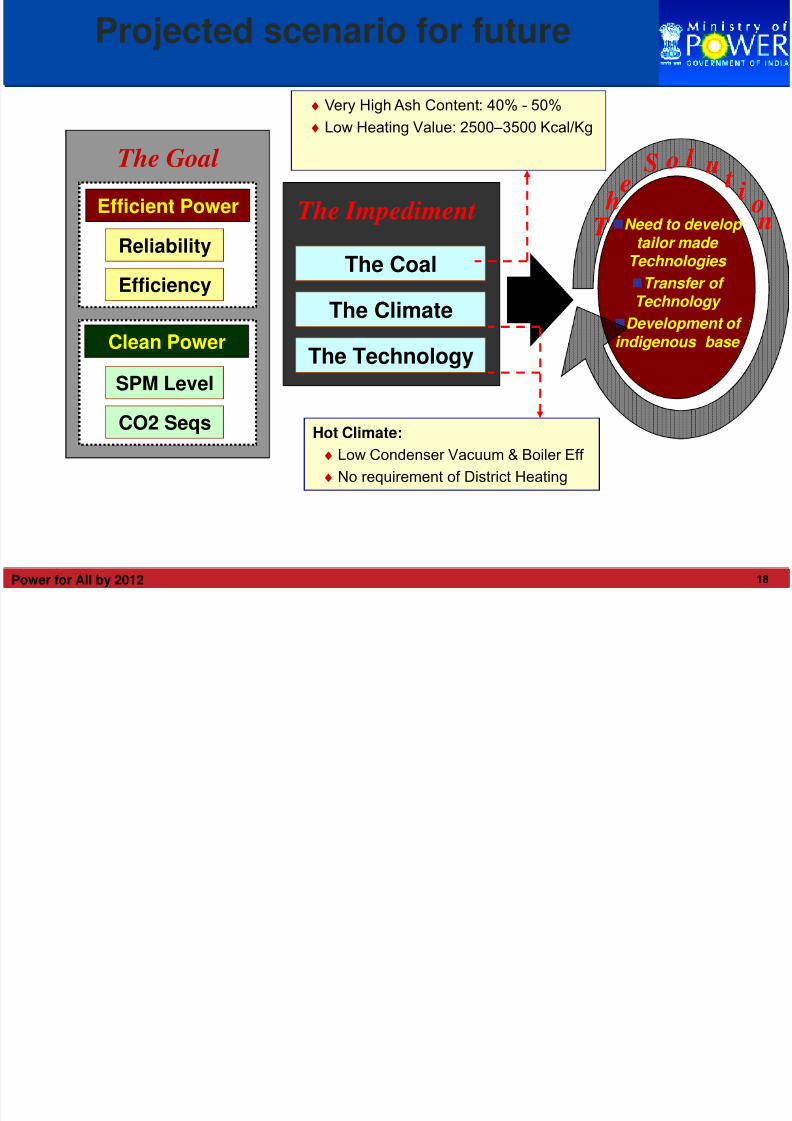
The Goal
Need to develop
tailor made Technologies
Transfer of Technology
Development of
indigenous base
Efficient Power
Reliability
Efficiency
Clean Power
SPM Level
CO2 Seqs
The Impediment
The Coal
The Climate
The Technology
Hot Climate:
♦ Low Condenser Vacuum & Boiler Eff
♦ No requirement of District Heating
♦ Very High Ash Content: 40% - 50%
♦ Low Heating Value: 2500–3500 Kcal/Kg
T h
eS o l u
ti o n
Projected scenario for future

19Power for All by 2012
Deployment of CCS ??
Discussions in the context of Clean Coal Technologies
Wide spectrum – supercritical, IGCC ,CCS
Different levels of commercialization and development
Our stand –we will deploy what is cost effective and safe
We are using Supercritical –NTPC, UMPP
IGCC -- yet to become commercial, 30% extra cost
CCS – will double the cost of power generation, concerns about safety
of storage
Demonstration Plants not to be located in densely populated
developing countries.
The difference between greener technologies and existing technologies
to be funded by developed countries as part of ‘Differentiated
Responsibilities’
20Power for All by 2012
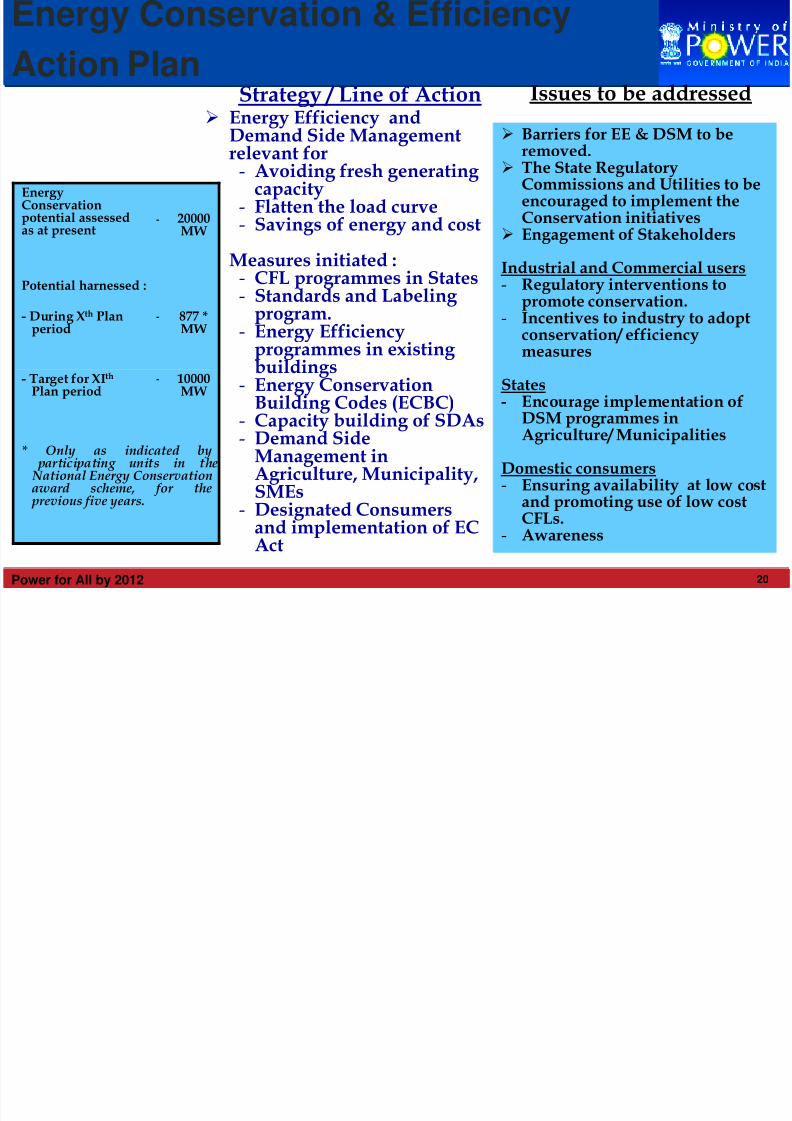
Energy Efficiency andDemand Side Managementrelevant for
- Avoiding fresh generating capacity
- Flatten the load curve- Savings of energy and cost
Measures initiated :- CFL programmes in States- Standards and Labeling
program.- Energy Efficiency
programmes in existing buildings
- Energy ConservationBuilding Codes (ECBC)
- Capacity building of SDAs- Demand Side
Management inAgriculture, Municipality,SMEs
- Designated Consumersand implementation of ECAct
Barriers for EE & DSM to beremoved.
The State RegulatoryCommissions and Utilities to beencouraged to implement theConservation initiatives
Engagement of Stakeholders
Industrial and Commercial users- Regulatory interventions to
promote conservation.- Incentives to industry to adopt
conservation/ efficiencymeasures
States- Encourage implementation of
DSM programmes inAgriculture/ Municipalities
Domestic consumers- Ensuring availability at low cost
and promoting use of low costCFLs.
- Awareness
Strategy / Line of Action Issues to be addressed
EnergyConservationpotential assessedas at present
- 20000MW
Potential harnessed :
- During Xth Planperiod
- 877 *MW
- Target for XIth
Plan period- 10000
MW
* Only as indicated by participating units in the National Energy Conservationaward scheme, for the previous five years.
Energy Conservation & Efficiency
Action Plan
21Power for All by 2012
Barriers to the Efficient Use of Energy
Energy conservation, and the choice of energy-efficienttechnologies, are win-win options
● Many win-win choices are not easily adopted
Market barriers constrain adoption of win-win options
● Comparative energy use information is unavailable
● First cost is higher than those of energy-inefficientoptions
● Costs and benefits accrue to different people
● Uncertainty of operating costs, performance andreliability, especially of new technologies and practices,deters investments by users and financiers
22Power for All by 2012
Energy Conservation Act, 2001, addresses some market failuresby enabling:
● Setting of minimum energy standards for, and affixingenergy-consumption labels on appliances and equipment
● Promulgation of Energy Conservation Building Codes
● Energy use monitoring, verification and reporting by largeenergy users, and the establishment of energy consumptionnorms for these consumers
BEE set up to promote:
● Demand-side management by distribution companies
● Enhancing energy conservation in exiting buildings,especially through Energy Service Companies (ESCOs)
● Outreach and awareness programmes
Legal and Policy Interventions to
Promote Energy Efficiency
23Power for All by 2012
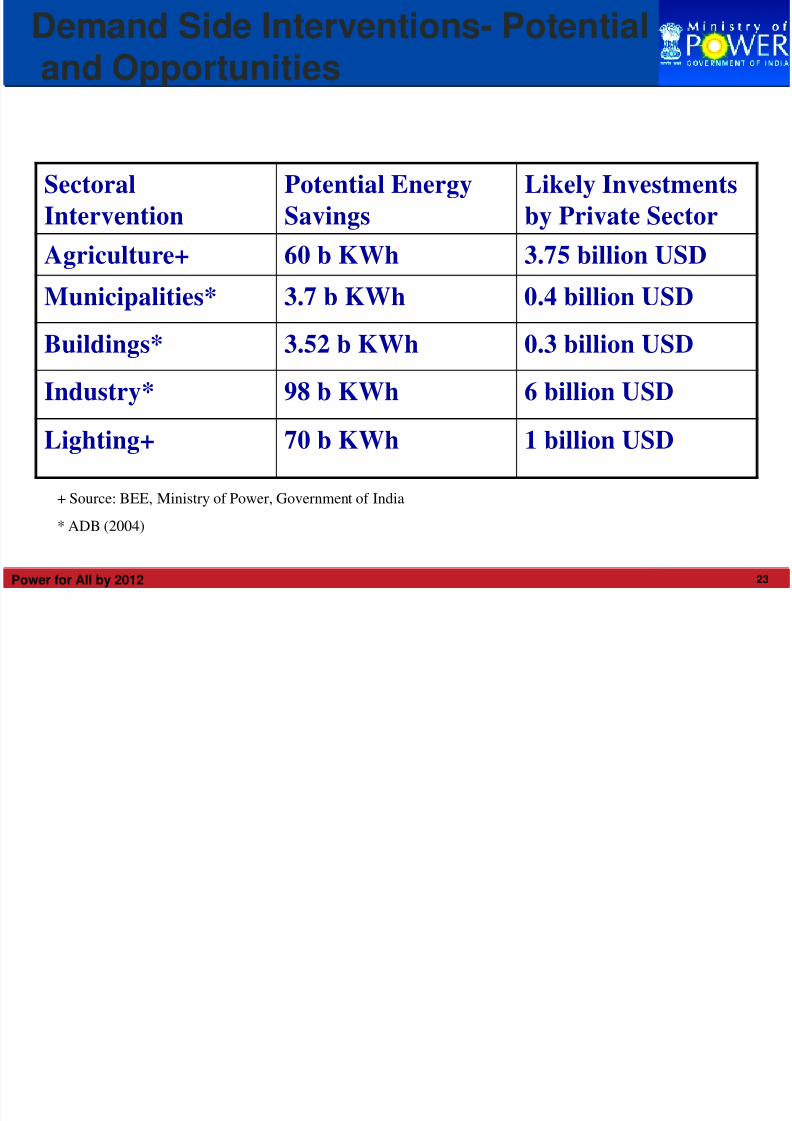
Demand Side Interventions- Potentialand Opportunities
Sectoral
Intervention
Potential Energy
Savings
Likely Investments
by Private Sector
Agriculture+ 60 b KWh 3.75 billion USD
Municipalities* 3.7 b KWh 0.4 billion USD
Buildings* 3.52 b KWh 0.3 billion USD
Industry* 98 b KWh 6 billion USD
Lighting+ 70 b KWh 1 billion USD
+ Source: BEE, Ministry of Power, Government of India
* ADB (2004)
24Power for All by 2012
Approach and Methodology- EnergyEfficiency Action Plan
Sector specific approach- barriers being addressed separately
in each sector- e.g.. Use of CDM to reduce cost of CFL under
BLY, creation of DPRs and provision of financing for
agriculture/ municipal and buildings, capacity building for use
of ECBC for commercial sector.
Adopting sectoral approach by facilitating creation of markets
for energy efficiency
Emphasis on conducive environment, handholding of early
movers
8 Different sector specific schemes being implemented to take
note of this requirement
25Power for All by 2012
CDM Based CFL Scheme
26Power for All by 2012
CDM Based CFL Scheme- BachatLamp Yojana (BLY)
Scheme seeks to replace estimated 400 million incandescentbulbs by CFLs- could save 6000 MW by 2012
BEE has prepared a Programme of Activities (PoA) as avoluntary coordinated effort to facilitate the scheme in theentire country and reduce transaction costs
18 CFL manufacturers/ suppliers have agreed to participate-14 states have initiated the scheme
Monitoring Plan finalised
2 pilot projects in Haryana and Andhra Pradesh submitted toCDM Executive Board for registration
Leveraging of CDM revenues to remove the high first costbarrier- market transformation in favour of efficient lighting
27Power for All by 2012
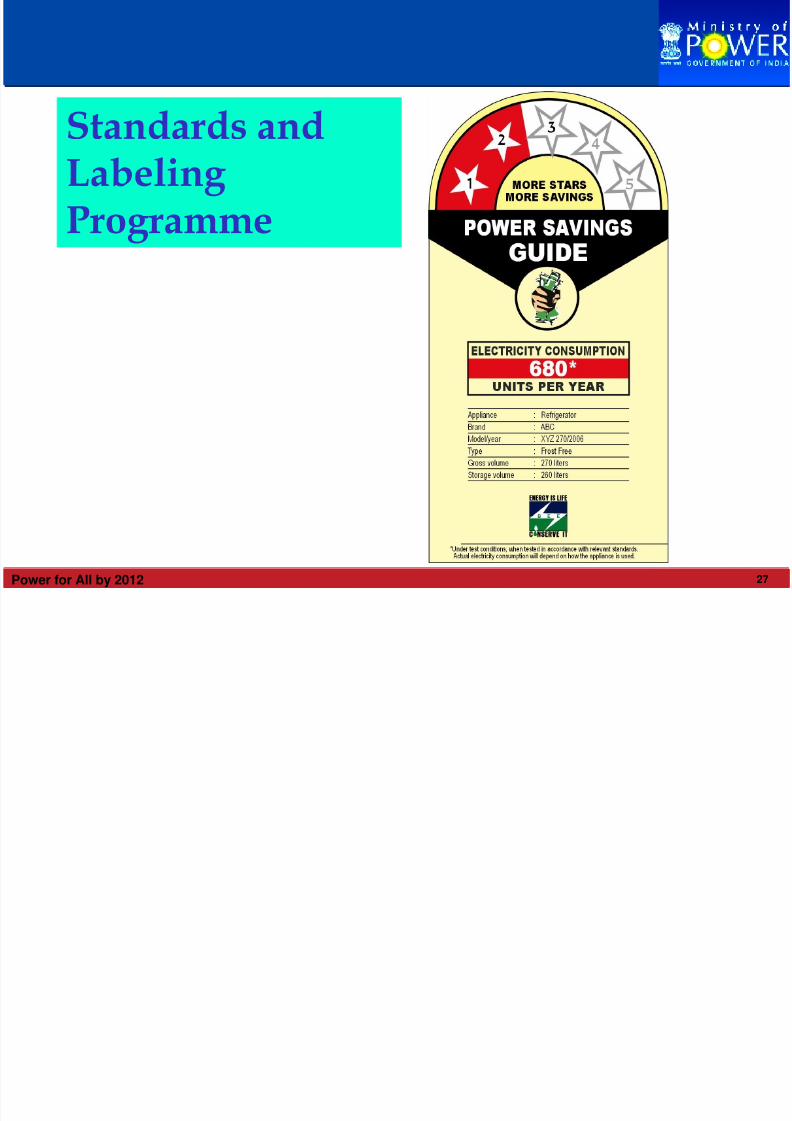
Standards andLabeling Programme
28Power for All by 2012
Standards & Labeling Programme
The National Energy Labeling Programme launched byHon’ble Union Minister of Power on 18th May, 2006.
• To create appropriate legal and regulatory environment forenergy efficient end use products
• To provide the consumer an informed choice about energysaving by using efficient devices
• To gear up Indian industry to compete in markets that havemade/ are making such standards mandatory e.g.. US or EU
• To stimulate market transformation in favour of energyefficient equipments and appliances- both from supply anddemand side
• To reduce overall energy consumption by use of suchequipments/ appliances- 18 BU by 2012 (~3000 MW)
• To provide assistance/ support to Small & MediumManufacturers
29Power for All by 2012
• Voluntary labeling for ACs, Refrigerators, Tube lights (TL),
motors and Distribution Transformers already in place
• 90% of TL, 80% of Refrigeration and 75% of AC industry
on board
• Consumer awareness campaign launched
• Independent institutional mechanism for check and
challenge testing on random basis for labeled equipments
being conducted.
• Regulation for mandatory labeling under section 14 of the
Energy Conservation Act to be notified
• Preliminary results for 2007-08 indicate energy savings by
use of these equipments equivalent to about 300 MW of
capacity
Standards & Labeling Programme…
30Power for All by 2012
Statutory agencies at state level to implement EC Act- key to
implement EC Act at State level
Capacity building necessary to enable them to discharge
regulatory, facilitative and enforcement functions under the
Act
Institutional capacity limited- both in terms of human and
infrastructure resources
Most states have notified SDAs in the last 2 years
Hand holding necessary to ensure balanced implementation of
Act
30 States have designated their agencies so far
State Designated Agency (SDA)Program
31Power for All by 2012
Energy Conservation Building Code(ECBC)
32Power for All by 2012
Energy Conservation Building Code(ECBC)
Covers new commercial buildings
Building components included
● Building Envelope (Walls, Roofs, Windows)
● Lighting (Indoor and Outdoor)
● Heating Ventilation and Air Conditioning (HVAC) System
● Solar Water Heating and Pumping
● Electrical Systems (Power Factor, Transformers)
● Potential to save 1.7 billion units annually on mandatoryapplication
● Expected reduction in XI plan 500 MW
ECBC launched by MOP on 27.5.2007 for five climatic zones
33Power for All by 2012
Easy to use guides, tip sheets launched
Panel of architects prepared to help dissemination of ECBC
Curriculum enhancement in architectural institutions taken up
CPWD and some other Government agencies taking the lead in ECBC
implementation
Survey indicates about 306 buildings being constructed in the country
which are ECBC complaint- will result is an estimated avoided capacity
addition of 300 MW on completion
Existing Buildings Energy Efficiency (EE)
Over 500 government buildings being taken up for EE
ESCOs being short listed- accreditation of ESCOs by CRISIL/ ICRA
being initiated to improve credibility
Standardised performance contract documents developed
Innovative financial instruments being developed to mainstream ESCO
based EE
ECBC Programme…
34Power for All by 2012
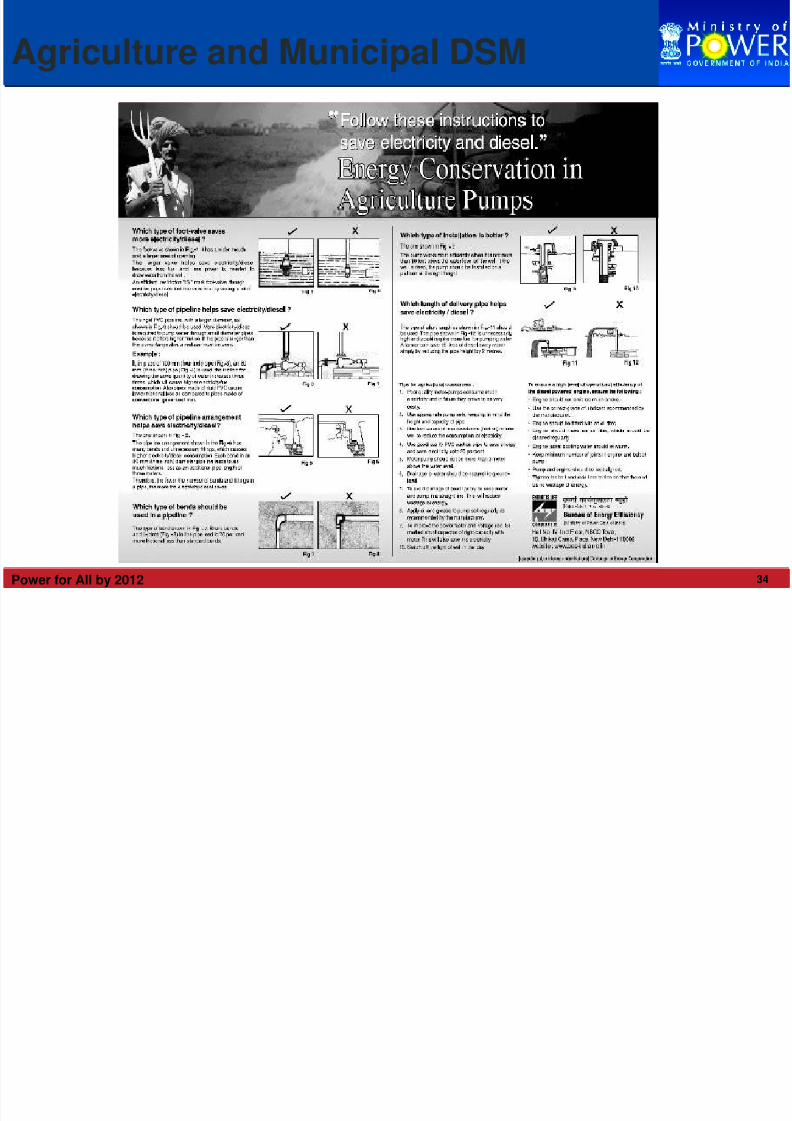
Agriculture and Municipal DSM
35Power for All by 2012
Agricultural & Municipal DSM
• Over 35% of electricity consumed by Agriculture and
Municipal sector
• High inefficiencies in pumping system- targeted through a
subsidy reduction approach
• Business model linked to subsidy reduction being evolved
• Shelf of bankable DPRs to be prepared- 10 in each states (total
350) to stimulate the market
• Baseline development, conducive regulatory regime and
payment security mechanism being worked out.
• Awareness and outreach to local and municipal bodies
• Manual for Mu DSM being developed with standard contract
documents to enable easier implementation
• Risk mitigation measures for encouraging PPP being evolved
CDM benefits for the scheme being put in.

36Power for All by 2012
Visit us at www.powermin.nic.in