Grow. Deliver. Sustain.s1.q4cdn.com/.../2017/09/TSN-Barclays-Consumer-Staples-FINAL.pdfGrow....
33
— Grow. Deliver. Sustain. Barclays Global Consumer Staples Conference September 6, 2017
Transcript of Grow. Deliver. Sustain.s1.q4cdn.com/.../2017/09/TSN-Barclays-Consumer-Staples-FINAL.pdfGrow....

—Grow. Deliver. Sustain.
Barclays Global Consumer Staples Conference
September 6, 2017

Tom HayesChief Executive Officer
Sally GrimesGroup President Prepared Foods
Curt CalawaySVP Controller Chief Accounting Officer

Forward looking statementsCertain information contained in this presentation may constitute forward-looking statements, such as statements relating to expected performance and including, but not limited to, statements appearing in the “Outlook” section and statements relating to adjusted EPS guidance. These forward-looking statements are subject to a number of factors and uncertainties, which could cause our actual results and experiences to differ materially from the anticipated results and expectations expressed in such forward-looking statements. We wish to caution readers not to place undue reliance on any forward-looking statements, which speak only as of the date made. Among the factors that may cause actual results and experiences to differ from anticipated results and expectations expressed in such forward-looking statements are the following: (i) the effect of, or changes in, general economic conditions; (ii) fluctuations in the cost and availability of inputs and raw materials, such as live cattle, live swine, feed grains (including corn and soybean meal) and energy; (iii) market conditions for finished products, including competition from other global and domestic food processors, supply and pricing of competing products and alternative proteins and demand for alternative proteins; (iv) successful rationalization of existing facilities and operating efficiencies of the facilities; (v) risks associated with our commodity purchasing activities; (vi) access to foreign markets together with foreign economic conditions, including currency fluctuations, import/export restrictions and foreign politics; (vii) outbreak of a livestock disease (such as avian influenza ((AI)) or bovine spongiform encephalopathy ((BSE))), which could have an adverse effect on livestock we own, the availability of livestock we purchase, consumer perception of certain protein products or our ability to access certain domestic and foreign markets; (viii) changes in availability and relative costs of labor and contract growers and our ability to maintain good relationships with employees, labor unions, contract growers and independent producers providing us livestock; (ix) issues related to food safety, including costs resulting from product recalls, regulatory compliance and any related claims or litigation; (x) changes in consumer preference and diets and our ability to identify and react to consumer trends; (xi) significant marketing plan changes by large customers or loss of one or more large customers; (xii) adverse results from litigation; (xiii) impacts on our operations caused by factors and forces beyond our control, such as natural disasters, fire, bioterrorism, pandemics or extreme weather; (xiv) risks associated with leverage, including cost increases due to rising interest rates or changes in debt ratings or outlook; (xv) compliance with and changes to regulations and laws (both domestic and foreign), including changes in accounting standards, tax laws, environmental laws, agricultural laws and occupational, health and safety laws; (xvi) our ability to make effective acquisitions or joint ventures and successfully integrate newly acquired businesses into existing operations; (xvii) cyber incidents, security breaches or other disruptions of our information technology systems; (xviii) effectiveness of advertising and marketing programs; and (xix) those factors listed under Item 1A. “Risk Factors” included in our Annual Report filed on Form 10-K for the period ended October 1, 2016 and subsequently filed Quarterly Reports on Form 10-Q and Current Reports on Form 8-K.

A strong food company
Diversified protein portfolio
—
Enviable brand portfolio
—FY16 Sales by Segment

Delivering consistent EPS growth over time
1 Represents a non-GAAP financial measure. Adjusted EPS is explained and reconciled in the Appendix at “EPS Reconciliations.”2 Projected adjusted EPS guidance as of 8/07/17. A further explanation of providing non-GAAP guidance is included in the appendix.
FY16 Adjusted EPS1 Growth Up 39% vs. FY15
FY12 FY13 FY14 FY15 FY16 FY17 proj.
$3.151
$2.261
$2.941
$4.391
$4.95 – 5.052
$1.971

Leading for tomorrow
Purpose Driven.
—
Strategically Focused.
—
Organized to Execute.
—
Grow.—
Our businesses through
differentiated capabilities
Deliver.—
Ongoing financial fitness through
continuous improvement
Sustain.—
Our company and our
world for future generations

8
Grow.

Growth in food has been modest
Volume % Change Year Over YearTotal Retail Food & Beverage
SOURCE: IRI Total US - Multi Outlet, YOY Tyson Foods Fiscal Quarters

Playing in a growth space is an advantageConsumer demand for protein… …is driving growth at retail
54%Of people are adding and/or increasing protein in their diets1
#1 Desired Health & Wellness Attribute2
Good Source of Protein
All-Natural Ingredients
Good Source of Vitamins & Minerals
No Trans-fats
Low in Sodium
1Source: Source: Hartman Health & Wellness 20152Source: Desirability of Health and Wellness
Attributes - Datassential CPP Protein 2015
Year Over Year Volume % Change, Latest 52 weeks
SOURCE: IRI Total US - Multi Outlet, Latest 52 Weeks Ending 08-06-17

A unique model is an advantage
• 11,000 family farmers
• Produces 1/5 of chicken, beef and pork pounds in the USA
• Nationwide fresh distribution network and coast to coast chilled lanes
• Proprietary packaging and natural ingredient systems to thrive in shelf life reality
• End to end quality and efficiency
• Portfolio of billion $, iconic and emerging brands
• Deep expertise in insight and brand building from across the best of ‘CPG’
• Customer growth planning and multi-channel leadership
• Core 9 volume growth +540bps1 vs. total food and beverage last 52 weeks
CreateDemand
—• Nearly 300 R&D team
members
• 9 chefs and 54 culinary developers
• >100K sq ft of purpose built facilities w/19 kitchens
• Food processing “Team of the Year”, delivering 13.4% retail innovation vitality and 2 of 10 IRI Pacesetter Rising Stars
Innovate—
Leverage Scale
—
1Source: IRI Total U.S. Multi-Outlet (x Costco) Volume Sales 52 weeks ending 8/06/2017 Product = Total Edible + Pet Food

Leading brands are an advantage
FrozenPreparedChicken
Hot Dogs
BrandedStacked Bacon
Frozen Protein Breakfast
Breakfast Sausage
Smoked Sausage
Branded Lunchmeat
Corn Dogs
Super PremiumSmokedSausage
1 1 1 1 1
1 2 1 1
Tyson Core 9
Source: IRI, Total US Multi-Outlet, data through 8/6/17

Tyson Core 9 volume growth considerably stronger than total food and beverage over time
+460bpsVolume % Change Year Over Year
+630bps+560bps+690bps+410bps+220bps+270bpsTyson Core 9 % Chgvs. Total F&B
SOURCE: IRI Total US - Multi Outlet, YOY Tyson Foods Fiscal Quarters

The
PerimeterRaw / Chilled / Freshly Prepared

Tyson is advantaged in the perimeterTyson Skews to the
Fresh Retail Perimeter
% of Retail Sales Volume from PerimeterLatest 52 Weeks
Tyson Excels in Perimeter Categories
that OutperformTyson Outperforms
Those Categories
% Change Sales VolumeLatest 52 Weeks
% Change Sales VolumeLatest 52 Weeks
62%
33%
+2.1%
+0.1%
+2.8%
+2.1%
SOURCE: IRI Geography : Total US - Multi Outlet, Retail Scanning and Fresh Data, Latest 52 Weeks Ending 07-09-17
62%
+0.1%
33%

Leveraging our model to lead in the perimeter Keep Core ChilledCategories Fresh
—
Build Brands & Innovate in Fresh Raw Food
—
Win in the Freshly Prepared Grocerant
—
Category growth +58% vs. prior year1
$ share +2.3PP year over year1
Household penetration +2.2pts last 52 weeks2
Bring a brand known for grilling to fresh beef patties
Successful summer test
Launch in March 2018
Fresh breakfast in minutes
>60% ACV
Strong repeat rates
Ingredients and recipes to make exceptional food
Solutions to reduce labor and increase efficiency
Advanced handheld capabilities
Relevant attributes
Simpler, faster prep
1IRI MULO 52 weeks ending 7/30/17 adult combos category2IRI Panel L52 weeks ending 7/9/17

The
FrozenSection

Tyson advantage leading to growth
Frozen Categories Where Tyson Plays1
Frozen2
+460 bps
+70 bpsVolume Change vs. Total Frozen Foods
Source: IRI Total U.S. Multi-Outlet (x Costco) Volume Sales 52 weeks ending 8/06/2017
1Frozen Categories with Tyson Foods Annual Sales > $1MM/year (excludes frozen dessert business line)
+7.2%—
Frozen volume growth last 52wks
Total Retail Frozen Foods Volume L52wks (1.2%)
+4.9%—
Frozen value added volume growth
last 52wks

Accelerating momentum with fresh, frozen innovation in 2018

Prepared Foods model
Mix Advantage
—Play in the right spaces
Performance Advantage
—Leverage differentiated
capabilities
Grow Demand
Expand Margins
Create Value

Deliver.

FY17 OutlookCapEx of ~$1BSales of ~$38B
Expect AdvancePierre to have an incremental impact of approximately $550 million
Adjusted EPS of $4.95-5.051
• ~13-15% growth over FY16• 5yr CAGR of ~20%
1Projected Adjusted EPS as of 8/7/17. Represents a non-GAAP financial measure. Adjusted EPS is explained and reconciled to comparable GAAP measures in the Appendix. A further explanation of providing non-GAAP guidance is included in the Appendix.2Represents a non-GAAP financial measure. Adjusted operating margin is explained and reconciled to a comparable GAAP measure in the Appendix.
FY 17 Segment Outlook
Adjusted ROS %2 Nine Months Ending FY17 Q4 Projection FY17 Outlook
Beef 5.2% ~4-5% ~5%Pork 13.5% ~6-8% ~12%Chicken 9.5% ~10-11% ~10%Prepared Foods 9.4% ~7-8% ~9%

FY18 Outlook1
CapEx of ~$1B+Sales of ~$41B2
Topline growth of ~6% as we grow volume and have full year benefit of AdvancePierre
1Does not include expected Other operating loss of approximately $70 million in fiscal 20182Includes full year of AdvancePierre but excludes sales from three non-protein businesses expected to be divested during FY183Excluding impact of divestitures
BeefOperating margin around 5%
PorkOperating margin above 6-8% normalized range
ChickenOperating margin ~10% with nearly 3% volume growth
Prepared FoodsOperating margin in upper ½ of 10-12% normalized range with ~10% volume growth3
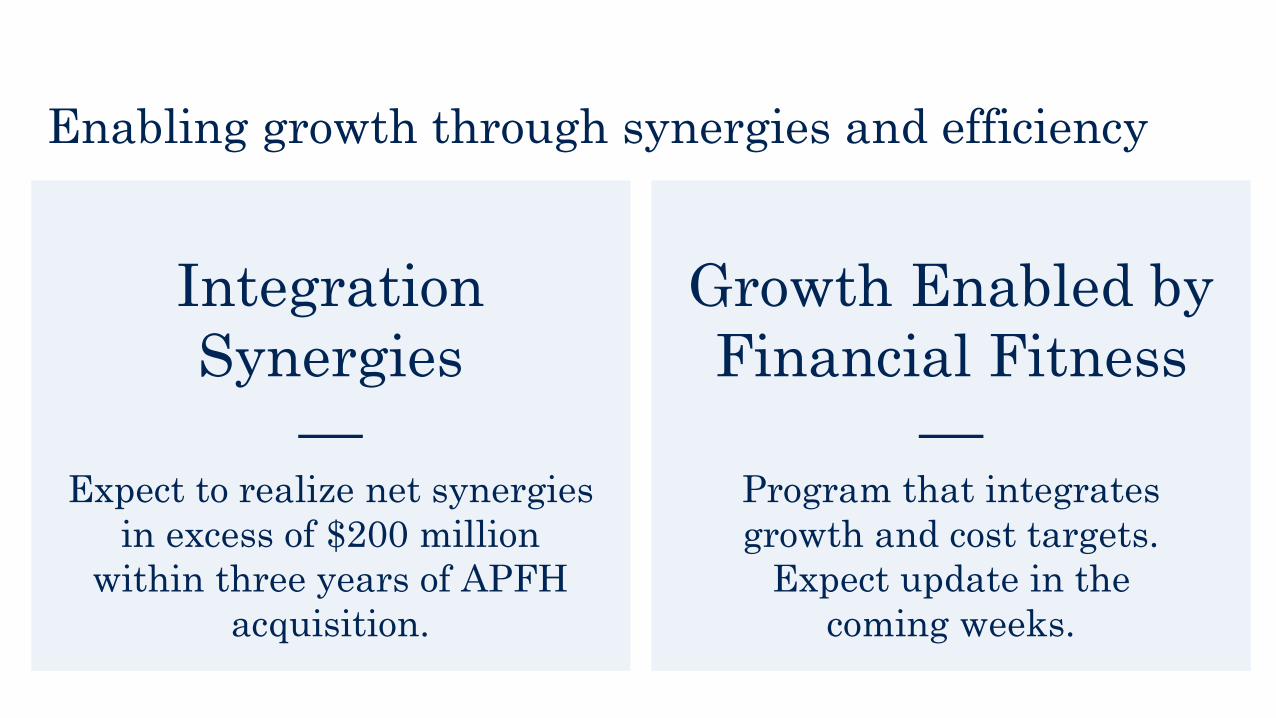
Enabling growth through synergies and efficiency
Integration Synergies
—Expect to realize net synergies
in excess of $200 million within three years of APFH
acquisition.
Growth Enabled by Financial Fitness
—Program that integrates growth and cost targets.
Expect update in thecoming weeks.

Sustain.

Taking a holistic approach to sustainability.
Healthier Food
Healthier Animals
Healthier Environment
Healthier Workplace
Healthier Bottom-line
Healthier Communities
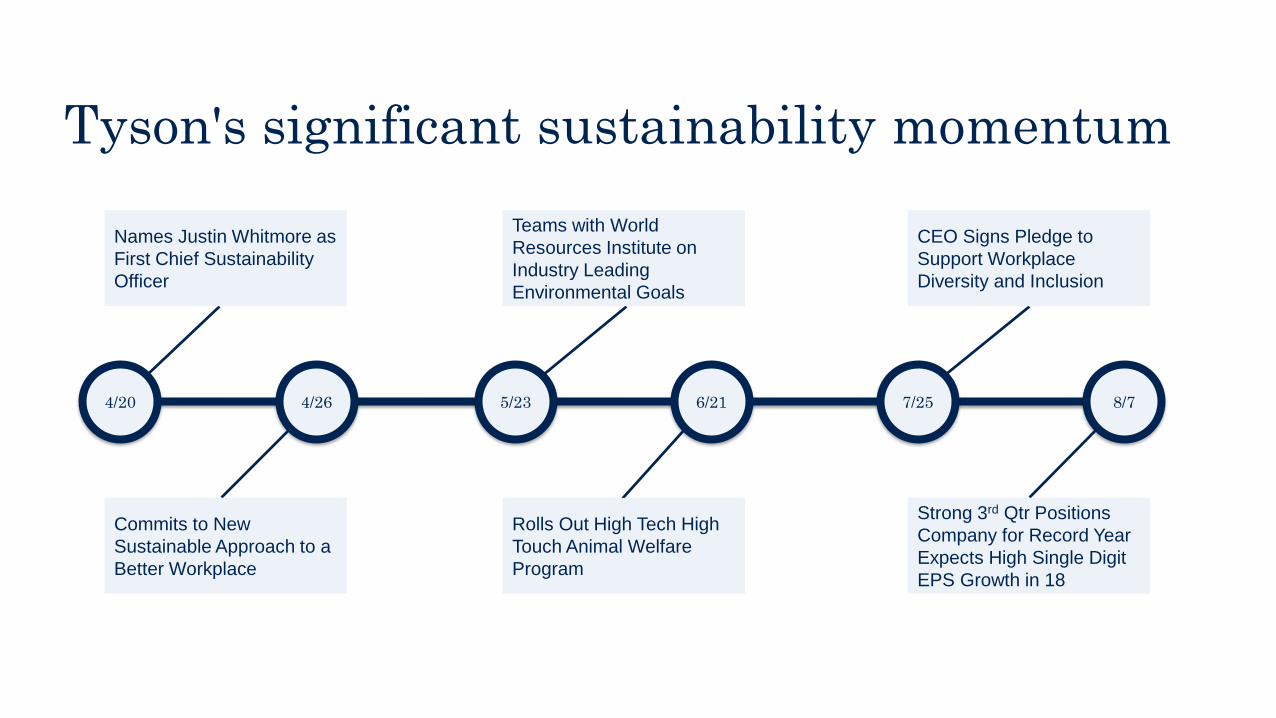
Tyson's significant sustainability momentum
4/20 4/26 8/75/23 6/21 7/25
Names Justin Whitmore as First Chief Sustainability Officer
Commits to New Sustainable Approach to a Better Workplace
Teams with World Resources Institute on Industry Leading Environmental Goals
Rolls Out High Tech High Touch Animal Welfare Program
CEO Signs Pledge to Support Workplace Diversity and Inclusion
Strong 3rd Qtr Positions Company for Record Year Expects High Single Digit EPS Growth in 18

Grow.—
Our businesses through
differentiated capabilities
Deliver.—
Ongoing financial fitness through
continuous improvement
Sustain.—
Our company and our
world for future generations

Thank you.—

AppendixNon-GAAP Reconciliations
Operating Income EPS
Operating Income EPS
Operating Income EPS
Operating Income EPS
Operating Income EPS
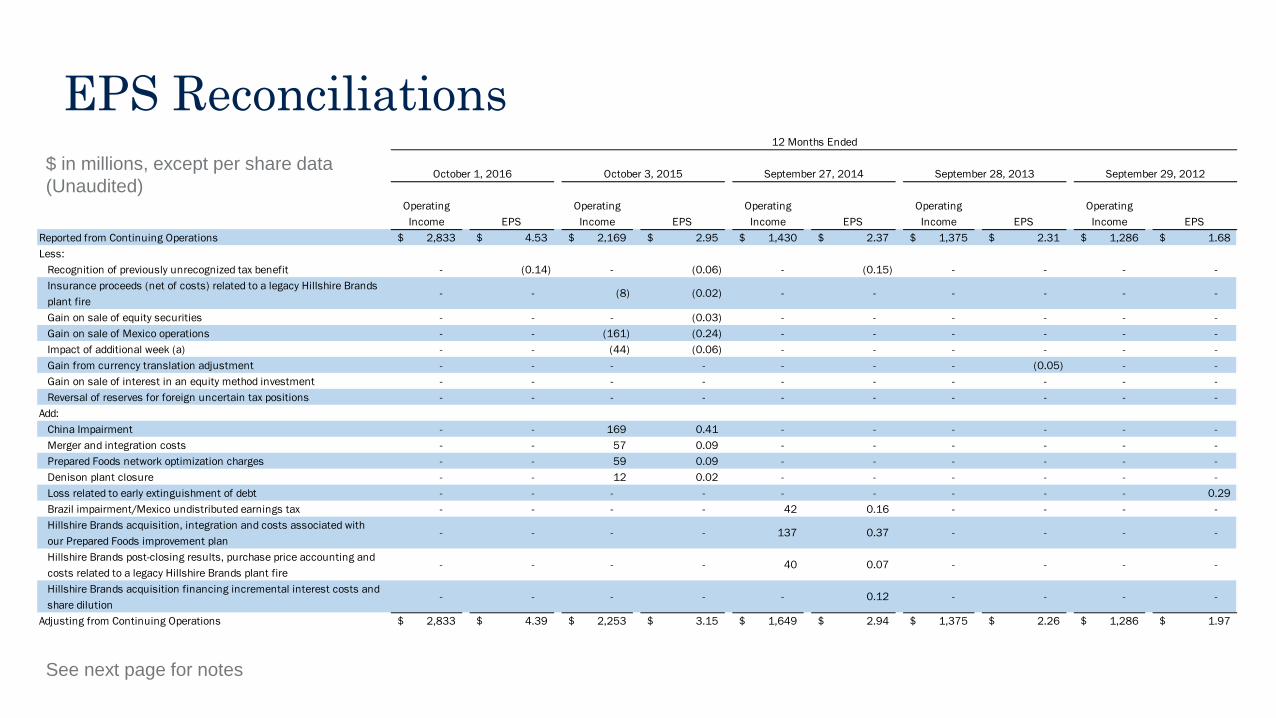
Reported from Continuing Operations 2,833$ 4.53$ 2,169$ 2.95$ 1,430$ 2.37$ 1,375$ 2.31$ 1,286$ 1.68$ Less:
Recognition of previously unrecognized tax benefit - (0.14) - (0.06) - (0.15) - - - - Insurance proceeds (net of costs) related to a legacy Hillshire Brands plant fire
- - (8) (0.02) - - - - - -
Gain on sale of equity securities - - - (0.03) - - - - - - Gain on sale of Mexico operations - - (161) (0.24) - - - - - - Impact of additional week (a) - - (44) (0.06) - - - - - - Gain from currency translation adjustment - - - - - - - (0.05) - - Gain on sale of interest in an equity method investment - - - - - - - - - - Reversal of reserves for foreign uncertain tax positions - - - - - - - - - -
Add:China Impairment - - 169 0.41 - - - - - - Merger and integration costs - - 57 0.09 - - - - - - Prepared Foods network optimization charges - - 59 0.09 - - - - - - Denison plant closure - - 12 0.02 - - - - - - Loss related to early extinguishment of debt - - - - - - - - - 0.29 Brazil impairment/Mexico undistributed earnings tax - - - - 42 0.16 - - - - Hillshire Brands acquisition, integration and costs associated with our Prepared Foods improvement plan
- - - - 137 0.37 - - - -
Hillshire Brands post-closing results, purchase price accounting and costs related to a legacy Hillshire Brands plant fire
- - - - 40 0.07 - - - -
Hillshire Brands acquisition financing incremental interest costs and share dilution
- - - - - 0.12 - - - -
Adjusting from Continuing Operations 2,833$ 4.39$ 2,253$ 3.15$ 1,649$ 2.94$ 1,375$ 2.26$ 1,286$ 1.97$
12 Months Ended
October 1, 2016 October 3, 2015 September 27, 2014 September 28, 2013 September 29, 2012
EPS Reconciliations$ in millions, except per share data(Unaudited)
See next page for notes

EPS Reconciliations – continued(a) Impact of additional week was calculated by using the fourth quarter of fiscal 2015 adjusted operating income (prior to the additional week impact) and divided by 14 weeks.
Adjusted operating income and adjusted net income from continuing operations per share attributable to Tyson (adjusted EPS) are presented as supplementary measures of our financial performance that is not required by, or presented in accordance with, GAAP. We use adjusted operating income and adjusted EPS as internal performance measurements and as two criteria for evaluating our performance relative to that of our peers. We believe adjusted operating income and adjusted EPS are meaningful to our investors to enhance their understanding of our financial performance and is frequently used by securities analysts, investors and other interested parties to compare our performance with the performance of other companies that report adjusted operating income and adjusted EPS. Further, we believe that adjusted operating income and adjusted EPS are useful measures because they improve comparability of results of operations from period to period. Adjusted operating income and adjusted EPS should not be considered as a substitute for operating income or net income per share attributable to Tyson or any other measure of financial performance reported in accordance with GAAP. Investors should rely primarily on our GAAP results and use non-GAAP financial measures only supplementally in making investment decisions. Our calculation of adjusted operating income and adjusted EPS may not be comparable to similarly titled measures reported by other companies.
Adjusted net income per share attributable to Tyson guidance is provided in this presentation on a non-GAAP basis. The Company is not able to reconcile its full-year fiscal 2017 Adjusted EPS guidance to its full-year fiscal 2017 projected GAAP guidance because certain information necessary to calculate such measure on a GAAP basis is unavailable or dependent on the timing of future events outside of our control. Therefore, because of the uncertainty and variability of the nature of the amount of future adjustments, which could be significant, the Company is unable to provide a reconciliation of this measure without unreasonable effort.

Beef Pork ChickenPrepared
Foods OtherIntersegment
Sales Total
Sales 11,015$ 3,876$ 8,374$ 5,590$ 257$ (997)$ 28,115$
Reported operating income (loss) 572 524 790 451 (87) - 2,250 Add: AdvancePierre purchase accounting and acquisition related costs (a) - - 4 21 34 - 59 Add: San Diego Prepared Foods operation impairment - - - 52 - - 52 Adjusted operating income (loss) 572$ 524$ 794$ 524$ (53)$ -$ 2,361$
Reported operating margin % 5.2% 13.5% 9.4% 8.1% n/a n/a 8.0%Adjusted operating margin % 5.2% 13.5% 9.5% 9.4% n/a n/a 8.4%
Adjusted Segment Operating Income (Loss)(for nine months ended July 1, 2017)
Segment operating income and operating margin reconciliations
In millions(Unaudited)
(a) AdvancePierre purchase accounting and acquisition related costs impacting operating income includes a $24 million purchase accounting adjustment for the fair value step-up of inventory and $35 million of acquisition related costs.
Adjusted segment operating income and adjusted segment operating margin are presented as supplementary measures of our operating performance that are not required by, or presented in accordance with, GAAP. We use adjusted segment operating income and adjusted segment operating margin as internal performance measurements and as two criteria for evaluating our performance relative to that of our peers. We believe adjusted segment operating income and adjusted segment operating margin are meaningful to our investors to enhance their understanding of our operating performance and are frequently used by securities analysts, investors and other interested parties to compare our performance with the performance of other companies that report adjusted segment operating income and adjusted segment operating margin. Further, we believe that adjusted segment operating income and adjusted segment operating margin are useful measures because they improve comparability of results of operations from period to period. Adjusted segment operating income and Adjusted segment operating margin should not be considered as a substitute for segment operating income, segment operating margin or any other measure of operating performance reported in accordance with GAAP. Investors should rely primarily on our GAAP results and use non-GAAP financial measures only supplementally in making investment decisions. Our calculation of adjusted segment operating income and adjusted segment operating margin may not be comparable to similarly titled measures reported by other companies.