Group Presentation
39
Background Presentation Vodafone Group Plc
-
Upload
rohit-mittal -
Category
Documents
-
view
18 -
download
0
description
Strategy analyisis
Transcript of Group Presentation

Background
Presentation
Vodafone Group Plc

Disclaimer
2
Information in the following presentation relating to the price at which relevant investments have been bought or sold in the past or
the yield on such investments cannot be relied upon as a guide to the future performance of such investments. This presentation
does not constitute an offering of securities or otherwise constitute an invitation or inducement to any person to underwrite,
subscribe for or otherwise acquire or dispose of securities in any company within the Group.
The presentation contains forward-looking statements within the meaning of the US Private Securities Litigation Reform Act of 1995
which are subject to risks and uncertainties because they relate to future events. Some of the factors which may cause actual results
to differ from these forward-looking statements are discussed on the final slide of the presentation.
The presentation also contains non-GAAP financial information which the Group’s management believes is valuable in understanding
the performance of the Group or the Group’s businesses. However, non-GAAP information is not uniformly defined by all companies
and therefore it may not be comparable with similarly titled measures disclosed by other companies, including those in the Group’s
industry. Although these measures are important in the assessment and management of the business, they should not be viewed in
isolation or as replacements for, but rather as complementary to, the comparable GAAP measures.
Vodafone, the Vodafone Speech Mark, the Vodafone Portrait, Vodacom and M-Pesa are trademarks of the Vodafone Group. The
Vodafone Rhombus is a registered design of the Vodafone Group. Other product and company names mentioned herein may be the
trademarks of their respective owners.

• Vodafone Group Plc is one of the world’s largest
telecommunications companies providing a wide range of
services, including voice, messaging, data across mobile
and fixed networks
• We have 438m mobile customers and 11 million fixed
broadband customers
• We have mobile operations in 26 countries and partner
with mobile networks in over 50 more
• Our operations are spread across two geographic regions -
Europe and Africa, Middle East and Asia Pacific (AMAP)
• The Group is listed on the London and NASDAQ (ADR
listing) stock exchanges and is headquartered in London
• We have over 275,000 base station sites across our
markets (as of December 2014)
A brief introduction to the Group
3
Financial highlights FY 13/14
Revenue £43.6bn
EBITDA £12.8bn
Adjusted operating profit £7.9bn
Capex £7.1bn
Free cash flow £4.4bn
Adjusted EPS 17.54p
Dividend per share 11.00p

8%
15%
4%
42%
31%
• Mobile accounts for the majority (81%)
of our business
• Fixed (15%) is becoming an increasing
part of what we do
• A quarter of our business comes from
Enterprise customers
• Revenue and profits are spread across
our geographical footprint
Revenue and profit mix of the Group
4
Mobile
out-of-
bundle
Mobile
incoming
Group service revenue FY 13/14
8%
27%
19% 15%
11%
10%
10%
Spain
Other
Germany
UK
Italy
Vodacom
India
Group service revenue FY 13/14
21%
13%
12% 11%
11%
6%
26%
Germany
Vodacom
Italy
UK
India
Spain
Group EBITDA FY 13/14
37%
29%
27%
7% Consumer
contract
Consumer prepaid
Other
Enterprise
Group service revenue FY 13/14
Other
Fixed
Other
Mobile in-bundle

• Over 60% of our customers are
from emerging markets
• The majority of our customers are
prepaid customers
• Consumer contract customers are
12% of the base and contribute
over a third of service revenue
• Enterprise contributes over a
quarter of our service revenue
Mobile customer mix of the Group
5
Customers by country (%) FY 13/14
38
15 7
10
6
4 3
17 India
Vodacom Germany
Egypt
Italy
UK
Spain
Other
Customers by segment (%) FY 13/14
12 81
7
Consumer contract
Enterprise
Consumer
prepaid

History of the Group
6
1984 1991 1999 2000 2006 2007 2009 2010 2011 2013 2014
Incorporated as Racal
Strategic Radio Limited
Demerger from
Racal and full listing
on the LSE
Merger with AirTouch
Communications,
formation of Verizon
Wireless (Vodafone
held a 45% stake)
Acquisition of
Mannesmann AG,
acquiring further
businesses in Europe
Acquisition of Telsim
(now Vodafone Turkey)
Disposal of
Vodafone Japan
Acquisition of
controlling stake in
Vodafone Essar (now
Vodafone India)
Vodacom Group
became a subsidiary
Vodafone Australia
merged with
Hutchinson 3G Australia
Disposal of our interest
in China Mobile
Sale of interest
in SFR
2012
Acquisition of
Cable and Wireless
Worldwide
Acquisition of
Kabel Deutschland
in Germany
Sale of 45%
interest in
Verizon
Wireless
Acquisition of
Ono in Spain
Ownership of
Vodafone India
and Italy
increased
to 100%

Where we operate
7
Subsidiaries (% ownership)
Joint ventures/associates
Indus Towers (42%), part of Vodafone India
Australia (50%)
Safaricom (Kenya) (40%)
Partner markets
Portugal (100%)
Qatar (22.95%)
Romania (100%)
Spain (100%)
Turkey (100%)
UK (100%)
Vodacom Group (65%)
Consists of
South Africa
Tanzania
Mozambique
DRC
Lesotho
Albania (100%)
Czech Rep (100%)
Egypt (54.9%)
Germany (100%)
Ghana (70%)
Greece (99.9%)
Hungary (100%)
India (100%)
Ireland (100%)
Italy (100%)
Malta (100%)
Netherlands (100%)
New Zealand (100%)
See page 37 for details

Our people
8
Gerard Kleisterlee (Chairman) Appointed July 2011
He retired as President/CEO and Chairman of Philips on 31 March
2011 after spending three decades with the company. He is also a
Board member of Daimler AG, Royal Dutch Shell and Dell Inc.
Vittorio Colao (CEO) Appointed July 2008
CEO before joining the Board in 2002. He left Vodafone in 2004 for
RCS MediaGroup before re-joining the Board in October 2006 as CEO,
Europe and Deputy CEO.
Nick Read (CFO) Appointed April 2014
He joined Vodafone in 2001 and has held a variety of roles including
CFO, CCO and CEO of Vodafone UK. Before becoming Group CFO, he
was the regional CEO for our AMAP region and a Board member of our
listed companies Vodacom Group, Safaricom and Vodafone Qatar.
Steve Pusey* (CTO) Appointed June 2009
He joined Vodafone in 2006 having previously served as Executive
Vice President and President for Nortel, EMEA having joined the
company in 1982. Before then he worked for British Telecom.
Non-executive board members: Luc Vandevelde (Senior Independent Director), Sir Crispin Davies, Dame Clara Furse DBE, Val Gooding, Renee James, Samuel Jonah,
Nick Land and Philip Yea
Executive committee: Vittorio Colao (CEO), Nick Read (CFO), Stephen Pusey (CTO), Philipp Humm (CEO Europe), Serpil Timuray (CEO AMAP), Paolo Bertoluzzo (Group
Chief Commercial and Operations Officer), Warren Finegold (Strategy & Business Development Director), Matthew Kirk (External Affairs Director), Rosemary Martin
(General Counsel and Company Secretary), Ronald Schellekens (Group HR Director), Nick Jeffery (Group Enterprise Director)
Over
97,000 employees1
24 nationalities 22% women in top senior management roles
1. As of March 2014
* Steve Pusey will retire on 31 July 2014

The services we provide
81%
15%
4%
Mobile
Fixed
Other
We also provide financial services
We have 18.5m M-Pesa users across 9 markets.
M-Pesa enables customers to send and receive money via
their mobile phones without the need for a bank account.
M-Pesa also includes the ability to save and receive
short-term loans in some markets
Split of Group service revenue FY 13/14 Voice
Over 1.2 trillion minutes of calls were carried over our networks last year
That’s the equivalent of everyone around the world talking for two and a half hours
Messaging We sent over 337 billion text, picture, music and video messages last year
Data Over 544 petabytes of data were sent across our networks last year
That’s enough data for over 100 billion one minute video clips
Fixed We serve over 11 million customers, mainly in Germany, Spain and Italy
Other services We earn revenue from letting other ‘virtual’ operators use our network and from partners outside our footprint using our products and services
9

Our technology
10 Data shown here correct as of 31 December 2014 unless otherwise stated
1. Next Generation Network technology: includes fibre-to-the-home, cable and fibre/VDSL to the cabinet or central office
We have over
Mobile
275,000 base station
sites
Europe
India
AMAP
37%
46%
17% (excl. India)
10
18 markets with 4G services
65% 4G coverage in Europe 77% European sites fully
modernised
90% 3G coverage in India (targeted urban areas)
80% 3G coverage in AMAP (excluding India)
£17.2bn net book value of owned licences and spectrum (as of March 2014)
Fixed
An excellent network experience is key to our strategy and Project Spring accelerates our progress
26m households passed with NGN
48m households passed with NGN
(incl. wholesale)
• Our fixed access comes from a range of sources:
– Acquisitions (e.g. KDG, Ono)
– Self or co-building (e.g. Italy, Spain, Portugal)
– Wholesale (e.g. Netherlands)
79% European sites with high capacity backhaul

Project Spring is our investment programme that increases our capital expenditure over two years
to £19 billion – to accelerate and extend our strategy and strengthen our differentiation
Project Spring: investing £19 billion over two years
11
European
mobile
• Extend network coverage and density with 36k new 4G sites and 98% of sites with high capacity backhaul
• Provide a ‘perfect voice’ experience (call success rates over 99%)
• Deliver the best 4G data experience with over 90% outdoor population 4G coverage and 90% of sessions > 3Mbps
AMAP
mobile • Extend network coverage and density with 22k new 3G sites
• Grow 3G coverage to 95% in targeted urban areas in India
Unified
comms
• Build fibre in Italy and Spain
• Extend our existing fibre build programme in Portugal
• Expand xDSL coverage in selected markets
Enterprise • Invest in growth areas: IP-VPN, Hosting & Cloud, M2M
• Leverage carrier services platform
• International expansion
Customer
experience
• Accelerate retail redesign and selectively increase direct distribution
• Enhance online/mCare capabilities and create consistently strong contact centre experience
• Faster deployment of mobile payment services

Our strategy
12
Our strategy is focused on four key growth areas and targets:
Unified
Communications
A leading mobile data provider Converged services in all key
European markets
A stronger leader and first
choice for data
Major enterprise provider with
full service offering
Consumer Europe Enterprise Consumer Emerging
Markets
Supported by:
An excellent network experience A simplified and cost-efficient business model
and operations
Project Spring accelerates and extends our strategic priorities through investment in mobile and fixed networks,
products and services, and our retail platform, to strengthen further our network and service differentiation
What we want to achieve for our customers:
Always best connected
• Best mobile voice and data
(coverage and quality) - 4G/3G
• Competitive in fixed and best converged
experience
Unmatched customer experience
• Number one in customer experience
- in store, online, on the phone
• Consistent execution across markets
Integrated worry-free solutions
• Simplest connectivity and price plans
• Converged enterprise product suite
• Innovator in new services, such as
mobile payments

390 430
473
527
627
Q2 13/14 Q3 13/14 Q4 13/14 Q1 14/15 Q2 14/15
Our strategy: Consumer Europe
13
• More and more of our customers are using data with increases in smartphone users,
4G customers and average data usage
• This is helped by bundling content with 4G price plans, for example UK consumers
can choose between Netflix, Spotify, Sky Sports and Now TV
Acceleration in average smartphone
usage growth Europe (MB)1
+10%
+11%
+19%
1. Android and iOS
33.0
41.0
48.0
Q2 12/13 Q2 13/14 Q2 14/15
Smartphone penetration
continues to increase European smartphone penetration (%)
+10%
4G penetration growing rapidly
2.0
4.7 6.7
9.7
5.4
11.0
13.6
16.2
Q3 13/14 Q4 13/14 Q1 14/15 Q2 14/15
4G smartphone customers (m)
4G smartphones (m)

Our strategy: unified communications
1. FY 14/15 includes Ono on a pro forma basis
2012 2013 2014
Acquired TelstraClear in
New Zealand to become
an unified comms operator
Acquired CWW in the UK, making
us an integrated fixed/mobile
operator for enterprise customers
Acquired Kabel
Deutschland, the
leading cable operator
in Germany
Acquired Ono,
the leading cable
operator in Spain
We increasingly offer more than mobile
Our recent acquisitions
Fixed as a % of European service revenue
FY 11/12 FY 14/15
(Pro forma)1 11%
25%
We are building out fibre in
Italy, Spain, Portugal and
Ireland
11.2m broadband customers
9.6m TV customers
14
Acquired Hellas Online
in Greece, a leading
broadband provider

Our strategy: Emerging markets
15
• Our emerging markets are DRC, Egypt, Ghana, India, Lesotho, Mozambique, Qatar,
South Africa, Tanzania and Turkey
• Customer growth remains strong and customers are increasingly moving to data
• Our money transfer service, M-Pesa, is now available in 9 markets
Growth in customers, AMAP (m)1
286.2
294.5
303.7
310.5 312.5
Q2 13/14 Q3 13/14 Q4 13/14 Q1 14/15 Q2 14/15
Growth in data users (m) Growth in M-Pesa users (m)
1. AMAP region also includes Australia and New Zealand
15.9
16.8 16.8
17.7
18.5
Q2
13/14
Q3
13/14
Q4
13/14
Q1
14/15
Q2
14/15
44.0
21.1
7.1 5.8
57.2
25.9
9.3 7.7
India Vodacom Turkey Egypt
Sept 2013
Sept 2014

Group strategy: Enterprise
1. Market leader in Gartner Magic Quadrant for managed M2M services
Group service revenue
Vodafone Global Enterprise serves around 1,700
multinational companies in over 100 countries
Expanding in key growth areas
Global leader in M2M1, position strengthened with
acquisition of Cobra Automotive
Our Cloud & Hosting services help organisations
bring their data and applications to the cloud
Carrier services – we are the largest international
voice carrier in the world
+1.2%
+23.5%
+2.0%
+9.1%
How we differentiate
• Scale - #1 or #2 position in most of our markets
• Strength in fixed and mobile- historically strong in mobile, successful in
building capability in fixed (now a quarter of enterprise revenues)
• Range of services - able to provide a full range of other services including
M2M, cloud & hosting and IP-VPN
• Geographic reach - presence in over 100 countries
• Network- leveraging the Vodafone mobile and fixed networks
We provide a range of mobile, fixed, hosting, cloud and other business
services for business across the world, whether large or small
Enterprise is
around a
quarter of the
Group
Q2 14/15 growth
16

Our financials
17
Guidance
Assumptions
Excludes Ono. Assumes FX rates of £1: €1.21, £1:INR 105.8 £1:ZAR 18.4. Also excludes the impact of license
and spectrum purchases, material one-off tax related payments, restructuring costs and any fundamental
structural change to the eurozone. It also assumes no material change to the current structure of the Group.
Net debt of £21.8bn at 30 September 2014 The Group has a range of debt instruments including bonds, commercial paper
and bank loans. The currency profile of the Group’s debt is broadly in line with
the value of the Group’s underlying assets.
Moody’s Fitch Standard & Poor’s Baa1 BBB+ A-
Long term credit ratings:
Key financials FY 13/14 FY 12/13 FY 11/12 FY 10/11 FY 09/10
Revenue (£bn) 43.6 44.4 46.4 45.9 44.5
EBITDA (£bn) 12.8 13.6 14.5 14.7 14.7
Adjusted operating
profit (£bn) 7.9 12.0 11.5 11.8 11.5
Capex (£bn) 7.1 6.3 6.4 6.2 6.2
Free cash flow (£bn) 4.2 5.5 6.1 7.0 7.2
Adjusted EPS (p) 17.54 15.65 14.91 16.75 16.11
Dividend per share (p) 11.00 10.19 13.52 8.90 8.31
For the year ended 31 March 2015
EBITDA: £11.6bn - £11.9bn
Positive free cash flow after all capex, before M&A, spectrum and restructuring costs
1.5
(1.9)
(4.3)
3.7
0.2
(2.0)
FY 11/12 FY 12/13 FY 13/14
Organic service revenue growth (%)
Reported
Excluding MTRs1
1. Mobile termination rates

35
12 10
43
Our shareholders and shareholder returns
18
Dividend policy
Intention to grow dividend per share annually
Year ended 31 March Interim Final Total
2008 2.49 5.02 7.51
2009 2.57 5.20 7.77
2010 2.66 5.65 8.31
2011 2.85 6.05 8.90
20122 3.05 6.47 9.52
2013 3.27 6,92 10.19
2014 3.53 7.47 11.00
2015 3.60 TBC TBC
Dividend history (pence per ordinary share)
Our shareholders (%) Share price history Price rebased to Vodafone (pence)
260
220
180
140
100 Oct 2011 Oct 2012 Oct 2013
UK North
America
Europe Rest of World
Listing - - -
Ticker - - -
Types - - -
Market Cap - - -
Shares in issue - - -
London, NASDAQ
VOD:LN, VOD:AR
Ordinary, ADR
Approx. £54bn
as of 30 Sept 2014
26,504m1
Vodafone DJ Global Telcos, rebased to Vodafone
Shareholder returns (£bn)
1. Excludes 2,309m treasury shares. Total of 28,813m shares in issue as of 30 Sept 2014
2. The group also paid a special dividend of 4.00p in February 2012
Over £80 billion returned to shareholders from
FY 10/11 to FY 13/14, consisting of £21 billion
in dividends, £8 billion of share buybacks and a
£51 billion return to shareholders following the
sale of our stake in Verizon Wireless (February
2014)
Sept 2014

Our markets: Europe
17
59
12
5 7
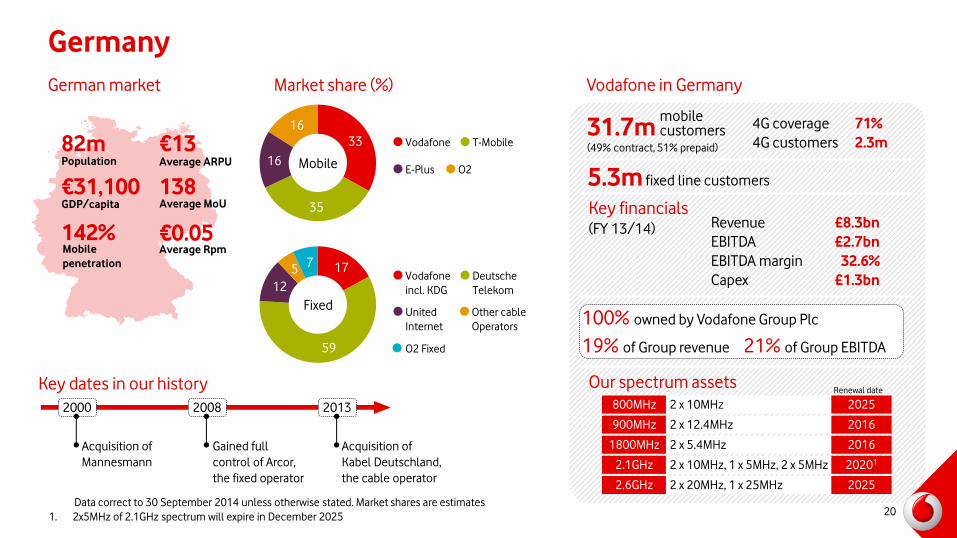
Germany
20
82m Population
€13 Average ARPU
€31,100 GDP/capita Average MoU
142% Mobile
penetration
138
€0.05 Average Rpm
Key dates in our history
German market
33
35
16
16
Mobile
Fixed
Vodafone T-Mobile
E-Plus O2
2000 2008 2013
Acquisition of
Mannesmann
Gained full
control of Arcor,
the fixed operator
Acquisition of
Kabel Deutschland,
the cable operator
900MHz
1800MHz
2.6GHz
800MHz
2.1GHz
2 x 12.4MHz
2 x 5.4MHz
2 x 20MHz, 1 x 25MHz
2 x 10MHz
2 x 10MHz, 1 x 5MHz, 2 x 5MHz
2016
2016
2025
2025
20201
Renewal date
Data correct to 30 September 2014 unless otherwise stated. Market shares are estimates
1. 2x5MHz of 2.1GHz spectrum will expire in December 2025
Market share (%) Vodafone in Germany
31.7m mobile customers
(49% contract, 51% prepaid)
5.3m fixed line customers
4G coverage 71%
4G customers 2.3m
Key financials (FY 13/14) Revenue £8.3bn
EBITDA £2.7bn
EBITDA margin 32.6%
Capex £1.3bn
100% owned by Vodafone Group Plc
19% of Group revenue 21% of Group EBITDA
Our spectrum assets
Vodafone
incl. KDG
Deutsche
Telekom
United
Internet
Other cable
Operators
O2 Fixed

9
72
4 7
8
UK
21
65m Population
£17 Average ARPU
£24,400 GDP/capita Average MoU
122% Mobile
penetration
186
£0.04 Average Rpm
Key dates in our history
UK market
25
24 31
11 9
Mobile
Fixed
Enterprise
Vodafone O2 EE
3
900MHz
1800MHz
2.6GHz
800MHz
2.1GHz
2 x 17.4MHz
2 x 5.8MHz
2 x 20MHz, 1 x 25MHz
2 x 10MHz
2 x 14.8MHz
n/a1
n/a1
2033
2033
n/a1
Renewal date
Data correct to 30 September 2014 unless otherwise stated. Market shares are estimates
1. Indefinite license with a five year notice of revocation
Market share (%) Vodafone in the UK
19.7m mobile customers
(60% contract, 40% prepaid)
Consumer fixed line services to launch 2015
4G coverage 48%
4G customers 1.4m
Key financials (FY 13/14) Revenue £6.4bn
EBITDA £1.4bn
EBITDA margin 22.1%
Capex £0.9bn
100% owned by Vodafone Group Plc
15% of Group revenue 11% of Group EBITDA
Our spectrum assets
Vodafone BT
Virgin
Media
Colt
MVNOs
1985 2004 2012
Vodafone launched
the first mobile
network in the UK
3G services
launched
Acquisition of
Cable and Wireless,
the fixed operator
Others
Fixed

6
73
8
12 1
Italy
22
61m Population
€12 Average ARPU
€22,700 GDP/capita Average MoU
146% Mobile
penetration
230
€0.03 Average Rpm
Key dates in our history
Italian market
33
33
21
9 3
Mobile
Fixed
Vodafone Telecom Italia
Wind 3
900MHz
1800MHz
2.6GHz
800MHz
2.1GHz
2 x 10MHz
2 x 15MHz, 2 x 5MHz
2 x 15MHz
2 x 10MHz
2 x 15MHz, 1 x 5MHz
2015
20151
2029
2029
2021
Renewal date
Data correct to 30 September 2014 unless otherwise stated. Market shares are estimates
1. 2 x 5MHz of 1800MHz spectrum will expire in 2029
Market share (%) Vodafone in Italy
26.0m mobile customers
(19% contract, 81% prepaid)
4G coverage 64%
4G customers 1.0m
Key financials (FY 13/14) Revenue £4.3bn
EBITDA £1.5bn
EBITDA margin 35.6%
Capex £0.6bn
100% owned by Vodafone Group Plc
10% of Group revenue 12% of Group EBITDA
Our spectrum assets
MVNOs
2000 2007 2014
Acquisition of
Mannesmann included
Italian operations
Acquisition of TeleTu,
the fixed operator
Took ownership to 100%
1.8m fixed line customers
Vodafone
Wind Fastweb Tiscali
Telecom Italia

12
69
7 8
5
Spain
23
46m Population
€16 Average ARPU
€22,100 GDP/capita Average MoU
109% Mobile
penetration
174
€0.06 Average Rpm
Key dates in our history
Spanish market
30
34
22
5 9
Mobile
Fixed
Vodafone
incl. Ono
Telefonica
Orange Yoigo
900MHz
1800MHz
2.6GHz
800MHz
2.1GHz
2 x 11MHz
2 x 20MHz
2 x20MHz. 1 x 20MHz
2 x 10MHz1
2 x 15MHz, 1 x 5MHz
2028
2030
2030
2030
2030
Renewal date
Market share (%) Vodafone in Spain
14.8m mobile customers
(74% contract, 26% prepaid)
4G coverage 64%
4G customers 1.6m
Key financials1 (FY 13/14) Revenue £3.5bn
EBITDA £0.8bn
EBITDA margin 22.4%
Capex £0.5bn
100% owned by Vodafone Group Plc
8% of Group revenue 6% of Group EBITDA
Our spectrum assets
MVNOs
1999 2007 2014
Acquisition of AirTouch
included Spanish
operations
Acquisition of Tele2,
the fixed operator
Acquisition of Ono,
a cable operator
2.7m fixed line customers
Vodafone
incl. Ono
Telefonica
Jazztel Orange Others
Data correct to 30 September 2014 unless otherwise stated. Market shares are estimates
1. Not yet available for use

Netherlands
24
17m Population
€24 Average ARPU
€37,400 GDP/capita Average MoU
101% Mobile
penetration
159
€0.09 Average Rpm
Key dates in our history
Dutch market
31
39
23
7
Mobile
Fixed
Vodafone KPN
T Mobile MVNOs
900MHz
1800MHz
2.6GHz
800MHz
2.1GHz
2 x 10MHz
2 x 20MHz
2 x 10MHz
2 x 10MHz
2 x 20MHz, 1 x 5MHz
2030
2030
2030
2029
2030
Renewal date
Market share (%) Vodafone in the Netherlands
5.2m mobile customers
74% contract, 26% prepaid)
Key financials (FY 13/14) Revenue £1.6bn
EBITDA £0.5bn
EBITDA margin 34.1%
Capex £0.2bn
100% owned by Vodafone Group Plc
4% of Group revenue 4% of Group EBITDA
Our spectrum assets
1995 2003
Libertel launched
services
Vodafone acquires
full ownership of
Vodafone Libertel
Consumer fixed line services launched Sept 2014
1
45 54
Vodafone KPN
Others
Data correct to 30 September 2014 unless otherwise stated. Market shares are estimates

Portugal
25
10m Population
€10 Average ARPU
€14,800 GDP/capita Average MoU
159% Mobile
penetration
148
€0.05 Average Rpm
Key dates in our history
Portuguese market
38
40
21 1
Mobile
900MHz
1800MHz
2.6GHz
800MHz
2.1GHz
2 x 10MHz, 2 x 3MHz
2 x 6MHz, 2 x 14MHz
2 x 20MHz, 25MHz TDD
2 x 10MHz
2 x 20MHz
20211
20272
2027
2027
2016
Renewal date
Data correct to 30 September 2014 unless otherwise stated. Market shares are estimates
1. 2 x 3MHz of 900MHz spectrum will expire in 2015
2. 2 x 6MHz of 1800MHz spectrum will expire in 2021
Market share (%) Vodafone in Portugal
5.4m mobile customers
(26% contract, 74% prepaid)
Key financials (FY 13/14) Revenue £0.9bn
EBITDA £0.3bn
EBITDA margin 34.8%
Capex £0.2bn
100% owned by Vodafone Group Plc
2% of Group revenue 2% of Group EBITDA
Our spectrum assets
1992 2001 2003
Telecel launched
services
Rebranded to
Vodafone
Vodafone acquired full
ownership
0.3m fixed line customers
Vodafone Portugal Telecom
Optimus MVNOs
4
55
33
9
Vodafone Portugal Telecom
Optimus Others
Fixed

Greece
26
11m Population
€11 Average ARPU
€14,700 GDP/capita Average MoU
133% Mobile
penetration
231
€0.04 Average Rpm
Key dates in our history
Greek market
31
51
18
Mobile
1800MHz
2.1GHz
900MHz
2 x 15MHz, 2 x 10MHz
2 x 20MHz, 1 x 5MHz
2 x 15MHz
20261
2021
20271
Renewal date
Data correct to 30 September 2014 unless otherwise stated. Market shares are estimates
1. 2 x 15MHz of the 1800MHz spectrum will expire in August 2016
2. As of 31. December 2014, including Hellas Online
Market share (%) Vodafone in Greece
5.0m (32% contract, 68% prepaid)
Key financials (FY 13/14) Revenue £0.6bn
EBITDA £0.2bn
EBITDA margin 27.6%
Capex £0.1bn
99.9% owned by Vodafone Group Plc
1% of Group revenue 1% of Group EBITDA
Our spectrum assets
1992 2004 2014
Creation of Panafon
between four partners,
including Vodafone
Final increase in
Vodafone’s share of
the business
Acquisition of
Hellas Online
0.5m fixed line customers2
Vodafone Cosmote
Wind
10
64
16
6 4
Vodafone
(incl. HOL)
OTE
Forthnet Tellas
Fixed
CYTA
mobile customers

Romania
27
20m Population
$10,200 GDP/capita
106% Mobile
penetration
Key dates in our history
Romanian market1
38
19
43 Mobile
Data correct to 30 September 2014 unless otherwise stated. Market shares are estimates
1. IMF Database and World Bank estimates
Market share (%) Vodafone in Romania
7.9m (42% contract, 58% prepaid)
Key financials (FY 13/14)
Revenue £0.6bn
EBITDA £0.2bn
EBITDA margin 33.2%
Capex £0.1bn
100% owned by Vodafone Group Plc
1% of Group revenue 2% of Group EBITDA
2005 2006
Acquisition of Connex Rebranded to
Vodafone
Vodafone Cosmote
Orange
900MHz
1800MHz
2.6GHz
800MHz
2.1GHz
2 x 10MHz
2 x 30MHz
1 x 15MHz
2 x 10MHz
2 x 15MHz, 1 x 5MHz
2029
2029
2029
2029
2020
Renewal date Our spectrum assets
3
53 33
11
Vodafone Romtelecom
RCS & RDS UPC Fixed
mobile customers

Other Europe
Albania 2.0m mobile customers (5% contract, 95% prepaid)
Data correct to 30 September 2014 unless otherwise stated. Market shares are estimates
1. World Bank, 2013 estimates
2. IMF, 2011 estimates
Czech Republic 3.2m mobile customers (62% contract, 38% prepaid)
Hungary 2.6m mobile customers (55% contract, 45% prepaid)
Ireland 2.1m mobile customers (45% contract, 55% prepaid)
Malta 0.3m mobile customers (18% contract, 82% prepaid)
0.2m fixed line customers
Population GDP/capita Mobile
penetration1
Mobile market share
Fixed market
share
2.9m
11.0m
9.9m
4.8m
0.4m
$4,900
$19,000
$13,200
€37,300
$24,300
116%
131%
116%
103%
n/a
n/a
n/a
43%
n/a
16%
99.9% ownership
<1% of Group revenue
<1% of Group EBITDA
100% ownership
1% of Group revenue
1% of Group EBITDA
100% ownership
<1% of Group revenue
<1% of Group EBITDA
100% ownership
2% of Group revenue
2% of Group EBITDA
100% ownership
<1% of Group revenue
<1% of Group EBITDA
130%
n/a
n/a
n/a
n/a
28

Our markets: AMAP

India
30
1,243m Population
$1,500 GDP/capita
74% Mobile
penetration
Indian market
22
29 16
10
6
7 10
Mobile
Market share (%) Vodafone in India
173.8m mobile customers
(7% contract, 93% prepaid)
3G coverage 90%1
Data users 57.1m
Key financials (FY 13/14)
Revenue £4.4bn
EBITDA £1.4bn
EBITDA margin 31.8%
Capex £0.7bn
100% owned by Vodafone Group Plc
10% of Group revenue 11% of Group EBITDA
1800MHz
2.1GHz
900MHz
Varies by circle
Varies by circle
Varies by circle
2014-27
2030
2014-24
Renewal date Our spectrum assets
INR185
379
INR0.40 Average Rpm
Average ARPU
Average MoU
Key dates in our history
Data correct to 30 September 2014 unless otherwise stated. Market shares are estimates
1. Targeted urban areas only
2. 2 x 15MHz of the 1800MHz spectrum will expire in August 2016
2007 2011 2014
Acquisition of controlling
stake in Vodafone Essar
Renamed Vodafone
India Limited
Took ownership to 100%
Vodafone Airtel India IDEA Cellular
BSNL / MTNL
Reliance Tata
Others

Vodacom Group: South Africa
31
53m Population
$6,400 GDP/capita
147% Mobile
penetration
South African market
53
31
15 2
Mobile
Mobile market share (%) Vodacom in South Africa
39.9m mobile customers
(9% contract, 91% prepaid)
3G coverage 97%
Data users 16.7m
Vodacom Group* - Key financials (FY 13/14)
Revenue £4.7bn
EBITDA £1.7bn
EBITDA margin 36.4%
Capex £0.7bn
Vodacom Group 65% owned by Vodafone Group
Vodacom South Africa 94% owned by Vodacom Group
11% of Group revenue 13% of Group EBITDA
1800MHz
2.1GHz
900MHz
2 x 12MHz
2 x 15MHz, 1 x 5MHz
2 x 11MHz
n/a1
n/a1
n/a1
Renewal date Our spectrum assets
ZAR93
108
ZAR0.66 Average Rpm
Average ARPU
Average MoU
Key dates in our history
Data correct to 30 September 2014 unless otherwise stated. Market shares are estimates
1. Spectrum licenses renewed annually
1994 2009 2011
Launched its first
services
Became a subsidiary Rebranded to align with
Vodafone global brand
Vodafone MTN
CellC TelkomMobile *82% of FY 13/14 revenue was from Vodacom South Africa

Vodacom Group: Internationals
32
Data correct to 30 September 2014 unless otherwise stated. Market shares are estimates
1. Vodacom, 2014 estimates
2. Owned through Vodacom Group, which is 65% owned by Vodafone Group
Tanzania 11.3m mobile customers
Mozambique 4.9m mobile customers
DRC 11.0m mobile customers
Lesotho 1.1m mobile customers
Population GDP/capita Mobile
penetration1
Mobile market share
50.8m
26m
69m
2.1m
$770
$630
$410
$1,300
60%
45%
40%
70%
44%
36%
73%
82% ownership
85% ownership
51% ownership
80% ownership
46%
Vodacom % ownership2

Turkey
33
77m Population
$10,500 GDP/capita
92% Mobile
penetration
Turkish market
28
50
22
Mobile market share (%) Vodafone in Turkey
20.6m mobile customers
(39% contract, 61% prepaid)
3G coverage 83%
Data users 9.3m
Key financials (FY 13/14)
Revenue £2.0bn
EBITDA £0.4bn
EBITDA margin 17.7%
Capex £0.3bn
100% owned by Vodafone Group Plc
5% of Group revenue 3% of Group EBITDA
2.1GHz
900MHz
2 x 15MHz, 1 x 5MHz
2 x 11MHz
2029
2023
Renewal date Our spectrum assets
TRL22
348
TRL0.06 Average Rpm
Average ARPU
Average MoU
Key dates in our history
2005 2006 2009
Acquisition of Telsim Rebranded to
Vodafone
Vodafone Turkcell
Avea
3G services launched
Mobile
1
74
13
12
Fixed Vodafone
Super
Online
Others
Turk Telecom
Data correct to 30 September 2014 unless otherwise stated. Market shares are estimates

Egypt
34
84m Population
$3,300 GDP/capita
120% Mobile
penetration
Egyptian market
39
33
28
Mobile market share (%) Vodafone in Egypt
39.4m mobile customers
(6% contract, 94% prepaid)
3G coverage 92%
Data users 7.7m
Key financials (FY 13/14)
Revenue £1.2bn
EBITDA £0.5bn
EBITDA margin 44.4%
Capex £0.2bn
54.9% owned by Vodafone Group Plc
3% of Group revenue 4% of Group EBITDA
1800MHz
900MHz
2 x 10MHz
2 x 12.5MHz
2020
2020
Renewal date Our spectrum assets
EGP26
195
EGP0.11 Average Rpm
Average ARPU
Average MoU
Key dates in our history
1998 2006
Part Vodafone-owned
consortium started
services in Egypt
Increased ownership
to 54.9%
Vodafone Mobinil
Etisalat
2.1GHz 2 x 15MHz 2020
Mobile
Data correct to 30 September 2014 unless otherwise stated. Market shares are estimates

Our markets: other AMAP
Ghana 6.8m mobile customers (1% contract, 99% prepaid)
New Zealand 2.3m mobile customers (37% contract, 63% prepaid)
Qatar 1.4m mobile customers (9% contract, 91% prepaid)
Population GDP/capita Mobile
penetration Mobile
market share Fixed market
share
26m
4.5m
2.3m
$1,400
$44,300
$94,700
108%
124%
153%
19%1
47%
32%
70% ownership
<1% of Group revenue
<1% of Group EBITDA
100% ownership
2% of Group revenue
2% of Group EBITDA
22.95% ownership
<1% of Group revenue
<1% of Group EBITDA
0.4m fixed line customers
27%
n/a
n/a
Data correct to 30 September 2014 unless otherwise stated. Market shares are estimates
1. As of 30 June 2014 35

Our joint ventures and associates
Australia (joint venture)
4.9m mobile customers
Indus Towers (joint venture)
50% ownership
42% ownership (through Vodafone India)
• Incorporated in November 2007
• Builds infrastructure for the three shareholders and rents to 3rd parties
• Largest telecom tower company in the world
18
53
29
Mobile market share (%)
Vodafone
Telstra
Optus
• Merged with Hutchison in 2009 to form joint venture
• Number three operator
Safaricom (associate) 21.9m mobile customers (3% contract, 97% prepaid)
40% ownership
• Market leader in Kenya
• 12.8m M-Pesa users generating over 20% of total revenue
• 3,140 base stations (as of March 2014)
36 1. Data correct to 30 September 2014 unless otherwise stated. Market shares are estimates

Partner markets
37
Europe
The Group has partnership agreements with local mobile operators
in over 50 countries extending our reach beyond our equity investments
by enabling a range of our products and services to be marketed in
partnership territories
These partnerships create additional revenue through fees paid by the
partners for access to the Vodafone brand. Results are included within
‘Common Functions’ in our results
Austria
Armenia
Belgium
Bulgaria
Channel Islands
Croatia
Cyprus
Denmark
Estonia
Faroe Islands
Finland
Americas
Brazil
Canada
Chile
AMAP
Afghanistan
Bahrain
Fiji
French Polynesia
Guam
Hong Kong
Iraq
Japan
Jordan
Kuwait
Malaysia
Papua New Guinea & Solomon Islands
Philippines
Saudi Arabia
Singapore
South Korea
Sri Lanka
Taiwan
Thailand
Uganda
United Arab Emirates
Vietnam
France
Iceland
Latvia
Lithuania
Luxemburg
Macedonia/FYROM
Norway
Poland
Russia
Serbia
Slovenia
Sweden
Switzerland
Turkmenistan
Ukraine

More information
38 www.vodafone.com/investor
Visit our website for more information
For definitions of terms please see www.vodafone.com/content/index/investors/glossary
References
All data correct as of 30 September 2014 unless otherwise stated
All market share figures are internal estimates as of 30 September 2014
General market data from Bank of America Merrill Lynch Global Wireless Matrix, 31 October 2014 unless otherwise stated
GDP data from IMF, “World Economic Outlook Database”, October 2014
Follow us
on Twitter
Download our
iPad app
@VodafoneIR

Forward-looking statements
39
This presentation contains “forward-looking statements” within the meaning of the US Private Securities Litigation Reform Act of 1995 with respect to the
Group’s financial condition, results of operations and businesses and certain of the Group’s plans and objectives.
In particular, such forward-looking statements include, but are not limited to, statements with respect to: expectations regarding the Group’s financial
condition or results of operations, including the outlook for the 2015 financial year, or dividends; expectations for the Group’s future performance
generally, including EBITDA growth, free cash flow and capital expenditure; statements relating to the Group’s Project Spring investment programme;
expectations regarding the operating environment and market conditions and trends, including customer usage, competitive and macroeconomic
pressures, price trends and opportunities in specific geographic markets; growth in customers and usage; expectations regarding spectrum licences; and
expectations regarding adjusted operating profit, EBITDA margins, capital expenditure, free cash flow, and foreign exchange rate movements.
Forward-looking statements are sometimes, but not always, identified by their use of a date in the future or such words as “will”, “anticipates”, “aims”,
“could”, “may”, “should”, “expects”, “believes”, “intends”, “plans” or “targets” (including in their negative form). By their nature, forward-looking
statements are inherently predictive, speculative and involve risk and uncertainty because they relate to events and depend on circumstances that may or
may not occur in the future. There are a number of factors that could cause actual results and developments to differ materially from those expressed or
implied by these forward-looking statements.
A review of the reasons why actual results and developments may differ materially from the expectations disclosed or implied within forward-looking
statements can be found under the headings “Risk Factors” and “Other Information – Forward-looking statements” in our half year financial report for the
six months ended 30 September 2014 which can be found on the Group’s website (vodafone.com/investor). All subsequent written or oral forward-
looking statements attributable to the Company, to any member of the Group or to any persons acting on their behalf are expressly qualified in their
entirety by the factors referred to above. No assurances can be given that the forward-looking statements in or made in connection with this presentation
will be realised. Subject to compliance with applicable law and regulations, Vodafone does not intend to update these forward-looking statements and
does not undertake any obligation to do so.