Group information - BP · Group information Basis of preparation BP prepares its consolidated...
29
Group information 6 Financial performance 7 Group income statement 8 Summarized group income statement by quarter 10 Replacement cost profit (loss) before interest and tax by business and geographical area 12 Non-operating items by business 14 Non-operating items by geographical area 16 Fair value accounting effects 16 Total of non-operating items and fair value accounting effects 18 Gulf of Mexico oil spill 19 Sales and other operating revenues 20 Production and similar taxes 20 Taxation 21 Depreciation, depletion and amortization 22 Group balance sheet 23 Operating capital employed 24 Property, plant and equipment 25 Analysis of inventories, receivables and payables 26 Group cash flow statement 27 Movement in net debt 28 Capital expenditure, acquisitions and disposals 29 Employee numbers 30 Ratios 31 BP shareholding information 32 BP share data 33 Information for earnings per share BP Financial and Operating Information 2006 - 2010 5
Transcript of Group information - BP · Group information Basis of preparation BP prepares its consolidated...

Group information
6 Financial performance
7 Group income statement
8 Summarized group income statement by quarter
10 Replacement cost profit (loss) before interest and tax by business and geographical area
12 Non-operating items by business
14 Non-operating items by geographical area
16 Fair value accounting effects
16 Total of non-operating items and fair value accounting effects
18 Gulf of Mexico oil spill
19 Sales and other operating revenues
20 Production and similar taxes
20 Taxation
21 Depreciation, depletion and amortization
22 Group balance sheet
23 Operating capital employed
24 Property, plant and equipment
25 Analysis of inventories, receivables and payables
26 Group cash flow statement
27 Movement in net debt
28 Capital expenditure, acquisitions and disposals
29 Employee numbers
30 Ratios
31 BP shareholding information
32 BP share data
33 Information for earnings per share
BP Financial and Operating Information 2006 - 2010 5

Group information
Basis of preparation BP prepares its consolidated financial statements included within BP Financial and Operating Information 2006-2010 on the basis of International Financial Reporting Standards (IFRS) as issued by the International Accounting Standards Board (IASB), IFRS as adopted by the European Union (EU). IFRS as adopted by the EU differs in certain respects from IFRS as issued by the IASB, however, the differences have no impact on the group’s consolidated financial statements for the periods presented. The financial information presented herein has been prepared in accordance with the accounting policies expected to be used in preparing BP Annual Report and Form 20-F 2011, which do not differ significantly from those used in the BP Annual Report and Form 20-F 2010.
Financial performanceHighlights 2006b 2007 2008 2009 2010
Replacement cost profit (loss) for the year ($ million) 22,537 18,370 25,593 13,955 (4,914) per ordinary share (cents) 112.52 95.85 136.20 74.49 (26.17) per American depositary share (dollars)a 6.75 5.75 8.17 4.47 (1.57)
a One American depositary share (ADS) is equivalent to six 25-cent ordinary shares. b As reported in Annual Report on Form 20-F. There was a $500 million ($315 million post tax) timing difference between the profit reported under IFRS in the Annual Report and Accounts and the profit reported under IFRS in BP Annual Report on Form 20-F 2006. For further information see BP Annual Report and Accounts 2006.
External environment 2006 2007 2008 2009 2010
BP average liquids realizations ($ per barrel ($/bbl))a b 59.23 67.45 90.20 56.26 73.41BP average natural gas realizations ($ per thousand cubic feet ($/mcf))b 4.72 4.53 6.00 3.25 3.97Refining marker margin ($/bbl)c 15.70 17.24 15.11 9.19 10.02
a Cr ude oil and natural gas liquids (NGLs). b Realizations are based on sales of consolidated subsidiaries only, which excludes equity-accounted entities.
c F rom 2011, we will be reporting a new refining indicator margin, replacing the GIM, which we call the refining marker margin (RMM). The refining marker margin is the average of regional indicator margins weighted for BP’s crude refining capacity in each region. Each regional marker margin is based on product yields and a marker crude oil deemed appropriate for the region. The regional indicator margins may not be representative of the margins achieved by BP in any period because of BP’s particular refinery configurations and crude and product slate.
BP Financial and Operating Information 2006 - 2010 6

Group information
Group income statementFor the year ended 31 December $ million
2006d 2007 2008 2009 2010
Sales and other operating revenues 265,906 284,365 361,143 239,272 297,107Earnings from jointly controlled entities – after interest and tax 3,553 3,135 3,023 1,286 1,175Earnings from associates – after interest and tax 442 697 798 2,615 3,582Interest and other income 701 754 736 792 681Gains on sale of businesses and fixed assets 3,714 2,487 1,353 2,173 6,383
Total revenues and other income 274,316 291,438 367,053 246,138 308,928Purchases (187,183) (200,766) (266,982) (163,772) (216,211)Production and manufacturing expenses (21,730) (24,225) (26,756) (23,202) (64,615)Production and similar taxes (5,184) (5,703) (8,953) (3,752) (5,244)Depreciation, depletion and amortization (9,128) (10,579) (10,985) (12,106) (11,164)Impairment and losses on sale of businesses and fixed assets (549) (1,679) (1,733) (2,333) (1,689)Exploration expense (1,045) (756) (882) (1,116) (843)Distribution and administration expensesa (14,447) (15,371) (15,412) (14,038) (12,555)Fair value gain (loss) on embedded derivatives 608 (7) (111) 607 (309)
Profit (loss) before interest and taxation from continuing operations 35,658 32,352 35,239 26,426 (3,702)Finance costs (986) (1,393) (1,547) (1,110) (1,170)Net finance income (expense) relating to pensions and other post-retirement benefits 470 652 591 (192) 47
Profit (loss) before taxation from continuing operations 35,142 31,611 34,283 25,124 (4,825)Taxation (12,516) (10,442) (12,617) (8,365) 1,501
Profit (loss) from continuing operations 22,626 21,169 21,666 16,759 (3,324)Profit (loss) from Innovene operations (25) – – – –
Profit (loss) for the year 22,601 21,169 21,666 16,759 (3,324)
Attributable to BP shareholders 22,315 20,845 21,157 16,578 (3,719) Minority interest 286 324 509 181 395
22,601 21,169 21,666 16,759 (3,324)
Earnings per share – centsProfit (loss) for the year attributable to BP shareholders Basic 111.41 108.76 112.59 88.49 (19.81) Diluted 110.56 107.84 111.56 87.54 (19.81)
Replacement cost resultsb c
Profit (loss) for the year 22,315 20,845 21,157 16,578 (3,719)Inventory holding (gains) losses, net of tax 222 (2,475) 4,436 (2,623) (1,195)
Replacement cost profit (loss) for the year 22,537 18,370 25,593 13,955 (4,914) a Research and development expenditure amounted to 395 566 595 587 780
b Replacement cost profit or loss reflects the replacement cost of supplies. The replacement cost profit or loss for the period is arrived at by excluding from profit or loss inventory holding gains and losses and their associated tax effect. Replacement cost profit or loss for the group is not a recognized generally accepted accounting practice (GAAP) measure. The equivalent measure on an International Finance Reporting Standards (IFRS) basis is ‘profit (loss) for the year’. Inventory holding gains and losses represent the difference between the cost of sales calculated using the average cost to BP of supplies acquired during the period and the cost of sales calculated on the first-in first-out (FIFO) method after adjusting for any changes in provisions where the net realizable value of the inventory is lower than its cost. Under the FIFO method, which we use for IFRS reporting, the cost of inventory charged to the income statement is based on its historic cost of purchase, or manufacture rather than its replacement cost. In volatile energy markets, this can have a significant distorting effect on reported income. The amounts disclosed represent the difference between the charge (to the income statement) for inventory on a FIFO basis (after adjusting for any related movements in net realizable value provisions) and the charge that would have arisen if an average cost of supplies was used for the period. For this purpose, the average cost of supplies during the period is principally calculated on a monthly basis by dividing the total cost of inventory acquired in the period by the number of barrels acquired. The amounts disclosed are not separately reflected in the financial statements as a gain or loss. No adjustment is made in respect of the cost of inventories held as part of a trading position and certain other temporary inventory positions. Management believes this information is useful to illustrate to investors the fact that crude oil and product prices can vary significantly from period to period and that the impact on our reported result under IFRS can be significant. Inventory holding gains and losses vary from period to period due principally to changes in oil prices as well as changes to underlying inventory levels. In order for investors to understand the operating performance of the group excluding the impact of oil price changes on the replacement of inventories, and to make comparisons of operating performance between reporting periods, BP’s management believes it is helpful to disclose this information.
c P rofit (loss) attributable to BP shareholders.d As reported in Annual Report on Form 20-F. There was a $500 million ($315 million post tax) timing difference between the profit reported under IFRS in the Annual Report and Accounts and the profit
reported under IFRS in BP Annual Report on Form 20-F 2006. For further information see BP Annual Report and Accounts 2006.
BP Financial and Operating Information 2006 - 2010 7

Group information
Summarized group income statement by quarter
Q1 Q2b Q3 Q4 2006b Q1 Q2 Q3 Q4 2007
Replacement cost resultsReplacement cost profit (loss) before interest and taxa
By business Exploration and Production 7,126 8,244 10,078 5,578 31,026 6,306 7,119 6,307 7,870 27,602 Refining and Marketing 1,498 2,358 1,480 325 5,661 804 2,742 371 (1,296) 2,621 Other businesses and corporate (89) (177) (225) (350) (841) (98) (173) (511) (427) (1,209) Gulf of Mexico oil spill response – – – – – – – – – – Consolidation adjustment (24) (260) 436 (87) 65 42 (98) 103 (267) (220) Replacement cost profit (loss) before interest and tax from continuing operations 8,511 10,165 11,769 5,466 35,911 7,054 9,590 6,270 5,880 28,794 Finance costs and net finance income (expense) relating to pensions and other post-retirement benefits (143) (107) (117) (149) (516) (171) (155) (173) (242) (741) Replacement cost profit (loss) before taxation from continuing operations 8,368 10,058 11,652 5,317 35,395 6,883 9,435 6,097 5,638 28,053 Taxation on a replacement cost basis (2,810) (3,241) (4,824) (1,672) (12,547) (2,357) (2,882) (1,982) (2,138) (9,359) Replacement cost profit (loss) from continuing operations 5,558 6,817 6,828 3,645 22,848 4,526 6,553 4,115 3,500 18,694 Replacement cost profit (loss) from Innovene operations (103) 78 – – (25) – – – – – Replacement cost profit (loss) for the period 5,455 6,895 6,828 3,645 22,823 4,526 6,553 4,115 3,500 18,694 Attributable to BP shareholders 5,384 6,818 6,765 3,570 22,537 4,444 6,488 4,043 3,395 18,370 Minority interest 71 77 63 75 286 82 65 72 105 324 Replacement cost profit (loss) for the period 5,455 6,895 6,828 3,645 22,823 4,526 6,553 4,115 3,500 18,694 Earnings on replacement cost profit (loss) per ordinary share – cents 26.24 33.75 34.06 18.47 112.52 22.93 33.75 21.27 17.90 95.85 per ADS – dollars 1.57 2.03 2.04 1.11 6.75 1.38 2.03 1.28 1.07 5.75 Replacement cost profit (loss) for the period 5,455 6,895 6,828 3,645 22,823 4,526 6,553 4,115 3,500 18,694 Inventory holding gains (losses), net of tax 239 763 (534) (690) (222) 220 888 363 1,004 2,475 Profit (loss) for the period 5,694 7,658 6,294 2,955 22,601 4,746 7,441 4,478 4,504 21,169 Earnings on profit (loss) per ordinary share – cents Basic 27.40 37.49 31.46 15.04 111.41 24.06 38.37 23.18 23.15 108.76 Diluted 27.13 37.12 31.40 14.88 110.56 23.94 38.18 23.07 22.65 107.84 per ADS – dollars Basic 1.64 2.25 1.89 0.90 6.68 1.44 2.30 1.39 1.39 6.52 Diluted 1.63 2.23 1.88 0.89 6.63 1.44 2.29 1.38 1.36 6.47 Earnings on profit (loss) from continuing operations per ordinary share – cents Basic 27.90 37.12 31.46 15.04 111.54 24.06 38.37 23.18 23.15 108.76 Diluted 27.63 36.74 31.40 14.88 110.68 23.94 38.18 23.07 22.65 107.84 per ADS – dollars Basic 1.67 2.23 1.89 0.90 6.69 1.44 2.30 1.39 1.39 6.52 Diluted 1.66 2.20 1.88 0.89 6.64 1.44 2.29 1.38 1.36 6.47
a R eplacement cost profit or loss is before inventory holding gains and losses. See page 7 for more information. b As reported in Annual Report on Form 20-F. There was a $500 million ($315 million post tax) timing difference between the profit reported under IFRS in the Annual Report and Accounts and the profit reported under IFRS in BP Annual Report on Form 20-F 2006. For further information see BP Annual Report and Accounts 2006.
Summarized group income statement by quarter continued$ million
Q1 Q2 Q3 Q4 2008 Q1 Q2 Q3 Q4 2009 Q1 Q2 Q3 Q4 2010
10,072 10,771 12,709 4,756 38,308 4,320 5,046 6,929 8,505 24,800 8,292 6,244 8,350 8,000 30,8861,249 539 1,972 416 4,176 1,090 680 916 (1,943) 743 729 2,075 1,787 964 5,555(213) (314) (16) (680) (1,223) (761) (583) (586) (392) (2,322) (328) (70) (568) (550) (1,516)
– – – – – – – – – – – (32,192) (7,656) (1,010) (40,858)(784) (221) 838 633 466 (405) 76 104 (492) (717) 208 98 85 56 447
10,324 10,775 15,503 5,125 41,727 4,244 5,219 7,363 5,678 22,504 8,901 (23,845) 1,998 7,460 (5,486)
(246) (221) (238) (251) (956) (368) (321) (311) (302) (1,302) (228) (214) (335) (346) (1,123)
10,078 10,554 15,265 4,874 40,771 3,876 4,898 7,052 5,376 21,202 8,673 (24,059) 1,663 7,114 (6,609)(3,729) (3,696) (5,099) (2,145) (14,669) (1,454) (1,714) (2,052) (1,846) (7,066) (2,966) 7,188 272 (2,404) 2,090
6,349 6,858 10,166 2,729 26,102 2,422 3,184 5,000 3,530 14,136 5,707 (16,871) 1,935 4,710 (4,519)
– – – – – – – – – – – – – – –
6,349 6,858 10,166 2,729 26,102 2,422 3,184 5,000 3,530 14,136 5,707 (16,871) 1,935 4,710 (4,519)
6,231 6,746 10,029 2,587 25,593 2,387 3,140 4,981 3,447 13,955 5,598 (16,973) 1,847 4,614 (4,914)118 112 137 142 509 35 44 19 83 181 109 102 88 96 395
6,349 6,858 10,166 2,729 26,102 2,422 3,184 5,000 3,530 14,136 5,707 (16,871) 1,935 4,710 (4,519)
33.01 35.83 53.43 13.93 136.20 12.75 16.76 26.59 18.38 74.49 29.82 (90.35) 9.83 24.55 (26.17)1.98 2.15 3.21 0.84 8.17 0.77 1.01 1.60 1.10 4.47 1.79 (5.42) 0.59 1.47 (1.57)
6,349 6,858 10,166 2,729 26,102 2,422 3,184 5,000 3,530 14,136 5,707 (16,871) 1,935 4,710 (4,519)863 2,612 (1,980) (5,931) (4,436) 175 1,245 355 848 2,623 481 (177) (62) 953 1,195
7,212 9,470 8,186 (3,202) 21,666 2,597 4,429 5,355 4,378 16,759 6,188 (17,048) 1,873 5,663 (3,324)
37.58 49.70 42.93 (17.62) 112.59 13.69 23.41 28.48 22.90 88.49 32.39 (91.29) 9.50 29.62 (19.81)37.25 49.23 42.56 (17.62) 111.56 13.54 23.16 28.18 22.64 87.54 31.99 (91.29) 9.38 29.28 (19.81)
2.25 2.98 2.58 (1.06) 6.75 0.82 1.40 1.71 1.37 5.31 1.94 (5.48) 0.57 1.78 (1.19)2.24 2.95 2.55 (1.06) 6.69 0.81 1.39 1.69 1.36 5.25 1.92 (5.48) 0.59 1.76 (1.19)
BP Financial and Operating Information 2006 - 2010 8

Group information
Summarized group income statement by quarter Summarized group income statement by quarter continued$ million
Q1 Q2 Q3 Q4 2008 Q1 Q2 Q3 Q4 2009 Q1 Q2 Q3 Q4 2010
10,072 10,771 12,709 4,756 38,308 4,320 5,046 6,929 8,505 24,800 8,292 6,244 8,350 8,000 30,8861,249 539 1,972 416 4,176 1,090 680 916 (1,943) 743 729 2,075 1,787 964 5,555(213) (314) (16) (680) (1,223) (761) (583) (586) (392) (2,322) (328) (70) (568) (550) (1,516)
– – – – – – – – – – – (32,192) (7,656) (1,010) (40,858)(784) (221) 838 633 466 (405) 76 104 (492) (717) 208 98 85 56 447
10,324 10,775 15,503 5,125 41,727 4,244 5,219 7,363 5,678 22,504 8,901 (23,845) 1,998 7,460 (5,486)
(246) (221) (238) (251) (956) (368) (321) (311) (302) (1,302) (228) (214) (335) (346) (1,123)
10,078 10,554 15,265 4,874 40,771 3,876 4,898 7,052 5,376 21,202 8,673 (24,059) 1,663 7,114 (6,609)(3,729) (3,696) (5,099) (2,145) (14,669) (1,454) (1,714) (2,052) (1,846) (7,066) (2,966) 7,188 272 (2,404) 2,090
6,349 6,858 10,166 2,729 26,102 2,422 3,184 5,000 3,530 14,136 5,707 (16,871) 1,935 4,710 (4,519)
– – – – – – – – – – – – – – –
6,349 6,858 10,166 2,729 26,102 2,422 3,184 5,000 3,530 14,136 5,707 (16,871) 1,935 4,710 (4,519)
6,231 6,746 10,029 2,587 25,593 2,387 3,140 4,981 3,447 13,955 5,598 (16,973) 1,847 4,614 (4,914)118 112 137 142 509 35 44 19 83 181 109 102 88 96 395
6,349 6,858 10,166 2,729 26,102 2,422 3,184 5,000 3,530 14,136 5,707 (16,871) 1,935 4,710 (4,519)
33.01 35.83 53.43 13.93 136.20 12.75 16.76 26.59 18.38 74.49 29.82 (90.35) 9.83 24.55 (26.17)1.98 2.15 3.21 0.84 8.17 0.77 1.01 1.60 1.10 4.47 1.79 (5.42) 0.59 1.47 (1.57)
6,349 6,858 10,166 2,729 26,102 2,422 3,184 5,000 3,530 14,136 5,707 (16,871) 1,935 4,710 (4,519)863 2,612 (1,980) (5,931) (4,436) 175 1,245 355 848 2,623 481 (177) (62) 953 1,195
7,212 9,470 8,186 (3,202) 21,666 2,597 4,429 5,355 4,378 16,759 6,188 (17,048) 1,873 5,663 (3,324)
37.58 49.70 42.93 (17.62) 112.59 13.69 23.41 28.48 22.90 88.49 32.39 (91.29) 9.50 29.62 (19.81)37.25 49.23 42.56 (17.62) 111.56 13.54 23.16 28.18 22.64 87.54 31.99 (91.29) 9.38 29.28 (19.81)
2.25 2.98 2.58 (1.06) 6.75 0.82 1.40 1.71 1.37 5.31 1.94 (5.48) 0.57 1.78 (1.19)2.24 2.95 2.55 (1.06) 6.69 0.81 1.39 1.69 1.36 5.25 1.92 (5.48) 0.59 1.76 (1.19)
37.58 49.70 42.93 (17.62) 112.59 13.69 23.41 28.48 22.90 88.49 32.39 (91.29) 9.50 29.62 (19.81)37.25 49.23 42.56 (17.62) 111.56 13.54 23.16 28.18 22.64 87.54 31.99 (91.29) 9.38 29.28 (19.81)
2.25 2.98 2.58 (1.06) 6.75 0.82 1.40 1.71 1.37 5.31 1.94 (5.48) 0.57 1.78 (1.19)2.24 2.95 2.55 (1.06) 6.69 0.81 1.39 1.69 1.36 5.25 1.92 (5.48) 0.59 1.76 (1.19)
Q1 Q2b Q3 Q4 2006b Q1 Q2 Q3 Q4 2007
Replacement cost resultsReplacement cost profit (loss) before interest and taxa
By business Exploration and Production 7,126 8,244 10,078 5,578 31,026 6,306 7,119 6,307 7,870 27,602 Refining and Marketing 1,498 2,358 1,480 325 5,661 804 2,742 371 (1,296) 2,621 Other businesses and corporate (89) (177) (225) (350) (841) (98) (173) (511) (427) (1,209) Gulf of Mexico oil spill response – – – – – – – – – – Consolidation adjustment (24) (260) 436 (87) 65 42 (98) 103 (267) (220) Replacement cost profit (loss) before interest and tax from continuing operations 8,511 10,165 11,769 5,466 35,911 7,054 9,590 6,270 5,880 28,794 Finance costs and net finance income (expense) relating to pensions and other post-retirement benefits (143) (107) (117) (149) (516) (171) (155) (173) (242) (741) Replacement cost profit (loss) before taxation from continuing operations 8,368 10,058 11,652 5,317 35,395 6,883 9,435 6,097 5,638 28,053 Taxation on a replacement cost basis (2,810) (3,241) (4,824) (1,672) (12,547) (2,357) (2,882) (1,982) (2,138) (9,359) Replacement cost profit (loss) from continuing operations 5,558 6,817 6,828 3,645 22,848 4,526 6,553 4,115 3,500 18,694 Replacement cost profit (loss) from Innovene operations (103) 78 – – (25) – – – – – Replacement cost profit (loss) for the period 5,455 6,895 6,828 3,645 22,823 4,526 6,553 4,115 3,500 18,694 Attributable to BP shareholders 5,384 6,818 6,765 3,570 22,537 4,444 6,488 4,043 3,395 18,370 Minority interest 71 77 63 75 286 82 65 72 105 324 Replacement cost profit (loss) for the period 5,455 6,895 6,828 3,645 22,823 4,526 6,553 4,115 3,500 18,694 Earnings on replacement cost profit (loss) per ordinary share – cents 26.24 33.75 34.06 18.47 112.52 22.93 33.75 21.27 17.90 95.85 per ADS – dollars 1.57 2.03 2.04 1.11 6.75 1.38 2.03 1.28 1.07 5.75 Replacement cost profit (loss) for the period 5,455 6,895 6,828 3,645 22,823 4,526 6,553 4,115 3,500 18,694 Inventory holding gains (losses), net of tax 239 763 (534) (690) (222) 220 888 363 1,004 2,475 Profit (loss) for the period 5,694 7,658 6,294 2,955 22,601 4,746 7,441 4,478 4,504 21,169 Earnings on profit (loss) per ordinary share – cents Basic 27.40 37.49 31.46 15.04 111.41 24.06 38.37 23.18 23.15 108.76 Diluted 27.13 37.12 31.40 14.88 110.56 23.94 38.18 23.07 22.65 107.84 per ADS – dollars Basic 1.64 2.25 1.89 0.90 6.68 1.44 2.30 1.39 1.39 6.52 Diluted 1.63 2.23 1.88 0.89 6.63 1.44 2.29 1.38 1.36 6.47 Earnings on profit (loss) from continuing operations per ordinary share – cents Basic 27.90 37.12 31.46 15.04 111.54 24.06 38.37 23.18 23.15 108.76 Diluted 27.63 36.74 31.40 14.88 110.68 23.94 38.18 23.07 22.65 107.84 per ADS – dollars Basic 1.67 2.23 1.89 0.90 6.69 1.44 2.30 1.39 1.39 6.52 Diluted 1.66 2.20 1.88 0.89 6.64 1.44 2.29 1.38 1.36 6.47
a Replacement cost profit or loss is before inventory holding gains and losses. See page 7 for more information. b As reported in Annual Report on Form 20-F. There was a $500 million ($315 million post tax) timing difference between the profit reported under IFRS in the Annual Report and Accounts and the profit reported under IFRS in BP Annual Report on Form 20-F 2006. For further information see BP Annual Report and Accounts 2006.
BP Financial and Operating Information 2006 - 2010 9
Group information
Replacement cost profit (loss) before interest and tax by business and geographical area
Q1 Q2a Q3 Q4 2006a Q1 Q2 Q3 Q4 2007
By businessExploration and Production US 2,500 2,476 3,958 1,068 10,002 1,731 2,183 1,775 2,240 7,929 Non-US 4,626 5,768 6,120 4,510 21,024 4,575 4,936 4,532 5,630 19,673 7,126 8,244 10,078 5,578 31,026 6,306 7,119 6,307 7,870 27,602 Refining and Marketing US 636 1,250 388 (416) 1,858 129 966 (522) (1,805) (1,232) Non-US 862 1,108 1,092 741 3,803 675 1,776 893 509 3,853 1,498 2,358 1,480 325 5,661 804 2,742 371 (1,296) 2,621 Other businesses and corporate US (98) (27) 58 (342) (409) (133) (128) (363) (336) (960) Non-US 9 (150) (283) (8) (432) 35 (45) (148) (91) (249) (89) (177) (225) (350) (841) (98) (173) (511) (427) (1,209) 8,535 10,425 11,333 5,553 35,846 7,012 9,688 6,167 6,147 29,014 Gulf of Mexico oil spill response – – – – – – – – – – Consolidation adjustment (24) (260) 436 (87) 65 42 (98) 103 (267) (220) Total for continuing operations 8,511 10,165 11,769 5,466 35,911 7,054 9,590 6,270 5,880 28,794 Innovene operations US 7 (6) – 15 16 – – – – – Non-US (103) (82) – (15) (200) – – – – – (96) (88) – – (184) – – – – – Total for period 8,415 10,077 11,769 5,466 35,727 7,054 9,590 6,270 5,880 28,794
By geographical areaUS 3,071 3,432 4,784 230 11,517 1,756 2,933 983 (91) 5,581 Non-US 5,440 6,733 6,985 5,236 24,394 5,298 6,657 5,287 5,971 23,213 Total for continuing operations 8,511 10,165 11,769 5,466 35,911 7,054 9,590 6,270 5,880 28,794
a As reported in Annual Report on Form 20-F. There was a $500 million ($315 million post tax) timing difference between the profit reported under IFRS in the Annual Report and Accounts and the profit reported under IFRS in BP Annual Report on Form 20-F 2006. For further information see BP Annual Report and Accounts 2006.
$ million
Q1 Q2 Q3 Q4 2008 Q1 Q2 Q3 Q4 2009 Q1 Q2 Q3 Q4 2010
3,085 3,601 3,739 1,299 11,724 1,143 1,161 1,864 2,517 6,685 2,762 1,798 3,602 1,522 9,6846,987 7,170 8,970 3,457 26,584 3,177 3,885 5,065 5,988 18,115 5,530 4,446 4,748 6,478 21,202
10,072 10,771 12,709 4,756 38,308 4,320 5,046 6,929 8,505 24,800 8,292 6,244 8,350 8,000 30,886
154 (401) 338 (735) (644) 308 (326) (229) (2,331) (2,578) (63) 757 220 21 9351,095 940 1,634 1,151 4,820 782 1,006 1,145 388 3,321 792 1,318 1,567 943 4,620
1,249 539 1,972 416 4,176 1,090 680 916 (1,943) 743 729 2,075 1,787 964 5,555
(152) (185) (288) (277) (902) (279) (129) (179) (141) (728) (231) (119) (156) (225) (731)(61) (129) 272 (403) (321) (482) (454) (407) (251) (1,594) (97) 49 (412) (325) (785)
(213) (314) (16) (680) (1,223) (761) (583) (586) (392) (2,322) (328) (70) (568) (550) (1,516)
11,108 10,996 14,665 4,492 41,261 4,649 5,143 7,259 6,170 23,221 8,693 8,249 9,569 8,414 34,925
– – – – – – – – – – – (32,192) (7,656) (1,010) (40,858)(784) (221) 838 633 466 (405) 76 104 (492) (717) 208 98 85 56 447
10,324 10,775 15,503 5,125 41,727 4,244 5,219 7,363 5,678 22,504 8,901 (23,845) 1,998 7,460 (5,486)
– – – – – – – – – – – – – – –– – – – – – – – – – – – – – –
– – – – – – – – – – – – – – –
10,324 10,775 15,503 5,125 41,727 4,244 5,219 7,363 5,678 22,504 8,901 (23,845) 1,998 7,460 (5,486)
2,621 3,267 4,419 371 10,678 854 730 1,516 (294) 2,806 2,590 (29,171) (3,891) 385 (30,087)7,703 7,508 11,084 4,754 31,049 3,390 4,489 5,847 5,972 19,698 6,311 5,326 5,889 7,075 24,601
10,324 10,775 15,503 5,125 41,727 4,244 5,219 7,363 5,678 22,504 8,901 (23,845) 1,998 7,460 (5,486)
BP Financial and Operating Information 2006 - 2010 10

Group information
Replacement cost profit (loss) before interest and tax by business and geographical area
Q1 Q2a Q3 Q4 2006a Q1 Q2 Q3 Q4 2007
By businessExploration and Production US 2,500 2,476 3,958 1,068 10,002 1,731 2,183 1,775 2,240 7,929 Non-US 4,626 5,768 6,120 4,510 21,024 4,575 4,936 4,532 5,630 19,673 7,126 8,244 10,078 5,578 31,026 6,306 7,119 6,307 7,870 27,602 Refining and Marketing US 636 1,250 388 (416) 1,858 129 966 (522) (1,805) (1,232) Non-US 862 1,108 1,092 741 3,803 675 1,776 893 509 3,853 1,498 2,358 1,480 325 5,661 804 2,742 371 (1,296) 2,621 Other businesses and corporate US (98) (27) 58 (342) (409) (133) (128) (363) (336) (960) Non-US 9 (150) (283) (8) (432) 35 (45) (148) (91) (249) (89) (177) (225) (350) (841) (98) (173) (511) (427) (1,209) 8,535 10,425 11,333 5,553 35,846 7,012 9,688 6,167 6,147 29,014 Gulf of Mexico oil spill response – – – – – – – – – – Consolidation adjustment (24) (260) 436 (87) 65 42 (98) 103 (267) (220) Total for continuing operations 8,511 10,165 11,769 5,466 35,911 7,054 9,590 6,270 5,880 28,794 Innovene operations US 7 (6) – 15 16 – – – – – Non-US (103) (82) – (15) (200) – – – – – (96) (88) – – (184) – – – – – Total for period 8,415 10,077 11,769 5,466 35,727 7,054 9,590 6,270 5,880 28,794
By geographical areaUS 3,071 3,432 4,784 230 11,517 1,756 2,933 983 (91) 5,581 Non-US 5,440 6,733 6,985 5,236 24,394 5,298 6,657 5,287 5,971 23,213 Total for continuing operations 8,511 10,165 11,769 5,466 35,911 7,054 9,590 6,270 5,880 28,794
a As reported in Annual Report on Form 20-F. There was a $500 million ($315 million post tax) timing difference between the profit reported under IFRS in the Annual Report and Accounts and the profit reported under IFRS in BP Annual Report on Form 20-F 2006. For further information see BP Annual Report and Accounts 2006.
Replacement cost profit (loss) before interest and tax by business and geographical area continued
$ million
Q1 Q2 Q3 Q4 2008 Q1 Q2 Q3 Q4 2009 Q1 Q2 Q3 Q4 2010
3,085 3,601 3,739 1,299 11,724 1,143 1,161 1,864 2,517 6,685 2,762 1,798 3,602 1,522 9,6846,987 7,170 8,970 3,457 26,584 3,177 3,885 5,065 5,988 18,115 5,530 4,446 4,748 6,478 21,202
10,072 10,771 12,709 4,756 38,308 4,320 5,046 6,929 8,505 24,800 8,292 6,244 8,350 8,000 30,886
154 (401) 338 (735) (644) 308 (326) (229) (2,331) (2,578) (63) 757 220 21 9351,095 940 1,634 1,151 4,820 782 1,006 1,145 388 3,321 792 1,318 1,567 943 4,620
1,249 539 1,972 416 4,176 1,090 680 916 (1,943) 743 729 2,075 1,787 964 5,555
(152) (185) (288) (277) (902) (279) (129) (179) (141) (728) (231) (119) (156) (225) (731)(61) (129) 272 (403) (321) (482) (454) (407) (251) (1,594) (97) 49 (412) (325) (785)
(213) (314) (16) (680) (1,223) (761) (583) (586) (392) (2,322) (328) (70) (568) (550) (1,516)
11,108 10,996 14,665 4,492 41,261 4,649 5,143 7,259 6,170 23,221 8,693 8,249 9,569 8,414 34,925
– – – – – – – – – – – (32,192) (7,656) (1,010) (40,858)(784) (221) 838 633 466 (405) 76 104 (492) (717) 208 98 85 56 447
10,324 10,775 15,503 5,125 41,727 4,244 5,219 7,363 5,678 22,504 8,901 (23,845) 1,998 7,460 (5,486)
– – – – – – – – – – – – – – –– – – – – – – – – – – – – – –
– – – – – – – – – – – – – – –
10,324 10,775 15,503 5,125 41,727 4,244 5,219 7,363 5,678 22,504 8,901 (23,845) 1,998 7,460 (5,486)
2,621 3,267 4,419 371 10,678 854 730 1,516 (294) 2,806 2,590 (29,171) (3,891) 385 (30,087)7,703 7,508 11,084 4,754 31,049 3,390 4,489 5,847 5,972 19,698 6,311 5,326 5,889 7,075 24,601
10,324 10,775 15,503 5,125 41,727 4,244 5,219 7,363 5,678 22,504 8,901 (23,845) 1,998 7,460 (5,486)
BP Financial and Operating Information 2006 - 2010 11
Group information
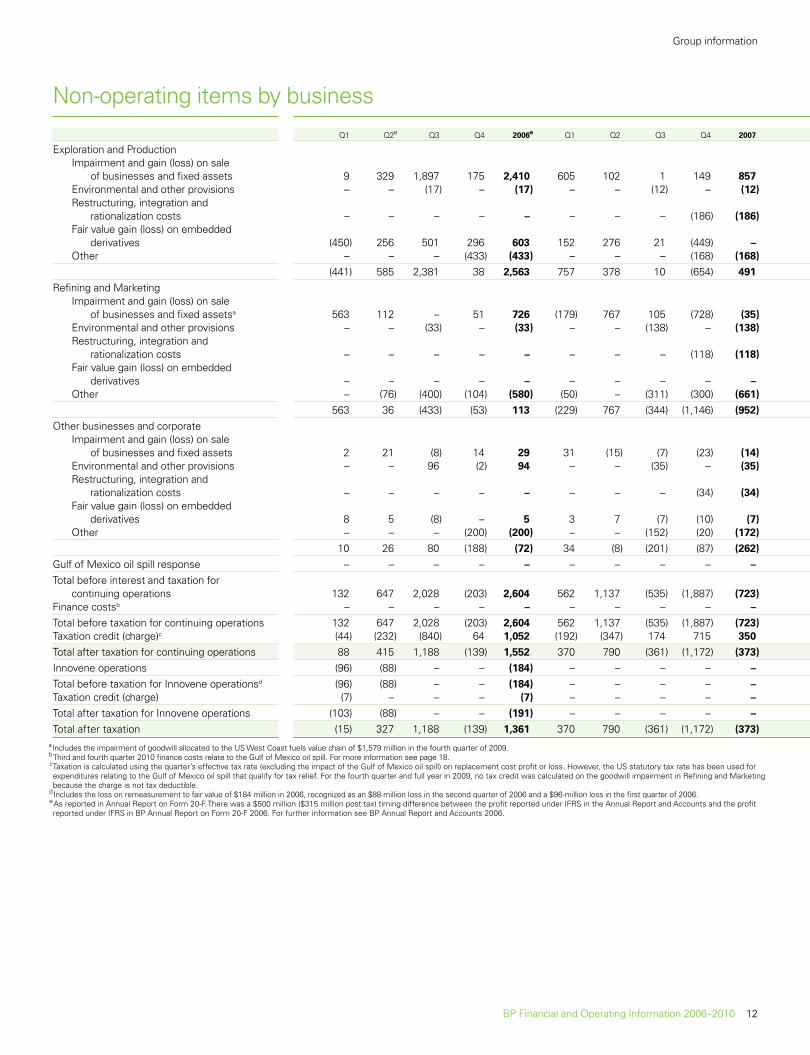
Non-operating items by business
Q1 Q2e Q3 Q4 2006e Q1 Q2 Q3 Q4 2007
Exploration and Production Impairment and gain (loss) on sale of businesses and fixed assets 9 329 1,897 175 2,410 605 102 1 149 857 Environmental and other provisions – – (17) – (17) – – (12) – (12) Restructuring, integration and rationalization costs – – – – – – – – (186) (186) Fair value gain (loss) on embedded derivatives (450) 256 501 296 603 152 276 21 (449) – Other – – – (433) (433) – – – (168) (168) (441) 585 2,381 38 2,563 757 378 10 (654) 491 Refining and Marketing Impairment and gain (loss) on sale of businesses and fixed assetsa 563 112 – 51 726 (179) 767 105 (728) (35) Environmental and other provisions – – (33) – (33) – – (138) – (138) Restructuring, integration and rationalization costs – – – – – – – – (118) (118) Fair value gain (loss) on embedded derivatives – – – – – – – – – – Other – (76) (400) (104) (580) (50) – (311) (300) (661) 563 36 (433) (53) 113 (229) 767 (344) (1,146) (952) Other businesses and corporate Impairment and gain (loss) on sale of businesses and fixed assets 2 21 (8) 14 29 31 (15) (7) (23) (14) Environmental and other provisions – – 96 (2) 94 – – (35) – (35) Restructuring, integration and rationalization costs – – – – – – – – (34) (34) Fair value gain (loss) on embedded derivatives 8 5 (8) – 5 3 7 (7) (10) (7) Other – – – (200) (200) – – (152) (20) (172) 10 26 80 (188) (72) 34 (8) (201) (87) (262) Gulf of Mexico oil spill response – – – – – – – – – – Total before interest and taxation for continuing operations 132 647 2,028 (203) 2,604 562 1,137 (535) (1,887) (723) Finance costsb – – – – – – – – – – Total before taxation for continuing operations 132 647 2,028 (203) 2,604 562 1,137 (535) (1,887) (723) Taxation credit (charge)c (44) (232) (840) 64 1,052 (192) (347) 174 715 350 Total after taxation for continuing operations 88 415 1,188 (139) 1,552 370 790 (361) (1,172) (373) Innovene operations (96) (88) – – (184) – – – – – Total before taxation for Innovene operationsd (96) (88) – – (184) – – – – – Taxation credit (charge) (7) – – – (7) – – – – – Total after taxation for Innovene operations (103) (88) – – (191) – – – – – Total after taxation (15) 327 1,188 (139) 1,361 370 790 (361) (1,172) (373)
a Includes the impairment of goodwill allocated to the US West Coast fuels value chain of $1,579 million in the fourth quarter of 2009. b Third and fourth quarter 2010 finance costs relate to the Gulf of Mexico oil spill. For more information see page 18. cTaxation is calculated using the quarter’s effective tax rate (excluding the impact of the Gulf of Mexico oil spill) on replacement cost profit or loss. However, the US statutory tax rate has been used for expenditures relating to the Gulf of Mexico oil spill that qualify for tax relief. For the fourth quarter and full year in 2009, no tax credit was calculated on the goodwill impairment in Refining and Marketing because the charge is not tax deductible.
d Includes the loss on remeasurement to fair value of $184 million in 2006, recognized as an $88-million loss in the second quarter of 2006 and a $96-million loss in the first quarter of 2006.e As reported in Annual Report on Form 20-F. There was a $500 million ($315 million post tax) timing difference between the profit reported under IFRS in the Annual Report and Accounts and the profit reported under IFRS in BP Annual Report on Form 20-F 2006. For further information see BP Annual Report and Accounts 2006.
Non-operating items by business continued$ million
Q1 Q2 Q3 Q4 2008 Q1 Q2 Q3 Q4 2009 Q1 Q2 Q3 Q4 2010
21 111 33 (1,180) (1,015) 73 359 72 1,070 1,574 (13) 660 1,735 1,430 3,812– (5) (7) – (12) – – 3 – 3 – – (54) – (54)
(44) – (6) (7) (57) (1) (6) 1 (4) (10) (104) (13) (6) (14) (137)
(684) (2,082) 1,098 1,505 (163) 243 154 370 (103) 664 146 (452) 20 (23) (309)331 – – (74) 257 (4) – 25 13 34 12 (134) 46 (37) (113)
(376) (1,976) 1,118 244 (990) 311 507 471 976 2,265 41 61 1,741 1,356 3,199
814 (13) 114 (114) 801 (21) (52) (13) (1,518) (1,604) (45) 270 507 145 877– – (62) (2) (64) – – (190) (29) (219) – – (83) (15) (98)
(205) (86) (52) (104) (447) (263) (114) (38) (492) (907) 12 (30) (32) (47) (97)
– – – 57 57 (57) – – – (57) – – – – –– – – – – (9) – – 193 184 (37) (8) (10) 3 (52)
609 (99) – (163) 347 (350) (166) (241) (1,846) (2,603) (70) 232 382 86 630
50 (42) (8) (166) (166) (108) (1) (14) (7) (130) (68) 97 (1) (23) 5– – (76) (41) (117) (75) – (16) 16 (75) – (4) (77) (22) (103)
(58) (75) (30) (91) (254) (71) (37) (28) (47) (183) (38) (22) (8) (13) (81)
(6) 1 – – (5) – – – – – – – – – –(67) (7) (14) (3) (91) (67) (1) (6) (27) (101) (12) – – (9) (21)
(81) (123) (128) (301) (633) (321) (39) (64) (65) (489) (118) 71 (86) (67) (200)
– – – – – – – – – – – (32,192) (7,656) (1,010) (40,858)
152 (2,198) 990 (220) (1,276) (360) 302 166 (935) (827) (147) (31,828) (5,619) 365 (37,229)– – – – – – – – – – – – (47) (30) (77)
152 (2,198) 990 (220) (1,276) (360) 302 166 (935) (827) (147) (31,828) (5,666) 335 (37,306)(56) 770 (331) 97 480 135 (106) (48) (221) (240) 50 9,877 2,097 (167) 11,857
96 (1,428) 659 (123) (796) (225) 196 118 (1,156) (1,067) (97) (21,951) (3,569) 168 (25,449)
– – – – – – – – – – – – – – –
– – – – – – – – – – – – – – –– – – – – – – – – – – – – – –
– – – – – – – – – – – – – – –
96 (1,428) 659 (123) (796) (225) 196 118 (1,156) (1,067) (97) (21,951) (3,569) 168 (25,449)
BP Financial and Operating Information 2006 - 2010 12

Group information
Non-operating items by business Non-operating items by business continued$ million
Q1 Q2 Q3 Q4 2008 Q1 Q2 Q3 Q4 2009 Q1 Q2 Q3 Q4 2010
21 111 33 (1,180) (1,015) 73 359 72 1,070 1,574 (13) 660 1,735 1,430 3,812– (5) (7) – (12) – – 3 – 3 – – (54) – (54)
(44) – (6) (7) (57) (1) (6) 1 (4) (10) (104) (13) (6) (14) (137)
(684) (2,082) 1,098 1,505 (163) 243 154 370 (103) 664 146 (452) 20 (23) (309)331 – – (74) 257 (4) – 25 13 34 12 (134) 46 (37) (113)
(376) (1,976) 1,118 244 (990) 311 507 471 976 2,265 41 61 1,741 1,356 3,199
814 (13) 114 (114) 801 (21) (52) (13) (1,518) (1,604) (45) 270 507 145 877– – (62) (2) (64) – – (190) (29) (219) – – (83) (15) (98)
(205) (86) (52) (104) (447) (263) (114) (38) (492) (907) 12 (30) (32) (47) (97)
– – – 57 57 (57) – – – (57) – – – – –– – – – – (9) – – 193 184 (37) (8) (10) 3 (52)
609 (99) – (163) 347 (350) (166) (241) (1,846) (2,603) (70) 232 382 86 630
50 (42) (8) (166) (166) (108) (1) (14) (7) (130) (68) 97 (1) (23) 5– – (76) (41) (117) (75) – (16) 16 (75) – (4) (77) (22) (103)
(58) (75) (30) (91) (254) (71) (37) (28) (47) (183) (38) (22) (8) (13) (81)
(6) 1 – – (5) – – – – – – – – – –(67) (7) (14) (3) (91) (67) (1) (6) (27) (101) (12) – – (9) (21)
(81) (123) (128) (301) (633) (321) (39) (64) (65) (489) (118) 71 (86) (67) (200)
– – – – – – – – – – – (32,192) (7,656) (1,010) (40,858)
152 (2,198) 990 (220) (1,276) (360) 302 166 (935) (827) (147) (31,828) (5,619) 365 (37,229)– – – – – – – – – – – – (47) (30) (77)
152 (2,198) 990 (220) (1,276) (360) 302 166 (935) (827) (147) (31,828) (5,666) 335 (37,306)(56) 770 (331) 97 480 135 (106) (48) (221) (240) 50 9,877 2,097 (167) 11,857
96 (1,428) 659 (123) (796) (225) 196 118 (1,156) (1,067) (97) (21,951) (3,569) 168 (25,449)
– – – – – – – – – – – – – – –
– – – – – – – – – – – – – – –– – – – – – – – – – – – – – –
– – – – – – – – – – – – – – –
96 (1,428) 659 (123) (796) (225) 196 118 (1,156) (1,067) (97) (21,951) (3,569) 168 (25,449)
Q1 Q2e Q3 Q4 2006e Q1 Q2 Q3 Q4 2007
Exploration and Production Impairment and gain (loss) on sale of businesses and fixed assets 9 329 1,897 175 2,410 605 102 1 149 857 Environmental and other provisions – – (17) – (17) – – (12) – (12) Restructuring, integration and rationalization costs – – – – – – – – (186) (186) Fair value gain (loss) on embedded derivatives (450) 256 501 296 603 152 276 21 (449) – Other – – – (433) (433) – – – (168) (168) (441) 585 2,381 38 2,563 757 378 10 (654) 491 Refining and Marketing Impairment and gain (loss) on sale of businesses and fixed assetsa 563 112 – 51 726 (179) 767 105 (728) (35) Environmental and other provisions – – (33) – (33) – – (138) – (138) Restructuring, integration and rationalization costs – – – – – – – – (118) (118) Fair value gain (loss) on embedded derivatives – – – – – – – – – – Other – (76) (400) (104) (580) (50) – (311) (300) (661) 563 36 (433) (53) 113 (229) 767 (344) (1,146) (952) Other businesses and corporate Impairment and gain (loss) on sale of businesses and fixed assets 2 21 (8) 14 29 31 (15) (7) (23) (14) Environmental and other provisions – – 96 (2) 94 – – (35) – (35) Restructuring, integration and rationalization costs – – – – – – – – (34) (34) Fair value gain (loss) on embedded derivatives 8 5 (8) – 5 3 7 (7) (10) (7) Other – – – (200) (200) – – (152) (20) (172) 10 26 80 (188) (72) 34 (8) (201) (87) (262) Gulf of Mexico oil spill response – – – – – – – – – – Total before interest and taxation for continuing operations 132 647 2,028 (203) 2,604 562 1,137 (535) (1,887) (723) Finance costsb – – – – – – – – – – Total before taxation for continuing operations 132 647 2,028 (203) 2,604 562 1,137 (535) (1,887) (723) Taxation credit (charge)c (44) (232) (840) 64 1,052 (192) (347) 174 715 350 Total after taxation for continuing operations 88 415 1,188 (139) 1,552 370 790 (361) (1,172) (373) Innovene operations (96) (88) – – (184) – – – – – Total before taxation for Innovene operationsd (96) (88) – – (184) – – – – – Taxation credit (charge) (7) – – – (7) – – – – – Total after taxation for Innovene operations (103) (88) – – (191) – – – – – Total after taxation (15) 327 1,188 (139) 1,361 370 790 (361) (1,172) (373)
a Includes the impairment of goodwill allocated to the US West Coast fuels value chain of $1,579 million in the fourth quarter of 2009. b Third and fourth quarter 2010 finance costs relate to the Gulf of Mexico oil spill. For more information see page 18. cTaxation is calculated using the quarter’s effective tax rate (excluding the impact of the Gulf of Mexico oil spill) on replacement cost profit or loss. However, the US statutory tax rate has been used for expenditures relating to the Gulf of Mexico oil spill that qualify for tax relief. For the fourth quarter and full year in 2009, no tax credit was calculated on the goodwill impairment in Refining and Marketing because the charge is not tax deductible. d Includes the loss on remeasurement to fair value of $184 million in 2006, recognized as an $88-million loss in the second quarter of 2006 and a $96-million loss in the first quarter of 2006. e As reported in Annual Report on Form 20-F. There was a $500 million ($315 million post tax) timing difference between the profit reported under IFRS in the Annual Report and Accounts and the profit reported under IFRS in BP Annual Report on Form 20-F 2006. For further information see BP Annual Report and Accounts 2006.
BP Financial and Operating Information 2006 - 2010 13

Group information
Non-operating items by geographical area
Q1 Q2e Q3 Q4 2006e Q1 Q2 Q3 Q4 2007
Exploration and Production US 2 8 2,021 (269) 1,762 (7) 178 (15) 213 369 Non-US (443) 577 360 307 801 764 200 25 (867) 122 (441) 585 2,381 38 2,563 757 378 10 (654) 491 Refining and Marketing USa 96 54 (266) 25 (91) (58) 170 (316) (977) (1,181) Non-US 467 (18) (167) (78) 204 (171) 597 (28) (169) 229 563 36 (433) (53) 113 (229) 767 (344) (1,146) (952) Other businesses and corporate US 9 10 107 (199) (73) 6 7 (195) (57) (239) Non-US 1 16 (27) 11 1 28 (15) (6) (30) (23) 10 26 80 (188) (72) 34 (8) (201) (87) (262) Gulf of Mexico oil spill response – – – – – – – – – – Total before interest and taxation for continuing operations 132 647 2,028 (203) 2,604 562 1,137 (535) (1,887) (723) Finance costsb – – – – – – – – – – Total before taxation for continuing operations 132 647 2,028 (203) 2,604 562 1,137 (535) (1,887) (723) Taxation credit (charge)c (44) (232) (840) 64 (1,052) (192) (347) 174 715 350 Total after taxation for continuing operations 88 415 1,188 (139) 1,552 370 790 (361) (1,172) (373) Innovene operations US 7 (6) – 15 16 – – – – – Non-US (103) (82) – (15) (200) – – – – – Total before taxation for Innovene operationsd (96) (88) – – (184) – – – – – Taxation credit (charge) (7) – – – (7) – – – – – Total after taxation for Innovene operations (103) (88) – – (191) – – – – – Total after taxation (15) 327 1,188 (139) 1,361 370 790 (361) (1,172) (373)
a Includes the impairment of goodwill allocated to the US West Coast fuels value chain of $1,579 million in the fourth quarter of 2009.b T hird and fourth quarter 2010 finance costs relate to the Gulf of Mexico oil spill. For more information see page 18.c T axation is calculated using the quarter’s effective tax rate (excluding the impact of the Gulf of Mexico oil spill) on replacement cost profit or loss. However, the US statutory tax rate has been used for expenditures relating to the Gulf of Mexico oil spill that qualify for tax relief. For the fourth quarter and full year in 2009, no tax credit was calculated on the goodwill impairment in Refining and Marketing because the charge is not tax deductible.
d Includes the loss on remeasurement to f air value of $184 million in 2006, recognized as an $88-million loss in the second quarter of 2006 and a $96-million loss in the first quarter of 2006.e As reported in Annual Report on Form 20-F. There was a $500 million ($315 million post tax) timing difference between the profit reported under IFRS in the Annual Report and Accounts and the profit reported under IFRS in BP Annual Report on Form 20-F 2006. For further information see BP Annual Report and Accounts 2006.
Non-operating items by geographical area continued$ million
Q1 Q2 Q3 Q4 2008 Q1 Q2 Q3 Q4 2009 Q1 Q2 Q3 Q4 2010
(8) (8) 3 (318) (331) 71 118 (65) 21 145 (62) (156) 1,681 (273) 1,190(368) (1,968) 1,115 562 (659) 240 389 536 955 2,120 103 217 60 1,629 2,009
(376) (1,976) 1,118 244 (990) 311 507 471 976 2,265 41 61 1,741 1,356 3,199
774 (16) 13 43 814 (134) (27) (179) (1,697) (2,037) (3) 151 216 (12) 352(165) (83) (13) (206) (467) (216) (139) (62) (149) (566) (67) 81 166 98 278
609 (99) – (163) 347 (350) (166) (241) (1,846) (2,603) (70) 232 382 86 630
(49) (33) (105) (115) (302) (116) (33) (29) 14 (164) (106) (7) (71) (54) (238)(32) (90) (23) (186) (331) (205) (6) (35) (79) (325) (12) 78 (15) (13) 38
(81) (123) (128) (301) (633) (321) (39) (64) (65) (489) (118) 71 (86) (67) (200)
– – – – – – – – – – – (32,192) (7,656) (1,010) (40,858)
152 (2,198) 990 (220) (1,276) (360) 302 166 (935) (827) (147) (31,828) (5,619) 365 (37,229)– – – – – – – – – – – – (47) (30) (77)
152 (2,198) 990 (220) (1,276) (360) 302 166 (935) (827) (147) (31,828) (5,666) 335 (37,306)(56) 770 (331) 97 480 135 (106) (48) (221) (240) 50 9,877 2,097 (167) 11,587
96 (1,428) 659 (123) (796) (225) 196 118 (1,156) (1,067) (97) (21,951) (3,569) 168 (25,449)
– – – – – – – – – – – – – – –– – – – – – – – – – – – – – –
– – – – – – – – – – – – – – –– – – – – – – – – – – – – – –
– – – – – – – – – – – – – – –
96 (1,428) 659 (123) (796) (225) 196 118 (1,156) (1,067) (97) (21,951) (3,569) 168 (25,449)
BP Financial and Operating Information 2006 - 2010 14

Group information
Non-operating items by geographical area Non-operating items by geographical area continued$ million
Q1 Q2 Q3 Q4 2008 Q1 Q2 Q3 Q4 2009 Q1 Q2 Q3 Q4 2010
(8) (8) 3 (318) (331) 71 118 (65) 21 145 (62) (156) 1,681 (273) 1,190(368) (1,968) 1,115 562 (659) 240 389 536 955 2,120 103 217 60 1,629 2,009
(376) (1,976) 1,118 244 (990) 311 507 471 976 2,265 41 61 1,741 1,356 3,199
774 (16) 13 43 814 (134) (27) (179) (1,697) (2,037) (3) 151 216 (12) 352(165) (83) (13) (206) (467) (216) (139) (62) (149) (566) (67) 81 166 98 278
609 (99) – (163) 347 (350) (166) (241) (1,846) (2,603) (70) 232 382 86 630
(49) (33) (105) (115) (302) (116) (33) (29) 14 (164) (106) (7) (71) (54) (238)(32) (90) (23) (186) (331) (205) (6) (35) (79) (325) (12) 78 (15) (13) 38
(81) (123) (128) (301) (633) (321) (39) (64) (65) (489) (118) 71 (86) (67) (200)
– – – – – – – – – – – (32,192) (7,656) (1,010) (40,858)
152 (2,198) 990 (220) (1,276) (360) 302 166 (935) (827) (147) (31,828) (5,619) 365 (37,229)– – – – – – – – – – – – (47) (30) (77)
152 (2,198) 990 (220) (1,276) (360) 302 166 (935) (827) (147) (31,828) (5,666) 335 (37,306)(56) 770 (331) 97 480 135 (106) (48) (221) (240) 50 9,877 2,097 (167) 11,587
96 (1,428) 659 (123) (796) (225) 196 118 (1,156) (1,067) (97) (21,951) (3,569) 168 (25,449)
– – – – – – – – – – – – – – –– – – – – – – – – – – – – – –
– – – – – – – – – – – – – – –– – – – – – – – – – – – – – –
– – – – – – – – – – – – – – –
96 (1,428) 659 (123) (796) (225) 196 118 (1,156) (1,067) (97) (21,951) (3,569) 168 (25,449)
Q1 Q2e Q3 Q4 2006e Q1 Q2 Q3 Q4 2007
Exploration and Production US 2 8 2,021 (269) 1,762 (7) 178 (15) 213 369 Non-US (443) 577 360 307 801 764 200 25 (867) 122 (441) 585 2,381 38 2,563 757 378 10 (654) 491 Refining and Marketing USa 96 54 (266) 25 (91) (58) 170 (316) (977) (1,181) Non-US 467 (18) (167) (78) 204 (171) 597 (28) (169) 229 563 36 (433) (53) 113 (229) 767 (344) (1,146) (952) Other businesses and corporate US 9 10 107 (199) (73) 6 7 (195) (57) (239) Non-US 1 16 (27) 11 1 28 (15) (6) (30) (23) 10 26 80 (188) (72) 34 (8) (201) (87) (262) Gulf of Mexico oil spill response – – – – – – – – – – Total before interest and taxation for continuing operations 132 647 2,028 (203) 2,604 562 1,137 (535) (1,887) (723) Finance costsb – – – – – – – – – – Total before taxation for continuing operations 132 647 2,028 (203) 2,604 562 1,137 (535) (1,887) (723) Taxation credit (charge)c (44) (232) (840) 64 (1,052) (192) (347) 174 715 350 Total after taxation for continuing operations 88 415 1,188 (139) 1,552 370 790 (361) (1,172) (373) Innovene operations US 7 (6) – 15 16 – – – – – Non-US (103) (82) – (15) (200) – – – – – Total before taxation for Innovene operationsd (96) (88) – – (184) – – – – – Taxation credit (charge) (7) – – – (7) – – – – – Total after taxation for Innovene operations (103) (88) – – (191) – – – – – Total after taxation (15) 327 1,188 (139) 1,361 370 790 (361) (1,172) (373)
a Includes the impairment of goodwill allocated to the US West Coast fuels value chain of $1,579 million in the fourth quarter of 2009. b Third and fourth quarter 2010 finance costs relate to the Gulf of Mexico oil spill. For more information see page 18. c Taxation is calculated using the quarter’s effective tax rate (excluding the impact of the Gulf of Mexico oil spill) on replacement cost profit or loss. However, the US statutory tax rate has been used for expenditures relating to the Gulf of Mexico oil spill that qualify for tax relief. For the fourth quarter and full year in 2009, no tax credit was calculated on the goodwill impairment in Refining and Marketing because the charge is not tax deductible. d Includes the loss on remeasurement to fair value of $184 million in 2006, recognized as an $88-million loss in the second quarter of 2006 and a $96-million loss in the first quarter of 2006. e As reported in Annual Report on Form 20-F. There was a $500 million ($315 million post tax) timing difference between the profit reported under IFRS in the Annual Report and Accounts and the profit reported under IFRS in BP Annual Report on Form 20-F 2006. For further information see BP Annual Report and Accounts 2006.
BP Financial and Operating Information 2006 - 2010 15

Group information
Fair value accounting effectsBP uses derivative instruments to manage the economic exposure relating to inventories above normal operating requirements of crude oil, natural gas and petroleum products as well as certain contracts to supply physical volumes at future dates. Under IFRS, these inventories and contracts are recorded at historic cost and on an accruals basis respectively. The related derivative instruments, however, are required to be recorded at fair value with gains and losses recognized in income because hedge accounting is either not permitted or not followed, principally due to the impracticality of effectiveness testing requirements. Therefore, measurement differences in relation to recognition of gains and losses occur. Gains and losses on these inventories and contracts are not recognized until the commodity is sold in a subsequent accounting period. Gains and losses on the related derivative commodity contracts are recognized in the income statement from the time the derivative commodity contract is entered into on a fair value basis using forward prices consistent with the contract maturity.
IFRS requires that inventory held for trading be recorded at its fair value using period end spot prices whereas any related derivative commodity instruments are required to be recorded at values based on forward prices consistent with the contract maturity. Depending on market conditions, these forward prices can be either higher or lower than spot prices resulting in measurement differences.
$ million
Q1 Q2 Q3 Q4 2006 Q1 Q2 Q3 Q4 2007
By businessExploration and Production (103) (150) (23) 244 (32) 31 (74) (36) 127 48 Refining and Marketing (123) 74 584 (324) 211 (539) 337 (93) (62) (357) (226) (76) 561 (80) 179 (508) 263 (129) 65 (309) Taxation credit (charge)a 76 24 (232) 25 (107) 174 (80) 42 (25) 111 (150) (52) 329 (55) 72 (334) 183 (87) 40 (198)
By geographical areaExploration and Production US (117) (147) 14 191 (59) (6) (71) (19) 19 (77) Non-US 14 (3) (37) 53 27 37 (3) (17) 108 125 (103) (150) (23) 244 (32) 31 (74) (36) 127 48 Refining and Marketing US (97) 26 315 (231) 13 (165) 174 (142) (32) (165) Non-US (26) 48 269 (93) 198 (374) 163 49 (30) (192)
(123) 74 584 (324) 211 (539) 337 (93) (62) (357) a T axation is calculated using the quarter’s effective tax rate (excluding the impact of the Gulf of Mexico oil spill) on replacement cost profit or loss.
Q1 Q2 Q3 Q4 2008 Q1 Q2 Q3 Q4 2009 Q1 Q2 Q3 Q4 2010
(259) (373) 97 253 (282) 158 135 180 446 919 63 (122) 68 (12) (3)101 (161) 636 (65) 511 (109) (126) 86 (112) (261) 10 119 (221) 134 42
(158) (534) 733 188 229 49 9 266 334 658 73 (3) (153) 122 3958 187 (245) (83) (83) (18) (3) (77) (115) (213) (25) 1 38 (40) (26)
(100) (347) 488 105 146 31 6 189 219 445 48 (2) (115) 82 13
(142) (236) 136 11 (231) 208 92 169 218 687 81 (35) 86 9 141(117) (137) (39) 242 (51) (50) 43 11 228 232 (18) (87) (18) (21) (144)
(259) (373) 97 253 (282) 158 135 180 446 919 63 (122) 68 (12) (3)
95 53 174 (91) 231 65 (46) 6 (9) 16 16 37 (61) 27 196 (214) 462 26 280 (174) (80) 80 (103) (277) (6) 82 (160) 107 23
101 (161) 636 (65) 511 (109) (126) 86 (112) (261) 10 119 (221) 134 42
Total of non-operating items and fair value accounting effects Total of non-operating items and fair value accounting effects continued $ million
Q1 Q2c Q3 Q4 2006c Q1 Q2 Q3 Q4 2007
Exploration and Production US (115) (139) 2,035 (78) 1,703 (13) 107 (34) 232 292 Non-US (429) 574 323 360 828 801 197 8 (759) 247 (544) 435 2,358 282 2,531 788 304 (26) (527) 539 Refining and Marketing US (1) 80 49 (206) (78) (223) 344 (458) (1,009) (1,346) Non-US 441 30 102 (171) 402 (545) 760 21 (199) 37 440 110 151 (377) 324 (768) 1,104 (437) (1,208) (1,309) Other businesses and corporate US 9 10 107 (199) (73) 6 7 (195) (57) (239) Non-US 1 16 (27) 11 1 28 (15) (6) (30) (23) 10 26 80 (188) (72) 34 (8) (201) (87) (262) Gulf of Mexico oil spill response – – – – – – – – – – Total before interest and taxation (94) 571 2,589 (283) 2,783 54 1,400 (664) (1,822) (1,032) Finance costsa – – – – – – – – – – Total before taxation for continuing operations (94) 571 2,589 (283) 2,783 54 1,400 (664) (1,822) (1,032) Taxation credit (charge)b 32 (208) (1,072) 89 (1,159) (18) (427) 216 690 461 Total after taxation for continuing operations (62) 363 1,517 (194) 1,624 36 973 (448) (1,132) (571) Innovene operations US 7 (6) – 15 16 – – – – – Non-US (103) (82) – (15) (200) – – – – – Total before taxation for Innovene operations (96) (88) – – (184) – – – – – Taxation charge (7) – – – (7) – – – – – Total after taxation for Innovene operations (103) (88) – – (191) – – – – – T 1,433 otal after taxation for period (165) 275 1,517 (194) 36 973 (448) (1,132) (571)
a 2010 finance costs relate to the Gulf of Me xico oil spill. For more information see page 18.b T axation is calculated using the quarter’s effective tax rate (excluding the impact of the Gulf of Mexico oil spill) on replacement cost profit or loss. However, the US statutory tax rate has been used for expenditures relating to the Gulf of Mexico oil spill that qualify for tax relief. For the fourth quarter and year in 2009, no tax credit was calculated on the goodwill impairment in Refining and Marketing because the charge is not tax deductable.
c As reported in Annual Report on Form 20-F. There was a $500 million ($315 million post tax) timing difference between the profit reported under IFRS in the Annual Report and Accounts and the profit reported under IFRS in BP Annual Report on Form 20-F 2006. For further information see BP Annual Report and Accounts 2006.
Q1 Q2 Q3 Q4 2008 Q1 Q2 Q3 Q4 2009 Q1 Q2 Q3 Q4 2010
(150) (244) 139 (307) (562) 279 210 104 239 832 19 (191) 1,767 (264) 1,331(485) (2,105) 1,076 804 (710) 190 432 547 1,183 2,352 85 130 42 1,608 1,865
(635) (2,349) 1,215 497 (1,272) 469 642 651 1,422 3,184 104 (61) 1,809 1,344 3,196
869 37 187 (48) 1,045 (69) (73) (173) (1,706) (2,021) 13 188 155 15 371(159) (297) 449 (180) (187) (390) (219) 18 (252) (843) (73) 163 6 205 301
710 (260) 636 (228) 858 (459) (292) (155) (1,958) (2,864) (60) 351 161 220 672
(49) (33) (105) (115) (302) (116) (33) (29) 14 (164) (106) (7) (71) (54) (238)(32) (90) (23) (186) (331) (205) (6) (35) (79) (325) (12) 78 (15) (13) 38
(81) (123) (128) (301) (633) (321) (39) (64) (65) (489) (118) 71 (86) (67) (200)
– – – – – – – – – – – (32,192) (7,656) (1,010) (40,858)(6) (2,732) 1,723 (32) (1,047) (311) 311 432 (601) (169) (74) (31,831) (5,772) 487 (37,190)– – – – – – – – – – – – (47) (30) (77)
(6) (2,732) 1,723 (32) (1,047) (311) 311 432 (601) (169) (74) (31,831) (5,819) 457 (37,267)2 957 (576) 14 397 117 (109) (125) (336) (453) 25 9,878 2,135 (207) 11,831
(4) (1,775) 1,147 (18) (650) (194) 202 307 (937) (622) (49) (21,953) (3,684) 250 (25,436)
– – – – – – – – – – – – – – –– – – – – – – – – – – – – – –– – – – – – – – – – – – – – –– – – – – – – – – – – – – – –
– – – – – – – – – – – – – – –
(4) (1,775) 1,147 (18) (650) (194) 202 307 (937) (622) (49) (21,953) (3,684) 250 (25,436)
BP Financial and Operating Information 2006 - 2010 16

Group information
Fair value accounting effects Fair value accounting effects continuedBP enters into contracts for pipelines which and storage capacity that, under IFRS, are recorded on an accruals basis. These contracts are risk-managed using a variety of derivative instruments, are fair valued under IFRS. This results in measurement differences in relation to recognition of gains and losses.
The way that BP manages the economic exposures described above, and measures performance internally, differs from the way these activities are measured under IFRS. BP calculates this difference for consolidated entities by comparing the IFRS result with management’s internal measure of performance, under which the inventory and the supply and capacity contracts in question are valued based on fair value using relevant forward prices prevailing at the end of the period. We believe that disclosing management’s estimate of this difference provides useful information for investors because it enables investors to see the economic effect of these activities as a whole. The impacts of fair value accounting effects, relative to management’s internal measure of performance, are shown in the table below.
$ million
Q1 Q2 Q3 Q4 2008 Q1 Q2 Q3 Q4 2009 Q1 Q2 Q3 Q4 2010
(259) (373) 97 253 (282) 158 135 180 446 919 63 (122) 68 (12) (3)101 (161) 636 (65) 511 (109) (126) 86 (112) (261) 10 119 (221) 134 42
(158) (534) 733 188 229 49 9 266 334 658 73 (3) (153) 122 3958 187 (245) (83) (83) (18) (3) (77) (115) (213) (25) 1 38 (40) (26)
(100) (347) 488 105 146 31 6 189 219 445 48 (2) (115) 82 13
(142) (236) 136 11 (231) 208 92 169 218 687 81 (35) 86 9 141(117) (137) (39) 242 (51) (50) 43 11 228 232 (18) (87) (18) (21) (144)
(259) (373) 97 253 (282) 158 135 180 446 919 63 (122) 68 (12) (3)
95 53 174 (91) 231 65 (46) 6 (9) 16 16 37 (61) 27 196 (214) 462 26 280 (174) (80) 80 (103) (277) (6) 82 (160) 107 23
101 (161) 636 (65) 511 (109) (126) 86 (112) (261) 10 119 (221) 134 42
Q1 Q2 Q3 Q4 2006 Q1 Q2 Q3 Q4 2007
By businessExploration and Production (103) (150) (23) 244 (32) 31 (74) (36) 127 48 Refining and Marketing (123) 74 584 (324) 211 (539) 337 (93) (62) (357) (226) (76) 561 (80) 179 (508) 263 (129) 65 (309) Taxation credit (charge)a 76 24 (232) 25 (107) 174 (80) 42 (25) 111 (150) (52) 329 (55) 72 (334) 183 (87) 40 (198)
By geographical areaExploration and Production US (117) (147) 14 191 (59) (6) (71) (19) 19 (77) Non-US 14 (3) (37) 53 27 37 (3) (17) 108 125 (103) (150) (23) 244 (32) 31 (74) (36) 127 48 Refining and Marketing US (97) 26 315 (231) 13 (165) 174 (142) (32) (165) Non-US (26) 48 269 (93) 198 (374) 163 49 (30) (192) (123) 74 584 (324) 211 (539) 337 (93) (62) (357)
a Taxation is calculated using the quarter’s effective tax rate (excluding the impact of the Gulf of Mexico oil spill) on replacement cost profit or loss.
Total of non-operating items and fair value accounting effects Total of non-operating items and fair value accounting effects continued $ million
Q1 Q2 Q3 Q4 2008 Q1 Q2 Q3 Q4 2009 Q1 Q2 Q3 Q4 2010
(150) (244) 139 (307) (562) 279 210 104 239 832 19 (191) 1,767 (264) 1,331(485) (2,105) 1,076 804 (710) 190 432 547 1,183 2,352 85 130 42 1,608 1,865
(635) (2,349) 1,215 497 (1,272) 469 642 651 1,422 3,184 104 (61) 1,809 1,344 3,196
869 37 187 (48) 1,045 (69) (73) (173) (1,706) (2,021) 13 188 155 15 371(159) (297) 449 (180) (187) (390) (219) 18 (252) (843) (73) 163 6 205 301
710 (260) 636 (228) 858 (459) (292) (155) (1,958) (2,864) (60) 351 161 220 672
(49) (33) (105) (115) (302) (116) (33) (29) 14 (164) (106) (7) (71) (54) (238)(32) (90) (23) (186) (331) (205) (6) (35) (79) (325) (12) 78 (15) (13) 38
(81) (123) (128) (301) (633) (321) (39) (64) (65) (489) (118) 71 (86) (67) (200)
– – – – – – – – – – – (32,192) (7,656) (1,010) (40,858)(6) (2,732) 1,723 (32) (1,047) (311) 311 432 (601) (169) (74) (31,831) (5,772) 487 (37,190)– – – – – – – – – – – – (47) (30) (77)
(6) (2,732) 1,723 (32) (1,047) (311) 311 432 (601) (169) (74) (31,831) (5,819) 457 (37,267)2 957 (576) 14 397 117 (109) (125) (336) (453) 25 9,878 2,135 (207) 11,831
(4) (1,775) 1,147 (18) (650) (194) 202 307 (937) (622) (49) (21,953) (3,684) 250 (25,436)
– – – – – – – – – – – – – – –– – – – – – – – – – – – – – –– – – – – – – – – – – – – – –– – – – – – – – – – – – – – –
– – – – – – – – – – – – – – –
(4) (1,775) 1,147 (18) (650) (194) 202 307 (937) (622) (49) (21,953) (3,684) 250 (25,436)
Q1 Q2c Q3 Q4 2006c Q1 Q2 Q3 Q4 2007
Exploration and Production US (115) (139) 2,035 (78) 1,703 (13) 107 (34) 232 292 Non-US (429) 574 323 360 828 801 197 8 (759) 247 (544) 435 2,358 282 2,531 788 304 (26) (527) 539 Refining and Marketing US (1) 80 49 (206) (78) (223) 344 (458) (1,009) (1,346) Non-US 441 30 102 (171) 402 (545) 760 21 (199) 37 440 110 151 (377) 324 (768) 1,104 (437) (1,208) (1,309) Other businesses and corporate US 9 10 107 (199) (73) 6 7 (195) (57) (239) Non-US 1 16 (27) 11 1 28 (15) (6) (30) (23) 10 26 80 (188) (72) 34 (8) (201) (87) (262) Gulf of Mexico oil spill response – – – – – – – – – – Total before interest and taxation (94) 571 2,589 (283) 2,783 54 1,400 (664) (1,822) (1,032) Finance costsa – – – – – – – – – – Total before taxation for continuing operations (94) 571 2,589 (283) 2,783 54 1,400 (664) (1,822) (1,032) Taxation credit (charge)b 32 (208) (1,072) 89 (1,159) (18) (427) 216 690 461 Total after taxation for continuing operations (62) 363 1,517 (194) 1,624 36 973 (448) (1,132) (571) Innovene operations US 7 (6) – 15 16 – – – – – Non-US (103) (82) – (15) (200) – – – – – Total before taxation for Innovene operations (96) (88) – – (184) – – – – – Taxation charge (7) – – – (7) – – – – – Total after taxation for Innovene operations (103) (88) – – (191) – – – – – Total after taxation for period (165) 275 1,517 (194) 1,433 36 973 (448) (1,132) (571)
a 2010 finance costs relate to the Gulf of Mexico oil spill. For more information see page 18. b Taxation is calculated using the quarter’s effective tax rate (excluding the impact of the Gulf of Mexico oil spill) on replacement cost profit or loss. However, the US statutory tax rate has been used for expenditures relating to the Gulf of Mexico oil spill that qualify for tax relief. For the fourth quarter and year in 2009, no tax credit was calculated on the goodwill impairment in Refining and Marketing because the charge is not tax deductable. c As reported in Annual Report on Form 20-F. There was a $500 million ($315 million post tax) timing difference between the profit reported under IFRS in the Annual Report and Accounts and the profit reported under IFRS in BP Annual Report on Form 20-F 2006. For further information see BP Annual Report and Accounts 2006.
BP Financial and Operating Information 2006 - 2010 17

Group information
Gulf of Mexico oil spill $ million
Q1 Q2 Q3 Q4 2010
Income statementProduction and manufacturing expenses – 32,192 7,656 1,010 40,858
Profit (loss) before interest and taxation – (32,192) (7,656) (1,010) (40,858)Finance costs – – 47 30 77
Profit (loss) before taxation – (32,192) (7,703) (1,040) (40,935)Less: taxation – 10,003 2,604 287 12,894
Profit (loss) for the period – (22,189) (5,099) (753) (28,041)
Balance sheetCurrent assets Trade and other receivables 5,943Current liabilities Trade and other payables (6,587) Provisions (7,938)
Net current liabilities (8,582)
Non-current assets Other receivables 3,601Non-current liabilities Other payables (9,899) Provisions (8,397) Deferred tax 11,255
Net non-current liabilities (3,440)
Net assets (12,022)
Cash flow statementProfit (loss) before taxation – (32,192) (7,703) (1,040) (40,935)Finance costs – – 47 30 77Net charge for provisions, less payments – 17,646 (409) 2,117 19,354Movements in other current and non-current assets and liabilities – 12,430 (2,042) (6,542) 3,846
Pre-tax cash flows – (2,116) (10,107) (5,435) (17,658)
BP Financial and Operating Information 2006 - 2010 18

Group information
Sales and other operating revenues $ million
2006 2007 2008 2009 2010
By businessExploration and Production 67,950 65,740 86,170 57,626 66,266Refining and Marketing 232,386 250,221 320,039 213,050 266,751Other businesses and corporate 3,372 3,698 4,634 2,843 3,328
303,708 319,659 410,843 273,519 336,345
Less: sales between businesses Exploration and Production 32,608 32,083 45,931 32,540 37,049 Refining and Marketing 3,935 1,914 1,918 821 1,358 Other businesses and corporate 1,259 1,297 1,851 886 831
37,802 35,294 49,700 34,247 39,238
Third party sales and other operating revenues Exploration and Production 35,342 33,657 40,239 25,086 29,217 Refining and Marketing 228,451 248,307 318,121 212,229 265,393 Other businesses and corporate 2,113 2,401 2,783 1,957 2,497
Total third party sales and other operating revenues 265,906 284,365 361,143 239,272 297,107
By geographical areaUS 99,935 105,120 130,142 87,283 107,256Non-US 185,079 201,816 267,246 173,822 220,059
285,014 306,936 397,388 261,105 327,315Less: sales between areas 19,108 22,571 36,245 21,833 30,208
265,906 284,365 361,143 239,272 297,107
BP Financial and Operating Information 2006 - 2010 19

Group information
Production and similar taxes $ million
2006 2007 2008 2009 2010
Production and similar taxes provided for US 887 1,260 2,602 649 1,093 Non-US 4,297 4,443 6,351 3,103 4,151
5,184 5,703 8,953 3,752 5,244
Production and similar taxes paid US 565 1,302 2,735 766 1,059 Non-US 4,937 4,545 6,681 3,219 4,402
5,502 5,847 9,416 3,985 5,461
Taxation $ million
2006a 2007 2008 2009 2010
Tax on profit (loss) from continuing operationsCurrent tax charge 11,800 9,835 13,383 5,745 6,692Deferred tax charge (credit) 716 607 (766) 2,620 (8,193)
Total tax on profit (loss) from continuing operations 12,516 10,442 12,617 8,365 (1,501)
Tax on inventory holdings (gains) losses 31 (1,083) 2,052 (1,299) (589)
Tax on replacement cost profit (loss) from continuing operations 12,547 9,359 14,669 7,066 (2,090)
Effective tax rates on Replacement cost profit (loss) for the year 35% 33% 36% 33% 32% Profit (loss) for the year 36% 33% 37% 33% 31%
Income taxes paid 13,733 9,072 12,824 6,324 6,610
a As reported in Annual Report on Form 20-F. There was a $500 million ($315 million post tax) timing difference between the profit reported under IFRS in the Annual Report and Accounts and the profit reported under IFRS in BP Annual Report on Form 20-F 2006. For further information see BP Annual Report and Accounts 2006.
BP Financial and Operating Information 2006 - 2010 20

Group information
Depreciation, depletion and amortization $ million
2006 2007 2008 2009 2010
By businessExploration and Productiona
US 2,336 2,365 3,012 4,150 3,751 Non-US 4,353 5,491 5,428 5,407 4,865
6,689 7,856 8,440 9,557 8,616
Refining and Marketing US 1,047 1,076 825 919 955 Non-US 1,192 1,345 1,383 1,317 1,303
2,239 2,421 2,208 2,236 2,258
Other businesses and corporate US 76 117 132 136 140 Non-US 124 185 205 177 150
200 302 337 313 290
By geographical areaUS 3,459 3,558 3,969 5,205 4,846Non-US 5,669 7,021 7,016 6,901 6,318
Total 9,128 10,579 10,985 12,106 11,164
a At the end of 2006, BP adopted the Securities and Ex change Commission (SEC) rules for estimating oil and natural gas reserves instead of the UK accounting rules contained in the Statement of Recommended Practice ‘Accounting for Oil and Gas Exploration, Development, Production and Decommissioning Activities’ (UK SORP). This change in accounting estimate had a direct impact on the amount of depreciation, depletion and amortization (DD&A) charged in the income statement in respect of oil and natural gas properties, which are depreciated on a unit-of-production basis. The change in estimate was applied prospectively, with no restatement of prior periods’ results. The group’s actual DD&A charge for 2006 was $9,128 million, whereas the charge based on UK SORP reserves would have been $9,057 million, i.e. an increase of $71 million due to the change in reserves estimates that was used to calculate DD&A for the last three months of 2006. For 2007, it was estimated that the DD&A charge would increase by approximately $400 million to $500 million as a result of the change. No estimate was made in respect of 2008. Over the life of a field this change would haveno overall effect on DD&A. The main differences between the UK SORP and SEC rules then applicable related to the SEC requirement to use year-end prices and costs, the application of SECinterpretations of SEC regulations relating to the use of technology (mainly seismic) to estimate reserves in the reservoir away from wellbores and the reporting of fuel gas (i.e. gas used for fuel inoperations) within proved reserves. Consequently, reserves quantities under SEC rules differed from those that would be reported under application of the UK SORP. The change to SEC reservesin 2006 represented a simplification of the group’s reserves reporting, as only one set of reserves estimates is now disclosed. In addition, the use of SEC reserves for accounting purposes makesour results more comparable with those of our major competitors.
BP Financial and Operating Information 2006 - 2010 21

Group information
Group balance sheetAt 31 December $ million
2006 2007 2008 2009 2010
Non-current assets Property, plant and equipment 90,999 97,989 103,200 108,275 110,163 Goodwill 10,780 11,006 9,878 8,620 8,598 Intangible assets 5,246 6,652 10,260 11,548 14,298 Investments in jointly controlled entities 15,074 18,113 23,826 15,296 12,286 Investments in associates 5,975 4,579 4,000 12,963 13,335 Other investments 1,697 1,830 855 1,567 1,191
Fixed assets 129,771 140,169 152,019 158,269 159,871 Loans 817 999 995 1,039 894 Other receivables 862 968 710 1,729 6,298 Derivative financial instruments 3,025 3,741 5,054 3,965 4,210 Prepayments 1,034 1,083 1,338 1,407 1,432 Deferred tax assets – – – 516 528 Defined benefit pension plan surpluses 6,753 8,914 1,738 1,390 2,176
142,262 155,874 161,854 168,315 175,409
Current assets Loans 141 165 168 249 247 Inventories 18,915 26,554 16,821 22,605 26,218 Trade and other receivables 38,692 38,020 29,261 29,531 36,549 Derivative financial instruments 10,373 6,321 8,510 4,967 4,356 Prepayments 3,006 3,589 3,050 1,753 1,574 Current tax receivable 544 705 377 209 693 Other investments – – – – 1,532 Cash and cash equivalents 2,590 3,562 8,197 8,339 18,556
74,261 78,916 66,384 67,653 89,725Assets classified as held for sale 1,078 1,286 – – 7,128
75,339 80,202 66,384 67,653 96,853
Total assets 217,601 236,076 228,238 235,968 272,262
Current liabilities Trade and other payables 42,236 43,152 33,644 35,204 46,329 Derivative financial instruments 9,424 6,405 8,977 4,681 3,856 Accruals 6,147 6,640 6,743 6,202 5,612 Finance debt 12,924 15,394 15,740 9,109 14,626 Current tax payable 2,635 3,282 3,144 2,464 2,920 Provisions 1,932 2,195 1,545 1,660 9,489
75,298 77,068 69,793 59,320 82,832Liabilities directly associated with the assets classified as held f or sale 54 163 – – 1,047
75,352 77,231 69,793 59,320 83,879
Non-current liabilities Other payables 1,430 1,251 3,080 3,198 14,285 Derivative financial instruments 4,203 5,002 6,271 3,474 3,677 Accruals 961 959 784 703 637 Finance debt 11,086 15,651 17,464 25,518 30,710 Deferred tax liabilities 18,116 19,215 16,198 18,662 10,908 Provisions 11,712 12,900 12,108 12,970 22,418 Defined benefit pension plan and other post-retirement benefit plan deficits 9,276 9,215 10,431 10,010 9,857
56,784 64,193 66,336 74,535 92,492
Total liabilities 132,136 141,424 136,129 133,855 176,371
Net assets 85,465 94,652 92,109 102,113 95,891
Equity Share capital 5,385 5,237 5,176 5,179 5,183 Reserves 79,239 88,453 86,127 96,434 89,804
BP shareholders’ equity 84,624 93,690 91,303 101,613 94,987Minority interest 841 962 806 500 904
Total equity 85,465 94,652 92,109 102,113 95,891
BP Financial and Operating Information 2006 - 2010 22

Group information
Operating capital employeda
$ million
2006 2007 2008 2009 2010
By businessExploration and Production US 27,687 30,341 35,807 39,209 40,065 Non-US 49,601 54,278 56,950 61,945 66,207
77,288 84,619 92,757 101,154 106,272
Refining and Marketing US 16,527 17,748 15,904 20,114 23,463 Non-US 24,611 30,163 25,295 26,387 24,959
41,138 47,911 41,199 46,501 48,422
Other businesses and corporate US (3,303) (1,903) (2,505) (2,773) (2,905) Non-US 4,504 6,785 3,247 4,655 17,285
1,201 4,882 742 1,882 14,380
Gulf of Mexico oil spill response – – – – (23,277)Consolidation adjustment (725) (929) (298) (1,016) (561)
118,902 136,483 134,400 148,521 145,236
By geographical areaUS 40,234 45,369 49,056 55,826 36,917Non-US 78,668 91,114 85,344 92,695 108,319
Total operating capital employed 118,902 136,483 134,400 148,521 145,236Liabilities for current and deferred taxation (20,207) (21,792) (18,965) (20,401) (12,607)Goodwill 10,780 11,006 9,878 8,620 8,598
Capital employed 109,475 125,697 125,313 136,740 141,227
Financed by Finance debt 24,010 31,045 33,204 34,627 45,336 Minority interest 841 962 806 500 904 BP shareholders’ equity 84,624 93,690 91,303 101,613 94,987
Capital employed 109,475 125,697 125,313 136,740 141,227
a Operating capital employed is total assets (excluding goodwill) less total liabilities, excluding finance debt and current and deferred taxation.
BP Financial and Operating Information 2006 - 2010 23

Group information
Property, plant and equipment $ million
2006 2007 2008 2009 2010
Net book amount by businessExploration and Production US 28,996 31,555 35,369 36,361 37,230 Non-US 36,629 39,274 40,439 42,583 42,542
65,625 70,829 75,808 78,944 79,772
Refining and Marketing US 10,247 9,440 10,608 12,497 14,151 Non-US 12,901 15,030 14,016 14,616 13,996
23,148 24,470 24,624 27,113 28,147
Other businesses and corporate US 922 1,248 1,659 1,385 1,495 Non-US 1,304 1,442 1,109 833 749
2,226 2,690 2,768 2,218 2,244
Net book amount by geographical area US 40,165 42,243 47,636 50,243 52,876 Non-US 50,834 55,746 55,564 58,032 57,287
90,999 97,989 103,200 108,275 110,163
Cost and accumulated depreciationExploration and Production Cost 140,620 152,486 165,626 176,332 177,537 Accumulated depreciation (74,995) (81,657) (89,818) (97,388) (97,765)
65,625 70,829 75,808 78,944 79,772
Refining and Marketing Cost 45,397 48,590 47,289 51,276 52,843 Accumulated depreciation (22,249) (24,120) (22,665) (24,163) (24,696)
23,148 24,470 24,624 27,113 28,147
Other businesses and corporate Cost 3,262 4,015 4,194 3,650 3,859 Accumulated depreciation (1,036) (1,325) (1,426) (1,432) (1,615)
2,226 2,690 2,768 2,218 2,244
Group Cost 189,279 205,091 217,109 231,258 234,239 Accumulated depreciation (98,280) (107,102) (113,909) (122,983) (124,076)
90,999 97,989 103,200 108,275 110,163
BP Financial and Operating Information 2006 - 2010 24

Group information
Analysis of inventories, receivables and payables $ million
2006 2007 2008 2009 2010
InventoriesInventories 16,301 23,040 13,821 18,679 23,078Supplies 1,222 1,517 1,588 1,661 1,669
17,523 24,557 15,409 20,340 24,747Trading inventories 1,392 1,997 1,412 2,265 1,471
18,915 26,554 16,821 22,605 26,218
Current receivables Trade receivables 32,460 33,012 22,869 22,604 24,255 Amounts receivable from jointly controlled entities 830 888 1,035 1,317 751 Amounts receivable from associates 268 380 219 417 448 Current tax receivable 544 705 377 209 693 Gulf of Mexico oil spill trust fund reimbursement asset – – – – 5,943 Other current receivables 18,654 13,815 16,866 12,162 12,861
52,756 48,800 41,366 36,709 44,951
Non-current receivables Amounts receivable from jointly controlled entities – – – 11 601 Amounts receivable from associates – – – 298 220 Gulf of Mexico oil spill trust fund reimbursement asset – – – – 3,601 Other non-current receivables 5,738 6,791 8,097 7,831 8,412
5,738 6,791 8,097 8,140 12,834
Current payables Trade payables 28,319 30,735 20,129 22,886 27,510 Amounts payable to jointly controlled entities 119 66 292 304 1,361 Amounts payable to associates 273 650 295 692 712 Production and similar taxes 852 803 445 757 919 Current tax payable 2,635 3,282 3,144 2,464 2,920 Dividends 1 1 1 1 1 Gulf of Mexico oil spill trust fund liability – – – – 5,002 Other current payables 28,243 23,942 28,202 21,447 20,292
60,442 59,479 52,508 48,551 58,717
Non-current payables Amounts payable to jointly controlled entities – – 2,255 2,419 1,905 Amounts payable to associates – – – 298 220 Production and similar taxes 899 765 538 286 471 Gulf of Mexico oil spill trust fund liability – – – – 9,899 Other non-current payables 5,695 6,447 7,342 4,372 6,104
6,594 7,212 10,135 7,375 18,599
BP Financial and Operating Information 2006 - 2010 25

Group information
Group cash flow statement $ million
2006a 2007 2008 2009 2010
Operating activities Profit (loss) before taxation from continuing operations 35,142 31,611 34,283 25,124 (4,825) Adjustments to reconcile profit (loss) before taxation to net cash provided by operating activities Exploration e xpenditure written off 624 347 385 593 375 Depreciation, depletion and amor tization 9,128 10,579 10,985 12,106 11,164 Impairment and (gain) loss on sale of businesses and fix ed assets (3,165) (808) 380 160 (4,694) Earnings f rom jointly controlled entities and associates (3,995) (3,832) (3,821) (3,901) (4,757) Dividends receiv ed from jointly controlled entities and associates 4,495 2,473 3,728 3,003 3,277 Interest receiv able (473) (489) (407) (258) (277) Interest receiv ed 500 500 385 203 205 Finance costs 986 1,393 1,547 1,110 1,170 Interest paid (1,242) (1,363) (1,291) (909) (912) Net finance (income) e xpense relating to pensions and other post-retirement benefits (470) (652) (591) 192 (47) Share-based pa yments 416 420 459 450 197 Net operating c harge for pensions and other post-retirement benefits, less contributions and benefit payments for unfunded plans (261) (404) (173) (887) (959) Net c harge for provisions, less payments (160) (92) (298) 650 19,217 (Increase) decrease in in ventories 995 (7,255) 9,010 (5,363) (3,895) (Increase) decrease in other cur rent and non-current assets 3,596 5,210 2,439 7,595 (15,620) Increase (decrease) in other cur rent and non-current liabilities (4,211) (3,857) (6,101) (5,828) 20,607 Income t axes paid (13,733) (9,072) (12,824) (6,324) (6,610)
Net cash provided by operating activities of continuing operations 28,172 24,709 38,095 27,716 13,616
Investing activities Capital expenditure (15,125) (17,830) (22,658) (20,650) (18,421) Acquisitions, net of cash acquired (229) (1,225) (395) 1 (2,468) Investment in jointly controlled entities (37) (428) (1,009) (578) (461) Investment in associates (570) (187) (81) (164) (65) Proceeds from disposal of fixed assets 5,963 1,749 918 1,715 7,492 Proceeds from disposal of businesses, net of cash disposed 291 2,518 11 966 9,462 Proceeds from loan repayments 189 192 647 530 501 Other – 374 (200) 47 –
Net cash used in investing activities (9,518) (14,837) (22,767) (18,133) (3,960)
Financing activities Net issue (repurchase) of shares (15,151) (7,113) (2,567) 207 169 Proceeds from long-term financing 3,831 8,109 7,961 11,567 11,934 Repayments of long-term financing (3,655) (3,192) (3,821) (6,021) (4,702) Net increase (decrease) in short-term debt 3,873 1,494 (1,315) (4,405) (3,619) Dividends paid BP shareholders (7,686) (8,106) (10,342) (10,483) (2,627) Minority interest (283) (227) (425) (416) (315)
Net cash provided by (used in) financing activities (19,071) (9,035) (10,509) (9,551) 840
Currency translation differences relating to cash and cash equivalents 47 135 (184) 110 (279)
Increase (decrease) in cash and cash equivalents (370) 972 4,635 142 10,217Cash and cash equivalents at beginning of year 2,960 2,590 3,562 8,197 8,339
Cash and cash equivalents at end of year 2,590 3,562 8,197 8,339 18,556
a As reported in Annual Report on Form 20-F. There was a $500 million ($315 million post tax) timing difference between the profit reported under IFRS in the Annual Report and Accounts and the profit reported under IFRS in BP Annual Report on Form 20-F 2006. For further information see BP Annual Report and Accounts 2006.
BP Financial and Operating Information 2006 - 2010 26

Group information
Movement in net debt $ million
2006 2007 2008 2009 2010
Opening balance Finance debt 19,162 24,010 31,045 33,204 34,627 Less: cash and cash equivalents 2,960 2,590 3,562 8,197 8,339 Less: fair value asset (liability) of hedges related to finance debt (171) 298 666 (34) 127
Opening net debt 16,373 21,122 26,817 25,041 26,161
Closing balance Finance debt 24,010 31,045 33,204 34,627 45,336 Less: cash and cash equivalents 2,590 3,562 8,197 8,339 18,556 Less: fair value asset (liability) of hedges related to finance debt 298 666 (34) 127 916
Closing net debt 21,122 26,817 25,041 26,161 25,864
Decrease (increase) in net debt (4,749) (5,695) 1,776 (1,120) 297
Movement in cash and cash equivalents (excluding exchange adjustments) (417) 837 4,819 32 10,496Net cash (inflow) outflow from financing (excluding share capital) (4,049) (6,411) (2,825) (1,141) (3,613)Movement in finance debt relating to investing activitiesa – – – – (6,197)Debt acquired (13) – – – –Other movements (145) (134) (136) (61) (304)
Movement in net debt before exchange effects (4,624) (5,708) 1,858 (1,170) 382Exchange adjustments (125) 13 (82) 50 (85)
Decrease (increase) in net debt (4,749) (5,695) 1,776 (1,120) 297
a 2010 includes $6,197 million of disposal deposits in respect of disposals expected to complete in 2011.
BP Financial and Operating Information 2006 - 2010 27

Group information
Capital expenditure, acquisitions and disposals $ million
2006 2007 2008 2009 2010
By businessExploration and Production USa b 4,655 5,096 10,359 6,169 6,632 Non-USc d e f 8,597 9,111 11,868 8,727 11,121
13,252 14,207 22,227 14,896 17,753
Refining and Marketing USe 1,339 1,872 4,297 2,625 2,761 Non-USg 1,788 3,623 2,337 1,489 1,268
3,127 5,495 6,634 4,114 4,029
Other businesses and corporate USh 598 519 1,390 1,071 977 Non-US 254 420 449 228 257
852 939 1,839 1,299 1,234
By geographical areaUSa b e h 6,592 7,487 16,046 9,865 10,370Non-USc d e f g 10,639 13,154 14,654 10,444 12,646
17,231 20,641 30,700 20,309 23,016
Included above Acquisitions and asset exchangesb d f 321 1,447 2,514 308 3,406
Disposals 6,254 4,267 929 2,681 16,954
a 2 008 included $3,667 million in Exploration and Production for the purchase of all of Chesapeake Energy Corporation’s interest in the Arkoma Basin Woodford Shale assets and a 25% interest in Chesapeake’s Fayetteville Shale assets.
b 2010 included $1,767 million in Exploration and P roduction in the US deepwater Gulf of Mexico as part of the transaction with Devon Energy.c 2 010 included capital expenditure of $900 million relating to the formation of a partnership with Value Creation Inc. to develop the Terre de Grace oil sands acreage in the Athabasca region of Alberta,
Canada. 2010 also included $492 million for the purchase of additional interests in the Valhall and Hod fields in the North Sea. d 2010 included $1,099 million in Azerbaijan as part of the transaction with Devon Energy.
e 2 008 included capital expenditure of $2,822 million in Exploration and Production and an asset exchange of $1,909 million in Refining and Marketing relating to the formation of an integrated North American oil sands business with Husky Energy Inc. f 2006 included $1 billion for the purchase of shares in Rosneft. g 2007 included the acquisition of Chevron’s Netherlands manufacturing company for $1,132 million. hIncludes capital expenditure of $557 million for 2010 and $440 million for 2009 for wind turbines, incurred at the time for future wind projects.
BP Financial and Operating Information 2006 - 2010 28

Group information
Employee numbers at 31 December
2006 2007 2008 2009 2010
By businessExploration and Production 21,400 21,800 21,400 21,500 21,100Refining and Marketing (excluding service station staff) 41,900 42,700 40,300 37,700 37,100Other businesses and corporate 7,600 9,100 9,100 7,200 6,200Gulf Coast Restoration Organization – – – – 100
70,900 73,600 70,800 66,400 64,500Service station staff 26,100 24,500 21,200 13,900 15,200
97,000 98,100 92,000 80,300 79,700
By geographical areaUS 33,700 33,000 29,300 22,800 22,100Non-US 63,300 65,100 62,700 57,500 57,600
97,000 98,100 92,000 80,300 79,700
BP Financial and Operating Information 2006 - 2010 29

Group information
Ratiosa
$ million
2006c 2007 2008 2009 2010
Return on average capital employedReplacement cost profit (loss) 22,537 18,370 25,593 13,955 (4,914)Interest expenseb 467 722 752 467 456Minority interest 286 324 509 181 395
Adjusted replacement cost profit (loss) 23,290 19,416 26,854 14,603 (4,063)Non-operating items after taxation (1,361) 373 796 1,067 25,449
Adjusted replacement cost profit excluding non-operating items 21,929 19,789 27,650 15,670 21,386
Average capital employed (including goodwill) 104,701 117,587 125,506 131,027 138,892Return on average capital employed (including goodwill and non-operating items) 22.2% 16.5% 21.4% 11.1% (2.9)%
Average capital employed (excluding goodwill) 94,125 106,694 115,064 121,778 130,373Return on average capital employed (excluding goodwill and non-operating items) 23.3% 18.5% 24.0% 12.9% 16.4%
Debt ratiosGross debt 24,010 31,045 33,204 34,627 45,336Less: fair value asset (liability) of hedges related to finance debt 298 666 (34) 127 916
23,712 30,379 33,238 34,500 44,420Cash and cash equivalents 2,590 3,562 8,197 8,339 18,556
Net debt 21,122 26,817 25,041 26,161 25,864Equity 85,465 94,652 92,109 102,113 95,891
Debt to debt-plus-equity ratio 22% 24% 27% 25% 32%Debt to equity ratio 28% 32% 36% 34% 46%Net debt to net debt-plus-equity ratio 20% 22% 21% 20% 21%Net debt to equity ratio 25% 28% 27% 26% 27%
aT he ratios are defined on pages 84 and 85. b Calculated on a post-tax basis using a deemed tax rate equal to the US statutory tax rate.
c As reported in Annual Report on Form 20-F. There was a $500 million ($315 million post tax) timing difference between the profit reported under IFRS in the Annual Report and Accounts and the profit reported under IFRS in BP Annual Report on Form 20-F 2006. For further information see BP Annual Report and Accounts 2006.
BP Financial and Operating Information 2006 - 2010 30
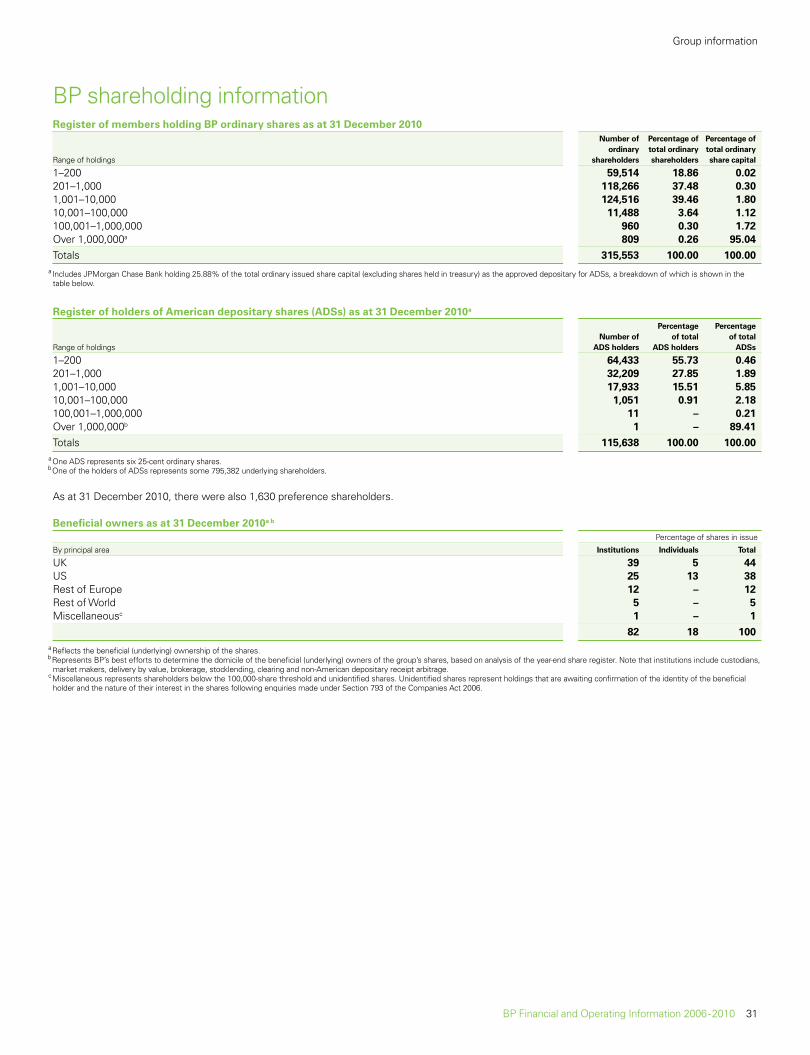
Group information
BP shareholding informationRegister of members holding BP ordinary shares as at 31 December 2010 Number of Percentage of Percentage of ordinary total ordinary total ordinaryRange of holdings shareholders shareholders share capital
1–200 59,514 18.86 0.02201–1,000 118,266 37.48 0.301,001–10,000 124,516 39.46 1.8010,001–100,000 11,488 3.64 1.12100,001–1,000,000 960 0.30 1.72Over 1,000,000a 809 0.26 95.04
Totals 315,553 100.00 100.00
a I ncludes JPMorgan Chase Bank holding 25.88% of the total ordinary issued share capital (excluding shares held in treasury) as the approved depositary for ADSs, a breakdown of which is shown in the table below.
Register of holders of American depositary shares (ADSs) as at 31 December 2010a
Percentage Percentage Number of of total of totalRange of holdings ADS holders ADS holders ADSs
1–200 64,433 55.73 0.46201–1,000 32,209 27.85 1.891,001–10,000 17,933 15.51 5.8510,001–100,000 1,051 0.91 2.18100,001–1,000,000 11 – 0.21Over 1,000,000b 1 – 89.41
Totals 115,638 100.00 100.00
a One ADS represents six 25-cent ordinary shares.b One of the holders of ADSs represents some 795,382 underlying shareholders.
As at 31 December 2010, there were also 1,630 preference shareholders.
Beneficial owners as at 31 December 2010a b
Percentage of shares in issue
By principal area Institutions Individuals Total
UK 39 5 44US 25 13 38Rest of Europe 12 – 12Rest of World 5 – 5Miscellaneousc 1 – 1
82 18 100
a R eflects the beneficial (underlying) ownership of the shares.b R epresents BP’s best efforts to determine the domicile of the beneficial (underlying) owners of the group’s shares, based on analysis of the year-end share register. Note that institutions include custodians,
market makers, delivery by value, brokerage, stocklending, clearing and non-American depositary receipt arbitrage.c Miscellaneous represents shareholders belo w the 100,000-share threshold and unidentified shares. Unidentified shares represent holdings that are awaiting confirmation of the identity of the beneficial
holder and the nature of their interest in the shares following enquiries made under Section 793 of the Companies Act 2006.
BP Financial and Operating Information 2006 - 2010 31

Group information
BP share data 2006c 2007 2008 2009 2010
Share price and dividendsShare price (pence per ordinary share) High 723.00 640.00 657.25 613.40 658.20 Low 558.50 504.50 370.00 400.00 296.00 End year 567.50 615.00 526.00 600.00 465.55
Dividends paid (pence per ordinary share) First quarter 5.288 5.258 6.813 9.818 8.679 Second quarter 5.251 5.151 6.830 9.584 – Third quarter 5.324 5.278 7.039 8.503 – Fourth quarter 5.241 5.308 8.705 8.512 –
21.104 20.995 29.387 36.417 8.679
Dividends paid (cents per ordinary share) First quarter 9.375 10.325 13.525 14.000 14.000 Second quarter 9.375 10.325 13.525 14.000 – Third quarter 9.825 10.825 14.000 14.000 – Fourth quarter 9.825 10.825 14.000 14.000 –
38.400 42.300 55.050 56.000 14.000
ADS price (US dollars per ADS) High 76.85 79.77 77.69 60.00 62.38 Low 63.52 58.62 37.57 33.71 26.75 End year 67.10 73.17 46.74 57.97 44.17
Dividends paid (US dollars per ADS) First quarter 0.5625 0.6195 0.8115 0.8400 0.8400 Second quarter 0.5625 0.6195 0.8115 0.8400 – Third quarter 0.5895 0.6495 0.8400 0.8400 – Fourth quarter 0.5895 0.6495 0.8400 0.8400 –
2.3040 2.5380 3.3030 3.3600 0.8400
Dividend payout ratio Based on replacement cost profit for the year 34% 44% 40% 75% n/a Based on profit for the year 34% 39% 49% 63% n/aDividend cover Dividend cover out of incomea 2.93 2.27 2.47 1.33 n/a Dividend cover out of cash flowb 3.67 3.05 3.68 2.64 5.18
a B ased on replacement cost profit for the year.b Net cash provided by operating activities, divided by gross dividends paid. The calculation is based on the assumption that all dividends are paid in cash.c A s reported in Annual Report on Form 20-F. There was a $500 million ($315 million post tax) timing difference between the profit reported under IFRS in the Annual Report and Accounts and the profit reported under IFRS in BP Annual Report on Form 20-F 2006. For further information see BP Annual Report and Accounts 2006.
BP Financial and Operating Information 2006 - 2010 32

Group information
Information for earnings per share $ million 2006b 2007 2008 2009 2010
Results for the periodProfit (loss) for the year attributable to BP shareholders 22,315 20,845 21,157 16,578 (3,719)Less: preference dividend 2 2 2 2 2
Profit (loss) for the year attributable to BP ordinary shareholders 22,313 20,843 21,155 16,576 (3,721)Unwinding of discount on deferred consideration for acquisition of investment in TNK-BP (net of tax) 16 – – – –
Diluted profit (loss) for the year attributable to BP ordinary shareholders 22,329 20,843 21,155 16,576 (3,721)
Profit (loss) for the year attributable to BP ordinary shareholders, as above 22,313 20,843 21,155 16,576 (3,721)Inventory holding (gains) losses, net of tax 222 (2,475) 4,436 (2,623) (1,195)
Replacement cost profit (loss) attributable to ordinary shareholders 22,535 18,368 25,591 13,953 (4,916)
Average number of sharesBasic weighted average number of shares outstanding (thousand)a 20,027,527 19,163,389 18,789,827 18,732,459 18,785,912 ADS equivalent (thousand)a 3,337,921 3,193,898 3,131,638 3,122,077 3,130,985Diluted weighted average number of shares outstanding (thousand)a 20,195,458 19,326,875 18,962,517 18,935,691 18,997,807 ADS equivalent (thousand)a 3,365,910 3,221,146 3,160,412 3,155,949 3,166,301
Shares in issue at year end (thousand)a 19,510,496 18,932,143 18,716,098 18,755,378 18,796,498 ADS equivalent (thousand)a 3,251,749 3,155,357 3,119,350 3,125,896 3,132,750
Shares repurchased in the year (thousand) 1,334,363 663,150 269,957 – –
a Ex cludes treasury shares and the shares held by the Employee Share Ownership Plans and includes certain shares that will be issuable in the future under employee share plans.b As reported in Annual Report on Form 20-F. There was a $500 million ($315 million post tax) timing difference between the profit reported under IFRS in the Annual Report and Accounts and the profit reported under IFRS in BP Annual Report on Form 20-F 2006. For further information see BP Annual Report and Accounts 2006.
BP Financial and Operating Information 2006 - 2010 33