thi ket dine hue phAn HICU TRUING TRVONG DAI HQC KY THUAT ...
Group-C
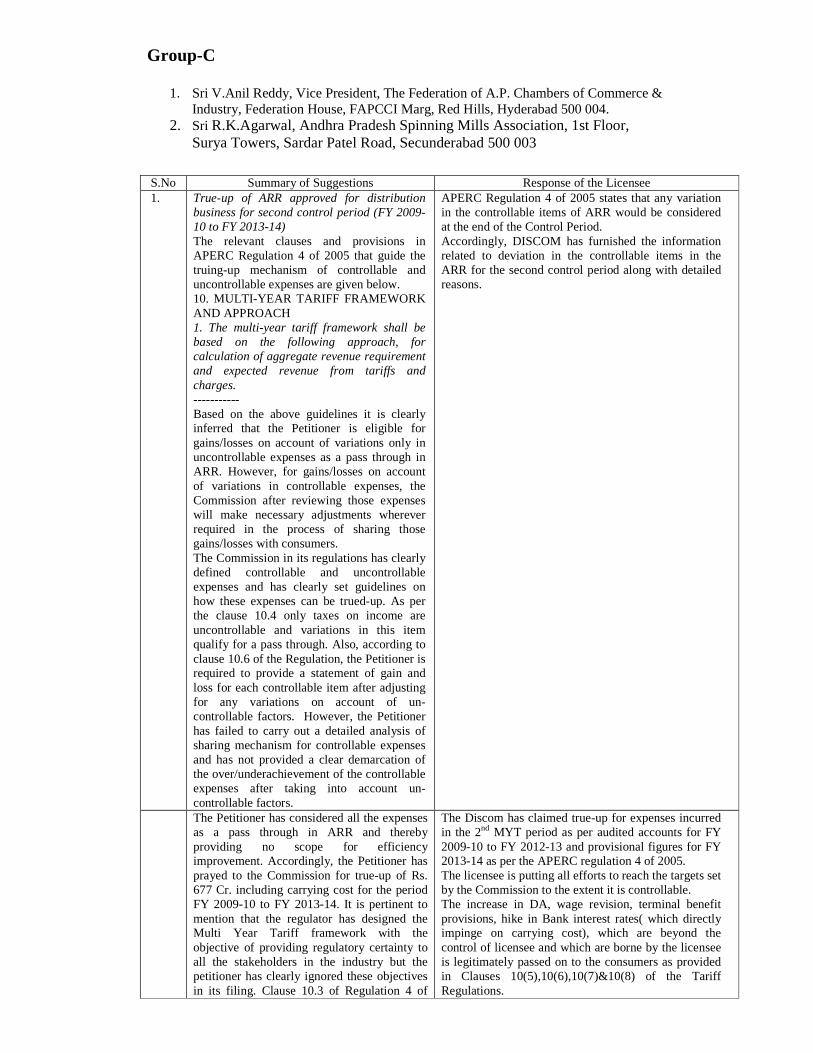
1. Sri V.Anil Reddy, Vice President, The Federation of A.P. Chambers of Commerce & Industry, Federation House, FAPCCI Marg, Red Hills, Hyderabad 500 004.
2. Sri R.K.Agarwal, Andhra Pradesh Spinning Mills Association, 1st Floor, Surya Towers, Sardar Patel Road, Secunderabad 500 003
S.No Summary of Suggestions Response of the Licensee 1. True-up of ARR approved for distribution
business for second control period (FY 2009-10 to FY 2013-14) The relevant clauses and provisions in APERC Regulation 4 of 2005 that guide the truing-up mechanism of controllable and uncontrollable expenses are given below. 10. MULTI-YEAR TARIFF FRAMEWORK AND APPROACH 1. The multi-year tariff framework shall be based on the following approach, for calculation of aggregate revenue requirement and expected revenue from tariffs and charges. ----------- Based on the above guidelines it is clearly inferred that the Petitioner is eligible for gains/losses on account of variations only in uncontrollable expenses as a pass through in ARR. However, for gains/losses on account of variations in controllable expenses, the Commission after reviewing those expenses will make necessary adjustments wherever required in the process of sharing those gains/losses with consumers. The Commission in its regulations has clearly defined controllable and uncontrollable expenses and has clearly set guidelines on how these expenses can be trued-up. As per the clause 10.4 only taxes on income are uncontrollable and variations in this item qualify for a pass through. Also, according to clause 10.6 of the Regulation, the Petitioner is required to provide a statement of gain and loss for each controllable item after adjusting for any variations on account of un-controllable factors. However, the Petitioner has failed to carry out a detailed analysis of sharing mechanism for controllable expenses and has not provided a clear demarcation of the over/underachievement of the controllable expenses after taking into account un-controllable factors.
APERC Regulation 4 of 2005 states that any variation in the controllable items of ARR would be considered at the end of the Control Period. Accordingly, DISCOM has furnished the information related to deviation in the controllable items in the ARR for the second control period along with detailed reasons.
The Petitioner has considered all the expenses as a pass through in ARR and thereby providing no scope for efficiency improvement. Accordingly, the Petitioner has prayed to the Commission for true-up of Rs. 677 Cr. including carrying cost for the period FY 2009-10 to FY 2013-14. It is pertinent to mention that the regulator has designed the Multi Year Tariff framework with the objective of providing regulatory certainty to all the stakeholders in the industry but the petitioner has clearly ignored these objectives in its filing. Clause 10.3 of Regulation 4 of
The Discom has claimed true-up for expenses incurred in the 2nd MYT period as per audited accounts for FY 2009-10 to FY 2012-13 and provisional figures for FY 2013-14 as per the APERC regulation 4 of 2005. The licensee is putting all efforts to reach the targets set by the Commission to the extent it is controllable. The increase in DA, wage revision, terminal benefit provisions, hike in Bank interest rates( which directly impinge on carrying cost), which are beyond the control of licensee and which are borne by the licensee is legitimately passed on to the consumers as provided in Clauses 10(5),10(6),10(7)&10(8) of the Tariff Regulations.

2005 clearly specifies the need for targets on controllable expenses. The Objector clearly objects to the petition on the grounds that the regulations were not clearly followed and thereby requests the Commission to address the issue while designing the order.
Another important factor in this is the accounts for FY 2012-13 are not yet audited and hence the licensee in the process of true-up has relied up on provisional accounts for FY 2012-13. For FY 2013-14, the licensee has projected the expenses for the true-up exercise. So, based on above submissions the Objector prays to Commission to consider following while carrying out true-up exercise
• True-up of expenses only for years FY 2009-10 to FY 2011-12 (Where accounts have been audited)
• True-up of variations in uncontrollable expenses for the control period FY 2009-10 to FY 2011-12;
• Direct the Petitioner to segregate the variations in controllable expenses based on controllable factors and uncontrollable factors as per regulation
• Identify the variations in controllable expenses due-to inefficiencies/efficiency gains and segregate them accordingly
• True-up of variations in controllable expenses only on account of uncontrollable factors
The licensee has improved performance in terms of distribution loss reduction substantially from a level of 17.92% during 2001-02 to 9.38% during 2012-13, which is a result of the company’s consistent endeavour to improve levels of efficiency. It is estimated that the loss level during 2013-2014 would be at 8.06 % that is much lesser than 17.08 % for the FY 2013-2014 as envisaged in the Tariff Order. It is submitted that statement of accounts have been audited for 2012-13 and provisional accounts are available for 2013-14. As and when audited statements of accounts are available for 2013-14 they will be filed with APERC and any true up will be taken up in accordance with the same. It is submitted that variation on account of controllable factors will be dealt with at the end of the control period and variation on account of uncontrollable items will be dealt on an annual basis.
A) Capital Expenditure and Additions to GFA
Additions to GFA plays a critical role in determining key expenses such as return on capital employed and depreciation, The Objector prays to the Commission for prudent review of capital expenditure and additions to GFA. The approved and actual (based on audited accounts) capital expenditure and additions to GFA for the period FY 2009-10 to FY 2011-12 is tabulated below. Table 1: Capital Expenditure and Capitalisation
Capital Expenditure (Rs. Crore) Additions to GFA (Rs. Crore) Financial Year
Approved
Actual Deviations Approved Actual Deviations
2009-10 800.07 705.33 -94.74 803.44 690.21 -113.23
2010-11 789.34 749.80 -39.54 795.20 659.06 -136.14
2011-12 902.47 965.13 62.66 828.73 920.00 91.27
Total 2491.88 2420.26 -71.62 2427.37 2269.27 -158.10
The Objector wants to highlight the fact that though it appears that the capital expenditure and additions to GFA have not increased significantly on consolidated basis, it is important that scheme wise capital expenditure has not increased
• The scheme wise details of approved and actual capital investment plan is enclosed vide Annexure – A.
• The details of approved and actual additions to GFA are enclosed vide Annexure – B
• The Discom will perform cost-benefit analysis in process of preparation of DPR (Detailed Project Report) and submit the same for the consent of the Hon’ble Commission for implementing the same.
• The scheme wise details of physical quantum of works taken up are enclosed vide Annexure – C.

significantly due to inefficiencies (such as delay in project execution etc.) of the Petitioner. However, Petitioner has not provided any details pertaining to scheme wise break-up of capital expenditure and additions to GFA for FY 2010-11 and FY 2011-12. Without this information it is not possible for the Objector to understand the reasons for variation in the additions to GFA. Also, from the Petition it is not clear whether the Petition has incurred any expenditure for un-approved capital schemes. Hence, the Objector prays to Commission to ensure that any increase in capital expenditure on account of unapproved schemes and inefficiencies of the Petitioner are not passed on to consumers Therefore, Objector prays to the Commission to consider following points while truing-up the capital expenditure and additions to GFA.
• Direct the Petitioner to provide the scheme wise details of approved and actual capital investment plan;
• Direct the Petitioner to provide the scheme wise details of approved and actual additions to GFA;
• Direct the Petitioner to provide cost benefit analysis for each scheme taken up;
• Direct the Petitioner to provide the scheme wise details of physical quantum of works taken up along with per unit cost;
B) Operational and Maintenance Expenses
Based on audited accounts, Petitioner has sought the Commission to approve for Rs. 412 Crs under true-up mechanism for O&M expenses corresponding to the period FY 2009-10 to FY 2011-12. However, it is re-iterated that Petitioner has not clarified how much of this amount is due to uncontrollable factors and how much is due to in-efficiencies. Objector prays to the Commission to due diligently review the O&M expenses while truing-up. Employee Expenses Petitioner has claimed true-up for the employee expenses on the following premises:
• Increase in employee expenses w.e.f. 1st April 2010 on account of pay revision;
• Increase in terminal benefits and leave encashment.
The Objector is of the view that increases in employee expenses on account of pay revision is an uncontrollable expense and needs to be accounted appropriately. However, the Petition did not clearly indicate the amount of increase in employee expenses due to pay revision. Also, it is not appropriate to account the entire increase in
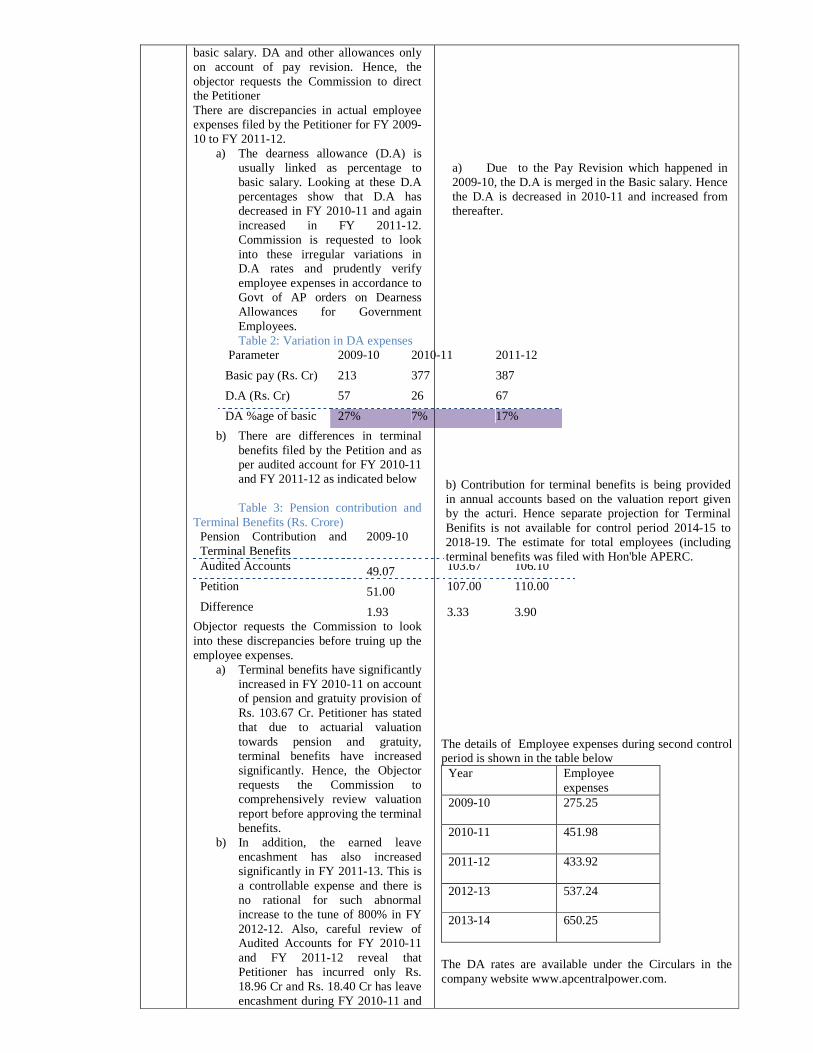
basic salary. DA and other allowances only on account of pay revision. Hence, the objector requests the Commission to direct the Petitioner There are discrepancies in actual employee expenses filed by the Petitioner for FY 2009-10 to FY 2011-12.
a) The dearness allowance (D.A) is usually linked as percentage to basic salary. Looking at these D.A percentages show that D.A has decreased in FY 2010-11 and again increased in FY 2011-12. Commission is requested to look into these irregular variations in D.A rates and prudently verify employee expenses in accordance to Govt of AP orders on Dearness Allowances for Government Employees. Table 2: Variation in DA expenses
Parameter 2009-10 2010-11 2011-12
Basic pay (Rs. Cr) 213 377 387
D.A (Rs. Cr) 57 26 67
DA %age of basic 27% 7% 17%
b) There are differences in terminal benefits filed by the Petition and as per audited account for FY 2010-11 and FY 2011-12 as indicated below Table 3: Pension contribution and
Terminal Benefits (Rs. Crore) Pension Contribution and Terminal Benefits
2009-10 2010-11 2011-12
Audited Accounts 49.07 103.67 106.10
Petition 51.00 107.00 110.00
Difference 1.93 3.33 3.90 Objector requests the Commission to look into these discrepancies before truing up the employee expenses.
a) Terminal benefits have significantly increased in FY 2010-11 on account of pension and gratuity provision of Rs. 103.67 Cr. Petitioner has stated that due to actuarial valuation towards pension and gratuity, terminal benefits have increased significantly. Hence, the Objector requests the Commission to comprehensively review valuation report before approving the terminal benefits.
b) In addition, the earned leave encashment has also increased significantly in FY 2011-13. This is a controllable expense and there is no rational for such abnormal increase to the tune of 800% in FY 2012-12. Also, careful review of Audited Accounts for FY 2010-11 and FY 2011-12 reveal that Petitioner has incurred only Rs. 18.96 Cr and Rs. 18.40 Cr has leave encashment during FY 2010-11 and
a) Due to the Pay Revision which happened in 2009-10, the D.A is merged in the Basic salary. Hence the D.A is decreased in 2010-11 and increased from thereafter.
b) Contribution for terminal benefits is being provided in annual accounts based on the valuation report given by the acturi. Hence separate projection for Terminal Benifits is not available for control period 2014-15 to 2018-19. The estimate for total employees (including terminal benefits was filed with Hon'ble APERC.
The details of Employee expenses during second control period is shown in the table below
Year Employee expenses
2009-10 275.25
2010-11 451.98
2011-12 433.92
2012-13 537.24
2013-14 650.25
The DA rates are available under the Circulars in the company website www.apcentralpower.com.

FY 2011-12 respectively. However, on account of actuarial valuation of leave encashment, the Petitioner has made a provision of Rs. 20 Cr and Rs. 175 Cr during FY 2010-11 and FY 2011-12 respectively. Also, in the Petition it is clearly stated that on account of actuarial valuation done for final EL Encashment for the past years, Rs 175 Crs was provided in the accounts for FY 2011-12. This indicates that the Petitioner is also asking to true-up a part of the expenses belonging to first control period. The Objector requests the Commission not to consider any true-up of expense pertaining to first control period in this tariff review exercise. So, Objector requests the Commission to consider amount in below table as leave encashment while truing-up the first control period expenses Table 4: Final Leave encashment
(Rs. Cr) Final Leave encashment 2010-11 2011-12
Objector 18.96 18.40
Petition 20.00 175.00
Difference 1.04 156.60
Based on the above submissions, Objector prays to the Commission to:
• Direct the Petitioner to provide the details of pay revision and to provide the quantum of increase in employee expenses due to pay revision;
• To allow increase in employee expenses only on account of pay revision;
• Direct the Petitioner to provide the half yearly DA rates applicable since January 2009 and to provide rationale for abnormal variations in DA expenses
• Consider pension contribution and terminal benefits in accordance with Petitioner’s audited accounts
• Direct the Petitioner to provide its terminal benefits valuation report and requests the Commission to comprehensively review the Petitioner’s terminal benefits valuation report before truing-up.
• Consider the EL encashment as proposed by the Objector;
Based on the available information, the Objector has calculated the impact (minimum reduction) in employee expenses on account of following factors
Table 5: Reduction in employee expenses (Rs. Crore)
Parameter 2009-10 2010-11 2011-12

Pension Contribution and Terminal Benefits
1.93 3.33 3.90
Final Leave encashment
1.04 156.60
Difference 1.93 4.37 160.50
Other operating and maintenance expenses – R&M and A&G Expenses The reasons provided by the Petitioner in support for increase in these expenses are:
• Increase in Travelling Expenditure and Vehicle Hire Charges due to rigorous inspection of field units, unforeseen hike in fuel cost, etc caused rise in administration and general expenses
• Increase in DTR repairs cost as well as maintenance cost of Lines and Cables & metering equipment due to unforeseen increase in material and labour rates
The above reasons submitted by the Petitioner do not substantiate the fact that the increase in these expenses is on account of uncontrollable factors. Also, the Petitioner has not given the deviation of actual A&G expenses and R&M expenses in comparison to Commission approved numbers. Due to absence of this information, Objector is not able to prudently comment on the validity of these expenses In addition, Petitioner has not clearly indicated whether there was an efficiency improvement due to this additional expenditure. Hence, the Objector requests the Commission not to approve for any inefficiencies of the Petitioner and not to pass on the same to consumers. The Objector being a subsidizing consumer is already bearing the burden of the subsidized category cost; above that bearing the cost of inefficiencies of the Petitioner too cannot be accepted. Based on the above submissions the Objector prays to the Commission
• To direct the Petitioner to provide the difference between actual and approved A&G and R&M expenses
• To disallow any additional other operating and maintenance expenses claimed by the Petitioner over and above the Commission approved expenses
In the Distribution Tariff order for the second control period, Hon APERC has approved aggregate O & M expenses only.Hence in the absence of break up of approved O&M costs, providing difference between actual and approved A&G and R&M expenses is not possible. The importance of R &M expenditure in reduction of losses and improvement in reliability and quality of power supply cannot be under estimated.
C) Depreciation and Return on Capital employed
The Petitioner has not provided the break-up of fixed assets and depreciation for second control period (FY 2009-10 to FY 2013-14) along with applicable depreciation rates. Hence, in the process of prudent verification of depreciation claim, the Objector requests the Commission to direct the Petitioner to provide the break-up of fixed assets and depreciation along with the depreciation rates considered.
The break-up of fixed assets and depreciation along with the depreciation rates and Consumer contributions are readily available in the Audited Annual Accounts of the Company. The depreciation and RRB has been computed by the Discoms after netting off the fully depreciated assets from the Gross block.

Also, the Objector requests the Commission to consider the following factors while truing-up the return on capital employed and depreciation
• Consider the approved capital expenditure in accordance to points raised in Section 1(A) for calculating regulatory rate base
• Direct the Petitioner to provide the detail break-up of fixed assets, depreciation and consumer contribution for second control period.
• Commission is requested to identify whether all fully depreciated assets are included by the licensee in its Petition and if included accordingly remove those assets for the purpose of calculation of regulatory asset base and depreciation
• Consider working capital as per revised O&M expenses trued-up by the Commission
• The licensee has taken up works under R-APDRP and RGGY schemes for which grant will be received. Hence, Commission is requested to identify the assets created through grants and accordingly remove those assets for the purpose of calculation of regulatory asset base and depreciation.
For computation of Regulated Rate Base (RRB) and Return on capital Employed (ROCE), the Discoms has deducted the entire consumer contributions/grants from the Asset block as stipulated in the Regulations. The Discoms has estimated the depreciation on consumer contributed assets based on the proportion of consumer contributions to loan funds. The depreciation on CC assets is shown as deferred revenue under the head Non-Tariff Income.
2. 1. Projections of ARR of distribution business for third control period (FY 2014-15 to FY 2018-19)
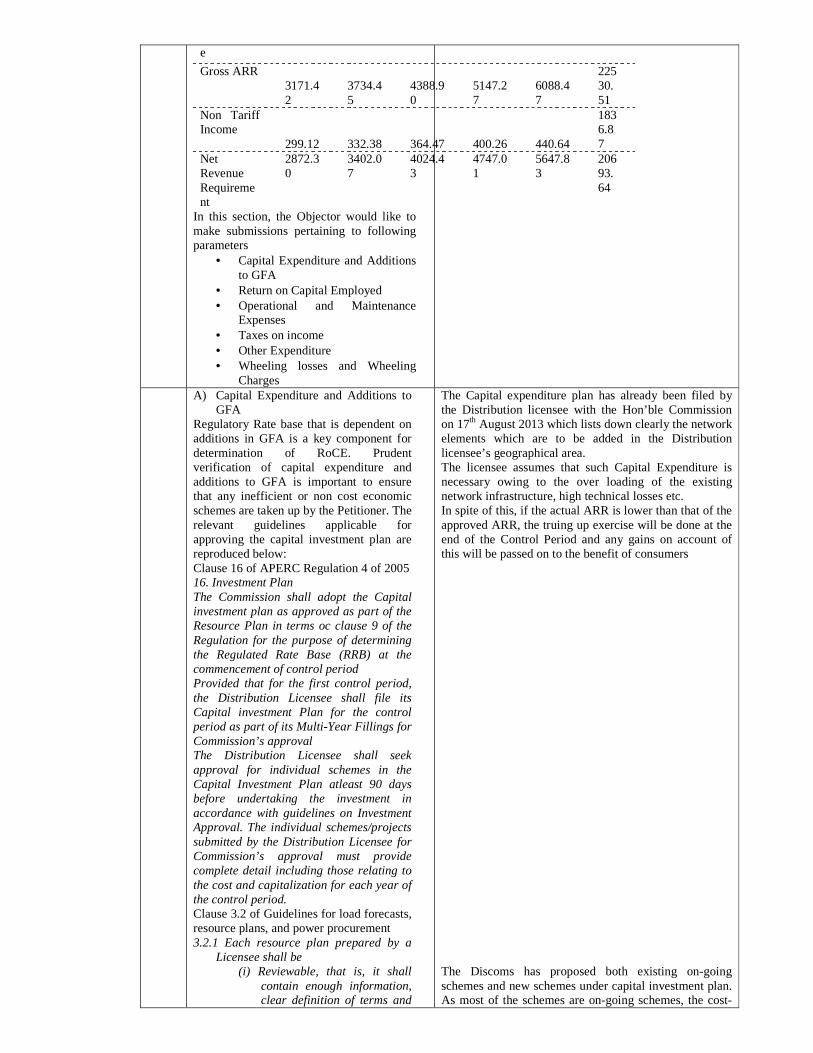
The Petitioner has proposed a total requirement of Rs. 14637.06 Cr as the net revenue requirement for distribution business for the third control period. The component wise summary of expenses proposed by the Petitioner is tabulated below: Table 6: Net Revenue Requirement (Rs. Cr.) for third control period - Proposed by Petitioner Particulars 2014-
15 2015-16
2016-17
2017-18
2018-19
Total
O&M(Net) 1689.24
2016.48
2415.32
2850.23
3399.87
12371.14
ROCE
525.43 627.67 751.95 903.76 1094.47
3903.28
Depreciation during the year 684.41 801.17 915.53
1068.49
1248.09
4717.69
Taxes on Income 54.02 65.79 77.73 91.39 107.61
396.54
Special appropriation of safety measures 30.00 35.00 40.00 45.00 50.00
200.00
Other Expenditur 188.32 188.34 188.37 188.40 188.43
941.86
e
Gross ARR 3171.42
3734.45
4388.90
5147.27
6088.47
22530.51
Non Tariff Income
299.12 332.38 364.47 400.26 440.64
1836.87
Net Revenue Requirement
2872.30
3402.07
4024.43
4747.01
5647.83
20693.64
In this section, the Objector would like to make submissions pertaining to following parameters
• Capital Expenditure and Additions to GFA
• Return on Capital Employed • Operational and Maintenance
Expenses • Taxes on income • Other Expenditure • Wheeling losses and Wheeling
Charges A) Capital Expenditure and Additions to
GFA Regulatory Rate base that is dependent on additions in GFA is a key component for determination of RoCE. Prudent verification of capital expenditure and additions to GFA is important to ensure that any inefficient or non cost economic schemes are taken up by the Petitioner. The relevant guidelines applicable for approving the capital investment plan are reproduced below: Clause 16 of APERC Regulation 4 of 2005 16. Investment Plan The Commission shall adopt the Capital investment plan as approved as part of the Resource Plan in terms oc clause 9 of the Regulation for the purpose of determining the Regulated Rate Base (RRB) at the commencement of control period Provided that for the first control period, the Distribution Licensee shall file its Capital investment Plan for the control period as part of its Multi-Year Fillings for Commission’s approval The Distribution Licensee shall seek approval for individual schemes in the Capital Investment Plan atleast 90 days before undertaking the investment in accordance with guidelines on Investment Approval. The individual schemes/projects submitted by the Distribution Licensee for Commission’s approval must provide complete detail including those relating to the cost and capitalization for each year of the control period. Clause 3.2 of Guidelines for load forecasts, resource plans, and power procurement 3.2.1 Each resource plan prepared by a
Licensee shall be (i) Reviewable, that is, it shall
contain enough information, clear definition of terms and
The Capital expenditure plan has already been filed by the Distribution licensee with the Hon’ble Commission on 17th August 2013 which lists down clearly the network elements which are to be added in the Distribution licensee’s geographical area. The licensee assumes that such Capital Expenditure is necessary owing to the over loading of the existing network infrastructure, high technical losses etc. In spite of this, if the actual ARR is lower than that of the approved ARR, the truing up exercise will be done at the end of the Control Period and any gains on account of this will be passed on to the benefit of consumers The Discoms has proposed both existing on-going schemes and new schemes under capital investment plan. As most of the schemes are on-going schemes, the cost-

data, and sufficient explanation to allow the Commission to understand fully the specific objectives, methods and assumptions used by the Licensee to prepare the plan;
(ii) Robust, that is, firstly it shall identify key uncertainties, the plan's exposure to those uncertainties, and the manner in which those risks are to be managed; and secondly it shall identify sources of finance such that the plan may be judged realistic in those terms; and
(iii) Viable, that is, it shall be supplemented with the business plan of the licensee approved by the GoAP wherein it is demonstrated that the resource plans can be sustained with licensee’s financial performance, consumer tariffs and government subsidy, if any.
However, there is very limited information to verify the prudency of proposed capital expenditure. The Petitioner has not provided any cost benefit analysis for the proposed investments. Also, historically it has been observed that the Petitioner was not been able to incur the capital expenditure as approved by the Commission. For the period FY 2009-10 to FY 2012-13, the Petitioner was able to incur only Rs. 3398 Cr as the capital expenditure. The yearly average capital expenditure for that period was Rs. 849 Cr. Yet for the third control period, the Petitioner has filed for a significantly higher capital investment of 10912 Cr. The yearly average of proposed capital expenditure for third control period was Rs. 2182 Cr, significantly higher than the actual average capital expenditure of Rs. 849 Crs and also than the approved yearly average capital expenditure of Rs. 895 Cr (Total was Rs. 4475 Cr) for second control period. This is resulting in inflated RRB while projecting the ARR for the distribution business. Hence, though capital investment and RRB will be trued-up at the end of the control period, the consumers are burdened due to front loaded tariffs resulting from this inflated base. Table 7: Actual capital expenditure for second control period(Rs. Cr) Year Approved Actual
2009-10 800.07 705.33 2010-11 789.34 749.80 2011-12 902.47 965.13 2012-13 928.10 977.41
benefit analysis has already been done in the DPR phase i.e. before taking the approval of the scheme. In fact, details of the network elements which are proposed to be added are already been filed with APERC in the form of the Resource Plan.

2013-14 1055.34 Total 4475.32 3397.67 Average 895.06 849.42
So, the Objector requests the Commission to direct the licensee to provide following information
• Cost benefit analysis for each of the proposed schemes;
• Provide work orders/approved plans/DPRs etc to indicate the appropriateness of the proposed investments and that licensee will be incurring those investments in the next control period;
• Status of financing those schemes i.e. Schemes for which financial closure has been achieved, Schemes for which the Petitioner is in negotiations for financing etc.
B) Special Appropriations for Safety Measures
During the second control period, Commission has approved Rs. 5 Cr each year for special appropriations for safety measures. However, licensee has not taken up any safety schemes and so failed to incur any expenditure under this head. For this third control period licensee again proposed a significantly high expenditure of Rs. 200 Cr under this head. Looking at the historical trend, Objector requests the Commission not to approve any expenditure under this head while determining distribution tariff. Considering any fictitious expenditure will result in inflated distribution ARR. If the licensee has really incurred expenditure under this head than it can be trued-up along with carrying cost during the later years.
Safety measures undertaken by APEPDCL are enclosed vide Annexure - D
C) Operational and Maintenance Expenses
Petitioner has changed the methodology adopted for estimating O&M expenses. The new methodology links the R&M expenses to GFA and links A&G/employee expenses to sales. The O&M expenses proposed by the Objector based on new methodology are tabulated below Table 8: O&M Expenses for third control period (Rs. Cr)
Actual
Based on Revised Approach Parameter
2012-13
2013-14
2014-15
2015-16
2016-17
2017-18
2018-19
Percentage increase in 2013-14
Net O&M Expenses
1106 1380 1689 2016 2415 2850 3400 24.74%
It can be observed from the above table that there is an increase 24.74% in net O&M
The licensee after careful consideration and analysis came to the conclusion that if there is a growth in sales the Employee as well as A&G expenses also rises because there is need to engage correspondingly more number of employees. MERC has also followed a similar approach for approving O&M expenses by linking it to sales and GFA for Tata Power for the period FY 2013-16 The Licensee has observed that R&M expenses are directly proportional to Gross Fixed Assets (GFA) of the corresponding financial year. Existing assets and further addition to assets will directly increase the repairs and maintenance expenses. Hence, a correlation between
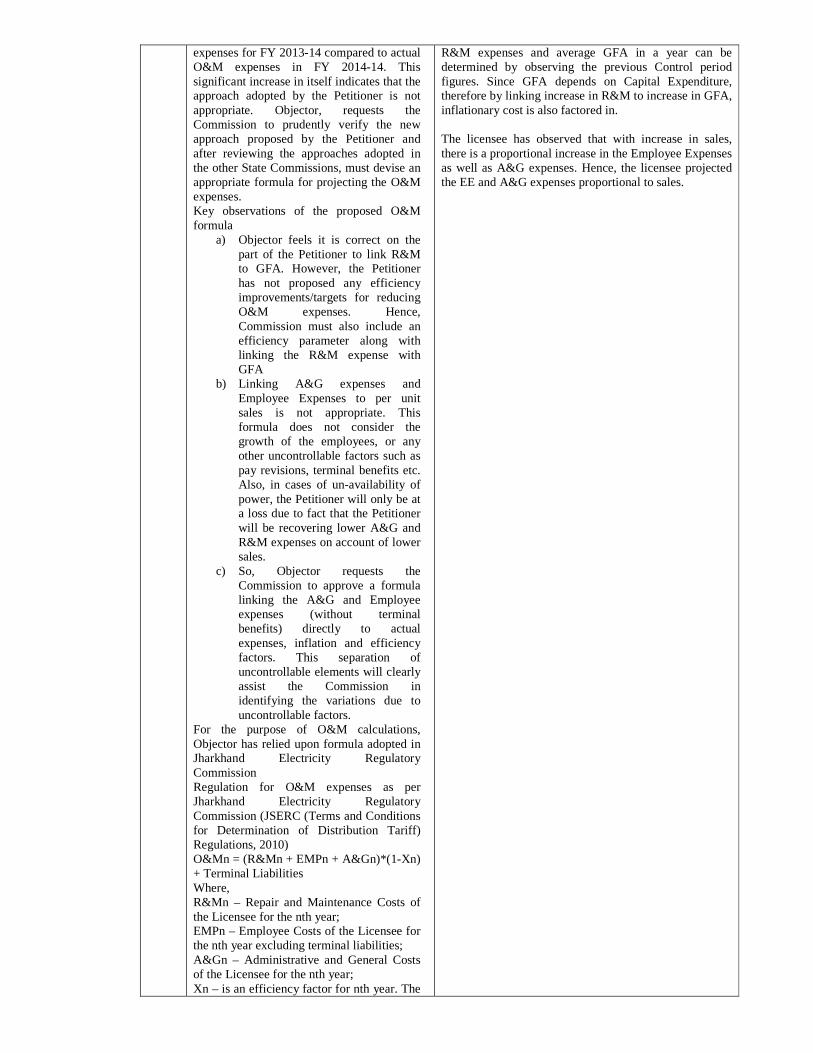
expenses for FY 2013-14 compared to actual O&M expenses in FY 2014-14. This significant increase in itself indicates that the approach adopted by the Petitioner is not appropriate. Objector, requests the Commission to prudently verify the new approach proposed by the Petitioner and after reviewing the approaches adopted in the other State Commissions, must devise an appropriate formula for projecting the O&M expenses. Key observations of the proposed O&M formula
a) Objector feels it is correct on the part of the Petitioner to link R&M to GFA. However, the Petitioner has not proposed any efficiency improvements/targets for reducing O&M expenses. Hence, Commission must also include an efficiency parameter along with linking the R&M expense with GFA
b) Linking A&G expenses and Employee Expenses to per unit sales is not appropriate. This formula does not consider the growth of the employees, or any other uncontrollable factors such as pay revisions, terminal benefits etc. Also, in cases of un-availability of power, the Petitioner will only be at a loss due to fact that the Petitioner will be recovering lower A&G and R&M expenses on account of lower sales.
c) So, Objector requests the Commission to approve a formula linking the A&G and Employee expenses (without terminal benefits) directly to actual expenses, inflation and efficiency factors. This separation of uncontrollable elements will clearly assist the Commission in identifying the variations due to uncontrollable factors.
For the purpose of O&M calculations, Objector has relied upon formula adopted in Jharkhand Electricity Regulatory Commission Regulation for O&M expenses as per Jharkhand Electricity Regulatory Commission (JSERC (Terms and Conditions for Determination of Distribution Tariff) Regulations, 2010) O&Mn = (R&Mn + EMPn + A&Gn)*(1-Xn) + Terminal Liabilities Where, R&Mn – Repair and Maintenance Costs of the Licensee for the nth year; EMPn – Employee Costs of the Licensee for the nth year excluding terminal liabilities; A&Gn – Administrative and General Costs of the Licensee for the nth year; Xn – is an efficiency factor for nth year. The
R&M expenses and average GFA in a year can be determined by observing the previous Control period figures. Since GFA depends on Capital Expenditure, therefore by linking increase in R&M to increase in GFA, inflationary cost is also factored in. The licensee has observed that with increase in sales, there is a proportional increase in the Employee Expenses as well as A&G expenses. Hence, the licensee projected the EE and A&G expenses proportional to sales.

value of Xn will be determined by the Commission in it first MYT order for the Control Period; Note: Terminal Liabilities will be approved as per actual submitted by the Licensee or be established through actuarial studies
a) R&Mn = K*GFA Where, ‘K’ is a constant (expressed in %) governing the relationship between R&M costs and Gross Fixed Assets (GFA) and will be calculated based on the % of R&M to GFA of the preceding year of the Base Year; ‘GFA’ is the opening value of the gross fixed asset of the nth year;
b) EMPn (excluding terminal liabilities) + A&Gn = (EMPn-1 + A&Gn-1)*(INDXn/ INDXn-1) + Gn
Where, INDXn – Inflation factor to be used for indexing the employee cost and A&G cost. This will be a combination of the Consumer Price Index (CPI) and the Wholesale Price Index (WPI) for immediately preceding year before the base year; Gn – Increase in Employee Expenses in nth year due to increase in consumer base/ load growth. Value of G for each year of the Control Period shall be determined by the Commission in the MYT Tariff order based on Licensee’s filing, benchmarking with the efficient utilities, actual cost incurred by the licensee due to increase in consumer base/load growth in past, and any other factor considered appropriate by the Commission; INDXn = 0.55*CPIn +0.45*WPIn; So based on the above methodology the Objector has recalculated the O&M expenses. The base year has been considered as FY 2013-14 and for projecting the O&M for the base year, the Commission has relied upon the O&M expenses for FY 2012-13.
Repair and Maintenance Expenses Based on trend of historical R&M expenses, the average of R&M expenses as % of average GFA during FY 2008-09 to FY 2012-13 was 2.84%. The Petitioner has projected the R&M expenses by taking 2.84% of the corresponding years GFA. However, the petitioner is of the view that this percentage is on a higher side considering R&M expenses of other state discoms. So, the objector requests the Commission to consider 2.50% of the average GFA for allowing R&M expenses. Also, in accordance to MYT Regulations it is important for the Commission to advocate efficiency in licensee operation. Hence, Objector requests the Commission to consider an efficiency factor starting with 1% in second year and gradually increase it to 4% by end of the third control period. Considering the efficiency factor, the percentage for calculating R&M expenses
The R&M expenses as a % of GFA for a distribution licensee would depending on the existing infrastructure network and not necessarily would be same as that of some other Distribution licensee. The licensee has furnished the historical values to the Hon’ble Commission and requests the Hon’ble Commission to take this into account while setting the R&M expenses

considering average GFA is tabulated below. Table 9: Projection of R&M expenses % on average GFA for third control period Particulars 2014-
15 2015-16
2016-17
2017-18
2018-19
Base R&M expenses %
2.50%
2.50%
2.50%
2.50%
2.50%
Efficiency Factor 1.00%
2.00%
3.00%
4.00%
Revised R&M expenses %
2.50%
2.48%
2.45%
2.43%
2.40%
The revised estimate of Rs. 1777 Crs has been arrived for R&M expenses during the third control period. The relevant calculations are tabulated below. Table 10: Revised R&M expenses (Rs. Cr) for third control period Particulars 2013-
14 2014-15
2015-16
2016-17
2017-18
2018-19
Opening GFA 7643 9554 11321 13285 15303 17793
Closing GFA 9554 11321 13285 15303 17793 20549
Average GFA 8599 10438 12303 14294 16548 19171
As per Petition
% of GFA 2.84% 2.84%
2.84%
2.84% 2.84% 2.84%
R&M Expenses 244.20 296.43
349.41
405.95
469.96 544.46
Revised Estimate As per Objector
% of GFA 2.50%
2.50%
2.48% 2.45% 2.43% 2.40%
Revised R&M Expenses 214.96
260.94
304.50
350.20 401.29 460.10
Decrease in R&M expenses
29.23 35.49 44.91 55.75 68.67 84.35
Employee Expenses
Due to un-availability of licensee estimates for terminal liability, Objector has considered the average terminal benefits for FY 2010-11 to FY 2012-13 for the purpose of calculating terminal benefits for third control period. Table 11: Terminal benefits in Rs. Cr Particular 2010-11 2011-12 2012-13 Average
Terminal Benefits 104 106 126 112
The average increase in inflation factor is 9.83% considering the WPI and CPI for FY 2012 and FY 2013 respectively Table 12: Increase in inflation factor Particulars W
PI CPI
Inflation factor (80% CPI + 20% WPI)
FY 2012 156
195
187.20
FY 2013 168
215
205.60
Increase in inflation factor
9.83%
Considering the efficiency factor, the revised year on year percentage increase in employee expenses is tabulated below. Table 13: Projection of revised YoY increase
It is submitted that the Objector has used an extraneous logic in arriving at the total O & M cost that he believes the petitioner is entitled to. However, a closer look at one of his assumptions namely terminal benefits reveals that the estimates are far of the mark. In fact, terminal benefits increases year by year as the pensioners will increase every year as retired employees will be added. Further, the share of EPDCL towards the pension contributions in future years will also increase depending upon the length of service rendered by employees who are eligible for pensions. The terminal benefits for the year 2013-14 can not be the average of last 3 years and it will be more than the terminal benefits of 2012-13.

in employee expenses Particulars 2014
-15 2015-16
2016-17
2017-18
2018-19
YoY Increase in inflation factor
9.83%
9.83%
9.83%
9.83% 9.83%
Efficiency Factor 1.00%
2.00%
3.00% 4.00%
Revised YoY increase in inflation factor
9.83%
9.73%
9.63%
9.53% 9.44%
The employee expenses are then projected without considering terminal benefits. The terminal benefits are later projected considering the average terminal benefits for FY 2009-10 to FY 2012-13 and year on year increase of 9.83%. The re-estimated employee expenses are tabulated below. Table 14: Revised Employee Expenses (Rs. Cr) for third control period Particulars FY
2013
FY 2014
FY 2015
FY 2016
FY 2017
FY 2018
FY 2019
Net Employee Expenses without terminal benefits
640 703 772 847 929 1017 1113
Increase in employee expenses over previous year's considering inflation and efficiency factor
9.83%
9.83%
9.73%
9.63%
9.53%
9.44%
Terminal Benefits
126 112 123 135 148 163 179
Increase in Terminal Benefits
9.83%
9.83%
9.83%
9.83%
9.83%
Net Revised Employee Expenses
766 815 895 982 1077 1180 1292
A&G Expenses
Using a similar approach A&G expenses are projected considering an increase in inflation of 9.83% and an efficiency factor of 1% to 4%. The re-estimated A&G expenses is tabulated below Table 15: Re-estimated A&G expenses for third control Period (Rs. Cr) Particular FY
2013
FY 2014
FY 2015
FY 2016
FY 2017
FY 2018
FY 2019
Increase in A&G expenses over previous year's considering inflation and efficiency factor
9.83%
9.83%
9.73%
9.63%
9.53%
9.44%
Net Revised
120 132 145 159 174 191 209
--
A&G expenses
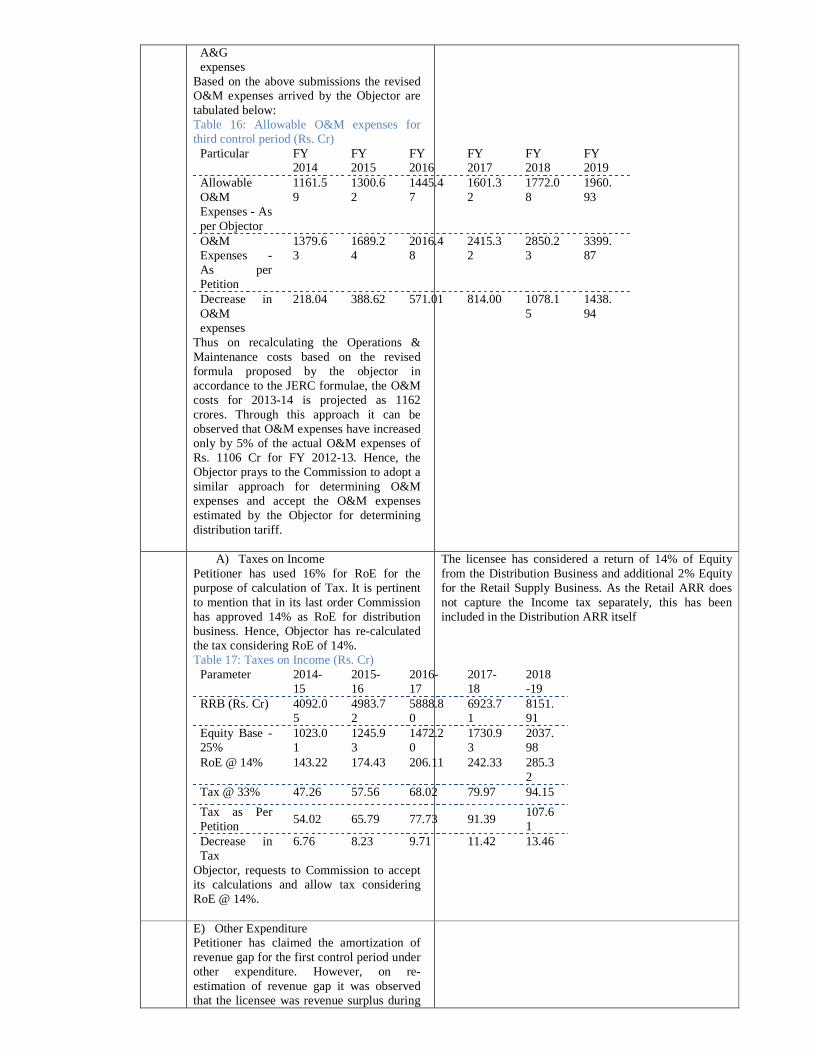
Based on the above submissions the revised O&M expenses arrived by the Objector are tabulated below: Table 16: Allowable O&M expenses for third control period (Rs. Cr) Particular FY
2014 FY 2015
FY 2016
FY 2017
FY 2018
FY 2019
Allowable O&M Expenses - As per Objector
1161.59
1300.62
1445.47
1601.32
1772.08
1960.93
O&M Expenses - As per Petition
1379.63
1689.24
2016.48
2415.32
2850.23
3399.87
Decrease in O&M expenses
218.04 388.62 571.01 814.00 1078.15
1438.94
Thus on recalculating the Operations & Maintenance costs based on the revised formula proposed by the objector in accordance to the JERC formulae, the O&M costs for 2013-14 is projected as 1162 crores. Through this approach it can be observed that O&M expenses have increased only by 5% of the actual O&M expenses of Rs. 1106 Cr for FY 2012-13. Hence, the Objector prays to the Commission to adopt a similar approach for determining O&M expenses and accept the O&M expenses estimated by the Objector for determining distribution tariff.
A) Taxes on Income Petitioner has used 16% for RoE for the purpose of calculation of Tax. It is pertinent to mention that in its last order Commission has approved 14% as RoE for distribution business. Hence, Objector has re-calculated the tax considering RoE of 14%. Table 17: Taxes on Income (Rs. Cr) Parameter 2014-
15 2015-16
2016-17
2017-18
2018-19
RRB (Rs. Cr) 4092.05
4983.72
5888.80
6923.71
8151.91
Equity Base - 25%
1023.01
1245.93
1472.20
1730.93
2037.98
RoE @ 14% 143.22 174.43 206.11 242.33 285.32
Tax @ 33% 47.26 57.56 68.02 79.97 94.15
Tax as Per Petition
54.02 65.79 77.73 91.39 107.61
Decrease in Tax
6.76 8.23 9.71 11.42 13.46
Objector, requests to Commission to accept its calculations and allow tax considering RoE @ 14%.
The licensee has considered a return of 14% of Equity from the Distribution Business and additional 2% Equity for the Retail Supply Business. As the Retail ARR does not capture the Income tax separately, this has been included in the Distribution ARR itself
E) Other Expenditure Petitioner has claimed the amortization of revenue gap for the first control period under other expenditure. However, on re-estimation of revenue gap it was observed that the licensee was revenue surplus during

the first control period. Hence, Objector requests the Commission to pass on the entire benefit of revenue surplus to consumers during FY 2014-15. Table 18: Other Expenditure - in Rs. Cr Other Expenses 2014-
15 2015-16
2016-17
2017-18
2018-19
As per Petition 188.32
188.34
188.37
188.40
188.43
As per Objector -161.95 0.031 0.032 0.032 0.033
Decrease in other expenses
350.27
188.31
188.34
188.37
188.40
F) Wheeling Losses Petitioner has proposed the voltage wise losses considering actual losses for FY 2012-13. However, Objector requests the Commission not to accept the Petitioner’s claim. Petitioner has not met the loss reduction trajectory set by the Commission. It can be observed that the actual losses were higher than that approved by the Commission for FY 2013-14. If the request of the petitioner is to be considered, the consumers will be affected on account of in-efficiency of the Petitioner in arresting the distribution losses. It is pertinent to mention that distribution loss is a controllable factor and under MYT framework Commission must set appropriate targets for reducing these distribution loss. So, Objector requests the Commission to consider the approved losses for FY 2013-14 and set a 2% YoY reduction for arriving at the losses applicable for each year of the control period. The revised loss reduction strategy proposed by the Objector is tabulated below Table 19: Loss reduction strategy proposed by the Objector Voltage Level
FY 2014 (Approved)
FY 2015
FY 2016
FY 2017
FY 2018
FY 2019
LT 8.00% 7.84%
7.68%
7.53%
7.38%
7.23%
11 kV 5.00% 4.90%
4.80%
4.71%
4.61%
4.52%
33 kV 3.99% 3.91%
3.83%
3.76%
3.68%
3.61%
132 kV Losses
4.02% 3.94%
3.86%
3.78%
3.71%
3.63%
The licensee has improved performance in terms of distribution loss reduction substantially from a level of 17.92% during 2001-02 to 9.38% during 2012-13, which is a result of the company’s consistent endeavour to improve levels of efficiency. It is estimated that the loss level during 2013-2014 would be at 8.06 % that is much lesser than 17.08 % for the FY 2013-2014 as envisaged in the Tariff Order It would not be out of the point to mention that other Discoms with similar consumer mix such as Tamilnadu and MSEDCL have losses equal to 21.6 % (T &D) for 2012-13 and 17.28% (Distribution) for 2010-11. The Distribution licensee has computed the actual losses for the year FY 2012-13 and accordingly proposed the loss trajectory for the third control period. The licensee requests the Hon’ble Commission to approve realistic loss trajectory for the next control period based on the actual loss levels of the licensee
G) Revised Wheeling Charges Based on the above submissions, the objector has arrived at the revised ARR for distribution business to be recovered from the consumers Table 20: Revised Distribution ARR (Rs. Cr) Particulars FY 2014-
15 FY 2015-16
FY 2016-17
FY 2017-18
FY 2018-19
Net O&M Expenses
1161.59 1300.62 1445.47 1601.32 1772.08
Depreciation 684.41 801.17 915.53 1068.49 1248.09
Taxes on Income
35.10 38.62 41.02 44.95 51.33
It is submitted that these revised wheeling charges are based on the assumed ARR calculated by the objector and the assumptions in the said ARR have been replied to earlier.

Other Expenditure
-161.95 0.03 0.03 0.03 0.03
Return on Capital Employed
525.43 627.67 751.95 903.76 1094.47
Total Distribution ARR
2244.58 2768.11 3154.00 3618.55 4166.00
Less: Wheeling Revenue from Third Party/Open Access/NTI (if any)
299.12 332.38 364.47 400.26 440.64
Revenue Requirement 1945.46 2435.73 2789.53 3218.29 3725.36
For arriving at the voltage wise wheeling charges, the contracted load and coincident demand are taken as per Petition. In addition, the apportioning of ARR among different voltage levels has been done in accordance with the Petition. Table 21: Voltage wise ARR apportioning (%)
Voltage wise ARR apportioning (%) ARR
Voltage level
FY 14-15
FY 15-16
FY 16-17
FY 17-18
FY 18-19
ARR33 33 kV 4.21%
4.38%
4.47%
4.49%
4.67%
ARR11 11 kV 24.61%
25.25%
25.71%
26.04%
25.48%
ARRLT
LT 71.18%
70.40%
69.81%
69.50%
69.85%
Table 22: Contracted Load and Coincident Demand - As per Petition
Contracted load ( 33 kV and 11 kV) and Coincident Demand (LT) — MW
Parameter Voltage Level
FY 14-15
FY 15-16
FY 16-17
FY 17-18
FY 18-19
Contracted Load — CD33
33 kV 1,916
2,171 2,460 2,788
3,160
Contracted Load — CD11
11 kV 2,004
2,181 2,373 2,583
2,811
Coincident Demand - CIDLT
LT 4,004
4,303
4,626 4,972 5,34
4
Table 23: Voltage wise ARR apportioning (Rs. Cr)
Voltage wise ARR apportioning Rs. Cr) ARR
Voltage level
FY 14-15
FY 15-16
FY 16-17
FY 17-18 FY 18-19
ARR33
33 kV 81.94
106.68
124.75
144.41
174.13
ARR11
11 kV 478.75
615.02
717.31
837.96
949.15
ARRLT
LT 1384.78
1714.75
1947.47
2236.60
2602.08
Total 1945.46
2436.45
2789.53
3218.97
3725.36
Revised voltage level wheeling charges that

are tabulated below are arrived by dividing the ARR at that voltage level with demand at that voltage level as per Table 25. Table 24: Revised wheeling tariff for third control period Wheeling Tariff — Rs./kVA/month
Voltage Level FY 14-15
FY 15-16
FY 16-17
FY 17-18
FY 18-19
33 kV (Rs./kVA/Month)
35.64 40.95 42.26 43.16 45.92
11 kV (Rs./kVA/Month)
199.08
234.99 251.90
270.35 281.38
LT (Rs./kVA/Month)
288.21
332.08 350.82
374.87 405.76
Objector, requests to Commission to accept its calculations and approve the wheeling charges for the third control period as determined by the Objector.
3. Review of ARR of retail supply business and revenue gap for FY 2013-14 Petitioner while revisiting the expenses and revenue for FY 2013-14 has projected a revenue gap of Rs. 925.09 Cr. However, Objector is of the view that the true-up of expenses for retail-supply business for FY 2013-14 most not be carried out during this tariff review exercise due to following reasons:
• The audited accounts for FY 2013-14 are not available and the estimates arrived for FY 2013-14 are based of provisional accounts for first half of FY 2013-14
• The increase in revenue gap is primarily due to changes in power purchase cost and revenue. It is pertinent to mention that those revised cost proposed for FY 2013-14 are also estimates but not the actual costs.
• The Commission stand taken while issuing FY 2010 tariff order pertaining to true-up of ARR pertaining to distribution business for first control period is as follows:
“The Licensees provided the details of expenses related to previous years to be trued up in this filing for distribution business but not included these amounts in the estimates of ARR for distribution business. The Licensees provided the amounts to be trued-up for three completed years FY2005-06 to FY2007-08 and some Licensees estimated the amounts to be trued up for FY2008-09 also. 201. The true up mechanism is already specified in Regulation 4 of 2005 issued for determination of wheeling and retail supply tariffs. Clause 10(5) of Regulation 4 of 2005 provides for; Pass-through of gains and losses on variations in “uncontrollable” items of ARR:- The Distribution Licensee shall be eligible to claim variations in “uncontrollable” items in the ARR for the year succeeding the relevant year of the Control Period depending on the
The Distribution licensee would like to submit that Power Purchase constitutes to 80% of the total Retail ARR. There has been a huge amount of variation in the Power Purchase cost in the past due to uncertain Hydel availability, shortage of domestic coal leading to usage of expensive imported coal, shortage of gas from KG-D6 basin etc. These factors are very volatile and the licensee has observed huge fluctuations in the power purchase cost over a 2-3 year horizon which cannot be projected accurately for a 5 year period. If the true up of power purchase cost for a period of 5 years is filed, it has to factor in the carrying cost for the complete control period. To avoid the consumer paying for this carrying cost, the licensee has filed that the deviation for the current year be incorporated for the tariff of the ensuing year. Also, the licensee has submitted the actual data for H1 13-14 and revised estimate for H213-14. Even if there is any variation between the revised estimates of H2 13-14, this deviation would be considered during the tariff filing of FY 15-16.

availability of data as per actuals with respect to effect of uncontrollable items 202. As per clause 10(4) of Regulation 4 of 2005, only taxes on income are uncontrollable and thus variations in this item qualify for true up. Further clause 10(8) of Regulation 4 of 2005 provides for; Notwithstanding anything contained in this Regulation, the gains or losses in the controllable items of ARR on account of factors that are beyond the control of the Distribution Licensee – force majeure – shall be passed on as an additional charge or rebate in ARR over such period as may be specified in the Order of the Commission. 203. It is appropriate to take up the issue of true up of expenses related to previous years separately after completion of the audited accounts for all years of the Control Period. As such, Licensees may seek the true ups outside the current filings as per the applicable regulations already notified.” Based on the above submissions and Commission’s previous stand taken, Objector prays to the Commission to true-up the ARR pertaining to retail –supply business for FY 2013-14 once audited accounts are available. In addition, Commission has contemplating to amends its tariff regulation for allowing provisional true-up. Accordingly, a draft regulation has been issue. However, Objector requests the Commission not to amend its Tariff Regulations and true-up the power purchase costs only based upon audited accounts for FY 2013-14 while determining retail supply tariff for FY 2015-16.
4. Projections of ARR of retail supply business for FY 2014-15
A) Sales forecast The summary of actual consumption and approved consumption is given in the below tables: Table 25: Comparison of sales mix for FY 2012-13 (Approved and Actual)
2012-13
APERC Order Actual
Particulars
MU % MU %
Change % in mix compared to approval
Metered Sales
26061.59 76.35%
21446.98
71.24%
-6.69%
LT Agricultural Sales 8073.9 23.65% 8659.48
28.76%
21.61%
Total Sales
34135.49
30106.46
Table 26: Comparison of sales mix for FY 2013-14 (Approved and Estimate)
2013-14
APERC Order Revised Estimate
Particulars
MU % MU %
Change % in mix compared to approval
The licensee has projected the sales mix based on the best effort estimate basis. The maintenance of the sales mix is not dependent on the Distribution licensee but is dependent on macro economic environment and factors beyond the control of the Discom.. The licensee requests the Hon’ble Commission to provide for truing up due to change in sales mix

Metered Sales
26061.59
76.35%
23775.76
72.26%
-5.35%
LT Agricultural Sales 8073.9
23.65% 9126.12
27.74%
17.27%
Total Sales
34135.49
32901.88
From the above tables it is inferred that there is a change in actual sales mix compared to that of Commission’s approval. In addition, it is the unmetered consumers who have benefitted due to change in sales mix. It is pertinent to mention that due to significantly lower tariffs of unmetered consumers, any increase in allocation of power to unmetered consumers that will not bring any noteworthy additional revenue to the Petitioner. The Objector has further carried out a category wise analysis to understand which of the metered consumers that are affected due to change in sales mix. The category wise approved and actual sales for FY 2012-13 are tabulated below. Table 27: Category wise approved and actual sales – FY 2012-13
Approved Actual Consumer Category Sales
(MU) % Share
Sales (MU)
% Share
Change in sales mix compared to approval
Domestic Consumers 6941.57 20.34% 6222.93 20.67% 1.64% Agriculture Consumers 8073.70 23.65% 8659.48 28.76% 21.61% LT Industrial 1253.95 3.67% 1128.94 3.75% 2.08% LT Non Domestic Consumers 2206.09 6.46% 1964.12 6.52% 0.95% Other LT Consumers 1022.41 3.00% 644.63 2.14% -28.51% Sub Total 19497.7
2 57.12% 18620.10 61.85% 8.28%
HT - I – Industrial
12095.09 35.43% 8791.74 29.20% -17.58%
HT - II – Others 1832.93 5.37% 1627.79 5.41% 0.69% Other HT 709.75 2.08% 1066.83 3.54% 70.43% Total 14637.7
7 42.88% 11486.36 38.15% -11.03%
Grand Total 34135.49
100.00%
30106.46
100.00%
From the above table it can be inferred that the HT industrial consumers are most affected due to change is sales mix. Due to the lower allocation of power, the HT consumers are not able to meet their power requirement. The Objector requests the Commission to direct the licensee to atleast maintain the sales mix approved by the Commission. The Petitioner wants to highlight the fact that increase in sales to lower tariff consumers while decreasing the sales mix to higher tariff consumers is the main reason for lower revenue realization. Due to the lower revenue

realization, the licensee is seeking the approval of the Commission for truing up of the revenue gap pertaining to shortfall in revenue. It will be the subsidizing consumers such as HT Industrial consumers that will be most affected in the form of increased tariffs due to truing up of this revenue shortfall. Therefore, due to the change in sales mix, the subsidizing consumers are being burdened significantly. Hence, the Objector prays to the Commission to:
• Direct the Petitioner to maintain the sales mix approved by the Commission.
• Any financial impacts due to changes in approved sales mix must not be passed on to the consumers.
B) Distribution Loss
In the ARR filed by the Petitioner, there are no separate estimates provided in the current filing for technical and commercial losses, except description of measures aimed at reduction of the same. The Objector requests the Hon’ble Commission to direct the CPDCL to separate the technical and commercial losses and submit along with ARR, separate individual estimates on technical and commercial losses. The Petitioner has always been unable to meet the loss reduction target set by the Commission in previous years. This can be observed from the table below: Table 28: Actual and approved distribution loss Year Loss Target as per
APERC Approved
Actual
Excl. EHT
Incl. EHT
Excl. EHT
Incl. EHT
(%) (%) (%) (%) APCPDCL 2009-10
13.04 11.51 18.41 16.67
2010-11
14.71 13.10 17.34 15.67
2011-12
13.86 12.34 18.13 16.36
2012-13
13.67 12.18 16.26 14.78
2013-14
12.84 11.44 13.39 12.00
APSPDCL
2009-10
14.50 13.00 14.03 12.98
2010-11
13.37 12.23 13.37 12.21
2011-12
12.18 11.19 12.53 11.29
2012-13
11.82 10.71 11.85 10.70
The licensee is striving to reduce the losses by the implementation of loss reduction measures like strengthening of the network infrastructure, addition of network elements, and vigorously undertaking the Energy Audit to keep a close tab on the losses. The licensee projected following loss reduction targets for the third control period by undertaking the above mentioned measures. Hence, the licensee humbly requests the Hon’ble Commission to approve the loss trajectory as given in the below table.
Losses FY
13-14
FY
14-
15
FY
15-
16
FY
16-
17
FY
17-
18
FY
18-
19
LT Loss
(%) 5.87%
5.69%
5.50%
5.33%
5.16%
4.99%
11 kV
Loss (%) 4.50%
4.41%
4.33%
4.24%
4.15%
4.07%
33 kV
Loss (%) 4.21%
4.03%
3.86%
3.70%
3.54%
3.40%

2013-14
11.61 10.52 11.65 10.51
APEPDCL
2009-10
11.14 8.82 10.43 8.45
2010-11
10.80 8.81 8.75 6.96
2011-12
10.54 8.55 10.37 8.40
2012-13
10.41 8.42 12.17 9.38
2013-14
10.22 8.26 13.53 10.76
APNPDPL 2009-10
18.76
15.80
16.43
14.53
2010-11
16.92
14.47
15.95
14.21
2011-12
15.38
13.33
15.63
14.02
2012-13
13.99
12.36
15.06
13.37
2013-14
13.45
11.88
13.44
11.91
It can be seen from the above Table that all the four Distribution Utilities have higher actual losses than that approved by the Commission for FY 2013-14. It is brought to the notice of the Hon’ble Commission that the Hon’ble Appellate Tribunal for Electricity in a ruling has held that once a target is set by the appropriate Commission for loss reduction, the utility is bound to achieve those targets. The Objector would also like to bring to the notice of the Hon’ble Commission that the Petitioner, in its petition has requested “to consider loss reduction strategy projected by the Petitioner based on actual losses. If the request of the petitioner is to be considered, the consumers will be affected in the form of increased power purchase cost due to in-efficiency of the Petitioner in arresting the distribution losses. It is pertinent to mention that distribution loss is a controllable factor and under MYT framework Commission must set appropriate targets for reducing these distribution loss. The Objector would also like to bring to the notice of the Hon’ble Commission the methodology suggested by the Sub-Committee of Forum of Regulators on, ‘Methods of Loss Reduction’ wherein it is suggested that “loss reduction target of not less than 10% of the current level to be set”. Considering the above fact, the Objector requests the Hon’ble Commission to set a loss reduction target for third control period with a reduction target of atleast 2% from the approved loss target of the preceding year. Based the above submissions, the Objector prays to the Commission to approve distribution loss as per the below tables. This

would have obvious implications on power purchase allowable and resultant cost of power purchase allowable in the ARR of the Petitioner. Table 29: Loss reduction strategy proposed by Objector (Excluding EHT sales) Particulars APCPD
CL APEPDCL
APNPDCL
APSPDCL
2014-15 (Proposed by Petitioner)
16.73% 11.56% 13.85% 12.05%
2013-14 (Approved by the Commission)
12.84% 10.22% 13.45% 11.61%
Loss reduction trajectory proposed by Objector
2014-15 12.58% 10.02% 13.18%
11.38%
2015-16 12.33% 9.82% 12.92%
11.15%
2016-17 12.08% 9.62% 12.66%
10.93%
2017-18 11.84% 9.43% 12.41%
10.71%
2018-19 11.61% 9.24% 12.16%
10.49%
Table 30: Loss reduction strategy proposed by Objector (Including EHT sales) Particulars APCPD
CL APEPDCL
APNPDCL
APSPDCL
2014-15 (Proposed by Petitioner) 14.46% 9.03% 12.22%
10.50%
2013-14 (Approved by the Commission) 11.44% 8.26% 11.88%
10.52%
Loss reduction trajectory proposed by Objector 2014-15
11.21% 8.09% 11.64% 10.31%
2015-16 10.99% 7.93% 11.41%
10.10%
2016-17 10.77% 7.77% 11.18%
9.90%
2017-18 10.55% 7.62% 10.96%
9.70%
2018-19 10.34% 7.47% 10.74%
9.51%
The Hon’ble Commission is also requested to scrutinise this serious issue carefully, and immediately conduct an independent study

of the Petitioner’s system to determine technical and commercial losses. The Objector is also of the view that there are inefficiencies in controlling the losses, in particular commercial losses, and these are being indirectly loaded onto the subsidising consumers as increase in tariffs for making good the additional cost of power purchase.
C) Power Purchase Requirement and
Expenses The quantum of power required to meet the state’s demand is estimated to be 99,046 MUs for FY 2014-15. However, the power available from various sources has been insufficient to meet the requirements. The following table details the projections of energy availability from various energy sources as per the Petition Table 31: Source wise energy availability (MUs) Source FY 2014-
15 APGENCO - Thermal 40,799 - Hydro 6,958 Central Generation Station (CGS)
26,272
APGPCL (Gas) 208 IPPs 3,787 NCE 3,070 Others * 4,694 Total Energy Available 85,778 Bilateral purchases 12,973 RLNG 491 Total 99252
* Others include Medium term purchase, mini power plants such as LVS, Hinduja and Srivathsa The power purchase cost estimated by the Petitioner is given in table below. It can be observed that there is a difference of 206 MUs in energy availability as per Table 34 and power purchase as per Table 35. The major difference is in energy procured in non-conventional energy sources. It is not understood why the licensees prefer costlier power of RLNG to non-conventional energy sources. It is also highlighted that non-conventional energy sources are must run plants and must not be subjected to merit order principle. Objector requests the Commission to look into this discrepancy while approving the power purchase cost. The Petitioner has proposed to claim income tax and incentives under other costs for APGENCO and CGS plants. As per APERC Regulation 1 of 2008, income tax is a part of fixed costs. Therefore, Objector requests the Commission to verify whether these expenses are not double accounted i.e. in fixed costs and in other costs. Table 32: Source wise power purchase cost for FY 2014-15 - As per Petition Generating Station
Power Purchase Costs - FY 2014-15
It is to be noted that the energy demand is not uniform across the months. Energy from RLNG is used only when energy from all other sources is exhausted.
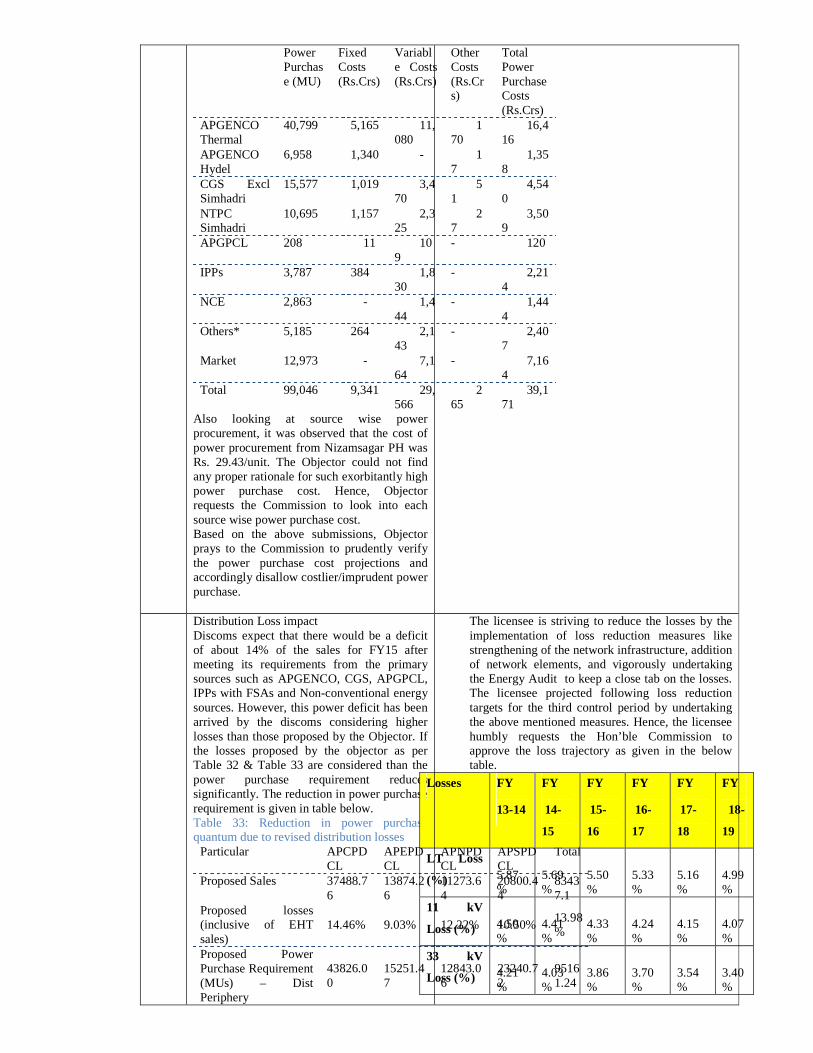
Power Purchase (MU)
Fixed Costs (Rs.Crs)
Variable Costs (Rs.Crs)
Other Costs (Rs.Crs)
Total Power Purchase Costs (Rs.Crs)
APGENCO Thermal
40,799 5,165 11,080
170
16,416
APGENCO Hydel
6,958 1,340 - 17
1,358
CGS Excl Simhadri
15,577 1,019 3,470
51
4,540
NTPC Simhadri
10,695 1,157 2,325
27
3,509
APGPCL 208 11 109
- 120
IPPs 3,787 384 1,830
- 2,214
NCE 2,863 - 1,444
- 1,444
Others* 5,185 264 2,143
- 2,407
Market 12,973 - 7,164
- 7,164
Total 99,046 9,341 29,566
265
39,171
Also looking at source wise power procurement, it was observed that the cost of power procurement from Nizamsagar PH was Rs. 29.43/unit. The Objector could not find any proper rationale for such exorbitantly high power purchase cost. Hence, Objector requests the Commission to look into each source wise power purchase cost. Based on the above submissions, Objector prays to the Commission to prudently verify the power purchase cost projections and accordingly disallow costlier/imprudent power purchase.
Distribution Loss impact Discoms expect that there would be a deficit of about 14% of the sales for FY15 after meeting its requirements from the primary sources such as APGENCO, CGS, APGPCL, IPPs with FSAs and Non-conventional energy sources. However, this power deficit has been arrived by the discoms considering higher losses than those proposed by the Objector. If the losses proposed by the objector as per Table 32 & Table 33 are considered than the power purchase requirement reduces significantly. The reduction in power purchase requirement is given in table below. Table 33: Reduction in power purchase quantum due to revised distribution losses Particular APCPD
CL APEPDCL
APNPDCL
APSPDCL
Total
Proposed Sales 37488.76
13874.26
11273.64
20800.44
83437.1
Proposed losses (inclusive of EHT sales)
14.46% 9.03% 12.22% 10.50% 13.98%
Proposed Power Purchase Requirement (MUs) – Dist Periphery
43826.00
15251.47
12843.06
23240.72
95161.24
The licensee is striving to reduce the losses by the implementation of loss reduction measures like strengthening of the network infrastructure, addition of network elements, and vigorously undertaking the Energy Audit to keep a close tab on the losses. The licensee projected following loss reduction targets for the third control period by undertaking the above mentioned measures. Hence, the licensee humbly requests the Hon’ble Commission to approve the loss trajectory as given in the below table.
Losses FY
13-14
FY
14-
15
FY
15-
16
FY
16-
17
FY
17-
18
FY
18-
19
LT Loss
(%) 5.87%
5.69%
5.50%
5.33%
5.16%
4.99%
11 kV
Loss (%) 4.50%
4.41%
4.33%
4.24%
4.15%
4.07%
33 kV
Loss (%) 4.21%
4.03%
3.86%
3.70%
3.54%
3.40%

Proposed losses (inclusive of EHT sales) - By Objector
11.21% 8.09% 11.64% 10.31% 10.54%
Revised Power Purchase Requirement - By Objector
42221.83
15095.48
12758.76
23191.48
93267.55
Decrease in Power Purchase Requirement (MUs)
1604.17 155.98 84.30 49.23 1893.69
Therefore, 1894 MUs need not be purchased if the Commission approves the distribution loss trajectory as proposed by the Objector. The Objector has estimated the reduction in power purchase cost based on merit order principle. Under merit order principle, the costlier power (except for must run plants i.e. renewable and nuclear) based on variable power purchase cost will be disallowed. Considering this principle, the disallowed power purchase quantum and cost is tabulated below: Table 34: Disallowed Power Purchase for FY 2015 Source Units
(MUs)
Per Unit Cost (Rs./Unit)
Cost (Rs. Cr)
RLNG 491 12.00 589.20
Market 1403 5.52 774.46
Total 1894 7.20 1363.66
In view of the above, the Objector requests the Hon’ble Commission to disallow 1894 MU and reduce the power procurement cost to the extent of Rs.1363.66 Crores.
Price Cap - Market According to the orders passed by the Commission for the purpose of Fuel Surcharge Adjustment, a cap of Rs.5.50 per unit was set in order to ensure that the additional cost of procurement over and above the ceiling price is not loaded onto the consumers. It has been observed that the power from other sources has been projected to be purchased at Rs.5.52 per unit. As the Commission has set a cap of Rs.5.50 per unit for such purchases, it is prudent to apply the same on purchases from market. . In addition with southern grid being connected with national grid, power can also be procured from power surplus states such as Haryana. With more power purchase options available, Petitioner should explore all options and ensure that costlier power purchase is not made. Table 35: Estimated reduction of cost of power purchased from Market Parameter FY2014-
15 Quantum of power purchased from market (in MUs)
12,973
Disallowed power purchase from market (in MUs)
1403
Allowable power purchase from market (in 11,570
For H1 FY 13-14, the Discoms have purchased total of 6,478 MU from bilateral sources @ Rs. 5.52/Unit which explains the projection of 12,973 MU for FY 14-15. The licensee requests the Hon’ble Commission to accept this prices for purchase of power from bilateral sources
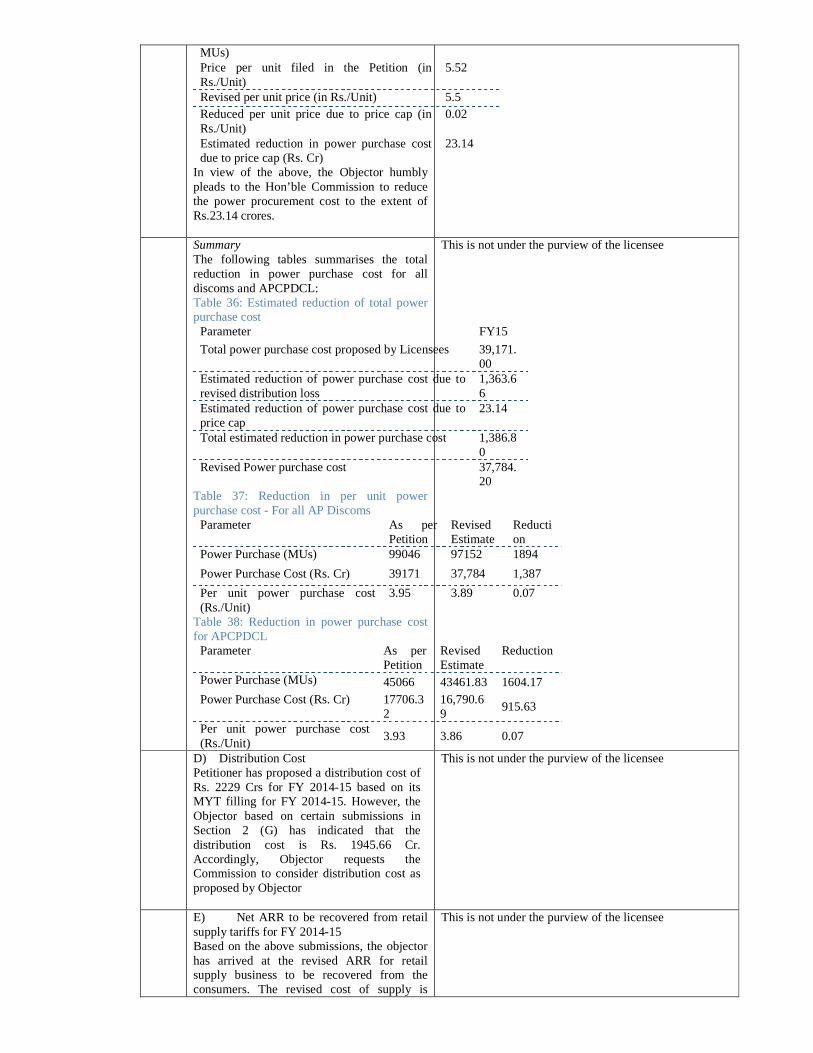
MUs) Price per unit filed in the Petition (in Rs./Unit)
5.52
Revised per unit price (in Rs./Unit) 5.5 Reduced per unit price due to price cap (in Rs./Unit)
0.02
Estimated reduction in power purchase cost due to price cap (Rs. Cr)
23.14
In view of the above, the Objector humbly pleads to the Hon’ble Commission to reduce the power procurement cost to the extent of Rs.23.14 crores.
Summary The following tables summarises the total reduction in power purchase cost for all discoms and APCPDCL: Table 36: Estimated reduction of total power purchase cost Parameter FY15
Total power purchase cost proposed by Licensees 39,171.00
Estimated reduction of power purchase cost due to revised distribution loss
1,363.66
Estimated reduction of power purchase cost due to price cap
23.14
Total estimated reduction in power purchase cost 1,386.80
Revised Power purchase cost 37,784.20
Table 37: Reduction in per unit power purchase cost - For all AP Discoms Parameter As per
Petition Revised Estimate
Reduction
Power Purchase (MUs) 99046 97152 1894
Power Purchase Cost (Rs. Cr) 39171 37,784 1,387
Per unit power purchase cost (Rs./Unit)
3.95 3.89 0.07
Table 38: Reduction in power purchase cost for APCPDCL Parameter As per
Petition Revised Estimate
Reduction
Power Purchase (MUs) 45066 43461.83 1604.17 Power Purchase Cost (Rs. Cr) 17706.3
2 16,790.69
915.63
Per unit power purchase cost (Rs./Unit)
3.93 3.86 0.07
This is not under the purview of the licensee
D) Distribution Cost Petitioner has proposed a distribution cost of Rs. 2229 Crs for FY 2014-15 based on its MYT filling for FY 2014-15. However, the Objector based on certain submissions in Section 2 (G) has indicated that the distribution cost is Rs. 1945.66 Cr. Accordingly, Objector requests the Commission to consider distribution cost as proposed by Objector
This is not under the purview of the licensee
E) Net ARR to be recovered from retail supply tariffs for FY 2014-15 Based on the above submissions, the objector has arrived at the revised ARR for retail supply business to be recovered from the consumers. The revised cost of supply is
This is not under the purview of the licensee
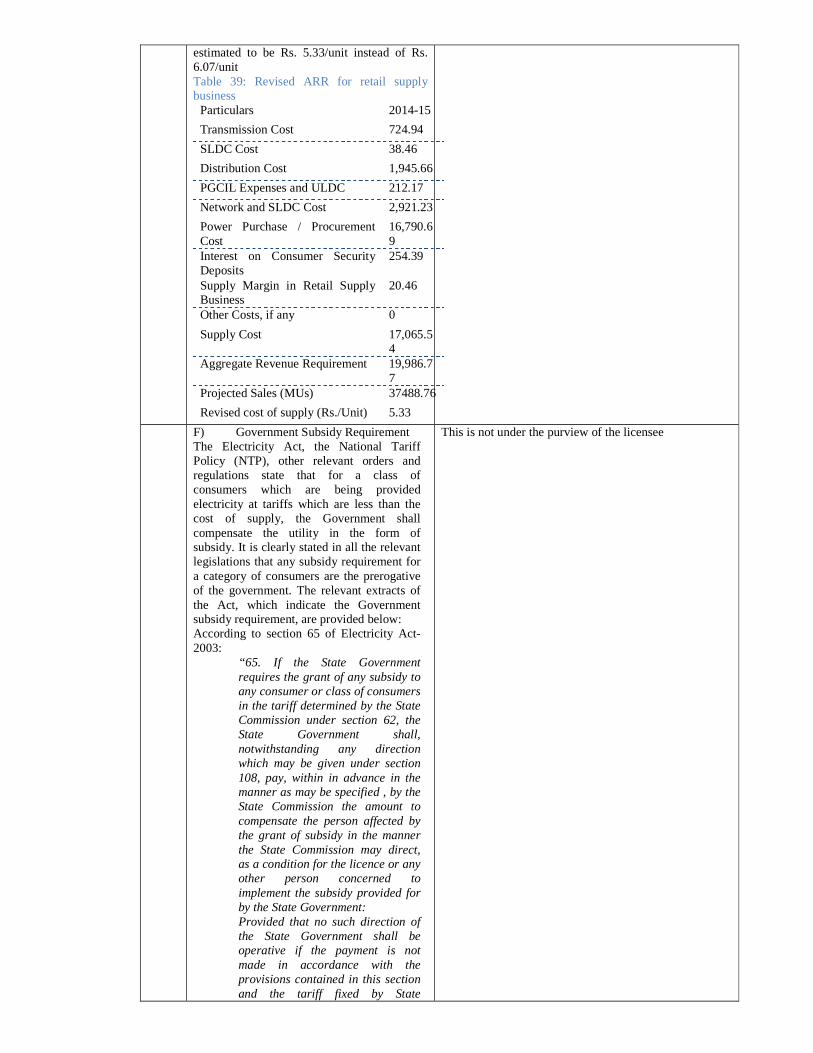
estimated to be Rs. 5.33/unit instead of Rs. 6.07/unit Table 39: Revised ARR for retail supply business Particulars 2014-15
Transmission Cost 724.94
SLDC Cost 38.46
Distribution Cost 1,945.66
PGCIL Expenses and ULDC 212.17
Network and SLDC Cost 2,921.23
Power Purchase / Procurement Cost
16,790.69
Interest on Consumer Security Deposits
254.39
Supply Margin in Retail Supply Business
20.46
Other Costs, if any 0
Supply Cost 17,065.54
Aggregate Revenue Requirement 19,986.77
Projected Sales (MUs) 37488.76
Revised cost of supply (Rs./Unit) 5.33
F) Government Subsidy Requirement The Electricity Act, the National Tariff Policy (NTP), other relevant orders and regulations state that for a class of consumers which are being provided electricity at tariffs which are less than the cost of supply, the Government shall compensate the utility in the form of subsidy. It is clearly stated in all the relevant legislations that any subsidy requirement for a category of consumers are the prerogative of the government. The relevant extracts of the Act, which indicate the Government subsidy requirement, are provided below: According to section 65 of Electricity Act-2003:
“65. If the State Government requires the grant of any subsidy to any consumer or class of consumers in the tariff determined by the State Commission under section 62, the State Government shall, notwithstanding any direction which may be given under section 108, pay, within in advance in the manner as may be specified , by the State Commission the amount to compensate the person affected by the grant of subsidy in the manner the State Commission may direct, as a condition for the licence or any other person concerned to implement the subsidy provided for by the State Government: Provided that no such direction of the State Government shall be operative if the payment is not made in accordance with the provisions contained in this section and the tariff fixed by State
This is not under the purview of the licensee

Commission shall be applicable from the date of issue of orders by the Commission in this regard.”
Further, the National Tariff Policy 2006 is instructive on the modality of implementation of subsidy decisions of the Government. Relevant sections are reproduced below for easy reference Clause 8.2.1 (3) of NTP:
“Section 65 of the Act provides that no direction of the State Government regarding grant of subsidy to consumers in the tariff determined by the State Commission shall be operative if the payment on account of subsidy as decided by the State Commission is not made to the utilities and the tariff fixed by the State Commission shall be applicable from the date of issue of orders by the Commission in this regard. The State Commissions should ensure compliance of this provision of law to ensure financial viability of the utilities. To ensure implementation of the provision of the law, the State Commission should determine the tariff initially, without considering the subsidy commitment by the State Government and subsidised tariff shall be arrived at thereafter considering the subsidy by the State Government for the respective categories of consumers.” Based on the above it is submitted that Hon’ble Commission should determine cost based tariffs and if the government wants to subsidise a category of consumers it might do so based on the provisions of the Act and the Tariff Policy. The Hon’ble Commission shall function as an independent body and ensure that the Act and the Policies are rightly enforced. This will ensure that the tariff hike for industry is curtailed as industrial and commercial consumer shall not bear the brunt of the shortfall in subsidy by the Government. Government of Andhra Pradesh is providing subsidy for domestic and agriculture consumers. Based on category wise cost of supply and revenue recovery, the subsidy required for these consumer categories is tabulated below: Table 40: Subsidy Requirement (Rs. Cr)
APCPDCL AP Discoms Category
Cost of Service
Net Revenue
Subsidy Requirement
Cost of Service
Net Revenue
Subsidy Requirement
Domestic 5647.38 4476.67 1170.71
14396.32
10348.63 4047.69
Agriculture 6326.30 50.18 6276.12
14656.58 140.55 14516.03
Total 11973.68 4526.85 7446.83 29052.9
10489.18 18563.72
Another provision of the NTP 2006 is of relevant interest is reproduced below:
“In accordance with the National Electricity Policy, consumers below poverty line who consume below a

specified level, say 30 units per month, may receive a special support through cross subsidy. Tariffs for such designated group of consumers will be at least 50% of the average cost of supply. This provision will be re-examined after five years. For achieving the objective that the tariff progressively reflects the cost of supply of electricity, the SERC would notify roadmap within six months with a target that latest by the end of year 2010-2011 tariffs are within ± 20 % of the average cost of supply. The road map would also have intermediate milestones, based on the approach of a gradual reduction in cross subsidy”
Hence, Objector has considered 80% of average CoS as agriculture consumers’ tariff. The Objector has determined the Agriculture subsidy considering the average cost of supply proposed by the Petitioner as well the revised cost of supply arrived by the Objector. The Govt subsidy requirement is calculated in below table: Table 41: Government subsidy requirement for APCPDCL - FY 2014-15 Parameter As Per
Petition Revised Estimate - Objector
Average Cost of Supply 6.07 5.33 Agriculture Tariff (80% of average CoS)
4.86 4.27
Agriculture Consumption (MUs)
9586 9586
Revenue to be recovered from Ag Consumers (Rs. Cr)
4655 4089
Projected revenue to be recovered from Ag consumers (Rs. Cr)
50 50
Govt Subsidy required (Rs. Cr)
4605 4039
As can be seen from the above table, the government subsidy requirement for the APCDCL for FY 2014-15 is Rs. 4039 Cr.
• Attention is invited to an important Appellate Tribunal judgement. The judgement is in Appeal No.131 of 2005 and is dated 31/3/2006. The Parties are DERC, BSES, Rajdhani Power Limited and Udyog Nagar Factory Owners Association. The order basing its arguments on Section 61 and 65, of the Electricity Act, The National Electricity Policy and National Tariff Policy of the Government of India directs as follows:
‘In case the State Government requires the grant of subsidy to any consumer or class of consumers, it shall pay in advance, the amount of the subsidy in the manner the State Commission may direct.

In case the State Government requires the grant of subsidy to any consumer or class of consumers but the state government fails to make the payment of the subsidy amount, the directions of the State Government shall not be operative. Cross subsidy needs to be reduced progressively within the period specified by the appropriate commission.’ • Attention is furthermore
invited to Hon’ble APERC Tariff Order for 2004-05, which states that the Commission approved the revenue and sales to agricultural consumers and then approves the subsidy and does not allow for any further increased sales to this category of consumers. APERC subsidy administration mechanism for agricultural consumers: 2004-05 Tariff order ‘The GOAP obligation towards subsidy payments to DISCOMs is limited to the quantities mentioned in this order. If the DISCOMs exceed tariff order quantities and thus the subsidy requirement, the Commission will not entertain any request for additional quantities of energy to subsidized categories unless the permission of the GoAP is taken for additional subsidy if the excess consumption relates to agriculture. In other categories, if there is excess consumption, no additional subsidy will be recommended by the Commission to GoAP.
Keeping in view the above submissions, figures and the relevant observations of the Appellate Tribunal and other Regulatory Commissions, , it is very clear that for any additional sale to the subsidised consumers the government has to release additional subsidy. The Hon’ble Commission itself has stated this in its orders but failed to implement it by seeking additional subsidy. The Objector strongly requests the Commission to direct the Government to release the additional subsidy required by the licensee for sale of additional power to agriculture consumers during the first control period, along with carrying cost at average interest rate of CPDCL.
Revenue to be recovered from consumers Considering the ARR re-determined in Section 4(E) and Government subsidy requirement estimated in Section 4(F), the Objector has arrived at the revenue to be recovered from consumers for FY 2014-15. Table 42: Estimated revenue required from consumers after considering Govt Subsidy Parameter Value Re-Determined ARR (Rs. Cr) 19,986.7
7
This is not under the purview of the licensee
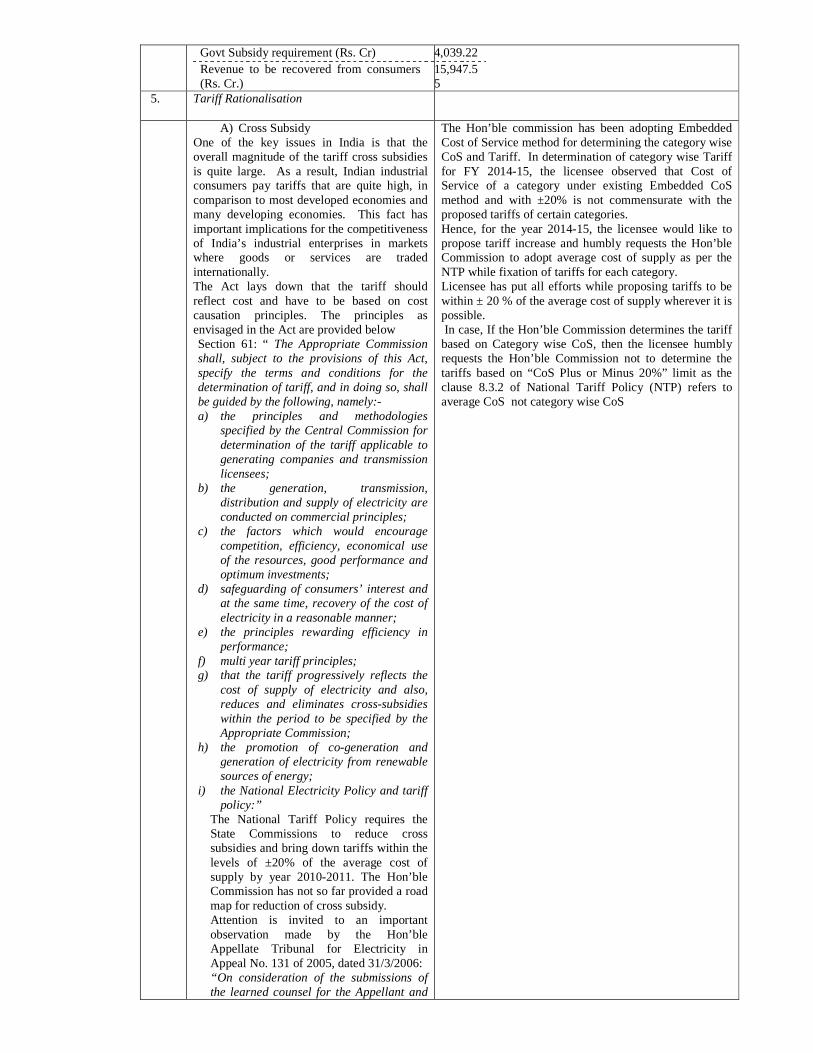
Govt Subsidy requirement (Rs. Cr) 4,039.22 Revenue to be recovered from consumers (Rs. Cr.)
15,947.55
5. Tariff Rationalisation
A) Cross Subsidy One of the key issues in India is that the overall magnitude of the tariff cross subsidies is quite large. As a result, Indian industrial consumers pay tariffs that are quite high, in comparison to most developed economies and many developing economies. This fact has important implications for the competitiveness of India’s industrial enterprises in markets where goods or services are traded internationally. The Act lays down that the tariff should reflect cost and have to be based on cost causation principles. The principles as envisaged in the Act are provided below Section 61: “ The Appropriate Commission shall, subject to the provisions of this Act, specify the terms and conditions for the determination of tariff, and in doing so, shall be guided by the following, namely:- a) the principles and methodologies
specified by the Central Commission for determination of the tariff applicable to generating companies and transmission licensees;
b) the generation, transmission, distribution and supply of electricity are conducted on commercial principles;
c) the factors which would encourage competition, efficiency, economical use of the resources, good performance and optimum investments;
d) safeguarding of consumers’ interest and at the same time, recovery of the cost of electricity in a reasonable manner;
e) the principles rewarding efficiency in performance;
f) multi year tariff principles; g) that the tariff progressively reflects the
cost of supply of electricity and also, reduces and eliminates cross-subsidies within the period to be specified by the Appropriate Commission;
h) the promotion of co-generation and generation of electricity from renewable sources of energy;
i) the National Electricity Policy and tariff policy:”
The National Tariff Policy requires the State Commissions to reduce cross subsidies and bring down tariffs within the levels of ±20% of the average cost of supply by year 2010-2011. The Hon’ble Commission has not so far provided a road map for reduction of cross subsidy. Attention is invited to an important observation made by the Hon’ble Appellate Tribunal for Electricity in Appeal No. 131 of 2005, dated 31/3/2006: “On consideration of the submissions of the learned counsel for the Appellant and
The Hon’ble commission has been adopting Embedded Cost of Service method for determining the category wise CoS and Tariff. In determination of category wise Tariff for FY 2014-15, the licensee observed that Cost of Service of a category under existing Embedded CoS method and with ±20% is not commensurate with the proposed tariffs of certain categories. Hence, for the year 2014-15, the licensee would like to propose tariff increase and humbly requests the Hon’ble Commission to adopt average cost of supply as per the NTP while fixation of tariffs for each category. Licensee has put all efforts while proposing tariffs to be within ± 20 % of the average cost of supply wherever it is possible. In case, If the Hon’ble Commission determines the tariff based on Category wise CoS, then the licensee humbly requests the Hon’ble Commission not to determine the tariffs based on “CoS Plus or Minus 20%” limit as the clause 8.3.2 of National Tariff Policy (NTP) refers to average CoS not category wise CoS

Respondents, the provisions of the Electricity Act 2003, the National Electricity and Tariff Policies, we are of the view that the cross-subsidies can only be gradually reduced and brought to the levels envisaged by the Act and the Tariff Policy. ” From a plain reading of the Hon’ble Tribunal above order, it is evident that the cross-subsidies cannot be increased and the Commission should ensure reduction of cross-subsidies. The Objector wants to put it across to the Hon’ble Commission that the Petitioners is not making any effort to reduce cross subsidies as per the principles of the Act and the National Tariff Policy. In the same Tribunal’s order it is further stated that “there is an urgent need for ensuring recovery of cost of service from consumers to make the power sector sustainable”. In effect the Commission should adopt category-wise Cost of Service determination and fix tariffs to recover costs based on this. The Objector would like to bring to the notice of the Hon’ble Commission that though the Petitioner has calculated the Category-wise CoS for all classes of consumers, it has not used the same to determine tariffs. This renders the exercise of calculating the Category-wise CoS futile and misleading. Further the Petitioner’s has not been able to adhere to even the mandate by the NTP of designing tariff at ± 20 % of the average cost of supply. The table below captures net cross subsidy provided by the industrial consumers. Major subsidizing consumers such as industrial consumers in APCPDCL provide a cross subsidy to the tune of Rs. 5334.97 Crs, which amounts to 61% of cost of service.
Table 43: Consumer Category wise Cross Subsidy for FY 2014-15 (APCPDCL) Consumer Category
Net Revenue
Cost of Service
Cross Subsidy
Domestic 4476.67 5647.38 -1170.71
LT Agriculture 50.18 6326.3 -6276.12
LT Non Domestic
2469.25 1475.87 993.38
LT Industry 971.65 745.43 226.22
HT I Industry (11 kV)
2818.49 1729.24 1089.25
HT I Industry (33 kV)
3545.81 2269.96 1275.85
HT I Industry (132 kV)
2311.92 1501.27 810.65
HT II (11 kV) 1397.09 732.56 664.53
HT II (33 kV) 574.33 323.11 251.22
HT III (132 kV) 45.90 22.03 23.87
Total Industrial and Commercial Consumers
14134.44 8799.47 5334.97
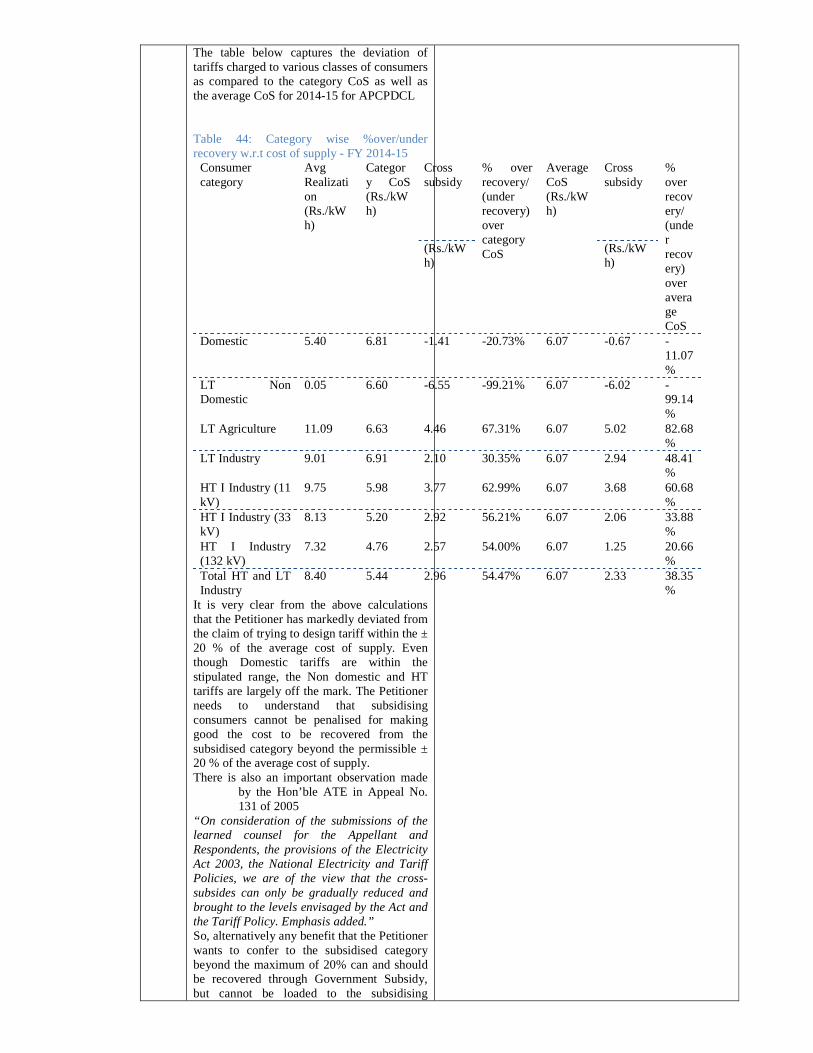
The table below captures the deviation of tariffs charged to various classes of consumers as compared to the category CoS as well as the average CoS for 2014-15 for APCPDCL Table 44: Category wise %over/under recovery w.r.t cost of supply - FY 2014-15
Cross subsidy
Cross subsidy
Consumer category
Avg Realization (Rs./kWh)
Category CoS (Rs./kWh)
(Rs./kWh)
% over recovery/ (under recovery) over category CoS
Average CoS (Rs./kWh)
(Rs./kWh)
% over recovery/ (under recovery) over average CoS
Domestic 5.40 6.81 -1.41 -20.73% 6.07 -0.67 -11.07%
LT Non Domestic
0.05 6.60 -6.55 -99.21% 6.07 -6.02 -99.14%
LT Agriculture 11.09 6.63 4.46 67.31% 6.07 5.02 82.68%
LT Industry 9.01 6.91 2.10 30.35% 6.07 2.94 48.41%
HT I Industry (11 kV)
9.75 5.98 3.77 62.99% 6.07 3.68 60.68%
HT I Industry (33 kV)
8.13 5.20 2.92 56.21% 6.07 2.06 33.88%
HT I Industry (132 kV)
7.32 4.76 2.57 54.00% 6.07 1.25 20.66%
Total HT and LT Industry
8.40 5.44 2.96 54.47% 6.07 2.33 38.35%
It is very clear from the above calculations that the Petitioner has markedly deviated from the claim of trying to design tariff within the ± 20 % of the average cost of supply. Even though Domestic tariffs are within the stipulated range, the Non domestic and HT tariffs are largely off the mark. The Petitioner needs to understand that subsidising consumers cannot be penalised for making good the cost to be recovered from the subsidised category beyond the permissible ± 20 % of the average cost of supply. There is also an important observation made
by the Hon’ble ATE in Appeal No. 131 of 2005
“On consideration of the submissions of the learned counsel for the Appellant and Respondents, the provisions of the Electricity Act 2003, the National Electricity and Tariff Policies, we are of the view that the cross-subsides can only be gradually reduced and brought to the levels envisaged by the Act and the Tariff Policy. Emphasis added.” So, alternatively any benefit that the Petitioner wants to confer to the subsidised category beyond the maximum of 20% can and should be recovered through Government Subsidy, but cannot be loaded to the subsidising

consumers. Based on the above submissions, the Objector strongly put forth its objection to the Hon’ble Commission that the tariffs should ideally be designed based on category-wise Cost of Supply and keeping in view the allowable cross subsidy component.
B) Significant Tariff Increase The Petitioner has proposed a significant tariff increase across all the consumer categories. The Revenue to the Petitioner at the current tariff is Rs. 17244.23 Crs and the Petitioner will receive additional revenue of Rs. 4296.15 Crs because of the proposed tariff increase, contributing to 25% increase in tariffs. Tariff for industrial consumers has been increased across all key components of tariff i.e. energy charges, demand charges etc. A comparison of the existing and proposed Tariff for HT and LT industrial consumers is given in below tables. Table 45: Comparison of existing and proposed tariff for HT industrial consumers Type of Charge
Existing Proposed Percentage increase
Energy Charges
11kV - Rs. 5.73/kVAh 33 kV - Rs. 5.30/kVAh 132 kV - Rs. 4.90/kVAh
11kV - Rs. 6.24/kVAh 33 kV - Rs. 5.79/kVAh 132 kV - Rs. 5.34/kVAh
9%
Demand Charges
Rs. 350/kVA/month
Rs. 600/kVA/Month
71%
Table 46: Comparison of existing and proposed tariff for LT industrial consumers Type of Charge
Existing Proposed Percentage increase
Energy Charges
Rs. 6.08 per unit
Rs. 7.03 per unit
16%
Demand Charges
Rs. 50/kW Rs. 150/kVA 200%
Table 47: Increase in Tariff - Per unit basis
Existing Proposed Percentage Increase Consumer Deman
d Charges (Rs./Unit)
Energy Charges (Rs./Unit)
Total
Demand Charges (Rs./Unit)
Energy Charges (Rs./Unit)
Total
Demand Charges (Rs./Unit)
Energy Charges (Rs./Unit)
Total
HT Industrial (33 kV)
1.22 5.30 6.52
2.08 5.79 7.87
70.49% 9.25% 20.71%
LT Industrial
0.58 6.08 6.66
1.74 7.03 8.77
200.00%
15.63% 31.65%
*For calculation of effective tariff load factor of 40% and 12% has been considered for HT industrial and LT industrial consumers respectively. To indicate the level of increase of industrial tariffs in Andhra Pradesh, the year on year
Due to the increase in average cost of service from Rs 5.25/Unit as approved in Tariff Order 2013-14 to Rs. 6.32/Unit as filed in ARR for FY 2014-15, the Licensee are forced to increase in Tariffs for certain categories of consumers for FY 2014-15. The increase in CoS is mainly because of increase in Power Purchase cost, increased Network Cost, considering of truing up gap of the Distribution Business for the Second Control period including the carrying cost and considering of Revenue deficit for the Retail Supply business for FY 13-14. Increase in the power purchase cost and corresponding cost of service lead to a revenue gap of Rs.2616 Cr (EPDCL) for the FY 2014-15. To reduce this revenue gap, the licensees are undertaking several energy conservation and loss reduction activities. But, without realistic revision in tariffs, these steps would fall short in bridging the revenue gap. Hence the licensees propose the tariff revisions for various categories.

tariff increase is compared with wholesale price index (WPI) of fuel and power, and all commodities. Compared to base value of April 2010, the LT industrial tariff and HT industrial tariff have increased to 217.14% and 228.28% of the base value (April 2010) respectively, while the WPI of fuel and power, and all commodities has increased to a mere 148.55% and 130.95% of the base value. Therefore, the Objector is of the view that there is no rational for such steep increase in energy charges of industrial consumers wherein WPI index of fuel & power has increased only by 49% in the last four years Figure 1: Tariff (including FSA and other charges) increase comparison with WPI
*The WPI index for November 2013 is shown under - April 2013. Note: FSA of Rs. 0.15/unit , Rs. 0.36/unit and Rs. 1.33 per unit has been assumed for the months of April 2010, April 2011 and April 2012 respectively for comparison purposes.
Therefore, the exorbitant increase proposed by the Petitioner will result in tariff shock for the reliable, cross subsidising industrial consumers and Objector rejects at the threshold and outright the need for such an exorbitant increase tariffs. The proposed tariff hike will have a significant impact on the input cost of many Micro, Small and Medium Enterprises (MSME) for which power procurement costs correspond to large percentage of their input costs. Hence, considering the above facts, the Objector prays to the Commission to due-diligently verify the need for tariff increase and set the industrial tariff as per Electricity Act such that the industrial tariffs are within +/- 20% of the average cost of supply. Also, to indicate the extent to which the power tariffs for HT industrial consumers have increase, the Objector has compared the HT industrial tariffs (33 kV) with those applicable in other states. It can also be observed form the below table that the

tariffs are highest for industrial consumers in the state of Andhra Pradesh Table 48: Comparision of HT industrial Tariff (For a 5 MVA consumer, 0.99 PF, 40% load factor, connected at 33 kV)
State Effective tariff (including all charges and incentives in Rs./Unit)
Andhra Pradesh 8.09
Gujarat* 6.77
Tamil Nadu 6.57
Karnataka 5.83
Odisha 5.57
*Including applicable FSA
C) Increase in Demand Charges D) Increase in Demand Charges
Petitioner has proposed to make following changes in levy of demand charges
• To significantly increase the demand charges
• To levy demand charges on 100% of contract demand
Objector out rightly rejects the following changes on account of following submissions Increase in Demand Charges
a) The proposed demand charge for HT Industrial consumers for FY 2014-15 is Rs.600/kVA/month. The existing applicable demand charge for HT Industrial consumers is Rs. 350/kVA/month. The proposed increase is 71% and when compared to the demand charges of other states, the proposed rates are the highest. Below table gives a comparison of Demand Charges is various states:
Table 49: Comparison of demand charges State Demand Charges
Andhra Pradesh (As per Tariff Petition) Rs. 600/kVA/Month Karnataka (As per Tariff Petition for FY 2013-14)
Rs. 170/kVA/Month
Tamil Nadu (TNERC order for 2013-14)
Rs. 300/kVA/Month
Gujarat (GERC order for 2012-13) For first 500 kVA - Rs. 120/kVA/month; Next 500 kVA - Rs. 230/kVA/month; Excess of 1000 kVA - Rs. 350/kVA/month
Maharashthra (MERC order for 2012-13)
Rs. 190/kVA/Month
Rajasthan (RERC order for FY 2013-14)
Rs. 140/kVA/Month
Uttarakhand (UERC Order for 2012-13) Rs. 260/kVA/Month
West Bengal (WBERC order for 2012-13)
Rs. 317/kVA/Month
Orissa (OERC order for 2012-13) Rs. 250/kVA/Month
b) Based on the contract
Further, The demand charges are meant for meeting the costs involved for making the availability of the require power in MW/MVA at the premises of the consumer round the clock. Demand charges include the fixed cost of network involved in transmitting the power and the fixed cost of the generators which have contract with the licensees to generate that power. For FY 14-15, the total Demand related costs for both HT and LT categories as projected at the state level is Rs. 19,364 Crs. It has been assumed that 35% of this total Demand related cost would be contributed/ allocated to HT categories which would be to around Rs 6,780 Crs. from all four Discoms. Based on the cost allocation and with contracted demand projected for FY 14-15, Demand charges to be recovered is around Rs. 520/kVA/Month. With the proposed increase in Demand charges by Rs. 250/kVA/ Month for all HT consumers and resetting billable demand to 100% of CMD, the weighted average realization from HT categories’ is estimated to be Rs. 528/ kVA/ Month. The DISCOM has to project and procure for the contracted demand of the consumer on 24 hr.s basis. The Licensee is incurring Distribution Net work expenditure whether the consumer utilizes the CMD or not. Hence, it is proposed to levy demand charges on 100% of CMD.

demand and projected sales, the load factor for HT industrial (33 kV and LT consumers is around 40% and 12% respectively. Considering this load factor of the industries, demand charges contribute to a significant portion of the total tariff. The existing and proposed demand charges on per unit basis are given in below table. It can be observed that the percentage contribution of demand charges has increased to 26% and 20% respectively for HT industrial and LT Industrial consumers in FY 2014-15. Objector requests the Hon’ble Commission to approve the demand charges in such a manner that they contribute at a similar level of total charges i.e. 18.65% and 8.69% respectively for HT Industrial and LT Industrial consumers.
Table 50: Demand and energy charges - Existing (For 1 kVA consumer for one month) Consumer
Demand Charges (Rs)
Units
Demand Charges (Rs./Unit)
Energy Charges (Rs./Unit)
Total % of demand charges
HT Industrial (33 kV)
350 288 1.22 5.30 6.52 18.65%
LT Industrial
50 86 0.58 6.08 6.66 8.69%
Table 51: Demand and energy charges - Proposed (For 1 kVA consumer for one month) Consumer
Demand Charges (Rs)
Units
Demand Charges (Rs./Unit)
Energy Charges (Rs./Unit)
Total
% of demand charges
HT Industrial (33 kV)
600 288 2.08 5.79 7.87 26.46%
LT Industrial
150 85 1.77 7.03 8.80 20.13%
c) It is pertinent to mention that in recent years the industrial consumers were subjected to severe load shedding. Due to this load shedding the consumers are not able to consumer more energy. So, these consumers are being burdened in terms of higher per unit demand charges on account of lower energy consumption. Objector requests the Commission not to increase the demand charges, since it is unfair to further burden the consumers affected by severe load shedding. Also, due to inking major portion of revenue recovery with energy charges, AP discoms will have have
an in-built incentive to supply more electricity and recover its fixed cost fully. This approach was adopted by MERC while issuing the FY 2008-09 tariff order and accordingly reduced the demand charges for HT industrial consumers to Rs. 150 per kVA from Rs. 300 per kVA. The relevant extracts of the MERC order are reproduced below: “The Commission has reduced the fixed charges/demand charges applicable for different consumer categories, and correspondingly increased the energy charges, so that the bills are more directly linked to the consumption. Economic theory states that the recovery of fixed costs through fixed charges should be increased, so that a reasonable portion of the fixed costs are recovered through the fixed charges. However, the ability of the Licensees to supply reasonably priced power on continuous basis has been eroded due to the stressed demand-supply position in recent times, and hence, the Commission has reduced the fixed charges. This will provide certain relief to the consumers who have lower load factor, as the consumers will be billed more for their actual consumption rather than the load, and the licensees also have an incentive to ensure that continuous 24 hour supply is given to the consumers. As and when sufficient power is available and contracted by the licensees, the fixed charges can again be increased, and energy charges reduced correspondingly.”
Therefore, Objector requests the Commission to consider above facts and prays to the Commission to not increase the demand charges.
Levy Demand Charges on 100% of contract
demand a) Petitioner proposes to levy
of Demand charges for HT consumers on a 100% of Contracted Demand Basis (CMD) and do away with the current practice of levying Demand charges basis on 80% of CMD or maximum demand. However, in changing this approach the Petitioner has failed to recognize the fact that the average load factors for HT consumers is in the range of 25 – 50%. The average load factor arrived considering the Petitioner’s projected sales and contract demand is tabulated below. So, considering actual load factor of industrial consumers, Objector wants to

highlight the fact that it is not appropriate for the Petitioner to charge on 100% of contract demand basis.
Table 52: Contract Demand, Sales and estimated load factor of HT industrial consumers for FY 2014-15
Contract Demand as per Petition (in MVA) Voltage APSPDCL
APCPDCL
APEPDCL
APNPDCL
Total
11 kV 609.68 1346.22 439.49 211.00 2606.39 33 kV 677.74 1363.55 288.85 48.51 2378.65 132 kV 470.23 818.73 669.28 120.78 2079.02 HT Industry
1757.65
3528.50 1397.62 380.29 7064.06
Sales as per Petition (in MUs) Voltage APSPDCL
APCPDCL
APEPDCL
APNPDCL
Total
11 kV 1276.98
2889.96 1067.10 491.68 5725.72
33 kV 2201.74
4363.54 1019.98 204.24 7789.50
132 kV 2090.41
3156.79 2611.55 557.38 8416.13
HT Industry
5569.13
10410.29
4698.63 1253.30 21931.35
Load Factor – Estimated Voltage APSPDCL
APCPDCL
APEPDCL
APNPDCL
Total
11 kV 23.91% 24.51% 27.72% 26.60% 25.08%
33 kV 37.09% 36.53% 40.31% 48.06% 37.38%
132 kV 50.75% 44.02% 44.54% 52.68% 46.21%
HT Industry
36.17% 33.68% 38.38% 37.62% 35.44%
b) The below table indicates the billing demand applicable for levy of demand charges in key states. None of these state charge demand charges on entire contract demand.
Table 53: Applicable billing demand in key states State Billing Demand
Karnataka The billing demand during unrestricted period shall be the maximum demand recorded during the month or 75% of the CD, whichever is higher.
Gujarat The billing demand during unrestricted period shall be the maximum demand recorded during the month or 85% of the CD, whichever is higher.
Maharashtra Actual Maximum Demand recorded in the month during 0600 hours to 2200 hours or 75% of the highest billing demand recorded during the preceding eleven months, subject to the limit of Contract Demand or 50% of the Contract Demand., whichever is higher
Rajasthan The billing demand during unrestricted period shall be the maximum demand recorded during the month or 75% of the CD, whichever is higher.
Based on the above submissions and

average load factor of the HT industrial consumers, Objector prays to the Commission not to increase billing demand to 100% of contract demand.
D) Harmonic Surcharge Petitioner has proposed to levy “Harmonic Surcharge” from FY 2014-15 for those who inject harmonics more than a permissible limit as stated by CEA from time to time. In case a consumer exceeds permissible limit, Licensee proposed to levy “compensation at 25% of energy charges of the respective category. Objector is of the view that this proposed surcharge is significantly high and following points must be considered by the Commission before approving the harmonic surcharge
a) Objector is of the view that before introducing this surcharge the Petitioner needs to carry out a comprehensive study in order to assess the existing harmonic levels in the system. This fact was also acknowledged by MERC through its order on Case No. 34 of 2011 dated 24 December 2012.
“The Commission is of the opinion that introduction of penalty for injection of the Harmonics at this stage will be premature. Instead of introduction of penalty, MSEDCL needs to analyze existing level of Harmonics in the system, causes and remedial measures for limiting the same. Further, MSEDCL needs to arrange program for creating awareness amongst the consumers about effects of Harmonics on the power equipments. “
b) To direct the Petitioner to measure the existing harmonics levels for industrial consumers after the completion of the study.
c) To direct the Petitioner to identify those consumers who are required to take remedial measures in getting the harmonics within prescribed limits.
d) To implement Harmonic Surcharge from FY 2015-16 after thoroughly reviewing the harmonic study
e) Instead of a flat surcharge of 25%, Commission is required to levy a slab wise surcharge ranging from 0-10% from FY 2014-15. Three slabs can be introduced depending upon the distortion levels
In order to improve overall power quality, there is a need to instill self discipline at the consumers end to prevent damage of licensee’s asset. Hence, Licensee would like to propose “Harmonic Surcharge” from FY 2014-15 for those who inject harmonics more than a permissible limit as stated by CEA from time to time. This is to prevent consumers from injecting odd harmonics in the power distribution system of Andhra Pradesh.
E) Load Factor Incentive The Commission has discontinued the load factor incentive from 1st August 2010. The Objector would like to submit that high Load Factor denotes that the system is best utilised and will benefit the system in terms of shifting the load to off-peak hours, reduction of losses, etc on account of high load factor. This point has been completely missed by the Petitioner in its filings and has decided not to
As the State is in a power deficit situation the load foactor incentives are not anticipated.
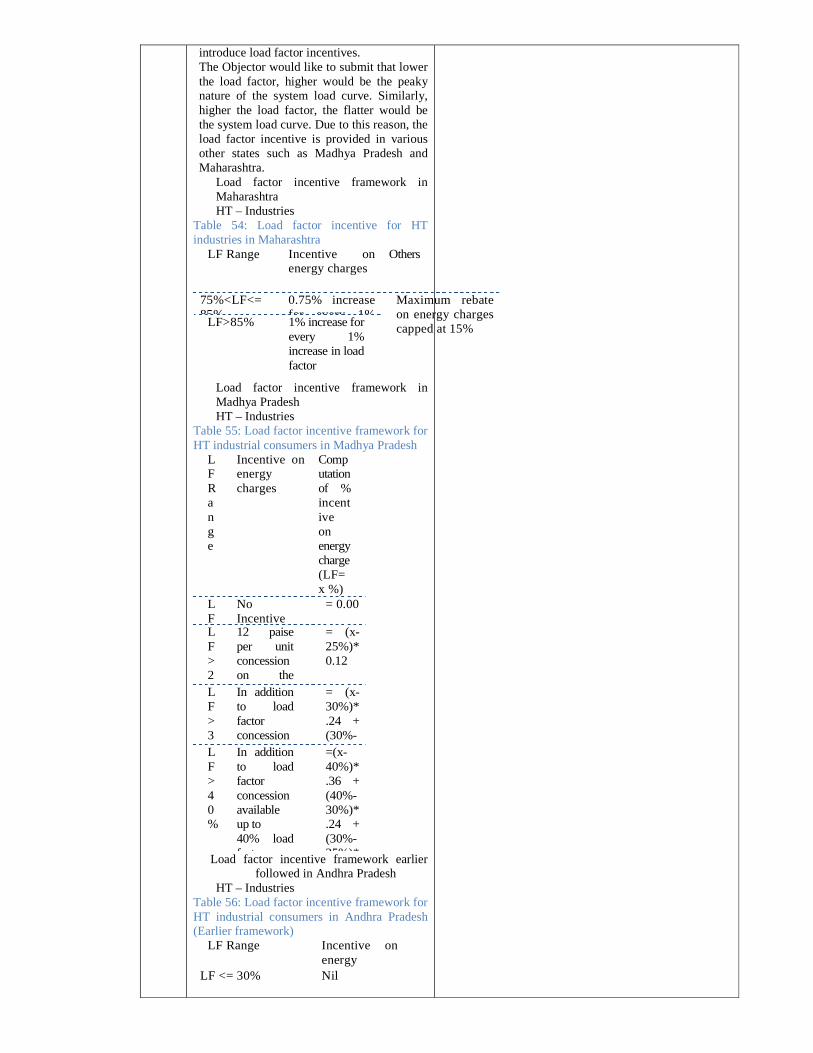
introduce load factor incentives. The Objector would like to submit that lower the load factor, higher would be the peaky nature of the system load curve. Similarly, higher the load factor, the flatter would be the system load curve. Due to this reason, the load factor incentive is provided in various other states such as Madhya Pradesh and Maharashtra.
Load factor incentive framework in Maharashtra HT – Industries
Table 54: Load factor incentive for HT industries in Maharashtra
LF Range Incentive on energy charges
Others
75%<LF<=85%
0.75% increase for every 1%
LF>85% 1% increase for every 1% increase in load factor
Maximum rebate on energy charges capped at 15%
Load factor incentive framework in Madhya Pradesh HT – Industries
Table 55: Load factor incentive framework for HT industrial consumers in Madhya Pradesh
LF Range
Incentive on energy charges
Computation of % incentive on energy charge (LF=x %)
LF
No Incentive
= 0.00
LF>25
12 paise per unit concession on the normal
= (x-25%)*0.12
LF>30
In addition to load factor concession available
= (x-30%)*.24 + (30%-25%)*L
F>40%
In addition to load factor concession available up to 40% load factor,
=(x-40%)*.36 + (40%-30%)*.24 + (30%-25%)*Load factor incentive framework earlier
followed in Andhra Pradesh HT – Industries
Table 56: Load factor incentive framework for HT industrial consumers in Andhra Pradesh (Earlier framework)
LF Range Incentive on energy charges LF <= 30% Nil

30%<LF<=50% 5%
50%<LF<=60% 10%
60%<LF<=70% 15%
LF>70% 20%
In this regard, Objector prays to the Hon’ble Commission to reconsider its position on the Load Factor incentive. It is appealed to the Commission that the presence of such a scheme would incentivise the industry to utilise its machinery in a better way thereby helping the Petitioner in flattening the load curve.
F) Time of Day Surcharge In order to shift the loads from peak
hours to off-peak hours, the Commission had introduced ToD tariff from 1st August 2010. However, the Commission has only approved an additional surcharge of Rs. 1.00 per unit during the peak hours and has not provided any rebate for consumption of power during the off-peak hours. As per section 62(3) of the Electricity Act 2003, the tariff should reflect cost and have to be based on cost causation principles. The Objector also feels that it is inappropriate and not in spirit with the Electricity Act 2003, to burden the consumers with additional surcharge during the peak hours and not providing any relief during the off-peak hours under ToD structure. Most of the states while introducing ToD tariffs have provided rebate during the off-peak hours while proposing additional surcharge during the peak hours as given in below table: Table 57: ToD tariff structure in different states State Surcharge Rebate
Tamil Nadu
6 AM to 9 AM and 6 PM to 9 PM- Rs. 1.1 per unit
From 10.00 PM to 5 AM - Rs. 0.28 per unit
Karnataka From 6 PM to 10 PM - Rs. 1.00 per unit
From 10.00 PM to 6 AM - Rs. 1.25 per unit
Maharashtra
From 9 AM to 12 PM – Rs. 0.80 per unit From 6 PM to 10 PM – Rs. 1.10 per unit
From 10.00 PM to 6 AM – Rs. 1.00 per unit
Gujarat From 7 AM to 11 AM and from 6 PM to 10 PM – Rs. 0.75 per unit
From 10.00 PM to 6 AM – Rs. 0.75 per unit (For energy consumption more than 1/3rd of total consumption)
Madhya Pradesh
From 6 PM to 10 PM – 15% of normal energy charges
From 10.00 PM to 6 AM – 7.5% of normal energy charges
The Objector therefore requests the
ToD tariff is mainly to reduce the overall peak demand in the system and also ensure a certain amount of Grid Discipline.
Short term power purchase price varies significantly depending on the time of the day, season, etc. keeping in view of the above Distribution Licensee has proposed ToD tariff to recover partial additional charges over and above the tariff applicable to meet the expensive power.

Hon’ble Commission that following the cost causation principle of Section 62(3) of Electricity Act, to modify the ToD tariff structure and introduce rebate on energy charges during off-peak period.
Annexure - A
APDRP /
RAPDRPHVDS
New
33/11KV
Substations
RGGVYOther
Schemes
System
Improvement
Works & Other
Works in T&D
Normal plan
& Agl.
Services
Total Exp.
Incurred
1 2009-10 360.00 0.010 29.190 59.440 43.360 1.630 57.510 82.210 273.35
2 2010-11 287.50 0.020 0.300 29.040 19.190 3.160 66.490 116.550 234.75
3 2011-12 308.60 10.040 9.150 12.250 16.360 27.870 86.060 138.400 300.13
4 2012-13 308.30 17.470 16.060 68.100 17.450 8.970 99.610 188.800 416.46
5
2013-14
Up to
Nov'13
347.60 5.920 3.410 15.110 7.840 4.630 47.630 106.370 190.91
Major Scheme / Head Wise Expenditure incurred during 2nd Control Period
Scheme Wise Expenditure Incurred
Sl.
No.
Financial
Year
Approved
by APERC
Annexure - B
Sl.No. Sl.No. Sl.No. Sl.No. ASSET GROUPASSET GROUPASSET GROUPASSET GROUPApproved Approved Approved Approved
(Rs. Cr.s)(Rs. Cr.s)(Rs. Cr.s)(Rs. Cr.s)
Actual (Rs. Actual (Rs. Actual (Rs. Actual (Rs.
Cr.s)Cr.s)Cr.s)Cr.s)
Approved Approved Approved Approved
(Rs. Cr.s)(Rs. Cr.s)(Rs. Cr.s)(Rs. Cr.s)
Actual (Rs. Actual (Rs. Actual (Rs. Actual (Rs.
Cr.s)Cr.s)Cr.s)Cr.s)
Approved Approved Approved Approved
(Rs. Cr.s)(Rs. Cr.s)(Rs. Cr.s)(Rs. Cr.s)
Actual (Rs. Actual (Rs. Actual (Rs. Actual (Rs.
Cr.s)Cr.s)Cr.s)Cr.s)
Approved Approved Approved Approved
(Rs. Cr.s)(Rs. Cr.s)(Rs. Cr.s)(Rs. Cr.s)
Actual (Rs. Actual (Rs. Actual (Rs. Actual (Rs.
Cr.s)Cr.s)Cr.s)Cr.s)
Approved Approved Approved Approved
(Rs. Cr.s)(Rs. Cr.s)(Rs. Cr.s)(Rs. Cr.s)
Actual (Rs. Actual (Rs. Actual (Rs. Actual (Rs.
Cr.s)Cr.s)Cr.s)Cr.s)
TOTALTOTALTOTALTOTAL 332.79 253.25 339.84 210.63 340.27 280.41 344.92 376.08 395.57168.46(Upt
o Dec.)
Details Gross Fixed Assets from 2009-10 to 2013-14 Details Gross Fixed Assets from 2009-10 to 2013-14 Details Gross Fixed Assets from 2009-10 to 2013-14 Details Gross Fixed Assets from 2009-10 to 2013-14
2009-102009-102009-102009-10 2010-112010-112010-112010-11 2011-122011-122011-122011-12 2012-132012-132012-132012-13 2013-142013-142013-142013-14
Annexure - C
No. of
33/11 KV
Substation
Pumpsets
converted
under HVDS
Release of
Service under
Normal Plan
Agricultural
Services
Released
No. of BPL
Services
Released under
RGGVY
1 2009-10 59 4121 215751 6548 129737
2 2010-11 27 70 174360 11883 62415
3 2011-12 15 2054 169215 10066 30347
4 2012-13 52 5573 141215 12617 1777
5
2013-14
Up to
Nov'13
16 1577 95177 5445 107
Major Scheme / Head Wise Physical quantities achieved during 2nd
Control Period
Physical Quantities
Sl.
No.
Financial
Year
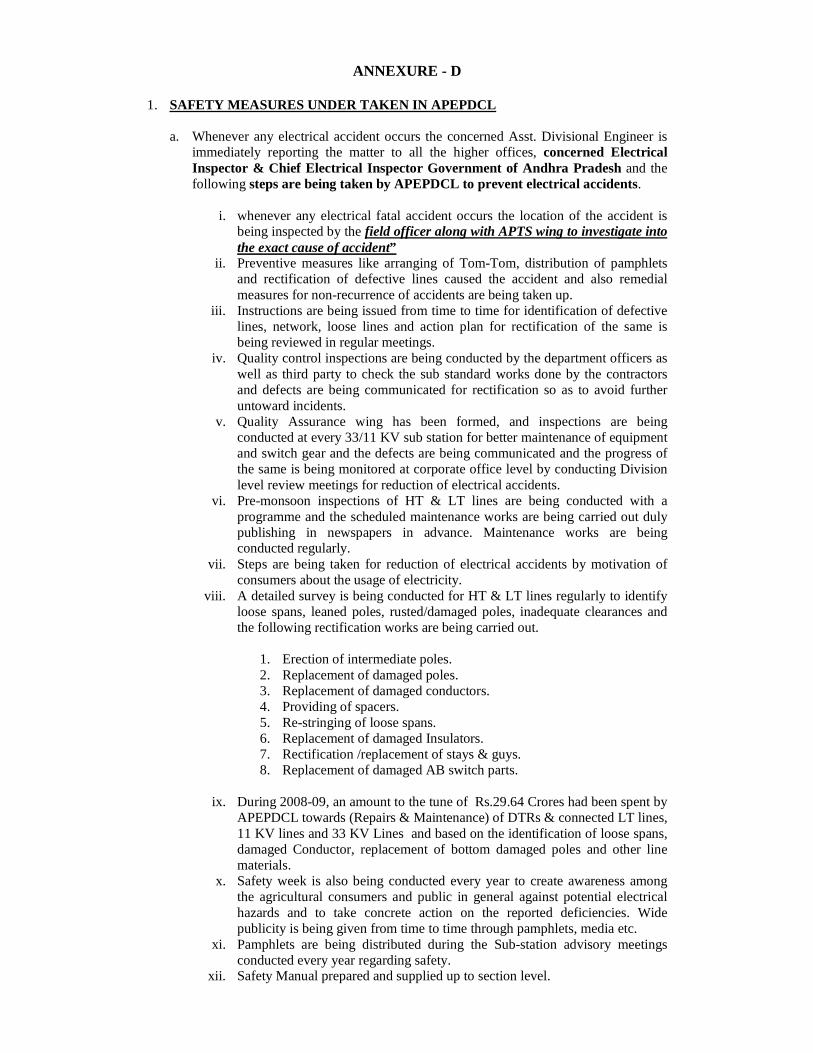
ANNEXURE - D
1. SAFETY MEASURES UNDER TAKEN IN APEPDCL
a. Whenever any electrical accident occurs the concerned Asst. Divisional Engineer is immediately reporting the matter to all the higher offices, concerned Electrical Inspector & Chief Electrical Inspector Government of Andhra Pradesh and the following steps are being taken by APEPDCL to prevent electrical accidents.
i. whenever any electrical fatal accident occurs the location of the accident is
being inspected by the field officer along with APTS wing to investigate into the exact cause of accident”
ii. Preventive measures like arranging of Tom-Tom, distribution of pamphlets and rectification of defective lines caused the accident and also remedial measures for non-recurrence of accidents are being taken up.
iii. Instructions are being issued from time to time for identification of defective lines, network, loose lines and action plan for rectification of the same is being reviewed in regular meetings.
iv. Quality control inspections are being conducted by the department officers as well as third party to check the sub standard works done by the contractors and defects are being communicated for rectification so as to avoid further untoward incidents.
v. Quality Assurance wing has been formed, and inspections are being conducted at every 33/11 KV sub station for better maintenance of equipment and switch gear and the defects are being communicated and the progress of the same is being monitored at corporate office level by conducting Division level review meetings for reduction of electrical accidents.
vi. Pre-monsoon inspections of HT & LT lines are being conducted with a programme and the scheduled maintenance works are being carried out duly publishing in newspapers in advance. Maintenance works are being conducted regularly.
vii. Steps are being taken for reduction of electrical accidents by motivation of consumers about the usage of electricity.
viii. A detailed survey is being conducted for HT & LT lines regularly to identify loose spans, leaned poles, rusted/damaged poles, inadequate clearances and the following rectification works are being carried out.
1. Erection of intermediate poles. 2. Replacement of damaged poles. 3. Replacement of damaged conductors. 4. Providing of spacers. 5. Re-stringing of loose spans. 6. Replacement of damaged Insulators. 7. Rectification /replacement of stays & guys. 8. Replacement of damaged AB switch parts.
ix. During 2008-09, an amount to the tune of Rs.29.64 Crores had been spent by
APEPDCL towards (Repairs & Maintenance) of DTRs & connected LT lines, 11 KV lines and 33 KV Lines and based on the identification of loose spans, damaged Conductor, replacement of bottom damaged poles and other line materials.
x. Safety week is also being conducted every year to create awareness among the agricultural consumers and public in general against potential electrical hazards and to take concrete action on the reported deficiencies. Wide publicity is being given from time to time through pamphlets, media etc.
xi. Pamphlets are being distributed during the Sub-station advisory meetings conducted every year regarding safety.
xii. Safety Manual prepared and supplied up to section level.