Groundwater Technical Report - PDP€¦ · Discharge of ingress groundwater during construction is...
61
Appendix G Groundwater Technical Report - PDP
Transcript of Groundwater Technical Report - PDP€¦ · Discharge of ingress groundwater during construction is...

Beca // 2 May 2018
4216571 // NZ1-15242655-52 0.52 // page 136
Appendix G
Groundwater Technical Report - PDP

Auckland Tauranga Wellington Christchurch
PATTLE DELAMORE PARTNERS LTD
St Marys Bay & Masefield Beach Water Quality Improvement Project –Groundwater Technical Report
Auckland Council
solutions for your environment

A03179700R001_GW_TECHNICALREPORT_FINAL.DOCX
PATTLE DELAMORE PARTNERS LTD Level 4, PDP House 235 Broadway, Newmarket, Auckland 1023 PO Box 9528, Auckland 1149, New Zealand
Tel +64 9 523 6900 Fax +64 9 523 6901 Website http://www.pdp.co.nz Auckland Tauranga Wellington Christchurch
St Marys Bay & Masefield Beach Water Quality Improvement Project – Groundwater Technical Report
• Prepared for
Auckland Council
• April 2018


i i
A U C K L A N D C O U N C I L - S T M A R Y S B A Y & M A S E F I E L D B E A C H W A T E R Q U A L I T Y I M P R O V E M E N T P R O J E C T – G R O U N D W A T E R T E C H N I C A L R E P O R T
A03179700R001_GW_TechnicalReport_Final.docx P A T T L E D E L A M O R E P A R T N E R S L T D
Executive Summary
A detailed assessment of the groundwater regime and hydrogeological conditions within the project area of the St Marys Bay and Masefield Beach Water Quality Improvement Project has been completed and presented within this report.
Key features of the proposed infrastructure require dewatering during the construction period. Dewatering depth and duration varies between project features; however groundwater drawdown and inflow control measures are planned as part of the project construction methodology. A summary of the key project features requiring dewatering, and their associated maximum dewatering depths and drawdown extent is summarised below:
Project Feature
Maximum Dewatering
Depth
Maximum Dewatering
Duration
Geological Unit of
Interest1
Maximum Drawdown in Unit of Interest1
Maximum Distance to
1 m Drawdown1
New St / London St
Shaft 22 m 7-months
ER and Fill (silt & clay
dominated) 2 m 8 m
St Marys Rd Park Shaft
8 m 2-months Fill (sandy)
and TA (silty)
<0.5 -
Pt Erin Park Shaft
10 m 7-months Fill and TL
(sandy) 1 m <5 m
Option A1 Outfall
Connection Trench
7 m 2-months Fill and TL
(sandy) 2.5 m 50 m
Wastewater Mains
Connection Trench
7 m 2-months
ER and Fill (silt & clay
dominated) TA (silty)
3 m 5 m
EOP Connection
Trench 4 m 2-months Fill (sandy) 1.5 m 4 m
New St / London St
Shaft 22 m 7-months
ER and Fill (silt & clay
dominated) 2 m 8 m
Notes: 1. Relates to geological units with settlement potential only i.e. units classified as soil strength.
i i i
A U C K L A N D C O U N C I L - S T M A R Y S B A Y & M A S E F I E L D B E A C H W A T E R Q U A L I T Y I M P R O V E M E N T P R O J E C T – G R O U N D W A T E R T E C H N I C A L R E P O R T
A03179700R001_GW_TechnicalReport_Final.docx P A T T L E D E L A M O R E P A R T N E R S L T D
A summary of the key project features requiring dewatering and their associated groundwater ingress rates during construction dewatering is provided below:
Project Feature Early Time
Inflow Rate (m3/day)1
Steady Inflow Rate
(m3/day)1
Primary Groundwater
Origin
New St / London St Shaft 50 10 EU
St Marys Rd Park Shaft 30 5 EU
Pt Erin Park Shaft 50 10 EU
Option A1 Outfall Connection Trench
1000 100 Fill & TL
EOP Connection Trench 50 20 Fill
Wastewater Mains Connection Trench
30 20 ER, Fill & TA
Discharge of ingress groundwater during construction is proposed to be to the storm water network. Discharge water quality is envisaged to be suitable for direct discharge to the receiving environment (marine), however detailed groundwater quality analysis and determination of any treatment requirements will be completed during detailed design.
Potential saline intrusion impacts (to groundwater) from construction dewatering associated with the New St / London St shaft, St Marys Rd park shaft, Pt Erin Park shaft, the wastewater mains connection trench, and the EOP connection trench are assessed as nil/negligible. Saline intrusion effects for the Option A1 trench from the Pt Erin Weir Structure to marine outfall connection are limited to approximately 50 m inland within the Fill/TL geology, and limited to ~50 m width adjacent to the trench alignment.
There are no existing groundwater users within the project area. Potential future groundwater users are unlikely to be impacted given the overall short temporal nature of the construction dewatering effects. There is also a lack of viable water supply aquifers/sources within the project area, so limited opportunity for existing and future groundwater use.
Groundwater monitoring locations and ‘Alert’ trigger levels have been proposed, and these have been based on both the primary case and alternative case scenarios (for risk management purposes) completed within the assessment.

i v
A U C K L A N D C O U N C I L - S T M A R Y S B A Y & M A S E F I E L D B E A C H W A T E R Q U A L I T Y I M P R O V E M E N T P R O J E C T – G R O U N D W A T E R T E C H N I C A L R E P O R T
A03179700R001_GW_TechnicalReport_Final.docx P A T T L E D E L A M O R E P A R T N E R S L T D
Table of Contents
S E C T I O N P A G E
Executive Summary ii
1.0 Introduction 1 1.1 Project Overview 1 1.2 Document Purpose 1 1.3 Glossary of Terms 2
2.0 Site Data Sources 4 2.1 Initial Data 4 2.2 Project specific data 4
3.0 Existing Environment 6 3.1 Site Setting & Topography 6 3.2 Site Geology 7 3.3 Hydrogeology & Groundwater Flow 8 3.4 Recharge & Surface Water 14 3.5 Existing Groundwater Users 14
4.0 New Street / London Street Shaft Construction 15 4.1 Detailed Hydrogeology 15 4.2 Relevant Construction Features 16 4.3 Assessment Approach 17 4.4 Results 17
5.0 St Mary’s Road Park Shaft Construction 21 5.1 Detailed Hydrogeology 21 5.2 Relevant Construction Features 22 5.3 Assessment Approach 23 5.4 Results 23
6.0 Pt Erin Park Shaft Construction 27 6.1 Detailed Hydrogeology 27 6.2 Relevant Construction Features 28 6.3 Assessment Approach 28 6.4 Results 29
7.0 Pt Erin Park Weir Structure to Marine Outfall Construction 32
7.1 Relevant Construction Features 32 7.2 Results 33
8.0 Pt Erin Park Weir Structure to Wastewater Mains Connection Construction 35
8.1 Hydrogeology 35 8.2 Relevant Construction Features 35

v
A U C K L A N D C O U N C I L - S T M A R Y S B A Y & M A S E F I E L D B E A C H W A T E R Q U A L I T Y I M P R O V E M E N T P R O J E C T – G R O U N D W A T E R T E C H N I C A L R E P O R T
A03179700R001_GW_TechnicalReport_Final.docx P A T T L E D E L A M O R E P A R T N E R S L T D
8.3 Results 35
9.0 Hackett St EOP Connection Construction 37 9.1 Relevant Construction Features 37 9.2 Results 37
10.0 Storage Tunnel Construction 39 10.1 Relevant Construction Features 39 10.2 Results 39
11.0 Assessment of Other Potential Groundwater Effects 42 11.1 Saline Intrusion Potential - Assessment 42 11.2 Other Groundwater Users - Assessment 44
12.0 Infrastructure Operation 45 12.1 Groundwater Mounding Potential 45
13.0 Proposed Groundwater Monitoring Locations & Alert Levels 46
14.0 Summary and Conclusion 47
15.0 Works Cited 51
Table of Figures
Figure 1: Key Locations and Monitoring Boreholes 6
Figure 2 - Interpreted Regional Groundwater System Head 10
Figure 3: New St / London St: Head vs Depth Profile 16
Figure 4: New St / London St Shaft Drawdown (Perched Groundwater System) @ 7-months Dewatering 18
Figure 5: New St / London St Shaft Alternative Scenario Drawdown (Perched Groundwater System) @ 7-months Dewatering 19
Figure 6: St Mary Rd Park Shaft Fill/TL/TA Drawdown @ 2-months Dewatering 24
Figure 7: St Mary Rd Park Shaft Fill/TL/TA Drawdown @ 2-months Dewatering SSW-NNE Section 24
Figure 8: Alternative Scenario EU Fracture Zone: St Mary Rd Park Shaft Fill/TL/TA Drawdown @ 2-months Dewatering 25
Figure 9: Alternative Scenario EU Fracture Zone: St Mary Rd Park Shaft Fill/TL/TA Drawdown @ 2-months Dewatering S-N Section 26
Figure 10: Pt Erin Park Shaft Fill/TL Drawdown @ 7-months Dewatering 29
Figure 11: Pt Erin Park Shaft Drawdown @ 7-months Dewatering S-N Section 30

v i
A U C K L A N D C O U N C I L - S T M A R Y S B A Y & M A S E F I E L D B E A C H W A T E R Q U A L I T Y I M P R O V E M E N T P R O J E C T – G R O U N D W A T E R T E C H N I C A L R E P O R T
A03179700R001_GW_TechnicalReport_Final.docx P A T T L E D E L A M O R E P A R T N E R S L T D
Figure 12: Alternative Scenario High Bulk Permeability Pt Erin Park Shaft Drawdown @ 7-months Dewatering 31
Figure 13: Alternative Scenario High Bulk Permeability EU: Pt Erin Park Shaft Drawdown @ 7-months Dewatering S-N Section 31
Figure 14: Pt Erin Park Shaft & Option A1 Trench Fill/TL Drawdown @ 7-months Dewatering 33
Figure 15: Pt Erin Park Option A1 Trench Drawdown @ 7-months Dewatering SW-NE Section Along Curran St Onramp 34
Figure 16: Wastewater Mains Connection Trench ER and TA Drawdown @ 7-months Dewatering 36
Figure 17: EOP Connection Trench Fill Drawdown @ 2-months Dewatering 38
Figure 18: Drained Tunnel Sections: Predicted Drawdown in EU at Invert Level 40
Figure 19: Drained Tunnel Drawdown: Cross-Section Through ‘Section 2’ 40
Figure 20: Saline Intrusion Particle Tracking (Southern Area) 43
Figure 21: Saline Intrusion Particle Tracking (Northern Area) 44
Table of Tables
Table 1: Project Area Key Hydrogeological Units and Typical Hydraulic Properties 11
Table 2: Groundwater Chemistry - Key Chemical Properties and Major Determinants 13
Table 3: New St / London St Shaft Drawdown Predictions 17
Table 4: New St / London St Shaft Alternative Scenario Drawdown Predictions 19
Table 5: New St / London St Shaft Inflow Rates 20
Table 6: St Marys Rd Park Area – Hydraulic Parameters 22
Table 7: St Marys Rd Park Shaft Inflow Rates 26
Table 8: Pt Erin Park Area – Hydraulic Parameters 28
Table 9: Pt Erin Park Shaft Inflow Rates 32
Table 10: Option A1 Trench Inflow Rates 34
Table 11: Summary of Project Feature Dewatering Depth & Drawdown1 48
Table 12: Summary of Project Feature Groundwater Ingress Rate & Origin1 49

v i i
A U C K L A N D C O U N C I L - S T M A R Y S B A Y & M A S E F I E L D B E A C H W A T E R Q U A L I T Y I M P R O V E M E N T P R O J E C T – G R O U N D W A T E R T E C H N I C A L R E P O R T
A03179700R001_GW_TechnicalReport_Final.docx P A T T L E D E L A M O R E P A R T N E R S L T D
Appendices
Appendix A: Site Plans & Layouts
Appendix B: AC Property File Summary Table of Groundwater Information
Appendix C: Monitoring Bore Construction Details Summary & Groundwater Level Data
Appendix D: Site Hydraulic Testing Data
Appendix E: New St / London St Shaft 2D Groundwater Modelling - Technical Memo
Appendix F: St Marys Bay & Masefield Beach Project 3D Groundwater Modelling - Technical Memo
Appendix G: Proposed Groundwater Monitoring Locations and Alert Levels

1
A U C K L A N D C O U N C I L - S T M A R Y S B A Y & M A S E F I E L D B E A C H W A T E R Q U A L I T Y I M P R O V E M E N T P R O J E C T – G R O U N D W A T E R T E C H N I C A L R E P O R T
A03179700R001_GW_TechnicalReport_Final.docx P A T T L E D E L A M O R E P A R T N E R S L T D
1.0 Introduction
1.1 Project Overview
The St Marys Bay and Masefield Beach Water Quality Improvement Project (the Project) is an Auckland Council (AC) project being undertaken to reduce combined sewer overflows to the beaches of St Marys Bay and Masefield Beach.
The Project involves the installation of a new storage pipeline that will run from New Street/London Street through to a new site within Pt Erin Park. The new pipeline (1800 mm diameter) will have the capacity to store much of the combined sewer overflow volume, so that when there is capacity in the sewer network, the captured overflows can be pumped back to the sewer network for treatment at the Mangere Treatment Plant. During heavy rainfall events when the capacity of the storage pipeline and sewer network is exceeded, overflows will be discharged via a new marine outfall further out into the Waitematā Harbour (approximately 450 m long), at a location that will enable dispersion and dilution. The existing failed outfall at Masefield Beach will be removed, and there will no longer be any direct discharges onto Masefield Beach. Overall the project will result in significant improvement in terms of discharges to these local environments from approximately 206 per year to approximately 20 per year.
The new storage pipeline is proposed to be installed via tunnelling, with the main construction site being located within Pt Erin Park. Some open trenching will also be required to install connecting pipes along Curran Street and Sarsfield Street, and further trenching and pipe jacking will be used to install the new marine pipeline from Pt Erin Park across Curran Street and out into the Waitematā Harbour. Construction is anticipated to take approximately 24 months to complete.
This report has been prepared as part of the technical work necessary to support resource Consent Application for construction of the new infrastructure. The specialist area of this report is hydrogeology/groundwater effects assessment; which is required due to the dewatering aspects of the proposed construction.
Appendix A: provides a selection of the technical drawings for the project.
1.2 Document Purpose
Pattle Delamore Partners Ltd (PDP) has been engaged by AC as groundwater specialists to assist aspects of design and construction, and to complete the groundwater effects assessment for resource consent lodgement on the Project.
This document provides site hydrogeological information and effects assessments relevant to the proposed works, namely:
• Hydrogeological setting description and interpretation
2
A U C K L A N D C O U N C I L - S T M A R Y S B A Y & M A S E F I E L D B E A C H W A T E R Q U A L I T Y I M P R O V E M E N T P R O J E C T – G R O U N D W A T E R T E C H N I C A L R E P O R T
A03179700R001_GW_TechnicalReport_Final.docx P A T T L E D E L A M O R E P A R T N E R S L T D
• Identification of groundwater related risks
• Assessment of groundwater dewatering effects
• Assessment of groundwater quality aspects relevant to the proposed dewatering
• Proposed monitoring and/or mitigation measures for consent conditions
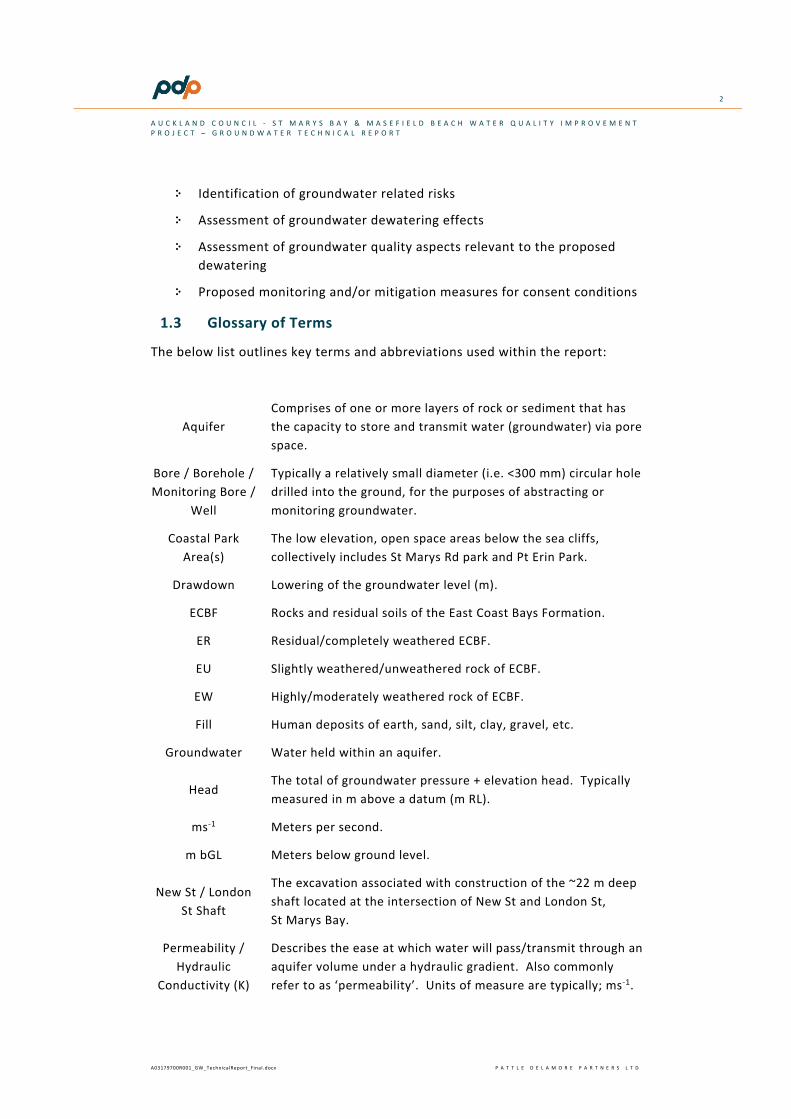
1.3 Glossary of Terms
The below list outlines key terms and abbreviations used within the report:
Aquifer Comprises of one or more layers of rock or sediment that has the capacity to store and transmit water (groundwater) via pore space.
Bore / Borehole / Monitoring Bore /
Well
Typically a relatively small diameter (i.e. <300 mm) circular hole drilled into the ground, for the purposes of abstracting or monitoring groundwater.
Coastal Park Area(s)
The low elevation, open space areas below the sea cliffs, collectively includes St Marys Rd park and Pt Erin Park.
Drawdown Lowering of the groundwater level (m).
ECBF Rocks and residual soils of the East Coast Bays Formation.
ER Residual/completely weathered ECBF.
EU Slightly weathered/unweathered rock of ECBF.
EW Highly/moderately weathered rock of ECBF.
Fill Human deposits of earth, sand, silt, clay, gravel, etc.
Groundwater Water held within an aquifer.
Head The total of groundwater pressure + elevation head. Typically measured in m above a datum (m RL).
ms-1 Meters per second.
m bGL Meters below ground level.
New St / London St Shaft
The excavation associated with construction of the ~22 m deep shaft located at the intersection of New St and London St, St Marys Bay.
Permeability / Hydraulic
Conductivity (K)
Describes the ease at which water will pass/transmit through an aquifer volume under a hydraulic gradient. Also commonly refer to as ‘permeability’. Units of measure are typically; ms-1.

3
A U C K L A N D C O U N C I L - S T M A R Y S B A Y & M A S E F I E L D B E A C H W A T E R Q U A L I T Y I M P R O V E M E N T P R O J E C T – G R O U N D W A T E R T E C H N I C A L R E P O R T
A03179700R001_GW_TechnicalReport_Final.docx P A T T L E D E L A M O R E P A R T N E R S L T D
Pt Erin Park The low elevation park area in-between Curran St and State Highway 1.
Pt Erin Park shaft The excavation associated with construction of the ~10 m deep shaft located within Pt Erin park.
RL (m RL) Meters above a Residual Level. For this project, measured as meters above Auckland 1949 mean sea level datum.
St Marys Rd park The public park at the northern end of St Marys Rd.
St Marys Rd park shaft
The excavation associated with construction of the ~8 m deep shaft located within St Marys Rd park.
Suburban Area The higher elevation, suburban (residential) areas located above the sea cliffs.
TA Alluvial deposited sediments of the Tauranga Group.
TL Marine deposited sediments of the Tauranga Group.

4
A U C K L A N D C O U N C I L - S T M A R Y S B A Y & M A S E F I E L D B E A C H W A T E R Q U A L I T Y I M P R O V E M E N T P R O J E C T – G R O U N D W A T E R T E C H N I C A L R E P O R T
A03179700R001_GW_TechnicalReport_Final.docx P A T T L E D E L A M O R E P A R T N E R S L T D
2.0 Site Data Sources
2.1 Initial Data
A body of previous data and studies were available for the site and surrounding area. Key previous studies are:
• Auckland Council property file data – returned property file information for 36 properties located near to the proposed geographical alignment. Received mid-2017. A summary table of property file data is provided in Appendix B:
• Auckland Council consent application file information – information on previous, nearby relevant consent applications were obtained from AC for REG/2013/4675 (Marine Parade Storm Water Upgrade Stage 1 - Herne Bay), and REG/2015/1853 (Wynyard Quarter Pump Station – Wynyard Quarter).
• Auckland Council digital topographic data, downloaded under Creative Commons Attribution 3.0 New Zealand license from Auckland Council’s online GIS Viewer. Data source: ALGGi Urban 2006 contour data.
• Auckland Council Registered Bore and Take Records – returned registered borehole and water take consent information within 2 km of the centre of the alignment. Received November 2017.
• Rainfall data – obtained from NIWA’s CliFlo database, weather station Ews MOTAT # 41351.
• (Edbrooke, 2001) – published geology of the Auckland Region.
• (High, 1976) – structural geology study of the Waitematā Group in the Point Erin area, Auckland.
2.2 Project Specific Data
2.2.1 Project Team Member Data
• (Aurecon, 2018) - Ground investigation factual report; includes geological logs and monitoring bore construction details
• (Aurecon, 2018a) – Construction methodology report
• (Aurecon, 2018b) – Concept design drawing set
• (Aurecon, 2018c) – Geological Long Section
• (Aurecon 3D GeoModel) - A digital 3D geological model developed by Aurecon for the site area

5
A U C K L A N D C O U N C I L - S T M A R Y S B A Y & M A S E F I E L D B E A C H W A T E R Q U A L I T Y I M P R O V E M E N T P R O J E C T – G R O U N D W A T E R T E C H N I C A L R E P O R T
A03179700R001_GW_TechnicalReport_Final.docx P A T T L E D E L A M O R E P A R T N E R S L T D
2.2.2 PDP Collected Data
As part of the investigation work for the Project, PDP collected groundwater and hydraulic properties data from the boreholes installed during the ground investigation. A summary of groundwater data collected during investigation phase is provided below:
• Groundwater level (head) monitoring data – comprises head monitoring data for 19 individual monitoring bores located across the alignment. Data and hydrographs provided in Appendix C:
• Hydraulic testing data – comprises open borehole packer test data and small-scale ‘slug’ testing. Data and analysis provided in Error! Reference source not found.
• Visual surveys of the cliff faces adjacent to St Marys Rd park, Pt Erin Park, and Shelly Beach.

6
A U C K L A N D C O U N C I L - S T M A R Y S B A Y & M A S E F I E L D B E A C H W A T E R Q U A L I T Y I M P R O V E M E N T P R O J E C T – G R O U N D W A T E R T E C H N I C A L R E P O R T
A03179700R001_GW_TechnicalReport_Final.docx P A T T L E D E L A M O R E P A R T N E R S L T D
3.0 Existing Environment
3.1 Site Setting & Topography
The Project is located near and adjacent to the coastal areas of St Marys Bay and Westhaven Marina immediately south of the Auckland Harbour Bridge. The Project spans a distance of approximately 1.2 km, from the New St / London St intersection (St Mary’s Bay, Auckland) to Point Erin Park (Herne Bay, Auckland). Figure 1 displays key locations referred within this report, including; the proposed tunnel alignment, proposed shafts, and the project groundwater monitoring bores.
Figure 1: Key Locations and Monitoring Boreholes
Topography in the region ranges from ~50 m RL (College Hill Rd / Jervois Rd) down to sea level along the coastal margins of St Mary’s Bay, Westhaven, Masefield Beach and Point Erin Park. Sea cliffs are a prominent topographical feature within the project area, and these cliffs run essentially parallel to the

7
A U C K L A N D C O U N C I L - S T M A R Y S B A Y & M A S E F I E L D B E A C H W A T E R Q U A L I T Y I M P R O V E M E N T P R O J E C T – G R O U N D W A T E R T E C H N I C A L R E P O R T
A03179700R001_GW_TechnicalReport_Final.docx P A T T L E D E L A M O R E P A R T N E R S L T D
coastline. The cliffs are typically around 10 to 15 m high, with varying slope. The steepest areas have slopes of around 80%, whilst shallower areas of ~30 - 50% slope are present near the embayment areas of St Marys Bay, Shelly Beach, and Masefield Beach.
For the purposes describing generalised locations, the project area can be split into two distinct settings; a) the higher elevation, suburban areas above the sea cliffs (‘Suburban Areas’), and b) and the low elevation, open space areas below the sea cliffs (‘Coastal Park Areas’).
The Suburban Area at the New St / London St intersection (proposed New St / London St shaft location), has a ground elevation of approximately 22 m RL and slopes of ~10%.
The Coastal Park Areas of St Marys Bay Rd Park (proposed St Marys Rd park shaft location), Pt Erin Park (proposed Pt Erin Park weir structure & shaft location) and Shelly Beach; ground elevation is typically 3 to 4 m RL and slopes are near flat.
3.2 Site Geology
Details of the geological and geotechnical investigations completed for The Project are provided in the Ground Investigation Factual Report (Aurecon, 2018). The alignment long section and cross sections (Aurecon, 2018c) provide the basis of the interpretted geological setting for The Project; however a basic summary of geological aspects relevant to groundwater and hydrogeology are presented here.
There are three key geological units present within the project area, described below:
• Fill (human placed deposits);
- Variable in nature, placement method, thickness, and age.
- Largest/thickest occurrences within the Coastal Park Areas; up to 5 m thickness. Localised occurrences in the Suburban Areas, typically <2 m thickness.
- Evidence that hydraulic fill (dredged harbour material) is present at the Coastal Park Areas, and potentially beneath SH1.
- Remainder of Fill material is likely to comprise mixtures of sand, silt, clay, gravel, buried organics or hardfill.
• Tauranga Group (TA and TL);
- Coastal marine (TL) and alluvial (TA) sedimentary deposits typically comprising sand, silt, gravel, or organics.

8
A U C K L A N D C O U N C I L - S T M A R Y S B A Y & M A S E F I E L D B E A C H W A T E R Q U A L I T Y I M P R O V E M E N T P R O J E C T – G R O U N D W A T E R T E C H N I C A L R E P O R T
A03179700R001_GW_TechnicalReport_Final.docx P A T T L E D E L A M O R E P A R T N E R S L T D
- Largest/thickest occurrences are of TL, and are located within the Coastal Park Areas; up to 10 m thick. Only minimal and localised occurrences of TA are present within the Suburban Areas.
- Notable presence of an alluvial paleo-channel (TA), orientated approximately north-south at St Marys Rd park; which contains TA thickness of ~7 m.
- Other smaller (extent and depth) occurrences of Tauranga Group sediments may be present along the alignment.
• East Coast Bays Formation (ECBF);
- ‘Basement’ unit for the project area, as well as the primary geological unit for the proposed tunnelling horizon.
- Typical weathering profile observed beneath the high elevation Suburban Area i.e. residual/completely weathered (ER) grading to highly/moderately weathered rock (EW) and then to slightly weathered/unweathered rock (EU). Full weathering profile typically occurs over ~5 to ~10 m of vertical thickness.
- Lower elevation Coastal Park Area areas comprise predominantly EU (ER and EW removed by erosion/wave action).
- UCS testing indicates a range of rock strengths from 0.4 MPa to 9.3 MPa. This indicates that some fairly strong (for ECBF) zones are present within the project area. This is a potentially important factor for rock fracture/joint openings. Please refer to Aurecon (2018) for further information on the geotechnical testing.
- No examples of ‘Parnell Grit’ beds, which are cemented highly indurated layers within some ECBF sequences elsewhere, have been identified within the investigations.
3.3 Hydrogeology & Groundwater Flow
The groundwater system within the project area is somewhat complex, with a number of isolated groundwater systems and catchments. The below chapters of this report provide a high-level conceptual interpretation of groundwater and hydrogeology within the project area, with detailed descriptions associated with key areas of the proposed construction provided in Section 4.0.
3.3.1 Groundwater Flow & Heads
Available groundwater level (head) data collected during the site investigation work covers a range of ~20 m (relative levels); although head range across the entire project area is expected to span between ~48 m RL (top of College Hill Rd and Jervois Rd) and ~0 m RL (coastal margin).

9
A U C K L A N D C O U N C I L - S T M A R Y S B A Y & M A S E F I E L D B E A C H W A T E R Q U A L I T Y I M P R O V E M E N T P R O J E C T – G R O U N D W A T E R T E C H N I C A L R E P O R T
A03179700R001_GW_TechnicalReport_Final.docx P A T T L E D E L A M O R E P A R T N E R S L T D
The highest groundwater levels (heads) are associated with the higher topography Suburban Areas, where heads are typically >10 m RL. For the Coastal Park Areas, and other lower lying coastal areas, groundwater levels are typically <4 m RL.
Analysis of the groundwater level data in coordination with the topographic and hydrological information indicates the following key conceptual findings:
Suburban Area:
• Comprised primarily of groundwater within the various ECBF geological units.
• Presence of perched groundwater and a regional groundwater system.
• Head waters of the groundwater catchment relevant to the project alignment extend up to approximately the topographical ridge line of Jervois Rd (see Figure 2).
• The regional groundwater system is present across the entire project area and occurs predominantly within the EU geology; with depth to regional groundwater varying between ~5 and ~15 m bGL – primarily influenced by topographic elevation.
• The deeper parts of the regional system (i.e. >20 m bGL) are likely to act as semi-confined aquifer.
• Groundwater flow within the regional system is primarily in a north to north east direction i.e. towards the Waitematā Harbour, which is the regional groundwater sink.
• Perched groundwater lenses are present in isolated areas, occurring predominantly within Fill and/or ER geology. Where a perched groundwater lens(s) is present, depth to groundwater ranges between approximately 0.5 m and 5 m bGL. Unsaturated conditions exist beneath the base of each perched lens.
• Groundwater flow direction within the perched groundwater system (the collected perched lenses) is likely variable and influenced by local groundwater discharge areas i.e. small springs, streams, drains.
Coastal Park Areas / Low-lying Areas
• Groundwater within the Fill, TL, and TA sediments as well as the underlying ECBF formations.
• Presence of a fully saturated regional groundwater system, with the water table encountered at shallow depths (i.e. <2 m bGL).
• The deeper parts of the regional system (i.e. >20 m bGL) are likely to act as semi-confined aquifer.

1 0
A U C K L A N D C O U N C I L - S T M A R Y S B A Y & M A S E F I E L D B E A C H W A T E R Q U A L I T Y I M P R O V E M E N T P R O J E C T – G R O U N D W A T E R T E C H N I C A L R E P O R T
A03179700R001_GW_TechnicalReport_Final.docx P A T T L E D E L A M O R E P A R T N E R S L T D
Groundwater flow within the regional system is primarily in a north to north east direction i.e. towards the Waitematā Harbour, which is the regional groundwater sink.
Figure 2 below displays interpreted head contours for regional groundwater system (horizontal slice through -2 m RL).
Figure 2 - Interpreted Regional Groundwater System Head
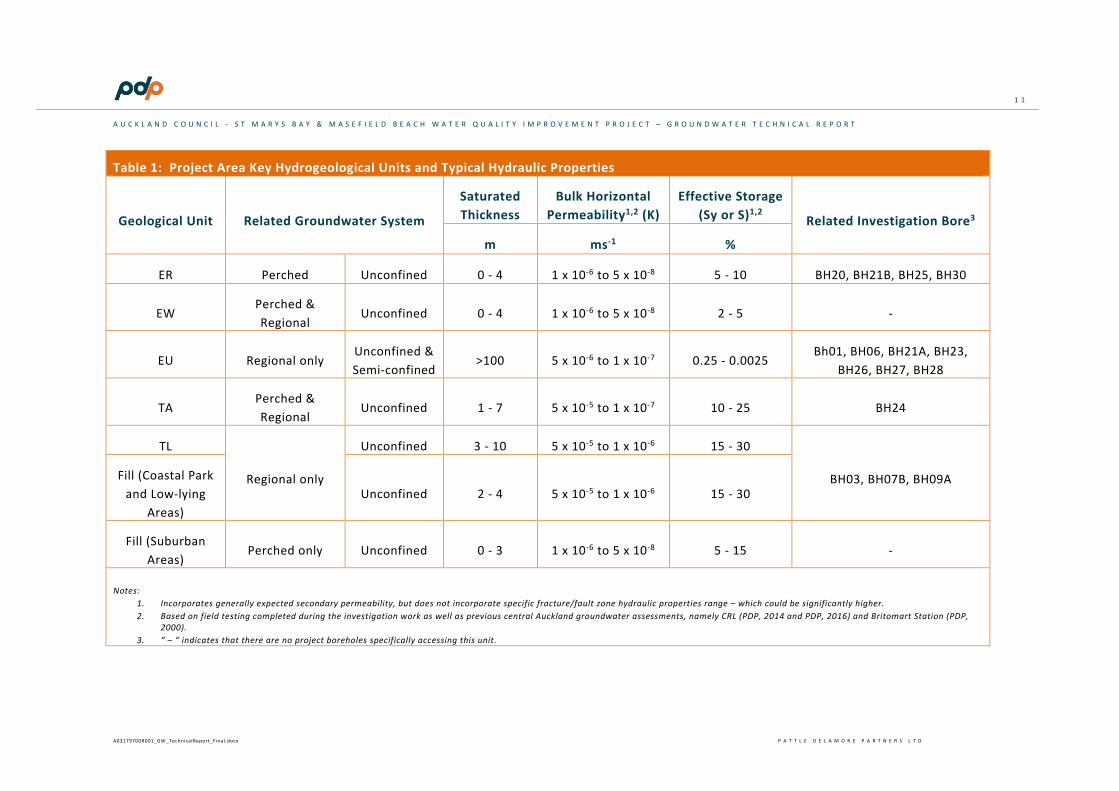
3.3.2 Hydrogeological Units & Hydraulic Properties
The key geological units have been subdivided into hydrogeological units, based on the observed investigation data and testing. Table 1 below summarises these properties.
1 1
A U C K L A N D C O U N C I L - S T M A R Y S B A Y & M A S E F I E L D B E A C H W A T E R Q U A L I T Y I M P R O V E M E N T P R O J E C T – G R O U N D W A T E R T E C H N I C A L R E P O R T
A03179700R001_GW_TechnicalReport_Final.docx P A T T L E D E L A M O R E P A R T N E R S L T D
Table 1: Project Area Key Hydrogeological Units and Typical Hydraulic Properties
Geological Unit Related Groundwater System
Saturated Thickness
Bulk Horizontal Permeability1,2 (K)
Effective Storage (Sy or S)1,2
Related Investigation Bore3
m ms-1 %
ER Perched Unconfined 0 - 4 1 x 10⁻⁶ to 5 x 10⁻⁸ 5 - 10 BH20, BH21B, BH25, BH30
EW Perched & Regional
Unconfined 0 - 4 1 x 10⁻⁶ to 5 x 10⁻⁸ 2 - 5 -
EU Regional only Unconfined & Semi-confined
>100 5 x 10⁻⁶ to 1 x 10⁻⁷ 0.25 - 0.0025 Bh01, BH06, BH21A, BH23,
BH26, BH27, BH28
TA Perched & Regional
Unconfined 1 - 7 5 x 10⁻⁵ to 1 x 10⁻⁷ 10 - 25 BH24
TL
Regional only
Unconfined 3 - 10 5 x 10⁻⁵ to 1 x 10⁻⁶ 15 - 30
BH03, BH07B, BH09A Fill (Coastal Park and Low-lying
Areas) Unconfined 2 - 4 5 x 10⁻⁵ to 1 x 10⁻⁶ 15 - 30
Fill (Suburban Areas)
Perched only Unconfined 0 - 3 1 x 10⁻⁶ to 5 x 10⁻⁸ 5 - 15 -
Notes: 1. Incorporates generally expected secondary permeability, but does not incorporate specific fracture/fault zone hydraulic properties range – which could be significantly higher. 2. Based on field testing completed during the investigation work as well as previous central Auckland groundwater assessments, namely CRL (PDP, 2014 and PDP, 2016) and Britomart Station (PDP,
2000). 3. “ – “ indicates that there are no project boreholes specifically accessing this unit.

1 2
A U C K L A N D C O U N C I L - S T M A R Y S B A Y & M A S E F I E L D B E A C H W A T E R Q U A L I T Y I M P R O V E M E N T P R O J E C T – G R O U N D W A T E R T E C H N I C A L R E P O R T
A03179700R001_GW_TechnicalReport_Final.docx P A T T L E D E L A M O R E P A R T N E R S L T D
3.3.3 Groundwater Quality
An assessment of the groundwater chemistry major determinants was undertaken within this assessment, to assist with understanding the conceptual site setting.
Groundwater in the units sampled (Fill/TL and EU) is predominantly fresh to slightly brackish and with circum-neutral to slightly alkaline pH. The chemistry matches that of what is expected for a groundwater sample collected within 100 m of the sea.
A high-level assessment of sodium (Na+), Chloride (Cl-), and calcium (Ca2+) ion ratios suggests that, for areas of EU which are within at least ~100 m and areas of Fill/TL within at least ~30 m of the present-day coastline, are likely to currently (or previously) be mildly influenced by saline intrusion.
A summary of chemical properties and major determinants is provided in Table 2.

1 3
A U C K L A N D C O U N C I L - S T M A R Y S B A Y & M A S E F I E L D B E A C H W A T E R Q U A L I T Y I M P R O V E M E N T P R O J E C T – G R O U N D W A T E R T E C H N I C A L R E P O R T
A03179700R001_GW_TechnicalReport_Final.docx P A T T L E D E L A M O R E P A R T N E R S L T D
Table 2: Groundwater Chemistry - Key Chemical Properties and Major Determinants
Bore
ID Unit pH
EC1 (uS/cm)
Major Cation
Major Anion
Total Alkalinity
(mg/L) Na+:Cl- Na+:Ca2+ Ca2+:HCO3
- Interpretative Comment
BH03 Fill/TL 7.0 1110 Ca HCO3 407 1.1:1 0.5:1 0.9:1 Fresh. Meteoric originated groundwater
with some calcite dissolution.
BH05 Fill/TL 6.6 729 Ca HCO3 189 1.0:1 0.4:1 1.1:1
BH07B Fill/TL 6.6 525 Ca HCO3 173 1.0:1 0.8:1 0.8:1
BH09A Fill/TL 6.8 1560 Na Cl 314 1.6:1 16:1 0.1:1
Slightly brackish. Ion ratios suggest evidence
of previous saline intrusion.
BH23 EU 8.4 445 Na HCO3 175 3.2:1 5:1 0.2:1 Fresh. Ion ratios suggest evidence of previous or current saline intrusion.
Seawater2 - 8.1 53,000 Na Cl 115 0.9:1 23:1 11:1 For reference
Notes: 1. Electrical conductivity. 2. Typical seawater chemistry as described in Parkhurst & Appelo (2012).
1 4
A U C K L A N D C O U N C I L - S T M A R Y S B A Y & M A S E F I E L D B E A C H W A T E R Q U A L I T Y I M P R O V E M E N T P R O J E C T – G R O U N D W A T E R T E C H N I C A L R E P O R T
A03179700R001_GW_TechnicalReport_Final.docx P A T T L E D E L A M O R E P A R T N E R S L T D
3.4 Recharge & Surface Water
Annual rainfall in the project area is expected to be similar to that of the central Auckland isthmus; 1100 mm to 1200 mm. Recharge to the groundwater system is interpreted to be primarily from the following mechanisms:
• Direct rainfall recharge across open permeable areas i.e. gardens, park land;
• Leakage from underground water, storm water and wastewater services.
Within the project area, surface water run-off and recharge characteristics for the Suburban Areas is distinct from the Coastal Park Areas.
The Suburban Area contains significant portions of impermeable pavement and roof area, which feeds into the municipal storm water network as run-off. Although urbanised/suburbanised areas typically have higher groundwater recharge rates post-urbanisation than pre-urbanisation (Barrett, et al, 1999) – recharge to the groundwater system across the Suburban Area is likely to be overall lower than that for the Coastal Park Areas. This is primarily due to the soil type, low run-off potential, and presence of underground services within the Coastal Park Areas.
Other low-lying area, namely State Highway 1, is likely to experience very low rates of recharge due to near complete impervious surface and absence of underground water carrying services.
Expected range of annual recharge rates for the project area is:
• Suburban Areas = 30 mm/yr to 150 mm/yr (~3% to ~15% of annual rainfall)
• Coastal Park Areas = 100 mm/yr to 600 mm/yr (~10% to 50% of annual rainfall)
• Other Low-lying Paved Areas = 0 mm/yr to 50 mm/yr (0% to ~5% of annual rainfall).
3.5 Existing Groundwater Users
A bore and take search was requested from AC in November 2017. No active groundwater takes for water supply purposes or boreholes with potential domestic supply use were identified within a groundwater study area (as outlined on Figure 2).

1 5
A U C K L A N D C O U N C I L - S T M A R Y S B A Y & M A S E F I E L D B E A C H W A T E R Q U A L I T Y I M P R O V E M E N T P R O J E C T – G R O U N D W A T E R T E C H N I C A L R E P O R T
A03179700R001_GW_TechnicalReport_Final.docx P A T T L E D E L A M O R E P A R T N E R S L T D
4.0 New Street / London Street Shaft Construction
4.1 Detailed Hydrogeology
Assessment of borehole lithology, groundwater levels, and permeability testing indicates the presence of a perched groundwater system, comprising a single perched layer hydraulically separated from the underlying regional groundwater table by ~6 m of unsaturation. This is demonstrated by two key lines of evidence:
• Head vs Depth profile (Figure 3) – which displays two distinct groupings of head vs depth, one for the shallow ER bores, and one for the deeper EU bores.
• Partial saturation of the screened zone in BH21A (EU – screened 8 - 12.5 m bGL) i.e. water level positioned within the lower portion of the screen zone only.

1 6
A U C K L A N D C O U N C I L - S T M A R Y S B A Y & M A S E F I E L D B E A C H W A T E R Q U A L I T Y I M P R O V E M E N T P R O J E C T – G R O U N D W A T E R T E C H N I C A L R E P O R T
A03179700R001_GW_TechnicalReport_Final.docx P A T T L E D E L A M O R E P A R T N E R S L T D
Figure 3: New St / London St: Head vs Depth Profile
Assessment of hydrograph data collected during the investigations and available property file documents (files for 11, 17, 19, 21-23 London St); indicates a potentially permanent perched groundwater level of ~3 m bGL in the vicinity of the proposed shaft. Based on the detailed geological log descriptions for BH01, BH20, BH21A, and BH21B (Aurecon, 2018); this equates to an estimated permanent saturated thickness of 2 m within the ER / Fill geology at proposed site of the New St / London St shaft. The ER and Fill geology is the unit of interest at this location due to its potential for settlement via dewatering.
Groundwater flow within the perched groundwater system is expected to be generally in the NE direction, towards the cliff face where discharge occurs. Other local sinks i.e. springs/depressions or drains, may also form discharge areas. A visual survey of the cliff face was completed for the entire tunnel alignment, however due to the significant vegetation cover present on the cliff face, no specific cliff face springs/seeps were able to the identified.
Key hydraulic properties adopted for the perched groundwater system assessment are;
• Horizontal Permeability = 5 x 10⁻⁷ ms-1
• Vertical Permeability = 3 x 10⁻⁷ ms-1
• Recharge = 68 mm/yr
• Starting saturated thickness = 2 m
Technical details of the modelling and assessment are provided in Appendix E.
4.1.1 Regional Groundwater System
The regional groundwater system is expected to be encountered at 11 m bGL within the EU. Due to the hydraulic separation of the regional groundwater system, drawdown within the EU will not result in underdrainage effects to the overlying ER/Fill.
Groundwater within the regional system migrates NE towards the Waitematā Harbour, and discharges predominantly to the harbour by either near-shore or off-shore submarine springs. Beneath the area covered by State Highway 1, a smaller proportion of EU groundwater is likely to migrate upwards and discharge into the shallow Fill/TL sediments which overlie the EU in this location.
4.2 Relevant Construction Features
The New St / London St shaft comprises an excavation from ground surface to approximately 22 m bGL. The shaft will be circular with a diameter varying between 3 m and 6 m throughout its vertical length. Dewatering during construction of the proposed New St / London St shaft is potentially required for

1 7
A U C K L A N D C O U N C I L - S T M A R Y S B A Y & M A S E F I E L D B E A C H W A T E R Q U A L I T Y I M P R O V E M E N T P R O J E C T – G R O U N D W A T E R T E C H N I C A L R E P O R T
A03179700R001_GW_TechnicalReport_Final.docx P A T T L E D E L A M O R E P A R T N E R S L T D
a maximum period of 7-months. The construction methodology, as outlined in Aurecon (2018a), will effectively form a fully drained excavation i.e. no provision for construction phase groundwater sealing/impedance.
4.3 Assessment Approach
Numerical modelling using the 2D modelling package, SEEP-W (GEO_SLOPE International Ltd., 2012), was selected to aid with the dewatering effects assessment. This package utilises a finite element approach to model groundwater head and flow, and is capable of simulating both saturated and unsaturated flow. It is industry standard software and is used worldwide within the fields of groundwater and geotechnical engineering.
An idealised, synthetic 2D section model was constructed and calibrated to the interpreted conceptual understating of the groundwater system as described above. Technical details on the model set up are provided in Appendix E.
The assessment in relation to drawdown for potential settlement was taken as drawdown below the lowest estimated groundwater level / perched zone saturated thickness i.e. 3 m bGL / 2 m saturated thickness respectively.
4.4 Results
4.4.1 Groundwater Drawdown
Predicted drawdown within the ER/Fill perched groundwater system, below that of the interpreted minimum permanent saturated thickness, is summarised in Table 3 and displayed visually in Figure 4 below:
Table 3: New St / London St Shaft Drawdown Predictions
Dewatering Time (months)
Maximum Drawdown (m)
Radial Extent of 1 m Drawdown (m)
3-months 2 5
5-months 2 6
7-months 2 8

1 8
A U C K L A N D C O U N C I L - S T M A R Y S B A Y & M A S E F I E L D B E A C H W A T E R Q U A L I T Y I M P R O V E M E N T P R O J E C T – G R O U N D W A T E R T E C H N I C A L R E P O R T
A03179700R001_GW_TechnicalReport_Final.docx P A T T L E D E L A M O R E P A R T N E R S L T D
Figure 4: New St / London St Shaft Drawdown (Perched Groundwater System) @ 7-months Dewatering
4.4.2 Alternative Scenario – High ER Permeability
To provide additional information and assessment for risk management purposes, a scenario incorporating a less likely alternative physical setting was developed. For this scenario, a higher ER permeability was utilised. Summary of key hydraulic parameters are outlined below;
• Horizontal Permeability = 1.2 x 10⁻⁶ ms-1
• Vertical Permeability = 7 x 10⁻⁷ ms-1
• Recharge = 70 mm/yr
• Starting saturated thickness = 3 m
Predictions are summarised in Table 4 and displayed in plan view on Figure 5.

1 9
A U C K L A N D C O U N C I L - S T M A R Y S B A Y & M A S E F I E L D B E A C H W A T E R Q U A L I T Y I M P R O V E M E N T P R O J E C T – G R O U N D W A T E R T E C H N I C A L R E P O R T
A03179700R001_GW_TechnicalReport_Final.docx P A T T L E D E L A M O R E P A R T N E R S L T D
Table 4: New St / London St Shaft Alternative Scenario Drawdown Predictions
Dewatering Time (months)
Maximum Drawdown
(m)
Radial Extent of 2 m Drawdown
(m)
Radial Extent of 1 m Drawdown
(m)
3-months 3 3 18
5-months 3 5 23
7-months 3 7 27
Figure 5: New St / London St Shaft Alternative Scenario Drawdown (Perched Groundwater System) @ 7-months Dewatering
4.4.3 Groundwater Ingress
Groundwater inflow rates were assessed with the project 3D groundwater model, the technical set up of which is described within Appendix F as well as Section 6.0). Groundwater ingress rates for both the primary and alternative assessment are provided in Table 5 below.

2 0
A U C K L A N D C O U N C I L - S T M A R Y S B A Y & M A S E F I E L D B E A C H W A T E R Q U A L I T Y I M P R O V E M E N T P R O J E C T – G R O U N D W A T E R T E C H N I C A L R E P O R T
A03179700R001_GW_TechnicalReport_Final.docx P A T T L E D E L A M O R E P A R T N E R S L T D
Table 5: New St / London St Shaft Inflow Rates
Assessment Scenario Early Time Inflow
(m3/day) Steady Inflow
(m3/day)
Primary Case 50 8
Alternative Scenario – High ER Permeability
100 35
The majority of groundwater ingress is predicted to come from aquifer storage within the EU. It is envisaged that the water will be of suitable quality for discharge into the storm water network / marine receiving environment. Detailed groundwater quality analysis will form part of detailed design and will determine if any treatment is required before discharge.
2 1
A U C K L A N D C O U N C I L - S T M A R Y S B A Y & M A S E F I E L D B E A C H W A T E R Q U A L I T Y I M P R O V E M E N T P R O J E C T – G R O U N D W A T E R T E C H N I C A L R E P O R T
A03179700R001_GW_TechnicalReport_Final.docx P A T T L E D E L A M O R E P A R T N E R S L T D
5.0 St Mary’s Road Park Shaft Construction
5.1 Detailed Hydrogeology
Assessment of borehole lithology, groundwater levels, and permeability testing indicates the presence of the regional groundwater system at shallow depth beneath the shaft site and St Marys Rd park area in general. This is demonstrated by specifically by:
• Shallow monitoring bores BH03, BH05 (Fill/TL) and BH24 (TA) - which display depth to groundwater of ~1 - 1.5 m bGL and no evidence of perched water in the unsaturated zone above.
• Deep monitoring bores BH04 and BH23 (EU) - which display depth to groundwater of ~0.5 - 1.5 m bGL.
The higher groundwater levels (head pressure) observed within the deeper EU monitoring bores compared to the shallow Fill/TL/TA monitoring bores are a key element to the conceptual understanding of the groundwater system in this area. A summary of the key conceptual interpretations for the St Marys Rd park area are presented below:
• Fully saturated regional groundwater system only.
• Groundwater level data indicates an upwards element to head gradients within the St Mary Rd Park area. This is expected given the comparatively high EU heads observed within the up-gradient EU (Suburban Area), and the embayment shape of St Marys Rd park, which sees the area act as a ‘focal point’ for groundwater flow from further up-catchment i.e. groundwater flow is converging into the St Mary Rd Park area.
• The vertical head difference between the deeper EU and the shallow Fill/TL/TA units is approximately 1 – 1.5 m, however hydrographs for the shallow and deep bores appear to follow the same trend. This indicates that there is some level of confinement within the higher pressure EU but the system is likely operating like a ‘leaky’ aquifer.
• Clear tidal signature observed in both EU bores BH04 and BH23 (typically 5 - 10 mm per tidal cycle), but with BH23 showing larger tidal influence (~50% more fluctuation).
• Notable high angle fractures observed within the EU encountered within BH23, however BH04 did not display notable fracturing. These geological descriptions, coupled with ~0.5 m higher head and stronger tidal influence (observed in BH23 compared to nearby BH04) indicates a discrete zone of fracturing, rather than a large pervasive fracture network, and is more likely.

2 2
A U C K L A N D C O U N C I L - S T M A R Y S B A Y & M A S E F I E L D B E A C H W A T E R Q U A L I T Y I M P R O V E M E N T P R O J E C T – G R O U N D W A T E R T E C H N I C A L R E P O R T
A03179700R001_GW_TechnicalReport_Final.docx P A T T L E D E L A M O R E P A R T N E R S L T D
• The Fill sediments that overlie the EU are primarily sandy and have a thickness of ~4 – 5 m across the park; and a saturated thickness of ~3 m.
• Through approximately the central axis of St Marys Rd park, an isolated alluvial paleo-channel has been identified (Aurecon, 2018c). Sediments within the paleo-channel are primarily silty or clay dominated. The thickest part of the paleo-channel extends to ~-8 m RL, but is located ~50 m NW of the shaft.
• Groundwater within the EU migrates NE towards the Waitematā Harbour, and discharges predominantly to the harbour by either near-shore or off-shore submarine springs. A smaller proportion of EU groundwater migrates upwards and discharges into the shallow Fill/TL/TA sediments.
• Groundwater within the Fill/TL/TA migrates NE towards the Waitematā Harbour and discharges predominantly via low-tide seepage along the St Marys Bay foreshore.
• Surface recharge to the park is estimated at 200 mm/yr.
Key hydraulic parameters adopted within the assessment for the St Marys Rd park area are summarised below in Table 6 below.
Table 6: St Marys Rd Park Area – Hydraulic Parameters
Geological Unit
Horizontal Permeability (Kh)
Vertical Permeability (Kv)
Expected Typical Effective Storage
(Sy or Ss)
ms-1 ms-1 %
Fill 2 x 10⁻⁵ 1 x 10⁻⁵ 25
TA 6 x 10⁻⁵ to 3 x 10⁻⁶ 6 x 10⁻⁵ to 3 x 10⁻⁷ 25
EW 1.4 x 10⁻⁷ 1 x 10⁻⁷ 0.001
EU 4 x 10⁻⁷ 1 x 10⁻⁷ 0.001
Notes: 1. Majority of TA comprises silt and clay dominated sediments, however a thin layer of coarser grained
sediments was identified within the TA deposit.
5.2 Relevant Construction Features
Construction of the St Marys Rd park shaft comprises an excavation from ground surface to approximately 8 m bGL. The shaft will be circular with a diameter of 9 m. The construction methodology, as outlined in Aurecon, 2018a, incorporates a secant pile wall to a depth of ~3 m below the base of excavation. The wall will have an assumed permeability of 1 x 10⁻⁸ ms-1 over a 0.6 m wall thickness and

2 3
A U C K L A N D C O U N C I L - S T M A R Y S B A Y & M A S E F I E L D B E A C H W A T E R Q U A L I T Y I M P R O V E M E N T P R O J E C T – G R O U N D W A T E R T E C H N I C A L R E P O R T
A03179700R001_GW_TechnicalReport_Final.docx P A T T L E D E L A M O R E P A R T N E R S L T D
will effectively form a cut-off to horizontal groundwater flow into the excavation i.e. groundwater ingress will occur only through the base of the shaft. Dewatering during construction of the proposed shaft is potentially required for a maximum period of 2-months.
5.3 Assessment Approach
Numerical modelling using the 3D modelling package, FEFLOW 7.1 (DHI Group), was selected to aid with the dewatering effects assessment. This package utilises a finite element approach to model groundwater head and flow and set up in saturated only mode. It is industry standard software and is used worldwide within the fields of groundwater and geotechnical engineering.
The 3D covered the entire groundwater study area, as outlined in Figure 2, and the model was also utilised for the project features requiring dewatering assessment. The model was constructed and calibrated to the interpreted conceptual understating of the regional groundwater system as described above and in Section 3.0 of this report. Technical details on the model set up and calibration are provided in Appendix F.
The assessment in relation for drawdown for potential settlement was taken as drawdown below the lowest estimated seasonal groundwater level within the Fill/TL geological units.
5.4 Results
5.4.1 Groundwater Drawdown
Drawdown in the shallow Fill/TA geological units is minimal, with the 0.1 m drawdown extent predicted at a maximum of ~9 m from the excavation. The drawdown extent and magnitude is significantly limited by the presence of the secant pile walls. Figure 6 and Figure 7 display the predicted drawdown propagation in both plan and cross-section view.

2 4
A U C K L A N D C O U N C I L - S T M A R Y S B A Y & M A S E F I E L D B E A C H W A T E R Q U A L I T Y I M P R O V E M E N T P R O J E C T – G R O U N D W A T E R T E C H N I C A L R E P O R T
A03179700R001_GW_TechnicalReport_Final.docx P A T T L E D E L A M O R E P A R T N E R S L T D
Figure 6: St Mary Rd Park Shaft Fill/TL/TA Drawdown @ 2-months Dewatering
Figure 7: St Mary Rd Park Shaft Fill/TL/TA Drawdown @ 2-months Dewatering SSW-NNE Section

2 5
A U C K L A N D C O U N C I L - S T M A R Y S B A Y & M A S E F I E L D B E A C H W A T E R Q U A L I T Y I M P R O V E M E N T P R O J E C T – G R O U N D W A T E R T E C H N I C A L R E P O R T
A03179700R001_GW_TechnicalReport_Final.docx P A T T L E D E L A M O R E P A R T N E R S L T D
5.4.2 Alternative Scenario – EU Fracture Zone
To provide additional information and assessment for risk management purposes, a scenario incorporating a less likely alternative physical setting was developed. For this scenario, a large and continuous fracture zone within the EU was assumed to be present, and centred directly beneath the St Mary Rd Park shaft.
Summary of key hydraulic parameters for the EU fracture zone are outlined below;
• Horizontal Permeability = 1 x 10⁻⁵ ms-1
• Vertical Permeability = 5 x 10⁻⁶ ms-1
• Fracture Zone Width = ~30 m
• Fracture Zone Thickness = ~20 m (from base of TL/TA downwards)
Drawdown in the shallow Fill/TA geological units is still limited, with 0.35 m drawdown extending to a maximum of ~25 m from the excavation and the 0.5 m drawdown extending to a maximum of <5 m.
Predicted drawdown extent and magnitude for this alternative scenario is presented on Figure 8 and Figure 9 below.
Figure 8: Alternative Scenario EU Fracture Zone: St Mary Rd Park Shaft Fill/TL/TA Drawdown @ 2-months Dewatering

2 6
A U C K L A N D C O U N C I L - S T M A R Y S B A Y & M A S E F I E L D B E A C H W A T E R Q U A L I T Y I M P R O V E M E N T P R O J E C T – G R O U N D W A T E R T E C H N I C A L R E P O R T
A03179700R001_GW_TechnicalReport_Final.docx P A T T L E D E L A M O R E P A R T N E R S L T D
Figure 9: Alternative Scenario EU Fracture Zone: St Mary Rd Park Shaft Fill/TL/TA Drawdown @ 2-months Dewatering S-N Section
5.4.3 Groundwater Ingress
Groundwater ingress rates for both the primary case and alternative scenario assessment are provided in Table 7 below.
Table 7: St Marys Rd Park Shaft Inflow Rates
Assessment Scenario Early Time Inflow
(m3/day) Steady Inflow
(m3/day)
Primary Case 30 5
Alternative Scenario EU Fracture Zone
100 35
The majority of groundwater ingress is predicted to come from aquifer storage within the EU. It is envisaged that the water will be of suitable quality for discharge into the storm water network / marine receiving environment. Detailed groundwater quality analysis will form part of detailed design and will determine if any treatment is required before discharge.

2 7
A U C K L A N D C O U N C I L - S T M A R Y S B A Y & M A S E F I E L D B E A C H W A T E R Q U A L I T Y I M P R O V E M E N T P R O J E C T – G R O U N D W A T E R T E C H N I C A L R E P O R T
A03179700R001_GW_TechnicalReport_Final.docx P A T T L E D E L A M O R E P A R T N E R S L T D
6.0 Pt Erin Park Shaft Construction
6.1 Detailed Hydrogeology
Assessment of borehole lithology, groundwater levels, and permeability testing indicates the presence of the regional groundwater system at shallow depth beneath the shaft site and Pt Erin Park area in general. This area differs somewhat to that of St Marys Rd park in terms geology and groundwater regime.
A summary of the key conceptual interpretations for the Pt Erin Park area, and comparisons to St Marys Rd park area, are presented below:
• Fully saturated regional groundwater system only.
• Head data indicates significantly lower groundwater levels than for St Marys Rd park (~1 - 2 m lower head pressure). This is expected given the physical setting, which situated at the end of a peninsula, and means the area does not have a large up-gradient groundwater catchment plus groundwater flow is largely diverging away from Pt Erin Park.
• Clear but small (i.e. 2 - 3 mm) tidal signature observed in both logger monitored EU bores; BH08 and BH26.
• No notable fracturing observed in the EU encountered within BH08, BH26, and BH27. BH28 did display some moderate angle fracturing; however, given its location near to the shoreline and lack of fracturing observed elsewhere, this was deemed likely an isolated occurrence.
• No apparent trend in upwards or downwards head gradient between the EU and overlying Fill/TA is evident, and hydrographs of the EU bores often showing divergent trends to that of the Fill/TL bores . This indicates that the groundwater within the Fill/TL is likely to be fairly well confined hydraulically from the underlying EU, and that the EU in this region is of comparatively lower permeability than that observed at St Marys Rd park.
• The geological descriptions, coupled with the above described hydrograph behaviour and subdued tidal influence, indicate permeability of the EU in this area is likely at ‘background’ levels generally seen across Auckland.
• The Fill and TL sediments that overlie the EU are primarily sandy and have a total thickness of ~4 – 6 m across the park; and a saturated thickness of ~2 - 3 m.
• Groundwater within the EU migrates towards the Waitematā Harbour in both the NW and NE direction (i.e. diverging), and discharges predominantly to the harbour by either near-shore or off-shore submarine springs.

2 8
A U C K L A N D C O U N C I L - S T M A R Y S B A Y & M A S E F I E L D B E A C H W A T E R Q U A L I T Y I M P R O V E M E N T P R O J E C T – G R O U N D W A T E R T E C H N I C A L R E P O R T
A03179700R001_GW_TechnicalReport_Final.docx P A T T L E D E L A M O R E P A R T N E R S L T D
• Groundwater within the Fill/TL migrates towards the Waitematā Harbour in both the NW and NE directions (i.e. diverging), and discharges predominantly via low-tide seepage along the reclaimed foreshore.
• Surface recharge to the park is estimated at 200 mm/yr.
Key hydraulic parameters adopted within the assessment are summarised below in Table 8 below.
Table 8: Pt Erin Park Area – Hydraulic Parameters
Geological Unit
Horizontal Permeability (Kh)
Vertical Permeability (Kv)
Expected Typical Effective Storage
(Sy or Ss)
ms-1 ms-1 %
Fill 2 x 10⁻⁵ 1 x 10⁻⁵ 25
TL 1 x 10⁻⁵ 1 x 10⁻⁶ 25
EW 1.4 x 10⁻⁷ 1 x 10⁻⁷ 0.001
EU 1 x 10⁻⁷ 1 x 10⁻⁷ 0.001
6.2 Relevant Construction Features
Construction of the Pt Erin Park shaft comprises an excavation from ground surface to approximately 10 m bGL. The excavation will be rectangular with dimensions of ~15 m x ~7 m. The construction methodology, as outlined in Aurecon (2018a), incorporates a sheet pile wall embedded shallow into the EW or EU geology. The sheet pile wall has an estimated equivalent effective permeability of 1 x 10⁻⁶ ms-1 over ~1 m width, and consequently will provide some level of cut-off to the shallow horizontal groundwater flow into the excavation i.e. groundwater ingress will occur only through the walls and base of the shaft open to the EU. Dewatering during construction of the proposed shaft is potentially required for a maximum period of 7-months.
6.3 Assessment Approach
The same 3D groundwater model described in Section 5.3 was used to aid the assessment of the Pt Erin Park area. Please refer to this section for further details.

2 9
A U C K L A N D C O U N C I L - S T M A R Y S B A Y & M A S E F I E L D B E A C H W A T E R Q U A L I T Y I M P R O V E M E N T P R O J E C T – G R O U N D W A T E R T E C H N I C A L R E P O R T
A03179700R001_GW_TechnicalReport_Final.docx P A T T L E D E L A M O R E P A R T N E R S L T D
6.4 Results
6.4.1 Groundwater Drawdown
Drawdown in the shallow Fill/TL geological units is relatively limited, with the 1 m drawdown contour extending only to a maximum of ~5 m from the excavation and the 0.35 m drawdown extending to a maximum of ~30 m.
The drawdown extent and magnitude is significantly limited by the presence of the sheet pile wall, however due to the longer dewatering duration and lesser wall seal than for St Marys Rd park shaft, drawdown effects at overall greater for Pt Erin Park shaft. Figure 10 and Figure 11 below display the predicted drawdown results in both plan and cross-section view.
Figure 10: Pt Erin Park Shaft Fill/TL Drawdown @ 7-months Dewatering

3 0
A U C K L A N D C O U N C I L - S T M A R Y S B A Y & M A S E F I E L D B E A C H W A T E R Q U A L I T Y I M P R O V E M E N T P R O J E C T – G R O U N D W A T E R T E C H N I C A L R E P O R T
A03179700R001_GW_TechnicalReport_Final.docx P A T T L E D E L A M O R E P A R T N E R S L T D
Figure 11: Pt Erin Park Shaft Drawdown @ 7-months Dewatering S-N Section
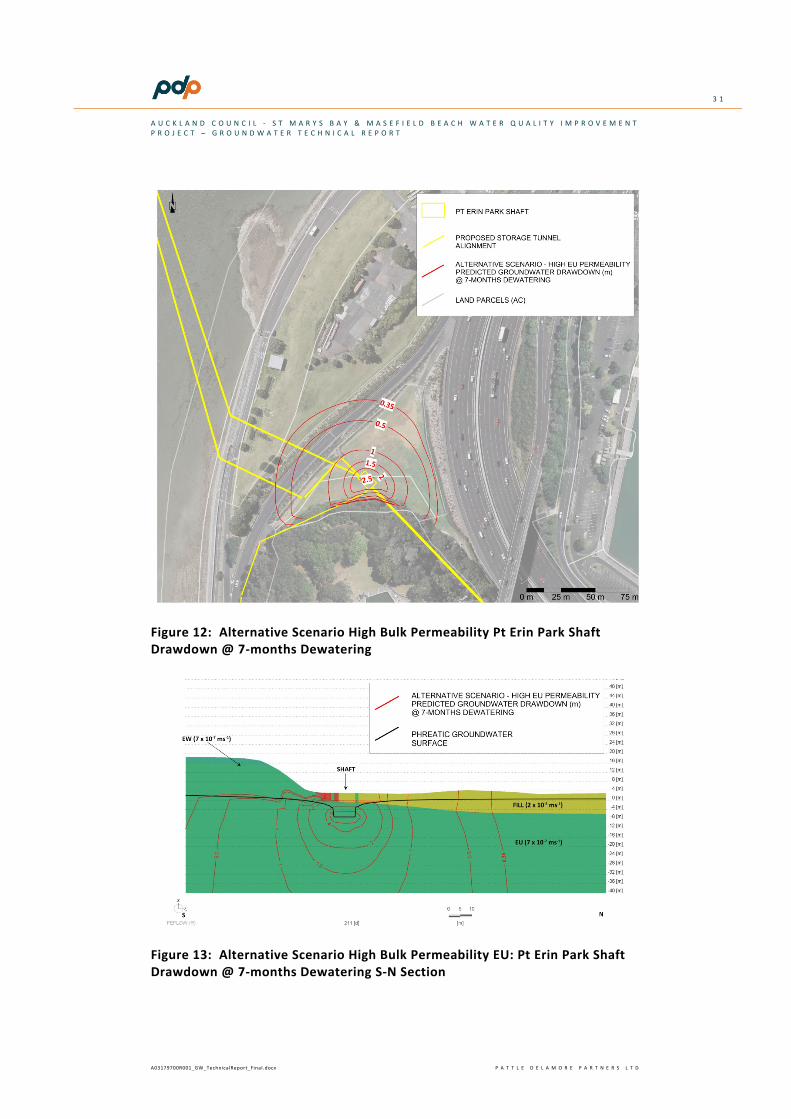
6.4.2 Alternative Scenario – High Bulk EU Permeability
To provide additional information and assessment for risk management purposes, a scenario incorporating a less likely alternative physical setting was developed. For this scenario, the bulk permeability of the EU was raised across the entire model. This concept was considered more appropriate for this area given the conceptual understanding outlined in Section 6.1 above.
Summary of key hydraulic parameters for the high bulk EU permeability scenario are outlined below:
• Horizontal EW and EU Permeability = 7 x 10⁻⁷ ms-1
• Vertical EW and EU Permeability = 6 x 10⁻⁷ ms-1
Drawdown in the shallow Fill/TL geological units is still relatively limited, with the 1 m drawdown extending only to a maximum of ~25 m from the excavation and the 0.35 m drawdown extending to a maximum of ~50 m.
Figure 12 and Figure 13 below display the predicted drawdown results in both plan and cross-section view.
3 1
A U C K L A N D C O U N C I L - S T M A R Y S B A Y & M A S E F I E L D B E A C H W A T E R Q U A L I T Y I M P R O V E M E N T P R O J E C T – G R O U N D W A T E R T E C H N I C A L R E P O R T
A03179700R001_GW_TechnicalReport_Final.docx P A T T L E D E L A M O R E P A R T N E R S L T D
Figure 12: Alternative Scenario High Bulk Permeability Pt Erin Park Shaft Drawdown @ 7-months Dewatering
Figure 13: Alternative Scenario High Bulk Permeability EU: Pt Erin Park Shaft Drawdown @ 7-months Dewatering S-N Section

3 2
A U C K L A N D C O U N C I L - S T M A R Y S B A Y & M A S E F I E L D B E A C H W A T E R Q U A L I T Y I M P R O V E M E N T P R O J E C T – G R O U N D W A T E R T E C H N I C A L R E P O R T
A03179700R001_GW_TechnicalReport_Final.docx P A T T L E D E L A M O R E P A R T N E R S L T D
6.4.3 Groundwater Ingress
Groundwater ingress rates for both the primary and alternative assessment are provided in Table 9 below:
Table 9: Pt Erin Park Shaft Inflow Rates
Assessment Scenario Early Time Inflow
(m3/day) Steady Inflow
(m3/day)
Primary Case 50 10
Alternative Scenario – High Bulk Permeability EU
100 35
The majority of groundwater ingress is predicted to come from aquifer storage within the EU. It is envisaged that the water will be of suitable quality for discharge into the storm water network / marine receiving environment. Detailed groundwater quality analysis will form part of detailed design and will determine if any treatment is required before discharge.
7.0 Pt Erin Park Weir Structure to Marine Outfall Construction
7.1 Relevant Construction Features
The preferred construction method for the pipeline connection from the Pt Erin Weir Structure to the marine outfall is via closed face pipejack (Aurecon, 2018a). However, a secondary option for the connection involves installation via open trenching (Option 1A alignment). This construction methodology has been assessed to provide an envelope of potential groundwater effects should it be needed.
The proposed pipeline grades from an invert of ~0 m RL (~3 m bGL) at Pt Erin Weir Structure, to ~-4 m RL (~7 m bGL) at the coastline manhole (MH01-03). Trench invert is assumed at 1 m below the pipeline invert, and trench width is ~3 m. Dewatering during trenching and pipeline installation is potentially required for a maximum period of 2-months.
For the purposes of this assessment, the full length of the trench has been instantaneously introduced to the model, and set to drain for the full 2-month period. The model trenches have been run simultaneously with the Pt Erin Park Shaft and the wastewater mains connection trench (Section 7.0), as this is possible within the construction sequence; specifically; Pt Erin Park shaft drained from model time 0 to 7-months, with the Option A1 trench drained from model time 5-months to 7-months.
3 3
A U C K L A N D C O U N C I L - S T M A R Y S B A Y & M A S E F I E L D B E A C H W A T E R Q U A L I T Y I M P R O V E M E N T P R O J E C T – G R O U N D W A T E R T E C H N I C A L R E P O R T
A03179700R001_GW_TechnicalReport_Final.docx P A T T L E D E L A M O R E P A R T N E R S L T D
7.2 Results
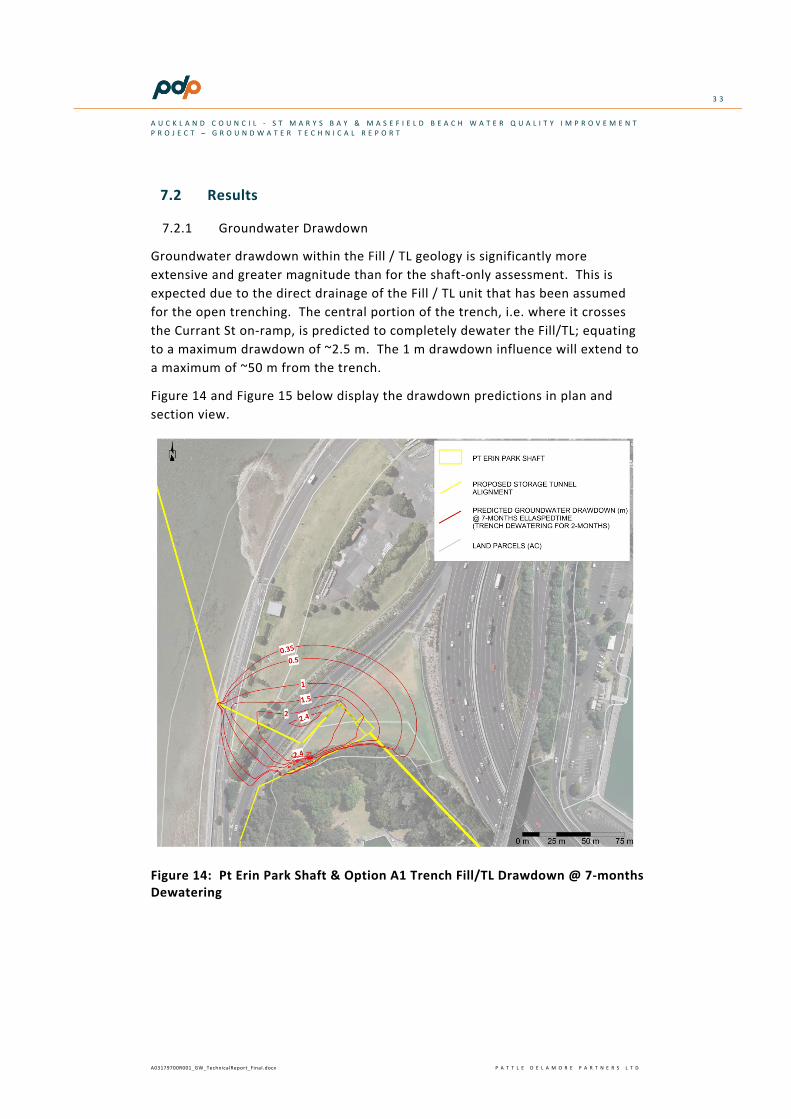
7.2.1 Groundwater Drawdown
Groundwater drawdown within the Fill / TL geology is significantly more extensive and greater magnitude than for the shaft-only assessment. This is expected due to the direct drainage of the Fill / TL unit that has been assumed for the open trenching. The central portion of the trench, i.e. where it crosses the Currant St on-ramp, is predicted to completely dewater the Fill/TL; equating to a maximum drawdown of ~2.5 m. The 1 m drawdown influence will extend to a maximum of ~50 m from the trench.
Figure 14 and Figure 15 below display the drawdown predictions in plan and section view.
Figure 14: Pt Erin Park Shaft & Option A1 Trench Fill/TL Drawdown @ 7-months Dewatering

3 4
A U C K L A N D C O U N C I L - S T M A R Y S B A Y & M A S E F I E L D B E A C H W A T E R Q U A L I T Y I M P R O V E M E N T P R O J E C T – G R O U N D W A T E R T E C H N I C A L R E P O R T
A03179700R001_GW_TechnicalReport_Final.docx P A T T L E D E L A M O R E P A R T N E R S L T D
Figure 15: Pt Erin Park Option A1 Trench Drawdown @ 7-months Dewatering SW-NE Section Along Curran St Onramp
7.2.2 Groundwater Ingress
Groundwater ingress rates for both the primary and alternative assessment are provided in Table 10 below. Actual inflow rates will be significantly influenced by the actual construction sequence, primarily the amount of trench area open beneath the groundwater table. Due to the assessment assumption of having an instantaneous open trench, these inflow rates are considered towards the upper end of what could be expected.
Table 10: Option A1 Trench Inflow Rates
Assessment Scenario Early Time Inflow1
(m3/day) Steady Inflow1
(m3/day)
Primary 1000 100-200
Notes: 1. Assumes instantaneous open trench.
The majority of groundwater ingress is predicted to come from aquifer storage within the Fill and TL geology, however for the portion of trench within ~40 m proximity of the western coastline, recharging seawater will likely dominate the water ingress.
It is envisaged that the ingress water will be of suitable quality for discharge into the storm water network / marine receiving environment. Detailed groundwater quality analysis will form part of detailed design and will determine if any treatment is required before discharge.
3 5
A U C K L A N D C O U N C I L - S T M A R Y S B A Y & M A S E F I E L D B E A C H W A T E R Q U A L I T Y I M P R O V E M E N T P R O J E C T – G R O U N D W A T E R T E C H N I C A L R E P O R T
A03179700R001_GW_TechnicalReport_Final.docx P A T T L E D E L A M O R E P A R T N E R S L T D
8.0 Pt Erin Park Weir Structure to Wastewater Mains Connection Construction
8.1 Hydrogeology
Along Sarsfield St, shallow geology is predominantly ER and Fill (of the re-worked ER type). Drawdown with the ER geology is limited in both extent and magnitude; which is expected given the comparatively low permeability (assumed at 5 x 10⁻⁷ ms-1). Monitoring bore BH30, is screened in ER with a bottom of screen depth at approximately 5.5 m depth – however the bore has been recorded as dry i.e. does not intersect groundwater at least for some period of the year. It is likely that groundwater within the geology along Sarsfield is below that of the trench invert level. Despite this observation, the overall paucity of groundwater data in this area has led to a conservative calibration for the groundwater model, with starting heads at ~1 – 1.5 m bGL along Sarsfield St. Consequently, the drawdown predictions presented in Figure 16 (below) are deemed very conservative.
A small, isolated occurrence of TA is interpreted along Curran St, adjacent to a stream/gully which runs off the park area encompassing Pt Erin Pools. Drawdown extent is predicted to be slightly larger here due to the estimated higher permeability of the TA compared to ER.
8.2 Relevant Construction Features
The proposed pipeline grades from an invert of ~0 m RL (~3 m bGL) at Pt Erin Weir Structure, to ~9 m RL (~6 m bGL) at the Sarsfield St network connection (SSMH1.1). Trench invert is assumed at 1 m below the pipeline invert. Dewatering during trenching and pipeline installation is potentially required for a maximum period of 2-months.
For the purposes of this assessment, the full length of the trench has been instantaneously introduced to the model, and set to drain for the full 2-month period. The model trenches have been run simultaneously with the Pt Erin Park Shaft and the Option A1 trench, as this is possible within the construction sequence; specifically; Pt Erin Park Shaft drained from model time 0 to 7-months, with the wastewater mains connection trench drained from model time 5-months to 7-months.
8.3 Results
8.3.1 Groundwater Drawdown
Drawdown in the ER along Sarsfield St is very limited, with the 1 m drawdown extending only to a maximum of ~3 m from the excavation and the 0.35 m drawdown extending to a maximum of ~8 m.

3 6
A U C K L A N D C O U N C I L - S T M A R Y S B A Y & M A S E F I E L D B E A C H W A T E R Q U A L I T Y I M P R O V E M E N T P R O J E C T – G R O U N D W A T E R T E C H N I C A L R E P O R T
A03179700R001_GW_TechnicalReport_Final.docx P A T T L E D E L A M O R E P A R T N E R S L T D
Drawdown in the isolated TA unit is also relatively limited, with the 1 m drawdown extending only to a maximum of ~5 m from the excavation and the 0.35 m drawdown extending to a maximum of ~20 m.
Figure 16 displays the drawdown predictions for the wastewater mains connection trench within the ER and TA geology.
Figure 16: Wastewater Mains Connection Trench ER and TA Drawdown @ 7-months Dewatering
8.3.2 Groundwater Ingress
Small groundwater ingress rates are predicted for the wastewater mains connection trench; with steady flow rates ~20 m3/day (or less), assuming the entire length of the trench is open at once.
The majority of groundwater ingress is predicted to come from aquifer storage within the ER and TA geology. It is envisaged that the water will be of suitable quality for discharge into the storm water network / marine receiving environment. Detailed groundwater quality analysis will form part of detailed design and will determine if any treatment is required before discharge.
3 7
A U C K L A N D C O U N C I L - S T M A R Y S B A Y & M A S E F I E L D B E A C H W A T E R Q U A L I T Y I M P R O V E M E N T P R O J E C T – G R O U N D W A T E R T E C H N I C A L R E P O R T
A03179700R001_GW_TechnicalReport_Final.docx P A T T L E D E L A M O R E P A R T N E R S L T D
9.0 Hackett St EOP Connection Construction
9.1 Relevant Construction Features
The proposed connection pipeline will require a trench with maximum depth of ~5 m, connecting the existing wastewater network into the tunnel at St Marys Rd park shaft. Dewatering during trenching and pipeline installation is potentially required for a maximum period of 2-months.
For the purposes of this assessment, the full length of the trench has been instantaneously introduced to the model, and set to drain for the full 2-month period. Construction sequence has this connection being installed after the completion of the St Marys Rd park shaft excavation. The model trench has been run within the model as the sole draining feature, but includes the tanked subsurface tunnel and shaft infrastructure.
9.2 Results
9.2.1 Groundwater Drawdown
Drawdown is predicted within the Fill of St Marys Rd park, and is of limited extent; primarily due to the limited saturated thickness of the Fill in this area of the park i.e. EU/EW is shallow and the Fill is pinching-out towards the toe of the sea cliffs. The 1 m drawdown prediction within the Fill extends only to a maximum of ~4 m from the excavation, and the 0.35 m drawdown extending to a maximum of ~18 m.
Figure 17 displays the drawdown predictions for the EOP connection trench within the Fill geology.

3 8
A U C K L A N D C O U N C I L - S T M A R Y S B A Y & M A S E F I E L D B E A C H W A T E R Q U A L I T Y I M P R O V E M E N T P R O J E C T – G R O U N D W A T E R T E C H N I C A L R E P O R T
A03179700R001_GW_TechnicalReport_Final.docx P A T T L E D E L A M O R E P A R T N E R S L T D
Figure 17: EOP Connection Trench Fill Drawdown @ 2-months Dewatering
9.2.2 Groundwater Ingress
Small groundwater ingress rates are predicted for the EOP connection trench; with steady flow rates ~20 m3/day (or less), assuming the entire length of the trench is open at once.
The majority of groundwater ingress is predicted to come from aquifer storage within the Fill geology. It is envisaged that the water will be of suitable quality for discharge into the storm water network / marine receiving environment. Detailed groundwater quality analysis will form part of detailed design and will determine if any treatment is required before discharge.

3 9
A U C K L A N D C O U N C I L - S T M A R Y S B A Y & M A S E F I E L D B E A C H W A T E R Q U A L I T Y I M P R O V E M E N T P R O J E C T – G R O U N D W A T E R T E C H N I C A L R E P O R T
A03179700R001_GW_TechnicalReport_Final.docx P A T T L E D E L A M O R E P A R T N E R S L T D
10.0 Storage Tunnel Construction
10.1 Relevant Construction Features
Preferred construction method for the boring and installation of the storage tunnel is via closed face pipejack or tunnel boring machine (Aurecon, 2018a), and is therefore effectively an ‘undrained’ construction methodology. However, an assessment of potential groundwater drawdown and inflow has been completed for selected sections of the alignment assuming a fully drained tunnelling method. The selected sections are based where the tunnelling horizon intersects competent EU rock and EU/EW cover of >~5 m. The locations of the selected sections and the assumed drainage durations are outlined below:
• Section 1: Ch30 m to Ch150 m – assumed 40 days drained
• Section 2: Ch250 m to Ch550 m – assumed 90days drained
• Section 3: Ch825 m to Ch1005 m – assumed 55 days drained
For the purposed of the assessment, it is assumed that each drained tunnel section is instantaneously introduced to the model, and set to drain for the full time period outlined above. The primary case model has been utilised for the predictions, and further details on the assessment within the 3D model are provided in Appendix F.
10.2 Results
10.2.1 Groundwater Drawdown
Drawdown within the EU at and adjacent to the tunnelling horizon is predicted for the selected drained tunnel sections. However, no significant drawdown (i.e. >1 m) is predicted within the ER or Fill geology which overly the selected sections of drained tunnel. Figure 18 below shows the EU drawdown at the tunnel horizon, and Figure 19 show a typical cross-section view of the drawdown propagation.

4 0
A U C K L A N D C O U N C I L - S T M A R Y S B A Y & M A S E F I E L D B E A C H W A T E R Q U A L I T Y I M P R O V E M E N T P R O J E C T – G R O U N D W A T E R T E C H N I C A L R E P O R T
A03179700R001_GW_TechnicalReport_Final.docx P A T T L E D E L A M O R E P A R T N E R S L T D
Figure 18: Drained Tunnel Sections: Predicted Drawdown in EU at Invert Level
Figure 19: Drained Tunnel Drawdown: Cross-Section Through ‘Section 2’

4 1
A U C K L A N D C O U N C I L - S T M A R Y S B A Y & M A S E F I E L D B E A C H W A T E R Q U A L I T Y I M P R O V E M E N T P R O J E C T – G R O U N D W A T E R T E C H N I C A L R E P O R T
A03179700R001_GW_TechnicalReport_Final.docx P A T T L E D E L A M O R E P A R T N E R S L T D
10.2.2 Groundwater Ingress
Average groundwater ingress rates for each section are:
• Section 1 = 13 m3/d
• Section 2 = 52 m3/d
• Section 3 = 62 m3/d

4 2
A U C K L A N D C O U N C I L - S T M A R Y S B A Y & M A S E F I E L D B E A C H W A T E R Q U A L I T Y I M P R O V E M E N T P R O J E C T – G R O U N D W A T E R T E C H N I C A L R E P O R T
A03179700R001_GW_TechnicalReport_Final.docx P A T T L E D E L A M O R E P A R T N E R S L T D
11.0 Assessment of Other Potential Groundwater Effects
11.1 Saline Intrusion Potential - Assessment
Due to the coastal setting of the project area, and dewatering requirements outlined in the above sections, an assessment of saline intrusion effects i.e. draw of seawater into groundwater has been completed using particle tracking within the 3D groundwater flow model.
Model particles were released from both within the project features being dewatered (i.e. shafts, trenches), and from the adjacent seawater body. Particles starting at project features were run in the ‘backwards’ direction, whilst the seawater particles were set to run in the ‘forwards’ direction. Particles were release within both shallow and deep geological units / model layers. This approach was deemed a reasonable approximation for assessment of the likely extent of groundwater particle advection during the various dewatering periods.
For all three shaft excavations, the wastewater mains connection trench, and the EOP connection trench; nil/negligible saline intrusion effects are predicted.
For the Option A1 trench (Pt Erin Weir Structure to marine outfall connection), saline intrusion is predicted; and this is expected due to the proximity of the trench to the coastline. The model predicts that particles released from the sea will encroach to a maximum of approximately 30 m landward within the Fill/TL units. In terms of actual groundwater chemistry effects, these are likely to extend further than the predicted limit of advection. Notable changes to groundwater salinity are estimated to extend up to ~50 m inland, centred on the trench axis, and extending ~50 m width adjacent to the trench axis. It is noted that BH09A, located approximately 30 m from the coast, displays groundwater chemistry which indicates existing influence from saline water.
Figure 20 and Figure 21 display the particle tracking within the project area.

4 3
A U C K L A N D C O U N C I L - S T M A R Y S B A Y & M A S E F I E L D B E A C H W A T E R Q U A L I T Y I M P R O V E M E N T P R O J E C T – G R O U N D W A T E R T E C H N I C A L R E P O R T
A03179700R001_GW_TechnicalReport_Final.docx P A T T L E D E L A M O R E P A R T N E R S L T D
Figure 20: Saline Intrusion Particle Tracking (Southern Area)

4 4
A U C K L A N D C O U N C I L - S T M A R Y S B A Y & M A S E F I E L D B E A C H W A T E R Q U A L I T Y I M P R O V E M E N T P R O J E C T – G R O U N D W A T E R T E C H N I C A L R E P O R T
A03179700R001_GW_TechnicalReport_Final.docx P A T T L E D E L A M O R E P A R T N E R S L T D
Figure 21: Saline Intrusion Particle Tracking (Northern Area)
11.2 Other Groundwater Users - Assessment
There are no active groundwater takes or registered groundwater bores with the potential for groundwater take within the project area outlined in Figure 2. Consequently, the Project is not assessed to have any impacts on other existing groundwater users.
Potential for future groundwater users to be impacted by the Project are low, given the temporal nature of the proposed dewatering, the lack of viable water supply aquifers within potentially affected area, and the good accessibility to water supply mains.

4 5
A U C K L A N D C O U N C I L - S T M A R Y S B A Y & M A S E F I E L D B E A C H W A T E R Q U A L I T Y I M P R O V E M E N T P R O J E C T – G R O U N D W A T E R T E C H N I C A L R E P O R T
A03179700R001_GW_TechnicalReport_Final.docx P A T T L E D E L A M O R E P A R T N E R S L T D
12.0 Infrastructure Operation
12.1 Groundwater Mounding Potential
The proposed storage tunnel and associated sub-surface infrastructure is to be fully sealed for operation. An assessment of groundwater mounding potential was completed to check for potential effects, particularly in the St Marys Rd park area and Pt Erin Park area – where subsurface sealed structures are of significant size and in some areas orientated across the groundwater flow direction.
The 3D groundwater flow model was used to aid the assessment, whereby the St Marys Rd park storage tunnel and manhole plus the Pt Erin Weir Structure and marine connection outline were assigned to a very low permeability (1 x 10⁻⁹ ms-1).
No discernible groundwater mounding was predicted over a steady-state model run, and the potential effects from groundwater mounding are assessed as negligible.
Technical details on this assessment scenario are provided in Appendix F.

4 6
A U C K L A N D C O U N C I L - S T M A R Y S B A Y & M A S E F I E L D B E A C H W A T E R Q U A L I T Y I M P R O V E M E N T P R O J E C T – G R O U N D W A T E R T E C H N I C A L R E P O R T
A03179700R001_GW_TechnicalReport_Final.docx P A T T L E D E L A M O R E P A R T N E R S L T D
13.0 Proposed Groundwater Monitoring Locations & Alert Levels
Proposed monitoring bore locations, ‘Alert’ trigger levels, and monitoring frequency is provided in Appendix G.

4 7
A U C K L A N D C O U N C I L - S T M A R Y S B A Y & M A S E F I E L D B E A C H W A T E R Q U A L I T Y I M P R O V E M E N T P R O J E C T – G R O U N D W A T E R T E C H N I C A L R E P O R T
A03179700R001_GW_TechnicalReport_Final.docx P A T T L E D E L A M O R E P A R T N E R S L T D
14.0 Summary and Conclusion
A detailed assessment of the groundwater regime and hydrogeological conditions within the project area of the St Marys Bay and Masefield Beach Water Quality Improvement Project has been completed and presented within this report. Investigation work covered the range of key geological terrane within the project area, through both desktop and field-based methods. Field investigations have included;
• 18 core boreholes with associated downhole testing
• 6 CPT probes
• Geophysical surveying
• Installation and monitoring of 18 groundwater monitoring bores (piezometers)
• Groundwater quality sampling
• Hydraulic testing
• Project area mapping and surveying
Thorough analysis and interpretation of the investigation data, and detailed characterisation of the key project sites completed. The hydrogeology of the project area has then been digitally represented and simulated within both 2D and 3D groundwater flow models. The flow models have been used to aid assessment of potential drawdown and groundwater ingress associated with project features requiring construction phase dewatering.
A summary of the key project features and their associated maximum dewatering depths and drawdown is provided below in Table 11. Information provided within Table 11 relates to the primary predictions for each project feature.

4 8
A U C K L A N D C O U N C I L - S T M A R Y S B A Y & M A S E F I E L D B E A C H W A T E R Q U A L I T Y I M P R O V E M E N T P R O J E C T – G R O U N D W A T E R T E C H N I C A L R E P O R T
A03179700R001_GW_TechnicalReport_Final.docx P A T T L E D E L A M O R E P A R T N E R S L T D
Table 11: Summary of Project Feature Dewatering Depth & Drawdown1
Project Feature
Maximum Dewatering
Depth
Maximum Dewatering
Duration
Geological Unit of
Interest2
Maximum Drawdown in Unit of Interest2
Maximum Distance to
1 m Drawdown2
New St / London St
Shaft 22 m 7-months
ER and Fill (silt & clay
dominated) 2 m 8 m
St Marys Rd Park Shaft
8 m 2-months Fill (sandy)
and TA (silty)
<0.5 -
Pt Erin Park Shaft
10 m 7-months Fill and TL
(sandy) 1 m <5 m
Option A1 Outfall
Connection Trench
7 m 2-months Fill and TL
(sandy) 2.5 m 50 m
Wastewater Mains
Connection Trench
7 m 2-months
ER and Fill (silt & clay
dominated) TA (silty)
3 m 5 m
EOP Connection
Trench 4 m 2-months Fill (sandy) 1.5 m 4 m
Drained Tunnel
Sections3 22 m 7-months
ER, Fill, TL, TA
- -
Notes: 1. Predictions for primary case assessment. 2. Relates to geological units with settlement potential only i.e. units classified as soil strength 3. Relates to selected areas of the tunnel alignment only, with these being areas strictly within competent EU
geology and with significant cover i.e. >5 m cover.
A summary of the key project features and their associated groundwater ingress rates during construction dewatering is provided below in Table 12. Information provided within Table 12 relates to the primary predictions for each project feature.

4 9
A U C K L A N D C O U N C I L - S T M A R Y S B A Y & M A S E F I E L D B E A C H W A T E R Q U A L I T Y I M P R O V E M E N T P R O J E C T – G R O U N D W A T E R T E C H N I C A L R E P O R T
A03179700R001_GW_TechnicalReport_Final.docx P A T T L E D E L A M O R E P A R T N E R S L T D
Table 12: Summary of Project Feature Groundwater Ingress Rate & Origin1
Project Feature Early Time
Inflow Rate (m3/day)1
Steady Inflow Rate
(m3/day)1
Primary Groundwater
Origin
New St / London St Shaft 50 8 EU
St Marys Rd Park Shaft
30 5 EU
Pt Erin Park Shaft 50 10 EU
Option A1 Outfall Connection Trench
1000 100 Fill & TL
Wastewater Mains Connection Trench
30 20 ER, Fill & TA
EOP Connection Trench
50 20 Fill
Drained Tunnel Sections2 - 30 - 60 EU
Notes: 1. Predictions for primary case assessment. 2. Relates to selected areas of the tunnel alignment only, with these being areas strictly within competent
EU geology and with significant cover i.e. >10 m cover.
Discharge of ingress groundwater during construction is proposed to be to the storm water network / marine environment. Discharge water quality is envisaged to be suitable for direct discharge to the receiving environment however detailed groundwater quality analysis and determination of any treatment requirement will be completed during detailed design.
Potential saline intrusion impacts from construction dewatering associated with the New St / London St shaft, St Marys Rd park shaft, Pt Erin Park shaft, the wastewater mains connection trench, and the EOP connection trench are assessed as nil/negligible. Saline intrusion effects for the Option A1 trench from Pt Erin Weir Structure to marine outfall connection are limited to approximately 50 m inland within the Fill/TL geology, and limited to ~50 m width adjacent to the trench alignment.
There are no existing groundwater users within the project area potential future groundwater users are unlikely to be impacted given the temporal nature of the construction dewatering.

5 0
A U C K L A N D C O U N C I L - S T M A R Y S B A Y & M A S E F I E L D B E A C H W A T E R Q U A L I T Y I M P R O V E M E N T P R O J E C T – G R O U N D W A T E R T E C H N I C A L R E P O R T
A03179700R001_GW_TechnicalReport_Final.docx P A T T L E D E L A M O R E P A R T N E R S L T D
Groundwater monitoring locations and Alert Levels conditions have been proposed, and these have been based on both the primary case and alternative scenarios (for risk management purposes) completed within the assessment.

5 1
A U C K L A N D C O U N C I L - S T M A R Y S B A Y & M A S E F I E L D B E A C H W A T E R Q U A L I T Y I M P R O V E M E N T P R O J E C T – G R O U N D W A T E R T E C H N I C A L R E P O R T
A03179700R001_GW_TechnicalReport_Final.docx P A T T L E D E L A M O R E P A R T N E R S L T D
15.0 Works Cited
Aurecon. (2018). St Marys Bay and Masefield Beach Water Quality Improvement Project - Ground Investigaiton Factual Report prepared for Auckland Council ref. 255303v3. Auckland: Aurecon NZ Ltd.
Aurecon. (2018a). St Marys Bay and Masefield Beach Water Quality Improvement Project - Construction Methodology ref: 255303v3. Auckland: Aurecon NZ Ltd.
Aurecon. (2018b). St Marys Bay and Masefield Beach Water Quality Improvement Project - Concept Design Drawing Set. Ref: 255303 0000 DRG CC 1021 D. Auckland: Aurecon NZ Ltd.
Aurecon. (2018c). Geological Long Section. Ref: 255303 0000 DRG GG A. Auckland: Aurecon NZ Ltd.
Barrett, M., Hiscock, K., Pedley, S., Lerner, D., Tellam, J., & French, M. (1999). Marker species for identifying urban groundwater recharge sources: A case study in Nottingham, UK. Water Resources Vol. 33(14), 3083-3097.
Chappell, P. R. (2015). The climate and weather of Auckland; 2nd edition ISSN 1173-0382. NIWA.
Edbrooke, S. W. (2001). Geology of the Auckland area. Institute of Geological and Nuclear Sciences 1:250 000 geological map 3. Lower Hutt: Institute of Geological and Nuclear Sciences Limited.
High, R. (1976). The Structural Geology of the Waitemata Group in the Pt. Erin – Gasworks Area, Auckland. Auckland: University of Auckland.
PDP. (2000). Groundwater Effects Assessments of Queen Street Station. Prepared for Auckland City Council. Auckalnd: Pattle Delamore Partners Ltd.
PDP. (2014). Auckland City Rail Link: Groundwater Effects Assessment - Britomart to Wyndham A02502782. Auckland: Pattle Delamore Partners Ltd.
PDP. (2015). Auckland City Rail Link: Karangahape Road Pumping Test Report (Stage 3). Auckland: Pattle Delamore Partners Ltd.