Groundwater Reliability Improvement Program (GRIP ...
80
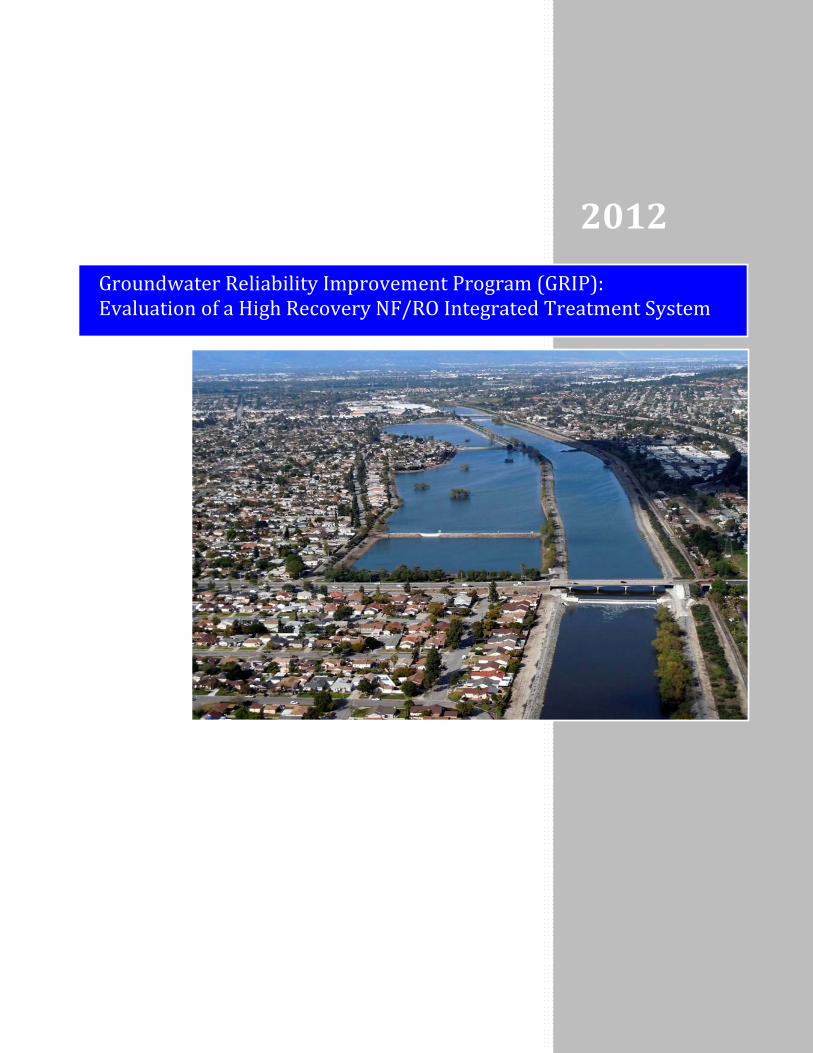
2012 Groundwater Reliability Improvement Program (GRIP): Evaluation of a High Recovery NF/RO Integrated Treatment System
Transcript of Groundwater Reliability Improvement Program (GRIP ...
2012
Groundwater Reliability Improvement Program (GRIP): Evaluation of a High Recovery NF/RO Integrated Treatment System

Cooperative Agreement No. R11AC35293
Groundwater Reliability Improvement Program (GRIP): Evaluation of a High Recovery NF/RO
Integrated Treatment System
Final Report
Submitted to:
United States Department of the Interior Bureau of Reclamation
Prepared by:
Sanitation Districts of Los Angeles County
June 29, 2012
i
Table of Contents
List of Tables……………………………………….…………………………….………. ii List of Figures…………………………………………………………………………….. iii Abbreviations……………………………………………………………………………... iv Acknowledgements……………………………………………………………………….. v Project Summary………………………………………………………………………….. vi 1. Introduction..………………………………………………...………………………… 1 1.1 Groundwater Reliability Improvement Program………..……………...…...……. 1 1.1.1 Collaborating Agencies………………………………………………...…… 1 1.1.2 Project Background………………………………………………………..... 2 1.2 High Recovery NF/RO Integrated Treatment System…...…...………………..…. 4 1.3 Project Objectives………………………………………...……...……………….. 6
2. Technical Approach…………………………….………………...….………………... 7 2.1 Test Site………...…….………………………………………………………...… 7 2.2 Pilot System……….……………………………………………………………… 8 2.3 Testing Conditions....…………………………………………………….……….. 13 2.4 Water Quality Sampling and Analysis Plan.……….....………………………...… 15 2.5 Membrane Autopsy Analyses……………...…………………………………...… 18 3. Results…………………………………………………………………………………. 19 3.1 Operational Performance Results..……………………………………………….. 19 3.1.1 Phase One - Primary NF System…………………………………………. .. 19 3.1.2 Phase One - Secondary RO System………………………………………… 21 3.1.3 Phase Two - Primary NF System…………………………………………… 23 3.1.4 Phase Two - Secondary RO System………………………………………... 24 3.2 Membrane Autopsy Results...…………………………………………………….. 25 3.2.1 Primary NF System……………………………………….………………. .. 25 3.2.1.1 External Visual Exam……………………………………………… 25 3.2.1.2 Wet Test…………….……………………………………………… 25 3.2.1.3 Internal Visual Exam………………………………………………. 26 3.2.1.4 Foulant Analyses…………………………………………………… 27 3.2.2 Secondary RO System……………………………………….……...……. .. 29 3.2.2.1 External Visual Exam……………………………………………… 29 3.2.2.2 Wet Test…………….……………………………………………… 29 3.2.2.3 Internal Visual Exam………………………………………………. 29 3.2.2.4 Foulant Analyses…………………………………………………… 31 3.3 Rejection Performance Results…………………………………………………… 33 3.3.1 General Water Quality Parameters…………………………………………. 33 3.3.2 Chemicals of Emerging Concern…………………………………………… 34 4. Summary and Conclusions……………………………………………………………. 44 References………………………………………………………………………………… 46 Appendix A, San Jose Creek Water Reclamation Plant………………………………….. 48 Appendix B, Dow Ultrafiltration System Presentation…………………………………… 53 Appendix C, Analytical Methods……………………..………………………………….. 69
ii
List of Tables
2-1 Dow SFP 2880 UF System Components…………………………………….….. 10 2-2 Primary NF System Components……………………………………………….. 11 2-3 NF-270 and TFC-HR Membrane Element Specifications ……………………… 12 2-4 Secondary RO System Components…………………….………..……………... 12 2-5 NF/RO Integrated System Average Operating Conditions……………………… 14 2-6 Primary NF System Operations Parameters….……………………………..…... 15 2-7 Secondary RO System Operations Parameters ………………………….……… 15 2-8 General Water Quality Parameters Monitored in this Study…...……………….. 16 2-9 Chemicals of Emerging Concern Monitored in this Study……………………… 17 2-10 Membrane Autopsy Analyses.…………………………………………………... 18 3-1 Primary NF System Phase One and Two Permeate Flow Ratios……………….. 20 3-2 Primary NF System Phase One and Two Fluxes………………………………... 21 3-3 Secondary RO System Phase One and Two Flux, Recovery, and Cross Flow
Velocity………………………………………………………………………….. 22
3-4 Wet Test Results for Lead and Tail NF Elements………………………………. 25 3-5 Wet Test Results for Lead and Tail RO Elements………………………………. 29 3-6 Primary NF System Rejection Results for General Water Quality Parameters..... 36 3-7 Secondary RO System Rejection Results for General Water Quality Parameters 37 3-8 Overall NF/RO Integrated System Rejection Results for General Water Quality
Parameters……………………………………………………………………...... 38
3-9 Primary NF System Rejection Results for CECs……………………………....... 39 3-10 Secondary RO System Rejection Results for CECs………………...………....... 40 3-11 Overall NF/RO Integrated System Rejection Results for CECs……….……....... 41 3-12 Drinking Water Equivalent Levels and Observed Removals by AOP and SAT
for Select CECs………………………………………………………………….. 41
iii
List of Figures 1-1 WRD Service Area…………...…………………………………………………. 1 1-2 Sanitation Districts’ Service Area……………………………………………….. 2 1-3 Vicinity Map of Rio Hondo and San Gabriel River Spreading Basins……….… 3 1-4 Rio Hondo and San Gabriel River Spreading Basins…….……………………... 4 1-5 GRIP AWTP Process Train……………………………………………………... 4 1-6 Alternative GRIP AWTP Process Train with High Recovery NF/RO Integrated
Treatment System…………………………………………………...…………... 5
2-1 Pilot Study Test Site.……………………………………………………………. 7 2-2 Schematic Diagram of the Pilot System…..………...…………………………... 9 2-3 Dow SFP 2880 UF System...………………………………………………..…... 10 2-4 Primary NF System……………………………………………………………… 11 2-5 Secondary RO System……..……………………………………………………. 12 3-1 Phase One Primary NF System Normalized Specific Flux………………..……. 20 3-2 Phase One Secondary RO System Normalized Specific Flux……………..……. 22 3-3 Phase Two Primary NF System Normalized Specific Flux………………..……. 23 3-4 Phase Two Secondary RO System Normalized Specific Flux and Feed pH……. 24 3-5 Lead NF Element Active Membrane Surface…………………………………… 26 3-6 Tail NF Element Active Membrane Surface…….……………………………… 26 3-7 Lead NF Element SEM Image………………………………………………….. 28 3-8 Tail NF Element SEM Image…………………………………..……………….. 28 3-9 Lead RO Element Active Membrane Surface……………………………...…… 30 3-10 Tail RO Element Active Membrane Surface…….……………………………… 30 3-11 Lead RO Element SEM Image………………………………………………….. 32 3-12 Tail RO Element SEM Image…………………………………..……………….. 32 3-13 Average Rejection Results for CECs Detected in Primary NF System Feed…… 42 3-14 Average Rejection Results for CECs Detected in Secondary RO System Feed… 42 3-15 Primary NF System and Overall NF/RO Integrated System Average Rejection
Results for CECs………………………………………………………………… 43
iv
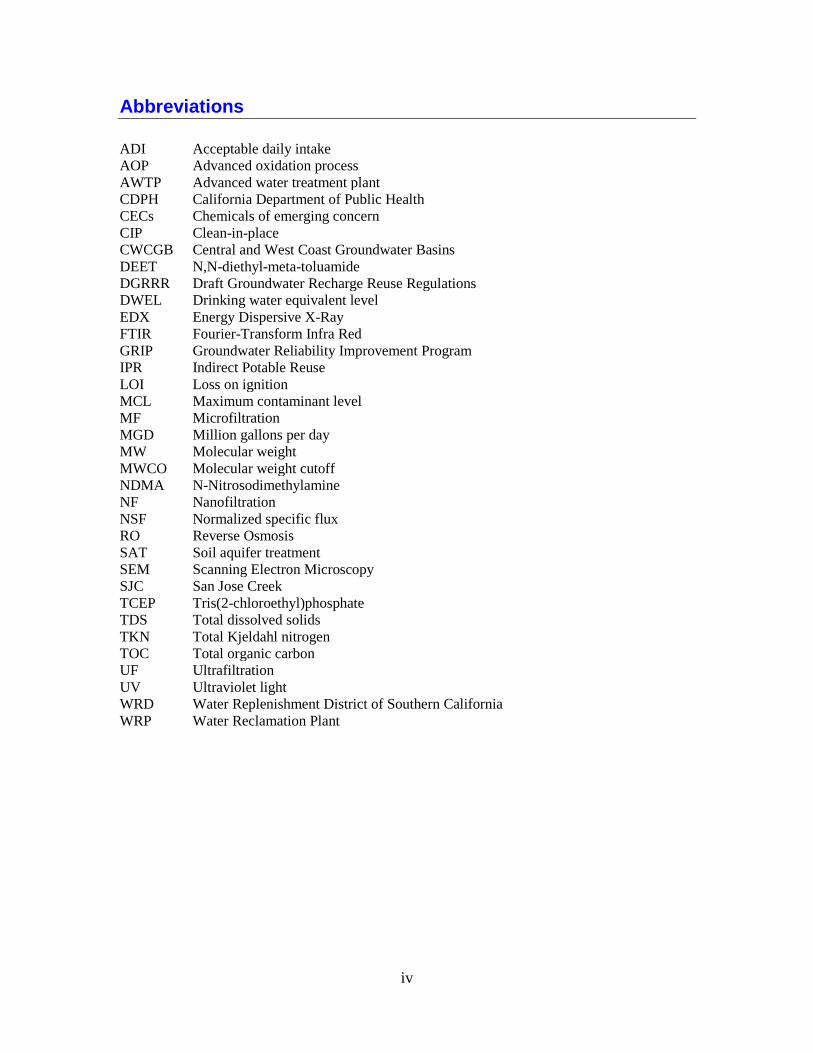
Abbreviations ADI Acceptable daily intake AOP Advanced oxidation process AWTP Advanced water treatment plant CDPH California Department of Public Health CECs Chemicals of emerging concern CIP Clean-in-place CWCGB Central and West Coast Groundwater Basins DEET N,N-diethyl-meta-toluamide DGRRR Draft Groundwater Recharge Reuse Regulations DWEL Drinking water equivalent level EDX Energy Dispersive X-Ray FTIR Fourier-Transform Infra Red GRIP Groundwater Reliability Improvement Program IPR Indirect Potable Reuse LOI Loss on ignition MCL Maximum contaminant level MF Microfiltration MGD Million gallons per day MW Molecular weight MWCO Molecular weight cutoff NDMA N-Nitrosodimethylamine NF Nanofiltration NSF Normalized specific flux RO Reverse Osmosis SAT Soil aquifer treatment SEM Scanning Electron Microscopy SJC San Jose Creek TCEP Tris(2-chloroethyl)phosphate TDS Total dissolved solids TKN Total Kjeldahl nitrogen TOC Total organic carbon UF Ultrafiltration UV Ultraviolet light WRD Water Replenishment District of Southern California WRP Water Reclamation Plant

v
Acknowledgements The project team (consisting of Bruce Mansell, Phil Ackman, Chi-Chung Tang, and Ray Tremblay from the Sanitation Districts, as well as Paul Fu from WRD) would like to acknowledge and thank Dow Water and Process Solutions for providing the NF-270 membrane elements as well as the UF membranes used during this study. We would also like to acknowledge the many Sanitation Districts' staff members who contributed to the successful completion of this project. Special thanks are extended to Charles Harris (Engineering Technician, Wastewater Research Section), Cheng Yao Tsai (Engineering Intern, Wastewater Research Section), Leo Mariscal (Laboratory Technician), Brenda Bell-Whitebear (Senior Laboratory Technician), and Maria Pang (Assistant Manager of Laboratories).
vi
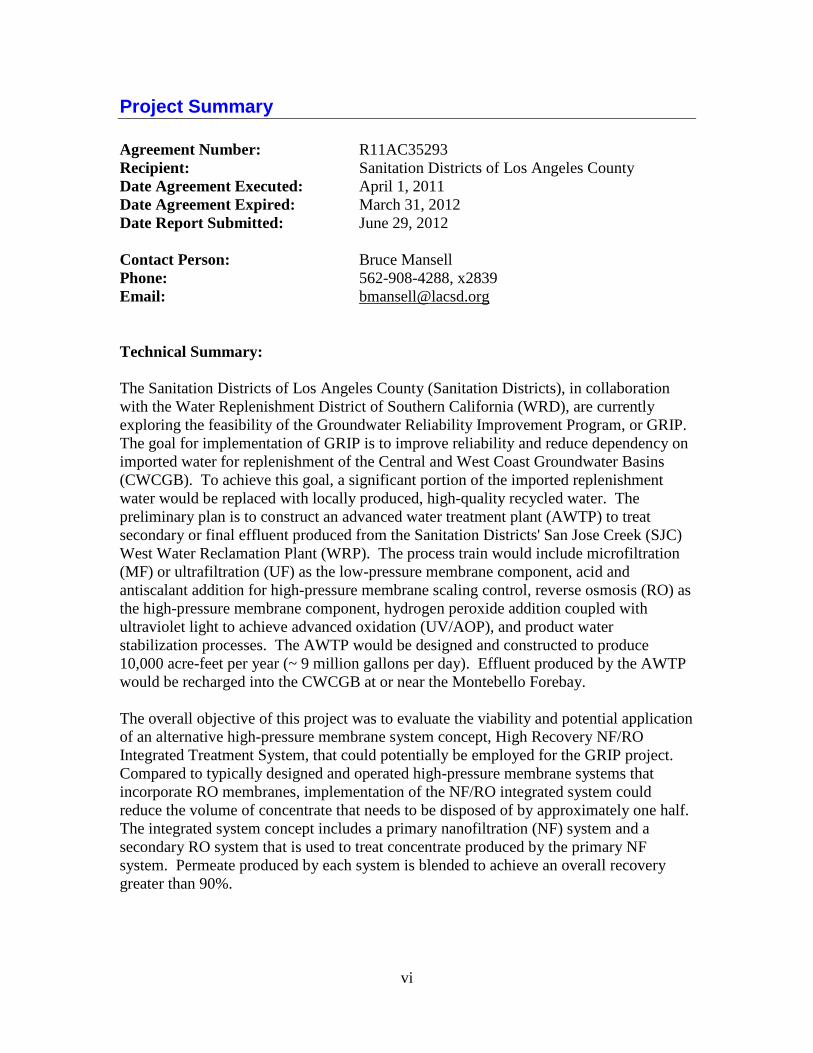
Project Summary Agreement Number: R11AC35293 Recipient: Sanitation Districts of Los Angeles County Date Agreement Executed: April 1, 2011 Date Agreement Expired: March 31, 2012 Date Report Submitted: June 29, 2012 Contact Person: Bruce Mansell Phone: 562-908-4288, x2839 Email: [email protected] Technical Summary: The Sanitation Districts of Los Angeles County (Sanitation Districts), in collaboration with the Water Replenishment District of Southern California (WRD), are currently exploring the feasibility of the Groundwater Reliability Improvement Program, or GRIP. The goal for implementation of GRIP is to improve reliability and reduce dependency on imported water for replenishment of the Central and West Coast Groundwater Basins (CWCGB). To achieve this goal, a significant portion of the imported replenishment water would be replaced with locally produced, high-quality recycled water. The preliminary plan is to construct an advanced water treatment plant (AWTP) to treat secondary or final effluent produced from the Sanitation Districts' San Jose Creek (SJC) West Water Reclamation Plant (WRP). The process train would include microfiltration (MF) or ultrafiltration (UF) as the low-pressure membrane component, acid and antiscalant addition for high-pressure membrane scaling control, reverse osmosis (RO) as the high-pressure membrane component, hydrogen peroxide addition coupled with ultraviolet light to achieve advanced oxidation (UV/AOP), and product water stabilization processes. The AWTP would be designed and constructed to produce 10,000 acre-feet per year (~ 9 million gallons per day). Effluent produced by the AWTP would be recharged into the CWCGB at or near the Montebello Forebay. The overall objective of this project was to evaluate the viability and potential application of an alternative high-pressure membrane system concept, High Recovery NF/RO Integrated Treatment System, that could potentially be employed for the GRIP project. Compared to typically designed and operated high-pressure membrane systems that incorporate RO membranes, implementation of the NF/RO integrated system could reduce the volume of concentrate that needs to be disposed of by approximately one half. The integrated system concept includes a primary nanofiltration (NF) system and a secondary RO system that is used to treat concentrate produced by the primary NF system. Permeate produced by each system is blended to achieve an overall recovery greater than 90%.
vii
To demonstrate the viability and potential application of the NF/RO integrated system concept, pilot-scale testing was conducted over approximately 7 months, from August 2011 to March 2012, at the Sanitation Districts’ SJC West WRP using UF filtered final effluent as feedwater. Specific pilot testing objectives included: (1) evaluate the operational performance of the NF/RO integrated system with respect to feed pressure, fouling, and related cleaning requirements; (2) evaluate the rejection performance of the NF/RO integrated system with respect to constituents that are relevant for indirect potable reuse projects including nitrogen, total organic carbon (TOC), and chemicals of emerging concern (CECs) (e.g., NDMA, 1,4-dioxane, hormones, pharmaceuticals and personal care products). The results from this study demonstrated that the NF/RO integrated treatment system concept is a viable alternative to a standard RO system and can potentially be employed for the GRIP project. The main advantages of this system that were demonstrated during this study include the following: (1) the ability to operate at an overall recovery of approximately 93%, which would reduce the volume of concentrate that needs to be disposed of; (2) the ability to achieve a high degree of rejection for many of the constituents that are relevant for indirect potable reuse projects including TOC and select CECs. A potential additional advantage is that the product water produced by the integrated system would have a higher total dissolved solids (TDS) concentration, when compared to that produced by RO systems, and would thus be less corrosive. This would lead to a reduction in costs associated with post treatment stabilization processes that are typically employed with RO systems. Key findings of this study are summarized below. Operational Performance The NF/RO integrated system was operated for over 3,000 hours in two distinct phases, with the major difference being the antiscalant product used for membrane scale control. During Phase One, the antiscalant product that was employed was SpectraGuard (Professional Water Technologies). This product was initially selected because of its unique molecular structure (dendrimer based chemistry) and reported ability to be concentrated, in high-recovery applications, to relatively high levels without contributing to membrane fouling. However, this product was not effective for scale control and significant membrane fouling was observed in both the primary NF and secondary RO systems. During Phase Two, the antiscalant was changed to Y2K (King Lee Technologies). This antiscalant product, which is a proprietary formulation of phosphonic acids, was effective for controlling membrane scale formation. The pilot system was operated for approximately 3 months (~ 2,000 hours), with significantly less fouling compared to Phase One operation. Over the 3-month operating period, the normalized specific flux for the primary NF and secondary RO systems decreased 16% and 28%, respectively.
viii
Membrane Autopsy At the conclusion of testing, sample NF and RO membrane elements were sent to Avista Technologies for autopsy analyses to (1) compare the performance of the elements to manufacturer specifications for new membrane elements, and (2) characterize the foulant material on the membrane surface. The results of the autopsy analyses confirmed the operational performance results and indicated that significant membrane fouling in general, and scaling in particular, did not occur during Phase Two operation. Membrane fouling was identified to be primarily organic in nature. However, biofouling, colloidal, as well as inorganic fouling were also identified. Rejection Performance The NF/RO integrated system achieved a high degree of rejection for some of the constituents that are relevant for indirect potable reuse projects including TOC (89%) and select CECs. Of 30 target CECs, 19 were detected in the feed stream to the system. Most of the detected CECs were rejected to a high degree (> 80%) and/or to below their respective reporting limits. Significantly lower rejection was achieved for total nitrogen (14%), NDMA (7%), and 1,4-dioxane (25%). Despite the low rejection for these constituents, application of the NF/RO integrated system for the GRIP project would still be feasible because (1) nitrogen removal could be achieved by the existing nitrification-denitrification activated sludge treatment process at the SJC West WRP, and (2) NDMA and 1,4-dioxane could be removed to below regulatory limits by downstream UV/AOP.
ix
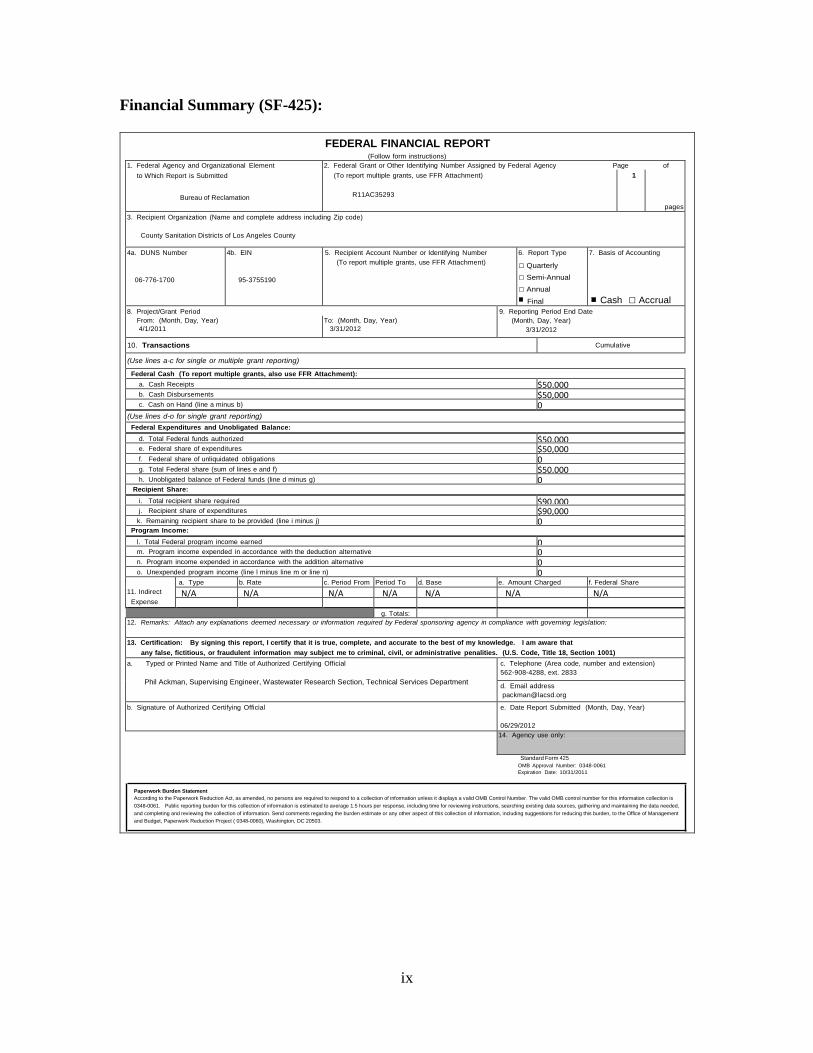
Financial Summary (SF-425):
FEDERAL FINANCIAL REPORT (Follow form instructions)
1. Federal Agency and Organizational Element to Which Report is Submitted
Bureau of Reclamation
2. Federal Grant or Other Identifying Number Assigned by Federal Agency Page of (To report multiple grants, use FFR Attachment)
R11AC35293
1
pages 3. Recipient Organization (Name and complete address including Zip code) County Sanitation Districts of Los Angeles County
4a. DUNS Number 06-776-1700
4b. EIN 95-3755190
5. Recipient Account Number or Identifying Number (To report multiple grants, use FFR Attachment)
6. Report Type
□ Quarterly □ Semi-Annual □ Annual
Final
7. Basis of Accounting Cash □ Accrual
8. Project/Grant Period 9. Reporting Period End Date (Month, Day, Year)
3/31/2012 From: (Month, Day, Year) 4/1/2011
To: (Month, Day, Year) 3/31/2012
10. Transactions Cumulative
(Use lines a-c for single or multiple grant reporting)
Federal Cash (To report multiple grants, also use FFR Attachment): a. Cash Receipts $50,000 b. Cash Disbursements $50,000 c. Cash on Hand (line a minus b) 0
(Use lines d-o for single grant reporting) Federal Expenditures and Unobligated Balance:
d. Total Federal funds authorized $50,000 e. Federal share of expenditures $50,000 f. Federal share of unliquidated obligations 0 g. Total Federal share (sum of lines e and f) $50,000 h. Unobligated balance of Federal funds (line d minus g) 0
Recipient Share: i. Total recipient share required $90,000 j. Recipient share of expenditures $90,000
k. Remaining recipient share to be provided (line i minus j) 0 Program Income:
l. Total Federal program income earned 0 m. Program income expended in accordance with the deduction alternative 0 n. Program income expended in accordance with the addition alternative 0 o. Unexpended program income (line l minus line m or line n) 0
11. Indirect
Expense
a. Type b. Rate c. Period From Period To d. Base e. Amount Charged f. Federal Share
N/A N/A N/A N/A N/A N/A N/A
g. Totals: 12. Remarks: Attach any explanations deemed necessary or information required by Federal sponsoring agency in compliance with governing legislation:
13. Certification: By signing this report, I certify that it is true, complete, and accurate to the best of my knowledge. I am aware that any false, fictitious, or fraudulent information may subject me to criminal, civil, or administrative penalities. (U.S. Code, Title 18, Section 1001)
a. Typed or Printed Name and Title of Authorized Certifying Official Phil Ackman, Supervising Engineer, Wastewater Research Section, Technical Services Department
c. Telephone (Area code, number and extension) 562-908-4288, ext. 2833
d. Email address [email protected]
b. Signature of Authorized Certifying Official e. Date Report Submitted (Month, Day, Year) 06/29/2012
14. Agency use only:
Standard Form 425 OMB Approval Number: 0348-0061 Expiration Date: 10/31/2011
Paperwork Burden Statement According to the Paperwork Reduction Act, as amended, no persons are required to respond to a collection of information unless it displays a valid OMB Control Number. The valid OMB control number for this information collection is 0348-0061. Public reporting burden for this collection of information is estimated to average 1.5 hours per response, including time for reviewing instructions, searching existing data sources, gathering and maintaining the data needed, and completing and reviewing the collection of information. Send comments regarding the burden estimate or any other aspect of this collection of information, including suggestions for reducing this burden, to the Office of Management and Budget, Paperwork Reduction Project ( 0348-0060), Washington, DC 20503.
lburgess
PAK
lburgess
Line

1
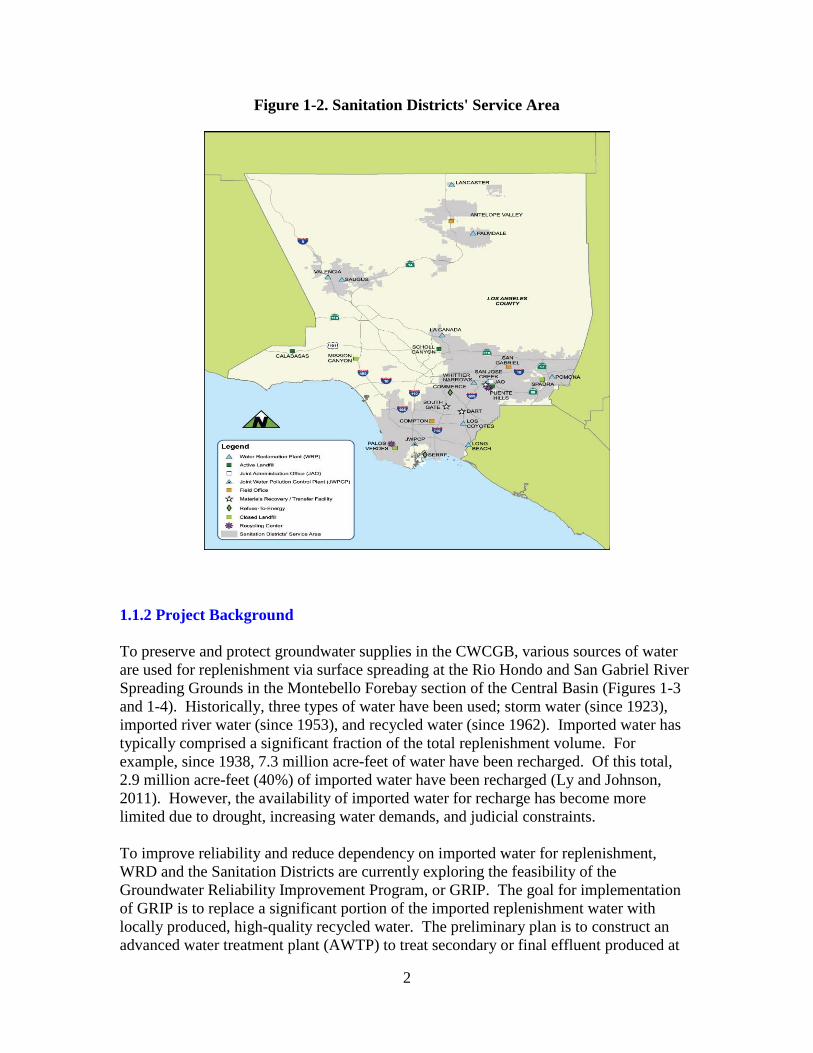
1. Introduction 1.1 Groundwater Reliability Improvement Program 1.1.1 Collaborating Agencies The Water Replenishment District of Southern California (WRD) is a special district that was formed, under the Water Replenishment District Act in 1959, to manage the groundwater in the Central and West Coast Groundwater Basins (CWCGB). These basins supply nearly 40% of the water demand for about 4 million people in 43 cities, covering a service area of approximately 420 square miles (Figure 1-1). WRD is responsible for maintaining adequate groundwater supplies, preventing seawater intrusion into the groundwater aquifers, and protecting groundwater quality against contamination. There are approximately 350 drinking water wells operated by 40 active groundwater pumpers within the WRD service area. The Sanitation Districts of Los Angeles County (Sanitation Districts) are a confederation of 23 independent special districts serving approximately 5.7 million people in Los Angeles County. The Sanitation Districts' service area covers approximately 800 square miles and encompasses 78 cities and unincorporated territory within the county (Figure 1-2). Formed in 1923 under the County Sanitation District Act, the Sanitation Districts construct, operate, and maintain facilities to convey, treat, recycle, and dispose of sewage and industrial wastes. In addition, the Sanitation Districts provide for the management of solid wastes, including disposal, transfer operations, energy conversion, and materials recovery.
Figure 1-1. WRD Service Area
2
Figure 1-2. Sanitation Districts' Service Area
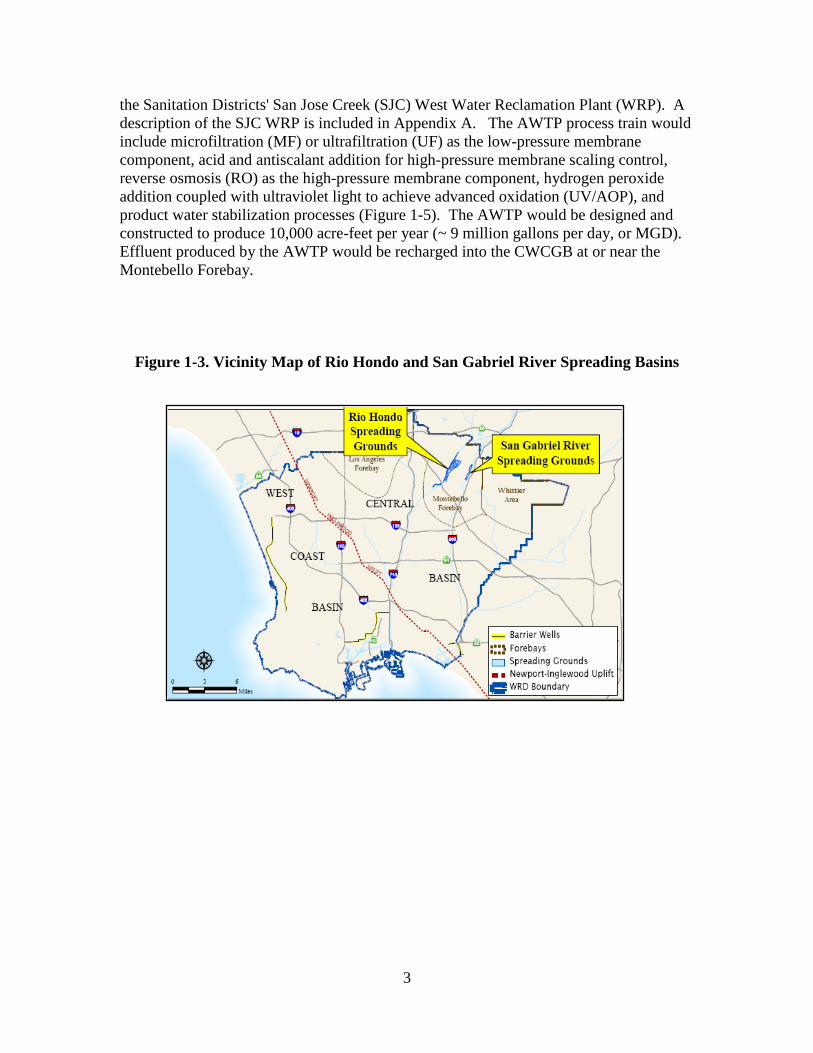
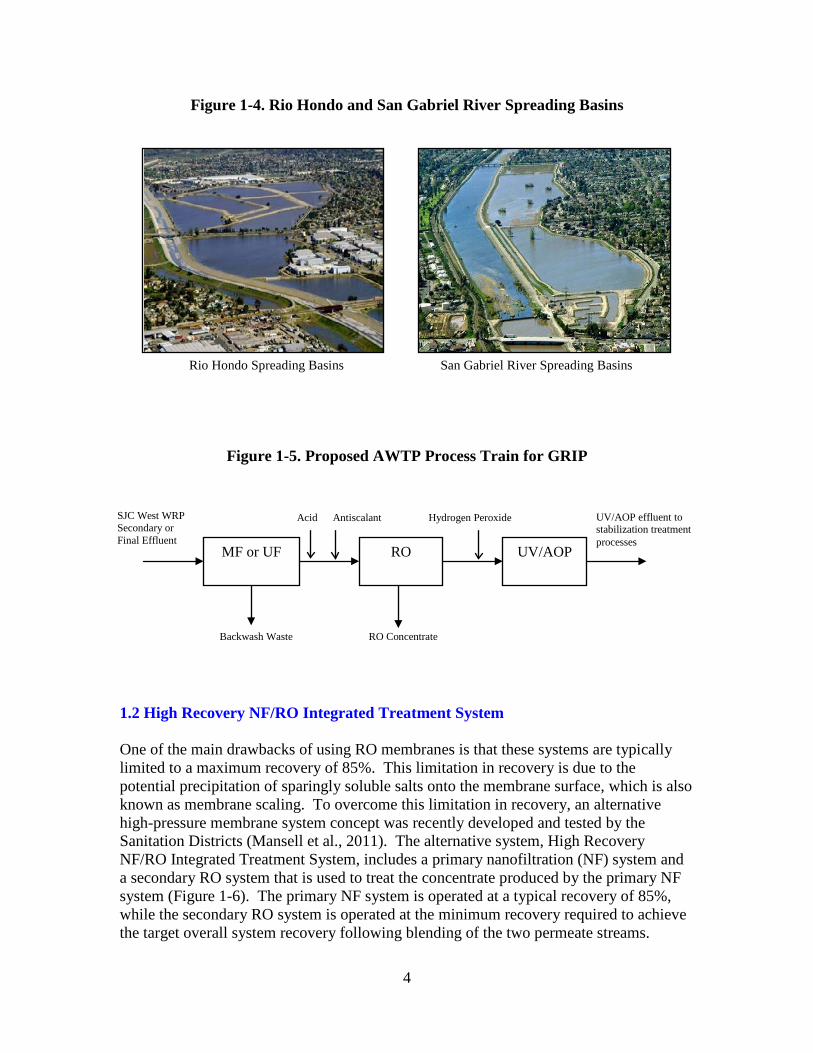
1.1.2 Project Background To preserve and protect groundwater supplies in the CWCGB, various sources of water are used for replenishment via surface spreading at the Rio Hondo and San Gabriel River Spreading Grounds in the Montebello Forebay section of the Central Basin (Figures 1-3 and 1-4). Historically, three types of water have been used; storm water (since 1923), imported river water (since 1953), and recycled water (since 1962). Imported water has typically comprised a significant fraction of the total replenishment volume. For example, since 1938, 7.3 million acre-feet of water have been recharged. Of this total, 2.9 million acre-feet (40%) of imported water have been recharged (Ly and Johnson, 2011). However, the availability of imported water for recharge has become more limited due to drought, increasing water demands, and judicial constraints. To improve reliability and reduce dependency on imported water for replenishment, WRD and the Sanitation Districts are currently exploring the feasibility of the Groundwater Reliability Improvement Program, or GRIP. The goal for implementation of GRIP is to replace a significant portion of the imported replenishment water with locally produced, high-quality recycled water. The preliminary plan is to construct an advanced water treatment plant (AWTP) to treat secondary or final effluent produced at
3
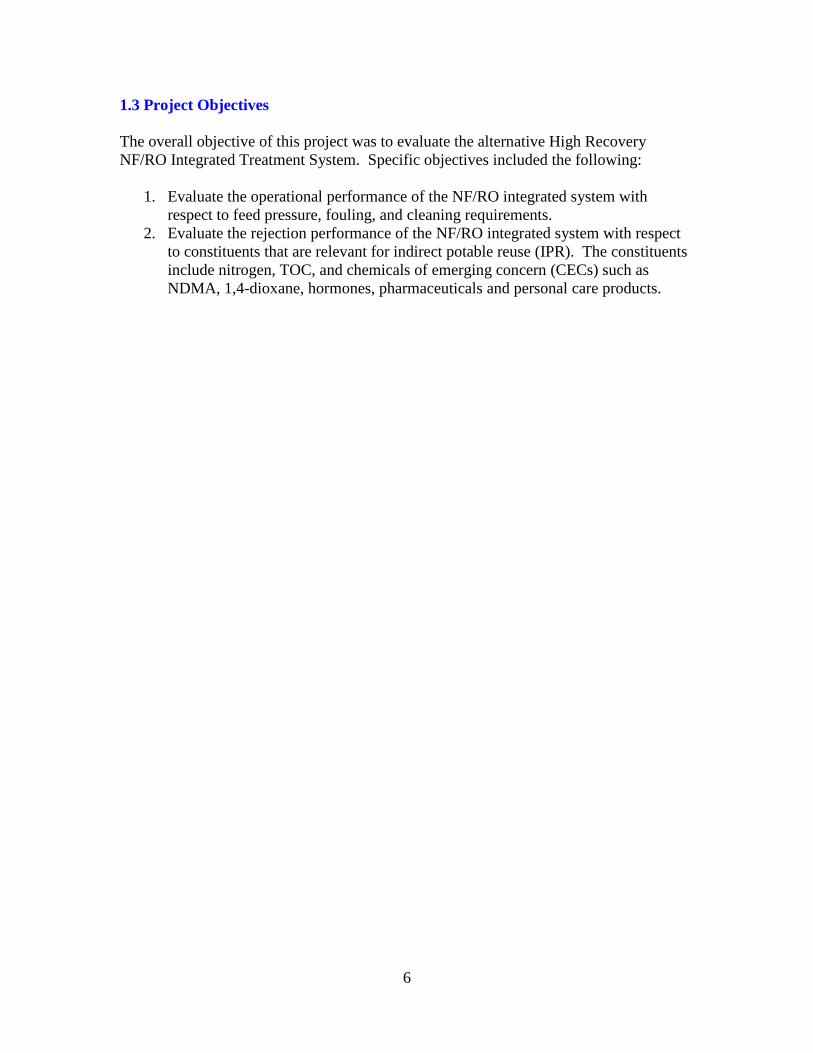
the Sanitation Districts' San Jose Creek (SJC) West Water Reclamation Plant (WRP). A description of the SJC WRP is included in Appendix A. The AWTP process train would include microfiltration (MF) or ultrafiltration (UF) as the low-pressure membrane component, acid and antiscalant addition for high-pressure membrane scaling control, reverse osmosis (RO) as the high-pressure membrane component, hydrogen peroxide addition coupled with ultraviolet light to achieve advanced oxidation (UV/AOP), and product water stabilization processes (Figure 1-5). The AWTP would be designed and constructed to produce 10,000 acre-feet per year (~ 9 million gallons per day, or MGD). Effluent produced by the AWTP would be recharged into the CWCGB at or near the Montebello Forebay.
Figure 1-3. Vicinity Map of Rio Hondo and San Gabriel River Spreading Basins
4
Figure 1-4. Rio Hondo and San Gabriel River Spreading Basins
Figure 1-5. Proposed AWTP Process Train for GRIP
1.2 High Recovery NF/RO Integrated Treatment System One of the main drawbacks of using RO membranes is that these systems are typically limited to a maximum recovery of 85%. This limitation in recovery is due to the potential precipitation of sparingly soluble salts onto the membrane surface, which is also known as membrane scaling. To overcome this limitation in recovery, an alternative high-pressure membrane system concept was recently developed and tested by the Sanitation Districts (Mansell et al., 2011). The alternative system, High Recovery NF/RO Integrated Treatment System, includes a primary nanofiltration (NF) system and a secondary RO system that is used to treat the concentrate produced by the primary NF system (Figure 1-6). The primary NF system is operated at a typical recovery of 85%, while the secondary RO system is operated at the minimum recovery required to achieve the target overall system recovery following blending of the two permeate streams.
San Gabriel River Spreading Basins Rio Hondo Spreading Basins
RO Concentrate
UV/AOP effluent to stabilization treatment processes
SJC West WRP Secondary or Final Effluent
MF or UF RO UV/AOP
Hydrogen Peroxide
Backwash Waste
Acid Antiscalant

5
For example, as shown in Figure 1-6, if the target overall system recovery is 92.5%, the secondary RO system would be operated at 50% recovery. The maximum secondary RO system recovery, and thus overall system recovery, that can be achieved will depend on the specific water quality being treated, operating flux, and related membrane fouling. The key component of the integrated system is the NF membrane. NF membranes differ from RO membranes primarily because they are designed to selectively remove compounds such as multivalent ions (e.g., hardness) or organic contaminants, while allowing other compounds to pass (Bellona et al., 2004). For this study, the NF-270 membrane (manufactured by Dow/FilmTec) was used. This membrane is designed to achieve a high degree of rejection of organics, but only moderate TDS rejection. Because the NF-270 membrane achieves relatively low rejection of ions that have high scale-formation potential, the concentrate stream produced by this membrane has a relatively reduced scale-formation potential compared to concentrate produced by an RO membrane. This allows for further treatment of the concentrate stream by the secondary RO system, thus increasing overall system recovery. An additional advantage of the NF-270 membrane is that it can be operated at lower feed pressures compared to RO membranes. Based on previous bench and pilot-scale testing, the NF-270 membrane feed pressure requirements are 40 - 50% lower than RO membranes (Yu et al., 2010; Mansell et al., 2011). As a result, the overall NF/RO integrated system feed pressure requirements are lower than typical high-pressure membrane systems that employ only RO membranes.
Figure 1-6. Alternative GRIP AWTP Process Train with
High Recovery NF/RO Integrated Treatment System
0.85 Q
0.15 Q NF Concentrate
RO Concentrate
UV/AOP Effluent SJC West WRP Secondary or Final Effluent
MF or UF Primary NF
Secondary RO
Backwash Waste
Hydrogen Peroxide Acid Antiscalant
Q
0.075 Q
0.075 Q
0.925 Q UV/AOP
6
1.3 Project Objectives The overall objective of this project was to evaluate the alternative High Recovery NF/RO Integrated Treatment System. Specific objectives included the following:
1. Evaluate the operational performance of the NF/RO integrated system with respect to feed pressure, fouling, and cleaning requirements.
2. Evaluate the rejection performance of the NF/RO integrated system with respect to constituents that are relevant for indirect potable reuse (IPR). The constituents include nitrogen, TOC, and chemicals of emerging concern (CECs) such as NDMA, 1,4-dioxane, hormones, pharmaceuticals and personal care products.
7
2. Technical Approach 2.1 Test Site
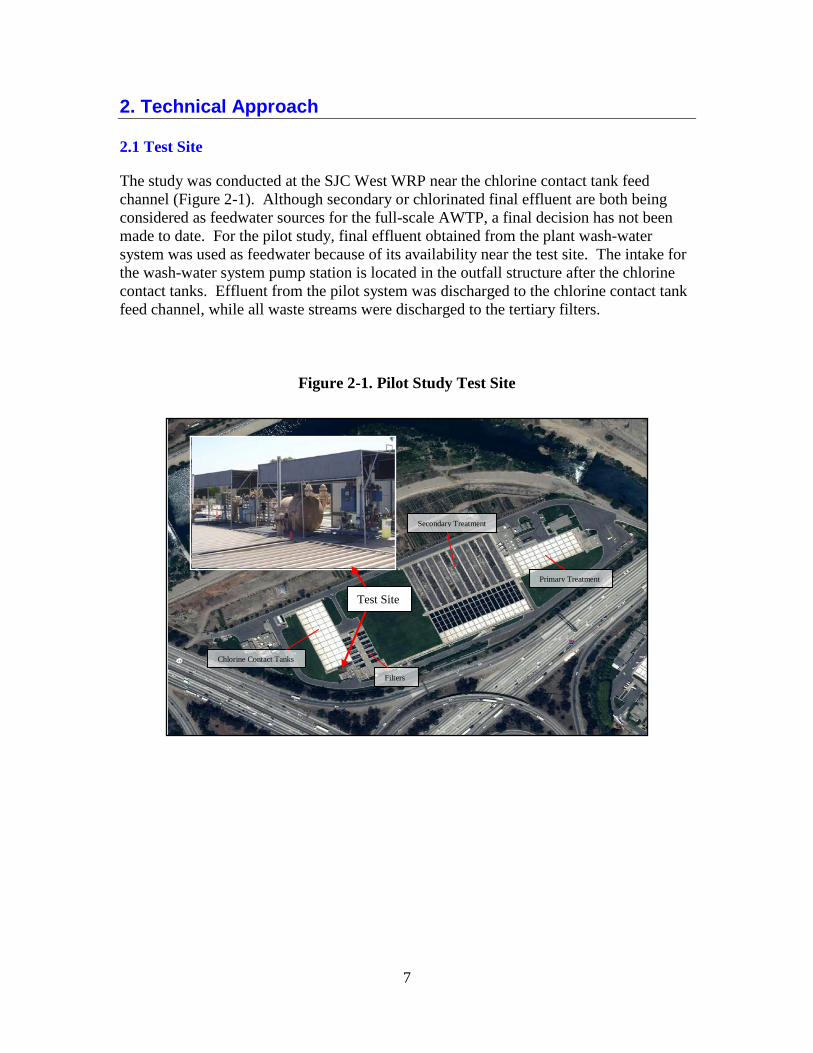
The study was conducted at the SJC West WRP near the chlorine contact tank feed channel (Figure 2-1). Although secondary or chlorinated final effluent are both being considered as feedwater sources for the full-scale AWTP, a final decision has not been made to date. For the pilot study, final effluent obtained from the plant wash-water system was used as feedwater because of its availability near the test site. The intake for the wash-water system pump station is located in the outfall structure after the chlorine contact tanks. Effluent from the pilot system was discharged to the chlorine contact tank feed channel, while all waste streams were discharged to the tertiary filters.
Figure 2-1. Pilot Study Test Site
Test Site Primary Treatment
Secondary Treatment
Filters
Chlorine Contact Tanks
8
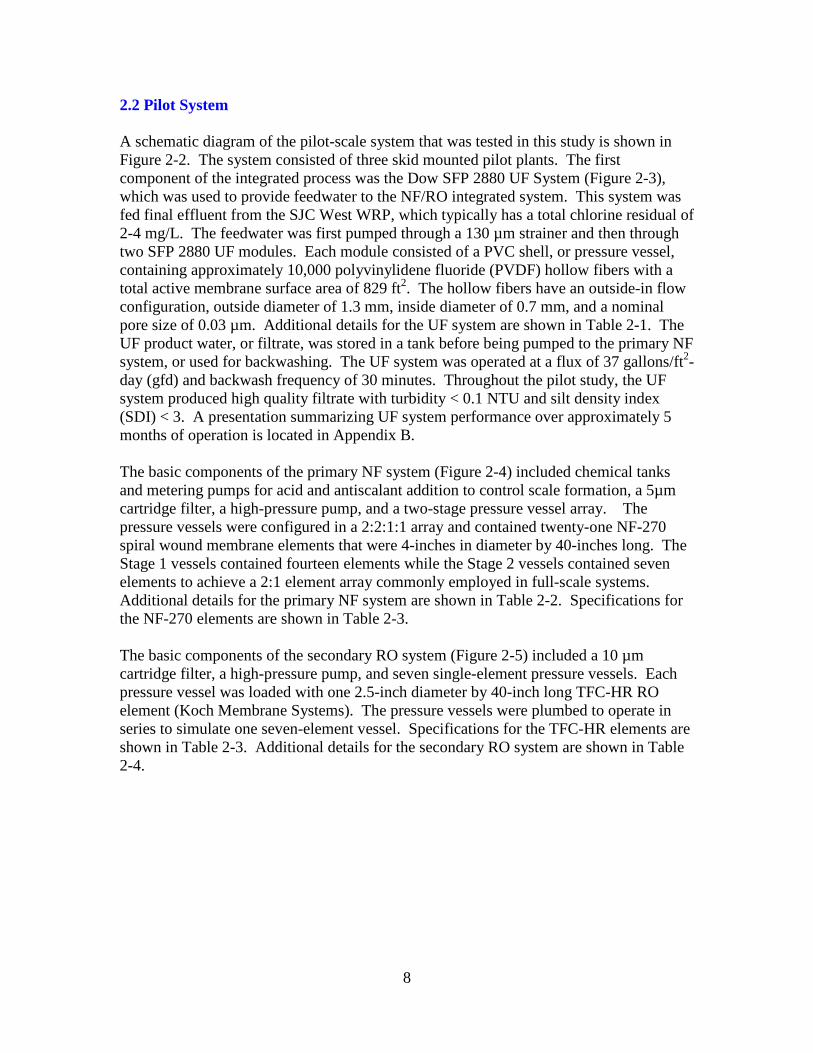
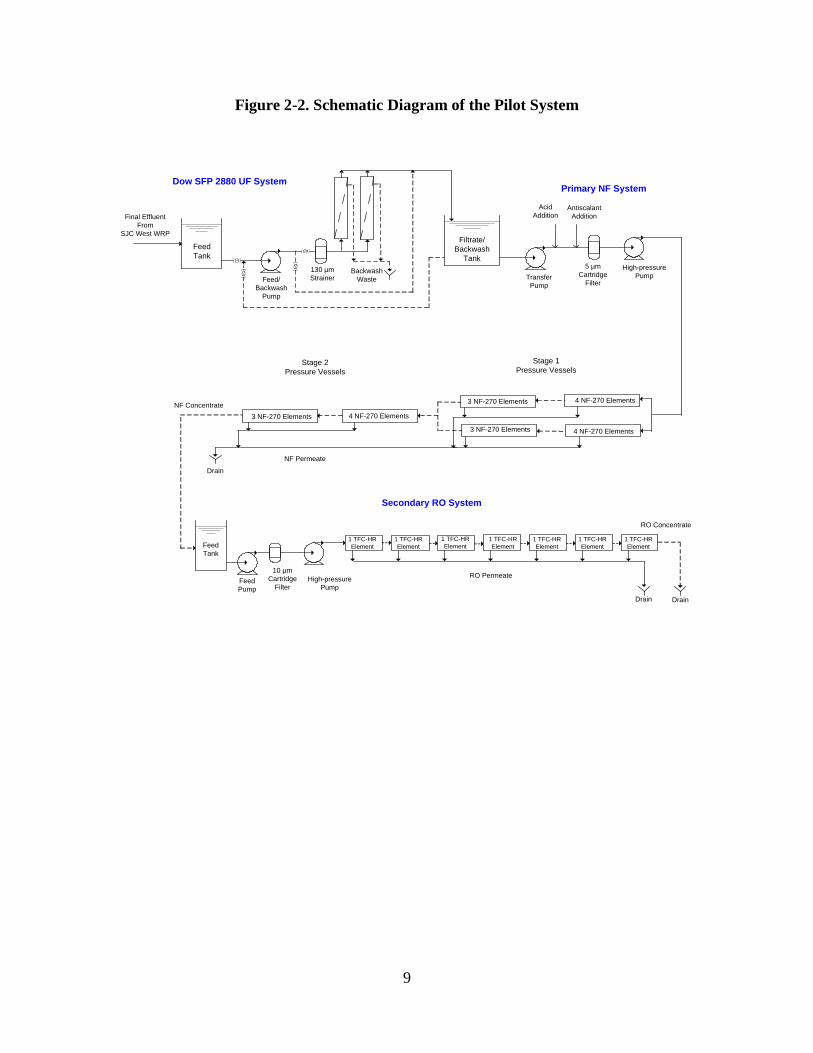
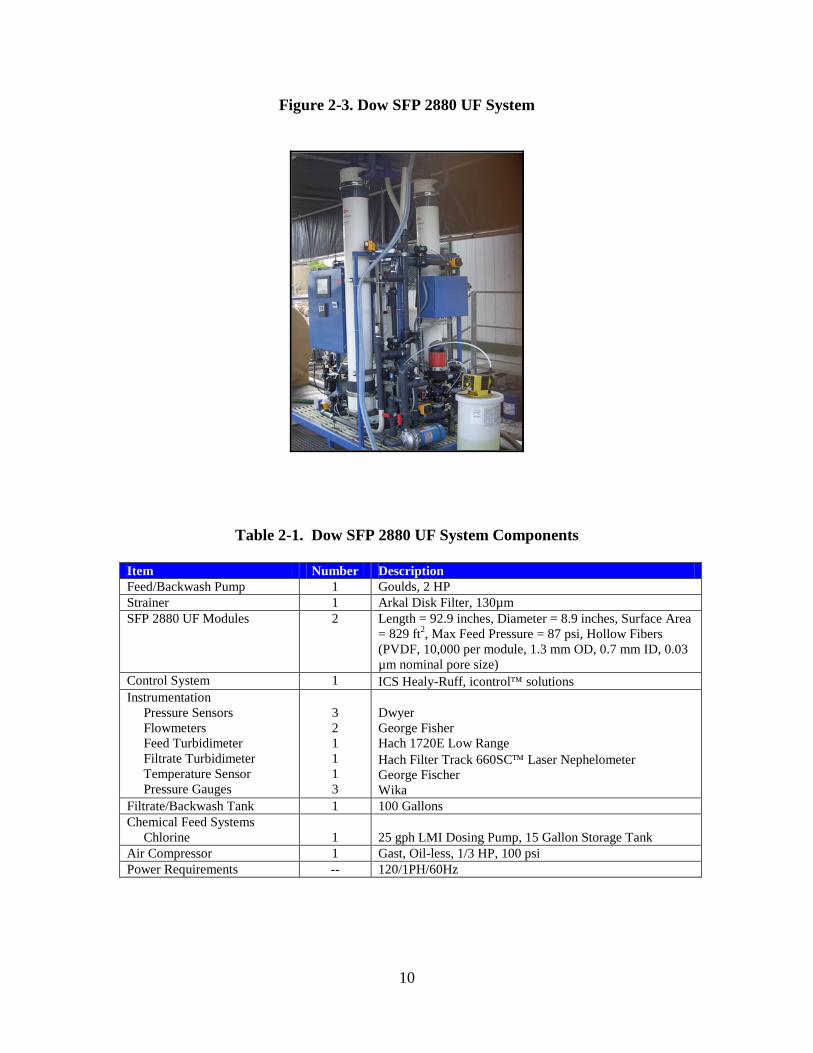
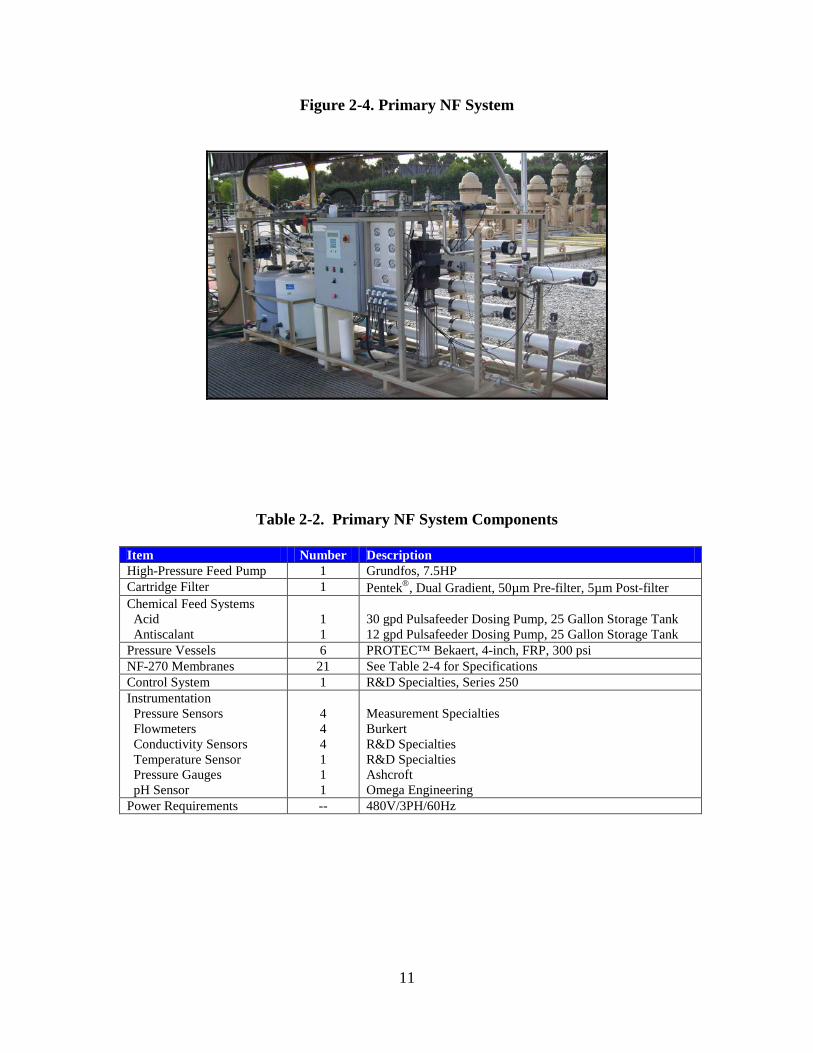
2.2 Pilot System A schematic diagram of the pilot-scale system that was tested in this study is shown in Figure 2-2. The system consisted of three skid mounted pilot plants. The first component of the integrated process was the Dow SFP 2880 UF System (Figure 2-3), which was used to provide feedwater to the NF/RO integrated system. This system was fed final effluent from the SJC West WRP, which typically has a total chlorine residual of 2-4 mg/L. The feedwater was first pumped through a 130 µm strainer and then through two SFP 2880 UF modules. Each module consisted of a PVC shell, or pressure vessel, containing approximately 10,000 polyvinylidene fluoride (PVDF) hollow fibers with a total active membrane surface area of 829 ft2. The hollow fibers have an outside-in flow configuration, outside diameter of 1.3 mm, inside diameter of 0.7 mm, and a nominal pore size of 0.03 µm. Additional details for the UF system are shown in Table 2-1. The UF product water, or filtrate, was stored in a tank before being pumped to the primary NF system, or used for backwashing. The UF system was operated at a flux of 37 gallons/ft2-day (gfd) and backwash frequency of 30 minutes. Throughout the pilot study, the UF system produced high quality filtrate with turbidity < 0.1 NTU and silt density index (SDI) < 3. A presentation summarizing UF system performance over approximately 5 months of operation is located in Appendix B. The basic components of the primary NF system (Figure 2-4) included chemical tanks and metering pumps for acid and antiscalant addition to control scale formation, a 5µm cartridge filter, a high-pressure pump, and a two-stage pressure vessel array. The pressure vessels were configured in a 2:2:1:1 array and contained twenty-one NF-270 spiral wound membrane elements that were 4-inches in diameter by 40-inches long. The Stage 1 vessels contained fourteen elements while the Stage 2 vessels contained seven elements to achieve a 2:1 element array commonly employed in full-scale systems. Additional details for the primary NF system are shown in Table 2-2. Specifications for the NF-270 elements are shown in Table 2-3. The basic components of the secondary RO system (Figure 2-5) included a 10 µm cartridge filter, a high-pressure pump, and seven single-element pressure vessels. Each pressure vessel was loaded with one 2.5-inch diameter by 40-inch long TFC-HR RO element (Koch Membrane Systems). The pressure vessels were plumbed to operate in series to simulate one seven-element vessel. Specifications for the TFC-HR elements are shown in Table 2-3. Additional details for the secondary RO system are shown in Table 2-4.
9
Figure 2-2. Schematic Diagram of the Pilot System
Stage 1Pressure Vessels
Stage 2Pressure Vessels
Backwash Waste
NF Concentrate
NF Permeate
High-pressure Pump
5 µm Cartridge
FilterTransfer
Pump
Dow SFP 2880 UF System
Feed/Backwash
Pump
130 µm Strainer
Filtrate/Backwash
Tank
Final EffluentFrom
SJC West WRP
AcidAddition
AntiscalantAddition
4 NF-270 Elements 3 NF-270 Elements
4 NF-270 Elements3 NF-270 Elements
4 NF-270 Elements
Feed Tank
Drain
Feed Tank
High-pressure Pump
10 µm Cartridge
Filter
RO Concentrate
Drain Drain
3 NF-270 Elements
RO PermeateFeed Pump
Secondary RO System
Primary NF System
1 TFC-HR Element
1 TFC-HR Element
1 TFC-HR Element
1 TFC-HR Element
1 TFC-HR Element
1 TFC-HR Element
1 TFC-HR Element
10
Figure 2-3. Dow SFP 2880 UF System
Table 2-1. Dow SFP 2880 UF System Components
Item Number Description Feed/Backwash Pump 1 Goulds, 2 HP Strainer 1 Arkal Disk Filter, 130µm SFP 2880 UF Modules 2 Length = 92.9 inches, Diameter = 8.9 inches, Surface Area
= 829 ft2, Max Feed Pressure = 87 psi, Hollow Fibers (PVDF, 10,000 per module, 1.3 mm OD, 0.7 mm ID, 0.03 µm nominal pore size)
Control System 1 ICS Healy-Ruff, icontrol solutions Instrumentation Pressure Sensors Flowmeters Feed Turbidimeter Filtrate Turbidimeter Temperature Sensor Pressure Gauges
3 2 1 1 1 3
Dwyer George Fisher Hach 1720E Low Range Hach Filter Track 660SC Laser Nephelometer George Fischer Wika
Filtrate/Backwash Tank 1 100 Gallons Chemical Feed Systems Chlorine
1
25 gph LMI Dosing Pump, 15 Gallon Storage Tank
Air Compressor 1 Gast, Oil-less, 1/3 HP, 100 psi Power Requirements -- 120/1PH/60Hz
11
Figure 2-4. Primary NF System
Table 2-2. Primary NF System Components
Item Number Description High-Pressure Feed Pump 1 Grundfos, 7.5HP Cartridge Filter 1 Pentek, Dual Gradient, 50µm Pre-filter, 5µm Post-filter Chemical Feed Systems Acid Antiscalant
1 1
30 gpd Pulsafeeder Dosing Pump, 25 Gallon Storage Tank 12 gpd Pulsafeeder Dosing Pump, 25 Gallon Storage Tank
Pressure Vessels 6 PROTEC™ Bekaert, 4-inch, FRP, 300 psi NF-270 Membranes 21 See Table 2-4 for Specifications Control System 1 R&D Specialties, Series 250 Instrumentation Pressure Sensors Flowmeters Conductivity Sensors Temperature Sensor Pressure Gauges pH Sensor
4 4 4 1 1 1
Measurement Specialties Burkert R&D Specialties R&D Specialties Ashcroft Omega Engineering
Power Requirements -- 480V/3PH/60Hz
12
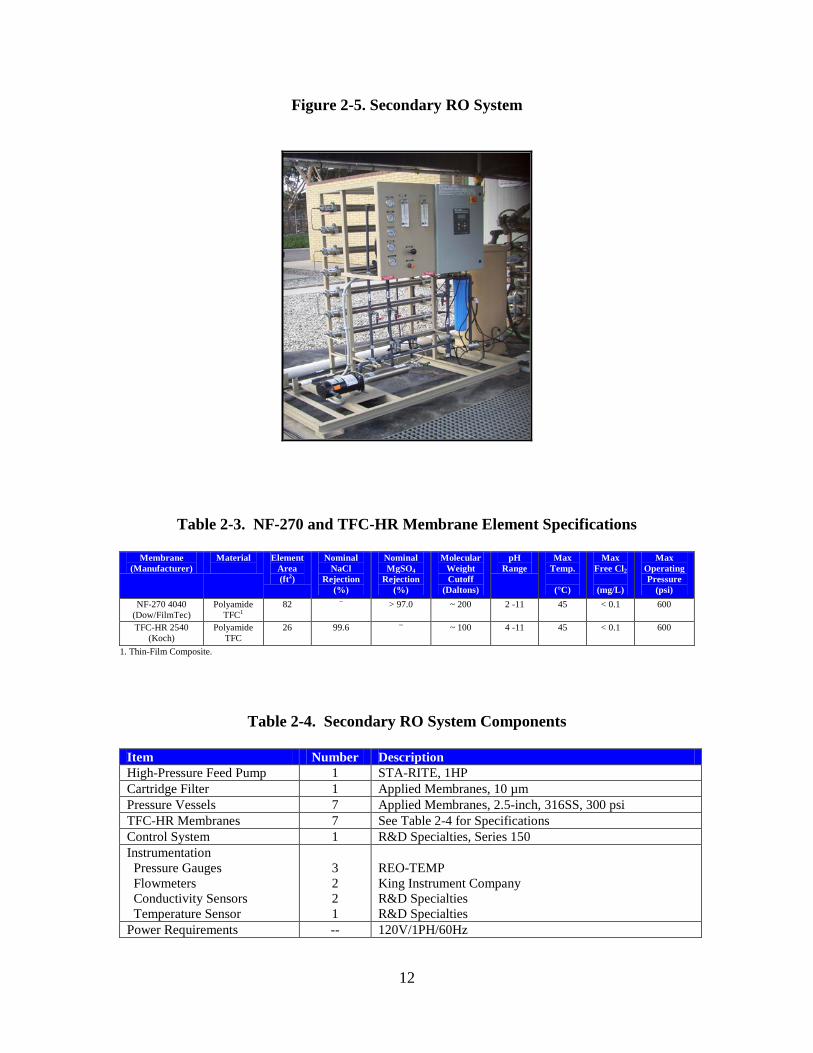
Figure 2-5. Secondary RO System
Table 2-3. NF-270 and TFC-HR Membrane Element Specifications
Membrane (Manufacturer)
Material
Element Area (ft2)
Nominal NaCl
Rejection (%)
Nominal MgSO4
Rejection (%)
Molecular Weight Cutoff
(Daltons)
pH Range
Max Temp.
(°C)
Max Free Cl2
(mg/L)
Max Operating Pressure
(psi) NF-270 4040
(Dow/FilmTec) Polyamide
TFC1 82 -- > 97.0 ~ 200
2 -11 45 < 0.1 600
TFC-HR 2540 (Koch)
Polyamide TFC
26 99.6 -- ~ 100
4 -11 45 < 0.1 600
1. Thin-Film Composite.
Table 2-4. Secondary RO System Components
Item Number Description High-Pressure Feed Pump 1 STA-RITE, 1HP Cartridge Filter 1 Applied Membranes, 10 µm Pressure Vessels 7 Applied Membranes, 2.5-inch, 316SS, 300 psi TFC-HR Membranes 7 See Table 2-4 for Specifications Control System 1 R&D Specialties, Series 150 Instrumentation Pressure Gauges Flowmeters Conductivity Sensors Temperature Sensor
3 2 2 1
REO-TEMP King Instrument Company R&D Specialties R&D Specialties
Power Requirements -- 120V/1PH/60Hz
13
2.3 Testing Conditions Average operating conditions for the NF/RO integrated system are shown in Table 2-5. The primary NF system was operated for a total of 3,690 hours, while the secondary RO system was operated for a total of 3,021 hours. The system was operated in two phases, with the major difference being the antiscalant product used for membrane scale control. Each antiscalant was dosed at approximately 2 mg/L in the feed to the primary NF system, resulting in a dose of approximately 13 mg/L in the feed to the secondary RO system. During Phase One, the antiscalant product employed was SpectraGuard (Professional Water Technologies). This product was selected because of its unique molecular structure (dendrimer based chemistry) and reported ability to be concentrated, in high-recovery applications, to relatively high levels without contributing to membrane fouling. During Phase Two, the antiscalant was changed to Y2K (King Lee Technologies). This antiscalant is a proprietary formulation of phosphonic acids, which are known to be effective chelating agents and scale inhibitors. However, phosphonic acids are sparingly soluble and can precipitate with the multivalent cations that are bound to them (Nowack, 2003). To control potential antiscalant precipitation and fouling, an operations strategy was employed in which the feed pH was periodically lowered to approximately 4-5 since Y2K is easily dissolved at this pH. In addition to antiscalant, sulfuric acid was dosed in the feed to the primary NF system to control membrane scaling. Approximate feedwater pH set points were selected based on preliminary scaling projections using membrane manufacturer design software. During Phase One, the average feedwater pH was 6.26, resulting in an average pH of 6.54 in the feed to the secondary RO system. During Phase Two, the average feedwater pH was 6.23, resulting in an average pH of 6.39 in the feed to the secondary RO system. These averages do not include the low pH from the periodic flushes described above. The primary NF system was operated at an overall flux of approximately 12 gallons/ft2-day (gfd) and 85% recovery during both phases. However, as will be discussed in Section 3, the first stage and second stage fluxes of the system were varied during Phase One in an attempt to reduce the significant membrane fouling that was observed during this phase. The secondary RO system was initially operated at the target flux of approximately 10 gfd and 50% recovery during Phase One. As with the primary NF system, however, the system was also operated under varied hydraulic conditions (reduced flux, reduced recovery, and with a concentrate recycle loop) to reduce membrane fouling observed during this phase. The secondary RO system was operated at the target flux and recovery throughout Phase Two. Throughout the pilot study, pertinent operations data including flow, pressure, conductivity, temperature, and pH were recorded daily (Tables 2-6 and 2-7). The data were used to calculate and monitor operations parameters including recovery, flux, net driving pressure, differential pressure, and normalized specific flux. Net driving pressure is the feed pressure required to produce the desired permeate flux minus the differential

14
pressure, permeate pressure, and osmotic pressure. This value was used to calculate normalized specific flux (i.e., flux divided by the net driving pressure, gfd/psi), which was used to evaluate the pressure or energy requirements of the membranes as well as fouling. A higher specific flux indicates that a lower feed pressure and thus lower energy is required. As membranes foul during operation, the net driving pressure increases in order to maintain permeate flux causing the normalized specific flux to decline over time. The rate of decline was used to assess the relative fouling propensity of the membranes. Normalized specific flux values were calculated per ASTM D 4516 (Standard Practice for Standardizing Reverse Osmosis Performance Data).
Table 2-5. NF/RO Integrated System Average Operating Conditions
Parameter Primary NF System Secondary RO System Phase One (8/15/11 – 11/21/11) Net Operating Time (hours) 1,654 987 Feed Flow (gpm) 17.0 2.4 1.7 1.7 1.5 Permeate Flow (gpm) 14.4 1.2 0.6 0.6 0.6 Concentrate Flow (gpm) 2.6 1.2 1.1 1.1 0.9 Concentrate Recycle Flow (gpm) -- -- -- 2.0 2.0 Flux (gfd) 12.0 9.5 4.7 4.7 4.7 Recovery (%) 84.7 50.0 35.3 35.3 40.0 Feed pH 6.26 6.54 Antiscalant SpectraGuard1 SpectraGuard Antiscalant Dose (mg/L) 2 13.1 mg/L2 Phase Two (12/5/11 – 3/22/12) Net Operating Time (hours) 2,036 2,035 Feed Flow (gpm) 17.1 2.4 Permeate Flow (gpm) 14.5 1.2 Concentrate Flow (gpm) 2.6 1.2 Flux (gfd) 12.1 9.5 Recovery (%) 84.8 50.0 Feed pH 6.23 6.39 Antiscalant Y2K3 Y2K Antiscalant Dose (mg/L) 2 13.2 mg/L4
1. Manufactured by Professional Water Technologies. 2. Estimated based on average Primary NF System recovery of 84.7% and related concentration factor of 6.54. 3. Manufactured by King Lee Technologies. 4. Estimated based on average Primary NF System recovery of 84.8% and related concentration factor of 6.58.
15
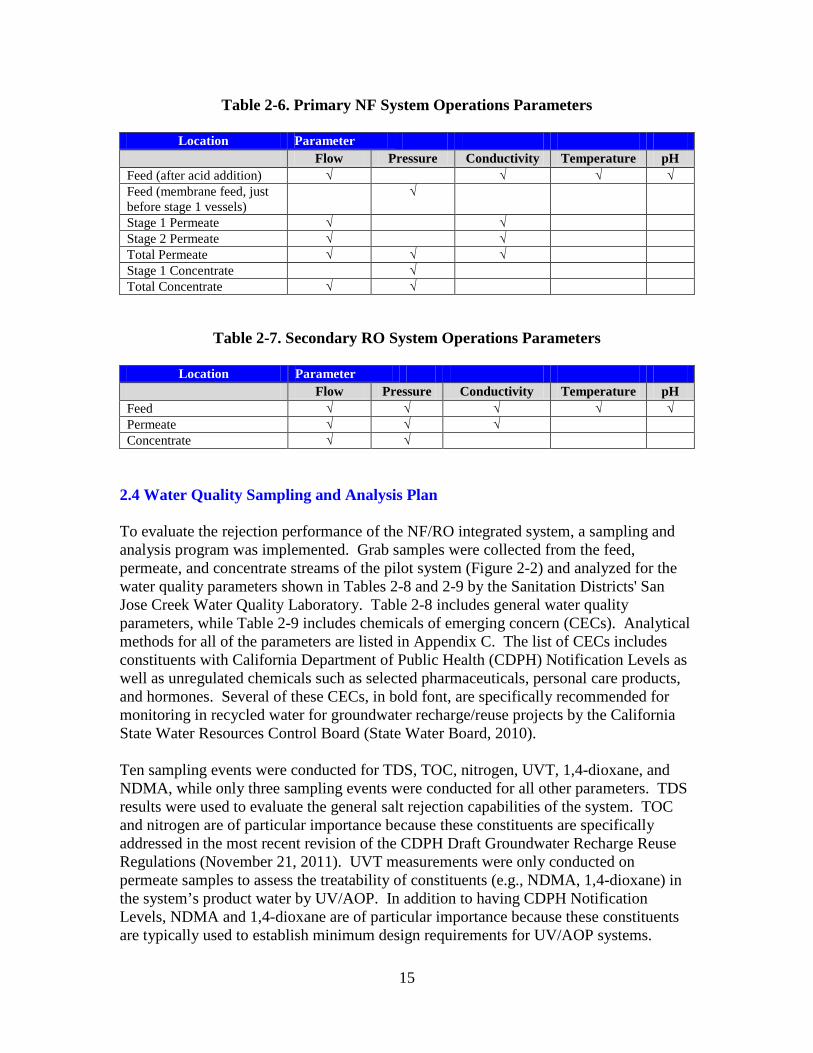
Table 2-6. Primary NF System Operations Parameters
Location Parameter Flow Pressure Conductivity Temperature pH
Feed (after acid addition) √ √ √ √ Feed (membrane feed, just before stage 1 vessels)
√
Stage 1 Permeate √ √ Stage 2 Permeate √ √ Total Permeate √ √ √ Stage 1 Concentrate √ Total Concentrate √ √
Table 2-7. Secondary RO System Operations Parameters
Location Parameter Flow Pressure Conductivity Temperature pH
Feed √ √ √ √ √ Permeate √ √ √ Concentrate √ √
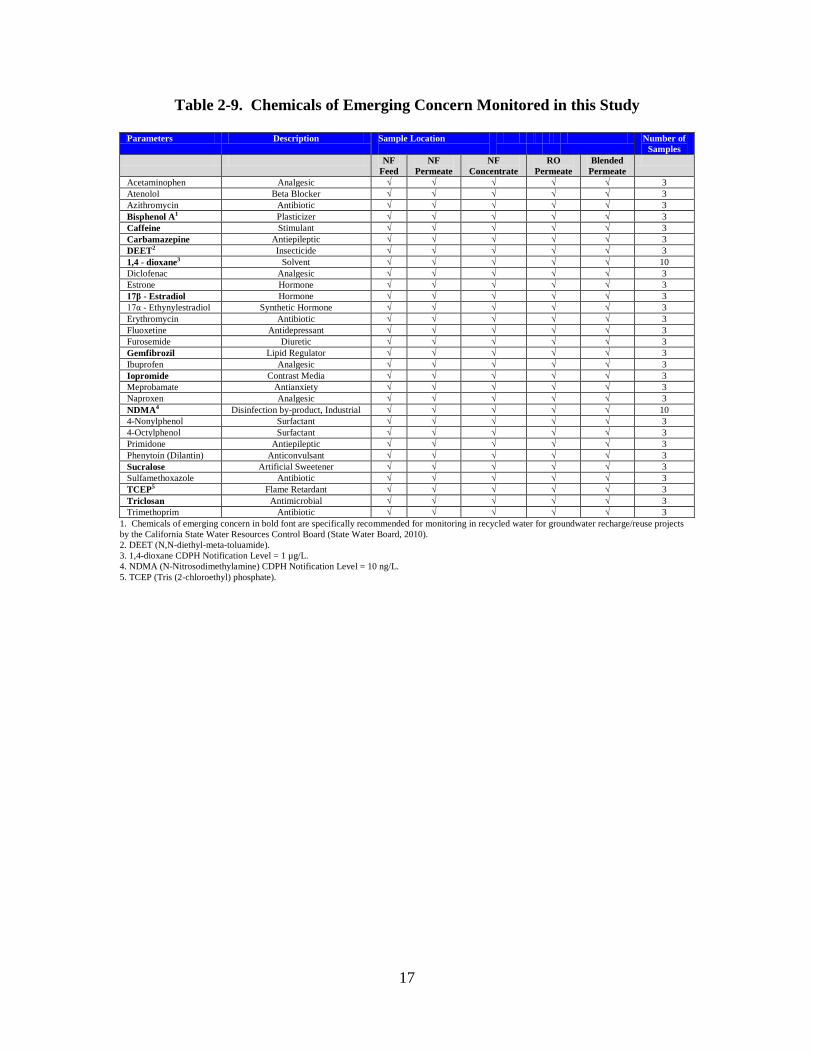
2.4 Water Quality Sampling and Analysis Plan To evaluate the rejection performance of the NF/RO integrated system, a sampling and analysis program was implemented. Grab samples were collected from the feed, permeate, and concentrate streams of the pilot system (Figure 2-2) and analyzed for the water quality parameters shown in Tables 2-8 and 2-9 by the Sanitation Districts' San Jose Creek Water Quality Laboratory. Table 2-8 includes general water quality parameters, while Table 2-9 includes chemicals of emerging concern (CECs). Analytical methods for all of the parameters are listed in Appendix C. The list of CECs includes constituents with California Department of Public Health (CDPH) Notification Levels as well as unregulated chemicals such as selected pharmaceuticals, personal care products, and hormones. Several of these CECs, in bold font, are specifically recommended for monitoring in recycled water for groundwater recharge/reuse projects by the California State Water Resources Control Board (State Water Board, 2010). Ten sampling events were conducted for TDS, TOC, nitrogen, UVT, 1,4-dioxane, and NDMA, while only three sampling events were conducted for all other parameters. TDS results were used to evaluate the general salt rejection capabilities of the system. TOC and nitrogen are of particular importance because these constituents are specifically addressed in the most recent revision of the CDPH Draft Groundwater Recharge Reuse Regulations (November 21, 2011). UVT measurements were only conducted on permeate samples to assess the treatability of constituents (e.g., NDMA, 1,4-dioxane) in the system’s product water by UV/AOP. In addition to having CDPH Notification Levels, NDMA and 1,4-dioxane are of particular importance because these constituents are typically used to establish minimum design requirements for UV/AOP systems.
16
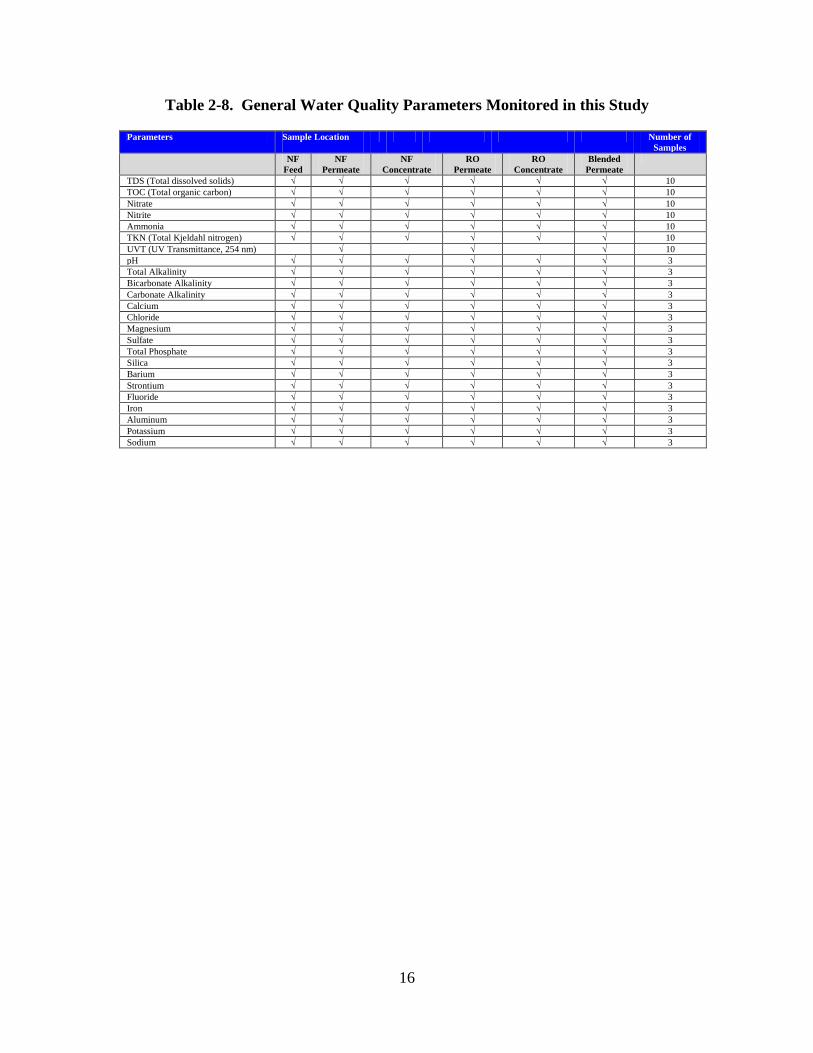
Table 2-8. General Water Quality Parameters Monitored in this Study
Parameters Sample Location
Number of Samples
NF Feed
NF Permeate
NF Concentrate
RO Permeate
RO Concentrate
Blended Permeate
TDS (Total dissolved solids) √ √ √ √ √ √ 10 TOC (Total organic carbon) √ √ √ √ √ √ 10 Nitrate √ √ √ √ √ √ 10 Nitrite √ √ √ √ √ √ 10 Ammonia √ √ √ √ √ √ 10 TKN (Total Kjeldahl nitrogen) √ √ √ √ √ √ 10 UVT (UV Transmittance, 254 nm) √ √ √ 10 pH √ √ √ √ √ √ 3 Total Alkalinity √ √ √ √ √ √ 3 Bicarbonate Alkalinity √ √ √ √ √ √ 3 Carbonate Alkalinity √ √ √ √ √ √ 3 Calcium √ √ √ √ √ √ 3 Chloride √ √ √ √ √ √ 3 Magnesium √ √ √ √ √ √ 3 Sulfate √ √ √ √ √ √ 3 Total Phosphate √ √ √ √ √ √ 3 Silica √ √ √ √ √ √ 3 Barium √ √ √ √ √ √ 3 Strontium √ √ √ √ √ √ 3 Fluoride √ √ √ √ √ √ 3 Iron √ √ √ √ √ √ 3 Aluminum √ √ √ √ √ √ 3 Potassium √ √ √ √ √ √ 3 Sodium √ √ √ √ √ √ 3
17
Table 2-9. Chemicals of Emerging Concern Monitored in this Study
Parameters Description Sample Location
Number of Samples
NF Feed
NF Permeate
NF Concentrate
RO Permeate
Blended Permeate
Acetaminophen Analgesic √ √ √ √ √ 3 Atenolol Beta Blocker √ √ √ √ √ 3 Azithromycin Antibiotic √ √ √ √ √ 3 Bisphenol A1 Plasticizer √ √ √ √ √ 3 Caffeine Stimulant √ √ √ √ √ 3 Carbamazepine Antiepileptic √ √ √ √ √ 3 DEET2 Insecticide √ √ √ √ √ 3 1,4 - dioxane3 Solvent √ √ √ √ √ 10 Diclofenac Analgesic √ √ √ √ √ 3 Estrone Hormone √ √ √ √ √ 3 17β - Estradiol Hormone √ √ √ √ √ 3 17α - Ethynylestradiol Synthetic Hormone √ √ √ √ √ 3 Erythromycin Antibiotic √ √ √ √ √ 3 Fluoxetine Antidepressant √ √ √ √ √ 3 Furosemide Diuretic √ √ √ √ √ 3 Gemfibrozil Lipid Regulator √ √ √ √ √ 3 Ibuprofen Analgesic √ √ √ √ √ 3 Iopromide Contrast Media √ √ √ √ √ 3 Meprobamate Antianxiety √ √ √ √ √ 3 Naproxen Analgesic √ √ √ √ √ 3 NDMA4 Disinfection by-product, Industrial √ √ √ √ √ 10 4-Nonylphenol Surfactant √ √ √ √ √ 3 4-Octylphenol Surfactant √ √ √ √ √ 3 Primidone Antiepileptic √ √ √ √ √ 3 Phenytoin (Dilantin) Anticonvulsant √ √ √ √ √ 3 Sucralose Artificial Sweetener √ √ √ √ √ 3 Sulfamethoxazole Antibiotic √ √ √ √ √ 3 TCEP5 Flame Retardant √ √ √ √ √ 3 Triclosan Antimicrobial √ √ √ √ √ 3 Trimethoprim Antibiotic √ √ √ √ √ 3
1. Chemicals of emerging concern in bold font are specifically recommended for monitoring in recycled water for groundwater recharge/reuse projects by the California State Water Resources Control Board (State Water Board, 2010). 2. DEET (N,N-diethyl-meta-toluamide). 3. 1,4-dioxane CDPH Notification Level = 1 µg/L. 4. NDMA (N-Nitrosodimethylamine) CDPH Notification Level = 10 ng/L. 5. TCEP (Tris (2-chloroethyl) phosphate).

18
2.5 Membrane Autopsy Analyses At the conclusion of testing, sample NF and RO membrane elements were sent to Avista Technologies for autopsy analyses to (1) compare the performance of the elements to manufacturer specifications for new membrane elements, and (2) characterize the foulant material on the membrane surface. A total of four elements were analyzed, including two NF-270 and two TFC-HR elements (one lead and one tail end element each from the primary NF and secondary RO systems). The analyses that were conducted and their descriptions are listed in Table 2-10.
Table 2-10. Membrane Autopsy Analyses
Analysis Description
External Visual Exam Thorough examination of the exterior of the elements with a focus on damage or defects in the outer wrappings, anti-telescope devices, permeate tubes, brine seals, and the general condition of the feed and concentrate ends.
Wet Test
The elements are placed in a single element vessel and operated under laboratory conditions. Flow, pressure, and salt rejection are measured and these data are compared to manufacturer specifications.
Internal Visual Exam The outer wrappings are removed and the membranes are cut open. Glue lines are examined and notes are made of any color and/or odors emanating from the membrane leaves. Foulant material is collected for analysis.
Foulant Analyses Loss on Ignition: Thermogravimetric test used to determine the amount of organic foulants relative to inorganic foulants on the membrane surface. Foulant Density: Membrane foulant density is determined as the weight of dry foulant per cm2 of membrane surface. Acid Test: Used to determine the presence of carbonates on the membrane surface. Several drops of dilute hydrochloric acid are placed on the foulant surfaces. Effervescing indicates a positive test result. Gram Staining: Foulant samples are stained and examined with a light microscope at 1000x using an oil immersion lens. Gram positive bacteria are stained blue, while Gram negative bacteria are stained red. FTIR (Fourier-Transform Infra Red) Spectroscopy Analysis: Used to determine the nature of any organic foulants on membrane surface. EDX (Energy Dispersive X-Ray)/ SEM (Scanning Electron Microscopy): EDX analyses are used to identify inorganic foulants and SEM analyses are used to produce high magnification images of the membrane surface.
19
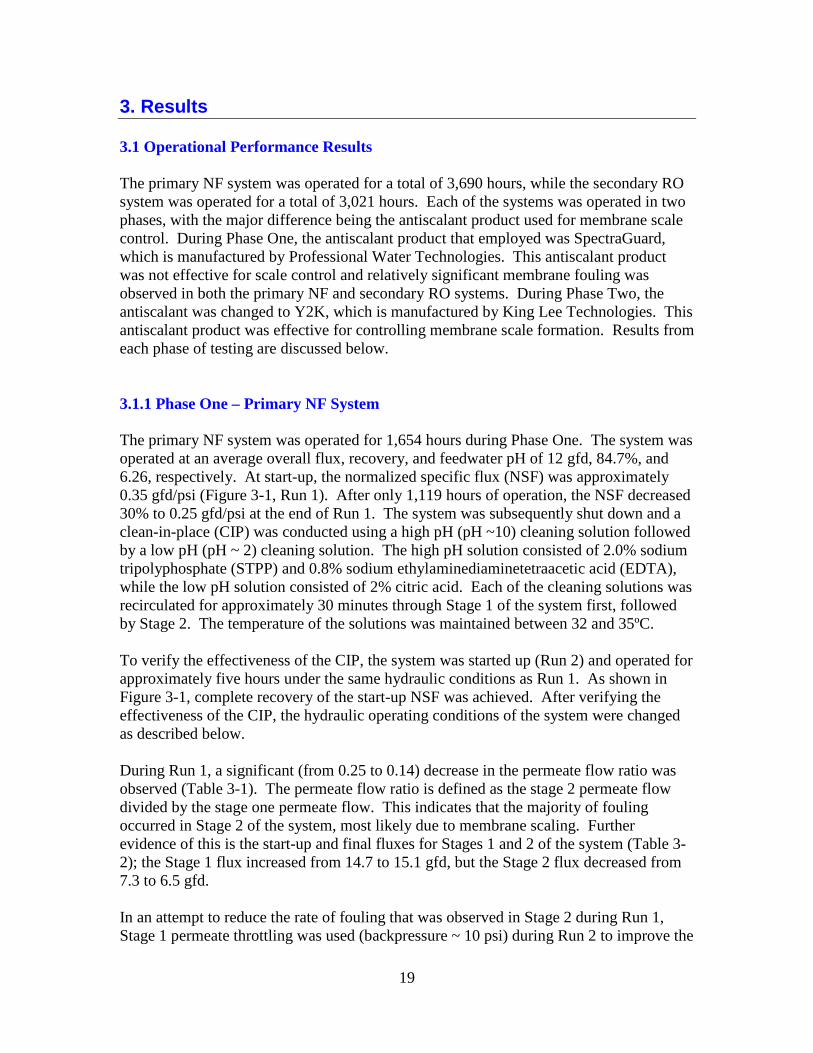
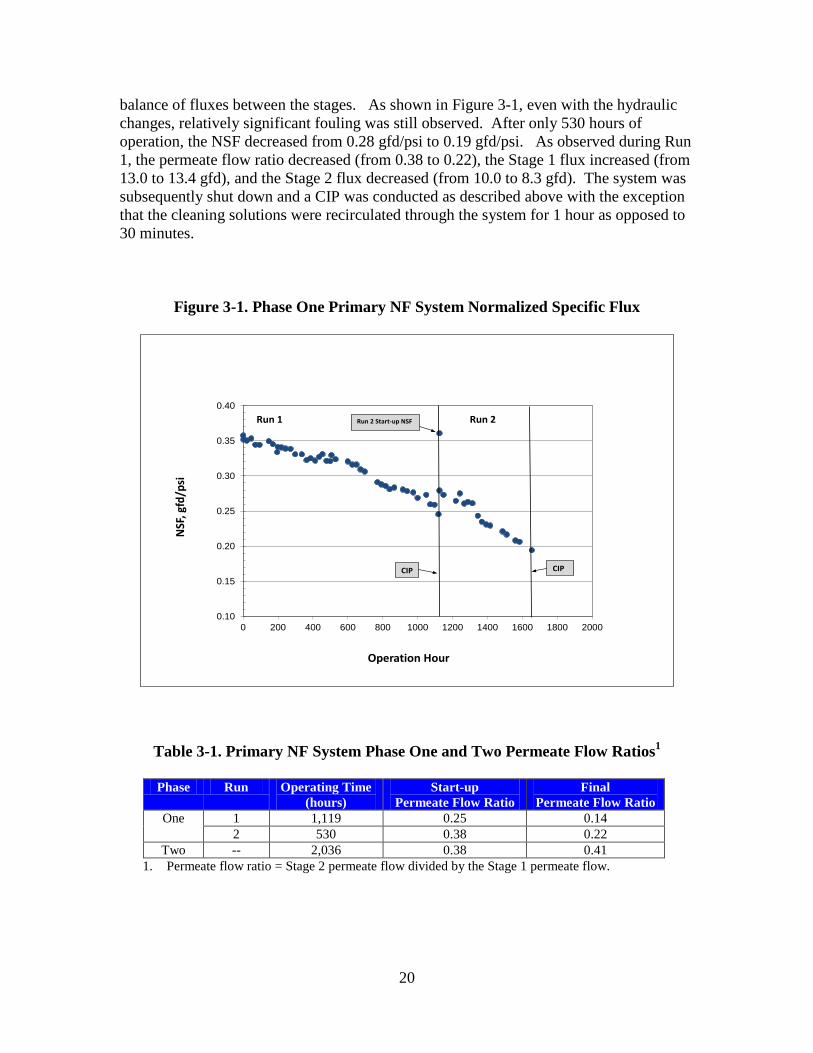
3. Results 3.1 Operational Performance Results The primary NF system was operated for a total of 3,690 hours, while the secondary RO system was operated for a total of 3,021 hours. Each of the systems was operated in two phases, with the major difference being the antiscalant product used for membrane scale control. During Phase One, the antiscalant product that employed was SpectraGuard, which is manufactured by Professional Water Technologies. This antiscalant product was not effective for scale control and relatively significant membrane fouling was observed in both the primary NF and secondary RO systems. During Phase Two, the antiscalant was changed to Y2K, which is manufactured by King Lee Technologies. This antiscalant product was effective for controlling membrane scale formation. Results from each phase of testing are discussed below. 3.1.1 Phase One – Primary NF System The primary NF system was operated for 1,654 hours during Phase One. The system was operated at an average overall flux, recovery, and feedwater pH of 12 gfd, 84.7%, and 6.26, respectively. At start-up, the normalized specific flux (NSF) was approximately 0.35 gfd/psi (Figure 3-1, Run 1). After only 1,119 hours of operation, the NSF decreased 30% to 0.25 gfd/psi at the end of Run 1. The system was subsequently shut down and a clean-in-place (CIP) was conducted using a high pH (pH ~10) cleaning solution followed by a low pH (pH ~ 2) cleaning solution. The high pH solution consisted of 2.0% sodium tripolyphosphate (STPP) and 0.8% sodium ethylaminediaminetetraacetic acid (EDTA), while the low pH solution consisted of 2% citric acid. Each of the cleaning solutions was recirculated for approximately 30 minutes through Stage 1 of the system first, followed by Stage 2. The temperature of the solutions was maintained between 32 and 35ºC. To verify the effectiveness of the CIP, the system was started up (Run 2) and operated for approximately five hours under the same hydraulic conditions as Run 1. As shown in Figure 3-1, complete recovery of the start-up NSF was achieved. After verifying the effectiveness of the CIP, the hydraulic operating conditions of the system were changed as described below. During Run 1, a significant (from 0.25 to 0.14) decrease in the permeate flow ratio was observed (Table 3-1). The permeate flow ratio is defined as the stage 2 permeate flow divided by the stage one permeate flow. This indicates that the majority of fouling occurred in Stage 2 of the system, most likely due to membrane scaling. Further evidence of this is the start-up and final fluxes for Stages 1 and 2 of the system (Table 3-2); the Stage 1 flux increased from 14.7 to 15.1 gfd, but the Stage 2 flux decreased from 7.3 to 6.5 gfd. In an attempt to reduce the rate of fouling that was observed in Stage 2 during Run 1, Stage 1 permeate throttling was used (backpressure ~ 10 psi) during Run 2 to improve the
20
balance of fluxes between the stages. As shown in Figure 3-1, even with the hydraulic changes, relatively significant fouling was still observed. After only 530 hours of operation, the NSF decreased from 0.28 gfd/psi to 0.19 gfd/psi. As observed during Run 1, the permeate flow ratio decreased (from 0.38 to 0.22), the Stage 1 flux increased (from 13.0 to 13.4 gfd), and the Stage 2 flux decreased (from 10.0 to 8.3 gfd). The system was subsequently shut down and a CIP was conducted as described above with the exception that the cleaning solutions were recirculated through the system for 1 hour as opposed to 30 minutes.
Figure 3-1. Phase One Primary NF System Normalized Specific Flux
0.10
0.15
0.20
0.25
0.30
0.35
0.40
0 200 400 600 800 1000 1200 1400 1600 1800 2000
NSF
, gfd
/psi
Operation Hour
CIP CIP
Run 2 Start-up NSFRun 1 Run 2
Table 3-1. Primary NF System Phase One and Two Permeate Flow Ratios1
Phase Run Operating Time
(hours) Start-up
Permeate Flow Ratio Final
Permeate Flow Ratio One 1 1,119 0.25 0.14
2 530 0.38 0.22 Two -- 2,036 0.38 0.41
1. Permeate flow ratio = Stage 2 permeate flow divided by the Stage 1 permeate flow.
21
Table 3-2. Primary NF System Phase One and Two Fluxes
Phase Run Operating Time (hours)
Overall System Flux (gfd)
Stage 1 Flux (gfd)
Stage 2 Flux (gfd)
One 1 1,119 12.2 Start-up = 14.7 Final = 15.1
Start-up = 7.3 Final = 6.5
2 530 11.8 Start-up = 13.0 Final = 13.4
Start-up = 10.0 Final = 8.3
Two -- 2,036 12.1 Start-up = 13.0 Final = 12.8
Start-up = 10.0 Final = 10.8
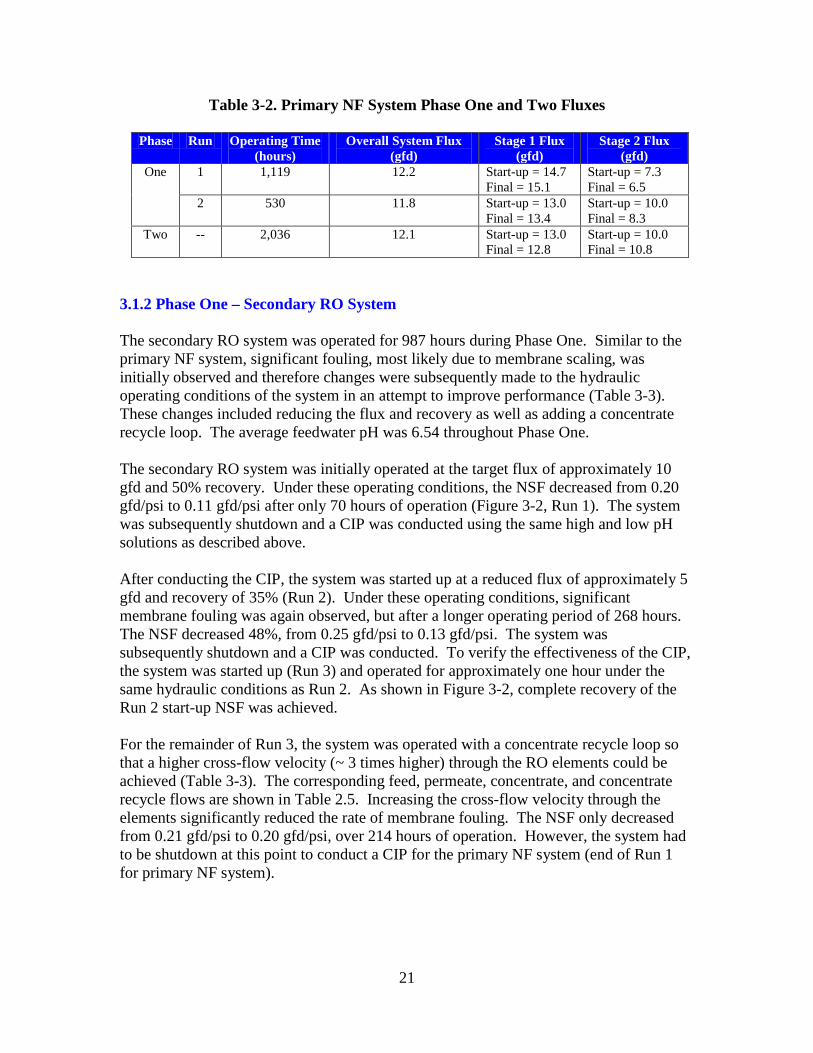
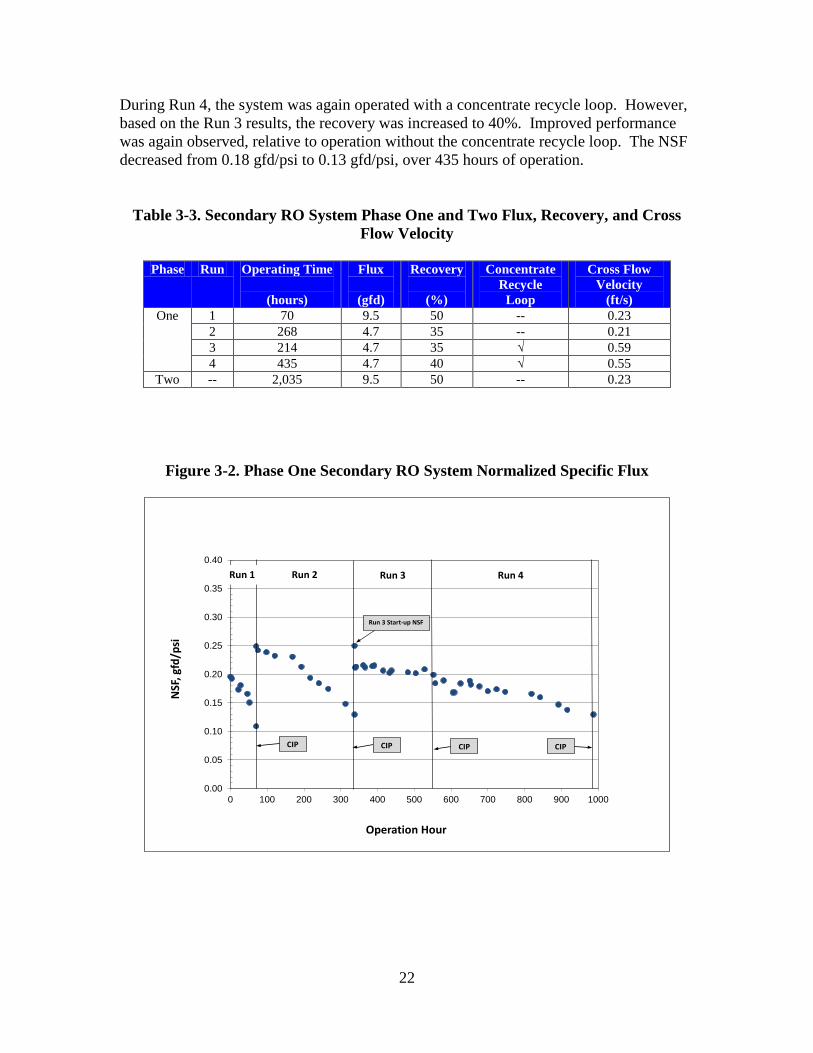
3.1.2 Phase One – Secondary RO System The secondary RO system was operated for 987 hours during Phase One. Similar to the primary NF system, significant fouling, most likely due to membrane scaling, was initially observed and therefore changes were subsequently made to the hydraulic operating conditions of the system in an attempt to improve performance (Table 3-3). These changes included reducing the flux and recovery as well as adding a concentrate recycle loop. The average feedwater pH was 6.54 throughout Phase One. The secondary RO system was initially operated at the target flux of approximately 10 gfd and 50% recovery. Under these operating conditions, the NSF decreased from 0.20 gfd/psi to 0.11 gfd/psi after only 70 hours of operation (Figure 3-2, Run 1). The system was subsequently shutdown and a CIP was conducted using the same high and low pH solutions as described above. After conducting the CIP, the system was started up at a reduced flux of approximately 5 gfd and recovery of 35% (Run 2). Under these operating conditions, significant membrane fouling was again observed, but after a longer operating period of 268 hours. The NSF decreased 48%, from 0.25 gfd/psi to 0.13 gfd/psi. The system was subsequently shutdown and a CIP was conducted. To verify the effectiveness of the CIP, the system was started up (Run 3) and operated for approximately one hour under the same hydraulic conditions as Run 2. As shown in Figure 3-2, complete recovery of the Run 2 start-up NSF was achieved. For the remainder of Run 3, the system was operated with a concentrate recycle loop so that a higher cross-flow velocity (~ 3 times higher) through the RO elements could be achieved (Table 3-3). The corresponding feed, permeate, concentrate, and concentrate recycle flows are shown in Table 2.5. Increasing the cross-flow velocity through the elements significantly reduced the rate of membrane fouling. The NSF only decreased from 0.21 gfd/psi to 0.20 gfd/psi, over 214 hours of operation. However, the system had to be shutdown at this point to conduct a CIP for the primary NF system (end of Run 1 for primary NF system).
22
During Run 4, the system was again operated with a concentrate recycle loop. However, based on the Run 3 results, the recovery was increased to 40%. Improved performance was again observed, relative to operation without the concentrate recycle loop. The NSF decreased from 0.18 gfd/psi to 0.13 gfd/psi, over 435 hours of operation.
Table 3-3. Secondary RO System Phase One and Two Flux, Recovery, and Cross Flow Velocity
Phase Run Operating Time
(hours)
Flux
(gfd)
Recovery
(%)
Concentrate Recycle
Loop
Cross Flow Velocity
(ft/s) One 1 70 9.5 50 -- 0.23
2 268 4.7 35 -- 0.21 3 214 4.7 35 √ 0.59 4 435 4.7 40 √ 0.55
Two -- 2,035 9.5 50 -- 0.23
Figure 3-2. Phase One Secondary RO System Normalized Specific Flux
0.00
0.05
0.10
0.15
0.20
0.25
0.30
0.35
0.40
0 100 200 300 400 500 600 700 800 900 1000
NSF
, gfd
/psi
Operation Hour
Run 1 Run 4Run 3Run 2
CIP
Run 3 Start-up NSF
CIP CIP CIP

23
3.1.3 Phase Two – Primary NF System During Phase Two, the primary NF system was operated at an average overall flux, recovery, and feedwater pH of 12.1 gfd, 84.8%, and 6.23, respectively. Similar to Phase One (Run 2), Stage 1 permeate throttling was used to balance the fluxes between the stages of the system. Under these conditions, the system was operated for 2,036 hours, or approximately 3 months, with significantly less fouling compared to Phase One operation. The NSF decreased from 0.31 gfd/psi at start-up to 0.26 gfd/psi at the end of Phase Two (Figure 3-3). The permeate flow ratio increased (from 0.38 to 0.41), the Stage 1 flux decreased (from 13.0 to 12.8 gfd), and the Stage 2 flux increased (from 10.0 to 10.8 gfd) (Tables 3-1 and 3-2). These results indicate that there was insignificant scaling in Stage 2 of the system. This was confirmed by the results of membrane autopsy analyses, discussed in Section 3.2.
Figure 3-3. Phase Two Primary NF System Normalized Specific Flux
0.10
0.15
0.20
0.25
0.30
0.35
0.40
0 200 400 600 800 1000 1200 1400 1600 1800 2000 2200
NSF
, gfd
/psi
Operation Hour
24
3.1.4 Phase Two – Secondary RO System
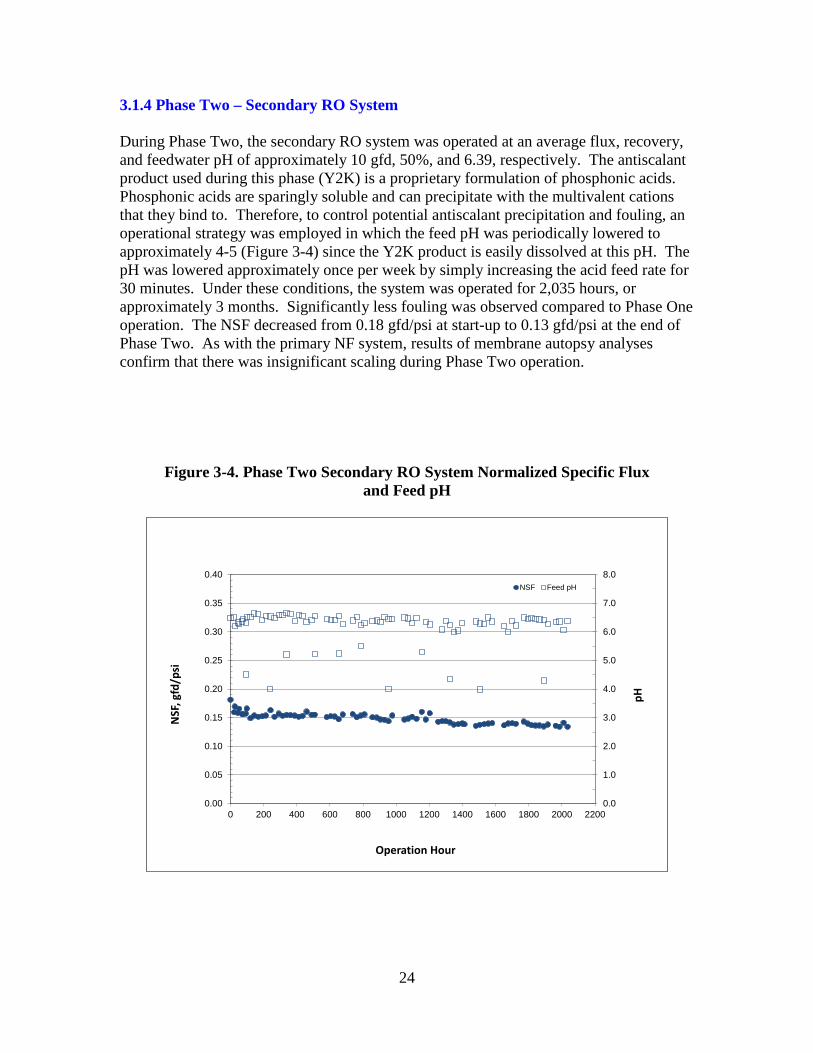
During Phase Two, the secondary RO system was operated at an average flux, recovery, and feedwater pH of approximately 10 gfd, 50%, and 6.39, respectively. The antiscalant product used during this phase (Y2K) is a proprietary formulation of phosphonic acids. Phosphonic acids are sparingly soluble and can precipitate with the multivalent cations that they bind to. Therefore, to control potential antiscalant precipitation and fouling, an operational strategy was employed in which the feed pH was periodically lowered to approximately 4-5 (Figure 3-4) since the Y2K product is easily dissolved at this pH. The pH was lowered approximately once per week by simply increasing the acid feed rate for 30 minutes. Under these conditions, the system was operated for 2,035 hours, or approximately 3 months. Significantly less fouling was observed compared to Phase One operation. The NSF decreased from 0.18 gfd/psi at start-up to 0.13 gfd/psi at the end of Phase Two. As with the primary NF system, results of membrane autopsy analyses confirm that there was insignificant scaling during Phase Two operation.
Figure 3-4. Phase Two Secondary RO System Normalized Specific Flux and Feed pH
0.0
1.0
2.0
3.0
4.0
5.0
6.0
7.0
8.0
0.00
0.05
0.10
0.15
0.20
0.25
0.30
0.35
0.40
0 200 400 600 800 1000 1200 1400 1600 1800 2000 2200
pH
NSF
, gfd
/psi
Operation Hour
NSF Feed pH
25
3.2 Membrane Autopsy Results At the conclusion of testing, sample NF and RO membrane elements were sent to Avista Technologies for autopsy analyses to (1) compare the performance of the elements to manufacturer specifications for new membrane elements, and (2) characterize the foulant material on the membrane surface. A total of four elements were analyzed, including two NF-270 and two TFC-HR elements (one lead and one tail end element each from the primary NF and secondary RO systems). The results of the autopsy analyses confirm the operational performance results and indicate that significant membrane fouling in general, and scaling in particular, did not occur during Phase Two operation. Membrane fouling was identified to be primarily organic in nature, with some biofouling, colloidal, as well as inorganic fouling. Results of autopsy analyses for the primary NF and secondary RO systems are summarized below. 3.2.1 Primary NF System 3.2.1.1 External Visual Exam Based on the external exam of the lead and tail end NF elements, the outer fiberglass wrappings, anti-telescope devices, permeate tubes, brine seals, and feed and concentrate ends were all in good condition. 3.2.1.2 Wet Test Wet test results for the lead and tail end NF elements are shown in Table 3-4. The tail element normalized permeate flow was within the manufacturer specified range for a new, clean membrane. However, membrane fouling was observed for the lead element; the normalized permeate flow was slightly lower than the specified minimum. The differential pressure for both elements was within the manufacturer specified range. This indicates that there was no significant blockage of the feed/concentrate channel due to deposition of particulate matter, biofilm formation, or scaling, during operation.
Table 3-4. Wet Test Results for Lead and Tail NF Elements1
Parameter Lead Element Tail Element Manufacturer Specification Normalized Permeate Flow (gpm) 1.3 1.7 1.5 - 1.7 Differential Pressure (psi) 3 3 3 - 5 MgSO4 Rejection (%) 99.5 96.9 ≥ 97
1. Test conditions: 2,000 mg/L MgSO4, 70 psi feed pressure, pH = 7.7
26
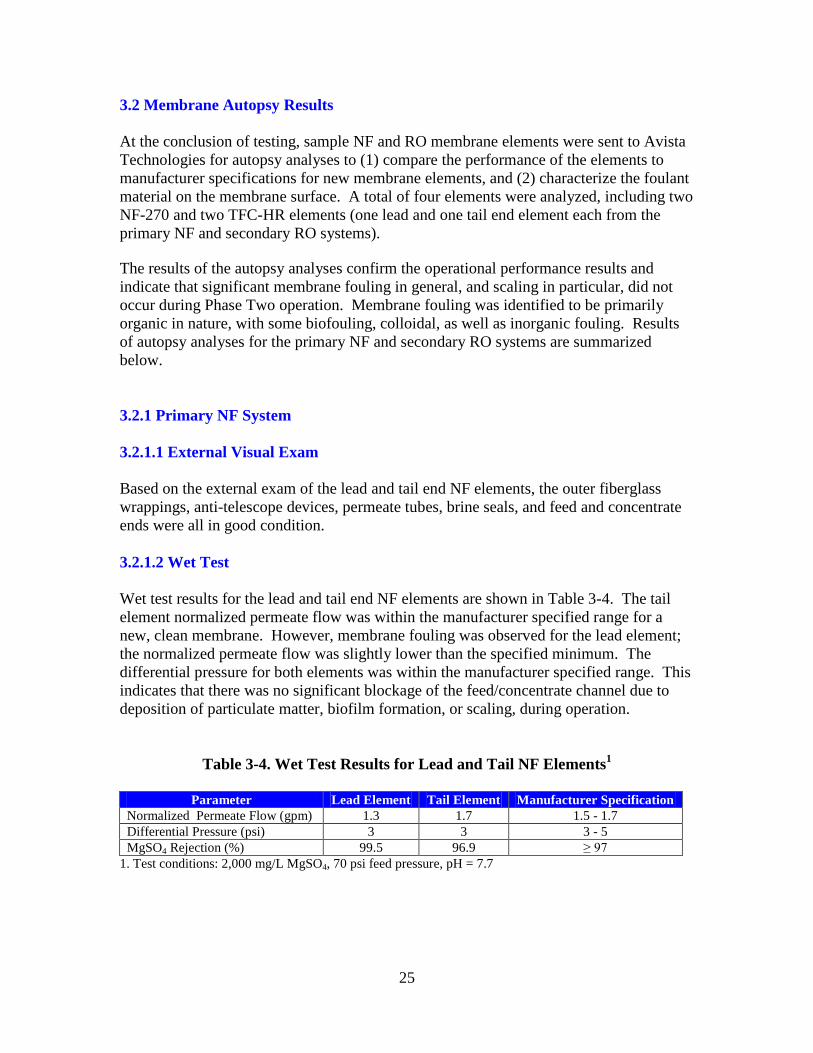
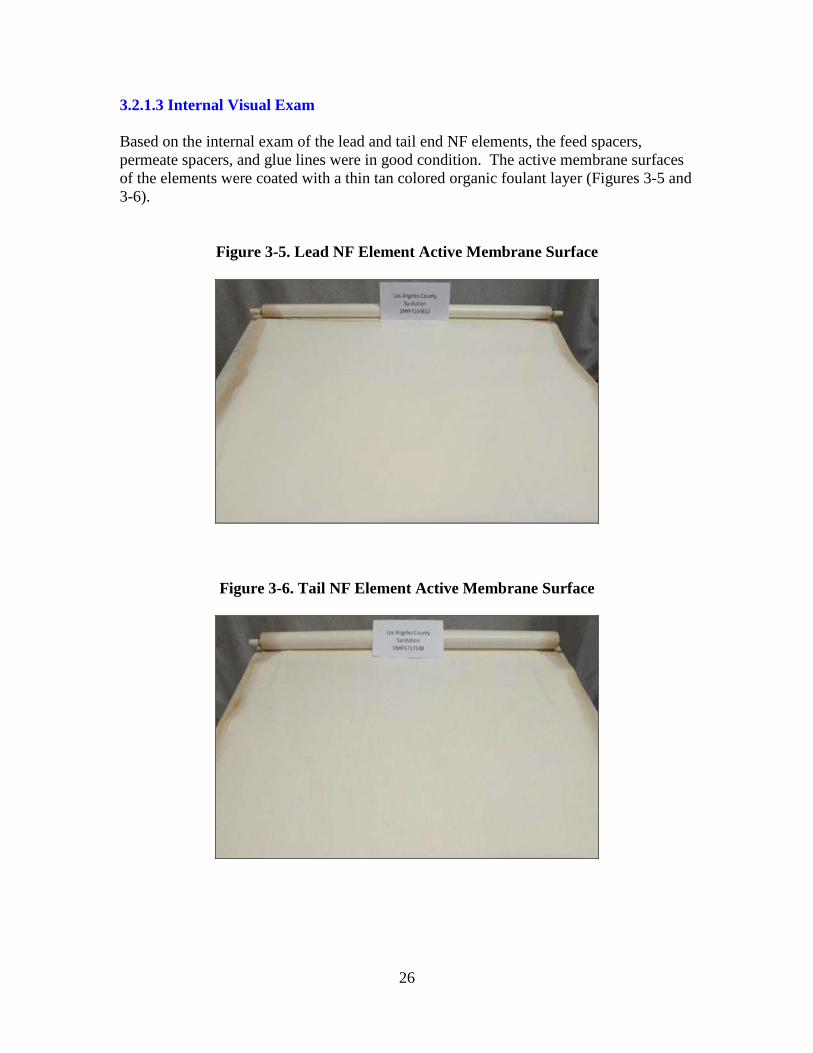
3.2.1.3 Internal Visual Exam Based on the internal exam of the lead and tail end NF elements, the feed spacers, permeate spacers, and glue lines were in good condition. The active membrane surfaces of the elements were coated with a thin tan colored organic foulant layer (Figures 3-5 and 3-6).
Figure 3-5. Lead NF Element Active Membrane Surface
Figure 3-6. Tail NF Element Active Membrane Surface

27
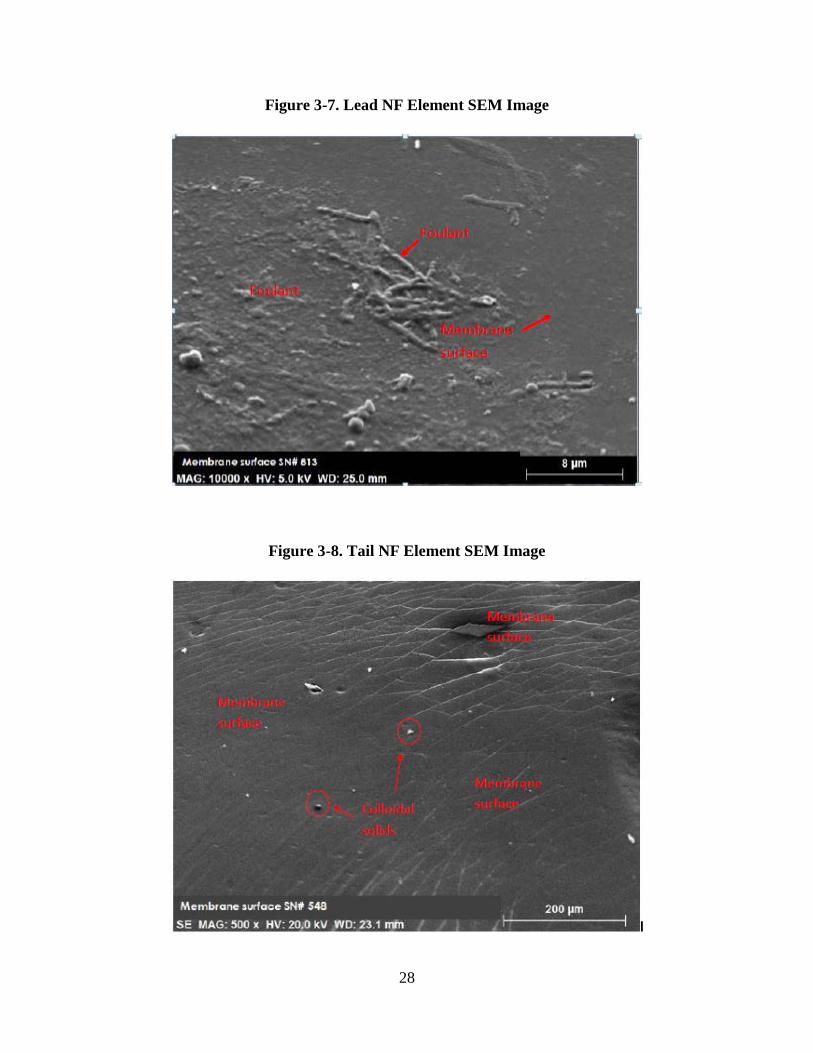
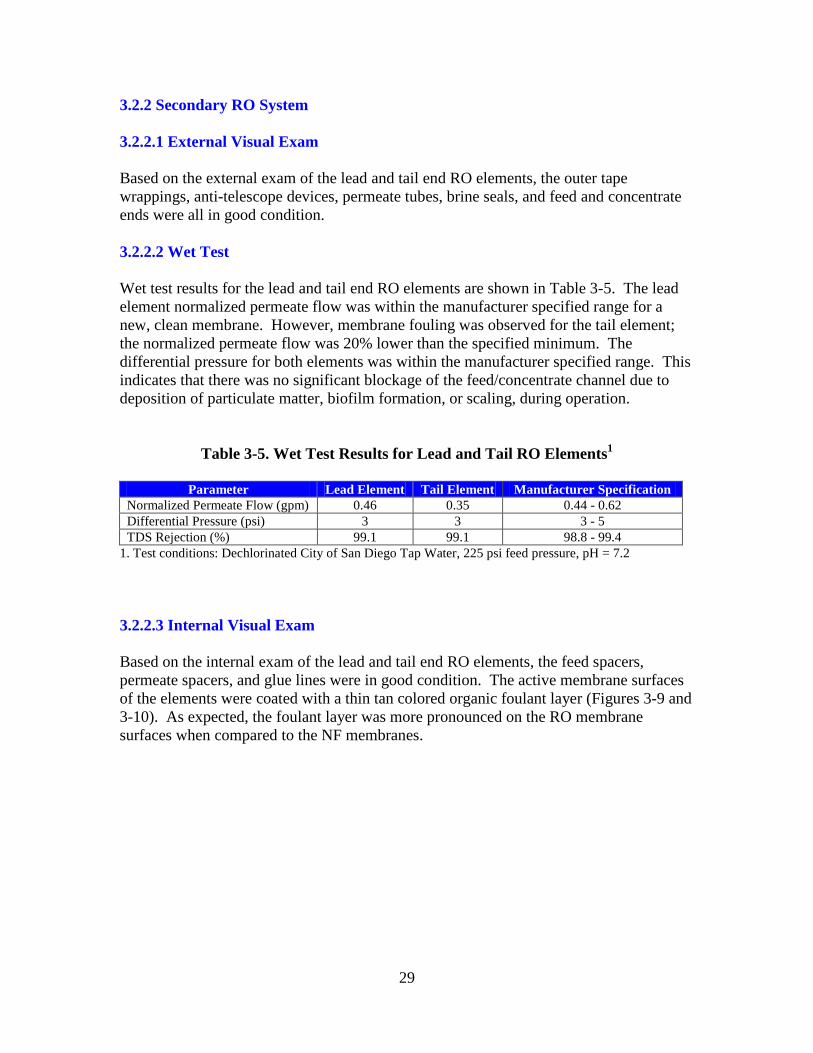
3.2.1.4 Foulant Analyses Results of the foulant analyses for the lead and tail end NF elements are summarized below. Based on the analyses that were conducted, in conjunction with visual observations of the active membrane surfaces, membrane fouling was identified to be primarily organic in nature. However, biofouling, colloidal, as well as inorganic fouling were also identified. Loss on Ignition: loss on ignition could not be determined due to insufficient foulant material on the membrane surfaces. Foulant Density: foulant density could not be determined due to insufficient foulant material on the membrane surfaces. Acid Test: no effervescing was observed when acid was applied on the surfaces of the membranes indicating that carbonates were not present. Gram Staining: microscope analysis of foulant scraped from the membrane surface identified Gram negative and Gram positive bacteria, algae, and amorphous organic material on the lead element. Insufficient foulant material was present on the tail element to perform the analysis. FTIR: FTIR analyses identified absorbance bands associated with organic material, including carbohydrates and proteins. EDX/SEM: EDX analyses identified negligible inorganic fouling on the membrane surfaces. Trace amounts of silica were identified on the lead element, while trace amounts of silica, aluminum, and magnesium were identified on the tail element. SEM images for both elements did not identify the presence of a significant amount of fouling. Images of the lead element identified a thin layer of organic material and colloidal solids (Figure 3-7). Images of the tail element identified very few particles on the membrane surface (Figure 3-8).
28
Figure 3-7. Lead NF Element SEM Image
Figure 3-8. Tail NF Element SEM Image
29
3.2.2 Secondary RO System 3.2.2.1 External Visual Exam Based on the external exam of the lead and tail end RO elements, the outer tape wrappings, anti-telescope devices, permeate tubes, brine seals, and feed and concentrate ends were all in good condition. 3.2.2.2 Wet Test Wet test results for the lead and tail end RO elements are shown in Table 3-5. The lead element normalized permeate flow was within the manufacturer specified range for a new, clean membrane. However, membrane fouling was observed for the tail element; the normalized permeate flow was 20% lower than the specified minimum. The differential pressure for both elements was within the manufacturer specified range. This indicates that there was no significant blockage of the feed/concentrate channel due to deposition of particulate matter, biofilm formation, or scaling, during operation.
Table 3-5. Wet Test Results for Lead and Tail RO Elements1
Parameter Lead Element Tail Element Manufacturer Specification Normalized Permeate Flow (gpm) 0.46 0.35 0.44 - 0.62 Differential Pressure (psi) 3 3 3 - 5 TDS Rejection (%) 99.1 99.1 98.8 - 99.4
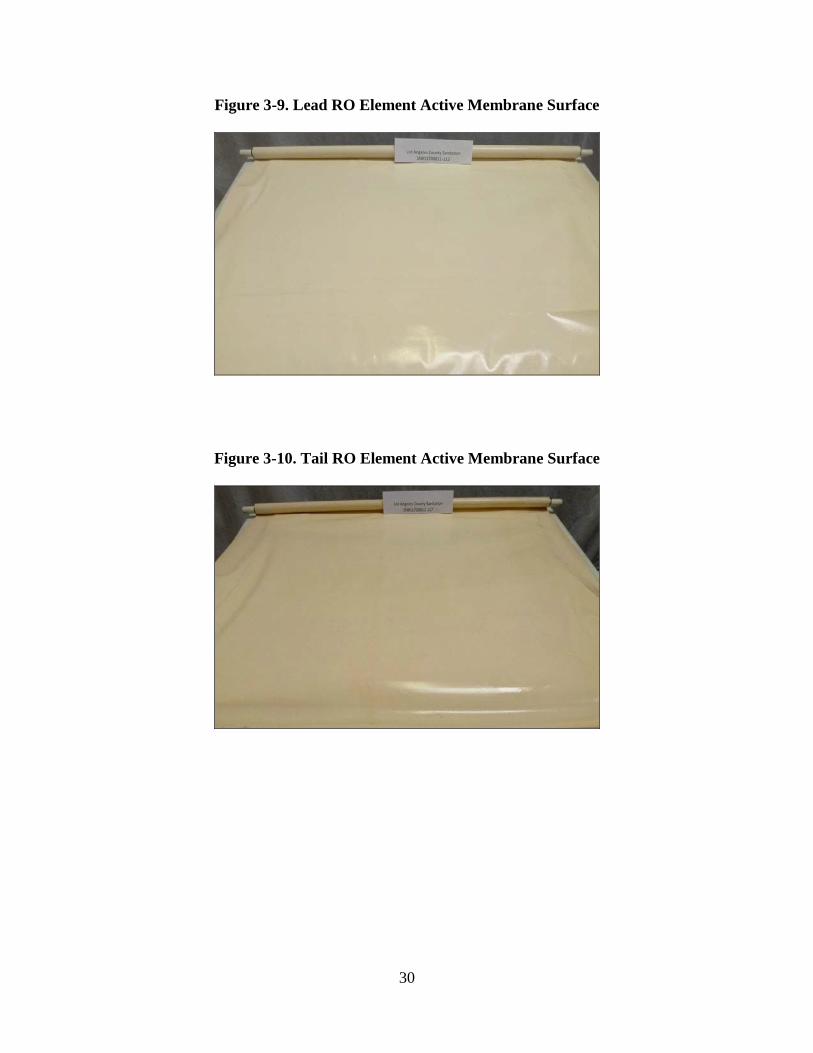
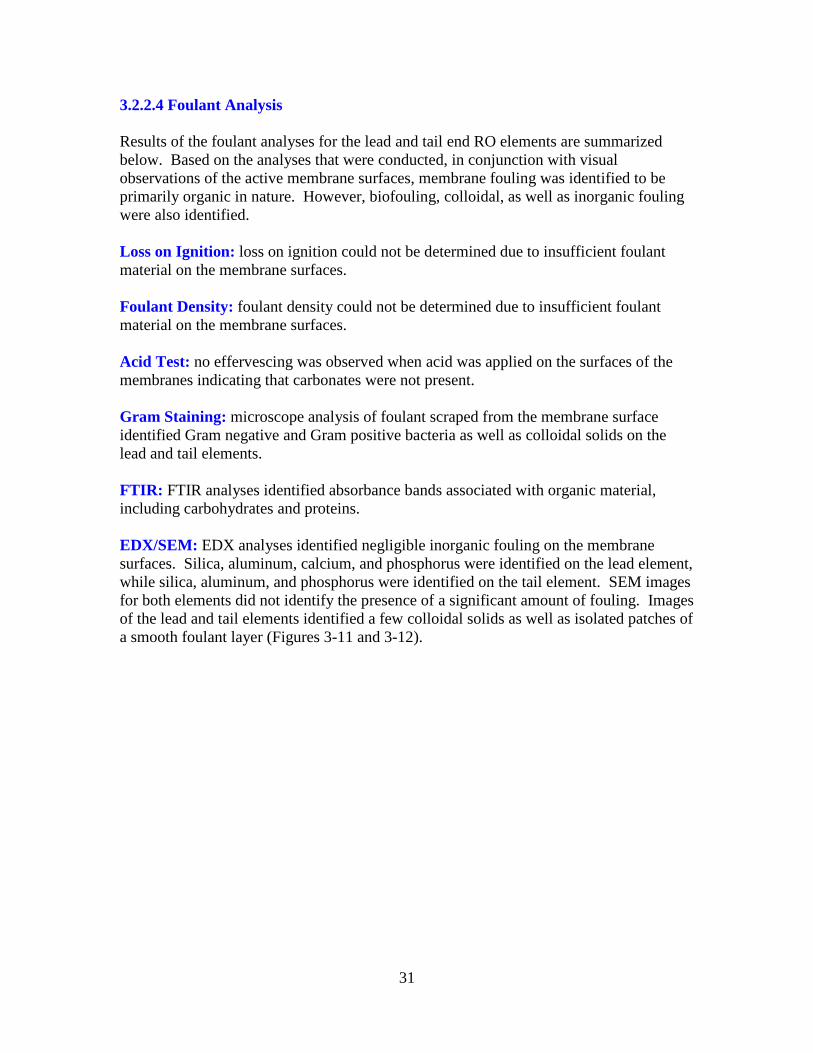
1. Test conditions: Dechlorinated City of San Diego Tap Water, 225 psi feed pressure, pH = 7.2 3.2.2.3 Internal Visual Exam Based on the internal exam of the lead and tail end RO elements, the feed spacers, permeate spacers, and glue lines were in good condition. The active membrane surfaces of the elements were coated with a thin tan colored organic foulant layer (Figures 3-9 and 3-10). As expected, the foulant layer was more pronounced on the RO membrane surfaces when compared to the NF membranes.
30
Figure 3-9. Lead RO Element Active Membrane Surface
Figure 3-10. Tail RO Element Active Membrane Surface
31
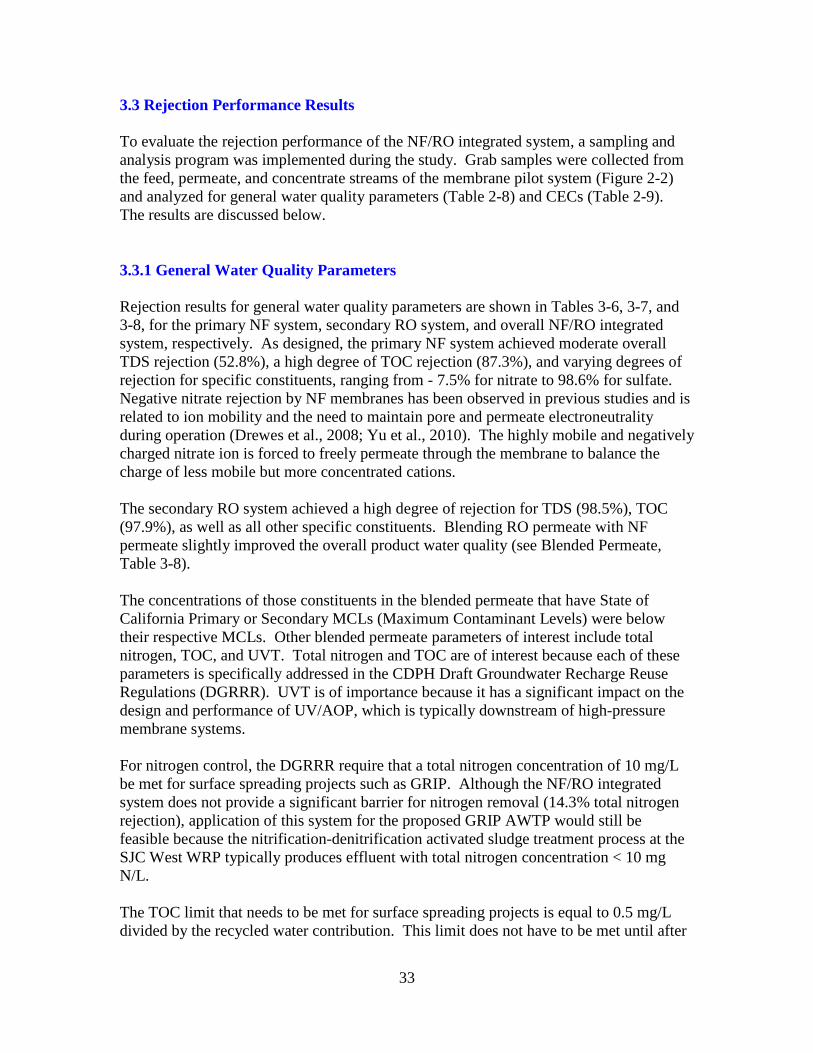
3.2.2.4 Foulant Analysis Results of the foulant analyses for the lead and tail end RO elements are summarized below. Based on the analyses that were conducted, in conjunction with visual observations of the active membrane surfaces, membrane fouling was identified to be primarily organic in nature. However, biofouling, colloidal, as well as inorganic fouling were also identified. Loss on Ignition: loss on ignition could not be determined due to insufficient foulant material on the membrane surfaces. Foulant Density: foulant density could not be determined due to insufficient foulant material on the membrane surfaces. Acid Test: no effervescing was observed when acid was applied on the surfaces of the membranes indicating that carbonates were not present. Gram Staining: microscope analysis of foulant scraped from the membrane surface identified Gram negative and Gram positive bacteria as well as colloidal solids on the lead and tail elements. FTIR: FTIR analyses identified absorbance bands associated with organic material, including carbohydrates and proteins. EDX/SEM: EDX analyses identified negligible inorganic fouling on the membrane surfaces. Silica, aluminum, calcium, and phosphorus were identified on the lead element, while silica, aluminum, and phosphorus were identified on the tail element. SEM images for both elements did not identify the presence of a significant amount of fouling. Images of the lead and tail elements identified a few colloidal solids as well as isolated patches of a smooth foulant layer (Figures 3-11 and 3-12).
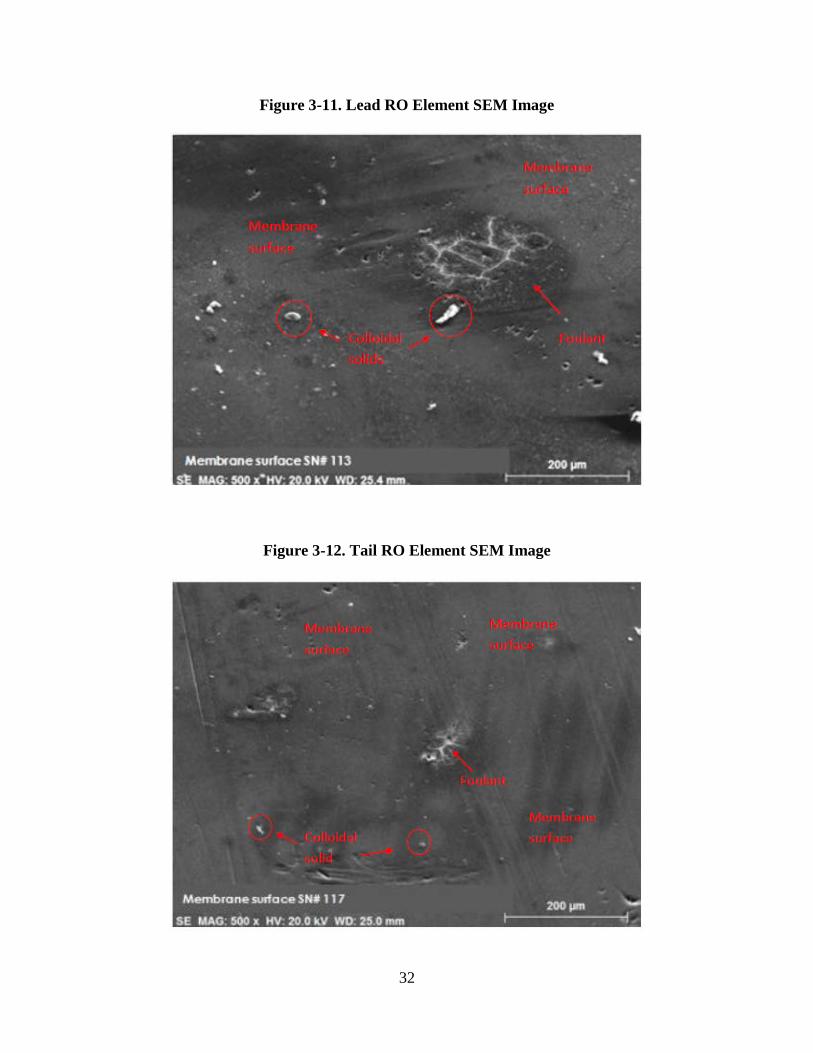
32
Figure 3-11. Lead RO Element SEM Image
Figure 3-12. Tail RO Element SEM Image
33
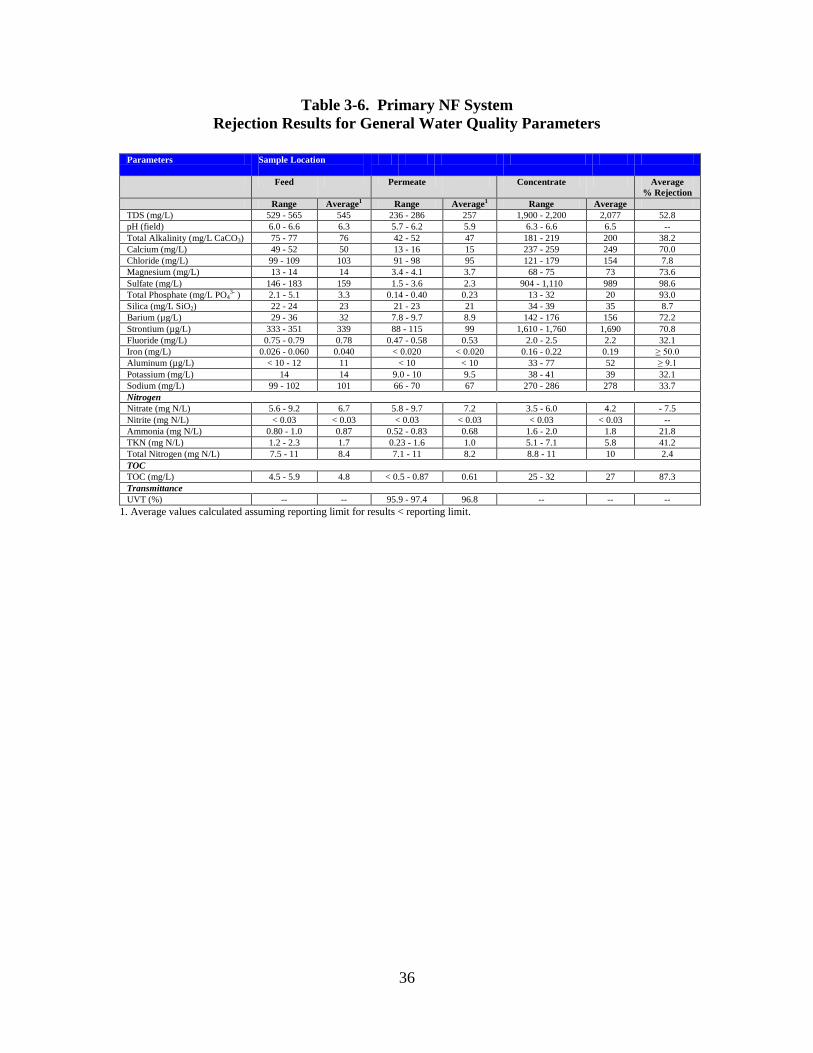
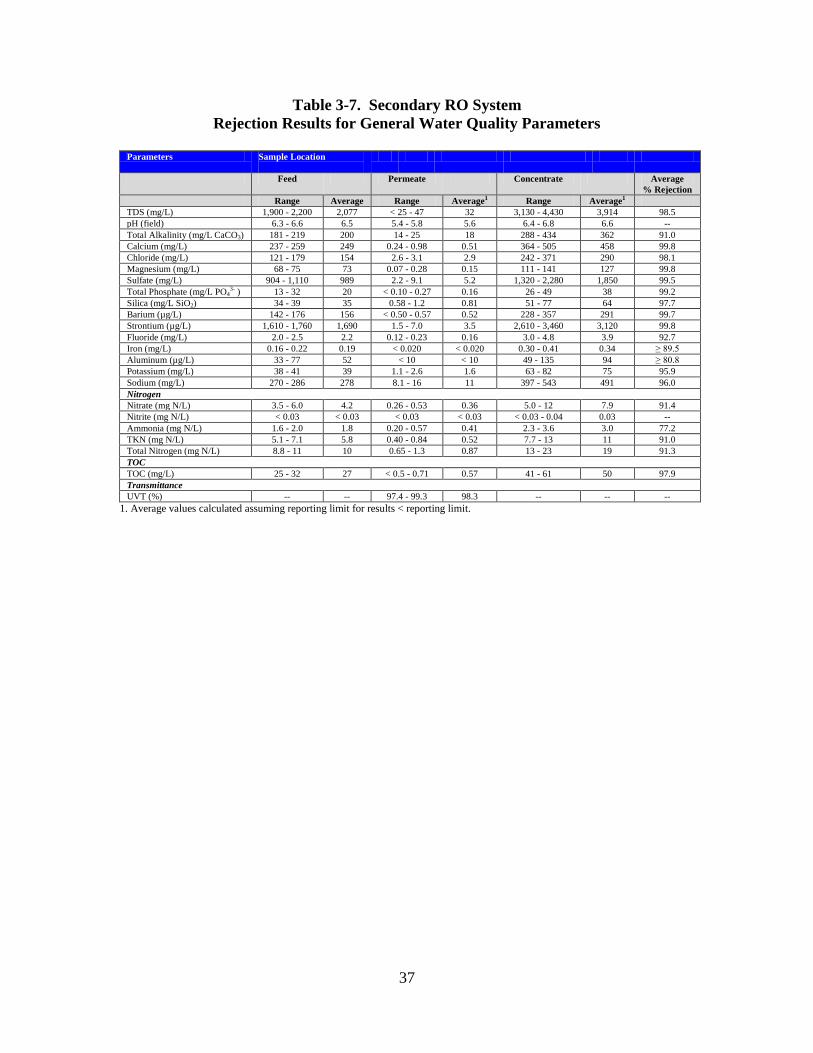
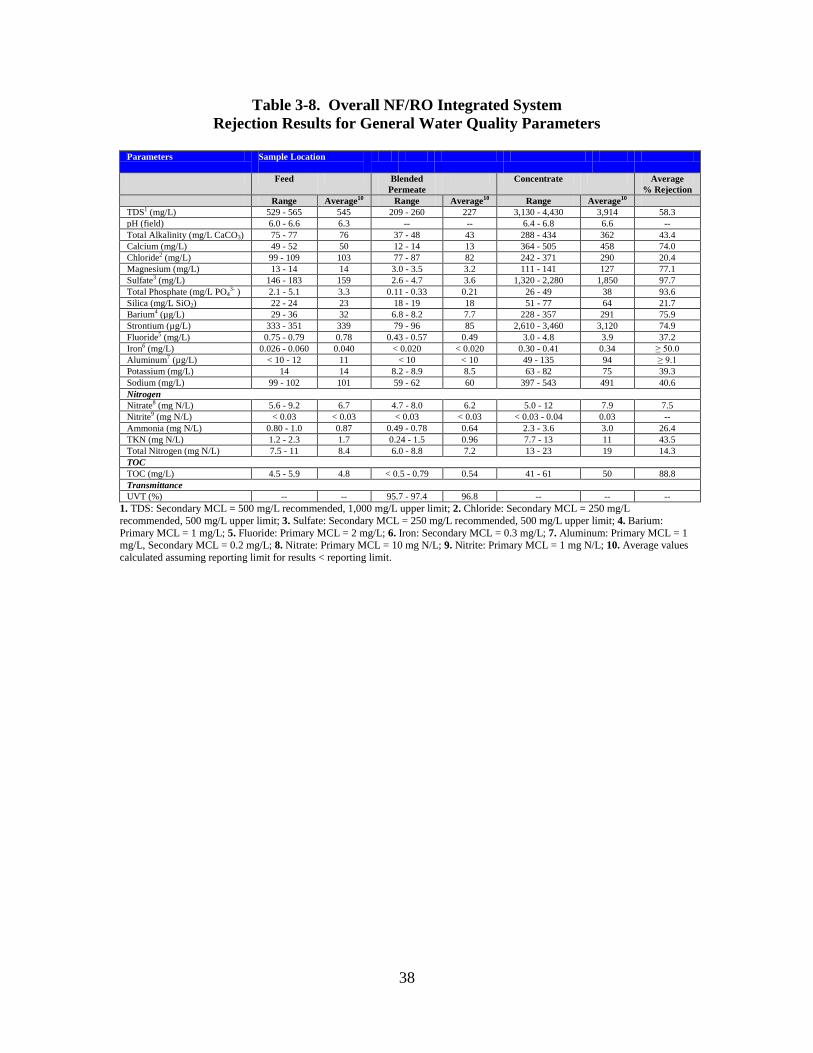
3.3 Rejection Performance Results To evaluate the rejection performance of the NF/RO integrated system, a sampling and analysis program was implemented during the study. Grab samples were collected from the feed, permeate, and concentrate streams of the membrane pilot system (Figure 2-2) and analyzed for general water quality parameters (Table 2-8) and CECs (Table 2-9). The results are discussed below. 3.3.1 General Water Quality Parameters Rejection results for general water quality parameters are shown in Tables 3-6, 3-7, and 3-8, for the primary NF system, secondary RO system, and overall NF/RO integrated system, respectively. As designed, the primary NF system achieved moderate overall TDS rejection (52.8%), a high degree of TOC rejection (87.3%), and varying degrees of rejection for specific constituents, ranging from - 7.5% for nitrate to 98.6% for sulfate. Negative nitrate rejection by NF membranes has been observed in previous studies and is related to ion mobility and the need to maintain pore and permeate electroneutrality during operation (Drewes et al., 2008; Yu et al., 2010). The highly mobile and negatively charged nitrate ion is forced to freely permeate through the membrane to balance the charge of less mobile but more concentrated cations. The secondary RO system achieved a high degree of rejection for TDS (98.5%), TOC (97.9%), as well as all other specific constituents. Blending RO permeate with NF permeate slightly improved the overall product water quality (see Blended Permeate, Table 3-8). The concentrations of those constituents in the blended permeate that have State of California Primary or Secondary MCLs (Maximum Contaminant Levels) were below their respective MCLs. Other blended permeate parameters of interest include total nitrogen, TOC, and UVT. Total nitrogen and TOC are of interest because each of these parameters is specifically addressed in the CDPH Draft Groundwater Recharge Reuse Regulations (DGRRR). UVT is of importance because it has a significant impact on the design and performance of UV/AOP, which is typically downstream of high-pressure membrane systems. For nitrogen control, the DGRRR require that a total nitrogen concentration of 10 mg/L be met for surface spreading projects such as GRIP. Although the NF/RO integrated system does not provide a significant barrier for nitrogen removal (14.3% total nitrogen rejection), application of this system for the proposed GRIP AWTP would still be feasible because the nitrification-denitrification activated sludge treatment process at the SJC West WRP typically produces effluent with total nitrogen concentration < 10 mg N/L. The TOC limit that needs to be met for surface spreading projects is equal to 0.5 mg/L divided by the recycled water contribution. This limit does not have to be met until after
34
infiltration, at the point where the recycled water meets the groundwater, thus receiving credit for removal that may occur within the vadose zone. Therefore, the acceptability of the blended permeate water quality will ultimately depend on (1) the approved recycled water contribution for the GRIP project and, (2) the expected degree of additional TOC removal within the vadose zone of the spreading basins. This analysis is beyond the scope of this project. The blended permeate UVT ranged from 95.7 - 97.4%, with an average of 96.8%. These results indicate that the blended permeate produced by the NF/RO integrated system would be suitable for treatment by UV/AOP since these systems are typically designed for a minimum UVT of 95% (Trojan Technologies, Inc., 2002).
3.3.2 Chemicals of Emerging Concern Rejection results for target CECs are shown in Tables 3-9, 3-10, and 3-11, for the primary NF system, secondary RO system, and overall NF/RO integrated system, respectively. Average rejection results for the primary NF and secondary RO systems are also shown in Figures 3-13 and 3-14, along with the molecular weights (MW) of the detected CECs. Of the 30 target CECs, 19 of them were detected in the feed stream to the primary NF system. The primary NF system achieved a high degree of rejection and/or rejection to below the respective reporting limits for all of the CECs, with the exception of NDMA (8.4%) and 1,4-dioxane (18.3%). The relatively poor rejection of NDMA and 1,4-dioxane is related to membrane rejection mechanisms as well as the physicochemical properties of the compounds. Based on a comprehensive literature review conducted by Bellona et al. (2004), the dominant rejection mechanisms for the removal of CECs by high-pressure membranes include: (1) size exclusion (i.e., removal of compounds with a MW greater than the molecular weight cutoff (MWCO) of the membrane); (2) electrostatic exclusion (i.e., removal of negatively charged compounds by electrostatic repulsion at the net negatively charged membrane surface); and (3) adsorption (i.e., adsorption of relatively hydrophobic compounds onto the membrane surface). Both NDMA and 1,4-dioxane are relatively small (MW NDMA = 74 g/mol, MW 1,4-dioxane = 88 g/mol), uncharged, and hydrophilic (i.e., log Kow < 2) compounds. Therefore, rejection by high-pressure membranes is due to size exclusion only. Since the reported MWCO of the NF-270 membrane used in the primary NF system is approximately 200 Daltons (Yu et al., 2010), poor rejection is expected. For the secondary RO system, 26 of the 30 target CECs were detected in the feed stream (NF concentrate). Seven of these CECs were not detected in the feed to the primary NF system, including acetaminophen, caffeine, estrone, 17ß - estradiol, furosemide, ibuprofen, and trimethoprim. This indicates that although these CECs were not detected in the NF feed, they were present and were concentrated by the NF-270 membrane. All of the detected CECs were rejected to a high degree and/or to below their respective reporting limits, with the exception of NDMA (39.8%). Poor NDMA rejection is
35
expected, however, since the reported MWCO of the TFC-HR membrane used in the secondary RO system is approximately 100 Daltons (Drewes et al., 2008). Rejection results for the overall NF/RO integrated system were essentially the same as the results for the primary NF system (Figure 3-15). These results illustrate that the permeate produced by the secondary RO system has a negligible effect on the overall product water quality. Eleven CECs were detected above their respective reporting limits in the blended permeate, including atenolol, azithromycin, carbamazepine, DEET, 1,4-dioxane, meprobamate, NDMA, primidone, phenytoin, sucralose, and TCEP. Currently, of these 11 CECs, only 1,4-dioxane and NDMA have regulatory limits. The CDPH Notification Levels for 1,4-dioxane and NDMA are 1 µg/L and 10 ng/L, respectively. The average 1,4-dioxane concentration of the blended permeate (0.9 µg/L) was lower than the 1 µg/L Notification Level. However, the Notification Level was not consistently met (concentrations ranged from 0.75 - 1.2 µg/L). NDMA levels were significantly higher than the 10 ng/L Notification Level, ranging from 110 - 260 ng/L, with an average of 176 ng/L. These results indicate that in order to reliably meet the Notification Levels for 1,4-dioxane and NDMA, downstream UV/AOP would be needed after the NF/RO integrated system. For the remaining CECs that were detected in the blended permeate, there are currently no regulatory levels. However, risk assessment studies have been conducted in which acceptable daily intakes (ADI) have been established for some of them (Snyder et al., 2008; Nellor et al., 2010). An ADI is commonly defined as the amount of chemical to which a person can be exposed to on a daily basis over an extended period of time, usually a lifetime, without suffering a deleterious effect. These ADI can be converted to drinking water equivalent levels (DWELs) by making assumptions about the daily water intake by a person. DWELs have been established for 7 of the CECs detected in the blended permeate including atenolol, carbamazepine, DEET, meprobamate, phenytoin, primidone, and TCEP. As shown in Table 3-12, the DWELs for these CECs are significantly higher than the maximum concentrations detected in the blended permeate. It should also be noted that, with the exception of TCEP, all of these CECs have been demonstrated to be efficiently removed by advanced oxidation processes. In addition, varying degrees of removal have been observed during soil aquifer treatment. Therefore, the detection of these CECs in the blended permeate may not be a concern with respect to causing deleterious health effects.
36
Table 3-6. Primary NF System Rejection Results for General Water Quality Parameters
Parameters Sample Location
Feed Permeate Concentrate Average % Rejection
Range Average1 Range Average1 Range Average TDS (mg/L) 529 - 565 545 236 - 286 257 1,900 - 2,200 2,077 52.8 pH (field) 6.0 - 6.6 6.3 5.7 - 6.2 5.9 6.3 - 6.6 6.5 -- Total Alkalinity (mg/L CaCO3) 75 - 77 76 42 - 52 47 181 - 219 200 38.2 Calcium (mg/L) 49 - 52 50 13 - 16 15 237 - 259 249 70.0 Chloride (mg/L) 99 - 109 103 91 - 98 95 121 - 179 154 7.8 Magnesium (mg/L) 13 - 14 14 3.4 - 4.1 3.7 68 - 75 73 73.6 Sulfate (mg/L) 146 - 183 159 1.5 - 3.6 2.3 904 - 1,110 989 98.6 Total Phosphate (mg/L PO4
3- ) 2.1 - 5.1 3.3 0.14 - 0.40 0.23 13 - 32 20 93.0 Silica (mg/L SiO2) 22 - 24 23 21 - 23 21 34 - 39 35 8.7 Barium (µg/L) 29 - 36 32 7.8 - 9.7 8.9 142 - 176 156 72.2 Strontium (µg/L) 333 - 351 339 88 - 115 99 1,610 - 1,760 1,690 70.8 Fluoride (mg/L) 0.75 - 0.79 0.78 0.47 - 0.58 0.53 2.0 - 2.5 2.2 32.1 Iron (mg/L) 0.026 - 0.060 0.040 < 0.020 < 0.020 0.16 - 0.22 0.19 ≥ 50.0 Aluminum (µg/L) < 10 - 12 11 < 10 < 10 33 - 77 52 ≥ 9.1 Potassium (mg/L) 14 14 9.0 - 10 9.5 38 - 41 39 32.1 Sodium (mg/L) 99 - 102 101 66 - 70 67 270 - 286 278 33.7 Nitrogen Nitrate (mg N/L) 5.6 - 9.2 6.7 5.8 - 9.7 7.2 3.5 - 6.0 4.2 - 7.5 Nitrite (mg N/L) < 0.03 < 0.03 < 0.03 < 0.03 < 0.03 < 0.03 -- Ammonia (mg N/L) 0.80 - 1.0 0.87 0.52 - 0.83 0.68 1.6 - 2.0 1.8 21.8 TKN (mg N/L) 1.2 - 2.3 1.7 0.23 - 1.6 1.0 5.1 - 7.1 5.8 41.2 Total Nitrogen (mg N/L) 7.5 - 11 8.4 7.1 - 11 8.2 8.8 - 11 10 2.4 TOC TOC (mg/L) 4.5 - 5.9 4.8 < 0.5 - 0.87 0.61 25 - 32 27 87.3 Transmittance UVT (%) -- -- 95.9 - 97.4 96.8 -- -- --
1. Average values calculated assuming reporting limit for results < reporting limit.
37
Table 3-7. Secondary RO System Rejection Results for General Water Quality Parameters
Parameters Sample Location
Feed Permeate Concentrate Average % Rejection
Range Average Range Average1 Range Average1 TDS (mg/L) 1,900 - 2,200 2,077 < 25 - 47 32 3,130 - 4,430 3,914 98.5 pH (field) 6.3 - 6.6 6.5 5.4 - 5.8 5.6 6.4 - 6.8 6.6 -- Total Alkalinity (mg/L CaCO3) 181 - 219 200 14 - 25 18 288 - 434 362 91.0 Calcium (mg/L) 237 - 259 249 0.24 - 0.98 0.51 364 - 505 458 99.8 Chloride (mg/L) 121 - 179 154 2.6 - 3.1 2.9 242 - 371 290 98.1 Magnesium (mg/L) 68 - 75 73 0.07 - 0.28 0.15 111 - 141 127 99.8 Sulfate (mg/L) 904 - 1,110 989 2.2 - 9.1 5.2 1,320 - 2,280 1,850 99.5 Total Phosphate (mg/L PO4
3- ) 13 - 32 20 < 0.10 - 0.27 0.16 26 - 49 38 99.2 Silica (mg/L SiO2) 34 - 39 35 0.58 - 1.2 0.81 51 - 77 64 97.7 Barium (µg/L) 142 - 176 156 < 0.50 - 0.57 0.52 228 - 357 291 99.7 Strontium (µg/L) 1,610 - 1,760 1,690 1.5 - 7.0 3.5 2,610 - 3,460 3,120 99.8 Fluoride (mg/L) 2.0 - 2.5 2.2 0.12 - 0.23 0.16 3.0 - 4.8 3.9 92.7 Iron (mg/L) 0.16 - 0.22 0.19 < 0.020 < 0.020 0.30 - 0.41 0.34 ≥ 89.5 Aluminum (µg/L) 33 - 77 52 < 10 < 10 49 - 135 94 ≥ 80.8 Potassium (mg/L) 38 - 41 39 1.1 - 2.6 1.6 63 - 82 75 95.9 Sodium (mg/L) 270 - 286 278 8.1 - 16 11 397 - 543 491 96.0 Nitrogen Nitrate (mg N/L) 3.5 - 6.0 4.2 0.26 - 0.53 0.36 5.0 - 12 7.9 91.4 Nitrite (mg N/L) < 0.03 < 0.03 < 0.03 < 0.03 < 0.03 - 0.04 0.03 -- Ammonia (mg N/L) 1.6 - 2.0 1.8 0.20 - 0.57 0.41 2.3 - 3.6 3.0 77.2 TKN (mg N/L) 5.1 - 7.1 5.8 0.40 - 0.84 0.52 7.7 - 13 11 91.0 Total Nitrogen (mg N/L) 8.8 - 11 10 0.65 - 1.3 0.87 13 - 23 19 91.3 TOC TOC (mg/L) 25 - 32 27 < 0.5 - 0.71 0.57 41 - 61 50 97.9 Transmittance UVT (%) -- -- 97.4 - 99.3 98.3 -- -- --
1. Average values calculated assuming reporting limit for results < reporting limit.
38
Table 3-8. Overall NF/RO Integrated System Rejection Results for General Water Quality Parameters
Parameters Sample Location
Feed Blended Permeate
Concentrate Average % Rejection
Range Average10 Range Average10 Range Average10 TDS1 (mg/L) 529 - 565 545 209 - 260 227 3,130 - 4,430 3,914 58.3 pH (field) 6.0 - 6.6 6.3 -- -- 6.4 - 6.8 6.6 -- Total Alkalinity (mg/L CaCO3) 75 - 77 76 37 - 48 43 288 - 434 362 43.4 Calcium (mg/L) 49 - 52 50 12 - 14 13 364 - 505 458 74.0 Chloride2 (mg/L) 99 - 109 103 77 - 87 82 242 - 371 290 20.4 Magnesium (mg/L) 13 - 14 14 3.0 - 3.5 3.2 111 - 141 127 77.1 Sulfate3 (mg/L) 146 - 183 159 2.6 - 4.7 3.6 1,320 - 2,280 1,850 97.7 Total Phosphate (mg/L PO4
3- ) 2.1 - 5.1 3.3 0.11 - 0.33 0.21 26 - 49 38 93.6 Silica (mg/L SiO2) 22 - 24 23 18 - 19 18 51 - 77 64 21.7 Barium4 (µg/L) 29 - 36 32 6.8 - 8.2 7.7 228 - 357 291 75.9 Strontium (µg/L) 333 - 351 339 79 - 96 85 2,610 - 3,460 3,120 74.9 Fluoride5 (mg/L) 0.75 - 0.79 0.78 0.43 - 0.57 0.49 3.0 - 4.8 3.9 37.2 Iron6 (mg/L) 0.026 - 0.060 0.040 < 0.020 < 0.020 0.30 - 0.41 0.34 ≥ 50.0 Aluminum7 (µg/L) < 10 - 12 11 < 10 < 10 49 - 135 94 ≥ 9.1 Potassium (mg/L) 14 14 8.2 - 8.9 8.5 63 - 82 75 39.3 Sodium (mg/L) 99 - 102 101 59 - 62 60 397 - 543 491 40.6 Nitrogen Nitrate8 (mg N/L) 5.6 - 9.2 6.7 4.7 - 8.0 6.2 5.0 - 12 7.9 7.5 Nitrite9 (mg N/L) < 0.03 < 0.03 < 0.03 < 0.03 < 0.03 - 0.04 0.03 -- Ammonia (mg N/L) 0.80 - 1.0 0.87 0.49 - 0.78 0.64 2.3 - 3.6 3.0 26.4 TKN (mg N/L) 1.2 - 2.3 1.7 0.24 - 1.5 0.96 7.7 - 13 11 43.5 Total Nitrogen (mg N/L) 7.5 - 11 8.4 6.0 - 8.8 7.2 13 - 23 19 14.3 TOC TOC (mg/L) 4.5 - 5.9 4.8 < 0.5 - 0.79 0.54 41 - 61 50 88.8 Transmittance UVT (%) -- -- 95.7 - 97.4 96.8 -- -- --
1. TDS: Secondary MCL = 500 mg/L recommended, 1,000 mg/L upper limit; 2. Chloride: Secondary MCL = 250 mg/L recommended, 500 mg/L upper limit; 3. Sulfate: Secondary MCL = 250 mg/L recommended, 500 mg/L upper limit; 4. Barium: Primary MCL = 1 mg/L; 5. Fluoride: Primary MCL = 2 mg/L; 6. Iron: Secondary MCL = 0.3 mg/L; 7. Aluminum: Primary MCL = 1 mg/L, Secondary MCL = 0.2 mg/L; 8. Nitrate: Primary MCL = 10 mg N/L; 9. Nitrite: Primary MCL = 1 mg N/L; 10. Average values calculated assuming reporting limit for results < reporting limit.
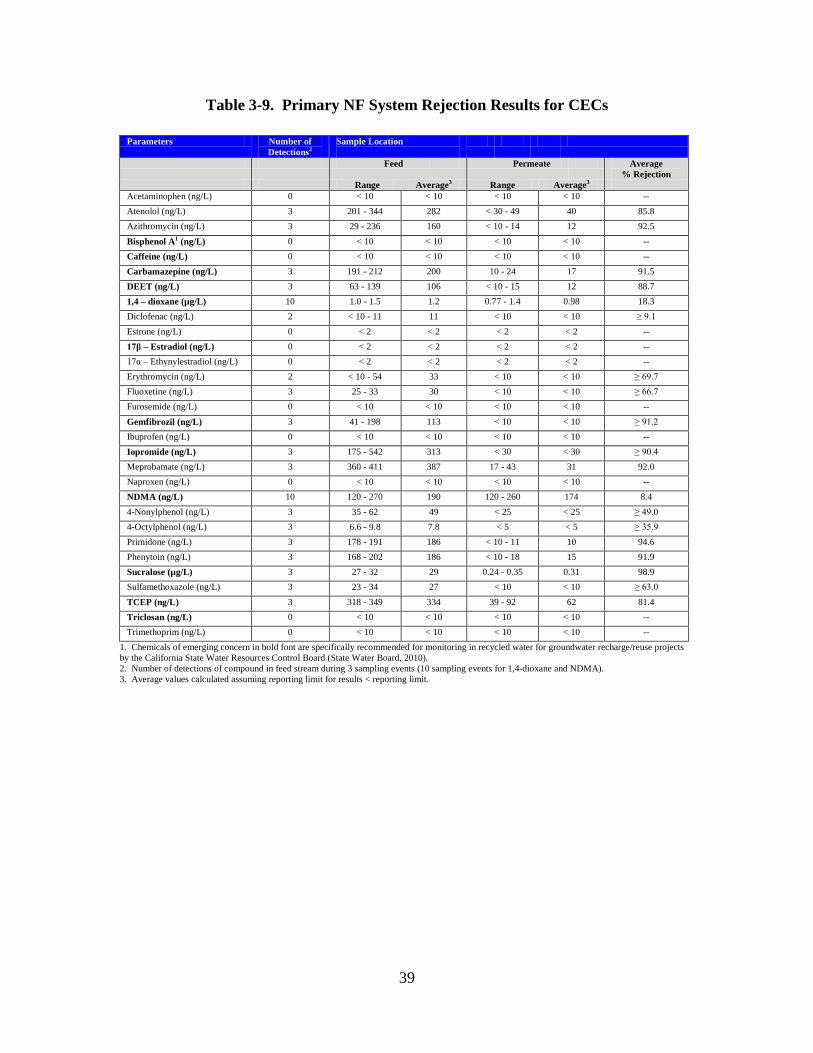
39
Table 3-9. Primary NF System Rejection Results for CECs
Parameters Number of Detections2
Sample Location
Feed Permeate Average % Rejection
Range Average3 Range Average3 Acetaminophen (ng/L) 0 < 10 < 10 < 10 < 10 -- Atenolol (ng/L) 3 201 - 344 282 < 30 - 49 40 85.8 Azithromycin (ng/L) 3 29 - 236 160 < 10 - 14 12 92.5
Bisphenol A1 (ng/L) 0 < 10 < 10 < 10 < 10 -- Caffeine (ng/L) 0 < 10 < 10 < 10 < 10 -- Carbamazepine (ng/L) 3 191 - 212 200 10 - 24 17 91.5 DEET (ng/L) 3 63 - 139 106 < 10 - 15 12 88.7 1,4 – dioxane (µg/L) 10 1.0 - 1.5 1.2 0.77 - 1.4 0.98 18.3 Diclofenac (ng/L) 2 < 10 - 11 11 < 10 < 10 ≥ 9.1 Estrone (ng/L) 0 < 2 < 2 < 2 < 2 -- 17β – Estradiol (ng/L) 0 < 2 < 2 < 2 < 2 -- 17α – Ethynylestradiol (ng/L) 0 < 2 < 2 < 2 < 2 -- Erythromycin (ng/L) 2 < 10 - 54 33 < 10 < 10 ≥ 69.7 Fluoxetine (ng/L) 3 25 - 33 30 < 10 < 10 ≥ 66.7 Furosemide (ng/L) 0 < 10 < 10 < 10 < 10 --
Gemfibrozil (ng/L) 3 41 - 198 113 < 10 < 10 ≥ 91.2 Ibuprofen (ng/L) 0 < 10 < 10 < 10 < 10 -- Iopromide (ng/L) 3 175 - 542 313 < 30 < 30 ≥ 90.4 Meprobamate (ng/L) 3 360 - 411 387 17 - 43 31 92.0 Naproxen (ng/L) 0 < 10 < 10 < 10 < 10 -- NDMA (ng/L) 10 120 - 270 190 120 - 260 174 8.4 4-Nonylphenol (ng/L) 3 35 - 62 49 < 25 < 25 ≥ 49.0 4-Octylphenol (ng/L) 3 6.6 - 9.8 7.8 < 5 < 5 ≥ 35.9 Primidone (ng/L) 3 178 - 191 186 < 10 - 11 10 94.6 Phenytoin (ng/L) 3 168 - 202 186 < 10 - 18 15 91.9 Sucralose (µg/L) 3 27 - 32 29 0.24 - 0.35 0.31 98.9 Sulfamethoxazole (ng/L) 3 23 - 34 27 < 10 < 10 ≥ 63.0
TCEP (ng/L) 3 318 - 349 334 39 - 92 62 81.4 Triclosan (ng/L) 0 < 10 < 10 < 10 < 10 -- Trimethoprim (ng/L) 0 < 10 < 10 < 10 < 10 --
1. Chemicals of emerging concern in bold font are specifically recommended for monitoring in recycled water for groundwater recharge/reuse projects by the California State Water Resources Control Board (State Water Board, 2010). 2. Number of detections of compound in feed stream during 3 sampling events (10 sampling events for 1,4-dioxane and NDMA). 3. Average values calculated assuming reporting limit for results < reporting limit.
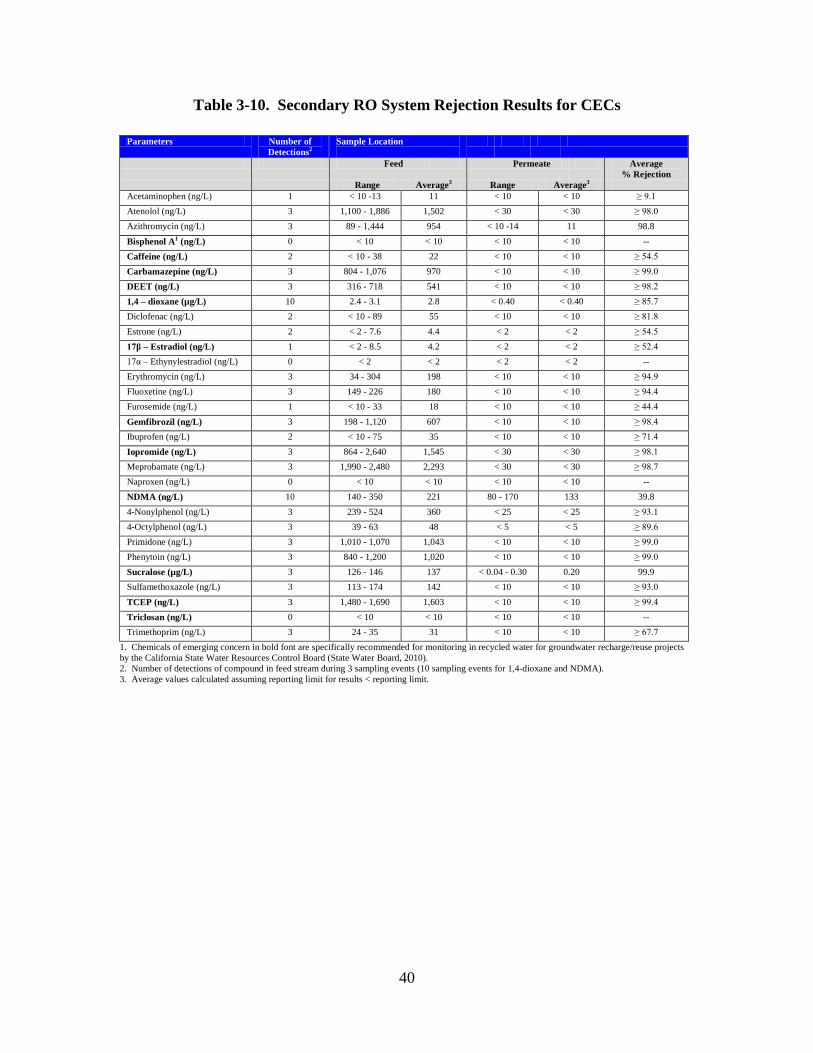
40
Table 3-10. Secondary RO System Rejection Results for CECs
Parameters Number of Detections2
Sample Location
Feed Permeate Average % Rejection
Range Average3 Range Average3 Acetaminophen (ng/L) 1 < 10 -13 11 < 10 < 10 ≥ 9.1 Atenolol (ng/L) 3 1,100 - 1,886 1,502 < 30 < 30 ≥ 98.0 Azithromycin (ng/L) 3 89 - 1,444 954 < 10 -14 11 98.8
Bisphenol A1 (ng/L) 0 < 10 < 10 < 10 < 10 -- Caffeine (ng/L) 2 < 10 - 38 22 < 10 < 10 ≥ 54.5 Carbamazepine (ng/L) 3 804 - 1,076 970 < 10 < 10 ≥ 99.0 DEET (ng/L) 3 316 - 718 541 < 10 < 10 ≥ 98.2 1,4 – dioxane (µg/L) 10 2.4 - 3.1 2.8 < 0.40 < 0.40 ≥ 85.7 Diclofenac (ng/L) 2 < 10 - 89 55 < 10 < 10 ≥ 81.8 Estrone (ng/L) 2 < 2 - 7.6 4.4 < 2 < 2 ≥ 54.5 17β – Estradiol (ng/L) 1 < 2 - 8.5 4.2 < 2 < 2 ≥ 52.4 17α – Ethynylestradiol (ng/L) 0 < 2 < 2 < 2 < 2 -- Erythromycin (ng/L) 3 34 - 304 198 < 10 < 10 ≥ 94.9 Fluoxetine (ng/L) 3 149 - 226 180 < 10 < 10 ≥ 94.4 Furosemide (ng/L) 1 < 10 - 33 18 < 10 < 10 ≥ 44.4
Gemfibrozil (ng/L) 3 198 - 1,120 607 < 10 < 10 ≥ 98.4 Ibuprofen (ng/L) 2 < 10 - 75 35 < 10 < 10 ≥ 71.4 Iopromide (ng/L) 3 864 - 2,640 1,545 < 30 < 30 ≥ 98.1 Meprobamate (ng/L) 3 1,990 - 2,480 2,293 < 30 < 30 ≥ 98.7 Naproxen (ng/L) 0 < 10 < 10 < 10 < 10 -- NDMA (ng/L) 10 140 - 350 221 80 - 170 133 39.8 4-Nonylphenol (ng/L) 3 239 - 524 360 < 25 < 25 ≥ 93.1 4-Octylphenol (ng/L) 3 39 - 63 48 < 5 < 5 ≥ 89.6 Primidone (ng/L) 3 1,010 - 1,070 1,043 < 10 < 10 ≥ 99.0 Phenytoin (ng/L) 3 840 - 1,200 1,020 < 10 < 10 ≥ 99.0 Sucralose (µg/L) 3 126 - 146 137 < 0.04 - 0.30 0.20 99.9 Sulfamethoxazole (ng/L) 3 113 - 174 142 < 10 < 10 ≥ 93.0
TCEP (ng/L) 3 1,480 - 1,690 1,603 < 10 < 10 ≥ 99.4 Triclosan (ng/L) 0 < 10 < 10 < 10 < 10 -- Trimethoprim (ng/L) 3 24 - 35 31 < 10 < 10 ≥ 67.7
1. Chemicals of emerging concern in bold font are specifically recommended for monitoring in recycled water for groundwater recharge/reuse projects by the California State Water Resources Control Board (State Water Board, 2010). 2. Number of detections of compound in feed stream during 3 sampling events (10 sampling events for 1,4-dioxane and NDMA). 3. Average values calculated assuming reporting limit for results < reporting limit.
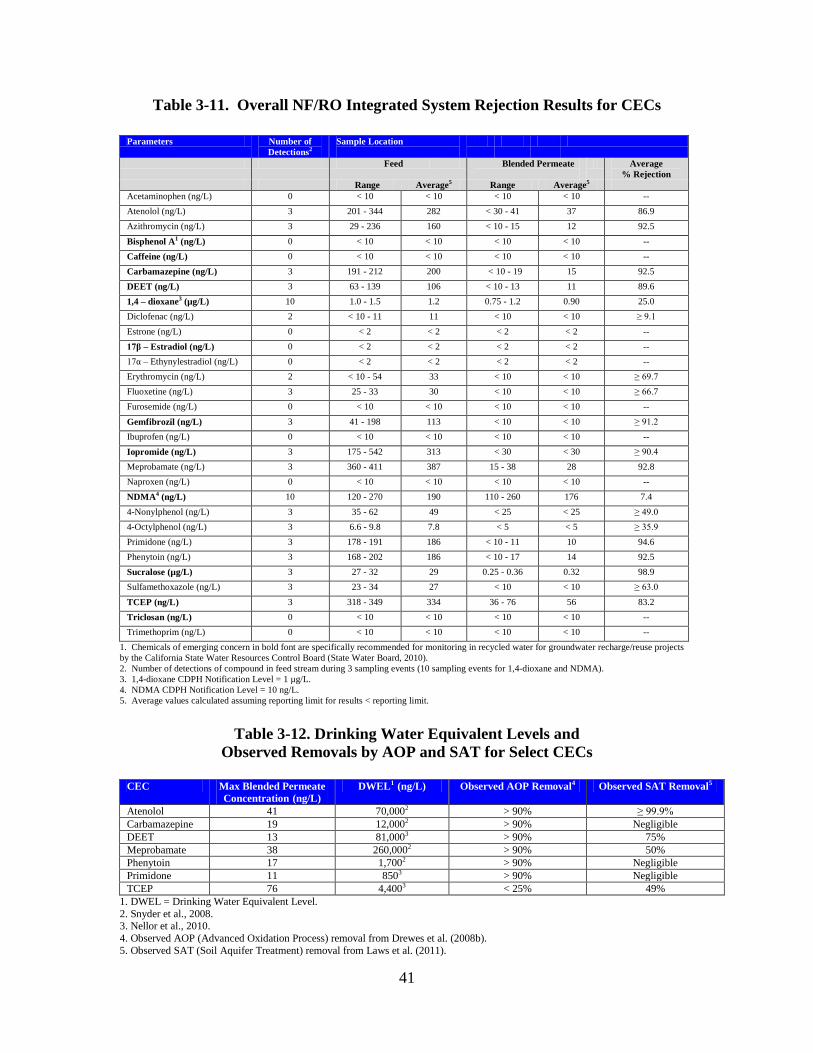
41
Table 3-11. Overall NF/RO Integrated System Rejection Results for CECs
Parameters Number of Detections2
Sample Location
Feed Blended Permeate
Average % Rejection
Range Average5 Range Average5 Acetaminophen (ng/L) 0 < 10 < 10 < 10 < 10 -- Atenolol (ng/L) 3 201 - 344 282 < 30 - 41 37 86.9 Azithromycin (ng/L) 3 29 - 236 160 < 10 - 15 12 92.5
Bisphenol A1 (ng/L) 0 < 10 < 10 < 10 < 10 -- Caffeine (ng/L) 0 < 10 < 10 < 10 < 10 -- Carbamazepine (ng/L) 3 191 - 212 200 < 10 - 19 15 92.5 DEET (ng/L) 3 63 - 139 106 < 10 - 13 11 89.6 1,4 – dioxane3 (µg/L) 10 1.0 - 1.5 1.2 0.75 - 1.2 0.90 25.0 Diclofenac (ng/L) 2 < 10 - 11 11 < 10 < 10 ≥ 9.1 Estrone (ng/L) 0 < 2 < 2 < 2 < 2 -- 17β – Estradiol (ng/L) 0 < 2 < 2 < 2 < 2 -- 17α – Ethynylestradiol (ng/L) 0 < 2 < 2 < 2 < 2 -- Erythromycin (ng/L) 2 < 10 - 54 33 < 10 < 10 ≥ 69.7 Fluoxetine (ng/L) 3 25 - 33 30 < 10 < 10 ≥ 66.7 Furosemide (ng/L) 0 < 10 < 10 < 10 < 10 --
Gemfibrozil (ng/L) 3 41 - 198 113 < 10 < 10 ≥ 91.2 Ibuprofen (ng/L) 0 < 10 < 10 < 10 < 10 -- Iopromide (ng/L) 3 175 - 542 313 < 30 < 30 ≥ 90.4 Meprobamate (ng/L) 3 360 - 411 387 15 - 38 28 92.8 Naproxen (ng/L) 0 < 10 < 10 < 10 < 10 -- NDMA4 (ng/L) 10 120 - 270 190 110 - 260 176 7.4 4-Nonylphenol (ng/L) 3 35 - 62 49 < 25 < 25 ≥ 49.0 4-Octylphenol (ng/L) 3 6.6 - 9.8 7.8 < 5 < 5 ≥ 35.9 Primidone (ng/L) 3 178 - 191 186 < 10 - 11 10 94.6 Phenytoin (ng/L) 3 168 - 202 186 < 10 - 17 14 92.5 Sucralose (µg/L) 3 27 - 32 29 0.25 - 0.36 0.32 98.9 Sulfamethoxazole (ng/L) 3 23 - 34 27 < 10 < 10 ≥ 63.0
TCEP (ng/L) 3 318 - 349 334 36 - 76 56 83.2 Triclosan (ng/L) 0 < 10 < 10 < 10 < 10 -- Trimethoprim (ng/L) 0 < 10 < 10 < 10 < 10 --
1. Chemicals of emerging concern in bold font are specifically recommended for monitoring in recycled water for groundwater recharge/reuse projects by the California State Water Resources Control Board (State Water Board, 2010). 2. Number of detections of compound in feed stream during 3 sampling events (10 sampling events for 1,4-dioxane and NDMA). 3. 1,4-dioxane CDPH Notification Level = 1 µg/L. 4. NDMA CDPH Notification Level = 10 ng/L. 5. Average values calculated assuming reporting limit for results < reporting limit.
Table 3-12. Drinking Water Equivalent Levels and
Observed Removals by AOP and SAT for Select CECs
CEC Max Blended Permeate Concentration (ng/L)
DWEL1 (ng/L) Observed AOP Removal4 Observed SAT Removal5
Atenolol 41 70,0002 > 90% ≥ 99.9% Carbamazepine 19 12,0002 > 90% Negligible DEET 13 81,0003 > 90% 75% Meprobamate 38 260,0002 > 90% 50% Phenytoin 17 1,7002 > 90% Negligible Primidone 11 8503 > 90% Negligible TCEP 76 4,4003 < 25% 49%
1. DWEL = Drinking Water Equivalent Level. 2. Snyder et al., 2008. 3. Nellor et al., 2010. 4. Observed AOP (Advanced Oxidation Process) removal from Drewes et al. (2008b). 5. Observed SAT (Soil Aquifer Treatment) removal from Laws et al. (2011).
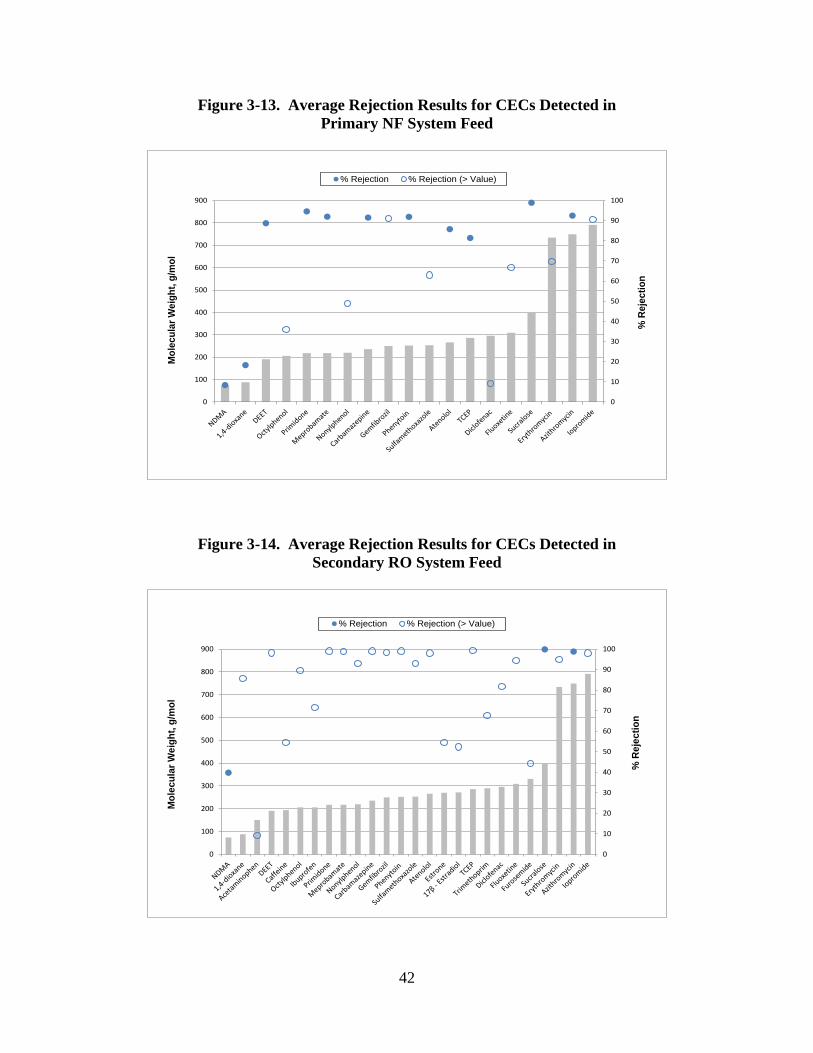
42
Figure 3-13. Average Rejection Results for CECs Detected in Primary NF System Feed
0
10
20
30
40
50
60
70
80
90
100
0
100
200
300
400
500
600
700
800
900
% R
ejec
tion
Mol
ecul
ar W
eigh
t, g/
mol
% Rejection % Rejection (> Value)
Figure 3-14. Average Rejection Results for CECs Detected in Secondary RO System Feed
0
10
20
30
40
50
60
70
80
90
100
0
100
200
300
400
500
600
700
800
900
% R
ejec
tion
Mol
ecul
ar W
eigh
t, g/
mol
% Rejection % Rejection (> Value)
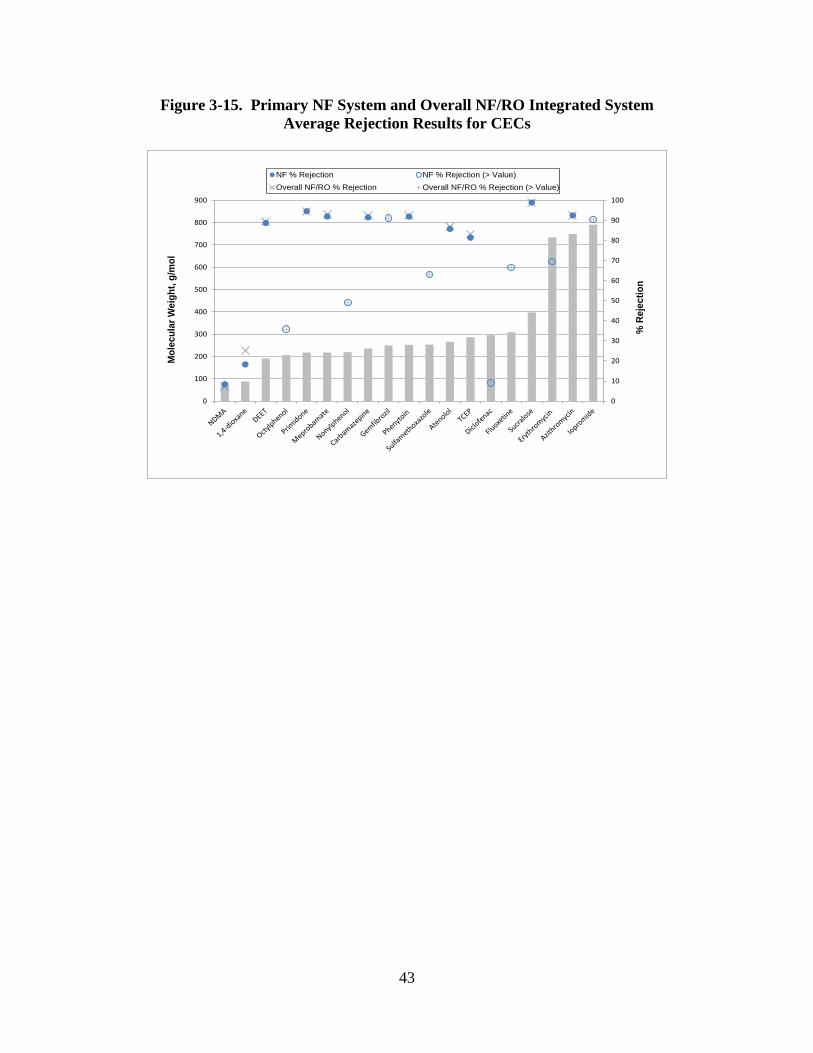
43
Figure 3-15. Primary NF System and Overall NF/RO Integrated System Average Rejection Results for CECs
0
10
20
30
40
50
60
70
80
90
100
0
100
200
300
400
500
600
700
800
900
% R
ejec
tion
Mol
ecul
ar W
eigh
t, g/
mol
NF % Rejection NF % Rejection (> Value)Overall NF/RO % Rejection Overall NF/RO % Rejection (> Value)
44
4. Summary and Conclusions Key findings of this study are summarized below. Operational Performance The NF/RO integrated system was operated for over 3,000 hours in two distinct phases, with the major difference being the antiscalant product used for membrane scale control. During Phase One, the antiscalant product employed was SpectraGuard (Professional Water Technologies). This product was not effective for scale control and relatively significant membrane fouling was observed in both the primary NF and secondary RO systems. During Phase Two, the antiscalant was changed to Y2K (King Lee Technologies). This antiscalant product was effective for controlling membrane scale formation. The pilot system was operated for approximately 3 months (~ 2,000 hours), with significantly less fouling compared to Phase One operation. Over the 3-month operating period, the normalized specific flux for the primary NF and secondary RO systems decreased 16% and 28%, respectively. Membrane Autopsy At the conclusion of testing, sample NF and RO membrane elements were sent to Avista Technologies for autopsy analyses to (1) compare the performance of the elements to manufacturer specifications for new membrane elements, and (2) characterize the foulant material on the membrane surface. The results of the autopsy analyses confirmed the operational performance results and indicated that significant membrane fouling in general, and scaling in particular, did not occur during Phase Two operation. Membrane fouling was identified to be primarily organic in nature. However, biofouling, colloidal, as well as inorganic fouling were also identified. Rejection Performance The NF/RO integrated system achieved a high degree of rejection for some of the constituents that are relevant for indirect potable reuse projects including TOC (89%) and select CECs. Of 30 target CECs, 19 were detected in the feed stream to the system. Most of the detected CECs were rejected to a high degree (> 80%) and/or to below their respective reporting limits. Significantly lower rejection was achieved for total nitrogen (14%), NDMA (7%), and 1,4-dioxane (25%). Despite the low rejection for these constituents, application of the NF/RO integrated system for the GRIP project would still be feasible because (1) nitrogen removal could be achieved by the existing nitrification-denitrification activated sludge treatment process at the SJC West WRP, and (2) NDMA and 1,4-dioxane could be removed to below regulatory limits by downstream UV/AOP. The results from this study demonstrated that the NF/RO integrated treatment system concept is a viable alternative to a standard RO system and can potentially be employed for the GRIP project. The main advantages of this system, that were demonstrated during

45
this study, include the following: (1) the ability to operate at an overall recovery of approximately 93%, which would reduce the volume of concentrate that needs to be disposed of; (2) the ability to achieve a high degree of rejection for many of the constituents that are relevant for indirect potable reuse projects including TOC and select CECs. A potential additional advantage is that the product water produced by the integrated system would have a higher TDS concentration, when compared to that produced by RO systems, and would thus be less corrosive. This would lead to a reduction in costs associated with post treatment stabilization processes that are typically employed with RO systems.
46
References Bellona, C., Drewes, J.E., Xu, P., Amy, G. (2004). Factors Affecting the Rejection of Organic Solutes During NF-RO Treatment - A literature Review. Water Research, 38, 2795-2809. Drewes, J.E., Bellona, C., Xu, P., Amy, G., Filteau, G., Oelker, G. (2008). Comparing Nanofiltration to Reverse Osmosis for Treating Recycled Water. AwwaRF Project Number 3012 Final Report. Drewes, J.E., Sedlak, D., Snyder, S., Dickenson, E. (2008). Development of Indicators and Surrogates fro Chemical Contaminant Removal during Wastewater Treatment and Reclamation. WateReuse Foundation Project Number WRF-03-014 Final Report. Laws, B.V., Dickenson, E.R.V., Johnson, T.A., Snyder, S., Drewes, J.E. (2011). Attenuation of Contaminants of Emerging Concern During Surface-Spreading Aquifer Recharge. Science of the Total Environment, 409, 1087-1094. Ly, P., Johnson, T., (2011) 75 Consecutive Weeks of Groundwater Sampling for Total Organic Carbon at the Montebello Forebay Spreading Grounds, Los Angeles County, California, WateReuse Annual Conference, Dana Point, CA, March 20 - 22. Mansell, B., Ackman, P., Tang, C.-C., Friess, P., Fu, P. (2011) Pilot-Scale Testing of a High Recovery NF/RO Integrated Treatment System for Indirect Potable Reuse, WEFTEC 2011, Los Angeles, CA, October 15 - 19. Nellor, M.H., Soller, J., Bruce, G.M., Pleus, R.C., Peterson, M.K. (2010). Development and Application of Tools to Assess and Understand the Relative Risks of Drugs and Other Chemicals in Indirect Potable Reuse Water. WateReuse Foundation Project Number WRF-06-018 Final Report. Nelson, E.D., Do, H., Lewis, R.S., Carr, S.A., (2011) Diurnal Variability of Pharmaceutical, Personal Care Product, Estrogen, and Alkylphenol Concentrations in Effluent from a Tertiary Wastewater Treatment Facility, Environ. Sci. Technol., 45 (4), 1228- 1234. Nowack, B. (2003). Review - Environmental Chemistry of Phosphonates. Water Research, 37, 2533 - 2546. Snyder, S.A., Snyder, E.M., Bruce, G.M., Bennett, E., Pleus, R.C., Hemming, J.D.C. (2008). Toxicological Relevance of EDCs and Pharmaceuticals in Drinking Water. AwwaRF Project Number 3085 Final Report. State Water Board (2010) Final Report – Monitoring Strategies for Chemicals of Emerging Concern (CECs) in Recycled Water, Recommendations of a Science Advisory Panel.
47
Trojan Technologies Inc. (2002), System Sizing Report for the Orange County Groundwater Replenishment System, February 27, 2002. Yu, C.H., Drewes, J.E., Bellona, C., Fu, P.L.K, (2010). Maximizing Recovery of Recycled Water for Groundwater Recharge Employing an Integrated Membrane System. WateReuse Foundation Project Number WRF-08-010 Final Report.
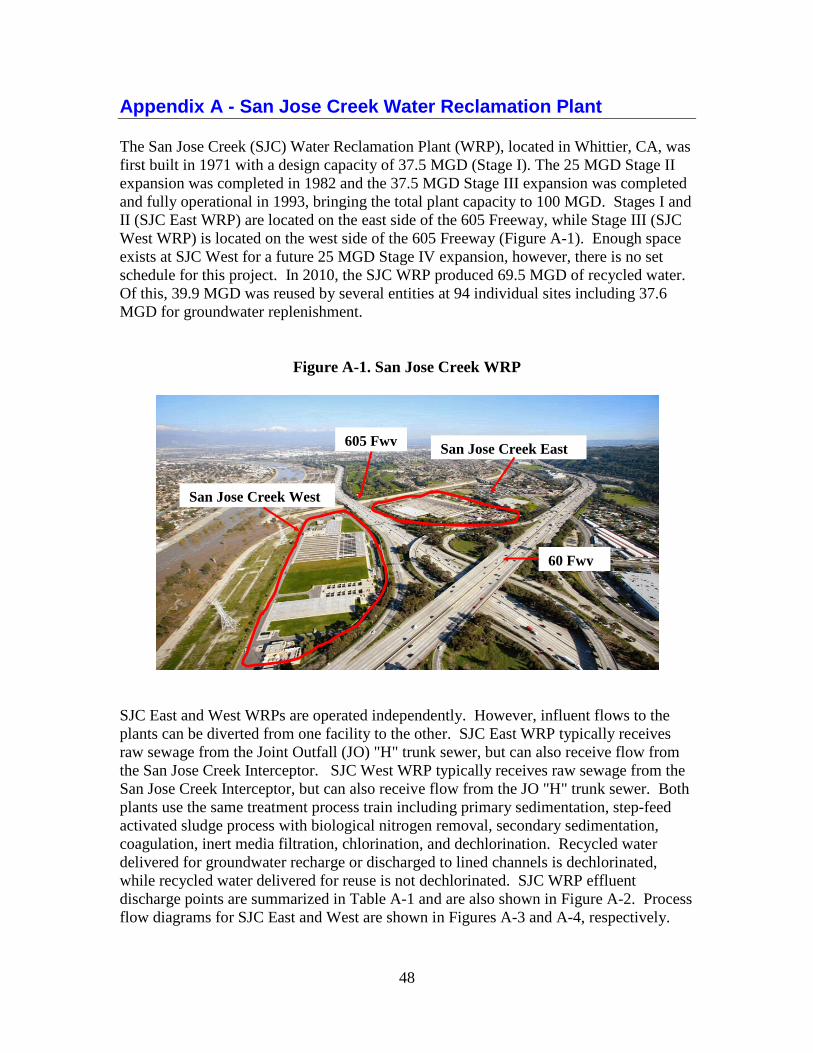
48
Appendix A - San Jose Creek Water Reclamation Plant The San Jose Creek (SJC) Water Reclamation Plant (WRP), located in Whittier, CA, was first built in 1971 with a design capacity of 37.5 MGD (Stage I). The 25 MGD Stage II expansion was completed in 1982 and the 37.5 MGD Stage III expansion was completed and fully operational in 1993, bringing the total plant capacity to 100 MGD. Stages I and II (SJC East WRP) are located on the east side of the 605 Freeway, while Stage III (SJC West WRP) is located on the west side of the 605 Freeway (Figure A-1). Enough space exists at SJC West for a future 25 MGD Stage IV expansion, however, there is no set schedule for this project. In 2010, the SJC WRP produced 69.5 MGD of recycled water. Of this, 39.9 MGD was reused by several entities at 94 individual sites including 37.6 MGD for groundwater replenishment.
Figure A-1. San Jose Creek WRP
SJC East and West WRPs are operated independently. However, influent flows to the plants can be diverted from one facility to the other. SJC East WRP typically receives raw sewage from the Joint Outfall (JO) "H" trunk sewer, but can also receive flow from the San Jose Creek Interceptor. SJC West WRP typically receives raw sewage from the San Jose Creek Interceptor, but can also receive flow from the JO "H" trunk sewer. Both plants use the same treatment process train including primary sedimentation, step-feed activated sludge process with biological nitrogen removal, secondary sedimentation, coagulation, inert media filtration, chlorination, and dechlorination. Recycled water delivered for groundwater recharge or discharged to lined channels is dechlorinated, while recycled water delivered for reuse is not dechlorinated. SJC WRP effluent discharge points are summarized in Table A-1 and are also shown in Figure A-2. Process flow diagrams for SJC East and West are shown in Figures A-3 and A-4, respectively.
San Jose Creek West
San Jose Creek East 605 Fwy
60 Fwy
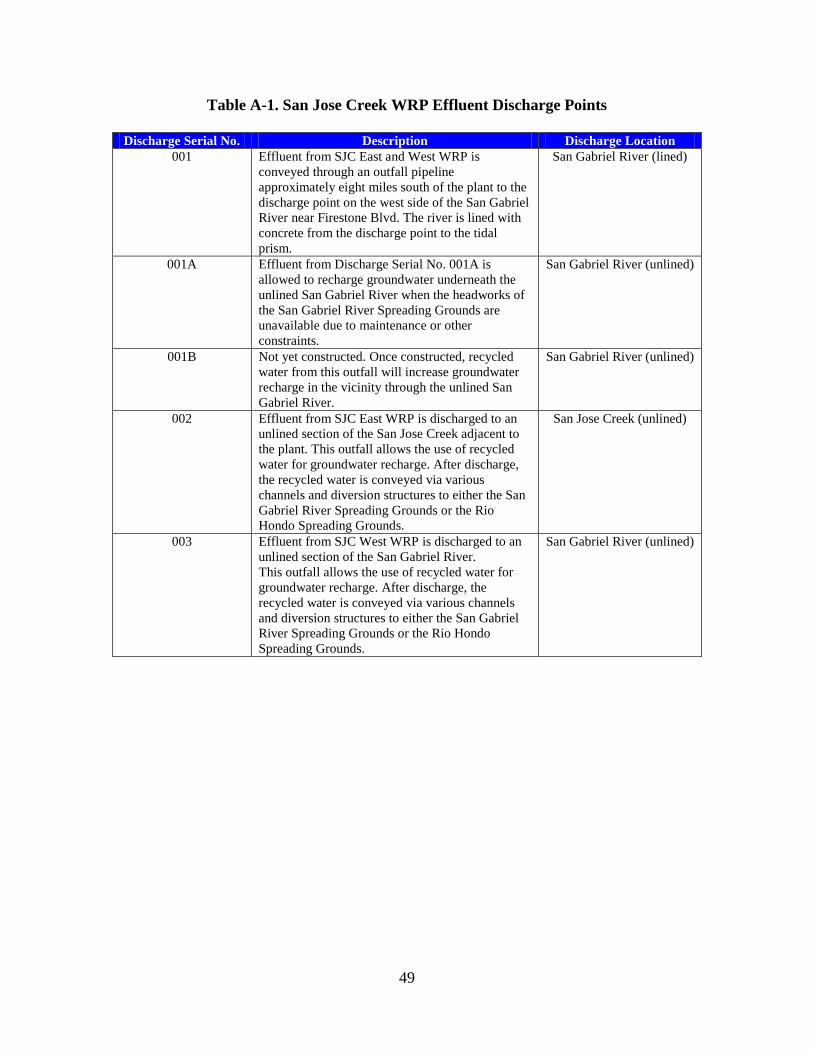
49
Table A-1. San Jose Creek WRP Effluent Discharge Points Discharge Serial No. Description Discharge Location
001 Effluent from SJC East and West WRP is conveyed through an outfall pipeline approximately eight miles south of the plant to the discharge point on the west side of the San Gabriel River near Firestone Blvd. The river is lined with concrete from the discharge point to the tidal prism.
San Gabriel River (lined)
001A Effluent from Discharge Serial No. 001A is allowed to recharge groundwater underneath the unlined San Gabriel River when the headworks of the San Gabriel River Spreading Grounds are unavailable due to maintenance or other constraints.
San Gabriel River (unlined)
001B Not yet constructed. Once constructed, recycled water from this outfall will increase groundwater recharge in the vicinity through the unlined San Gabriel River.
San Gabriel River (unlined)
002 Effluent from SJC East WRP is discharged to an unlined section of the San Jose Creek adjacent to the plant. This outfall allows the use of recycled water for groundwater recharge. After discharge, the recycled water is conveyed via various channels and diversion structures to either the San Gabriel River Spreading Grounds or the Rio Hondo Spreading Grounds.
San Jose Creek (unlined)
003 Effluent from SJC West WRP is discharged to an unlined section of the San Gabriel River. This outfall allows the use of recycled water for groundwater recharge. After discharge, the recycled water is conveyed via various channels and diversion structures to either the San Gabriel River Spreading Grounds or the Rio Hondo Spreading Grounds.
San Gabriel River (unlined)
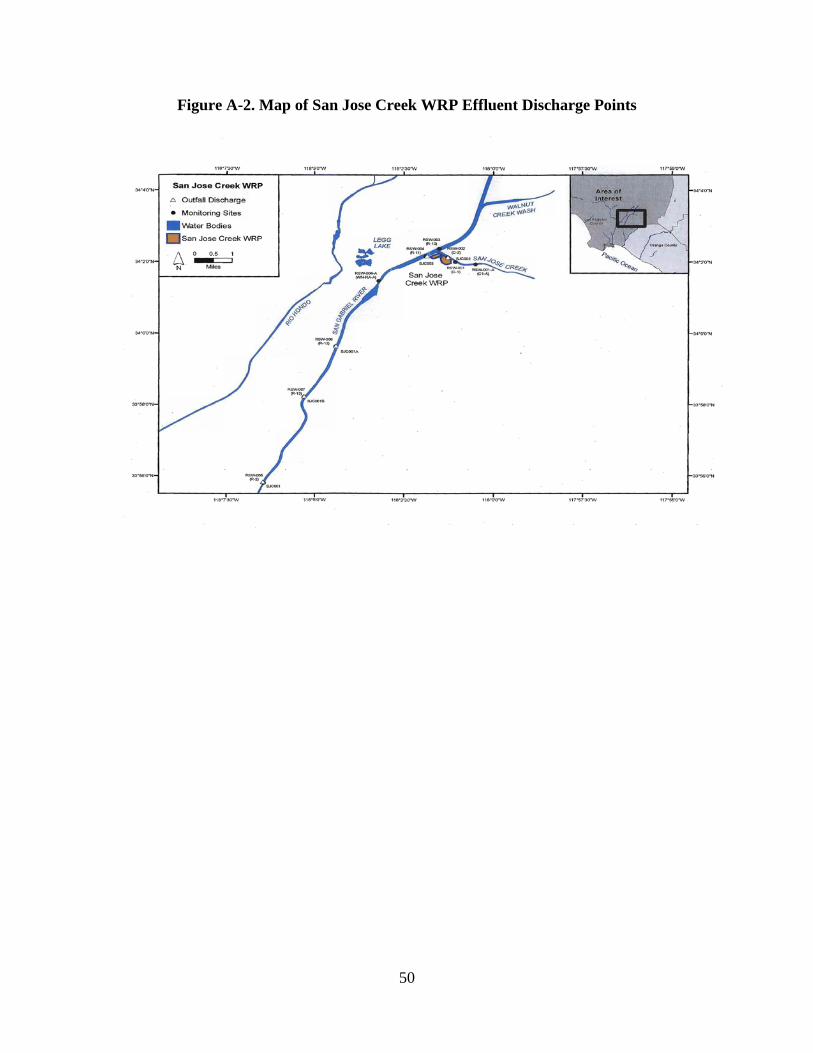
50
Figure A-2. Map of San Jose Creek WRP Effluent Discharge Points
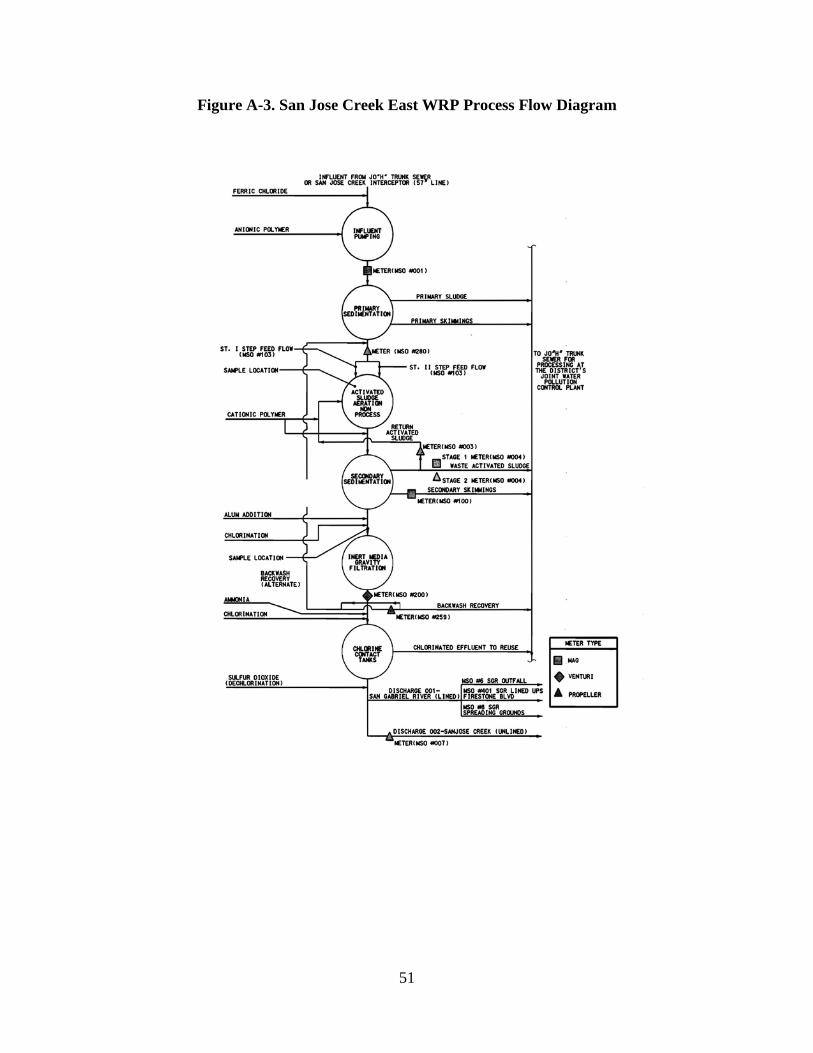
51
Figure A-3. San Jose Creek East WRP Process Flow Diagram
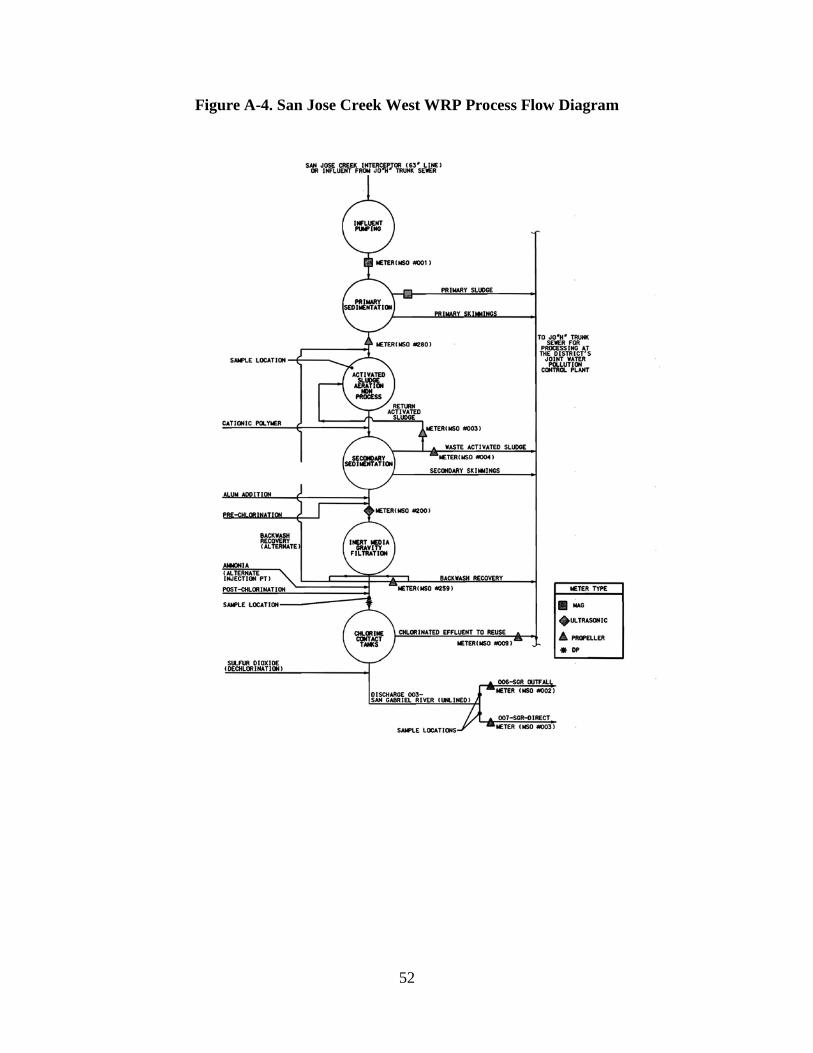
52
Figure A-4. San Jose Creek West WRP Process Flow Diagram
53
Appendix B – Dow Ultrafiltration System Presentation

54
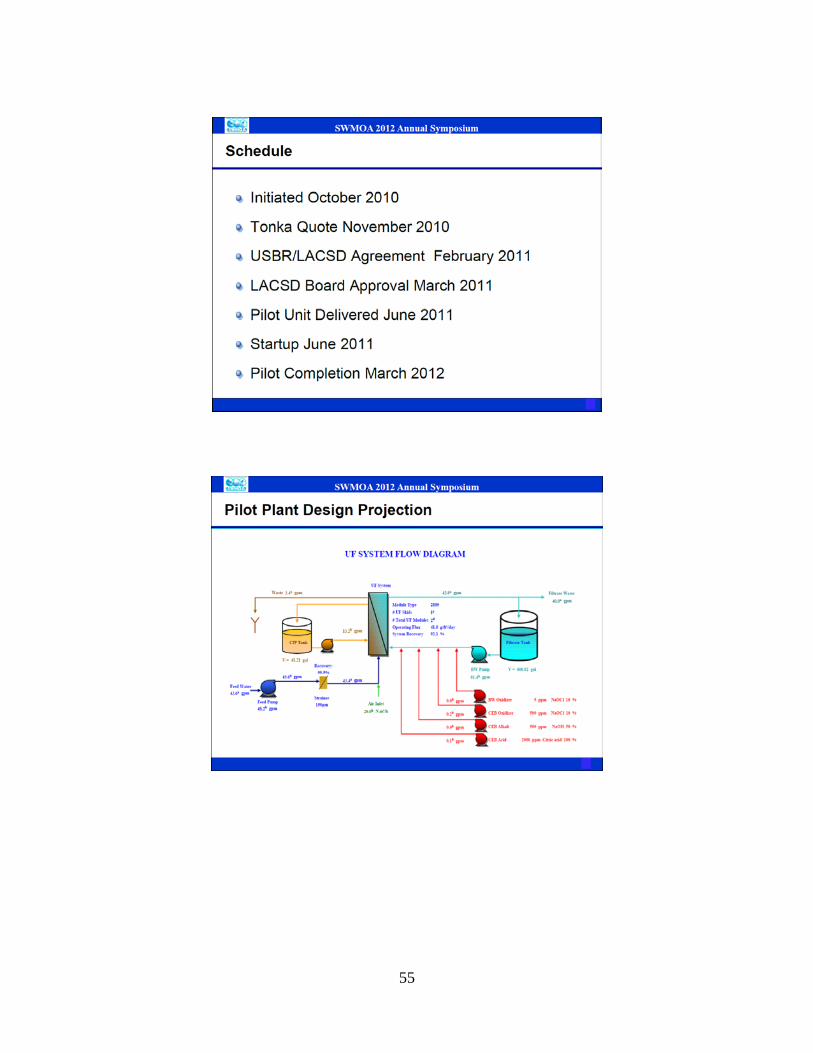
55
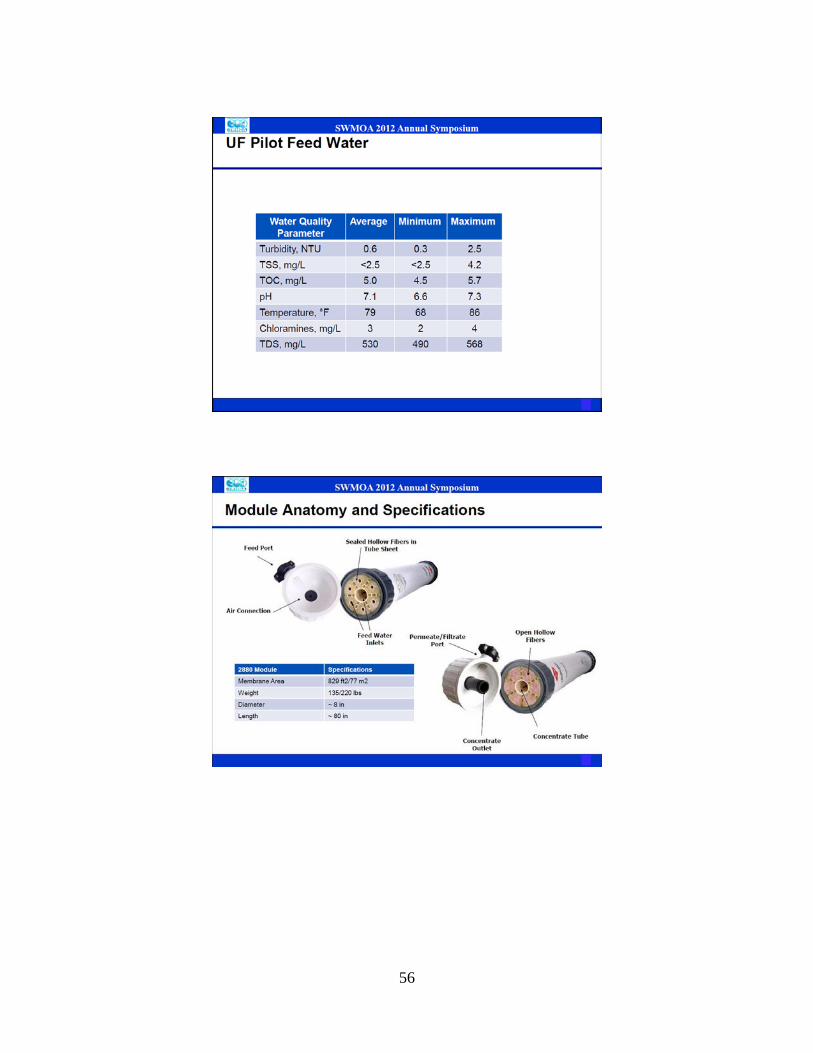
56
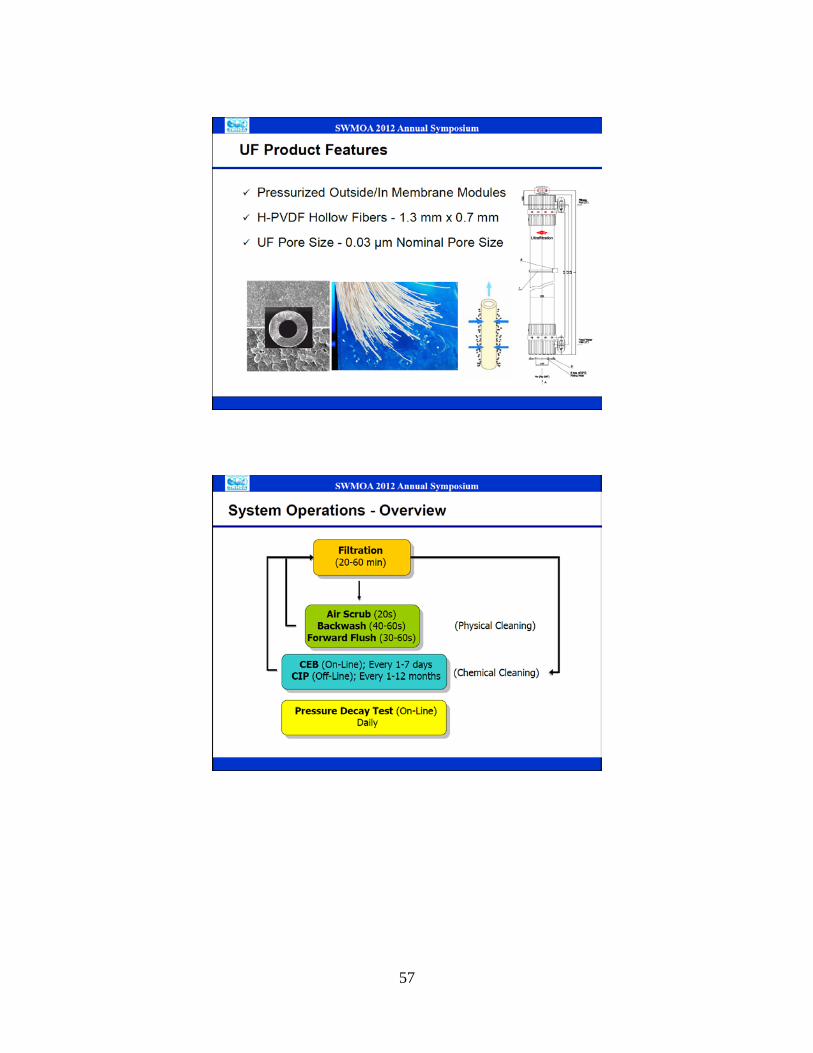
57
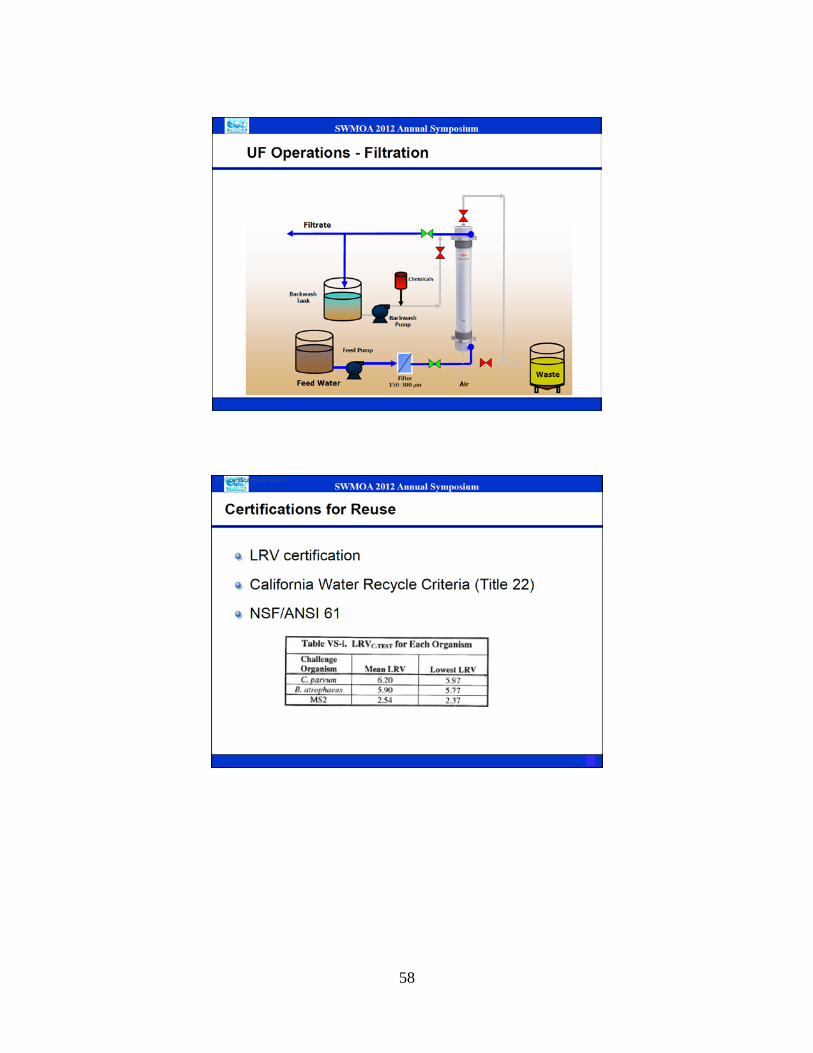
58
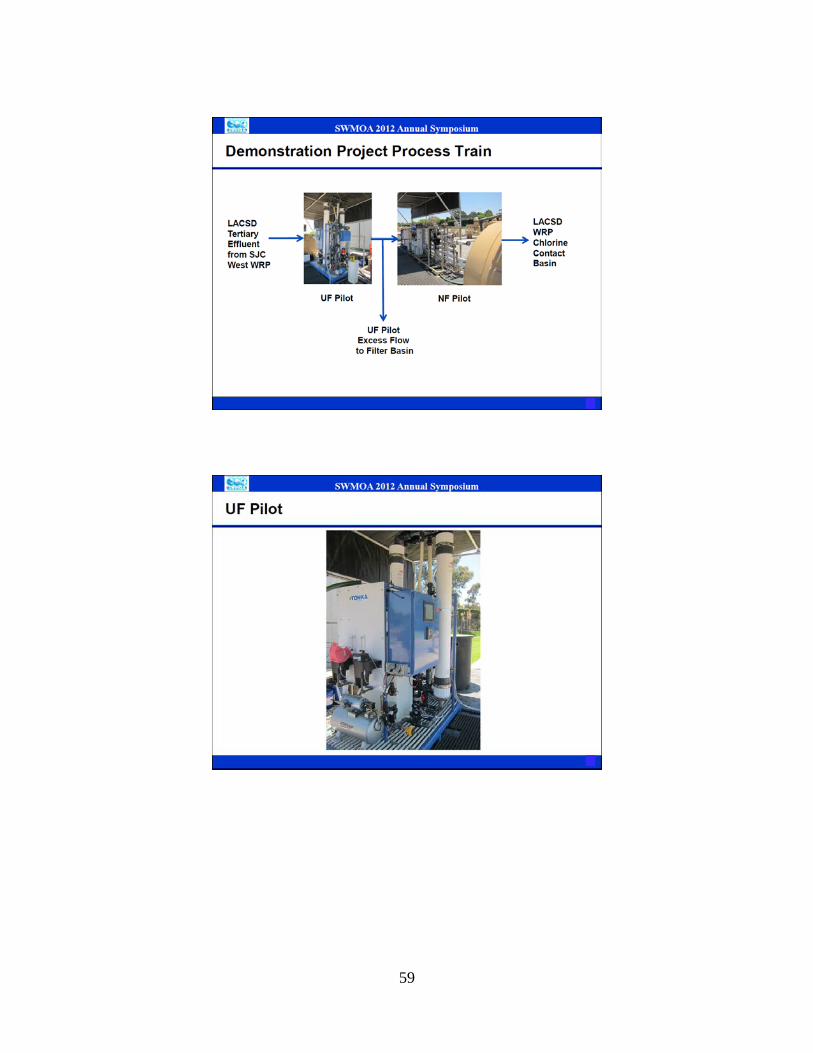
59
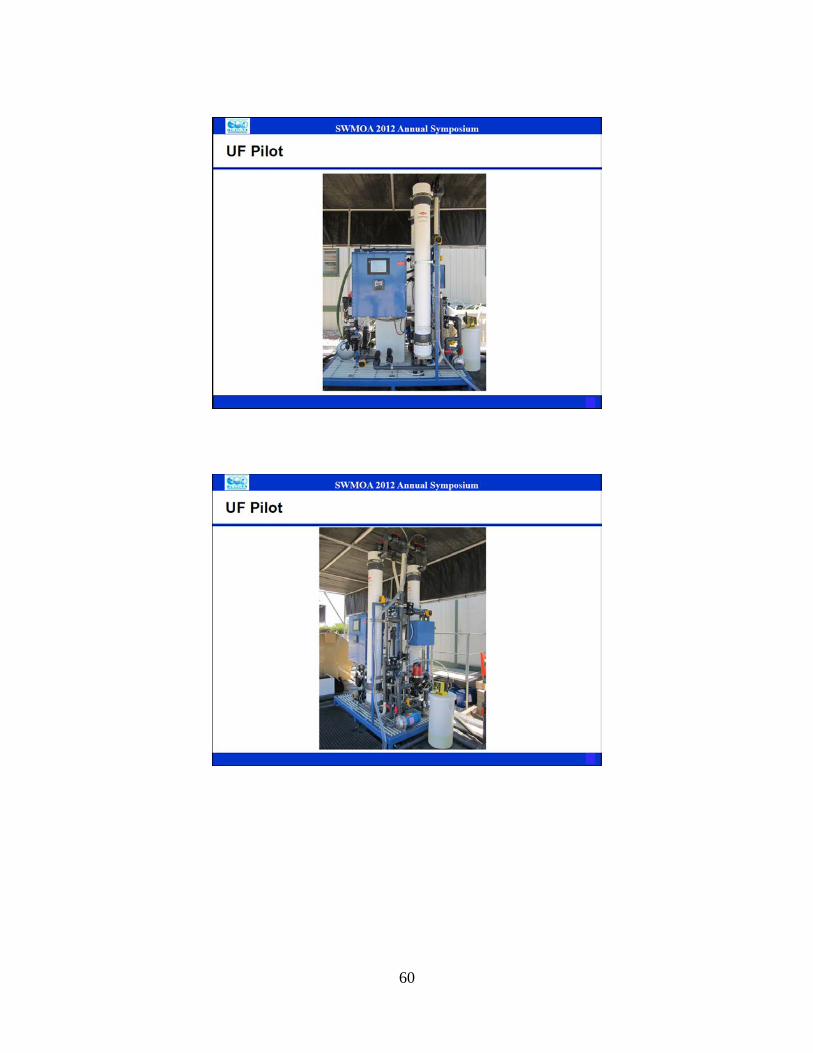
60
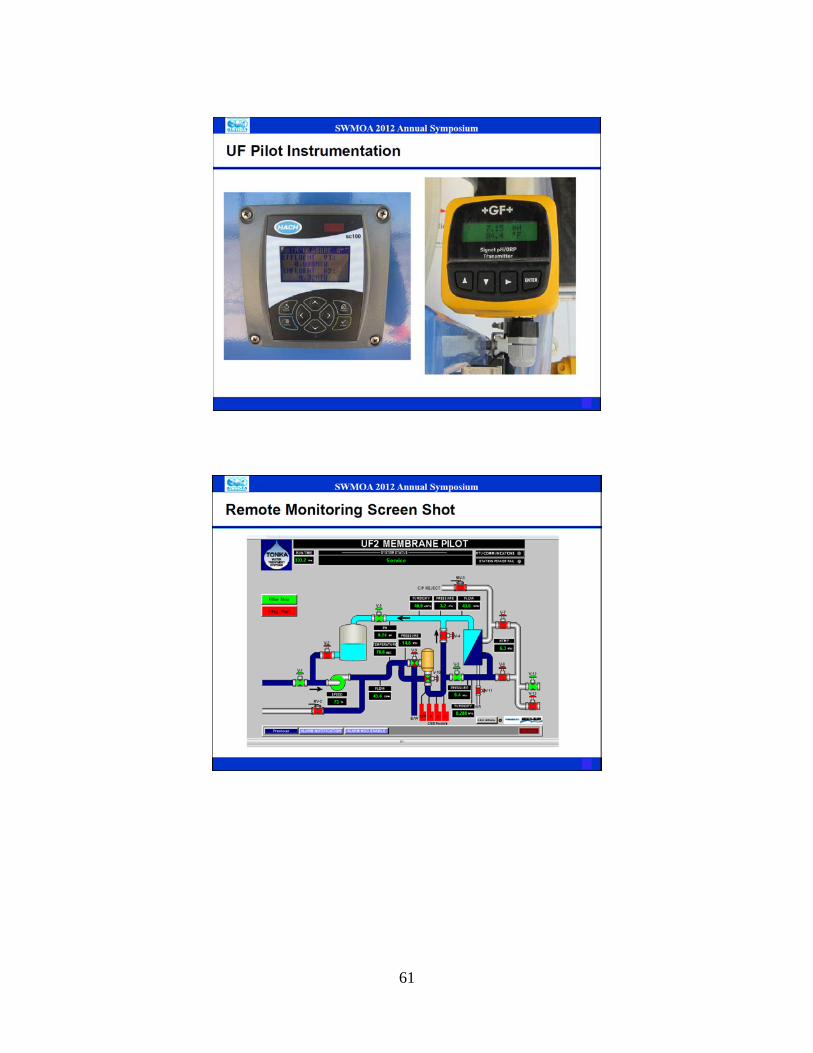
61

62
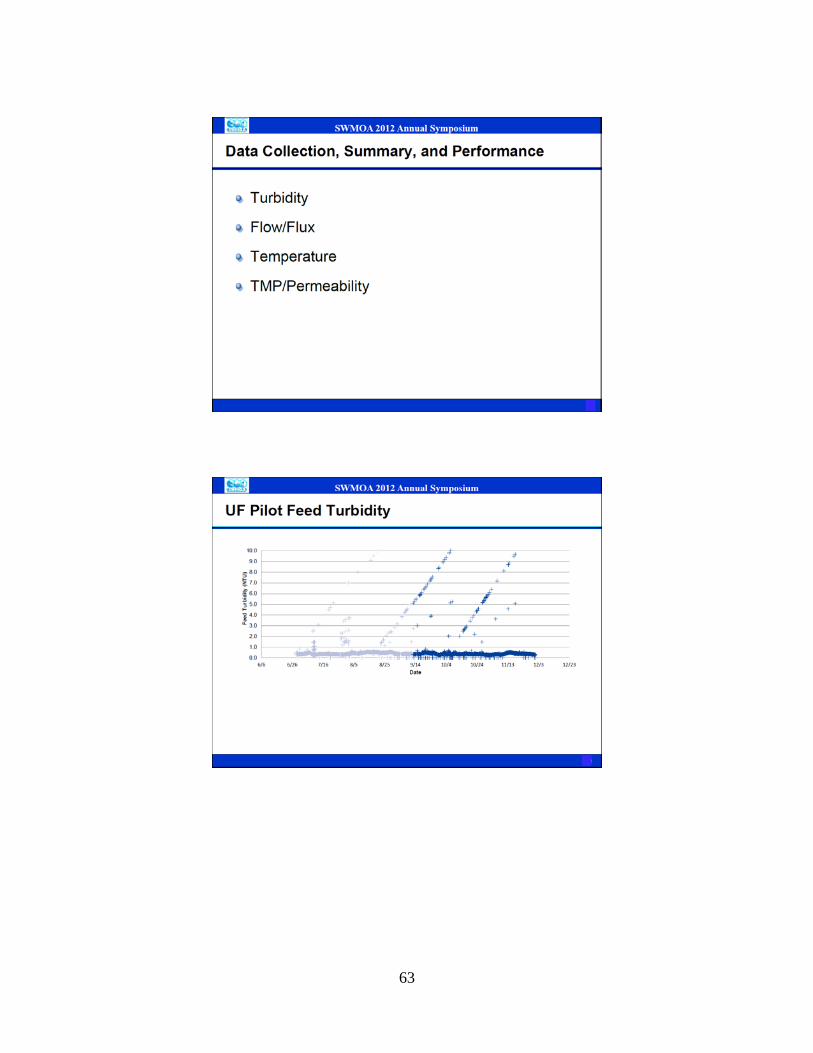
63
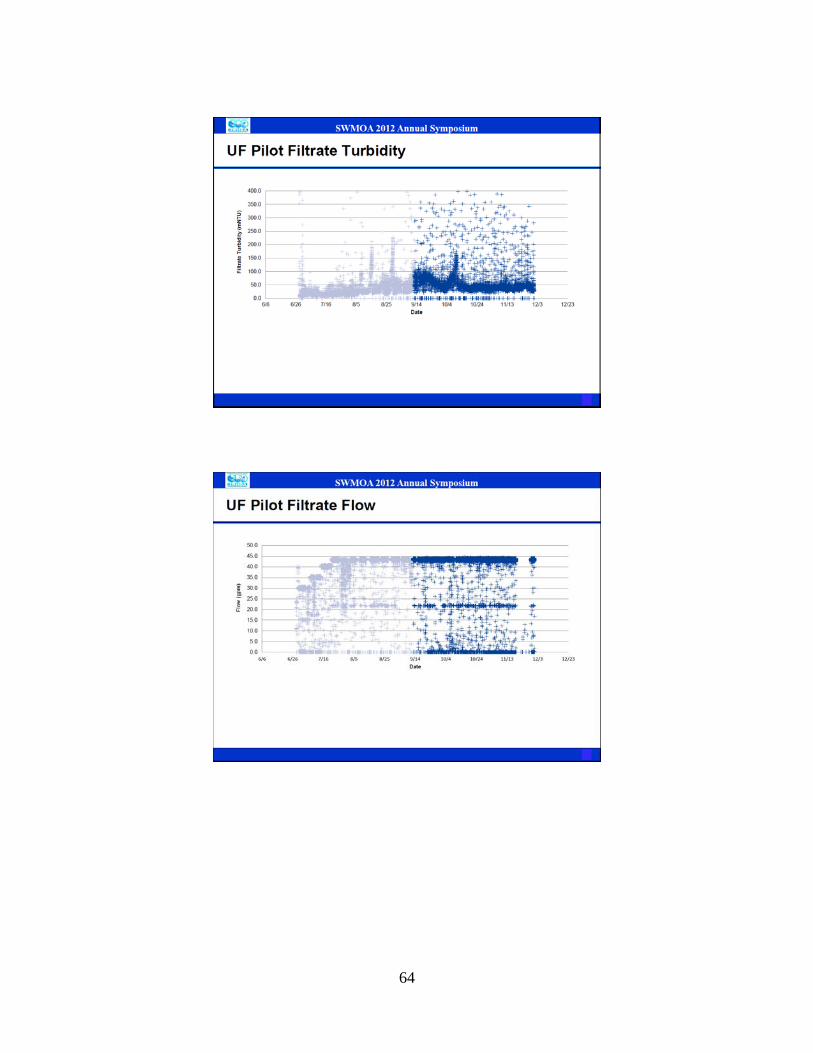
64
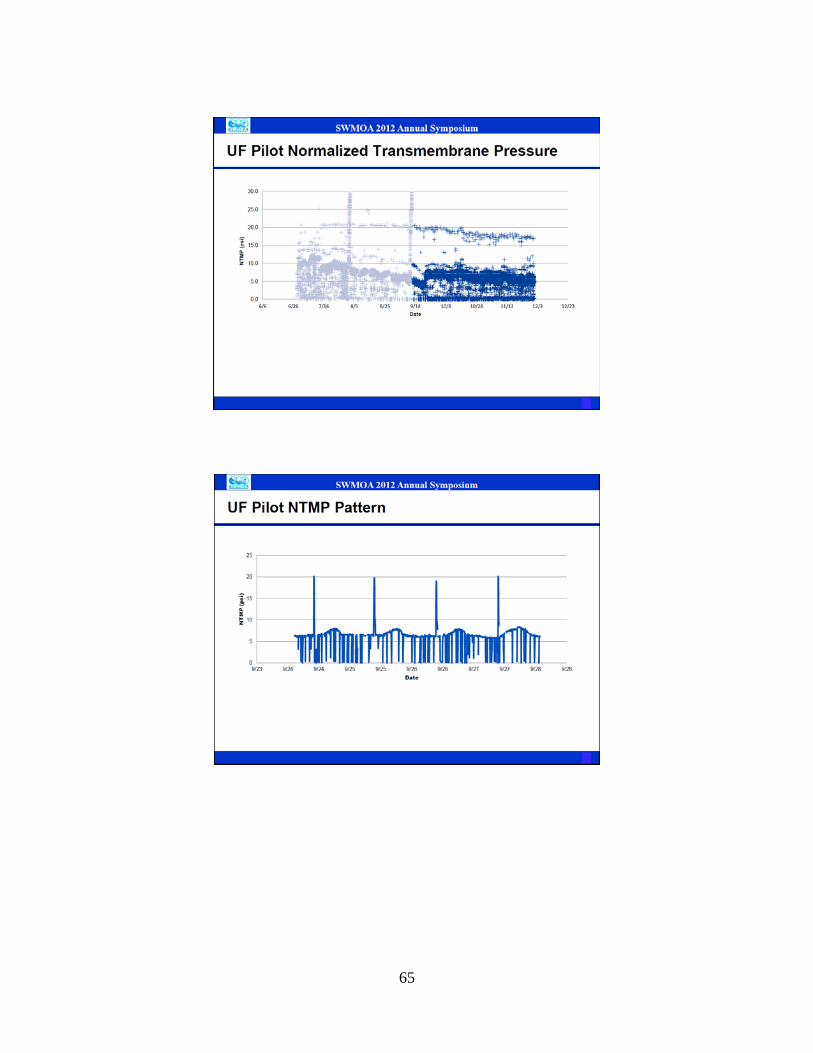
65
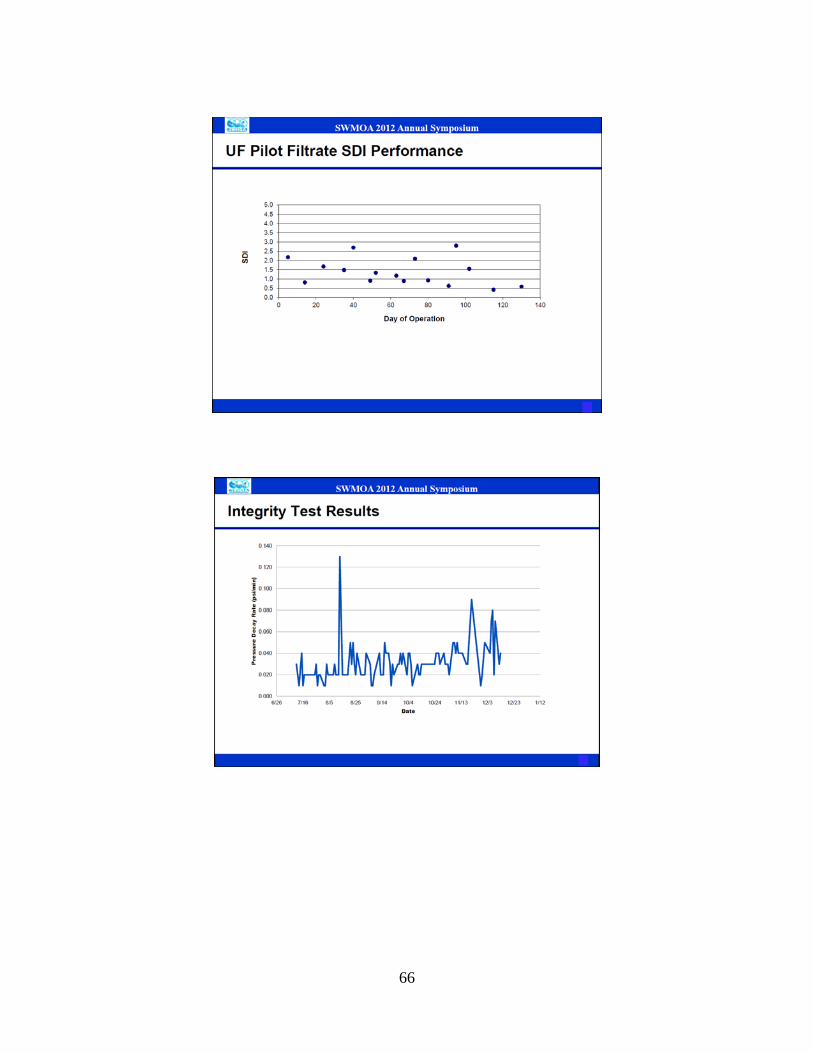
66
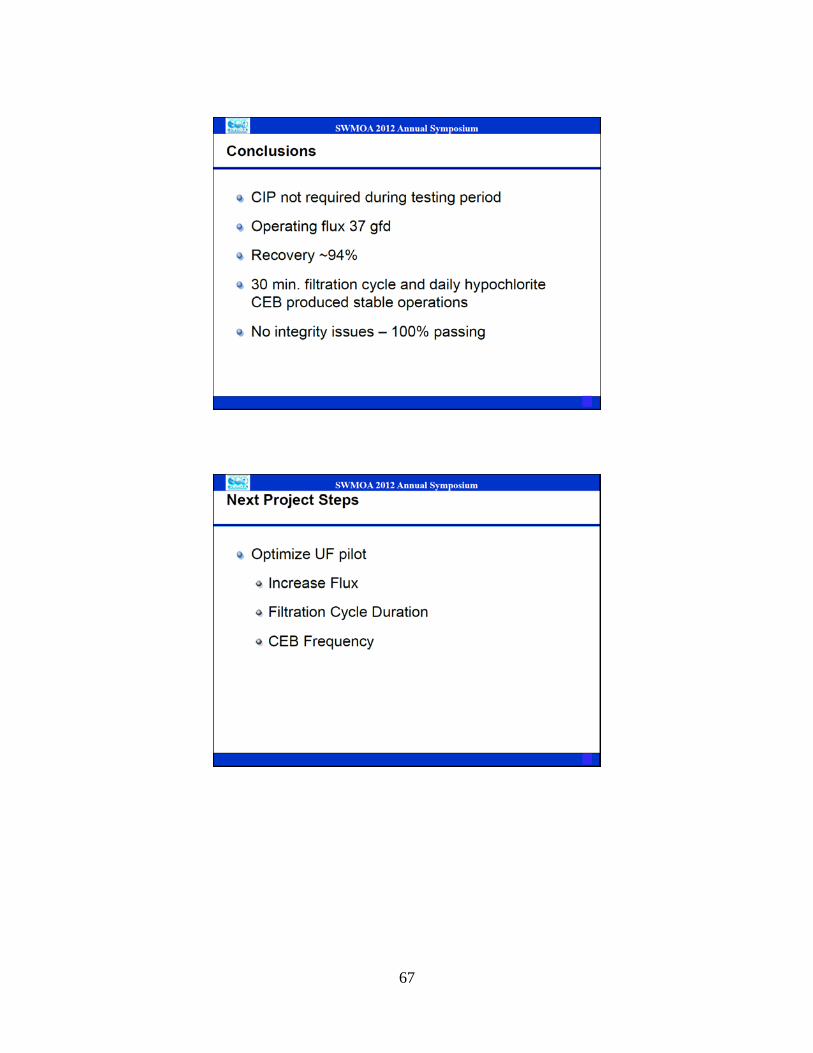
67
68
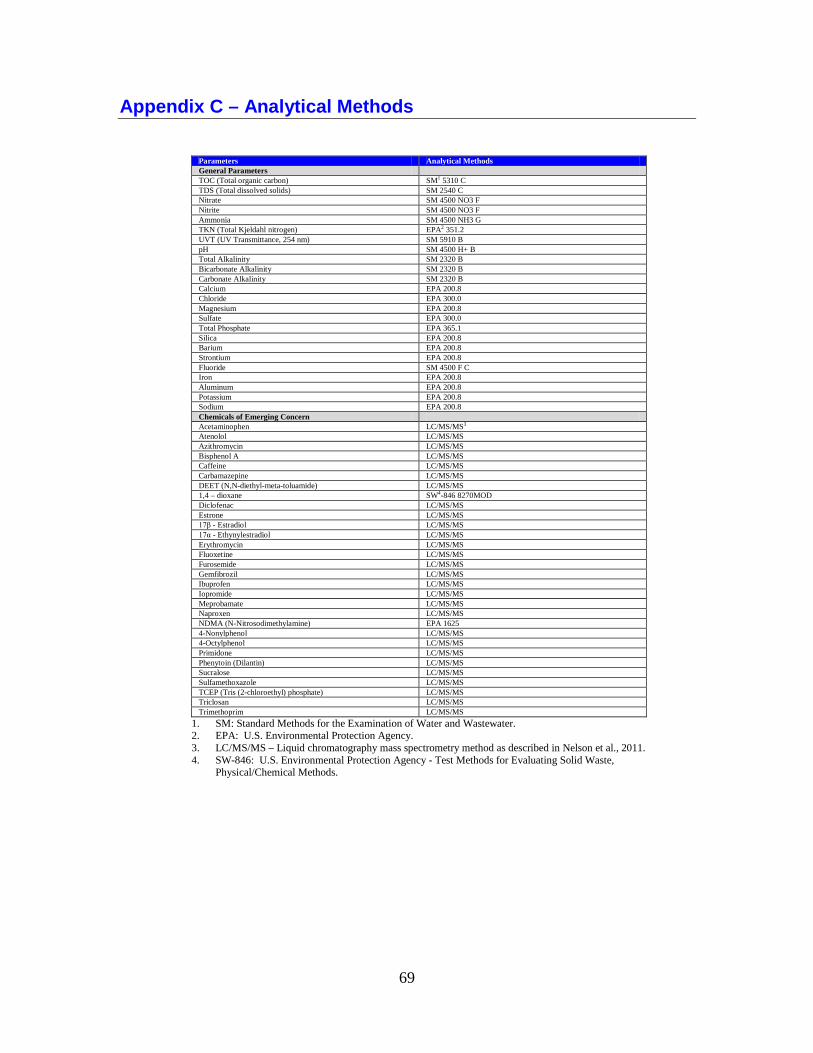
69
Appendix C – Analytical Methods
Parameters Analytical Methods General Parameters TOC (Total organic carbon) SM1 5310 C TDS (Total dissolved solids) SM 2540 C Nitrate SM 4500 NO3 F Nitrite SM 4500 NO3 F Ammonia SM 4500 NH3 G TKN (Total Kjeldahl nitrogen) EPA2 351.2 UVT (UV Transmittance, 254 nm) SM 5910 B pH SM 4500 H+ B Total Alkalinity SM 2320 B Bicarbonate Alkalinity SM 2320 B Carbonate Alkalinity SM 2320 B Calcium EPA 200.8 Chloride EPA 300.0 Magnesium EPA 200.8 Sulfate EPA 300.0 Total Phosphate EPA 365.1 Silica EPA 200.8 Barium EPA 200.8 Strontium EPA 200.8 Fluoride SM 4500 F C Iron EPA 200.8 Aluminum EPA 200.8 Potassium EPA 200.8 Sodium EPA 200.8 Chemicals of Emerging Concern Acetaminophen LC/MS/MS3
Atenolol LC/MS/MS Azithromycin LC/MS/MS Bisphenol A LC/MS/MS Caffeine LC/MS/MS Carbamazepine LC/MS/MS DEET (N,N-diethyl-meta-toluamide) LC/MS/MS 1,4 – dioxane SW4-846 8270MOD Diclofenac LC/MS/MS Estrone LC/MS/MS 17β - Estradiol LC/MS/MS 17α - Ethynylestradiol LC/MS/MS Erythromycin LC/MS/MS Fluoxetine LC/MS/MS Furosemide LC/MS/MS Gemfibrozil LC/MS/MS Ibuprofen LC/MS/MS Iopromide LC/MS/MS Meprobamate LC/MS/MS Naproxen LC/MS/MS NDMA (N-Nitrosodimethylamine) EPA 1625 4-Nonylphenol LC/MS/MS 4-Octylphenol LC/MS/MS Primidone LC/MS/MS Phenytoin (Dilantin) LC/MS/MS Sucralose LC/MS/MS Sulfamethoxazole LC/MS/MS TCEP (Tris (2-chloroethyl) phosphate) LC/MS/MS Triclosan LC/MS/MS Trimethoprim LC/MS/MS
1. SM: Standard Methods for the Examination of Water and Wastewater. 2. EPA: U.S. Environmental Protection Agency. 3. LC/MS/MS – Liquid chromatography mass spectrometry method as described in Nelson et al., 2011. 4. SW-846: U.S. Environmental Protection Agency - Test Methods for Evaluating Solid Waste,
Physical/Chemical Methods.