
Groundwater Quality of Southeastern Brazzaville,...
10
ISSN: 0973-4945; CODEN ECJHAO E-Journal of Chemistry http://www.e-journals.net 2010, 7(3), 861-869 Groundwater Quality of Southeastern Brazzaville, Congo MATINI LAURENT and MOUTOU JOSEPH MARIE Department of Exact Sciences, E.N.S., Marien NGOUABI University, B.P 69 Brazzaville, Congo. [email protected] Received 2 October 2009; Accepted 1 December 2009 Abstract: The groundwater in southeastern Brazzaville (Congo) was analyzed for their fluoride contents and others related parameters in rainy season. The fluoride contents in water samples (wells and spring) can be gather in three classes in the study area: low, optimal, high. Fluoride concentration in water samples presents a low significant correlation with Ca 2+ . This suggests that fluoride in the groundwater come from fluoride-bearing minerals such as CaF 2 (fluorite). Maps were drawn to show the geographical distribution of EC, Ca 2+ , Mg 2+ and F - . Factor analysis and cluster analysis were applied to the dataset. Factor analysis resulted in four factors explained 76.90% of the total groundwater quality variance. Factor 1 (hardness of the groundwater) includes total hardness, the concentration of K + , Ca 2+ and pH. Factor 2 (low mineralization of the groundwater) includes concentrations of TDS, Cl - , SO 4 2- and EC. Factor 3 (anthropogenic activities with the impact of agricultural fertilizers, farming activities, domestic wastewater, septic tanks) includes concentrations of Na + and NO 3 - . Factor 4 (weathering of calcium minerals) includes concentrations of F - . For cluster analysis, Ward’s method and the Euclidean distance were used. The findings of the cluster analysis are presented in the form of dendrogram of the well water sites (cases). The discriminating parameters between clusters have been highlighted from the Student test. In majority, they are in accordance with those highlighted by factor analysis. Keywords: Fluoride, Groundwater, Sandstone aquifer, Factor analysis, t-Test. Introduction Fluoride is of interest, because of its effects on human health. Even small quantity of fluoride (< 0.7 mg/L) has beneficial effects to the teeth by hardening the enamel and reducing the incidence of dental caries 1 . Excessive intake of fluoride (>1.5 mg/L) results in dental and skeletal fluorosis 2 . Unlike many others elements, a large quantity of fluoride is ingested from drinking water and food. Many studies have reported that fluoride is one of the most undesired elements present in the underground water extracted for drinking 3-5 .
Transcript of Groundwater Quality of Southeastern Brazzaville,...
ISSN: 0973-4945; CODEN ECJHAO
E-Journal of Chemistry
http://www.e-journals.net 2010, 7(3), 861-869
Groundwater Quality of Southeastern
Brazzaville, Congo
MATINI LAURENT and MOUTOU JOSEPH MARIE
Department of Exact Sciences,
E.N.S., Marien NGOUABI University, B.P 69 Brazzaville, Congo.
Received 2 October 2009; Accepted 1 December 2009
Abstract: The groundwater in southeastern Brazzaville (Congo) was analyzed for
their fluoride contents and others related parameters in rainy season. The fluoride
contents in water samples (wells and spring) can be gather in three classes in the
study area: low, optimal, high. Fluoride concentration in water samples presents a
low significant correlation with Ca2+. This suggests that fluoride in the groundwater
come from fluoride-bearing minerals such as CaF2 (fluorite). Maps were drawn to
show the geographical distribution of EC, Ca2+, Mg2+and F-. Factor analysis and
cluster analysis were applied to the dataset. Factor analysis resulted in four factors
explained 76.90% of the total groundwater quality variance. Factor 1 (hardness of
the groundwater) includes total hardness, the concentration of K+, Ca2+ and pH.
Factor 2 (low mineralization of the groundwater) includes concentrations of TDS,
Cl-, SO42- and EC. Factor 3 (anthropogenic activities with the impact of agricultural
fertilizers, farming activities, domestic wastewater, septic tanks) includes
concentrations of Na+ and NO3-. Factor 4 (weathering of calcium minerals)
includes concentrations of F-. For cluster analysis, Ward’s method and the
Euclidean distance were used. The findings of the cluster analysis are presented in
the form of dendrogram of the well water sites (cases). The discriminating
parameters between clusters have been highlighted from the Student test. In
majority, they are in accordance with those highlighted by factor analysis.
Keywords: Fluoride, Groundwater, Sandstone aquifer, Factor analysis, t-Test.
Introduction
Fluoride is of interest, because of its effects on human health. Even small quantity of
fluoride (< 0.7 mg/L) has beneficial effects to the teeth by hardening the enamel and
reducing the incidence of dental caries1. Excessive intake of fluoride (>1.5 mg/L) results in
dental and skeletal fluorosis2. Unlike many others elements, a large quantity of fluoride is
ingested from drinking water and food. Many studies have reported that fluoride is one of
the most undesired elements present in the underground water extracted for drinking3-5
.
862 MATINI LAURENT et al.
Fluoride build-up in water is controlled by many factors like aquifer geology, contact
times with fluoride-bearing minerals, agricultural fertilizers and climate. Fluoride mainly
occurs in groundwater through fluoride-rich minerals, such as fluorite (CaF2), fluorapatite
Ca5F(PO4)3, apatite Ca5(PO4)3(F, OH, Cl). It derives from dissolution of these minerals in
the rocks and soils through which water interacts.
The present study has been designed for the first time on the concentration of fluoride in
groundwater in Southeastern Brazzaville, Congo, which provides baseline data for taking
appropriate management measures to reduce the intensity of health disorders.
The study area
The study area is located between 15°13’53” - 15°14’10” East longitude and 4°15’7.2” to
4°15’28.8” South latitude. The area is in the equatorial climate zone, with two seasons: rainy
season (October to May) and dry season (June to September). Temperature in rainy season varies
from 25 °C to 36 °C, while it is between 18 °C and 24 °C in dry season. The mean annual rainfall
is 1470 mm. The vegetation is of savanna type (Loutetia demeusi) and presents a formation to
sparse gramineous carpet with a shrubby layer of hymenocardia acida. The soils of the area are
sandy and have been derived from Tertiary Silicate Sandstones of the Inkisi Serial. They are
ferralitic and acid. Aquifer is shallow. Generally, the depth of wells does not exceed 2 m. The
main natural recharge to groundwater is from precipitation (rainfall). Farming activities are
present around some well water sites and also agricultural activities near the River Mfilou.
Experimental
Twenty seven samples of wells water and one sample of spring water were collected in three
times in rainy season (from March 25 to April 5, 2007) from the study area. They were analyzed
for pH, electrical conductivity (EC), total dissolved solids (TDS), total hardness (TH as CaCO3),
Ca2+
, Mg2+
, K+, Cl
-, SO4
2-, NO3
-, HCO3
- and following standard methods
6. The ratio Ca
2+/Mg
2+
was also computed for all the groundwater samples. STATISTICA 7.1 software was used to
perform factor and cluster analyses. Factor analysis was used to understand the correlation
structure of collected data and identified most important factors contributing the data structure7.
The data were standardized to produce a normal distribution of all variables8, whose mean and
variance were set to zero and one respectively. The factor extraction was performed, using the
method of principal components. Kaiser criterion9, which retains only the factors with
eigenvalues greater than 1, was applied. The proportion of variance in all the groundwater
parameters accounted for each factor was obtained by dividing the factor’s eigenvalue by the
number of parameters. Interpretation of groundwater quality was facilitated, using the
varimax rotation, which is a standard rotation method. Cluster analysis is also another data
reduction method10
that was used to classify entities or objects, with similar properties into
groups called clusters. Objects within the clusters are similar, while objects in different
clusters are dissimilar. This exploratory method enables to discover the data structure not
only among observations, but also among variables. In this study, the Ward’s clustering
method and the Euclidean distance was used as a similarity measure.
Results and Discussion
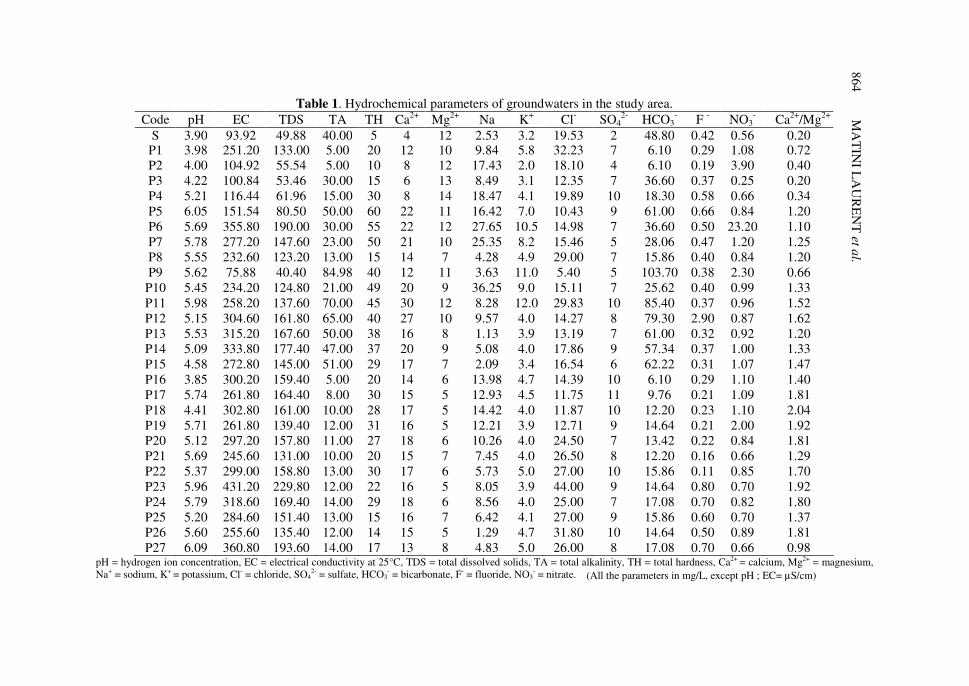
Table 1 presents the chemical composition of groundwater samples in the study area. It is
observed that the pH in all the groundwater samples ranges from 3.85 to 6.08, with a mean
of 5.22, indicating an acidic environment. The pH values are below the prescribed limits of
6.5-8.5 for drinking. The results show that electrical conductivity is varied between
75 µS/cm and 431.20 µS/cm, with a mean of 235.51 µS/cm (at 25 °C), indicating the
Groundwater Quality of Southeastern Brazzaville 863
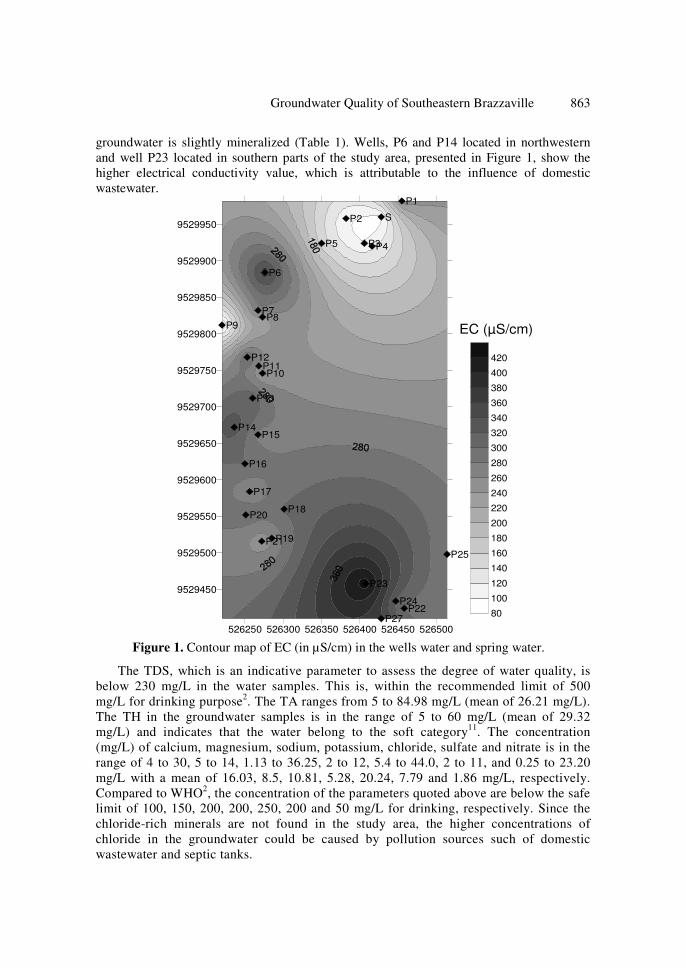
groundwater is slightly mineralized (Table 1). Wells, P6 and P14 located in northwestern
and well P23 located in southern parts of the study area, presented in Figure 1, show the
higher electrical conductivity value, which is attributable to the influence of domestic
wastewater.
526250 526300 526350 526400 526450 526500
9529450
9529500
9529550
9529600
9529650
9529700
9529750
9529800
9529850
9529900
9529950S
P1
P2
P3P4P5
P6
P7P8
P9
P10P11
P12
P13
P14P15
P16
P17
P18
P19
P20
P21
P22
P23
P24
P25
P2780
100
120
140
160
180
200
220
240
260
280
300
320
340
360
380
400
420
EC (µS/cm)
Figure 1. Contour map of EC (in µS/cm) in the wells water and spring water.
The TDS, which is an indicative parameter to assess the degree of water quality, is
below 230 mg/L in the water samples. This is, within the recommended limit of 500
mg/L for drinking purpose2. The TA ranges from 5 to 84.98 mg/L (mean of 26.21 mg/L).
The TH in the groundwater samples is in the range of 5 to 60 mg/L (mean of 29.32
mg/L) and indicates that the water belong to the soft category11
. The concentration
(mg/L) of calcium, magnesium, sodium, potassium, chloride, sulfate and nitrate is in the
range of 4 to 30, 5 to 14, 1.13 to 36.25, 2 to 12, 5.4 to 44.0, 2 to 11, and 0.25 to 23.20
mg/L with a mean of 16.03, 8.5, 10.81, 5.28, 20.24, 7.79 and 1.86 mg/L, respectively.
Compared to WHO2, the concentration of the parameters quoted above are below the safe
limit of 100, 150, 200, 200, 250, 200 and 50 mg/L for drinking, respectively. Since the
chloride-rich minerals are not found in the study area, the higher concentrations of
chloride in the groundwater could be caused by pollution sources such of domestic
wastewater and septic tanks.
86
4
MA
TIN
I LA
UR
EN
T e
t al.
Table 1. Hydrochemical parameters of groundwaters in the study area.
Code pH EC TDS TA TH Ca2+
Mg2+
Na K+ Cl
- SO4
2- HCO3
- F
- NO3
- Ca
2+/Mg
2+
S 3.90 93.92 49.88 40.00 5 4 12 2.53 3.2 19.53 2 48.80 0.42 0.56 0.20 P1 3.98 251.20 133.00 5.00 20 12 10 9.84 5.8 32.23 7 6.10 0.29 1.08 0.72
P2 4.00 104.92 55.54 5.00 10 8 12 17.43 2.0 18.10 4 6.10 0.19 3.90 0.40
P3 4.22 100.84 53.46 30.00 15 6 13 8.49 3.1 12.35 7 36.60 0.37 0.25 0.20
P4 5.21 116.44 61.96 15.00 30 8 14 18.47 4.1 19.89 10 18.30 0.58 0.66 0.34
P5 6.05 151.54 80.50 50.00 60 22 11 16.42 7.0 10.43 9 61.00 0.66 0.84 1.20
P6 5.69 355.80 190.00 30.00 55 22 12 27.65 10.5 14.98 7 36.60 0.50 23.20 1.10
P7 5.78 277.20 147.60 23.00 50 21 10 25.35 8.2 15.46 5 28.06 0.47 1.20 1.25
P8 5.55 232.60 123.20 13.00 15 14 7 4.28 4.9 29.00 7 15.86 0.40 0.84 1.20
P9 5.62 75.88 40.40 84.98 40 12 11 3.63 11.0 5.40 5 103.70 0.38 2.30 0.66
P10 5.45 234.20 124.80 21.00 49 20 9 36.25 9.0 15.11 7 25.62 0.40 0.99 1.33
P11 5.98 258.20 137.60 70.00 45 30 12 8.28 12.0 29.83 10 85.40 0.37 0.96 1.52
P12 5.15 304.60 161.80 65.00 40 27 10 9.57 4.0 14.27 8 79.30 2.90 0.87 1.62
P13 5.53 315.20 167.60 50.00 38 16 8 1.13 3.9 13.19 7 61.00 0.32 0.92 1.20
P14 5.09 333.80 177.40 47.00 37 20 9 5.08 4.0 17.86 9 57.34 0.37 1.00 1.33
P15 4.58 272.80 145.00 51.00 29 17 7 2.09 3.4 16.54 6 62.22 0.31 1.07 1.47
P16 3.85 300.20 159.40 5.00 20 14 6 13.98 4.7 14.39 10 6.10 0.29 1.10 1.40
P17 5.74 261.80 164.40 8.00 30 15 5 12.93 4.5 11.75 11 9.76 0.21 1.09 1.81
P18 4.41 302.80 161.00 10.00 28 17 5 14.42 4.0 11.87 10 12.20 0.23 1.10 2.04
P19 5.71 261.80 139.40 12.00 31 16 5 12.21 3.9 12.71 9 14.64 0.21 2.00 1.92
P20 5.12 297.20 157.80 11.00 27 18 6 10.26 4.0 24.50 7 13.42 0.22 0.84 1.81
P21 5.69 245.60 131.00 10.00 20 15 7 7.45 4.0 26.50 8 12.20 0.16 0.66 1.29
P22 5.37 299.00 158.80 13.00 30 17 6 5.73 5.0 27.00 10 15.86 0.11 0.85 1.70
P23 5.96 431.20 229.80 12.00 22 16 5 8.05 3.9 44.00 9 14.64 0.80 0.70 1.92
P24 5.79 318.60 169.40 14.00 29 18 6 8.56 4.0 25.00 7 17.08 0.70 0.82 1.80
P25 5.20 284.60 151.40 13.00 15 16 7 6.42 4.1 27.00 9 15.86 0.60 0.70 1.37
P26 5.60 255.60 135.40 12.00 14 15 5 1.29 4.7 31.80 10 14.64 0.50 0.89 1.81
P27 6.09 360.80 193.60 14.00 17 13 8 4.83 5.0 26.00 8 17.08 0.70 0.66 0.98 pH = hydrogen ion concentration, EC = electrical conductivity at 25°C, TDS = total dissolved solids, TA = total alkalinity, TH = total hardness, Ca2+ = calcium, Mg2+ = magnesium,
Na+ = sodium, K+ = potassium, Cl- = chloride, SO42- = sulfate, HCO3
- = bicarbonate, F- = fluoride, NO3- = nitrate. (All the parameters in mg/L, except pH ; EC= µS/cm)
Groundwater Quality of Southeastern Brazzaville 865
The Ca2+
/Mg2+
ratio is divided the groundwater quality as less than 1 and more than 1
(Table 1). The water observed from the location of S, P1, P2, P3 and P4 have Ca2+
/Mg2+
ratio
less than 1, while the water found from the locations P5 to P27 have Ca2+
/Mg2+
ratio more than 1.
The Ca2+
/Mg2+
ratio less than 1 indicates the weathering process of calcium minerals whereas the
Ca2+
/Mg2+
ratio more than 1 indicates the dissolution of more magnesium minerals. The
groundwater samples have been also characterized by HCO3-/Ca
2+ ratio, which vary between 0.17
and 0.96 in 75% of the total groundwater samples. However, this ratio is high than 1 in 25% of
the total groundwater samples. This suggests the importance of the alkalinity in the groundwater.
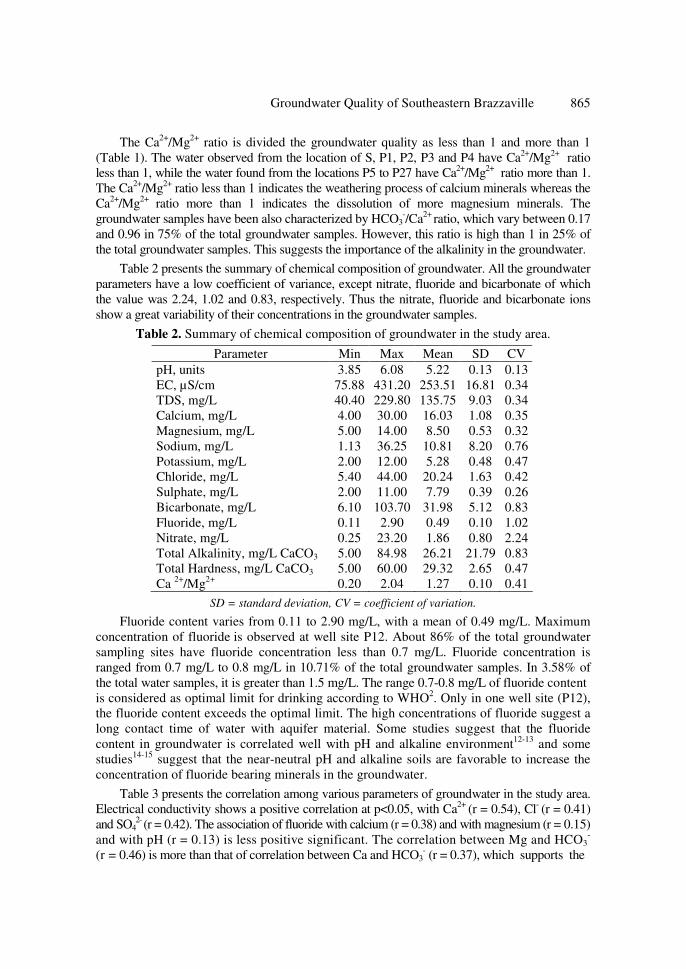
Table 2 presents the summary of chemical composition of groundwater. All the groundwater
parameters have a low coefficient of variance, except nitrate, fluoride and bicarbonate of which
the value was 2.24, 1.02 and 0.83, respectively. Thus the nitrate, fluoride and bicarbonate ions
show a great variability of their concentrations in the groundwater samples.
Table 2. Summary of chemical composition of groundwater in the study area.
Parameter Min Max Mean SD CV
pH, units 3.85 6.08 5.22 0.13 0.13
EC, µS/cm 75.88 431.20 253.51 16.81 0.34
TDS, mg/L 40.40 229.80 135.75 9.03 0.34
Calcium, mg/L 4.00 30.00 16.03 1.08 0.35
Magnesium, mg/L 5.00 14.00 8.50 0.53 0.32
Sodium, mg/L 1.13 36.25 10.81 8.20 0.76
Potassium, mg/L 2.00 12.00 5.28 0.48 0.47
Chloride, mg/L 5.40 44.00 20.24 1.63 0.42
Sulphate, mg/L 2.00 11.00 7.79 0.39 0.26
Bicarbonate, mg/L 6.10 103.70 31.98 5.12 0.83
Fluoride, mg/L 0.11 2.90 0.49 0.10 1.02
Nitrate, mg/L 0.25 23.20 1.86 0.80 2.24
Total Alkalinity, mg/L CaCO3 5.00 84.98 26.21 21.79 0.83
Total Hardness, mg/L CaCO3 5.00 60.00 29.32 2.65 0.47
Ca 2+
/Mg2+
0.20 2.04 1.27 0.10 0.41
SD = standard deviation, CV = coefficient of variation.
Fluoride content varies from 0.11 to 2.90 mg/L, with a mean of 0.49 mg/L. Maximum
concentration of fluoride is observed at well site P12. About 86% of the total groundwater
sampling sites have fluoride concentration less than 0.7 mg/L. Fluoride concentration is
ranged from 0.7 mg/L to 0.8 mg/L in 10.71% of the total groundwater samples. In 3.58% of
the total water samples, it is greater than 1.5 mg/L. The range 0.7-0.8 mg/L of fluoride content
is considered as optimal limit for drinking according to WHO2. Only in one well site (P12),
the fluoride content exceeds the optimal limit. The high concentrations of fluoride suggest a
long contact time of water with aquifer material. Some studies suggest that the fluoride
content in groundwater is correlated well with pH and alkaline environment12-13
and some
studies14-15
suggest that the near-neutral pH and alkaline soils are favorable to increase the
concentration of fluoride bearing minerals in the groundwater.
Table 3 presents the correlation among various parameters of groundwater in the study area.
Electrical conductivity shows a positive correlation at p<0.05, with Ca2+
(r = 0.54), Cl- (r = 0.41)
and SO42-
(r = 0.42). The association of fluoride with calcium (r = 0.38) and with magnesium (r = 0.15)
and with pH (r = 0.13) is less positive significant. The correlation between Mg and HCO3-
(r = 0.46) is more than that of correlation between Ca and HCO3- (r = 0.37), which supports the
866 MATINI LAURENT et al.
Ca2+
/Mg2+
ratio. Calcium and magnesium could proceed from the weathering process of the
minerals in the sandstone bedrock, such as fluoride-rich minerals and MgCO3. The
correlation between fluoride and calcium indicates the weathering of calcium minerals as a
dominant controlling mechanism for leaching of fluoride from the sources material in the
groundwater.
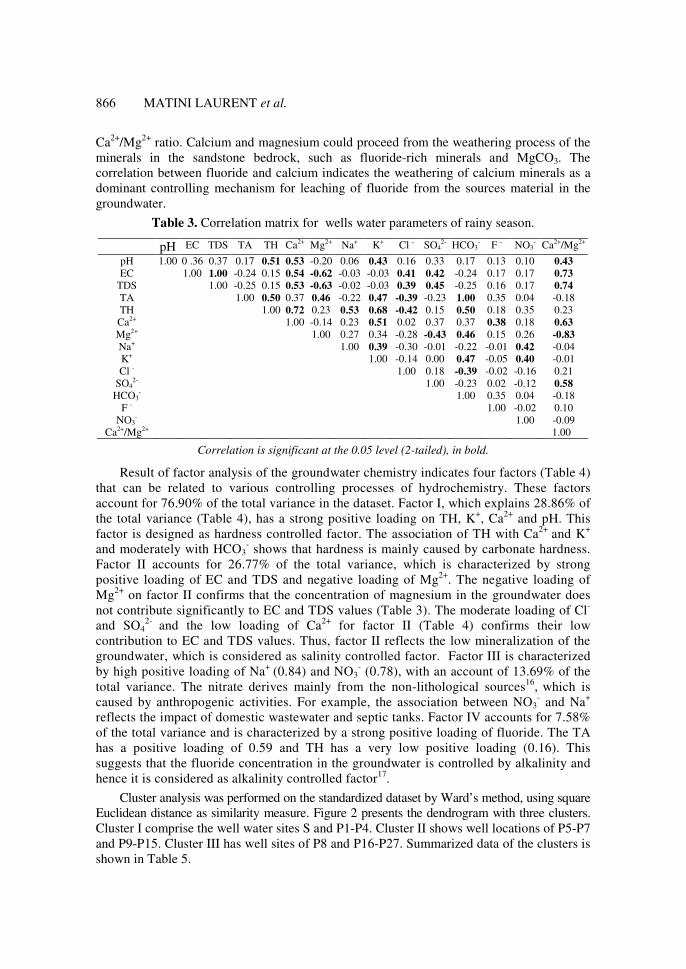
Table 3. Correlation matrix for wells water parameters of rainy season.
pH EC TDS TA TH Ca2+ Mg2+ Na+ K+ Cl - SO42- HCO3
- F - NO3- Ca2+/Mg2+
pH 1.00 0 .36 0.37 0.17 0.51 0.53 -0.20 0.06 0.43 0.16 0.33 0.17 0.13 0.10 0.43
EC 1.00 1.00 -0.24 0.15 0.54 -0.62 -0.03 -0.03 0.41 0.42 -0.24 0.17 0.17 0.73 TDS 1.00 -0.25 0.15 0.53 -0.63 -0.02 -0.03 0.39 0.45 -0.25 0.16 0.17 0.74
TA 1.00 0.50 0.37 0.46 -0.22 0.47 -0.39 -0.23 1.00 0.35 0.04 -0.18
TH 1.00 0.72 0.23 0.53 0.68 -0.42 0.15 0.50 0.18 0.35 0.23
Ca2+ 1.00 -0.14 0.23 0.51 0.02 0.37 0.37 0.38 0.18 0.63
Mg2+ 1.00 0.27 0.34 -0.28 -0.43 0.46 0.15 0.26 -0.83
Na+ 1.00 0.39 -0.30 -0.01 -0.22 -0.01 0.42 -0.04
K+ 1.00 -0.14 0.00 0.47 -0.05 0.40 -0.01
Cl - 1.00 0.18 -0.39 -0.02 -0.16 0.21
SO42- 1.00 -0.23 0.02 -0.12 0.58
HCO3- 1.00 0.35 0.04 -0.18
F - 1.00 -0.02 0.10
NO3- 1.00 -0.09
Ca2+/Mg2+ 1.00
Correlation is significant at the 0.05 level (2-tailed), in bold.
Result of factor analysis of the groundwater chemistry indicates four factors (Table 4)
that can be related to various controlling processes of hydrochemistry. These factors
account for 76.90% of the total variance in the dataset. Factor I, which explains 28.86% of
the total variance (Table 4), has a strong positive loading on TH, K+, Ca
2+ and pH. This
factor is designed as hardness controlled factor. The association of TH with Ca2+
and K+
and moderately with HCO3- shows that hardness is mainly caused by carbonate hardness.
Factor II accounts for 26.77% of the total variance, which is characterized by strong
positive loading of EC and TDS and negative loading of Mg2+
. The negative loading of
Mg2+
on factor II confirms that the concentration of magnesium in the groundwater does
not contribute significantly to EC and TDS values (Table 3). The moderate loading of Cl-
and SO42-
and the low loading of Ca2+
for factor II (Table 4) confirms their low
contribution to EC and TDS values. Thus, factor II reflects the low mineralization of the
groundwater, which is considered as salinity controlled factor. Factor III is characterized
by high positive loading of Na+
(0.84) and NO3- (0.78), with an account of 13.69% of the
total variance. The nitrate derives mainly from the non-lithological sources16
, which is
caused by anthropogenic activities. For example, the association between NO3- and Na
+
reflects the impact of domestic wastewater and septic tanks. Factor IV accounts for 7.58%
of the total variance and is characterized by a strong positive loading of fluoride. The TA
has a positive loading of 0.59 and TH has a very low positive loading (0.16). This
suggests that the fluoride concentration in the groundwater is controlled by alkalinity and
hence it is considered as alkalinity controlled factor17
.
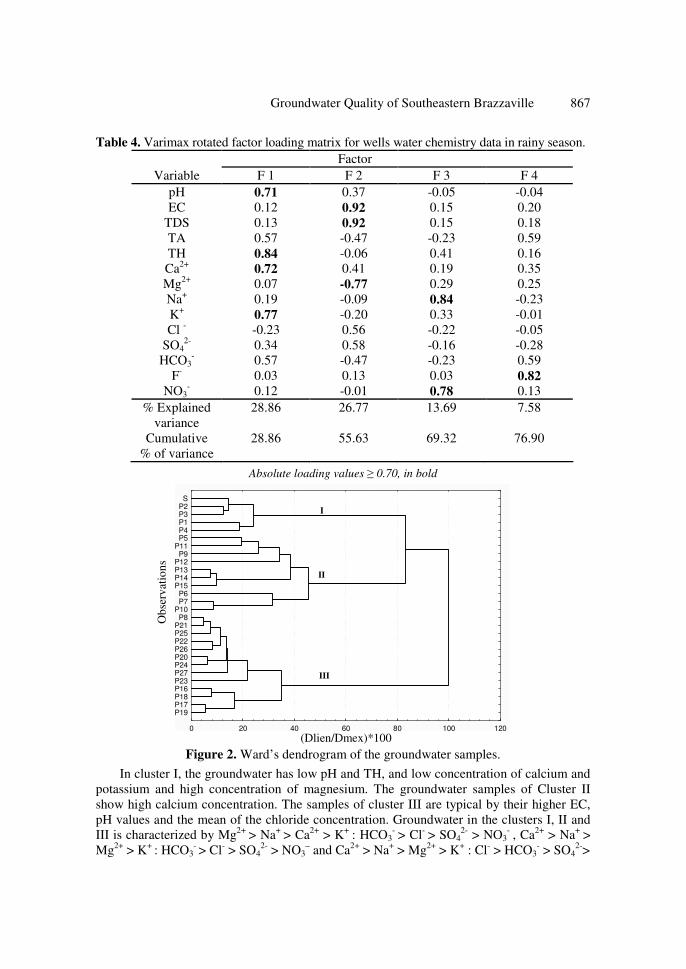
Cluster analysis was performed on the standardized dataset by Ward’s method, using square
Euclidean distance as similarity measure. Figure 2 presents the dendrogram with three clusters.
Cluster I comprise the well water sites S and P1-P4. Cluster II shows well locations of P5-P7
and P9-P15. Cluster III has well sites of P8 and P16-P27. Summarized data of the clusters is
shown in Table 5.
(Dlien/Dmex)*100
Ob
serv
atio
ns
Groundwater Quality of Southeastern Brazzaville 867
Table 4. Varimax rotated factor loading matrix for wells water chemistry data in rainy season.
Factor
Variable F 1 F 2 F 3 F 4
pH 0.71 0.37 -0.05 -0.04
EC 0.12 0.92 0.15 0.20
TDS 0.13 0.92 0.15 0.18
TA 0.57 -0.47 -0.23 0.59
TH 0.84 -0.06 0.41 0.16
Ca2+
0.72 0.41 0.19 0.35
Mg2+
0.07 -0.77 0.29 0.25
Na+ 0.19 -0.09 0.84 -0.23
K+ 0.77 -0.20 0.33 -0.01
Cl - -0.23 0.56 -0.22 -0.05
SO42-
0.34 0.58 -0.16 -0.28
HCO3- 0.57 -0.47 -0.23 0.59
F- 0.03 0.13 0.03 0.82
NO3- 0.12 -0.01 0.78 0.13
% Explained 28.86 26.77 13.69 7.58
variance
Cumulative 28.86 55.63 69.32 76.90
% of variance
Absolute loading values ≥ 0.70, in bold
0 20 40 60 80 100 120
P19P17P18P16P23P27P24P20P26P22P25P21P8
P10P7P6
P15P14P13P12P9
P11P5P4P1P3P2S
I
II
III
Figure 2. Ward’s dendrogram of the groundwater samples.
In cluster I, the groundwater has low pH and TH, and low concentration of calcium and
potassium and high concentration of magnesium. The groundwater samples of Cluster II
show high calcium concentration. The samples of cluster III are typical by their higher EC,
pH values and the mean of the chloride concentration. Groundwater in the clusters I, II and
III is characterized by Mg2+
> Na+
> Ca2+
> K+
: HCO3- > Cl
- > SO4
2- > NO3
- , Ca
2+ > Na
+ >
Mg2+
> K+
: HCO3- > Cl
- > SO4
2- > NO3
– and Ca
2+ > Na
+ > Mg
2+ > K
+ : Cl
- > HCO3
- > SO4
2->
868 MATINI LAURENT et al.
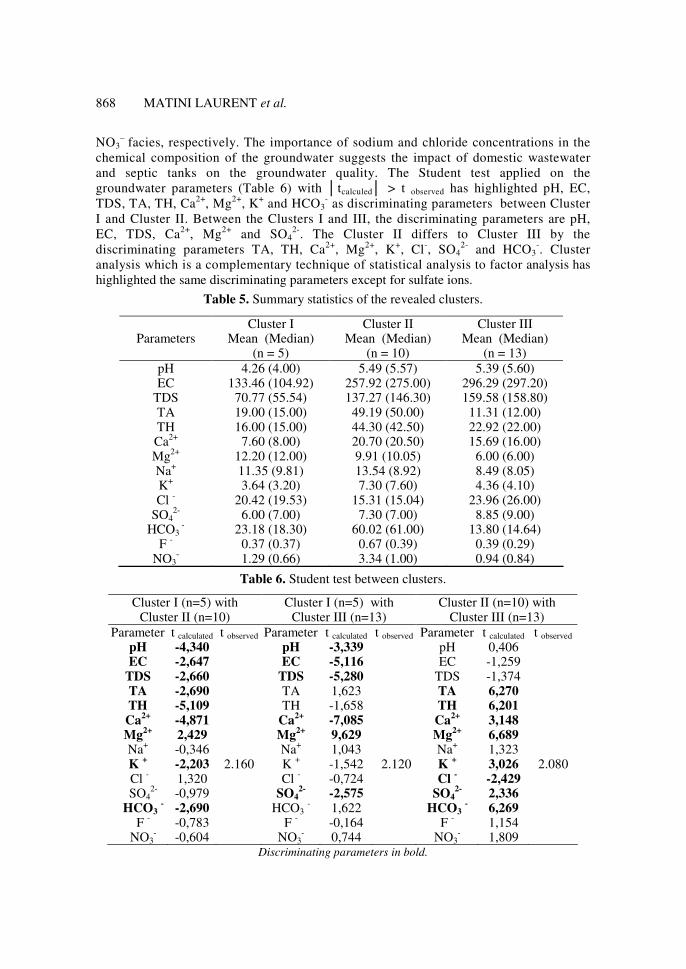
NO3–
facies, respectively. The importance of sodium and chloride concentrations in the
chemical composition of the groundwater suggests the impact of domestic wastewater
and septic tanks on the groundwater quality. The Student test applied on the
groundwater parameters (Table 6) with │tcalculed│ > t observed has highlighted pH, EC,
TDS, TA, TH, Ca2+
, Mg2+
, K+ and HCO3
- as discriminating parameters between Cluster
I and Cluster II. Between the Clusters I and III, the discriminating parameters are pH,
EC, TDS, Ca2+
, Mg2+
and SO42-
. The Cluster II differs to Cluster III by the
discriminating parameters TA, TH, Ca2+
, Mg2+
, K+, Cl
-, SO4
2- and HCO3
-. Cluster
analysis which is a complementary technique of statistical analysis to factor analysis has
highlighted the same discriminating parameters except for sulfate ions.
Table 5. Summary statistics of the revealed clusters.
Table 6. Student test between clusters.
Cluster I (n=5) with Cluster II (n=10)
Cluster I (n=5) with Cluster III (n=13)
Cluster II (n=10) with Cluster III (n=13)
Parameter t calculated t observed Parameter t calculated t observed Parameter t calculated t observed pH -4,340 pH -3,339 pH 0,406 EC -2,647 EC -5,116 EC -1,259
TDS -2,660 TDS -5,280 TDS -1,374 TA -2,690 TA 1,623 TA 6,270 TH -5,109 TH -1,658 TH 6,201 Ca
2+ -4,871 Ca
2+ -7,085 Ca
2+ 3,148
Mg2+
2,429 Mg2+
9,629 Mg2+
6,689 Na
+ -0,346 Na
+ 1,043 Na
+ 1,323
K + -2,203 2.160 K
+ -1,542 2.120 K
+ 3,026 2.080
Cl - 1,320 Cl
- -0,724 Cl
- -2,429
SO42-
-0,979 SO42-
-2,575 SO42-
2,336 HCO3
- -2,690 HCO3
- 1,622 HCO3
- 6,269
F - -0,783 F
- -0,164 F
- 1,154
NO3- -0,604 NO3
- 0,744 NO3
- 1,809
Discriminating parameters in bold.
Cluster I Cluster II Cluster III Parameters Mean (Median) Mean (Median) Mean (Median)
(n = 5) (n = 10) (n = 13)
pH 4.26 (4.00) 5.49 (5.57) 5.39 (5.60) EC 133.46 (104.92) 257.92 (275.00) 296.29 (297.20)
TDS 70.77 (55.54) 137.27 (146.30) 159.58 (158.80) TA 19.00 (15.00) 49.19 (50.00) 11.31 (12.00) TH 16.00 (15.00) 44.30 (42.50) 22.92 (22.00) Ca
2+ 7.60 (8.00) 20.70 (20.50) 15.69 (16.00)
Mg2+
12.20 (12.00) 9.91 (10.05) 6.00 (6.00) Na
+ 11.35 (9.81) 13.54 (8.92) 8.49 (8.05)
K+ 3.64 (3.20) 7.30 (7.60) 4.36 (4.10)
Cl - 20.42 (19.53) 15.31 (15.04) 23.96 (26.00)
SO42-
6.00 (7.00) 7.30 (7.00) 8.85 (9.00) HCO3
- 23.18 (18.30) 60.02 (61.00) 13.80 (14.64)
F - 0.37 (0.37) 0.67 (0.39) 0.39 (0.29)
NO3- 1.29 (0.66) 3.34 (1.00) 0.94 (0.84)
Groundwater Quality of Southeastern Brazzaville 869
Conclusion
In this study, aquifer materials are sandstone which contributes weakly to the groundwater composition. Two zones of wells water sites were identified from the Ca
2+/Mg
2+ ratio. The first
zone with Ca2+
/Mg2+
ratio less than 1 which indicates the weathering process of calcium minerals, the second zone with Ca
2+/Mg
2+ ratio higher than 1 which corresponds to the
dissolution of more magnesium. Factor analysis identified four factors accounting for 76.90% of the total variance due to hardness, salinity, domestic waste water and septic tanks and alkalinity. Cluster analysis performed on groundwater parameters resulted in three clusters and the discriminating parameters highlighted from the Student test were in accordance, in majority, with those of factor analysis. In the absence of anthropogenic sources, the groundwater facies would be Mg - Ca - HCO3 in the cluster I and Ca - Mg - HCO3 in the clusters II and III as it is showed by the Ca
2+/Mg
2+ ratio. The study has helped to improve
understanding of groundwater hydrochemistry of the area for appropriate management.
Acknowledgment Authors are thankful to Prof. Subba Rao Nandipati, Department of Geology, Andhra University, for its suggestions in the preparation of the paper.
References 1. Public health Service. US Public Health Service Drinking Water Standards, PHS
Publication # 956, Government Printing Office, Washington, DC, 1962.
2. World Health Organization, Guidelines for drinking water quality-I, Recommandations,
2nd
Ed. Geneva WHO, 1993.
3. Subba Rao N, Prakasa Rao J, Nagamalleswara Rao B, Niranjan Babu P,
Madusudhana Reddy P and Devadas D J, Curr Sci., 1998, 75(9), 887-888.
4. Gupta M K, Singh V, Rajwanshi P, Agarwal M, Rai K, Srivastava S, Srivastava R,
snf Dass S, Environ Monit Assess., 1999, 59, 275-285.
5. Ravindra K and Garg V K, Int J Environ Health Res., 2006, 16, 163-166.
6. Standard Methods for the Examination of Water and Wastewater, 20th
Ed. APHA,
AWWA, WEF. Washington DC, 1998.
7. Malinowski E R, Factor Analysis in Chemistry, 2nd
Ed John Wiley & Sons, New
York, 2001.
8. Davis J C, Statistics and Data Analysis in Geology, John Wiley & Sons. New York, 1986.
9. Kaiser H F, Educational and Psychological Measurement, 1960, 20, 141-151.
10. Everitt B, Landau S and Leese M, Clusters Analysis, 4th
Ed., Hodder Arnold,
London, 2001.
11. Durfor C N and Becker E, US-Geological Survey Water Supply Paper 1812, 1964, p364.
12. Zhang Bo, Hong Mei, Zhao Yong Sheng, Liu Xueyu, Zhang Xuelin and Dong Jun,
Environ Geochem Health, 2003, 25, 421-431.
13. Jain P, Sharma D J, Sohu D and Sharma P, Int J Environ Sci Tech., 2005, 2(4), 373-379
14. Saxena V K and Ahmed S, Environ Geol, 2001, 40(9), 1084-1087.
15. Tripathy S, Panigrahil M K and Kundu N, Environ Geochem Health, 2005, 27, 205-216.
16. Ritzi R W, Wright S L, Mann B and Chen M, Ground Water, 31, 221-229.
17. Al-Zarah A I, J Applied Sci., 2007, 7(23), 3669-3677.
Submit your manuscripts athttp://www.hindawi.com
Hindawi Publishing Corporationhttp://www.hindawi.com Volume 2014
Inorganic ChemistryInternational Journal of
Hindawi Publishing Corporation http://www.hindawi.com Volume 2014
International Journal ofPhotoenergy
Hindawi Publishing Corporationhttp://www.hindawi.com Volume 2014
Carbohydrate Chemistry
International Journal of
Hindawi Publishing Corporationhttp://www.hindawi.com Volume 2014
Journal of
Chemistry
Hindawi Publishing Corporationhttp://www.hindawi.com Volume 2014
Advances in
Physical Chemistry
Hindawi Publishing Corporationhttp://www.hindawi.com
Analytical Methods in Chemistry
Journal of
Volume 2014
Bioinorganic Chemistry and ApplicationsHindawi Publishing Corporationhttp://www.hindawi.com Volume 2014
SpectroscopyInternational Journal of
Hindawi Publishing Corporationhttp://www.hindawi.com Volume 2014
The Scientific World JournalHindawi Publishing Corporation http://www.hindawi.com Volume 2014
Medicinal ChemistryInternational Journal of
Hindawi Publishing Corporationhttp://www.hindawi.com Volume 2014
Chromatography Research International
Hindawi Publishing Corporationhttp://www.hindawi.com Volume 2014
Applied ChemistryJournal of
Hindawi Publishing Corporationhttp://www.hindawi.com Volume 2014
Hindawi Publishing Corporationhttp://www.hindawi.com Volume 2014
Theoretical ChemistryJournal of
Hindawi Publishing Corporationhttp://www.hindawi.com Volume 2014
Journal of
Spectroscopy
Analytical ChemistryInternational Journal of
Hindawi Publishing Corporationhttp://www.hindawi.com Volume 2014
Journal of
Hindawi Publishing Corporationhttp://www.hindawi.com Volume 2014
Quantum Chemistry
Hindawi Publishing Corporationhttp://www.hindawi.com Volume 2014
Organic Chemistry International
Hindawi Publishing Corporationhttp://www.hindawi.com Volume 2014
CatalystsJournal of
ElectrochemistryInternational Journal of
Hindawi Publishing Corporation http://www.hindawi.com Volume 2014


