Groundwater Quality in New Zealand - NIWAdocs.niwa.co.nz/library/public/9780478301694.pdf · Table...
81
Groundwater Quality in New Zealand State and Trends 1995–2006
Transcript of Groundwater Quality in New Zealand - NIWAdocs.niwa.co.nz/library/public/9780478301694.pdf · Table...
Groundwater Quality in New Zealand
State and Trends 1995–2006

This report has been prepared by the Institute of Geological and Nuclear Sciences Limited (GNS Science) exclusively for and under contract to the Ministry for the Environment. Unless otherwise agreed in writing, all liability of GNS Science to any other party other than the Ministry for the Environment in respect of the report is expressly excluded.
Acknowledgements
We would like to thank regional council groundwater scientists for providing data, and for their careful reviews of a draft version of this report.
Published in August 2007 by the Ministry for the Environment Manatū Mō Te Taiao PO Box 10362, Wellington, New Zealand
ISBN: 978-0-478-30169-4 (electronic) Publication number: ME 831
This document is available on the Ministry for the Environment’s website: www.mfe.govt.nz

Contents
Executive Summary vii
1 Introduction 1 1.1 Overview 1 1.2 Methods 1
Groundwater quality data 1 Data analysis methods 7 Data limitations 8
1.3 General chemical characteristics of groundwater 9 Total dissolved solids 10 Major cation and anion ratios 10 Redox state 10 Human influence 11
2 Groundwater quality status 1995–2006 12 2.1 Categorisation of monitoring sites based on groundwater quality status 12
Auckland 18 Manawatu–Wanganui 19 Wellington 19 Marlborough 19 Canterbury 19
2.2 Quantification of groundwater quality status at the national scale 20 Nitrate 24 Iron and manganese 24 Microbiological parameters 25 Salinity 25 Other parameters 26
3 Groundwater quality trends 1995–2006 28 3.1 Categorisation of monitoring sites based on trends in groundwater quality 28 3.2 Quantification of groundwater quality trends at the national scale 32
Nitrate 34 Iron and manganese 35 Microbiological parameters 35 Salinity 36
4 Groundwater quality status and trends in relation to controlling factors 37 4.1 Well depth and aquifer confinement 37 4.2 Aquifer lithology 39 4.3 Surrounding land use and land cover 39
5 Comparison to previous studies 41 5.1 Regional investigations 41 5.2 National assessments of groundwater quality 41
Groundwater Quality in New Zealand: State and Trends 1995–2006 iii

5.3 National assessments of river water quality 42 5.4 International studies 42
6 Summary and Conclusions 43
References 45
Appendix 1: Groundwater quality maps 47
Tables
Table 1: Sources of groundwater quality data and abbreviations used in this report 2
Table 2: Number of sites considered in this investigation, categorised by programme, aquifer lithology and aquifer confinement for each regional council 3
Table 3: Number of sites considered in this investigation, categorised by surrounding land use and surrounding land cover for each regional council 4
Table 4: Parameter category names and units, and the abbreviations used for the remainder of this report (see also Spreadsheet 2) 6
Table 5: Parameters used to assign monitoring sites to the status-based groundwater quality categories defined by Daughney and Reeves (2005), and their median concentrations in each category, based on the NGMP data set 14
Table 6: Percentage of SOE monitoring sites in each region assigned to each status-based groundwater quality category, relative to the total number (n) of sites for which a categorical assignment could be made 14
Table 7: Calculated national percentiles and maximum values for groundwater quality parameters, with global average concentrations for river water and groundwater given for comparison 21
Table 8: Percentage of monitoring sites at which median concentrations exceed water-quality guidelines 23
Table 9: General characteristics of trend-based groundwater categories defined by Daughney and Reeves (2006) 28
Table 10: Percentage of monitoring sites assigned to each trend-based groundwater quality category, and total number (n) and percentage (%n) of sites in each category overall 29
Table 11: Total number of monitoring sites at which trend assessments could be performed (n), and percentages without significant trends (%N) or with significant increasing (%INCR) or significant decreasing (%DECR) trends 32
iv Groundwater Quality in New Zealand: State and Trends 1995–2006

Table 12: National absolute and relative rates of change in groundwater quality parameters (units per year) 33
Table A1: Reported land use and the assigned categories 48
Table A2: Reported aquifer lithologies and their assigned categories 49
Figures
Figure 1: General characteristics of status-based groundwater quality categories defined by Daughney and Reeves (2005) 13
Figure 2: Assignment of North Island SOE monitoring sites to status-based groundwater quality categories 15
Figure 3: Assignment of South Island SOE monitoring sites to status-based groundwater quality categories 16
Figure 4: Proportion of monitoring sites considered in this investigation that fall into category 1 (oxidised groundwater potentially at risk for elevated NO3-N) 17
Figure 5: Proportion of category 1 monitoring sites considered in this investigation that fall into subcategory 1A (oxidised groundwater that currently shows some level of human or agricultural impact) 18
Figure 6: National percentiles for selected groundwater quality parameters, including (a) major elements, (b) minor elements and microbiological indicators, and (c) trace elements 22
Figure 7: Assignment of North Island monitoring sites to trend-based groundwater quality categories 30
Figure 8: Assignment of South Island monitoring sites to trend-based groundwater quality categories 31
Figure 9: National percentiles for rates of change in groundwater quality parameters, including (a) major elements and (b) minor elements and microbiological indicators 34
Figure 10: Relationship between median NO3-N concentration, bore depth and aquifer confinement 38
Figure 11: Relationship between the microbiological parameter with the highest median (MaxMicro) and bore depth and aquifer confinement 38
Figure A1: Aquifer lithology – North Island 50
Figure A2: Aquifer lithology – South Island 51
Figure A3: Aquifer confinement – North Island 52
Figure A4: Aquifer confinement – South Island 53
Groundwater Quality in New Zealand: State and Trends 1995–2006 v

Figure A5: Well depth – North Island 54
Figure A6: Well depth – South Island 55
Figure A7: Surrounding land use – North Island 56
Figure A8: Surrounding land use – South Island 57
Figure A9: Median calculated TDS – North Island 58
Figure A10: Median calculated TDS – South Island 59
Figure A11: Median conductivity – North Island 60
Figure A12: Median conductivity – South Island 61
Figure A13: Median NO3-N concentration – North Island 62
Figure A14: Median NO3-N concentration – South Island 63
Figure A15: Median Fe concentration – North Island 64
Figure A16: Median Fe concentration – South Island 65
Figure A17: Median Mn concentration – North Island 66
Figure A18: Median Mn concentration – South Island 67
Figure A19: Median microbiological indicator (MaxMicro) – North Island 68
Figure A20: Median microbiological indicator (MaxMicro) – South Island 69
Figure A21: Trend magnitudes, NO3-N – North Island 70
Figure A22: Trend magnitudes, NO3-N – South Island 71
Figure A23: Trend magnitudes, conductivity – North Island 72
Figure A24: Trend magnitudes, conductivity – South Island 73
vi Groundwater Quality in New Zealand: State and Trends 1995–2006

Executive Summary This report provides a summary of the current status of groundwater quality in New Zealand, and an assessment of changes over the period from 1995 to 2006. Data used in this study were sourced from the state of the environment monitoring programmes operated by 15 regional authorities, and from the National Groundwater Monitoring Programme run by GNS Science. The study identified two major national-scale groundwater quality issues:
• contamination with nitrate and/or microbial pathogens, especially in shallow wells in unconfined aquifers
• naturally elevated concentrations of iron, manganese, arsenic and/or ammonia, especially in deeper wells in confined aquifers.
At about a third of the monitoring sites considered in this study the groundwater shows some level of human influence, with nitrate and/or sulphate concentrations in excess of natural background levels. At another third of the sites the groundwater shows little or no evidence of human influence, but due to high levels of oxygen in the aquifer any introduced nitrate or sulphate will persist and accumulate. At the remaining third of the sites the groundwater is oxygen-poor and is not likely to accumulate significant nitrate, but due to natural processes it commonly accumulates concentrations of iron, manganese, arsenic and/or ammonia that exceed water-quality guidelines. The health-related guideline values for nitrate and indicator bacteria are exceeded at 5% and 20% of the monitoring sites for which indicator data were available, respectively. At about two-thirds of the sites considered in this study groundwater quality is either constant over time or changing slowly, probably due to the natural process of water−rock interaction. Changes in groundwater quality over time are more rapid at the remaining sites, with patterns that suggest human influence. At 6% of all sites a dilution trend, possibly related to changes in pumping regime, is indicated by rapid and concurrent decreases in the concentrations of several major elements. Time trends in parameters such as nitrate and sulphate suggest increasing (12% of sites) or decreasing (10% of sites) levels of human or agricultural impact. Elevated levels of nitrates and faecal bacteria in groundwater are almost certainly the result of human activities on the land. This conclusion is supported by the fact that elevated nitrate and bacteria levels are more often observed in shallow, unconfined aquifers (ie, those that tend to lie under flat expanses of urban and rural land) than deep, confined aquifers. However, this study has not been able to prove the relationship between different land use types (and intensity of land uses) and the magnitude or pattern of their impacts on groundwater quality. This is in fact a common result that has been observed in several previous studies in New Zealand and overseas, for a number of reasons. Firstly, an overwhelming majority of groundwater quality monitoring wells are located in developed catchments and it is therefore hard to make robust comparisons with groundwater in undeveloped areas (ie, pristine groundwater). Secondly, the quality of groundwater drawn from a monitoring well does not necessarily reflect the land use directly surrounding that well; water may have travelled from an area dominated by a different type/intensity of land use. Third, groundwater that has been impacted by land use might not have had sufficient time to move all the way from the aquifer’s recharge area to the monitoring well. In order to better understand relationships between groundwater quality and different types of land use, accurate knowledge of the age and source of the groundwater being monitored is required. This is presently a major information gap in New Zealand.
Groundwater Quality in New Zealand: State and Trends 1995–2006 vii


1 Introduction
1.1 Overview Groundwater quality is monitored in every region of New Zealand. This report focuses on groundwater quality data collected for routine state of the environment (SOE) monitoring. The SOE monitoring programmes conducted in different regions vary in terms of the number of sites sampled, the frequency of sample collection, the sampling methods, and the groundwater quality parameters measured. Regional councils (and unitary authorities) report regularly on the results of SOE monitoring within their own regions, but with the exception of occasional national surveys of nitrate contamination (Burden, 1982; Bright et al, 1998), SOE data have not been collated to provide a national overview of groundwater quality in New Zealand. The purpose of this report is to provide an assessment of the current state and trends in groundwater quality at a national scale. This assessment is based on data from regional council SOE monitoring programmes, and from the National Groundwater Monitoring Programme (NGMP) operated by GNS Science. All data relate to the period between 1995 and 2006. The remainder of this report is divided as follows: The rest of the Introduction contains a description of the data, data limitations and methods used for data analysis, and then a brief background discussion of the general chemical characteristics of groundwater. Section 2 gives a summary of groundwater quality status in New Zealand from 1995 to 2006, based on the medians and percentiles of 33 different indicator parameters. Section 3 provides a summary of changes in groundwater quality in New Zealand over the period from 1995 to 2006, based on calculated temporal trends for 33 indicator parameters. Section 4 gives an assessment of the importance of factors that might influence groundwater quality status and trends, such as well depth, aquifer characteristics and surrounding land use Section 5 then compares the results from this study with previous regional, national and international assessments of groundwater quality, and the final section discusses the results in relation to managing New Zealand’s groundwater resources.
1.2 Methods
Groundwater quality data
This investigation used groundwater quality data from 16 different databases (see Table 1). SOE groundwater monitoring data were extracted from 15 different regional council databases by regional council personnel. In addition, data collected through the National Groundwater Monitoring Programme (Rosen, 2001; Daughney and Reeves, 2005) were extracted from the Geothermal-Groundwater database housed at GNS Science. For the remainder of this report the data from the NGMP sites are grouped together with the SOE data from the relevant region.
Groundwater Quality in New Zealand: State and Trends 1995–2006 1
Table 1: Sources of groundwater quality data and abbreviations used in this report
Abbreviation Data source
ARC Auckland Regional Council EBOP Environment Bay of Plenty ECAN Environment Canterbury ES Environment Southland EW Environment Waikato GDC Gisborne District Council GWRC Greater Wellington Regional Council HBRC Hawke’s Bay Regional Council MDC Marlborough District Council MWRC Manawatu−Wanganui Regional Council NRC Northland Regional Council ORC Otago Regional Council TDC Tasman District Council TRC Taranaki Regional Council WCRC West Coast Regional Council NGMP National Groundwater Monitoring Programme
The entire data set used in this study included groundwater quality data from 1,068 SOE monitoring sites, most of which are privately owned wells. Data on the end use of water (eg, as drinking-water, irrigation, industrial use) at each monitoring site were not compiled for this study. The median well depth is 20 m, with a quarter of all wells less than 9m deep and a quarter more than 45m deep. The sites were divided into categories describing aquifer lithology and confinement, based on information provided by regional councils (see Table 2). The sites were also divided into categories describing the surrounding land use and land cover, based on information provided by regional councils and the Land Cover Database (TerraLink, 2007), respectively (see Table 3). Specific details on each site are presented in map form in Appendix 1 and in table form in Spreadsheet 1 (all spreadsheets are on the CD accompanying this report). This investigation considered groundwater quality data from 23,675 individual sampling events between 1 January 1995 and 31 December 2006. This amounts to an average of 22 sampling events at each site over the period of interest, or roughly one sampling event per site every six months. Some sites were sampled once a month over the entire 11-year period considered in this study, whereas some were sampled just two or three times.
2 Groundwater Quality in New Zealand: State and Trends 1995–2006

Table 2: Number of sites considered in this investigation, categorised by programme, aquifer lithology and aquifer confinement for each regional council
Category
AR
C
EBO
P
ECA
N
ES
EW
GD
C
GW
RC
HB
RC
MD
C
MW
RC
NR
C
OR
C
TDC
TRC
WC
RC
Tota
l
Total sites 24 62 279 86 116 80 71 50 24 32 48 101 16 71 8 1068 NGMP* 6 6 6 8 9 6 15 8 13 4 7 7 10 6 8 119 SOE* 18 56 273 78 107 74 56 42 11 28 41 94 6 65 – 949
Aquifer lithology (as recorded by regional councils)
Basalt 8 – – – 14 – – – – – 11 – – – – 33 Clay – – – – – – – 1 – – – – – – – 1 Gravel – 1 279 77 6 16 69 29 4 4 1 14 8 7 515 Greywacke 1 – – – 2 – – 1 – – 12 – – – – 16 Ignimbrite – 18 – – 34 – – – – – – – – – – 52 Lignite – – – 3 – – – – – – – – – – – 3 Limestone – 1 – 4 4 – – 1 1 – – – 3 – – 14 Pumice – 9 – – 16 1 – – – – – – – – – 26 Rhyolite – 1 – – – – – – – – – – – – – 1 Sand 4 7 – – 38 2 2 1 9 19 – – 71 1 154 Sandstone 9 – – – – – – – – – 3 – – – – 12 Shellbeds 2 – – – – – – – – – 2 – – – – 4 Unknown – 25 – 2 2 61 – 17 10 28 – 84 5 – – 234
Aquifer confinement (as recorded by regional councils)
Confined 13 2 15 1 25 3 37 26 10 2 6 – 7 4 – 151 Semi-confined 4 – 16 9 1 2 10 1 3 1 31 – – – – 78 Unconfined 7 2 47 73 69 1 24 1 10 1 8 7 9 18 – 277 Unknown – 58 201 3 21 74 – 22 1 28 3 94 – 49 8 562
* Includes a small proportion of sites that are no longer actively monitored.
Groundwater Quality in New Zealand: State and Trends 1995–2006 3
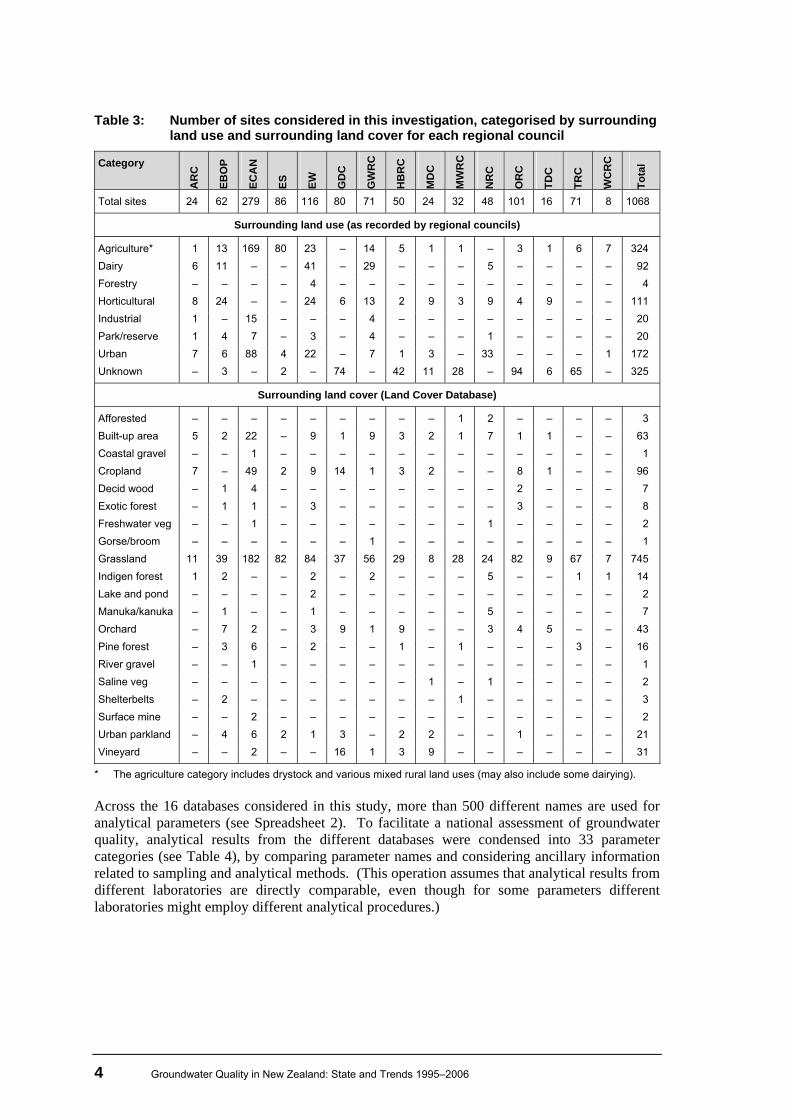
Table 3: Number of sites considered in this investigation, categorised by surrounding land use and surrounding land cover for each regional council
Category
AR
C
EBO
P
ECA
N
ES
EW
GD
C
GW
RC
HB
RC
MD
C
MW
RC
NR
C
OR
C
TDC
TRC
WC
RC
Tota
l
Total sites 24 62 279 86 116 80 71 50 24 32 48 101 16 71 8 1068
Surrounding land use (as recorded by regional councils)
Agriculture* 1 13 169 80 23 – 14 5 1 1 – 3 1 6 7 324 Dairy 6 11 – – 41 – 29 – – – 5 – – – – 92 Forestry – – – – 4 – – – – – – – – – – 4 Horticultural 8 24 – – 24 6 13 2 9 3 9 4 9 – – 111 Industrial 1 – 15 – – – 4 – – – – – – – – 20 Park/reserve 1 4 7 – 3 – 4 – – – 1 – – – – 20 Urban 7 6 88 4 22 – 7 1 3 – 33 – – – 1 172 Unknown – 3 – 2 – 74 – 42 11 28 – 94 6 65 – 325
Surrounding land cover (Land Cover Database)
Afforested – – – – – – – – – 1 2 – – – – 3 Built-up area 5 2 22 – 9 1 9 3 2 1 7 1 1 – – 63 Coastal gravel – – 1 – – – – – – – – – – – – 1 Cropland 7 – 49 2 9 14 1 3 2 – – 8 1 – – 96 Decid wood – 1 4 – – – – – – – – 2 – – – 7 Exotic forest – 1 1 – 3 – – – – – – 3 – – – 8 Freshwater veg – – 1 – – – – – – – 1 – – – – 2 Gorse/broom – – – – – – 1 – – – – – – – – 1 Grassland 11 39 182 82 84 37 56 29 8 28 24 82 9 67 7 745 Indigen forest 1 2 – – 2 – 2 – – – 5 – – 1 1 14 Lake and pond – – – – 2 – – – – – – – – – – 2 Manuka/kanuka – 1 – – 1 – – – – – 5 – – – – 7 Orchard – 7 2 – 3 9 1 9 – – 3 4 5 – – 43 Pine forest – 3 6 – 2 – – 1 – 1 – – – 3 – 16 River gravel – – 1 – – – – – – – – – – – – 1 Saline veg – – – – – – – – 1 – 1 – – – – 2 Shelterbelts – 2 – – – – – – – 1 – – – – – 3 Surface mine – – 2 – – – – – – – – – – – – 2 Urban parkland – 4 6 2 1 3 – 2 2 – – 1 – – – 21 Vineyard – – 2 – – 16 1 3 9 – – – – – – 31
* The agriculture category includes drystock and various mixed rural land uses (may also include some dairying). Across the 16 databases considered in this study, more than 500 different names are used for analytical parameters (see Spreadsheet 2). To facilitate a national assessment of groundwater quality, analytical results from the different databases were condensed into 33 parameter categories (see Table 4), by comparing parameter names and considering ancillary information related to sampling and analytical methods. (This operation assumes that analytical results from different laboratories are directly comparable, even though for some parameters different laboratories might employ different analytical procedures.)
4 Groundwater Quality in New Zealand: State and Trends 1995–2006

This data compilation also involved combining results relating to:
1. “dissolved” and “total” concentrations specific to a particular major, minor or trace element
2. “field” and “lab” measurements of pH, conductivity, etc
3. various microbiological parameters. Note that dissolved versus total and field versus lab results are not directly comparable for many parameters (on a site-specific basis). Thus tests to compare separate analyses of dissolved” versus total concentrations and field” versus lab measurements were conducted as part of this investigation (results not compiled). These tests indicated that in most cases the combination analytical results, as described above, would not unduly bias the national-scale assessment of groundwater quality. Many of the parameter categories defined in this report are represented in the base suite of groundwater chemical determinands for routine SOE monitoring, recently developed by the Regional Groundwater Forum (Environment Waikato, 2006). The base suite includes major cations and anions, nitrate and ammoniacal nitrogen, dissolved iron and manganese, pH, electrical conductivity, and calculated total dissolved solids (TDS), all of which are among the parameter categories considered in this report (see Table 4). The base suite also includes the trace elements boron and arsenic, which it suggests should be measured on at least two occasions and then at regular intervals afterwards if concentrations are greater than 50% of the relevant drinking-water guideline value. Most other trace elements considered in this report are not included in the base suite because they are usually derived from corroded pipework rather than from the aquifer itself.
Groundwater Quality in New Zealand: State and Trends 1995–2006 5

Table 4: Parameter category names and units, and the abbreviations used for the remainder of this report (see also Spreadsheet 2)
Class Abbreviation Units Parameter category name
Ca* mg/L Calcium
Cl* mg/L Chloride
HCO3* mg/L Bicarbonatea
K* mg/L Potassium
Mg* mg/L Magnesium
Na* mg/L Sodium
NO3-N* mg/L Nitrate
SiO2 mg/L Silica
SO4* mg/L Sulphate
TDS mg/L Total dissolved solidsb
Major elements
Calc TDS* mg/L Calculated total dissolved solidsc
B** mg/L Boron
Br mg/L Bromide
F mg/L Fluoride
Fe* mg/L Iron
Li mg/L Lithium
Mn* mg/L Manganese
NH4-N* mg/L Ammonia
PO4-P mg/L Phosphate
Minor elements and microbial indicators
MaxMicro cfu/100 ml Maximum microbiological indicatord
Al mg/L Aluminium
As** mg/L Arsenic
Cd mg/L Cadmium
Cr mg/L Chromium
Cu mg/L Copper
Ni mg/L Nickel
NO2-N mg/L Nitrite
Pb mg/L Lead
Sn mg/L Tin
Trace elements
Zn mg/L Zinc
Cond.* uS/cm Electrical conductivity
pH* pH units pH
Othere
Temp. °C Temperature
* Parameters in the base suite that are recommended for regular SOE monitoring (Environment Waikato, 2006). ** Parameters in the base suite that are recommended for at least occasional SOE monitoring (Environment Waikato,
2006). a This category includes alkalinity results. b A laboratory measurement, or in some cases a field measurement made by linear regression to electrical
conductivity. TDS is not used extensively in this report because it is measured by few regional councils. c Calculated by summing the major and minor element concentrations (it can also be estimated from electrical
conductivity). d This category represents the maximum analytical result for E. coli, Enterococci, faecal coliforms, or total coliforms.
Note that E. coli is the only one of these parameters that is considered in the drinking-water standards (Ministry of Health, 2005); all other parameters are proxies for E. coli.
e “Other” parameter categories are not used extensively in the data analysis in this report, but they are compiled in Spreadsheets 1 and 3.
6 Groundwater Quality in New Zealand: State and Trends 1995–2006
Data analysis methods
An automated spreadsheet program (Daughney, 2005) was used to compute descriptive statistics for each of the 33 parameter categories defined above, based on methods described in detail elsewhere (Helsel and Cohn, 1988; Helsel and Hirsch, 1992; Daughney and Reeves, 2003, 2005, 2006). In all cases, outliers were identified (on a per-site and per-parameter basis) and excluded from subsequent calculations, and if fewer than three results were available for the parameter at the site in question, the calculations were not performed (no results tabulated). The statistics are compiled on a per-site and per-parameter basis in Spreadsheet 1, including:
• median, calculated using log-probability regression to deal with “censored” results (ie, those reported as being below some analytical detection limit)
• trend significance and magnitude, quantified using Sen’s slope estimator for all trends that are detectable with the Mann-Kendal test at the 95% confidence interval (positive numbers indicate increasing trends), or tabulated as “N” for non-significant trends.
The site-specific medians and trend magnitudes were then used to compute national-level statistics for each of the 33 parameter categories. For medians, this entailed determining:
1. the total number of sites for which a site-specific median had been calculated for the parameter in question
2. the percentage of sites at which the median value was “censored” and could only be listed as being less than some detection limit
3. the 5th, 25th, 50th, 75th and 95th percentiles
4. the maximum
5. the median absolute deviation (MAD). The MAD is a measure of the spread in the analytical results that is analogous to the standard deviation but less subject to biasing by extreme values (Helsel and Hirsch, 1992). Similar national-level statistics were calculated for trends, with the exception of the MAD, and the addition of the minimum and the percentage of sites at which a significant trend could be detected relative to the total number of sites at which a trend assessment could be performed. National-level statistics are compiled in Spreadsheet 3. The national-level statistics were then used for further analysis, with methods described below in relevant sections of this report.
• Hierarchical categorisation was used to assign each monitoring site to one of six categories based on current status of groundwater quality (section 2.1) and one of five categories based on trends in groundwater quality (section 3.1).
• Water quality standards were used as a benchmark for comparison to the calculated median values (section 2.2).
• The Kruskal-Wallis test was used to assess the influence of various categorical factors (eg, aquifer lithology or confinement, surrounding land use, etc.) on calculated medians and trends (section 4). The Kruskal-Wallis test is similar to the more common t-test and analysis of variance (ANOVA), but it is non-parametric and so less biased by extreme values in the data set (Helsel and Hirsch, 1992).
Groundwater Quality in New Zealand: State and Trends 1995–2006 7

Data limitations
Representativeness of monitoring sites
Although this study involves the analysis of groundwater quality data from over 1,000 monitoring sites across the country, it is not clear whether or not these sites provide an accurate representation of groundwater quality in New Zealand. First, this is because many monitoring programmes target contaminated or at-risk regions or aquifers, and so the data set used in this study may lack sites in pristine areas to provide highly relevant baseline (background) groundwater quality data. Other monitoring programmes might specifically target aquifers that are important for water supply. For example, a large proportion of wells in Auckland’s SOE monitoring programme tap into deep confined aquifers used for water supply, and so groundwater quality issues in shallower groundwater systems, if they exist, would be difficult to detect in this investigation. Second, the source area (capture zone) of groundwater that reaches each monitoring site is usually not known. Thus monitoring sites must be displayed as points on maps, which makes groundwater quality hard to characterise at the scale of an aquifer, a region, or a nation with a limited amount of point data. A third difficulty is that most monitoring wells in New Zealand have fairly long screened or open intervals, which allow them to extract or pump water from several different flow lines within the aquifer. Any sample from such a well is therefore a composite from flow lines with potentially different ages and different groundwater quality. Little is known about the distribution of flow lines that reach monitoring wells in New Zealand, although it is likely to be site-specific and dependent on well construction and aquifer lithology. Without this information highly contaminated groundwater could go unnoticed if it represents only a small proportion of the composite sample extracted from the well, or if most of the water extracted from the well is old and pre-dates the contamination event.
Site details
Important information about some monitoring sites is either not known or could not be provided within the timeframe for this study. Thus 22% of monitoring sites have unknown aquifer lithology, 53% have unknown aquifer confinement and 30% have unknown surrounding land use (see Tables 2 and 3). Even for sites where this information was provided, it might be known with only limited confidence. Feedback provided by regional council personnel on a draft version of this report suggested that this is often the case with reported aquifer lithology and confinement. It is also very difficult to supply meaningful land-use information, because it is the land use in the capture zone at the time the groundwater was recharged that has the potential to influence current groundwater quality at any given monitoring site, but the capture zone and groundwater age are unknown for most monitoring sites in New Zealand.
8 Groundwater Quality in New Zealand: State and Trends 1995–2006

Interdependencies in the data set
The data set used in this investigation has some features that can cloud statistical interpretation. For example, well depth is statistically related to confinement: there are more shallow wells (less than 10 m) in unconfined than confined aquifers. This is to be expected, but it means that any statistically significant relationship between well depth and groundwater quality might in fact be determined by aquifer confinement. There are weak relationships between well depth and surrounding land use. When testing for the effect of land use on groundwater quality, it is therefore important to consider only the wells within a limited range of depths. There are also significant relationships between depth and aquifer lithology for the sites used in this study: wells in sand and gravel aquifers are shallower than wells in sandstone, ignimbrite or shellbed aquifers (well depths in other lithologies are intermediate between these two groups). Finally, the Chi-square test shows that aquifer lithology is statistically related to confinement. Specifically, for the sites considered in this study, sand, gravel and pumice aquifers are most likely to be unconfined, whereas basalt, greywacke, ignimbrite, lignite, limestone, sandstone and shellbed aquifers are most likely to be confined.
Coverage of parameters
The data set used in this investigation did not include some important groundwater quality parameters; for example, pesticide concentrations, which previous work has shown can be present at low but detectable levels in about 10% of shallow wells across the country (Close and Flintoft, 2004). This study also did not consider volatile organic compounds, petroleum hydrocarbons (eg, benzene, xylene), or other potentially important classes of organic contaminants (eg, pharmaceuticals, endocrine-disrupting compounds) simply because these are not routinely analysed in SOE groundwater monitoring programmes.
1.3 General chemical characteristics of groundwater
Before discussing the specific results from this study it is useful to understand the general chemical characteristics of groundwater. A global perspective on this subject is provided by Turekian (1977), Freeze and Cherry (1979), Hem (1985) and Langmuir (1997). In New Zealand, Daughney and Reeves (2005) have determined that groundwater chemistry is governed both by natural processes and by human influence. Natural processes are reflected primarily by changes in total dissolved solids (TDS), cation and anion ratios (ie, water type), and redox state (ie, oxidation−reduction potential). In New Zealand, human influence (including the effects of agricultural activities) is usually indicated by above-background concentrations of NO3-N.
Groundwater Quality in New Zealand: State and Trends 1995–2006 9

Total dissolved solids
Natural changes in TDS can in some cases be used as a proxy for groundwater source and age. Rainwater is dilute, with TDS around 10 mg/L. Reaction between rainwater and rock results in an increase in TDS, with the global average for rivers being around 120 mg/L (Langmuir, 1997). Groundwater that has been recently recharged from a river may have a similar TDS, especially near the recharge zone. In comparison, recently recharged groundwater that is sourced primarily from rainfall typically has slightly higher TDS (around 160 mg/L), due to the accumulation of salts during passage through the soil zone. The TDS of groundwater increases with time and distance along the flow path (the global average TDS for groundwater is 350 mg/L; Langmuir, 1997) due to prolonged contact with aquifer minerals and lack of dilution by rainfall. It is not uncommon for older and/or more chemically evolved groundwater to have TDS well over 1,000 mg/L. In some coastal aquifers, high TDS is an indication of saltwater intrusion (for comparison, seawater has TDS of 34,500 mg/L).
Major cation and anion ratios
Natural changes in the concentration ratios of major cations and anions (ie, water type) can also be used to infer the origin and extent of evolution of a particular groundwater (Freeze and Cherry, 1979; Langmuir, 1997). Rainwater usually has Na as the dominant cation and Cl as the dominant anion, because its composition is governed primarily by equilibration with salt aerosols of marine origin. In contrast, river waters usually have Ca as the dominant cation and HCO3 as the dominant anion. The shift from Na-Cl to Ca-HCO3 dominance is caused by the rainwater reacting with carbonate minerals. Carbonates are common, they dissolve rapidly relative to other minerals, and as little as 1% carbonate in a rock will dominate the chemistry of the solution during water−rock interaction. Groundwater that has been recently recharged from a river will often retain Ca and HCO3 as the dominant cation and anion, respectively. Groundwater that has been recently recharged from rain will often be a Ca-Na-HCO3-Cl type, due to the accumulation of Na and Cl during passage through the soil zone. As a groundwater ages, there is often a gradual transition from Ca to Na as the dominant cation, and from HCO3 to SO4 to Cl as the dominant anion, due to the dissolution of silicate minerals (a slow process) and sulphate- and chloride-bearing minerals (which are quite rare).
Redox state
Natural changes in redox state (ie, oxidation−reduction potential, or EH) control the form and behaviour of many elements (Langmuir, 1997). Recently recharged groundwaters are usually (but not always) oxygen-rich (ie, oxidised) due to contact with the atmosphere. In contrast, it is common (but not universal) for more evolved groundwaters to be oxygen-poor (ie, reduced), due to natural processes of microbial respiration which deplete oxygen. Oxidised groundwater can contain NO3-N, but would not contain significant concentrations of any elements or compounds that only accumulate in groundwater in their reduced forms, such as Fe, Mn, As or NH4-N. Conversely, a reduced groundwater might contain significant concentrations of Fe, Mn, As and/or NH4-N, but would not contain NO3-N. In highly reduced groundwaters SO4 is also usually absent and methane can accumulate.
10 Groundwater Quality in New Zealand: State and Trends 1995–2006
Human influence
In New Zealand, human influence on groundwater quality is usually indicated by relatively high concentrations of NO3-N, sometimes also with relatively high concentrations of K, SO4 and/or Cl (Daughney and Reeves, 2005). It is certainly possible that human influence can give rise to other types of groundwater quality degradation (eg, contamination by petroleum hydrocarbons or heavy metals), but these are not typically detected in SOE monitoring programmes in New Zealand and so are not discussed in this report. Note that as described above, elevated NO3-N concentrations arising from human influence would only accumulate in an oxidised groundwater; under reducing conditions the NO3-N is removed by microbial respiration (denitrification).
Groundwater Quality in New Zealand: State and Trends 1995–2006 11

2 Groundwater quality status 1995–2006
2.1 Categorisation of monitoring sites based on groundwater quality status
Daughney and Reeves (2005) developed a hierarchical classification scheme for the NGMP in order to simplify the interpretation of groundwater quality data at the national and regional scale (see Figure 1). This classification scheme assigns each monitoring site to a category and sub-category on the basis of measured concentrations of 15 water quality parameters (see Table 5). Each site is assigned to one of two main categories, where category 1 includes all oxidised (oxygen-rich) groundwaters and category 2 includes all reduced (oxygen-poor) groundwaters. At the second level of classification, category 1 is divided into two subcategories. Subcategory 1A includes all oxidised groundwaters that show evidence of human influence in the form of elevated NO3-N, K, SO4 and/or Cl, whereas subcategory 1B represents oxidised groundwaters that show little or no such impact. Note that human activities can influence groundwater chemistry in other ways (aside from the elevation of NO3-N), some of which might occur in reduced groundwater. However, any other styles of human influence are not evident in the NGMP data set and therefore are not accounted for in the categorisation scheme developed by Daughney and Reeves (2005). Note also that subcategory 1B groundwaters may be recharged primarily from rivers, whereas subcategory 1A groundwaters may have a higher proportion of recharge from rain (which allows accumulation of salts and NO3-N during passage through the soil zone). Categorical assignments are based only on groundwater chemistry and do not specifically consider factors such as well depth, aquifer confinement or lithology. However, Daughney and Reeves (2005) showed that these factors are usually related to the categorical assignments. For example, at the third level of classification, six subcategories are defined. These subcategories reflect differences in water type in subcategories 1A and 1B, possibly associated with aquifers of different lithology, and differences in extent of reduction in category 2, possibly associated with degree of aquifer confinement.
12 Groundwater Quality in New Zealand: State and Trends 1995–2006

Figure 1: General characteristics of status-based groundwater quality categories defined by Daughney and Reeves (2005)
Category 1
Oxidised groundwater, usually in an unconfined aquifer. Low to moderate TDS.
Potential for elevated concentrations of NO3-N, but low risk for elevated Fe, Mn, As or NH4-N.
Category 2
Reduced (oxygen-poor) groundwater, usually in a confined aquifer. Moderate to high TDS.
Potential for elevated concentrations of Fe, Mn, As and/or NH4-N, but low risk for elevated NO3-N
Subcategory 1A
Signs of human influence in the form of elevated concentrations of NO3-N, K, Cl and/or SO4
Subcategory 1B
Little evidence of human influence, with usually low concentrations of NO3-N, K, Cl and/or SO4
Subcategory 1A-1
Moderate human influence. Water chemistry suggests water-rock interaction in a carbonate or sand/gravel aquifer.
Subcategory 1A-2
Most human influence. Water chemistry suggests water-rock interaction in a volcanic or volcaniclasticaquifer.
Subcategory 1B-1
Water chemistry suggests water-rock interaction in a carbonate or sand/gravel aquifer.
Subcategory 1B-2
Water chemistry suggests water-rock interaction in a volcanic or volcaniclastic aquifer.
Subcategory 2A
Moderately reduced, majority in unconfined aquifers. High TDS.
Subcategory 2B
Highly reduced, majority in confined aquifers. Highest TDS.
One major limitation of this classification scheme is that it does not include a category for groundwater with marine character (eg, high salinity), simply because the NGMP includes few coastal monitoring sites that are influenced by salt water intrusion. The development of a new national scale classification scheme is beyond the scope of this investigation, and so due to the lack of a dedicated category, groundwaters with low, moderate, high and very high marine chemical signature are assigned to subcategories 1A-1, 1A-2, 2A and 2B, respectively. In the following discussion we identify cases where this limitation might be important. Despite any limitations, the hierarchical classification scheme provides a useful way of summarising the status of groundwater quality across New Zealand. Table 6 lists the total number of monitoring sites that could be categorised as part of this investigation, and the percentage that fall into each groundwater quality category (site-specific categorical assignments are given in Spreadsheet 1). In some regions, such as the West Coast and Taranaki, relatively few SOE monitoring sites could be categorised, and so the conclusions made below may not apply to the region as a whole. Figures 2 and 3 display the site-specific categorical assignments in map form, to clearly highlight important regional differences in groundwater quality. As stated above, the categorical assignments are based only on groundwater quality and do not specifically account for factors such as well depth or aquifer confinement. However, there are logical relationships between these factors and groundwater quality categories (see section 4).
Groundwater Quality in New Zealand: State and Trends 1995–2006 13

Table 5: Parameters used to assign monitoring sites to the status-based groundwater quality categories defined by Daughney and Reeves (2005), and their median concentrations in each category, based on the NGMP data set
Threshold 1 Threshold 2 Threshold 3 Parameter
1 2 1A 1B 1A-1 1A-2 1B-1 1B-2 2A 2B
Br 0.05 0.11 0.08 0.02 0.07 0.1 0.02 0.04 0.07 0.2 Ca 13.2 36.5 14.6 11.7 15.5 13.1 18.7 6.4 26 57.6 Cl 10.4 27 19.5 4.5 16.9 24.7 3.1 7.3 18 46.3 F 0.05 0.16 0.05 0.06 0.07 0.03 0.07 0.04 0.13 0.21 Fe 0.01 0.47 0.01 0.02 0.01 0.02 0.01 0.02 0.22 1.25 HCO3 57.2 216.8 62.1 51.3 69.7 51.3 70.6 34.2 153 345 K 1.55 3.5 1.86 1.22 1.36 3.1 1.06 1.46 2.36 5.91 Mg 4.6 9.6 7.4 2.5 7.1 7.8 2.7 2.3 7.5 13.3 Mn 0 0.15 0 0 0.01 0 0 0 0.07 0.44 Na 11.5 38 17.4 6.7 15.6 20.8 5.6 8.4 26.8 60.3 NH4-N 0.01 4.1 0.01 0.01 0.01 0.01 0 0.02 0.15 0.92 NO3-N 1.36 0.01 2.32 0.67 1.51 4.68 0.62 0.73 0.02 0 PO4-P 0.01 0.04 0.01 0.01 0 0.02 0 0.02 0.03 0.05 SiO2 21.4 31.8 26.9 15.8 19.2 47 11.7 23 27.6 38.4 SO4 7.5 2.2 10.4 4.6 11.6 8.6 5.2 3.9 5.8 0.3 Calc TDS 128.9 370.4 162.5 99 158.6 181.4 119.4 87.7 269.3 581.5
Table 6: Percentage of SOE monitoring sites in each region assigned to each status-
based groundwater quality category, relative to the total number (n) of sites for which a categorical assignment could be made
Council 1A-1 1A-2 1B-1 1B-2 2A 2B
ARC 4.2% 20.8% 0.0% 4.2% 33.3% 37.5% EBOP* 1.9 11.5 0.0 38.5 26.9 21.2 ECAN 35.6 16.1 28.5 13.5 4.9 1.5 ES 14.0 53.5 2.3 18.6 7.0 4.7 EW 4.9 53.4 4.9 29.1 7.8 0.0 GDC 5.3 1.3 0.0 0.0 25.0 68.4 GWRC 10.0 24.3 1.4 24.3 18.6 21.4 HBRC 8.0 10.0 10.0 14.0 38.0 20.0 MDC 4.3 0.0 39.1 26.1 30.4 0.0 MWRC 3.2 16.1 0.0 16.1 29.0 35.5 NRC* 14.6 31.7 0.0 7.3 36.6 9.8 ORC 23.0 14.9 21.8 10.3 24.1 5.7 TDC* 43.8 25.0 12.5 0.0 18.8 0.0 TRC 0.0 14.3 0.0 14.3 28.6 42.9 WCRC 0.0 0.0 25.0 75.0 0.0 0.0
n 158 191 120 149 154 126 %n 17.6 21.2 13.4 16.6 17.1 14.0
* Regions in which categorical assignments may be biased by groundwater under marine influence.
14 Groundwater Quality in New Zealand: State and Trends 1995–2006

Figure 2: Assignment of North Island SOE monitoring sites to status-based groundwater quality categories
Note: see Appendix 1 for data sources pertaining to various map layers.
Groundwater Quality in New Zealand: State and Trends 1995–2006 15

Figure 3: Assignment of South Island SOE monitoring sites to status-based groundwater quality categories
Note: see Appendix 1 for data sources pertaining to various map layers.
16 Groundwater Quality in New Zealand: State and Trends 1995–2006
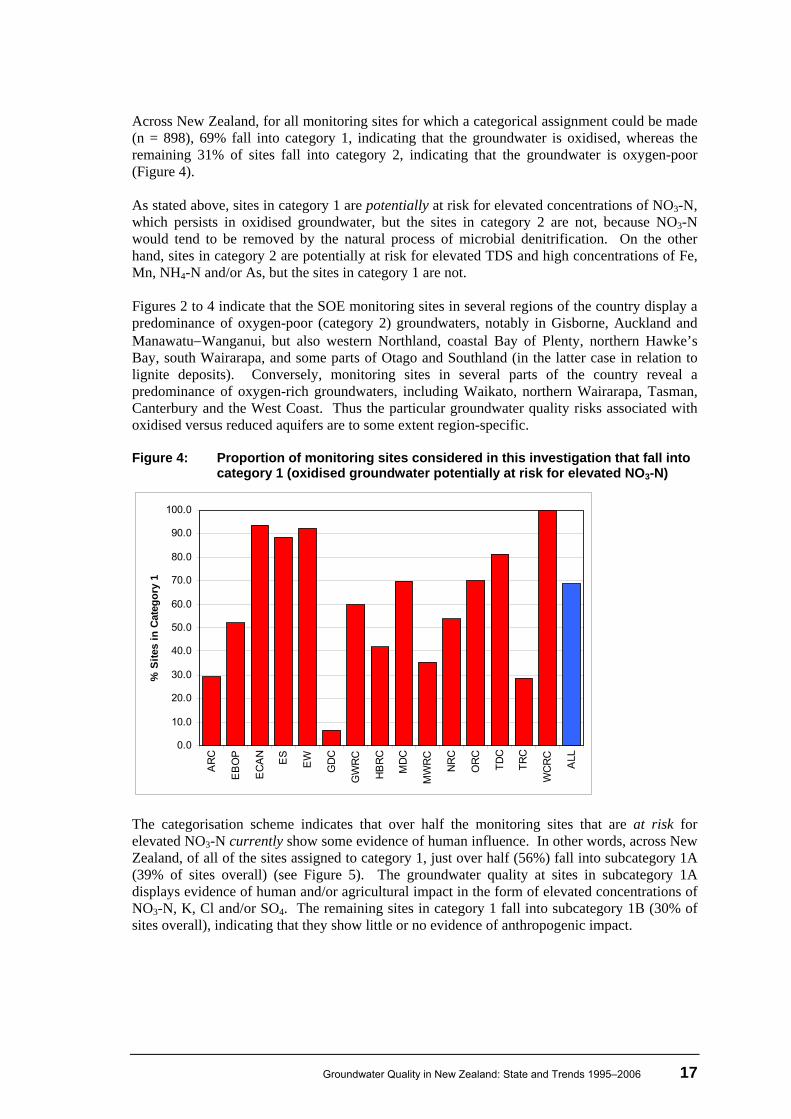
Across New Zealand, for all monitoring sites for which a categorical assignment could be made (n = 898), 69% fall into category 1, indicating that the groundwater is oxidised, whereas the remaining 31% of sites fall into category 2, indicating that the groundwater is oxygen-poor (Figure 4). As stated above, sites in category 1 are potentially at risk for elevated concentrations of NO3-N, which persists in oxidised groundwater, but the sites in category 2 are not, because NO3-N would tend to be removed by the natural process of microbial denitrification. On the other hand, sites in category 2 are potentially at risk for elevated TDS and high concentrations of Fe, Mn, NH4-N and/or As, but the sites in category 1 are not. Figures 2 to 4 indicate that the SOE monitoring sites in several regions of the country display a predominance of oxygen-poor (category 2) groundwaters, notably in Gisborne, Auckland and Manawatu−Wanganui, but also western Northland, coastal Bay of Plenty, northern Hawke’s Bay, south Wairarapa, and some parts of Otago and Southland (in the latter case in relation to lignite deposits). Conversely, monitoring sites in several parts of the country reveal a predominance of oxygen-rich groundwaters, including Waikato, northern Wairarapa, Tasman, Canterbury and the West Coast. Thus the particular groundwater quality risks associated with oxidised versus reduced aquifers are to some extent region-specific. Figure 4: Proportion of monitoring sites considered in this investigation that fall into
category 1 (oxidised groundwater potentially at risk for elevated NO3-N)
0.0
10.0
20.0
30.0
40.0
50.0
60.0
70.0
80.0
90.0
100.0
AR
C
EB
OP
EC
AN
ES
EW
GD
C
GW
RC
HB
RC
MD
C
MW
RC
NR
C
OR
C
TDC
TRC
WC
RC
ALL
% S
ites
in C
ateg
ory
1
The categorisation scheme indicates that over half the monitoring sites that are at risk for elevated NO3-N currently show some evidence of human influence. In other words, across New Zealand, of all of the sites assigned to category 1, just over half (56%) fall into subcategory 1A (39% of sites overall) (see Figure 5). The groundwater quality at sites in subcategory 1A displays evidence of human and/or agricultural impact in the form of elevated concentrations of NO3-N, K, Cl and/or SO4. The remaining sites in category 1 fall into subcategory 1B (30% of sites overall), indicating that they show little or no evidence of anthropogenic impact.
Groundwater Quality in New Zealand: State and Trends 1995–2006 17

Of SOE sites that are at risk of elevated NO3-N, the highest proportions that currently show human influence are found in Auckland (86%), Southland (76%) and Waikato (63%). Note that the categorisation scheme used here may mistakenly assign groundwater with marine character to subcategory 1A (see above), and so the proportions for regions such as Northland (86%), Tasman (85%) and the Bay of Plenty may be about 10% too high. The categorisation suggests that all of the oxidised groundwaters in Gisborne are already affected by human activity, but this conclusion is based on just five monitoring sites and so may not be representative of the region as a whole. The regions that show the lowest proportions of affected sites are West Coast (0%), Marlborough (6%) and Bay of Plenty (26%). Overall, of all sites that might potentially show human impact, this analysis shows that there are clear regional differences in the proportion of monitoring sites that currently show such impact (subcategory 1A) compared to those that do not (subcategory 1B). Figure 5: Proportion of category 1 monitoring sites considered in this investigation
that fall into subcategory 1A (oxidised groundwater that currently shows some level of human or agricultural impact)
0
10
20
30
40
50
60
70
80
90
100
AR
C
EB
OP
EC
AN
ES
EW
GD
C
GW
RC
HB
RC
MD
C
MW
RC
NR
C
OR
C
TDC
TRC
WC
RC
ALL
% C
ateg
ory
1 S
ites
in S
ub-C
ateg
ory
1A
The categorical assignments also reveal several variations in groundwater chemistry within individual regions (see Figures 2 and 3). Some examples of the more significant sub-regional scale variations in groundwater chemistry, and hydrogeological explanations for them, are as follows.
Auckland
Many of the SOE monitoring sites in the central and northern parts of the Auckland region tap deep confined aquifers (Crowcroft and Smaill, 2001). These aquifers contain highly reduced groundwaters that are assigned to category 2. On the other hand, some monitoring sites in central and southern parts of the Auckland region tap shallower unconfined basalt aquifers. These aquifers often contain oxidised groundwaters assigned to category 1.
18 Groundwater Quality in New Zealand: State and Trends 1995–2006

Manawatu–Wanganui
Little information is available about the confinement and lithology of aquifers in this region, but there are clear differences in groundwater quality in the central−northern and southern (Horowhenua) parts of this region (Bekesi and McConchie, 1999; Taylor et al, 2001). The fact that the former are almost all assigned to category 2 and the latter are in category 1 suggests a major difference in hydrogeological environment.
Wellington
Monitoring sites in the Wellington region are either on the Kapiti Coast, in the Hutt Valley, or in the Wairarapa, and because these aquifer systems are distinct they all have distinct groundwater quality (Morgan and Hughes, 2001). The Kapiti Coast aquifers are generally oxidised, and so most monitoring sites are assigned to category 1. The Hutt Valley aquifers are characterised by a progressive decrease in redox potential along the flow path (Downes, 1985), and so monitoring sites near the recharge zone are oxidised (category 1), whereas those further down-gradient are more reduced (category 2). There is a similar gradation in redox potential along the major groundwater flow path in the Wairarapa (Morgenstern, 2005), and so monitoring sites in the northern Wairarapa are usually assigned to category 1, whereas those further south are assigned to category 2.
Marlborough
Many of the monitoring sites in the Marlborough region tap into the gravel aquifers of the Wairau Plains. There is a distinct gradation in groundwater quality across the Wairau Valley, such that groundwater close to the river has chemistry essentially the same as the river itself (category 1B) and groundwater further away shows more evidence of rainfall recharge and the accompanying accumulation of salts and NO3-N (category 1A). There is also a gradation in groundwater chemistry parallel to the axis of the Wairau Valley, with groundwater in deep coastal wells usually being more reduced. The southern valleys also tend to contain clay-bound aquifers with slow-moving groundwater, and so many monitoring sites in this part of the region fall into category 2.
Canterbury
The gravel aquifers of this region have been described extensively elsewhere (see Brown, 2001). Unlike many gravel aquifers in New Zealand, the groundwater in the Canterbury aquifer system generally remains oxidised even after many years and significant travel distance along the flow path, and so most monitoring sites in the region are assigned to category 1. Groundwater recharge from rivers is important in many areas of the Canterbury Plains, which explains the dominance of subcategory 1B sites near rivers (similar to the Wairau Plains in Marlborough).
Groundwater Quality in New Zealand: State and Trends 1995–2006 19

Some distance away from the rivers, a greater proportion of groundwater recharge comes from rain. During passage through the soil zone this recharge water accumulates salts and NO3-N. Thus many of the monitoring sites in between the major rivers show more evidence of human or agricultural impact and are assigned to category 1A. The region around Oamaru is characterised by limestone aquifer systems with distinctive groundwater chemistry.
2.2 Quantification of groundwater quality status at the national scale
The categorisation scheme described above provides an overview of groundwater quality in New Zealand, but it does not quantify the magnitude of any specific groundwater quality issues. For example, the categorical analysis indicates that over one-third of the monitoring sites considered in this investigation currently show evidence of human influence. But how severe is this influence for each of the parameters of concern? This information can be provided by national medians and percentiles. In this investigation the calculated percentiles are compared to two water-quality guidelines: the Drinking-water Standards for New Zealand (DWSNZ) (Ministry of Health, 2005) and the Australia and New Zealand Environment Conservation Council (ANZECC) guidelines for fresh and marine water quality (Australia and New Zealand Environment Conservation Council, 2000). The DWSNZ defines health-related maximum allowable values (MAVs) and aesthetic guideline values (GVs) related to taste, odour or colour. The ANZECC guidelines define trigger values (TVs) based on specified protection levels for aquatic ecosystems. This study uses TVs that correspond to the 95% protection level for freshwater ecosystems. The ANZECC guidelines also define TVs for stock drinking-water, which are referred to in some sections of this report. Comparisons to both water-quality standards are performed on a per-parameter basis, to determine the number and percentage of monitoring sites at which calculated medians exceed the relevant MAVs, GVs or TVs. National medians for most parameters (see Table 7) are very similar to previously reported values across the NGMP (Daughney and Reeves, 2005). National medians for major elements are intermediate between the global average for river water and the global average for groundwater (Turekian, 1977; Hem, 1985; Langmuir, 1997), often being closer to the former (see Figure 6).
20 Groundwater Quality in New Zealand: State and Trends 1995–2006

Table 7: Calculated national percentiles and maximum values for groundwater quality parameters, with global average concentrations for river water and groundwater given for comparison
New Zealand groundwater (this study) Global averagesa
Percentiles
Parameter
nb
5th 25th 50th 75th 95th
Max River water
Ground water
Ca 899 3.9 9.6 15.5 30.0 128.4 363.4 15 50
Cl 917 2.8 7.3 15.3 30.1 141.8 1855.0 7.8 20
HCO3 907 20.0 40.0 62.7 144.6 571.8 1476.0 58 200
K 892 0.7 1.0 1.6 3.7 8.9 37.3 2.3 3
Mg 902 0.2 2.6 4.6 8.5 25.9 115.9 4.1 7
Na 908 4.6 9.4 15.0 29.6 117.0 800.0 6.3 30
NO3-N 956 0.0 0.0 1.3 4.4 11.2 33.0
SiO2 563 8.4 13.5 17.0 29.5 79.9 137.0 14 16
SO4 898 0.1 3.0 6.5 13.0 44.0 180.5 3.7 30
Maj
or
Calc TDSc 868 63.8 103.7 148.9 288.3 950.0 2959.8 120 350
B 281 0.01 0.02 0.02 0.05 0.38 12.90
Br 206 0.01 0.03 0.08 0.18 0.57 4.51
F 279 0.03 0.06 0.10 0.18 0.56 4.30
Fe 863 0.00 0.01 0.03 0.23 5.49 69.60 0.05 0.7
Li 74 0.00 0.01 0.01 0.04 0.50 1.79
Mn 798 0.00 0.00 0.01 0.24 3.62 14.00 < 0.01 0.03
NH4-N 924 0.00 0.00 0.01 0.06 2.45 18.30
PO4-P 508 0.00 0.01 0.02 0.07 0.57 5.13
Min
or o
r bio
logi
cal
MaxMicro 520 0.02 0.02 0.02 0.02 2.0 385.5
Al 147 0.0012 0.0040 0.0047 0.0063 0.1184 0.6650
As 157 0.0000 0.0000 0.0005 0.0044 0.0239 0.2640
Cd 86 0.0000 0.0000 0.0000 0.0000 0.0000 0.0004
Cr 107 0.0000 0.0000 0.0000 0.0001 0.0010 0.0060
Cu 240 0.0000 0.0000 0.0000 0.0003 0.0075 0.0335
Ni 78 0.0003 0.0004 0.0005 0.0008 0.0011 0.0060
NO2-N 291 0.0004 0.0005 0.0007 0.0014 0.0100 1.3000
Pb 169 0.0000 0.0000 0.0000 0.0002 0.0017 0.0500
Sn 57 0.0038 0.0065 0.0090 0.0210 0.1300 15.200
Trac
e
Zn 309 0.0011 0.0020 0.0070 0.0225 0.1280 0.9565
Cond. 960 88.5 144.8 210.0 371.1 1111.0 27300
pH 952 5.9 6.4 6.8 7.2 7.9 945.0
Oth
er
Temp. 866 10.8 12.1 13.3 15.1 18.3 63.5
Note: All values in mg/L except MaxMicro (cfu/100 ml), Cond (μS/cm), pH (pH units) and Temp (°C). a After Turekian (1977), Hem (1985) and Langmuir (1997). b Total number of sites for which statistics could be calculated (ie, parameter had been measured at least three
times). c Similar percentiles are obtained for measured TDS, but statistics are based on fewer measurements and so are not
tabulated here.
Groundwater Quality in New Zealand: State and Trends 1995–2006 21
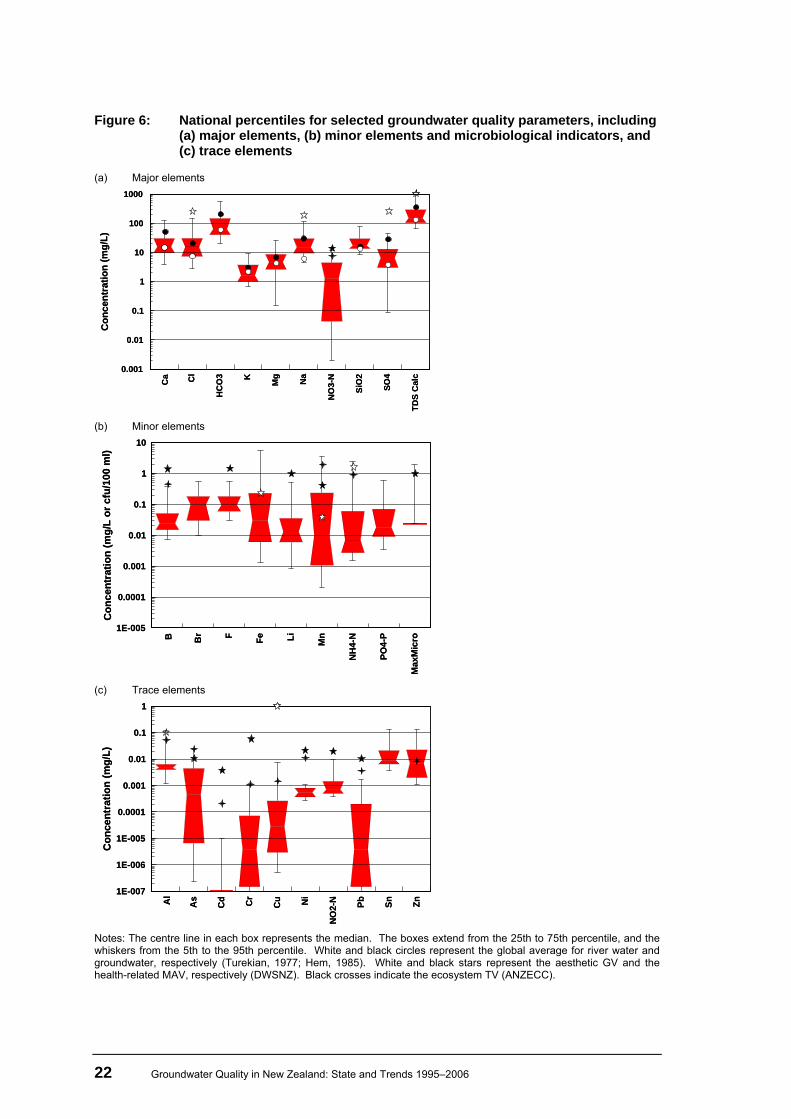
Figure 6: National percentiles for selected groundwater quality parameters, including (a) major elements, (b) minor elements and microbiological indicators, and (c) trace elements
(a) Major elements C
a Cl
HC
O3 K
Mg Na
NO
3-N
SiO
2
SO4
TDS
Cal
c
0.001
0.01
0.1
1
10
100
1000
Con
cent
ratio
n (m
g/L)
Ca Cl
HC
O3 K
Mg Na
NO
3-N
SiO
2
SO4
TDS
Cal
c
0.001
0.01
0.1
1
10
100
1000
Con
cent
ratio
n (m
g/L)
(b) Minor elements
B Br F Fe Li Mn
NH
4-N
PO4-
P
Max
Mic
ro
1E-005
0.0001
0.001
0.01
0.1
1
10
Con
cent
ratio
n (m
g/L
or c
fu/1
00 m
l)
B Br F Fe Li Mn
NH
4-N
PO4-
P
Max
Mic
ro
1E-005
0.0001
0.001
0.01
0.1
1
10
Con
cent
ratio
n (m
g/L
or c
fu/1
00 m
l)
(c) Trace elements
Al
As
Cd Cr
Cu Ni
NO
2-N Pb Sn Zn
1E-007
1E-006
1E-005
0.0001
0.001
0.01
0.1
1
Con
cent
ratio
n (m
g/L)
Al
As
Cd Cr
Cu Ni
NO
2-N Pb Sn Zn
1E-007
1E-006
1E-005
0.0001
0.001
0.01
0.1
1
Con
cent
ratio
n (m
g/L)
Notes: The centre line in each box represents the median. The boxes extend from the 25th to 75th percentile, and the whiskers from the 5th to the 95th percentile. White and black circles represent the global average for river water and groundwater, respectively (Turekian, 1977; Hem, 1985). White and black stars represent the aesthetic GV and the health-related MAV, respectively (DWSNZ). Black crosses indicate the ecosystem TV (ANZECC).
22 Groundwater Quality in New Zealand: State and Trends 1995–2006

The percentage of sites that exceed a threshold MAV, GV or TV is shown in Table 8. This analysis indicates that there are only a few nationally significant groundwater quality issues, including NO3-N, Fe and Mn, microbiological parameters and salinity, as discussed below. Table 8: Percentage of monitoring sites at which median concentrations exceed
water-quality guidelines
DWSNZ ANZECC Parameter Units
Reason MAV or GV %Sites exceedinga
TV %Sites exceedinga
Ca mg/L N/A – – – – Cl mg/L Aesthetic 250 2.5 – – HCO3 mg/L N/A – – – – K mg/L N/A – – – – Mg mg/L N/A – – – – Na mg/L Aesthetic 200 1.9 – – NO3-N mg/L Health 11.3 4.9 7.2 10.3 SiO2 mg/L N/A – – – – SO4 mg/L Aesthetic 250 0.0 – –
Maj
or
Calc TDSb mg/L Aesthetic 1000 4.3 – –
B mg/L Health 1.4 3.2 0.37 5.7 Br mg/L N/A – – – – F mg/L Health 1.5 1.1 – – Fe mg/L Aesthetic 0.2 26.5 – – Li mg/L Health 1.0 1.4 – –
Aesthetic 0.04 32.7 Mn mg/L Health 0.4 14.9
1.9 2.0
NH4-N mg/L Aesthetic 1.5 7.1 0.9 9.5 PO4-P mg/L N/A – – 0.01 68.9
Min
or o
r bio
logi
cal
MaxMicroc cfu/100 ml Health 1 19.6 100d 1.9d
Al mg/L Aesthetic 0.1 6.1 0.055 2.4 As mg/L Health 0.01 10.2 0.024 2.5 Cd mg/L Health 0.004 0.0 0.0002 1.2 Cr mg/L Health 0.05 0.0 0.001 5.0 Cu mg/L Aesthetic 1 0.0 0.0014 3.1 Ni mg/L Health 0.02 0.0 0.011 1.0 NO2-N mg/L Health 0.2 0.7 – – Pb mg/L Health 0.01 2.4 0.0034 0.4 Sn mg/L N/A – – – –
Trac
e
Zn mg/L Aesthetic 1.5 0.0 0.008 20.4
Cond uS/cm N/A – – – – pH pH units Aesthetic 7.0–8.5 65.7 – –
Oth
er
Temp °C N/A – – – – a Percentage of monitoring sites at which median exceeds the water-quality standard, relative to the total number of
sites for which a median could be calculated for the parameter in question. b Similar percentiles are obtained for measured TDS, but statistics are based on fewer measurements and so are not
tabulated here. c MaxMicro represents the maximum analytical result for E. coli, Enterococci, faecal coliforms, or total coliforms. Note
that E. coli is the only one of these parameters that is considered in the Drinking-water Standards (Ministry of Health, 2005); all other parameters are proxies for E. coli.
d Trigger value for stock drinking-water.
Groundwater Quality in New Zealand: State and Trends 1995–2006 23

Nitrate
From a groundwater quality perspective, NO3-N, with a national median concentration of 1.3 mg/L, is the compound of most concern. For comparison, previous studies have provided estimates of 0.3−1.0 mg/L for median NO3-N concentration in unaffected groundwaters in New Zealand (Burden, 1982; Morgenstern et al, 2004; Daughney and Reeves, 2005). Of the 956 sites at which a site-specific median could be calculated, 4.9% exceed the MAV based on the DWSNZ (11.3 mg/L), 10.3% exceed the TV for ecosystem protection based on the ANZECC guidelines (7.2 mg/L), and none exceed the ANZECC TV for stock drinking-water (400 mg/L). A previous study defined a threshold value of > 1.6 mg/L (about twice the estimated background, or around quarter of the TV) as a “probable” indicator of human influence (Daughney and Reeves, 2005). The same study defined a threshold of > 3.5 mg/L (about four times the estimated background, or around half the TV) as an “almost certain” indicator of human influence. Based on these threshold values, at 46% of all sites for which median NO3-N concentration could be determined, the evidence for human influence is “probable”, and at 31% of sites the evidence of human influence is “almost certain”. These percentages are comparable to the groundwater quality categorisation described in section 2.1, which indicated that 39% of the monitoring sites considered in this study currently show some level of human impact (category 1A). It is important to recognise that low concentrations of NO3-N do not necessarily correspond to pristine groundwaters (subcategory 1B), but may indicate reduced groundwaters (category 2) where NO3-N has been removed by microbial respiration. In other words, a low nitrate concentration doesn’t mean that groundwater isn’t polluted or never was polluted, but could instead indicate that all evidence of the pollution has been erased by natural microbial respiration. It is instructive to compare the national median nitrate concentration (1.3 mg/L, above) to the median nitrate concentration in only oxidised groundwater (ie, where nitrate would persist if present). For all monitoring sites in category 1 (1A-1, 1A-2, 1B-1, 1B-2), the 5th, 25th, 50th, 75th and 95th percentiles are 0.14, 0.85, 2.8, 5.7 and 12.5 mg/L for NO3-N, respectively (n = 611). The sites with elevated NO3-N concentrations are found in many regions of New Zealand, especially Waikato, southern Manawatu−Wanganui (Horowhenua), Canterbury and Southland (Appendix 1).
Iron and manganese
The calculated national medians for Fe and Mn are 0.03 and 0.01 mg/L, respectively, which is in good agreement with previously reported values (Rosen, 2001; Daughney, 2003; Daughney and Reeves, 2005). Elevated concentrations of dissolved Fe and/or Mn can impart an unpleasant taste to drinking-water and can lead to staining and clogging of pipes, and so the DWSNZ includes aesthetic GVs of 0.2 and 0.04 mg/L for Fe and Mn, respectively. Due to risks to human health and freshwater ecosystems, Mn has a MAV of 0.4 mg/L and a TV of 1.9 mg/L (there is no MAV or TV for Fe).
24 Groundwater Quality in New Zealand: State and Trends 1995–2006

Of the sites at which median concentrations could be determined, 27% exceeded the GVs for Fe and 33% for Mn, 15% exceeded the MAV for Mn, and 2% exceeded the TV for Mn. Note that the water-quality guidelines relate to dissolved concentrations of these elements; dissolved concentrations, especially for Fe, are often two to five times less than total concentrations (Daughney, 2003). Elevated concentrations of dissolved Fe and/or Mn generally arise from natural microbial respiration in oxygen-poor aquifers (category 2), which are found in many regions of New Zealand. Elevated total concentrations of Fe and/or Mn may be caused by this same process, but may also arise from corrosion of the well casing or reticulation system. Of the sites for which median dissolved Fe or Mn can be calculated, 16% and 31% exceeded the aesthetic GVs, respectively (data not shown). Groundwaters with high concentrations of Fe and/or Mn are found in many regions of New Zealand, especially Gisborne, Auckland and Manawatu−Wanganui, but also in western Northland, coastal Bay of Plenty, northern Hawke’s Bay, south Wairarapa, and some parts of Otago and Southland (see Appendix 1).
Microbiological parameters
The SOE groundwater monitoring programmes run by many regional councils include one or more microbiological indicator parameters. Of all sites considered in this investigation, a median value for at least one microbiological indicator could be determined at 520 sites (either E. coli, enterococci, faecal coliforms or total coliforms). The microbiological parameter with the highest median (MaxMicro) exceeds the health-related MAV (1 cfu/100 ml) at 20% of sites, and exceeds the ANZECC TV for stock drinking-water (100 cfu/100 ml) at 2% of sites. Note that the distribution of MaxMicro is heavily skewed: the majority of results at most sites are near or below the detection limit (1 cfu/100 ml), but occasionally a much higher result is reported. The rare elevated microbiological counts might reflect a flooding event at a site with poor well-head protection, or perhaps contamination during sampling. For comparison, previous regional surveys have reported exceedance levels of 9−60% (Sinton, 2001). Note also that E. coli is the only microbial indicator parameter that is actually considered in the New Zealand drinking-water standards. All other microbial parameters listed above are considered to be proxies for E. coli. For those regions that provided microbiological indicator data for this investigation, the greatest proportions of sites that exceed the MAV are found in Northland, Southland and Canterbury (Appendix 1).
Salinity
There are aesthetic GVs under the DWSNZ for Cl, Na, SO4 and TDS, but these guidelines are related to taste. High concentrations of these parameters (and high salinity in general) usually indicate that the groundwater is older and more chemically evolved (see section 1.3). High-salinity groundwaters are found in certain regions, notably Gisborne but also in northern Hawke’s Bay, central Manawatu, south Wairarapa, Auckland (especially deep aquifers), and south Canterbury around Oamaru (see Appendix 1). However, high salinity is not a pervasive issue in New Zealand aquifers: the relevant aesthetic GVs are exceeded at only 2−4% of all sites at which site-specific median values could be calculated for Cl, Na, SO4 and/or TDS. In some coastal aquifers high salinity arises from saltwater intrusion, which is a serious issue for groundwater resource management in regions such as Northland, Bay of Plenty and Horowhenua.
Groundwater Quality in New Zealand: State and Trends 1995–2006 25
Other parameters
There are several other groundwater quality issues that can arise in selected regions or aquifers, but they are not pervasive at the national scale.
Arsenic
Arsenic concentrations in New Zealand groundwater are typically less than the health-related MAV (0.01 mg/L). However, of all sites at which median arsenic concentrations could be determined (n = 157), 10% exceeded the MAV. The hydrochemical behaviour of arsenic is governed by the behaviour of Fe and SO4. As a result, arsenic is usually only present at significant concentrations in cases where the redox potential of the groundwater falls within a narrow range. In oxidised groundwaters Fe is insoluble, and the arsenic tends to be removed from solution via co-precipitation with Fe-oxide minerals. In slightly more reduced groundwaters, as Fe is solubilised by natural microbial respiration, arsenic is also released into solution. In highly reduced groundwaters SO4 is also removed by microbial respiration. This leads to the formation of sulphide, which tends to cause the removal of arsenic from solution through the precipitation of sulphide minerals.
Trace metals
Trace metals in New Zealand groundwater are generally present at low concentrations and thus do not pose a risk to human health. It is difficult to determine whether or not trace metal concentrations in groundwater pose a serious threat to ecosystem health. This is because, for many heavy metals, the ANZECC TV is near or below the detection limit of many analytical methods. Additional research with more sensitive sampling and analytical methods may be necessary to assess the threat that trace metals in groundwater pose for New Zealand’s aquatic ecosystems.
Ammonia
Of the 924 sites at which a site-specific median could be calculated for NH4-N, 7.1% exceeded the aesthetic GV of 1.5 mg/L and 9% exceeded the TV of 0.9 mg/L. Elevated concentrations of NH4-N are only found in oxygen-poor groundwaters (category 2) and so tend to co-occur with elevated Fe and Mn, but do not co-occur with elevated concentrations of NO3-N. As for Fe and Mn, elevated concentrations of NH4-N are confined to certain regions of the country, including Gisborne, Manawatu−Wanganui, Auckland and some parts of Hawke’s Bay.
Phosphate
The DWSNZ does not define a MAV or GV for PO4-P, and the ANZECC guidelines do not define a generic TV, but the latter standard includes a TV that is specific to “slightly disturbed” ecosystems in New Zealand (for upland and lowland rivers the TV is 0.009 and 0.01 mg/L, respectively). From a groundwater perspective, 0.01 mg/L represents a relatively low concentration of PO4-P, equivalent to the 25th percentile reported in this investigation (see Table 7). Thus it is possible that the discharge of phosphate-rich groundwater into a stream or river may pose a significant threat to its ecosystem, but the number of locations in New Zealand where this is presently occurring cannot be determined with the data used in this study.
26 Groundwater Quality in New Zealand: State and Trends 1995–2006

pH
The DWSNZ states that for aesthetic reasons pH should be between 7.0 and 8.5. Of all sites for which a median pH value could be determined (n = 952), 64.2% were less than 7.0 and 1.5% were above 8.5. The fact that the majority of New Zealand groundwaters have pH less than 7.0 is typical of the global situation, where most groundwaters have a pH between 6.5 and 7.5 (Langmuir, 1997). Although in some regions of New Zealand groundwater pH might be a problem for water supply, it should not be considered a pervasive environmental issue.
Groundwater Quality in New Zealand: State and Trends 1995–2006 27

3 Groundwater quality trends 1995–2006
3.1 Categorisation of monitoring sites based on trends in groundwater quality
Daughney and Reeves (2006) developed a classification scheme for the NGMP in order to simplify the interpretation of groundwater quality trends at the national scale (see Table 9). As for the classification scheme based on medians (see section 2.1), this classification scheme for trends was developed for the NGMP and has not been rigorously tested for its applicability to non-NGMP monitoring sites. Nonetheless, it provides a convenient means of summarising the patterns of change among several different groundwater quality parameters. Trend-based categorical assignments are based only on groundwater quality and do not specifically account for factors such as well depth or aquifer confinement (see section 4). Table 9: General characteristics of trend-based groundwater categories defined by
Daughney and Reeves (2006)
Category Characteristics Possible causes Comments
DIL (diluting)
Rapid decrease in Na, Ca, HCO3 and Cl over time
Change in pumping regime or hydrogeologic conditions; reduction of saltwater intrusion
• Usually category 2 (see Figure 2)
• Median depth 95 m
• No significant relationship to lithology, confinement or surrounding land use
DEG (degrading)
Increases in Ca, Cl, K, Mg, Na, NO3-N and/or SO4 over time
Increasing proportion of recharge from rainfall relative to river over time; increasing human or agricultural impact in recharge area
• Usually category 1 (see Figure 2)
• Median depth < 10 m
• Most in unconfined aquifers
• No significant relationship to lithology or surrounding land use
SiO2 Rapid increase in SiO2 without accompanying changes in other analytes at a similar rate
Unknown • Only one NGMP site falls into this category, so its significance at the national scale is questionable
IMP (improving)
Decreases in K, Mg and/or NO3-N over time, often with accompanying decreases in Ca, Na, Cl and/or SO4
Increasing proportion of recharge from rivers relative to rainfall over time; decreasing human or agricultural impact in recharge area
• Usually category 1 (see Figure 2)
• No significant relationship to depth
• No significant relationship to lithology, confinement or surrounding land use
WR (water−rock interaction)
No or only slow changes in most parameters over time
Natural water−rock interaction
• No relationship to water quality categories (see Figure 2)
• No significant relationship to depth
• No significant relationship to lithology, confinement or surrounding land use
28 Groundwater Quality in New Zealand: State and Trends 1995–2006

Across New Zealand, for all monitoring sites for which a trend-based categorical assignment could be made (n = 918), the majority (68%) fall into trend category WR, indicating that changes in groundwater quality are occurring slowly, if at all (see Table 10). The remaining sites are partitioned roughly equally into trend categories DIL, DEG, IMP and SiO2. Figures 7 and 8 display the trend-based categorical assignments in map form (site-specific trend category assignments are given in Spreadsheet 1). The regions with the proportions of monitoring sites assigned to trend category DIL are Northland (18%), Gisborne (14%) and the Bay of Plenty (12%), possibly due to changes in hydrogeological regime related to the pumping of coastal aquifers. The regions with the highest proportions of monitoring sites assigned to trend category DEG are Southland, Tasman and Waikato. Southland is also the region with the highest proportion of monitoring sites assigned to trend category IMP. This indicates that groundwater quality is improving over time in some parts of Southland and becoming worse in others. Note that Southland also shows proportionally high current levels of impact (status-based category 1A; see Table 6). This indicates that one of the regions in which groundwater is currently most affected is also a region in which groundwater quality is changing (improving or degrading) most rapidly over time. Some regions in which the current status of groundwater quality is quite good, such as the West Coast, also show an above-average proportion of monitoring sites in trend category DEG. Although this assessment is based on a small number of monitoring sites, it may indicate that one of New Zealand’s least affected regions may not remain that way for very long. Table 10: Percentage of monitoring sites assigned to each trend-based groundwater
quality category, and total number (n) and percentage (%n) of sites in each category overall
Council DIL DEG IMP SiO2 WR
ARC 4.2% 0.0% 4.2% 0.0% 91.7% EBOP* 12.3 7.0 15.8 1.8 63.2 ECAN 1.4 8.3 1.8 0.0 88.4 ES 0.0 28.9 40.0 8.9 22.2 EW 8.2 17.5 19.6 1.0 53.6 GDC 14.3 13.0 3.9 16.9 51.9 GWRC 2.8 7.0 23.9 1.4 64.8 HBRC 4.0 8.0 4.0 0.0 84.0 MDC 4.3 4.3 13.0 8.7 69.6 MWRC 3.2 9.7 12.9 3.2 71.0 NRC* 17.8 15.6 15.6 17.8 33.3 ORC 7.8 14.4 5.6 6.7 65.6 TDC* 6.3 25.0 6.3 0.0 62.5 TRC 0.0 14.3 0.0 14.3 71.4 WCRC 0.0 12.5 0.0 0.0 87.5
n 53 106 94 38 627 %n 5.8 11.5 10.2 4.1 68.3
* Regions in which categorical assignments may be biased by groundwater under marine influence.
Groundwater Quality in New Zealand: State and Trends 1995–2006 29

Figure 7: Assignment of North Island monitoring sites to trend-based groundwater quality categories
Note: see Appendix 1 for data sources relating to various map layers.
30 Groundwater Quality in New Zealand: State and Trends 1995–2006

Figure 8: Assignment of South Island monitoring sites to trend-based groundwater quality categories
Note: see Appendix 1 for data sources relating to various map layers.
Groundwater Quality in New Zealand: State and Trends 1995–2006 31

3.2 Quantification of groundwater quality trends at the national scale
For most of the 33 parameter categories defined in section 1.2, a significant increasing or decreasing trend is detectable at about 25% of the monitoring sites at which the trend assessments could be performed (see Table 11). Trend assessments for trace elements are not given in Table 11 because they are analysed at relatively few sites and many of the reported concentrations are near or below the detection limit. For the remaining parameters, when all monitoring sites are considered together as a single group the proportions of sites showing increasing and decreasing trends are the same to within about 10%, as observed in a previous study of the NGMP data (Daughney and Reeves, 2006). Previous studies in New Zealand and overseas have shown that for parameters such as Cl, K and NO3-N, the proportion of sites showing increasing trends can exceed the proportion of sites showing decreasing trends by more than 10%, presumably due to intensification of agricultural activity (Frappaporti et al, 1994; Daughney and Reeves, 2006). However, such patterns are not detectable in this investigation, even if the data set is limited to shallow wells (< 10 m deep). We acknowledge that for some specific sites the ability to detect trends for some parameters is limited by the low number of measurements made between 1995 and 2006. However, the general conclusions reached above are not altered if the analysis is limited to sites where the relevant parameter has been measured more than three times, more than five times, or more than 10 times. Table 11: Total number of monitoring sites at which trend assessments could be
performed (n), and percentages without significant trends (%N) or with significant increasing (%INCR) or significant decreasing (%DECR) trends
Parameter n %INCR %DECR %N
Ca 903 17.9% 8.5% 73.5% Cl 915 18.8 10.3 70.9 HCO3 941 20.2 10.6 69.2 K 895 11.6 7.6 80.8 Mg 889 13.0 13.4 73.6 Na 911 12.4 13.7 73.9 NO3-N 878 13.1 11.0 75.9 SiO2 564 4.4 4.4 91.1 SO4 852 20.5 11.0 68.4
Maj
or
TDS* 252 11.9 8.3 79.8
B 280 7.5 4.6 87.9 Br 175 8.6 14.3 77.1 F 258 5.0 5.4 89.5 Fe 643 6.8 23.5 69.7 Li 75 4.0 4.0 92.0 Mn 539 7.6 19.3 73.1 NH4-N 652 9.8 9.2 81.0 PO4-P 467 16.3 9.0 74.7
Min
or o
r bio
logi
cal
MaxMicro 297 7.1 3.0 89.9
Cond. 964 16.5 14.2 69.3 pH 952 13.8 10.4 75.8
Oth
er
Temp. 864 6.5 6.0 87.5
* All trend assessments use measured TDS instead of calculated TDS.
32 Groundwater Quality in New Zealand: State and Trends 1995–2006

In general, the rate of change in groundwater quality is slow, with national median values for absolute trend magnitude being less than 0.5 and 0.01 mg/L per year for most major and minor elements, respectively (Figure 9, Table 12). Compared to relevant median concentrations from Table 7, this equates to national median relative trend magnitudes of less than ±2% and ±5% per year for most major and minor elements considered in this study, respectively. Similar absolute and relative rates of change for major and minor elements have been reported for the NGMP (Daughney and Reeves, 2006). For comparison, a “purely arbitrary” cut-off of ±1% has recently been used to identify relative trends in river water quality that are both statistically significant and meaningful from an environmental management perspective (Scarsbrook, 2006). Further work is required to determine what threshold should be used to identify relative trends in groundwater quality that are important from a management perspective. Absolute rates of change are uncorrelated or only weakly correlated to median concentrations. For example, there is no relationship between the median concentration of NO3-N at a particular site and the rate at which NO3-N is changing over time. Trend assessments for NO3-N, Fe and Mn, microbiological parameters and salinity are discussed in more detail below due to their recognised importance as indicators of groundwater quality in New Zealand (see section 2.2). Table 12: National absolute and relative rates of change in groundwater quality
parameters (units per year)
Absolute trend (units per year) Parameter Units
Minimum Median Maximum
Relative median trend (%)*
Ca mg/L -25.47 0.27 10.54 1.7%
Cl mg/L -26.93 0.16 49.06 1.1
HCO3 mg/L -33.57 0.78 18.26 1.2
K mg/L -3.48 0.02 4.41 1.5
Mg mg/L -5.47 -0.02 2.96 -0.4
Na mg/L -69.00 -0.08 33.86 -0.5
NO3-N mg/L -1.96 0.03 2.91 0.2
SiO2 mg/L -2.72 0.01 3.73 -0.04
SO4 mg/L -3.36 0.14 11.98 2.2
Maj
or
TDS mg/L -24.94 2.62 37.60 1.8
B mg/L -0.025 0.001 0.164 5.3
Br mg/L -0.899 -0.003 0.263 -3.2
F mg/L -0.118 -0.002 0.014 -1.9
Fe mg/L -2.170 -0.006 3.401 -18.3
Li mg/L -0.001 0.000 0.004 -0.2
Mn mg/L -1.047 -0.002 1.864 -15.2
NH4-N mg/L -1.366 0.000 0.522 6.1
PO4-P mg/L -0.474 0.001 0.033 6.2
Min
or o
r bio
logi
cal
MaxMicro cfu/100 ml -13.56 0.68 391.96 –
Cond. uS/cm -149.0 1.48 159.3 0.7
pH pH units -0.40 0.01 0.35 0.3
Oth
er
Temp. °C -8.46 0.02 1.11 0.2
* Relative median rates of change (% per year) are calculated by dividing the median absolute trend magnitude by the relevant median concentration from Table 7.
Groundwater Quality in New Zealand: State and Trends 1995–2006 33

Figure 9: National percentiles for rates of change in groundwater quality parameters, including (a) major elements and (b) minor elements and microbiological indicators
a) Major elements C
a Cl
HC
O3 K
Mg Na
NO
3-N
SiO
2
SO4
TDS
-15
-10
-5
0
5
10
15
Rat
e of
Cha
nge
(mg/
L pe
r yea
r)
b) Minor elements and microbiological indicators
B Br F Fe Li Mn
NH
4-N
PO4-
P
Max
Mic
ro
-1
-0.5
0
0.5
1
Rat
e of
Cha
nge
(mg/
L pe
r yea
r or c
fu/1
00 m
l per
yea
r)
Notes: The centre line in each box represents the median absolute rate of change. The boxes extend from the 25th to 75th percentiles, and the whiskers extend from the 5th to the 95th percentiles.
Nitrate
Significant increasing trends in NO3-N concentration are detectable at around 13% of the monitoring sites considered in this investigation (see Table 11). Significant decreasing trends in NO3-N concentration are detectable at a roughly equivalent percentage of monitoring sites. In agreement with the trend-based categorisation, sites with detectable trends in NO3-N are found in all regions of the country (see Appendix 1), especially in Waikato and Southland, but also in regions such as the West Coast, where water quality is generally good, and Gisborne, where many groundwater systems are oxygen-poor and would not be expected to contain significant concentrations of NO3-N.
34 Groundwater Quality in New Zealand: State and Trends 1995–2006

Iron and manganese
Significant trends in Fe and/or Mn are detectable at about 30% of the monitoring sites at which trend calculations could be performed (see Table 11). The majority of these sites show decreasing trends in Fe and/or Mn over time, which is unusual compared to other parameters considered in this study (most of which show roughly equal proportions of increasing and decreasing trends). The disproportionately high number of sites with decreasing trends in Fe and/or Mn might be caused by improvements in sampling and analytical methods between 1995 and 2006. The statistical methods used for trend detection require the replacement of censored values with some fraction of the detection limit. If the majority of results at a particular site are below the detection limit, then the statistical tests could conclude that a decreasing trend is present if the detection limits have decreased over time (eg, due to the improvement of analytical methods). Improvements in sampling methodology could also lead to decreasing trends in Fe and/or Mn. Within the 11-year timeframe of this study, several regional councils started to field-filter samples for Fe and Mn analysis, whereas in the past a raw sample might have been collected for this purpose. Dissolved Fe and Mn concentrations in filtered samples are often many times less than total concentrations in raw samples, and so the change to collecting the former could lead to identification of decreasing temporal trends. It is also possible that human influence could cause the disproportionately high number of decreasing trends in Fe and/or Mn. This could arise, for example, by over-abstraction of groundwater near a stream, which could potentially lead to an increased proportion of oxidised surface water (with low Fe and Mn concentration) being drawn into an aquifer. It will be important to repeat these analyses again in a few years to identify the cause and significance of trends in Fe and Mn, ideally with more information on the source of the water being monitored.
Microbiological parameters
Trend assessments were performed using the microbiological parameter with the highest reported value for each sampling event at each site (MaxMicro). Under this approach, the microbiological indicators display an extremely wide range of trend magnitudes. The extreme values in calculated trends presumably arise because of a small number of analytical results that are substantially above background. Sporadically elevated microbial counts could be related to flooding events at sites with poor well-head protection or to contamination during sampling, making site-specific trend assessments for microbiological indicators difficult to interpret. However, national-level statistics can be interpreted, with caution. In this study, significant increasing and decreasing trends are detectable at about 7% and 3% of sites, respectively, and the median absolute rate of change is near zero. Similar results are obtained for most of the non-biological water quality parameters considered in this report. Overall it appears that microbial contamination of New Zealand’s aquifers is not worsening very dramatically over time, but this tentative conclusion should be re-tested by repeating a similar study in a few years.
Groundwater Quality in New Zealand: State and Trends 1995–2006 35
Salinity
Electrical conductivity is a useful measure of salinity and TDS. Significant increasing and decreasing trends in conductivity are detectable at roughly equal proportions of monitoring sites considered in this study (16.5% and 14.2%, respectively). Sites with increasing trends in conductivity are found in most areas of New Zealand, especially Waikato, Southland and Wellington. At some sites, especially those assigned to category 1 (oxidised), the trends in electrical conductivity are mirrored (in direction and relative magnitude) by trends in NO3-N. More research on these relationships may indicate that they can be used in combination as indicators of human influence.
36 Groundwater Quality in New Zealand: State and Trends 1995–2006
4 Groundwater quality status and trends in relation to controlling factors
The general controls on groundwater quality and its evolution over time are discussed above in section 1.3. In this section the aim is to identify and explain significant relationships between groundwater quality in New Zealand (status and trends) and factors of potential influence, such as well depth and aquifer characteristics (cf. Aller et al, 1987) or surrounding land use. Note that well depth and aquifer confinement must be assessed together because they are correlated: for the sites considered in this study, there is a statistically greater proportion of shallow wells (less than 10m deep) in unconfined than in confined aquifers (see section 1.2).
4.1 Well depth and aquifer confinement The Kruskal-Wallis test does not reveal any significant relationships between trend magnitudes and well depth or aquifer confinement for any of the parameters considered in this study. There are, however, significant (p < 0.05) relationships between the median values of four groundwater quality parameters and well depth and/or aquifer confinement.
1. Median NO3-N concentrations are higher for shallow wells in unconfined aquifers (Figure 10).
2. Microbiological indicator parameters are also higher in shallow wells in unconfined aquifers (Figure 11).
3. Median SiO2 concentrations are lower for shallow wells in unconfined aquifers (data not shown).
4. Median PO4-P concentrations are lower for shallow wells in unconfined aquifers (data not shown).
The first two relationships almost certainly arise from human influence. On the one hand, these relationships are to be expected, because unconfined aquifers are more susceptible to contamination, and proximity to the surface (the source of NO3-N and microbial pathogens) is obviously an important influence. However, it is important to stress that these relationships are not even remotely predictive, because it is clear from Figures 10 and 11 that deep wells in confined and semi-confined aquifers can also be susceptible to contamination by NO3-N and/or micro-organisms (which is probably why there is no significant relationship between the rates of change in these parameters and well depth or aquifer confinement). Cases of microbial contamination in deep wells or confined aquifers probably reflect poor well-head protection more than the susceptibility of a particular type of aquifer (Sinton, 2001). Cases of NO3-N contamination in deep wells or confined aquifers may also indicate poor well-head protection, but can arise in certain New Zealand aquifer systems where the groundwater tends to remain oxidised for a long distance along the flow path (eg, Canterbury), possibly due to a low concentrations of the organic matter required as the substrate for microbial denitrification (Langmuir, 1997).
Groundwater Quality in New Zealand: State and Trends 1995–2006 37

The third and fourth relationships probably reflect natural processes of water−rock interaction: SiO2 and PO4-P accumulate naturally in groundwaters due to the dissolution of minerals (Langmuir, 1997). The relationship might be biased to some degree by the fact that many of the wells in acidic volcanic aquifers considered in this investigation happen to be quite deep, and groundwaters in such lithologies typically have SiO2 and PO4-P concentrations two to three times higher than other rock types (section 4.2). Figure 10: Relationship between median NO3-N concentration, bore depth and aquifer
confinement
Bore Depth (m)
NO
3-N
(mg/
L)
Confined Semi-confinedUnconfined Unknown
1 10 100 10000.1
1
10
100
Figure 11: Relationship between the microbiological parameter with the highest
median (MaxMicro) and bore depth and aquifer confinement
Bore Depth (m)
Max
Mic
ro (c
fu/1
00 m
l) Confined Semi-confinedUnconfined Unknown
1 10 100 10000.1
1
10
100
1000
Note: points shown below 1 cfu/100 ml correspond to censored results below the analytical detection limit.
38 Groundwater Quality in New Zealand: State and Trends 1995–2006
4.2 Aquifer lithology There are no significant relationships between trend magnitudes and aquifer lithology for any of the parameters considered in this study, but there are several significant relationships between aquifer lithology and the median values of certain water-quality parameters. Many of these relationships are most evident for deep or confined aquifers, where water−rock interaction has caused the chemistry of groundwater to be influenced by the chemistry (mineralogy) of the aquifer. For example, in accordance with expected mineralogy, SiO2 concentrations are lowest in carbonate aquifers and highest in aquifers of volcanic character, especially ignimbrite and rhyolite. There are several other relationships like this, many of which have been reported previously (Daughney and Reeves, 2005). Aquifer lithology also has an indirect influence on the concentrations of redox-sensitive elements and compounds such as NO3-N, NH4-N, Fe, Mn, As and SO4. The transition from the oxidised to reduced state is mediated by microbial respiration (see section 1.3), which requires the presence of a reductant (organic carbon in most cases). In aquifer lithologies with low concentrations of organic carbon, such as ignimbrite, rhyolite and some gravels (eg, Canterbury), it is possible that microbial respiration is curtailed. As a result the groundwater remains oxidised, and this favours the persistence of NO3-N and SO4 and prevents the solubilisation and accumulation of NH4-N, Fe, Mn and As (Langmuir, 1997). The opposite case applies to lithologies that do contain abundant organic carbon, which is why concentrations of dissolved Fe and Mn are often observed to be high in sand aquifers (Daughney, 2003).
4.3 Surrounding land use and land cover Elevated levels of nitrates and faecal bacteria in groundwater are almost certainly the result of human activities on the land. This conclusion is supported by the fact that elevated nitrate and bacteria levels are more often observed in shallow, unconfined aquifers (ie, those that tend to lie under flat expanses of urban and rural land) than deep, confined aquifers; see section 6.1. Furthermore, numerous catchment or local-scale studies have suggested land uses such as agriculture and horticulture as major sources of nitrate contamination of groundwater (eg, Close et al, 2001) and this helps develop our understanding of land use impacts on groundwater quality at a national scale. While land use is logically implicated in the degradation of groundwater, this study has not been able to reveal systematic relationships (at a national scale) between the particular type and intensity of land use surrounding monitoring bores and the magnitude or pattern of impact from these land uses on groundwater quality. This result applies to all groundwater quality parameters reported earlier, including NO3-N, SO4, conductivity (and other potential indicators of land use impact), and holds regardless of whether all monitoring sites are considered together, or if the data set is limited to the sites less than 10m deep (at which the impact of land use would probably be most apparent).
Groundwater Quality in New Zealand: State and Trends 1995–2006 39

The lack of a proven relationship between land use types/intensity and groundwater quality is a common result that has been observed in several previous studies in New Zealand and overseas (Close et al, 1995; Reijnders et al, 1998; Broers and van der Grift, 2004; Daughney and Reeves, 2005, 2006). There are a number of reasons for this:
• an overwhelming majority of groundwater quality monitoring wells are located in developed catchments and it is therefore hard to make robust comparisons with groundwater in undeveloped areas (ie, pristine groundwater)
• the quality of groundwater drawn from a monitoring well does not necessarily reflect the land use directly surrounding that well; water may have travelled from an area dominated by a different type/intensity of land use
• groundwater that has been impacted by land use might not have had sufficient time to move all the way from the aquifer’s recharge area to the monitoring well, or substances indicative of land use impact (eg, nitrate) might have been transformed or degraded before reaching the monitoring site.
In order to better understand relationships between groundwater quality and different types of land use, accurate knowledge of the age and source of the groundwater being monitored is required. As stated in Section 2.3, such information is not generally available for monitoring wells in New Zealand, and to obtain this information will require substantial research effort in the future.
40 Groundwater Quality in New Zealand: State and Trends 1995–2006

5 Comparison to previous studies This section provides a brief comparison with previous work as a framework for assessing the results of this investigation. Emphasis is placed on the parameters of greatest concern: NO3-N, Fe, Mn, salinity and microbiological indicators (cf. section 2.2). Note that comparisons to previous studies must be made with caution, due to possible biases resulting from differences in monitoring objectives, sampling and analytical methods, data interpretation techniques, and so on.
5.1 Regional investigations Many regional investigations of groundwater quality have been conducted in New Zealand, in most cases by regional councils. In some cases these investigations have focused on the same SOE monitoring bores considered in this study, whereas in other cases additional monitoring data are included. It is important to note that regional studies can usually account more specifically for location-specific details related to aquifer characteristics and groundwater quality than is possible in a national overview. It is beyond the scope of this report to provide an exhaustive summary of previous regional results, but certain generalisations can be made. For NO3-N, regional council surveys report median concentrations of about 2 mg/L, with typically 5−10% of sites above the MAV (Close et al, 2001). For microbiological parameters, regional surveys report results above the MAV at 9−60% of sites (Sinton, 2001). There are few specific regional surveys of Fe, Mn or salinity.
5.2 National assessments of groundwater quality
There are relatively few previous national assessments of groundwater quality available for comparison with the results from this investigation. An early survey reported that about 30% of wells tested in Taranaki, Wairau, Waimea, Waikato and mid-Canterbury (n = 497) had an NO3-N concentration above 10 mg/L (Burden, 1982). Bright et al (1998) used a larger data set to demonstrate that a significant proportion of wells tested had NO3-N concentrations above 5 mg/L (half the MAV). Unfortunately, the survey by Bright et al (1998) did not include statistics that are directly comparable to the results in this report. Davies et al (2001) reported that 86% of drinking-water supplies that were found to have NO3-N above half the MAV were derived from groundwater sources. They also found that groundwater-derived water supplies had elevated Mn relative to supplies sourced from surface water. In a national survey of Fe and Mn in New Zealand’s groundwater, Daughney (2003) reported median concentrations of 0.08 and 0.01 mg/L, respectively (n = 9,784). This same study reported that 36% and 39% of the samples tested had median Fe and Mn above the relevant aesthetic GVs for drinking-water, respectively. The NGMP data set has median concentrations of NO3-N, Fe and Mn of 0.77, 0.03 and 0.002 mg/L, respectively (Daughney and Reeves, 2003, 2005). Temporal trends observed in the NGMP (Daughney and Reeves, 2006) are very similar to those reported in this study. We are not aware of any other national assessments of trends in groundwater quality. Overall, the results of this study appear to be generally similar to previous investigations.
Groundwater Quality in New Zealand: State and Trends 1995–2006 41

5.3 National assessments of river water quality The National River Water Quality Network (NRWQN) includes 77 sites that are monitored monthly by NIWA for various parameters. A recent summary of the NRWQN data collected over the period 1989−2005 revealed national medians for conductivity of 95 μS/cm, NOx-N of 0.116 mg/L, and E. coli of 49 cfu/100 ml (Scarsbrook, 2006). As expected, New Zealand groundwaters have higher median conductivity and NO3-N but lower microbial counts (see Table 7). Thus it is possible that the discharge of nitrate-rich groundwater into a stream or river may pose a significant threat to its ecosystem, but the number of locations in New Zealand where this is presently occurring cannot be determined with the data used in this study. Similarly, the recharge of groundwater from a river may introduce microbial pathogens into the aquifer, but again the number of locations where this is a potential concern is not known. Median relative rates of change in the NRWQN were 0.15% and 0.47% per year for conductivity and nitrate, respectively (Scarsbrook, 2006) and were comparable to median rates for groundwater (see Table 12). In the future it would be useful to perform a more quantitative comparison of results from the NRWQN and groundwater monitoring programmes such as the NGMP.
5.4 International studies Griffioen et al (2005) summarise groundwater quality at the global scale through the use of 11 status-based indicators. Of the 231 countries considered (including administrative units), 65 were identified to have a significant fraction of “high-NO3” groundwater, usually associated with intense agricultural activities, about 20 countries were identified as having high concentrations of Fe and Mn of natural origin, and “many” countries were identified as having problems with salinity, usually associated with salt-water intrusion. Several investigations have discussed groundwater quality at the national scale. For example, groundwater in Finland is characterised by similar ranges of Fe and Mn as found in New Zealand, but concentrations of NO3-N tend to be lower, presumably due to less intense agricultural activity (Lahermo et al, 1999). In Canada, about 14% of wells tested have NO3-N concentrations above guideline values, and 20% have coliform counts above guideline values (Lesage, 2005). Broers and van der Grift (2004) reported increasing trends in NO3-N at 8% of monitoring sites in a region of intensive livestock farming in the Netherlands. These examples illustrate that, generally speaking, groundwater quality in New Zealand is similar to that in many other countries.
42 Groundwater Quality in New Zealand: State and Trends 1995–2006
6 Summary and Conclusions This study has shown that data from New Zealand’s various SOE groundwater quality monitoring programmes can be meaningfully compiled at a national scale. Based on the current status of groundwater quality in New Zealand (section 2), the major national-scale issues are:
• contamination with NO3-N and/or microbial pathogens, especially for shallow wells in unconfined aquifers
• naturally elevated salinity, Fe, Mn, NH4-N and/or As, especially for deeper wells in confined aquifers.
These issues vary in importance at different monitoring sites and in different regions, but at the national scale the current status of groundwater quality can be summarised as follows.
• The health-related guideline value for microbial pathogens is exceeded at 20% of the monitoring sites for which indicator data were available. This issue is probably more related to poor well-head protection than to the vulnerability of any particular type of aquifer.
• Median NO3-N concentration exceeds the health-related MAV for drinking-water and the TV for ecosystem protection at 4.9% and 10.3% of monitoring sites, respectively.
• At 39% of monitoring sites the groundwater currently shows some level of human influence in the form of above-background concentration of NO3-N, often with elevated K, Cl and/or SO4 (this is especially common in Waikato and Southland). The median concentration of NO3-N exceeds the threshold for “probable” human impact (> 1.6 mg/L) at almost all sites in this category.
• At 30% of monitoring sites the groundwater currently shows little or no evidence of human influence, but due to high levels of oxygen in the aquifer there is a risk that any introduced NO3-N or SO4 will persist and accumulate.
• At 31% of monitoring sites the groundwater is oxygen-poor and is not likely to accumulate significant NO3-N; however, the groundwater can accumulate high concentrations of Fe, Mn, As and/or NH4-N due to natural processes (especially in parts of Gisborne, Auckland and Manawatu−Wanganui). Aesthetic drinking-water guidelines are exceeded for Fe and Mn at almost all sites in this category. Health-related guideline values for As and Mn are exceeded at about a quarter to a third of sites in this category (10% and 15% of sites overall, respectively). Many groundwaters in this category also have high salinity and can exceed aesthetic water-quality guidelines for Cl, Na, SO4 or TDS.
Trend assessments based on data for the period from 1995 to 2006 (section 3) reveal that about two-thirds of the monitoring sites considered in this study show slow changes in groundwater quality that probably indicate natural water−rock interaction. The remaining third of the monitoring sites show more rapid changes in groundwater quality, with patterns of change that appear to reflect human influence.
Groundwater Quality in New Zealand: State and Trends 1995–2006 43

• At 6% of monitoring sites, rapid decreases in parameters such as Na, Ca, HCO3 and Cl in deep aquifers may suggest dilution (most common in Northland, Gisborne and the Bay of Plenty), possibly due to pumping of coastal aquifers.
• At 12% of monitoring sites increases in parameters such as NO3-N, K, Cl and/or SO4, usually in shallow unconfined aquifers and often in Waikato or Southland, may indicate increasing human or agricultural impact in the recharge area.
• At 10% of monitoring sites decreases in parameters such as NO3-N, K, Cl and/or SO4 may indicate decreasing anthropogenic influence in the recharge area.
Findings from this study support the implication that human activities on the land have led to the degradation of groundwater quality, particularly in shallow, unconfined aquifers (ie, those most vulnerable to pollution from the land surface). However, proving relationships between the particular land use types/intensities surrounding monitoring bores and the magnitude or pattern of impacts of these land uses on groundwater quality has not been possible. This is in fact a common result that has been observed in several previous studies in New Zealand and overseas. There are some important information gaps identified in Section 2 that should be addressed in order to better understand the drivers of groundwater quality and underpin the development of sound resource management strategies:
• Information related to well construction, aquifer characteristics and surrounding land should be available for all monitoring sites, and, if possible, consistent metadata standards should be applied nationally.
• The age and origin of the groundwater monitored should be determined.
• Routine groundwater quality monitoring programmes should include a balanced number of shallow and deep sites to ensure local, regional and national-scale representativeness, along with a certain number of sites in pristine areas to provide valuable baseline data.
• Baseline data should be used to determine what threshold should be used to identify groundwater quality issues and trends that are important from a management perspective.
44 Groundwater Quality in New Zealand: State and Trends 1995–2006
References Aller L, Bennett T, Lehr JH, Petty RJ, Hackett G. 1987. DRASTIC: A Standardized System for Evaluating Groundwater Pollution Potential Using Hydrogeologic Setting. United States Environmental Protection Agency. Report EPA/600/2-87/035.
Australia and New Zealand Environment Conservation Council. 2000. Australian and New Zealand Guidelines for Fresh and Marine Water Quality. Volume 1: The Guidelines. Australian Water Association: Artarmon.
Bekesi G, McConchie J. 1999. Groundwater recharge modelling using the Monte Carlo technique, Manawatu region, New Zealand. J Hydrol 224: 137–48.
Bright J, Allison K, Painter B. 1998. A Survey of Nitrate Contamination of New Zealand Aquifers. Unpublished Lincoln Environmental Report 4309/1.
Broers HP, van der Grift B. 2004. Regional monitoring of temporal changes in groundwater quality. J Hydrol 296: 192–220.
Brown LJ. 2001. Canterbury. In: Rosen MR, White PA (eds). Groundwaters of New Zealand. New Zealand Hydrological Society: Wellington.
Burden RJ. 1982. Nitrate contamination of New Zealand aquifers: a review. New Zealand J Science 25: 205–20.
Close ME. 1987. Effects of irrigation on water quality of a shallow unconfined aquifer. Wat Resour Bull 23: 793–802.
Close ME, Flintoft MJ. 2004. National survey of pesticides in groundwater in New Zealand − 2002. New Zealand J Mar Freshwater Res 38: 289–9.
Close ME, Rosen MR, Smith VR. 2001. Fate and transport of nitrates and pesticides in New Zealand’s aquifers. In: Rosen MR, White PA (eds). Groundwaters of New Zealand. New Zealand Hydrological Society: Wellington.
Close ME, Stewart M, Rosen M, Morgenstern U, Nokes C. 2000. Investigation into Secure Groundwater Supplies. Institute of Environmental Science and Research Client Report FW0034.
Close ME, Tod JL, Tod GJ. 1995. Effect of recharge variations on regional groundwater quality in mid-Canterbury, New Zealand. J Hydrol (NZ) 33: 1–16.
Crowcroft G, Smaill A. 2001. Auckland. In: Rosen MR, White PA (eds). Groundwaters of New Zealand. New Zealand Hydrological Society: Wellington.
Daughney CJ. 2003. Iron and manganese in New Zealand’s groundwater. J Hydrol (NZ) 42: 11–26.
Daughney CJ. 2005. Spreadsheet for Automatic Processing of Water Quality Data: Theory, Use and Implementation in Excel. GNS Science Report 2005/35.
Daughney CJ, Reeves R. 2003. Definition of Hydrochemical Facies for New Zealand’s Groundwaters Using Data from the National Groundwater Monitoring Programme. GNS Science Report 2003/18.
Daughney CJ, Reeves RR. 2005. Definition of hydrochemical facies in the New Zealand National Groundwater Monitoring Programme. J Hydrol (NZ) 44: 105–30.
Daughney CJ, Reeves R. 2006. Analysis of long-term trends in New Zealand’s groundwater quality based on data from the National Groundwater Monitoring Programme. J Hydrol (NZ) 45: 41–62.
Davies H, Nokes C, Ritchie J. 2001. A Report on the Chemical Quality of New Zealand’s Community Drinking Water Supplies. Environmental Science and Research Client Report FW0120.
Downes CJ. 1985. Redox reactions, mineral equilibria, and ground water quality in New Zealand aquifers. In: Ward CH, Giger W, McCarty PL (eds). Ground Water Quality. Wiley and Sons: New York.
Groundwater Quality in New Zealand: State and Trends 1995–2006 45
Environment Waikato. 2006. Base Suite of Groundwater Chemical Determinands (State of Environment). Environment Waikato Document 1066032, circulated to the Regional Groundwater Forum.
Frapporti G, Vriend SP, van Gaans PF. 1994. Qualitative time trend analysis of groundwater monitoring networks: an example from the Netherlands. Env Monit Assessment 30: 81–102.
Freeze RA, Cherry JA. 1979. Groundwater. Prentice-Hall: New Jersey.
Griffioen J, Brunt R, Vasak S, van der Gun J. 2005. A global inventory of groundwater quality: first results. In: Brining Groundwater Quality to the Watershed Scale. IAHS Publication 297: 3–10.
Helsel DR, Cohn TA. 1988. Estimation of descriptive statistics for multiply censored water quality data. Water Resources Research 24: 1997–2004.
Helsel DR, Hirsch RM. 1992. Statistical Methods in Water Resources: Studies in Environmental Science, Vol 49. Elsevier: Amsterdam.
Hem JD. 1985. Study and Interpretation of the Chemical Characteristics of Natural Waters. United States Geological Survey Water Supply Paper 2254.
Lahermo P, Tarvainen T, Hatakka T, Backman B, Juntunen R, Kortelainen N, Lakomaa T, Suomela P. 1999. One thousand wells: the physical-chemical quality of Finnish well waters in 1999. Tutkimusraportti Geologian Tutkimuskeskus 155: 5–92.
Langmuir D. 1997. Aqueous Environmental Geochemistry. Prentice-Hall: New Jersey.
Lesage S. 2005. Groundwater quality in Canada: a national overview. In: Brining Groundwater Quality to the Watershed Scale. IAHS Publication 297: 11–18.
Ministry of Health. 2005. Drinking-Water Standards for New Zealand 2005. Ministry of Health: Wellington, New Zealand.
Morgan M, Hughes B. 2001. Wellington. In: Rosen MR, White PA (eds). Groundwaters of New Zealand. New Zealand Hydrological Society: Wellington.
Morgenstern U. 2005. Wairarapa Valley groundwater: Residence Time, Flow Pattern and Hydrochemistry Trends. GNS Science Report 2005/33.
Morgenstern U, Reeves R, Daughney C, Cameron S, Gordon D. 2004. Groundwater Age and Chemistry, and Future Nutrient Load in the Lake Rotorua Area. GNS Science Report 2004/31.
Reijnders HFR, van Drecht G, Prins HF, Boumans LJ. 1998. The quality of groundwater in the Netherlands. J Hydrol 207: 179–88.
Rosen MR. 2001. Hydrochemistry of New Zealand’s aquifers. In: Rosen MR, White PA (eds). Groundwaters of New Zealand. New Zealand Hydrological Society: Wellington.
Scarsbrook M. 2006. State and Trends in the National River Water Quality Network (1989–2005). Report prepared for the Ministry for the Environment, ME number 778.
Sinton L. 2001. Microbial contamination of New Zealand’s aquifers. In: Rosen MR, White PA (eds). Groundwaters of New Zealand. New Zealand Hydrological Society: Wellington.
Taylor CB, Trompetter VJ, Brown LJ, Bekesi G. 2001. The Manawatu aquifers, North Island, New Zealand: clarification of hydrogeology using a multidisciplinary environmental tracer approach. Hydrol Proc 15: 3269–89.
TerraLink International. 2007. Land Cover Database of New Zealand. www.terralink.co.nz (accessed January 2007).
Turekian KK. 1977. The fate of metals in the oceans. Geochim Cosmochim Acta 41: 1139–44.
46 Groundwater Quality in New Zealand: State and Trends 1995–2006

Appendix 1: Groundwater quality maps This appendix includes a series of maps showing: 1. aquifer lithology 2. aquifer confinement 3. well depth 4. surrounding land use 5. median calculated TDS 6. median conductivity 7. median NO3-N concentration 8. median Fe concentration 9. median Mn concentration 10. median microbiological indicator (MaxMicro) 11. trend magnitudes, NO3-N 12. trend magnitudes, conductivity. All maps in this report use a shaded digital elevation model as the base layer. This was obtained from GNS Science’s ArcSDE server. Overlain on top of the DEM is a simplified hydrogeological map of New Zealand. This layer is set to be 60% transparent. The hydrogeological map was created by simplifying and creating a new category within the existing Q-map 1:250,000 shape files. The major lakes shape file was obtained from the GNS Science ArcSDE database. Minor lakes were manually removed from the file. The rivers displayed on the maps came from NIWA’s River Environment Classification system (REC), produced for the Ministry for the Environment in 2004. The maps in this report display rivers classified as 6, 7 and 8. The regional council boundaries were obtained from the GNS Science ArcSDE server. LCDB2 data were obtained from the Ministry for the Environment. These were produced in 2004 for the Ministry by Terralink International. Eastings and northings of the well sites were used to extract LCDB2 information. Maps showing aquifer lithology, aquifer confinement and surrounding land use are based on information provided by regional council personnel. In order to compile the lithology and land-use information at the national scale, the regional council names were grouped into a number of categories, as displayed in the following tables.
Groundwater Quality in New Zealand: State and Trends 1995–2006 47

Table A1: Reported land use and the assigned categories
Agricultural Urban Horticultural
Agriculture and stock Chicken Drystock Drystock/lifestyle Horse stud Industry and stock Lifestyle/drystock Livestock Saleyards Rural School and stock Sheep/beef Stock Stock and agriculture Stock and industry
Domestic Aerodrome Airport Commercial Holiday residential Lifestyle Residential Residential coastal School School grounds Urban Urban/lifestyle
Agriculture Berries Horticulture Horticultural Lifestyle/orchard/vineyard Market garden Market gardening Nursery Orchard Orchard/dairy Orchard/lifestyle Orchards Plant nursery Plantation Vineyard
Forestry Park/reserve Dairy
Forest Forestry Glasshouses
Camping Golf course Motor camp Park/reserve Regional park Rural Seafloor
Dairy Dairy/drystock Dairy/lifestyle Dairying
Industrial
Industrial Light industry Light industry/retail
* Interpreted by GNS Science using land use classifications supplied by regional councils.
48 Groundwater Quality in New Zealand: State and Trends 1995–2006

Table A2: Reported aquifer lithologies and their assigned categories
Sand Sandstone Pumice
Sand Sand and gravel Te Hapara sands Dune sand Sand/silt Sandstone Sand/gravel Pleistocene sand Pleistocene sands (lower) Kaawa sand Kaipara sands Confined aquifer in sand Flowing artesian in sand Unconfined aquifer in sand Unconfined aquifer in undifferentiated alluvium Volcanics Whenuakura Marine terraces Matemateaonga
Fractured Waitemata sandstone Waitemata sandstone Fractured Waitemata sandstone – geothermal Waitemata sandstones fractured Waitemata sandstone Waitemata sandstone Deep Waitemata sandstone Shallow Waitemata sandstone Fractured Waitemata sandstones – geothermal Sandstone/limestone
Pumice gravel Pumice sand Pumice sands
Shellbeds Gravel Ignimbrite
Shell Kaawa shellbed
Gravel Alluvial gravel Tertiary gravel Gravels Gravels and some lignite Shallow fluvial deposit Waipaoa gravels Matokitoki gravels Makauri gravels Large stones, sand and water stained gravels Manuherikia alluvium Waitaki alluvium River gravels Gravel and clay
Rhyolite Ignimbrite Volcanic rock Rhyolitic pyroclastics Oruanui ignimbrite Unwelded ignimbrite Taupo ignimbrite Whakamaru ignimbrite Rhyolitic pyroclastic Andesite
Limestone Lignite Basalt
Limestone Takaka limestone
Lignite Basalt Three Kings basalt Bombay basalt One Tree Hill basalt Drury basalt (upper) Mt Richmond basalt Deep Pukekohe basalt Shallow Pukekohe tephra/weathered basalt
Greywacke Clay Unknown
Greywacke Basal Waitemata onto greywacke
Clay Unknown Fractured rock
* Interpreted by GNS Science using aquifer names and/or aquifer lithologies supplied by regional councils.
Groundwater Quality in New Zealand: State and Trends 1995–2006 49

Figure A1: Aquifer lithology – North Island
50 Groundwater Quality in New Zealand: State and Trends 1995–2006

Figure A2: Aquifer lithology – South Island
Groundwater Quality in New Zealand: State and Trends 1995–2006 51

Figure A3: Aquifer confinement – North Island
52 Groundwater Quality in New Zealand: State and Trends 1995–2006

Figure A4: Aquifer confinement – South Island
Groundwater Quality in New Zealand: State and Trends 1995–2006 53

Figure A5: Well depth – North Island
54 Groundwater Quality in New Zealand: State and Trends 1995–2006

Figure A6: Well depth – South Island
Groundwater Quality in New Zealand: State and Trends 1995–2006 55

Figure A7: Surrounding land use – North Island
56 Groundwater Quality in New Zealand: State and Trends 1995–2006
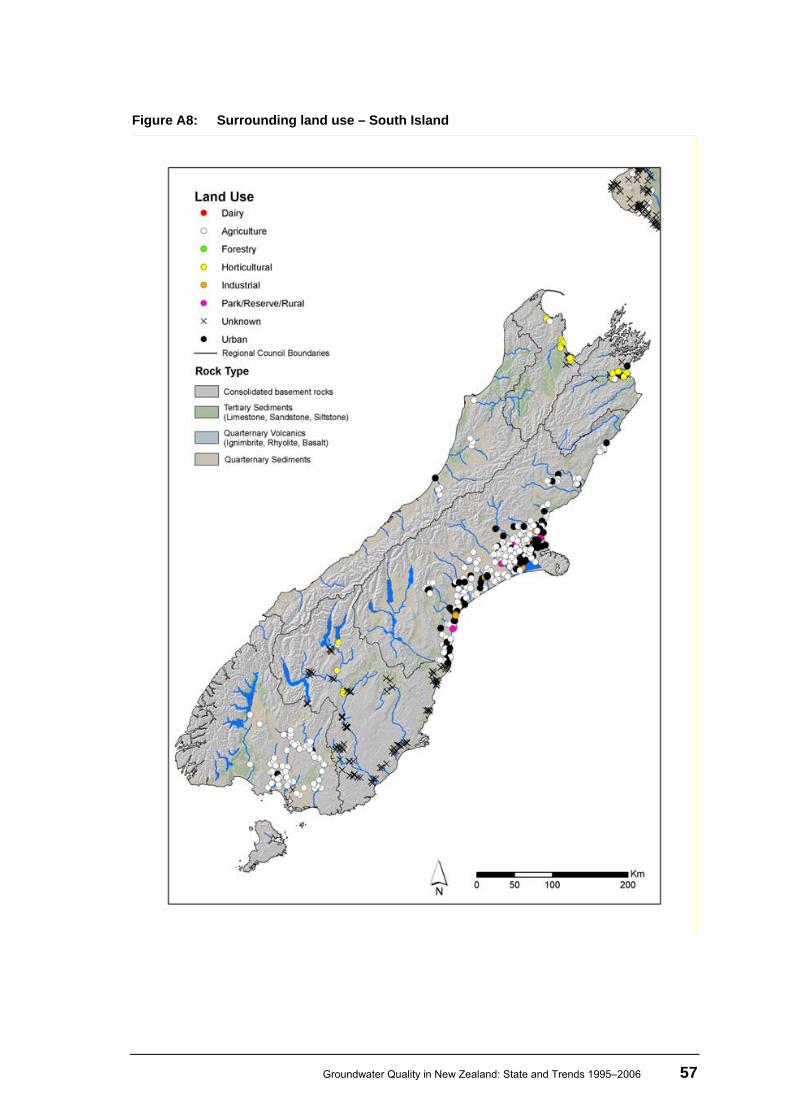
Figure A8: Surrounding land use – South Island
Groundwater Quality in New Zealand: State and Trends 1995–2006 57

Figure A9: Median calculated TDS – North Island
58 Groundwater Quality in New Zealand: State and Trends 1995–2006

Figure A10: Median calculated TDS – South Island
Groundwater Quality in New Zealand: State and Trends 1995–2006 59
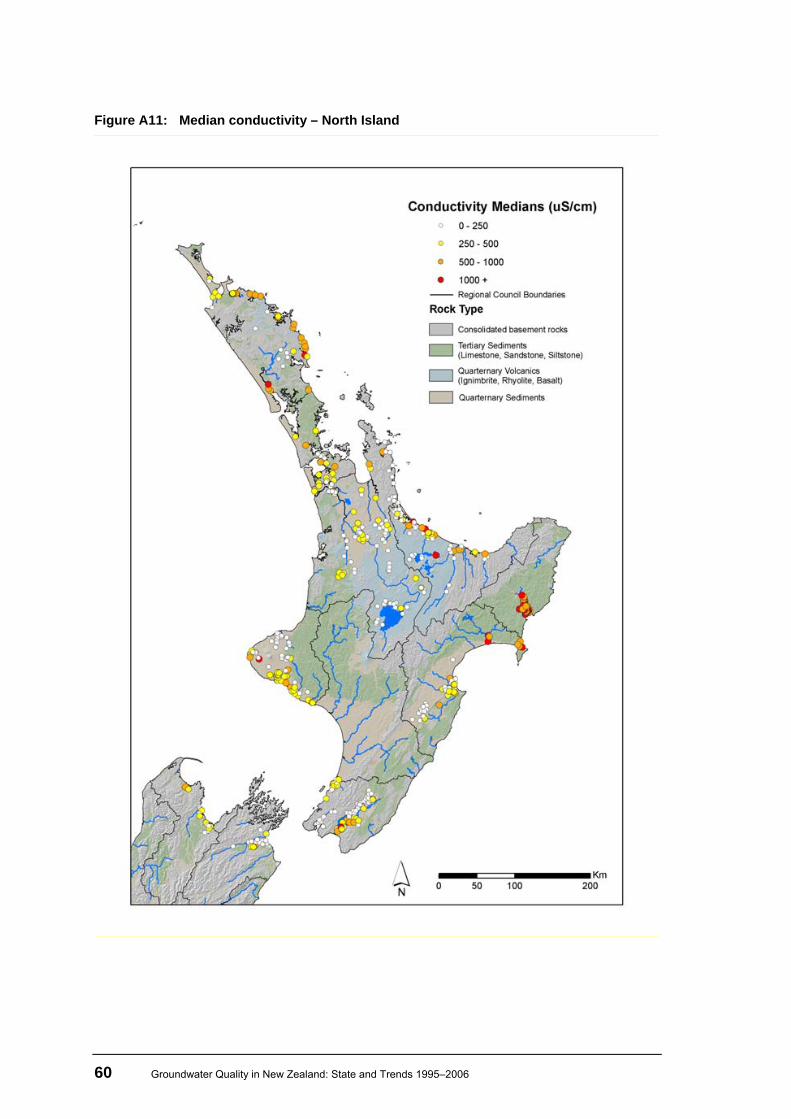
Figure A11: Median conductivity – North Island
60 Groundwater Quality in New Zealand: State and Trends 1995–2006

Figure A12: Median conductivity – South Island
Groundwater Quality in New Zealand: State and Trends 1995–2006 61

Figure A13: Median NO3-N concentration – North Island
62 Groundwater Quality in New Zealand: State and Trends 1995–2006

Figure A14: Median NO3-N concentration – South Island
Groundwater Quality in New Zealand: State and Trends 1995–2006 63
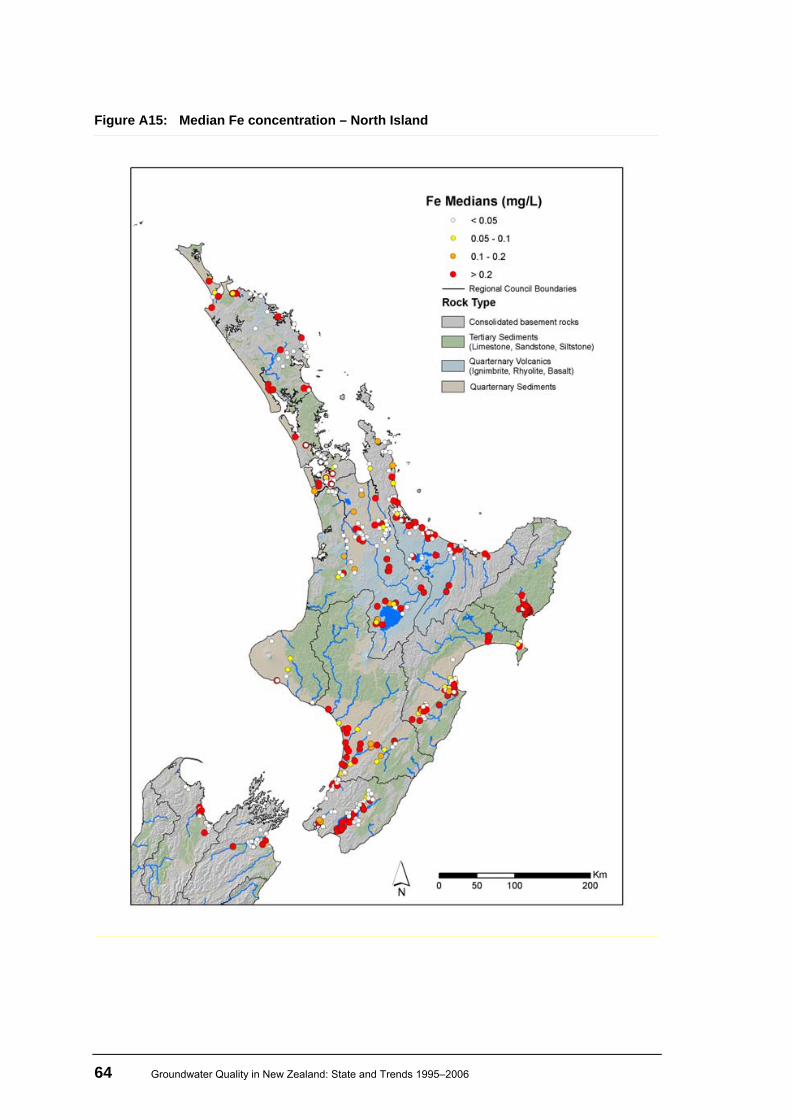
Figure A15: Median Fe concentration – North Island
64 Groundwater Quality in New Zealand: State and Trends 1995–2006

Figure A16: Median Fe concentration – South Island
Groundwater Quality in New Zealand: State and Trends 1995–2006 65

Figure A17: Median Mn concentration – North Island
66 Groundwater Quality in New Zealand: State and Trends 1995–2006

Figure A18: Median Mn concentration – South Island
Groundwater Quality in New Zealand: State and Trends 1995–2006 67

Figure A19: Median microbiological indicator (MaxMicro) – North Island
68 Groundwater Quality in New Zealand: State and Trends 1995–2006
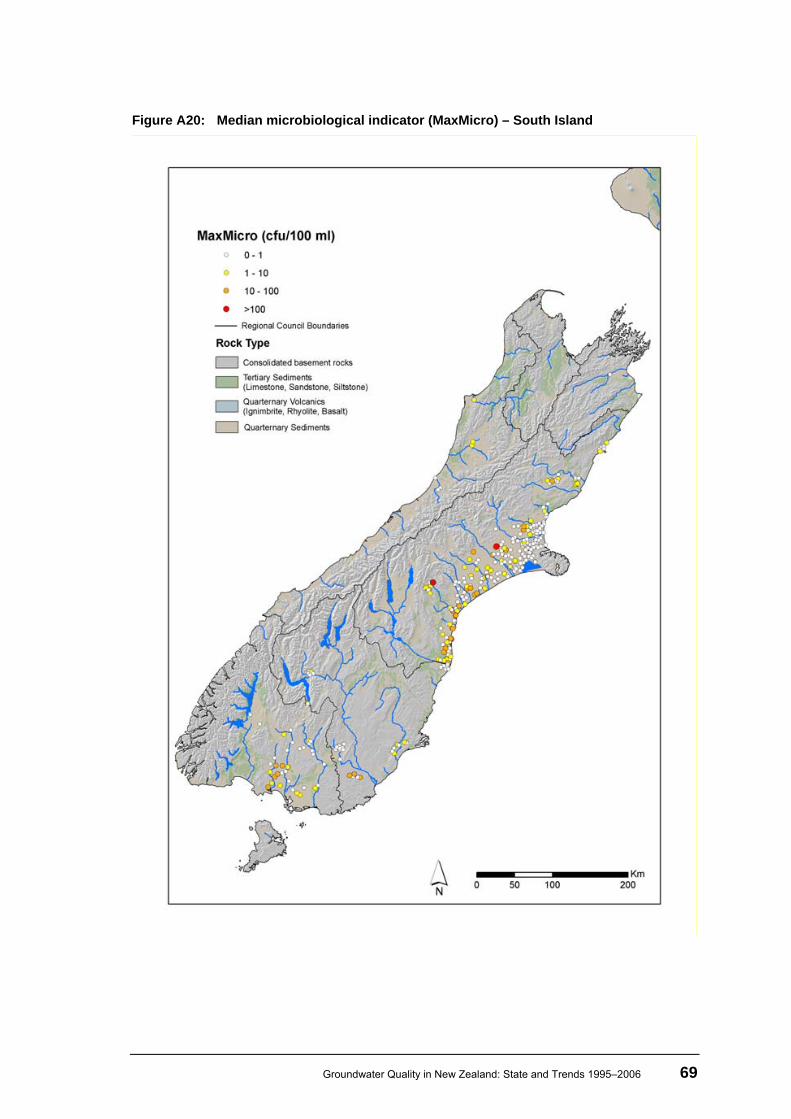
Figure A20: Median microbiological indicator (MaxMicro) – South Island
Groundwater Quality in New Zealand: State and Trends 1995–2006 69

Figure A21: Trend magnitudes, NO3-N – North Island
70 Groundwater Quality in New Zealand: State and Trends 1995–2006

Figure A22: Trend magnitudes, NO3-N – South Island
Groundwater Quality in New Zealand: State and Trends 1995–2006 71

Figure A23: Trend magnitudes, conductivity – North Island
72 Groundwater Quality in New Zealand: State and Trends 1995–2006
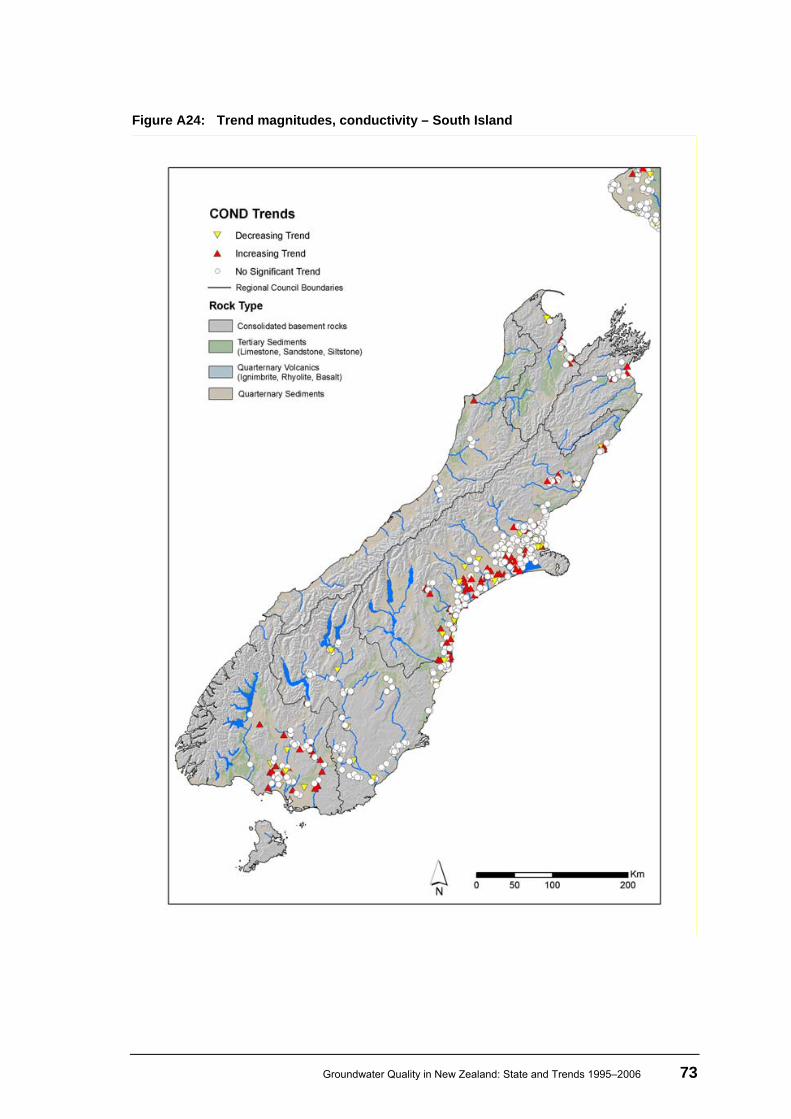
Figure A24: Trend magnitudes, conductivity – South Island
Groundwater Quality in New Zealand: State and Trends 1995–2006 73