Groundwater flow modeling for impact assessment of port ... · modelling Dewatering Groundwater...
15
ORIGINAL ARTICLE Groundwater flow modeling for impact assessment of port dredging works on coastal hydrogeology in the area of Al-Wakrah (Qatar) Fethi Lachaal 1 • Slim Gana 2 Received: 23 October 2016 / Accepted: 31 October 2016 / Published online: 12 November 2016 Ó Springer International Publishing Switzerland 2016 Abstract This paper presents the impact assessment of the port dredging works on aquifer’s hydrogeology in the area of Al-Wakrah Economic Port Zone 3 in Qatar (QEZ3) project using groundwater numerical model (MODFLOW- 3D). The QEZ3 model is used to estimate the groundwater flow system and the groundwater levels in the study area, during the dredging and dewatering period. Specially, we focused on the impact of dredged and dewatering water stored in two programmed stilling basins. The modeling period is about 6 years from August 2010 to May 2015 according to the available data and the project phasing. Three scenarios are chosen according to the time schedule of QEZ3 project. The model gives a high piezometric level of more than 2.5 m CD (chart datum) located in stilling basins area, which can will cause water resurgence and groundwater flooding. As solution, using the model results we proposed to change the programmed discharge areas. Keywords Dredging Hydrogeology Groundwater modelling Dewatering Groundwater MODFLOW Introduction Urbanization occupies a puzzling position in country development and growth, global economic development, energy consumption, natural resource use, and human wellbeing (McDonald et al. 2011, 2014; Uddameri et al. 2014; Mondal et al. 2015; Pandey and Joshi 2015; Jain et al. 2016). In the 21st century, urbanization has experi- enced strong growth, especially in coastal regions. In this case, construction in the coastal region requires dredging and dewatering works which cause an environment per- turbation (Wang et al. 2013, 2014, 2016; Xu et al. 2016; Chambers et al. 2016; Khadri and Chaitanya 2016). Groundwater flow modeling has become an invaluable tool for assessing the impact of existing and future activi- ties on groundwater resources (Lachaal et al. 2012, 2013; Jothibasu and Anbazhagan 2016; Seyedmohammadi et al. 2016; Sajil Kumar 2016; Ehteshami et al. 2016; Gopinath et al. 2016; Mokarram 2016; Khorasani et al. 2016) espe- cially for the groundwater systems evolution caused by urbanization and growth (Calderhead et al. 2012). Previous studies show the significant contribution of groundwater modeling to estimate the mine and tunnel construction impact in groundwater situation and quality (Jaramillo- Nieves and Ge 2012; Hussien 2013; Chen and Jiao 2014; Jahanshahi and Zare 2015; Pujades et al. 2016), and to estimate groundwater quality in relation with the port construction (Zammouri et al. 2014). Dredging and dewatering activities planned in the Al- Wakrah Economic Port Zone 3 in Qatar (QEZ3, Qatar) construction requires careful groundwater management. In addition the groundwater rise that can be resulted by the dewatering activity can induce the flooding of some area outside the project area. This problem was observed in the & Fethi Lachaal [email protected]; [email protected] 1 Georesources Laboratory, Water Research and Technology Centre, Borj Cedria Ecopark, PO Box 273, Soliman 8020, Tunisia 2 National Agronomic Institute of Tunisia, 43 Avenue Charles Nicolle, Mahraje `ne, 1082 Tunis, Tunisia 123 Model. Earth Syst. Environ. (2016) 2:201 DOI 10.1007/s40808-016-0252-1
Transcript of Groundwater flow modeling for impact assessment of port ... · modelling Dewatering Groundwater...

ORIGINAL ARTICLE
Groundwater flow modeling for impact assessment of portdredging works on coastal hydrogeology in the area of Al-Wakrah(Qatar)
Fethi Lachaal1 • Slim Gana2
Received: 23 October 2016 / Accepted: 31 October 2016 / Published online: 12 November 2016
� Springer International Publishing Switzerland 2016
Abstract This paper presents the impact assessment of the
port dredging works on aquifer’s hydrogeology in the area
of Al-Wakrah Economic Port Zone 3 in Qatar (QEZ3)
project using groundwater numerical model (MODFLOW-
3D). The QEZ3 model is used to estimate the groundwater
flow system and the groundwater levels in the study area,
during the dredging and dewatering period. Specially, we
focused on the impact of dredged and dewatering water
stored in two programmed stilling basins. The modeling
period is about 6 years from August 2010 to May 2015
according to the available data and the project phasing.
Three scenarios are chosen according to the time schedule
of QEZ3 project. The model gives a high piezometric level
of more than 2.5 m CD (chart datum) located in stilling
basins area, which can will cause water resurgence and
groundwater flooding. As solution, using the model results
we proposed to change the programmed discharge areas.
Keywords Dredging � Hydrogeology � Groundwater
modelling � Dewatering � Groundwater MODFLOW
Introduction
Urbanization occupies a puzzling position in country
development and growth, global economic development,
energy consumption, natural resource use, and human
wellbeing (McDonald et al. 2011, 2014; Uddameri et al.
2014; Mondal et al. 2015; Pandey and Joshi 2015; Jain
et al. 2016). In the 21st century, urbanization has experi-
enced strong growth, especially in coastal regions. In this
case, construction in the coastal region requires dredging
and dewatering works which cause an environment per-
turbation (Wang et al. 2013, 2014, 2016; Xu et al. 2016;
Chambers et al. 2016; Khadri and Chaitanya 2016).
Groundwater flow modeling has become an invaluable
tool for assessing the impact of existing and future activi-
ties on groundwater resources (Lachaal et al. 2012, 2013;
Jothibasu and Anbazhagan 2016; Seyedmohammadi et al.
2016; Sajil Kumar 2016; Ehteshami et al. 2016; Gopinath
et al. 2016; Mokarram 2016; Khorasani et al. 2016) espe-
cially for the groundwater systems evolution caused by
urbanization and growth (Calderhead et al. 2012). Previous
studies show the significant contribution of groundwater
modeling to estimate the mine and tunnel construction
impact in groundwater situation and quality (Jaramillo-
Nieves and Ge 2012; Hussien 2013; Chen and Jiao 2014;
Jahanshahi and Zare 2015; Pujades et al. 2016), and to
estimate groundwater quality in relation with the port
construction (Zammouri et al. 2014).
Dredging and dewatering activities planned in the Al-
Wakrah Economic Port Zone 3 in Qatar (QEZ3, Qatar)
construction requires careful groundwater management. In
addition the groundwater rise that can be resulted by the
dewatering activity can induce the flooding of some area
outside the project area. This problem was observed in the
& Fethi Lachaal
[email protected]; [email protected]
1 Georesources Laboratory, Water Research and Technology
Centre, Borj Cedria Ecopark, PO Box 273, Soliman 8020,
Tunisia
2 National Agronomic Institute of Tunisia, 43 Avenue Charles
Nicolle, Mahrajene, 1082 Tunis, Tunisia
123
Model. Earth Syst. Environ. (2016) 2:201
DOI 10.1007/s40808-016-0252-1

Qatar New Port project (NPP), located further south of
QEZ3 project (Fig. 1).
The QEZ3 is programmed to be constructed in the
Messaieed/Al Wekrah region (center East Qatar) (Fig. 2).
It is a self-contained development with industrial and
residential facilities; it will be located adjacent to the NPP
port. The QEZ3 will be an important gateway into Qatar.
The groundwater numerical model was developed to
assess the initial status of the aquifers’ hydrogeology QEZ3
project area before the commencement of the dredging
Fig. 1 Location map of the study area. a Qatar general location map. b Messaieed/Al Wekrah plain location and used data: position of
Groundwater monitoring wells and constructions in the QEZ3 project area
201 Page 2 of 15 Model. Earth Syst. Environ. (2016) 2:201
123

works and then, to assess the impact of dredged water
stored in the two stilling basins on groundwater level in
order to prevent seepage and flooding, during the progress
of the dredging works.
Materials and methods
Hydrogeology description of study area
Qatar is a small peninsula in the Persian Gulf, with an area
of approximately 11,590 km2 (CIA 2013) including a
number of small offshore islands (FAO 2015). The Qatar
Peninsula is located in the Arabian Gulf at the northeastern
margin of the Arabian Peninsula land mass (Mohamed
Ashour 2013). Qatar has arid desert climate that is char-
acterized by high temperatures during summer ([40 �C),
scanty rainfall with an annual average of about 82 mm over
the period 1999–2008 and, a high evaporation rates with an
annual average of 2200 mm (UN-Qatar 2009), a very
strong winds, and high relative humidity. Qatar is a water
resources stressed country and groundwater forms the main
natural internal water resource (Shomar et al. 2014; Kuiper
et al. 2015; FAO 2015; Baalousha 2016a, b).
The study area covered the Messaieed/Al Wekrah
region that is located in the center East Qatar, approxi-
mately 1300 m from the coast of Arabian Gulf, southeast
of Doha, Qatar. The hydrogeologic units on the
Messaieed/Al Wekrah region is composed by two main
aquifers shallow and deep aquifer. The upper aquifer
correspond to the Simsima formation and is formed
within the limestone and overlying sediments. The deep
aquifer is formed by Rus formation. The two aquifers are
typically separated by the relatively impermeable and
continuous Midra shale.
GIS database
In order to simplify the use, the interpretation of the
available hydrogeological data, and to construct the three-
dimensional groundwater flow numerical model, we pro-
pose to develop first a spatial database.
Numerous data from many sources and different types
have been collected, homogenized and integrated in the
GIS spatial database.
The required GIS data for groundwater conceptual
modeling are converted to the appropriate format for
numerical modeling using Arc Map 10.0. The surface
elevation, the geometric boundary of the modeled aquifer,
the aquifer base and top of the different aquifer layers, the
QEZ3 canal and channel, the NPP canal, the two stilling
basins (C and D), the G3 basin, and the monitoring wells
positions (40 observations in August 2010, 41 observation
wells covering the period from July 27, 2011 to December
22, 2013) are saved as shape files which is compatible with
the used modeling software (Fig. 1).
Fig. 2 Conceptual 3D-model of
the Messaieed/Al Wekrah
aquifer
Model. Earth Syst. Environ. (2016) 2:201 Page 3 of 15 201
123

Climate data of rainfall
The average annual rainfall is about 82 mm year-1 and the
Infiltration is 10% of the average annual rainfall. The
recharge is included in the model as 8.2 mm year-1. In
Sabkha areas (salt lake) located outside the study area, in
west direction, the recharge is set to 0 and the evaporation
defined as 100 mm year-1 based on the estimated value
from Hashim (2009).
Groundwater geometry and hydrogeological
parameters
The surface topographic level was interpolated from two
recent topographic grids done in January 16, 2010 and
October 2, 2010 for the QEZ3 project covering the surface
located between the parallels 362,940 and 373,800 north
and 258,300 and 242,700 East. For the South side and
between the parallels 362,940 and 362,940 north and
232,600 and 242,700 East we imposed a topographic level
of ?2.5 m CD (chart datum) = 1.2 m ZQNHD, that is will
not affect the result because this area is so far to the project
QEZ3 canal area.
The aquifer geometry is defined using the wells logging,
geotechnical investigation and geophysics data done in the
region to QEZ3 project. The aquifer is considered as a
multilayer system represented by four layers represented in
the following Table 1 and Fig. 2.
The groundwater hydraulic conductivity and specific
storage have been obtained from the pumping tests data
conducted in the study area in 2011. The calculated
hydraulic conductivity range from 1.0 9 10-7 to
2.0 9 10-4 m s-1. The groundwater pumping is negligible
because of the water high salinity.
Groundwater levels (piezometric levels)
Two types of groundwater levels monitoring are used for
the QEZ3 groundwater model. The monitoring wells are
presented in Fig. 2:
• Piezometric data of August 2010 reduced from 40
piezometric observations represented in Fig. 1 are used
for the steady state calibration. In fact, groundwater is
poorly used because the high groundwater salinity.
• Piezometric monitoring covering the period from July
27, 2011 to December 22, 2013. 41 piezomerters are
used for the transient state calibration. We note the
absence of groundwater monitoring during the year of
2014. Therefore, the model calibration during this
period is not verified.
Governing equations and groundwater model
selection
Three-dimensional groundwater flow can be mathemati-
cally represented given the following equation Eq. (1)
based on water mass balance and Darcy’s law equations
(Bear 1972):
Ssdh
dt� o
oxKx
oh
ox
� �þ o
oyKy
oh
oy
� �þ o
ozKz
oh
oz
� �� �¼ qs ð1Þ
where h is the hydraulic head, Ss is the specific storage, qsis a sink or source, and Kx, Ky, Kz is the hydraulic con-
ductivity in x, y, z directions, respectively. For the simu-
lating the 3-D groundwater flow system, we chose the
Visual MODFLOW model (Waterloo Hydrogeologic Inc
2003). This deterministic numerical model is based on
Darcy’s law and mass conservation concept. It is well-
documented and extensively used all over the world, based
on the horizontal and vertical discretization of the model-
ing domain which solves the groundwater flow equation for
each cell.
The spreading range of the water seepage from sedi-
mentation basins, its directions and its velocity in the area,
are provided using module MODPATH that is incorporated
in the Visual MODFLOW numerical software used to
implement and simulate the 3-D QEZ3-groundwater flow
system. MODPATH calculates 3D particle tracking path-
lines from the simulation output obtained thanks to
MODFLOW.
Results and discussions
Conceptual hydrogeological model
The Messaieed/Al Wekrah aquifer conceptual model has
been constructed based on the design layout of the Qatar
Table 1 Aquifer geometry and characteristics
Depths (m CD) Depths (m QNHD) K average (m s-1)
Superficial deposit Surface topographic level *3 Surface topographic level *1.7 3.5 9 10-5
Limestone (1) 3–22.5 1.7–21.2 2.0 9 10-4
Limestone (2) 22.5–32.5 21.2–31.2 1.0 9 10-5
Midra shale 32.5* 31.2* 1.0 9 10-7
201 Page 4 of 15 Model. Earth Syst. Environ. (2016) 2:201
123

New Port, QEZ3 channels and basins, stilling basins used
to store dredging water, QEZ3, the groundwater piezo-
metric and the geometric proprieties, the number of aquifer
layers, the position of each layer, the flow direction, the
hydraulic conductivity and specific storage of each
groundwater levels. In this step, we take into consideration
the canal and basin excavation that will intercept the
potential seeped quantity of water from basins.
The aquifer is a multilayer system represented by four
layers, formed by superficial deposit, limestone (1), lime-
stone (2) and shale, respectively. From the East, the Sea
imposes a constant head.
The hydrodynamics of the water is influenced by the
aquifer geometry, the sea and the Sabkha climate is char-
acterized by strong evaporation (Hashim 2009).
Because of the saline nature of aquifer water it is unlikely
that groundwater is used for domestic, agricultural, or other
purposes in the surrounding area. This is confirmed in
Hashim (2009) where the area does not figure as a zone with
groundwater abstractions or any other use. That is why we
consider that before August 2010 the GWL is stable and The
modeling period is about 6 years from August 2010 to May
2015. According to the piezometric map of August 2010
(Fig. 4), the groundwater levels vary in the study area from a
low of -1.5 m QNHD to a high of ?0.8 m QNHD (August
2010). The map shows a depression in groundwater levels to
the immediate southwest of QEZ3 canal site (Fig. 1).
Groundwater levels generally increase near the coast, in
response to the sea water levels. An observed increase in
groundwater levels toward southern areas of the NPP site
(Fig. 1) may be in response to the presence of large stilling
basins filled by dredged waters.
Model discretisation
The numerical model domain is assumed to be a rectangle
shape (12.1 9 14.5 km) and an area of 175.45 km2. It is
located between the parallels 358,300 and 373,800 north and
232,600 and 244,700 East, in the Qatar National Datum 1995
coordinate system. The vertical levels is referred to the
Qatar National Height Data (ZQNHD = ZCD - 1.3 m),
also used in the database. The modeling grid consists of 141
rows and 121 columns. Each cell has a size of
100 m 9 100 m aligned to the West–East direction that
coincides with the main groundwater flow direction. The grid
cells are designated as ‘‘inactive’’ outside the model domain
and as ‘‘active’’ inside the model domain.
Boundary conditions
It is mandatory to define the different boundary conditions
for the groundwater numerical model. In the case of the
Messaieed/Al Wekrah aquifer, boundary conditions will
describe the exchange of flow between the model and the
external system (rainfall infiltration, Sea, the two stilling
basins…).
The boundary conditions define the exchange of flow
between the groundwater model and the external system. In
the case of QEZ3 project model, fixed-head boundary
conditions are applied to the Eastern boundary, as imposed
by the Sea water resistance h ¼ 0mQNHDð Þ. It can be
represented in the Visual Modlow model by river boundary
conditions. To the North, South, and West sides, we con-
sidered an impermeable boundaries (no-flow conditionsdh
dt¼ 0). In fact, the model aim is to study the groundwater
evolution in the QEZ3 area and the aquifer limits are so far
of the study area.
In addition, MEDCO (dredging company in charge of
NPP) has started pumping water into G3 basin on 14
February 2013. The G3 Basin is expected to finish oper-
ating by August 2014. In this case the G3 basin imposed
fixed-head boundary conditions to the aquifer
h ¼ 5 m CD ¼ 3:7 m QNHDð Þ during the dredging period
(from 14 February 2013 to August 2014).
Finally, the two stilling basins will impose also fixed-
head boundary conditions to the aquifer
h ¼ 7 m CD ¼ 5:7 m QNHDð Þ during the dredging period
(from September 2014 to May 2015).
Model calibration
The calibration aims to obtain an optimal fit between the
calculated and measured data, which is also an important
measure for the reliability of the operational model. The
calibration of the current groundwater model involved two
sequential steps, detailed below.
The steady state model and initial conditions
First, the steady state model representing the state of the
aquifer system before the QEZ3 canal project works. It was
calibrated using the water level data from 40 observation wells
measured in August 2010. The aim of this step is to understand
the trend of groundwater level in the whole domain.
Meanwhile, the initial distribution of hydraulic con-
ductivity values was estimated from pumping test con-
ducted in the study area (Table 1). The annual averaged
rainfall distributions are applied at the top surface. The
infiltration rate represents the groundwater recharge, which
is estimated by 10% of the precipitation (82 mm year-1).
In addition, an evaporation of 100 mm is imposed in the
groundwater domain.
Figure 3 shows a scatter diagram of the observed and
calculated water level in monitoring wells, with correlation
Model. Earth Syst. Environ. (2016) 2:201 Page 5 of 15 201
123

coefficient of 0.879. Therefore, it can be concluded from
the comparisons presented here that the current numerical
model provides a fair simulation of the groundwater flow.
Figure 4 represents the modeled piezometric map of
August 2010.
Transient state simulations
The modeling period is about 6 years from August 2010 to
May 2015 in accordance with the available data. The
transient model calibration was performed by simulating
groundwater level changes in response to the variations of
the natural and artificial recharge quantities due to the
rainfall fluctuations. The transient model is based on the
preliminary hydrogeological properties obtained from the
steady-state calibration. The porosity for the unconfined
party and specific storage for the confined party of the
aquifer were arbitrary chosen.
For the transient simulations, the geometric and the
hydraulic conductivities of the aquifer are the same as
those used for the steady state simulations. The resulting
flow field of the steady state model is used as the initial
condition for the subsequent transient simulations of the
flow system in response to the dynamic recharge. Analo-
gous to the steady state simulation, the groundwater
recharge is assumed as 8 mm year-1.
The transient model calibration is accomplished by
simulating hydraulic head changes in response to changes
in recharge and porosity, with regard to the time series data
of water level. The comparison of calculated and measured
water level in observation wells are shown in Fig. 5 indi-
cating an acceptable calibration.
3-D groundwater flow numerical model scenarios
and results
The simulation period spans from August 2010 to May
2015 (Table 2). This period is fixed in relation of the time
schedule of QEZ3 project.
Time schedule and model scenarios
The time schedule of QEZ3 project is pacified with dif-
ferent project phases (Table 2):
• MEDCO (dredging company in charge of NPP) has
started pumping water into G3 on February 14, 2013
and discharging out of G3 basin to the sea on April 30,
2013. The G3 basin is expected to finish operating by
August 2014.
• HBC (dredging company in charge of QEZ3) deepens
basin excavation below existing groundwater level June
2014 with dewatering.
• HBC reaches final excavation level of -7.5 m
CD = -6.3 m QNHD part of the area at September
2014.
• HBC starts dredging and fill the still basin from
September 2014 and completes dredging May 2015.
• NPP basin starts flooded from February 2015 for
39 days.
The model aim is to estimate the groundwater level, that
is way we propose to definite the scenarios according to the
time schedule of QEZ3 project. In this case we propose to
study groundwater piezometric level for three scenarios.
a. Scenario 1 Scenario 1 is based in three conditions:
• G3 basin imposed fixed-head boundary conditions
to the aquifer h ¼ 5 m CD ¼ 3:7 m QNHDð Þ dur-
ing the dredging period of NPP canal (from
February 14, 2013 to August 2014).
• Dewatering of the entire QEZ3 canal with
5000 m3 h-1.
• Dewatering from NPP basin with an average of
about 6700 m3 h-1.
b. Scenario 2 Scenario 2 is based in three conditions:
• Dewatering of the entire QEZ3 canal with
5000 m3 h-1.
• Dewatering from NPP basin with an average of
about 6700 m3 h-1.
• Stilling basins (C and D) imposed fixed-head
boundary conditions to the aquifer (h = 7.0 m
CD = 5.7 m QNHD).Fig. 3 Comparison of observed and calculated head in the steady
state
201 Page 6 of 15 Model. Earth Syst. Environ. (2016) 2:201
123

c. Scenario 3 Scenario 3 is based in three conditions:
• Stilling basins (C and D) imposed fixed-head
boundary conditions to the aquifer (h = 7.0 m
CD = 5.7 m QNHD).
• Dewatering of the entire QEZ3 canal with
5000 m3 h-1.
• Flooding of NPP basin (recover of groundwater
level approximately to ?1 m CD).
Fig. 4 Modeled groundwater piezometric map in upper aquifer (August, 2010)
Model. Earth Syst. Environ. (2016) 2:201 Page 7 of 15 201
123
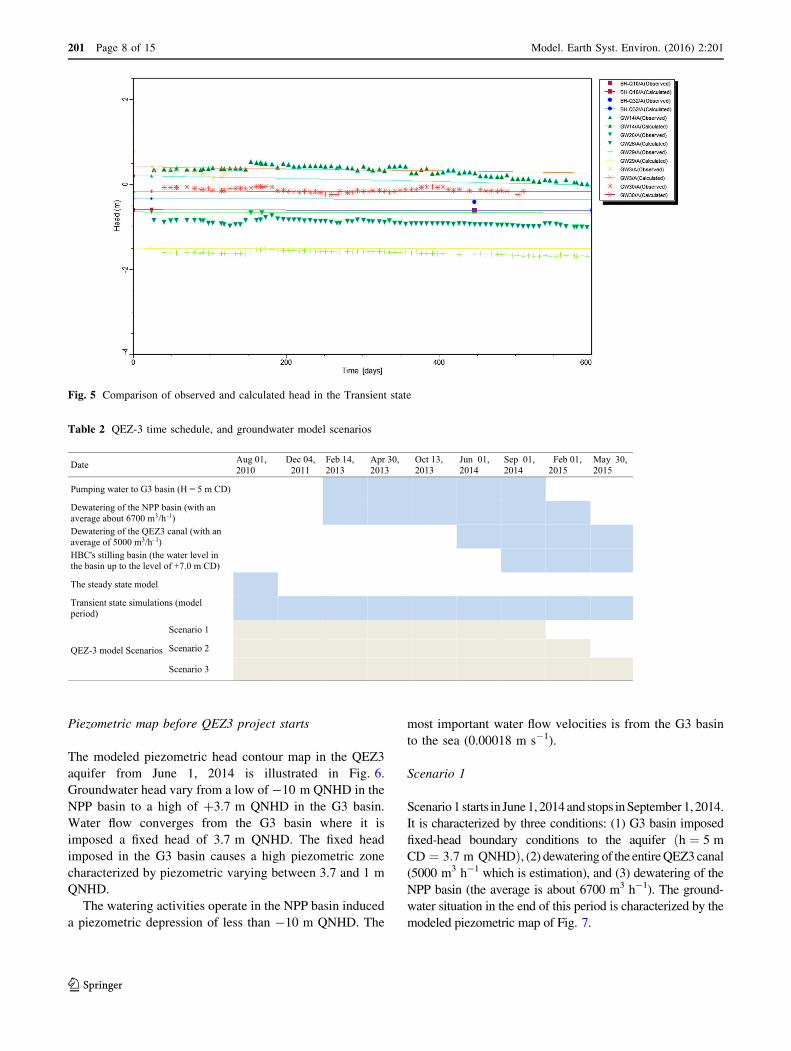
Piezometric map before QEZ3 project starts
The modeled piezometric head contour map in the QEZ3
aquifer from June 1, 2014 is illustrated in Fig. 6.
Groundwater head vary from a low of -10 m QNHD in the
NPP basin to a high of ?3.7 m QNHD in the G3 basin.
Water flow converges from the G3 basin where it is
imposed a fixed head of 3.7 m QNHD. The fixed head
imposed in the G3 basin causes a high piezometric zone
characterized by piezometric varying between 3.7 and 1 m
QNHD.
The watering activities operate in the NPP basin induced
a piezometric depression of less than -10 m QNHD. The
most important water flow velocities is from the G3 basin
to the sea (0.00018 m s-1).
Scenario 1
Scenario 1 starts in June 1, 2014 and stops in September 1, 2014.
It is characterized by three conditions: (1) G3 basin imposed
fixed-head boundary conditions to the aquifer h ¼ 5 mðCD ¼ 3:7 m QNHDÞ, (2) dewatering of the entire QEZ3 canal
(5000 m3 h-1 which is estimation), and (3) dewatering of the
NPP basin (the average is about 6700 m3 h-1). The ground-
water situation in the end of this period is characterized by the
modeled piezometric map of Fig. 7.
Fig. 5 Comparison of observed and calculated head in the Transient state
Table 2 QEZ-3 time schedule, and groundwater model scenarios
Date Aug 01, 2010
Dec 04, 2011
Feb 14, 2013
Apr 30, 2013
Oct 13, 2013
Jun 01, 2014
Sep 01, 2014
Feb 01, 2015
May 30, 2015
Pumping water to G3 basin (H = 5 m CD)
Dewatering of the NPP basin (with an average about 6700 m3
Dewatering of the QEZ3 canal (with an average of 5000 m3 –1/h )
–1/h )
HBC's stilling basin (the water level in the basin up to the level of +7.0 m CD)
The steady state model
Transient state simulations (modelperiod)
QEZ-3 model Scenarios
Scenario 1
Scenario 2
Scenario 3
201 Page 8 of 15 Model. Earth Syst. Environ. (2016) 2:201
123
The modeled piezometric level varies between -10 m
QNHD in the NPP basin to 3.7 m QNHD in the G3 basin.
The water flow converges from G3 to the QEZ3 canal and
the NPP canal. The piezometric map is characterized by the
presence of two piezometric depressions. The first
depression is located in the NPP basin with piezometric
level that can be less than -10 m QNHD. The second
piezometric depression is observed in the QEZ3 canal, that
is explained by the dewatering of the QEZ3 Canal
(5000 m3 h-1) influence. The high piezometric zone is
Fig. 6 Modeled groundwater piezometric map and presentation of
water flow velocities in upper aquifer before HBC deepens basin
excavation and dewatering (June 1, 2014), showing the directions and
the velocity of groundwater in the area of Stilling Basins (the
maximum velocity calculated by the model is 0.00018 m s-1)
Model. Earth Syst. Environ. (2016) 2:201 Page 9 of 15 201
123

observed in the G3 basin and caused by the pumping water
to the G3 basin.
Two important water flow velocities are presented in
this scenario. The first one is from G3 to the sea. The
second one is from the G3 to the QEZ3 canal. It is caused
by the dewatering of the entire QEZ3 canal.
Scenario 2
Scenario 2 is characterized by three conditions: (1) The
water level in stilling basins (C and D) imposed fixed-head
boundary conditions to the aquifer (h = 7 m CD), (2)
Dewatering of the entire QEZ3 canal (5000 m3 h-1 which
Fig. 7 Modeled groundwater piezometric map and presentation of
water flow velocities in upper aquifer for scenario 1 before HBC starts
dredging (September 1, 2014), showing the directions and the velocity
of groundwater in the area of Stilling Basins (the maximum velocity
calculated by the model is 0.00018 m s-1)
201 Page 10 of 15 Model. Earth Syst. Environ. (2016) 2:201
123

is estimation), and (3) dewatering of the NPP basin (the
average is about 6700 m3 h-1). Scenario 2 starts in
September 1, 2014 and stops in February 1, 2015 when the
flooding of NPP basin starts.
Two types of fixed-head boundary conditions are
applied to the groundwater in scenario 2. In addition to the
fixed-head imposed by the Sea water resistance
h ¼ 0m QNHDð Þ, the two stilling basins will impose also
fixed-head boundary conditions to the aquifer
Fig. 8 Modeled groundwater piezometric map and presentation of
water flow velocities in upper aquifer for scenario 2 before NPP basin
starts flooded (February 1, 2015), showing the directions and the
velocity of groundwater in the area of Stilling Basins (the maximum
velocity calculated by the model is 0.00019 m s-1)
Model. Earth Syst. Environ. (2016) 2:201 Page 11 of 15 201
123
h ¼ 7 m CD ¼ 5:7 m QNHDð Þ during the dredging period
(from September 2014 to May 2015).
The groundwater situation is characterized by increase
in the piezometric level situated in the QEZ3 basins area
(Fig. 8). The piezometric level decrease from 5.7 m
QNHD in stilling basins to -4 m QNHD in the NPP canal
in the South of the aquifer. The water flow follows the
North to South direction.
The hydraulic gradient is strange in the stilling basins
region and decreases in the west direction. In the North and
South of study region the piezometric vary between 0 m
QNHD and 0.2 m QNHD. The water flow diverges from
the QEZ3 stilling basins. It diverges to the sea, following
the West–East direction. The water flow velocities in
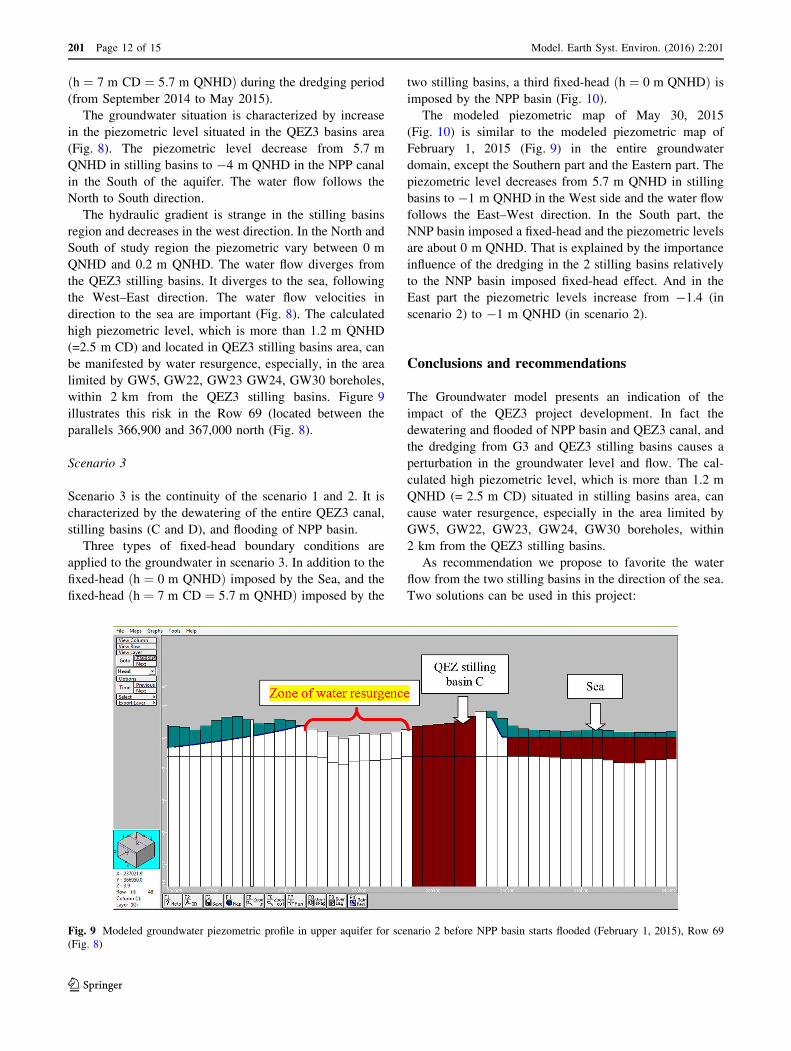
direction to the sea are important (Fig. 8). The calculated
high piezometric level, which is more than 1.2 m QNHD
(=2.5 m CD) and located in QEZ3 stilling basins area, can
be manifested by water resurgence, especially, in the area
limited by GW5, GW22, GW23 GW24, GW30 boreholes,
within 2 km from the QEZ3 stilling basins. Figure 9
illustrates this risk in the Row 69 (located between the
parallels 366,900 and 367,000 north (Fig. 8).
Scenario 3
Scenario 3 is the continuity of the scenario 1 and 2. It is
characterized by the dewatering of the entire QEZ3 canal,
stilling basins (C and D), and flooding of NPP basin.
Three types of fixed-head boundary conditions are
applied to the groundwater in scenario 3. In addition to the
fixed-head h ¼ 0 m QNHDð Þ imposed by the Sea, and the
fixed-head h ¼ 7 m CD ¼ 5:7 m QNHDð Þ imposed by the
two stilling basins, a third fixed-head h ¼ 0 m QNHDð Þ is
imposed by the NPP basin (Fig. 10).
The modeled piezometric map of May 30, 2015
(Fig. 10) is similar to the modeled piezometric map of
February 1, 2015 (Fig. 9) in the entire groundwater
domain, except the Southern part and the Eastern part. The
piezometric level decreases from 5.7 m QNHD in stilling
basins to -1 m QNHD in the West side and the water flow
follows the East–West direction. In the South part, the
NNP basin imposed a fixed-head and the piezometric levels
are about 0 m QNHD. That is explained by the importance
influence of the dredging in the 2 stilling basins relatively
to the NNP basin imposed fixed-head effect. And in the
East part the piezometric levels increase from -1.4 (in
scenario 2) to -1 m QNHD (in scenario 2).
Conclusions and recommendations
The Groundwater model presents an indication of the
impact of the QEZ3 project development. In fact the
dewatering and flooded of NPP basin and QEZ3 canal, and
the dredging from G3 and QEZ3 stilling basins causes a
perturbation in the groundwater level and flow. The cal-
culated high piezometric level, which is more than 1.2 m
QNHD (= 2.5 m CD) situated in stilling basins area, can
cause water resurgence, especially in the area limited by
GW5, GW22, GW23, GW24, GW30 boreholes, within
2 km from the QEZ3 stilling basins.
As recommendation we propose to favorite the water
flow from the two stilling basins in the direction of the sea.
Two solutions can be used in this project:
Fig. 9 Modeled groundwater piezometric profile in upper aquifer for scenario 2 before NPP basin starts flooded (February 1, 2015), Row 69
(Fig. 8)
201 Page 12 of 15 Model. Earth Syst. Environ. (2016) 2:201
123
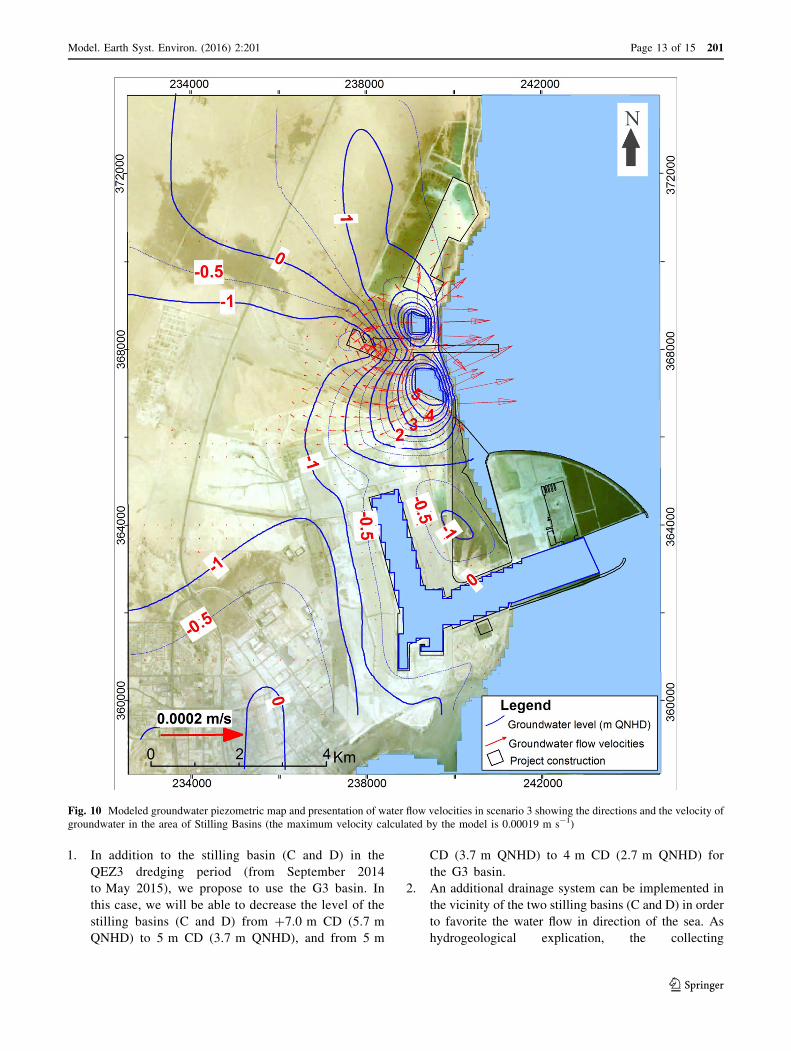
1. In addition to the stilling basin (C and D) in the
QEZ3 dredging period (from September 2014
to May 2015), we propose to use the G3 basin. In
this case, we will be able to decrease the level of the
stilling basins (C and D) from ?7.0 m CD (5.7 m
QNHD) to 5 m CD (3.7 m QNHD), and from 5 m
CD (3.7 m QNHD) to 4 m CD (2.7 m QNHD) for
the G3 basin.
2. An additional drainage system can be implemented in
the vicinity of the two stilling basins (C and D) in order
to favorite the water flow in direction of the sea. As
hydrogeological explication, the collecting
Fig. 10 Modeled groundwater piezometric map and presentation of water flow velocities in scenario 3 showing the directions and the velocity of
groundwater in the area of Stilling Basins (the maximum velocity calculated by the model is 0.00019 m s-1)
Model. Earth Syst. Environ. (2016) 2:201 Page 13 of 15 201
123
groundwater trench around sediment basin will play
the role of an artificial groundwater discharge fields.
References
Baalousha HM (2016a) Development of a groundwater flow model
for the highly parameterized Qatar aquifers. Model Earth Syst
Environ 2:67. doi:10.1007/s40808-016-0124-8
Baalousha HM (2016b) Using Monte Carlo simulation to estimate
natural groundwater recharge in Qatar. Model Earth Syst
Environ 2:87. doi:10.1007/s40808-016-0140-8
Bear J (1972) Dynamics of fluids in porous media. Dover Publica-
tions, New York. COWI’s report: 01 Technical
Reports\EIA\Submission\Rev1\Vol I-Vol I-EIA\P-70876-EZ3-
PR-05-QEZ3 Canal EIA rev 1
Calderhead AI, Martel R, Garfias J, Rivera A, Therrien R (2012)
Pumping dry: an increasing groundwater budget deficit induced
by urbanization, industrialization, and climate change in an over-
exploited volcanic aquifer. Environ Earth Sci 66:1753–1767.
doi:10.1007/s12665-011-1398-9
Chambers JE, Meldrum PI, Wilkinson PB, Ward W, Jackson C,
Matthews B, Joel P, Kuras O, Bai L, Uhlemann S, Gunn D
(2016) Spatial monitoring of groundwater drawdown and
rebound associated with quarry dewatering using automated
time-lapse electrical resistivity tomography and distribution
guided clustering. Eng Geol. doi:10.1016/j.enggeo.2015.05.015
Chen K, Jiao JJ (2014) Modeling freshening time and hydrochemical
evolution of groundwater in coastal aquifers of Shenzhen, China.
Environ Earth Sci 71:2409–2418. doi:10.1007/s12665-013-
2641-3
CIA (2013) The World Fact Book. Middle East: Qatar. http://www.
cia.gov/library/publications/the-world-factbook/geos/qa.html.
Accessed 30 April 2014
Ehteshami M, Dolatabadi Farahani N, Tavassoli S (2016) Simulation
of nitrate contamination in groundwater using artificial neural
networks. Model Earth Syst Environ 2:28. doi:10.1007/s40808-
016-0080-3
FAO (2015) Irrigation in the Middle East region in figures—
AQUASTAT Survey 2008. AQUASTAT website, Food and
Agriculture Organization of the United Nations (FAO). http://
www.fao.org/nr/water/aquastat/countries_regions/qat/index.stm
Gopinath S, Srinivasamoorthy K, Saravanan K, Suma CS, Prakash R,
Senthilnathan D, Chandrasekaran N, Srinivas Y, Sarma VS
(2016) Modeling saline water intrusion in Nagapattinam coastal
aquifers, Tamilnadu, India. Model Earth Syst Environ 2:2.
doi:10.1007/s40808-015-0058-6
Hashim MA (2009) Water, Agriculture and Environment in Arid
Lands—Water and Agriculture Vision for Qatar By 2020
Hussien BM (2013) Modeling the impact of groundwater depletion on
the hydrochemical characteristic of groundwater within Mullusi
carbonate aquifer-west Iraq. Environ Earth Sci 70:453–470.
doi:10.1007/s12665-012-2139-4
Jahanshahi R, Zare M (2015) Assessment of heavy metals pollution in
groundwater of Golgohar iron ore mine area, Iran. Environ Earth
Sci 74:505–520. doi:10.1007/s12665-015-4057-8
Jain M, Dawa D, Mehta R, Dimri AP, Pandit MK (2016) Monitoring
land use change and its drivers in Delhi, India using multi-
temporal satellite data. Model Earth Syst Environ 2:19. doi:10.
1007/s40808-016-0075-0
Jaramillo-Nieves LG, Ge S (2012) Groundwater modeling of the
Silver Bell Mountains, Arizona, USA. Environ Earth Sci
66:1933–1941. doi:10.1007/s12665-011-1418-9
Jothibasu A, Anbazhagan S (2016) Modeling groundwater probability
index in Ponnaiyar River basin of South India using analytic
hierarchy process. Model Earth Syst Environ 2:109. doi:10.1007/
s40808-016-0174-y
Khadri SFR, Chaitanya P (2016) Ground water flow modeling for
calibrating steady state using MODFLOW software: a case study
of Mahesh River basin, India. Model Earth Syst Environ 2:39.
doi:10.1007/s40808-015-0049-7
Khorasani M, Ehteshami M, Ghadimi H, Salari M (2016) Simulation
and analysis of temporal changes of groundwater depth using
time series modeling. Model Earth Syst Environ 2:90. doi:10.
1007/s40808-016-0164-0
Kuiper N, Rowell C, Shomar B (2015) High levels of molybdenum in
Qatar’s groundwater and potential impacts. J Geochem Explor
150:16–24
Lachaal F, Mlayah M, Bedir B, Tarhouni J, Leduc C (2012)
Development and application of three-dimensional groundwater
flow numerical model to complex aquifer system in arid and
semi-arid regions using MODFLOW and GIS tools: Zeramdine-
Beni Hassen Miocene aquifer system (east–central Tunisia).
Comput Geosci 48:187–198. doi:10.1016/j.cageo.2012.05.007
Lachaal F, Mlayah A, Anane M, Bedir M, Tarhouni J, Leduc C (2013)
Comprehension and hydrogeological conceptualization of aqui-
fer in arid and semi-arid regions using integrated hydrogeolog-
ical information system: case of the deep aquifer of Zeramdine-
Beni Hassen (east-central Tunisia). Arab J Geosci
6(7):2655–2671. doi:10.1007/s12517-011-0498-x
McDonald RI, Green P, Balk D, Fekete B, Revenga C, Todd M,
Montgomery M (2011) Urban growth, climate change, and
freshwater availability. Proc Natl Acad Sci USA 108:6312–6317
McDonald RI et al (2014) Water on an urban planet: Urbanization and
the reach of urban water infrastructure. Glob Environ Change
27:96–105
Mohamed Ashour M (2013) Sabkhas in Qatar peninsula. Landscape
and Geodiversity, issue 1/2013, pp 10–35. ISSN 2286-0177.
ICCS, Spiru Haret University
Mokarram M (2016) Modeling of multiple regression and multiple
linear regressions for prediction of groundwater quality (case
study: north of Shiraz). Model Earth Syst Environ 2:3. doi:10.
1007/s40808-015-0059-5
Mondal B, Das DN, Dolui G (2015) Modeling spatial variation of
explanatory factors of urban expansion of Kolkata: a geograph-
ically weighted regression approach. Model Earth Syst Environ
1:29. doi:10.1007/s40808-015-0026-1
Pandey B, Joshi PK (2015) Numerical modelling spatial patterns of
urban growth in Chandigarh and surrounding region (India)
using multi-agent systems. Model Earth Syst Environ. doi:10.
1007/s40808-015-0005-6
Pujades E, Vazquez-Sune E, Culı L, Carrera J, Ledesma A, Jurado A
(2016) Hydrogeological impact assessment by tunnelling at sites
of high sensitivity. Eng Geol. doi:10.1016/j.enggeo.2015.05.018
Sajil Kumar PJ (2016) Influence of water level fluctuation on
groundwater solute content in a tropical south Indian region: a
geochemical modelling approach. Model Earth Syst Environ
2:171. doi:10.1007/s40808-016-0235-2
Seyedmohammadi J, Esmaeelnejad L, Shabanpour M (2016) Spatial
variation modeling of groundwater electrical conductivity using
geostatistics and GIS. Model Earth Syst Environ 2:169. doi:10.
1007/s40808-016-0226-3
Shomar B, Darwish M, Rowell C (2014) What does integrated water
resources management from local to global perspective mean?
Qatar as a Case Study, the Very Rich Country with No Water.
Water Resour Manag 28:2781–2791. doi:10.1007/s11269-014-
0636-9
Uddameri V, Singaraju S, Hernandez EA (2014) Impacts of sea-level
rise and urbanization on groundwater availability and
201 Page 14 of 15 Model. Earth Syst. Environ. (2016) 2:201
123

sustainability of coastal communities in semi-arid South Texas.
Environ Earth Sci 71:2503–2515. doi:10.1007/s12665-013-
2904-z
UN-Qatar (2009) National Vision 2030. Advancing sustainable
development, Qatar Second Human Report, Qatar’s second
human development report, Doha, Qatar
Wang J, Feng B, Yu H, Guo T, Yang G, Tang J (2013) Numerical
study of dewatering in a large deep foundation pit. Environ Earth
Sci 69:863–872. doi:10.1007/s12665-012-1972-9
Wang J, Huang T, Hu J, Wu L, Li G, Yang P (2014) Field
experiments and numerical simulations of whirlpool foundation
pit dewatering. Environ Earth Sci 71:3245–3257. doi:10.1007/
s12665-013-2981-z
Wang J, Wu Y, Liu X, Yang T, Wang H, Zhu Y (2016) Areal
subsidence under pumping well–curtain interaction in subway
foundation pit dewatering: conceptual model and numerical
simulations. Environ Earth Sci 75:198. doi:10.1007/s12665-015-
4860-2
Waterloo Hydrogeologic Inc (2003) Visual Modflow V.3.1. User’s
manual for professional applications in three-dimensional
groundwater flow and contaminant transport modeling, p 452
Xu B, Yan C, Sun Q, Liu Y, Hou J, Liu S, Che C (2016) Field
pumping experiments and numerical simulations of shield tunnel
dewatering under the Yangtze River. Environ Earth Sci 75:715.
doi:10.1007/s12665-016-5493-9
Zammouri M, Jarraya-Horriche F, Odo BO, Benabdallah S (2014)
Assessment of the effect of a planned marina on groundwater
quality in Enfida plain (Tunisia). Arab J Geosci 7(3):1187–1203.
doi:10.1007/s12517-012-0814-0
Model. Earth Syst. Environ. (2016) 2:201 Page 15 of 15 201
123