Groundwater Contamination Part 3 Potential with...
18
1 Stormwater Controls Stormwater Controls Emphasizing Emphasizing Part 3 Stormwater Controls Stormwater Controls Emphasizing Emphasizing Infiltration, Evapotranspiration, and Infiltration, Evapotranspiration, and Beneficial Uses: green roofs, cisterns, Beneficial Uses: green roofs, cisterns, biofiltration/bioretention, porous biofiltration/bioretention, porous pavement and swales pavement and swales pavement, and swales pavement, and swales Robert Pitt, Ph.D., P.E., BCEE, D. WRE Cudworth Professor of Urban Water Systems Department of Civil, Construction, and Environmental Engineering University of Alabama Tuscaloosa, AL, USA 35487 Groundwater Contamination Potential with Stormwater Infiltration • Enhanced infiltration increases water movement to groundwater compared to conventional development groundwater compared to conventional development. • Care must also be taken to minimize groundwater contamination when infiltrating stormwater. Book published by Ann Arbor P /CRC 219 Press/CRC, 219 pages. 1996, based on EPA research and NRC committee work. Karst formation at Barton Springs, San Antonio, Texas Groundwater Impacts Associated with Stormwater Infiltration • Scattered information is available addressing groundwater impacts in urban areas. Major information sources include: • Historically known high chlorides under northern cities • EPA 1983 NURP work on groundwater beneath Fresno and Long Island infiltration basins • NRC 1994 report on groundwater recharge using waters of impaired quality • USGS work on groundwater near stormwater • USGS work on groundwater near stormwater management devices in Florida and Long Island • A number of communities throughout the world (including Portland, OR; Phoenix, AZ; Tokyo; plus areas in France, Denmark, Sweden, Switzerland, and Germany, etc.) Minimal Pre-treatment before Infiltration Increases Groundwater Contamination Potential Perforated pipe for infiltrating stormwater Older infiltration trench at parking lot infiltrating stormwater (also, filter fabric liners are usually not recommended anymore as many have failed due to clogging from silts)
Transcript of Groundwater Contamination Part 3 Potential with...
1
Stormwater ControlsStormwater Controls EmphasizingEmphasizing
Part 3
Stormwater Controls Stormwater Controls Emphasizing Emphasizing Infiltration, Evapotranspiration, and Infiltration, Evapotranspiration, and Beneficial Uses: green roofs, cisterns, Beneficial Uses: green roofs, cisterns,
biofiltration/bioretention, porous biofiltration/bioretention, porous pavement and swalespavement and swalespavement, and swales pavement, and swales Robert Pitt, Ph.D., P.E., BCEE, D. WRE
Cudworth Professor of Urban Water SystemsDepartment of Civil, Construction, and Environmental Engineering
University of AlabamaTuscaloosa, AL, USA 35487
Groundwater Contamination Potential with Stormwater Infiltration
• Enhanced infiltration increases water movement to groundwater compared to conventional developmentgroundwater compared to conventional development.
• Care must also be taken to minimize groundwater contamination when infiltrating stormwater.
Book published by Ann Arbor P /CRC 219Press/CRC, 219 pages. 1996, based on EPA research and NRC committee work.
Karst formation at Barton Springs, San Antonio, Texas
Groundwater Impacts Associated with Stormwater Infiltration
• Scattered information is available addressing groundwater impacts in urban areas. Major information sources include:
• Historically known high chlorides under northern cities• EPA 1983 NURP work on groundwater beneath Fresno
and Long Island infiltration basins • NRC 1994 report on groundwater recharge using
waters of impaired quality • USGS work on groundwater near stormwater• USGS work on groundwater near stormwater
management devices in Florida and Long Island• A number of communities throughout the world
(including Portland, OR; Phoenix, AZ; Tokyo; plus areas in France, Denmark, Sweden, Switzerland, and Germany, etc.)
Minimal Pre-treatment before Infiltration Increases Groundwater Contamination Potential
Perforated pipe for infiltrating stormwaterOlder infiltration trench at parking lot infiltrating stormwater
(also, filter fabric liners are usually not recommended anymore as many have failed due to clogging from silts)

2
Potential Problem Pollutants were Identified by Pitt, et al. (1994 and
1996) Based on a Weak-Link Model Having the Following Components:Having the Following Components:
• Their abundance in stormwater,• Their mobility through the unsaturated
zone above the groundwater andzone above the groundwater, and• Their treatability before discharge.
Pitt, et al. (1994) EPA report available at:http://unix.eng.ua.edu/~rpitt/Publications/BooksandReports/Groundwater%20EPA%20report.pdf
Moderate to High Contamination PotentialSurface Infiltration after Sedimentation plus sorption/ion-exchange (MCTT and bioretention)
Surface Infiltration with minimal Pretreatment (biofiltration with marginal soils)
Injection after Minimal Pretreatment (dry wells, gravel trenches, and most porous pavements)and bioretention) marginal soils) porous pavements)
Lindane, chlordane Lindane, chlordane
Fluoranthene, pyrene Benzo (a) anthracene, bis (2-ethylhexl phthalate), fluoranthene, pentachlorophenol, phenanthrene, pyrene
1,3-dichlorobenzene, benzo (a) anthracene, bis (2-ethylhexl phthalate), fluoranthene, pentachlorophenol, p , py p p ,phenanthrene, pyrene
Enteroviruses Enteroviruses Enteroviruses, some bacteria and protozoa
Nickel, chromium, lead, zinc
Chloride Chloride Chloride
Stormwater Constituents that may Adversely Affect Infiltration Device Life
and Performance• Sediment (suspended solids) will clog device• Major cations (K+, Mg+2, Na+, Ca+2, plus various
heavy metals in high abundance, such as Al and Fe) will consume soil CEC (cation exchange capacity) in competition with stormwater pollutants. p
• An excess of sodium, in relation to calcium and magnesium, can increase the soil’s SAR (sodium adsorption ratio), which decreases the soil’s infiltration rate and hydraulic conductivity.
Enhanced Infiltration and Groundwater Protection with Soil
Amendments
• Modifying soil in biofiltration and bioretention devices can improve their performance, while offering groundwater protectionprotection.

3
Many soil processes reduce the mobility of stormwater pollutants
• Ion exchange, sorption, precipitation, surface Ion exchange, sorption, precipitation, surface complex ion formation, chelation, volatilization, microbial processes, lattice penetration, etc.
• If soil is lacking in these properties, then soil amendments can be added to improve the soil characteristics.
• Cation exchange capacity (CEC), organic matter g p y ( ) g(OM) content, and sodium adsorption ratio (SAR) are soil factors that can be directly measured and water characteristics compared. These are not perfect measures, but can be used as indicators. Other soil processes (especially in complex mixtures) need to be evaluated using controlled experiments.
Effects of Compost-Amendments on Runoff Properties
A series of tests by Rob Harrison of the Univ. of Wash. and Bob Pitt examined soil modifications for rain gardens and other biofiltration areas. These were shown to significantly increase treatment and infiltration capacity compared to native soils.
Six to Eleven Times Increased Infiltration with Modified Soils
Average Infiltration Rate (in/h)
Test plot 1 Alderwood soil alone 0.5es p o de wood so o e 0.5
Test plot 2 Alderwood soil with Ceder Grove compost (old site)
3.0
Test plot 5 Alderwood soil alone 0.3
Test plot 6 Alderwood soil with GroCo compost (old site)
3.3
Pitt, et al. 1999
King County, Washington, test plots of modified soils
Changes in Mass Discharges for Plots having Amended Soil Compared to Unamended Soil
Constituent Surface Runoff Mass Discharges
Subsurface Flow Mass Discharges
Runoff Volume 0.09 (test/control) 0.29 (due to ET)
Phosphate 0.62 3.0
Ammonia 0.56 4.4
Nitrate 0.28 1.5
Copper 0.33 1.2
Zinc 0.061 0.18
Increased mass discharges in subsurface water pollutants observed for many constituents (new plots).

4
Water Quality and Quantity Effects of Amending Urban Soils with Compost
• Surface runoff rates and volumes decreased by six to ten eleven after amending the soils withsix to ten eleven after amending the soils with compost, compared to unamended sites.
• Unfortunately, the concentrations of many pollutants increased in surface runoff from amended soil plots, especially nutrients which were leached from the fresh compost.
• However, the several year old test sites had less, but still elevated concentrations, compared to unamended soil-only test plots.
Typical Biofiltration Facility
Many states are publishing standards for biofiltration/bioretention facilities, including standards for engineered soils.
WDNR, 2004 infiltration standard 1004
Engineered Soil Mixture – WI Technical Standard 1004
• Mineral Sand (40%) – USDA Coarse Sand or ASTM C33 ( )(Fine Aggregate Concrete Sand)
• Compost (30%) – Meet WDNR Spec. S100• Topsoil (30%) – Sandy loam or loamy sand
Unfortunately, most compost specifications are not very clear and also allow many components that are not desirable (such as not fully stabilized materials and even some animalas not fully stabilized materials and even some animal wastes). Need a material that will not be a pollutant source, while adding desirable soil properties. Fully composted garden wastes and some stabilized agricultural products are usually best (CEC of about 15 meq/100g). Peat is one of the best soil amendments, as it has a much greater CEC than other organic materials (about 300 meq/100g).
Near Tullamore, County Offaly, Ireland
Unfortunately, Irish peat harvesting is a surface mining operation of a non-renewable resource.
Locally available organic wastes (composts), appropriately processed, should be investigated as a preferable soil amendment.

5
Tests on Soil Amendments
• Many tests have been conducted to• Many tests have been conducted to investigate filtration/ion exchange/sorption properties of materials that can be potentially used as a soil amendment and as a treatment media in stormwater controls.
Development and Testing of Treatment Methods
Example laboratory and field pilot-scale test setups (EPA and p (WERF-supported research at Univ. of Alabama). Critical that tests use actual stormwater, not artificial mixtures.
Capture of Stormwater Particulates by Different Soils and Amendments
0.45 to 3µm
3 to 12µm
12 to 30µm
30 to 60µm
60 to 120µm
120 to 250µm
>250µm
Porous pavement surface (asphalt or concrete)
0% 0% 0% 10% 25% 50% 100%
Coarse gravel 0% 0% 0% 0% 0% 0% 10%
Fine sand 10% 33% 85% 90% 100% 100% 100%
Loam soil 0% 0% 0% 0% 25% 50% 100%
Activated carbon, peat, and sand mixture
40% 45% 80% 100% 100% 100% 100%
Final underdrain quality is usually greater than 10 to 25 mg/L TSS

6
Laboratory Media Studies • Rate and Extent of Metals Capture– Capacities
(partitioning)– Kinetics (rate of
uptake)uptake)
• Effect of pH & pH changes due to media, particle size, interfering ions, etc
• Packed bed filter studies
• Physical properties and surface area determinations
Example Media Capacities for Copper(high concentration tests; much different for typical
stormwaters; commercial resins much worse and peat and bone char activated carbon very high)
Johnson, et al. 2003
Contaminant Losses during Anaerobic vs. Aerobic Conditions between Events
S d h d li l
Peat had large capacity for Cu
Sand had very little capacity for Cu
No significant stripping of copper during aerobic and anaerobic conditions

7
Peat had greatestPeat had greatest capacity for P
Again, sand had very little capacity
Compost leached soluble P during all conditions, especially if anaerobic
Recent media tests for a broad range of metallic and organic toxicants Site Zeolite GAC
Peat SMZ
Rhyolite Sand
Long-Term Column Tests: Maintenance• Infiltration rates typically decrease over a device’s life due to solids capture on the
surface of and in the media. • Most media typically fail when the total solids loading is about 10 – 25 kg/m2 of
media surface (flow rate < 1 m/d, generally). Full-scale setups clog at about 5 times the capacity as the column tests.
Examined potentialExamined potential maintenance options once flow rate < 5 m/d (effects of disturbing media vs. removing media from filter).
M di l llMedia removal generally more effective, but must remove at least 4 – 6” because clogging solids are captured deep in the media (deeper than visible solids buildup).
Long-Term Column Tests: Removal as a Function of Pollutant Form
Excellent removals of particulate associated pollutants, but removal of dissolved/colloidal components vary greatly by media.
Primary removal mechanism is physical straining/removal of particulate-associated copper.Removal by GAC and then peat may be related to organic complexation of copper in influent water or
complexation with the organic content of the media.Poorer removal by zeolites and sands (typically associated with CEC).

8
Batch Testing to Optimize Contact Time Modeling Bioretention Devices• In this example, two curb-cut biofilters are located in front of each house.
These are between the sidewalk and the street. The curb is cut to allow the gutter water to flow into the first unit, which overflows into the second unit. The second unit then overflows back into the gutter during large rains.E h bi filt i 20 f t l d 5 f t id ith t t l ti d th f• Each biofilter is 20 feet long and 5 feet wide, with a total excavation depth of 5 feet.
• A 2 ft layer of rock fill is a storage layer on the bottom, with a 1-1/2 ft layer of a peat-sand mixture on top of the rock (no filter fabric is used, as they tend to clog with silts, rather a rock filter gradient layer is used instead). There is a one foot storage layer on top of the engineered soil before the overflow weir.
• The only outlets are the native soil and broad crested weir overflows and are therefore bioretention devices A second example has an underdrain and aretherefore bioretention devices. A second example has an underdrain and are therefore biofilters.
• Since these are curb-cut biofilters, they are “land use” biofilters. The input form is located under the “land use” drop down menu then under “land use biofilter.” The contributing source areas that drain to the biofilters are selected. Since these are curb-cut biofilters, all of the source areas are selected.
Main land use biofilter input screen:The required broad-crested weir is the overflow for excessive stormwater that is not infiltrated:

9
Summary output showing about 66% runoff and particulate solids reductions with the biofilters. Compare the “source area total without controls” with the “total before drainage system” for the performance of the biofilters:
The receiving water benefits show a calculated improvement from poor to good.
The program can also calculate the flow-duration curve for the study area, with and without the controls (select the “perform flow-duration curve calculations” on the output summary page). This shows that the peak flows are reduced by about 25% and the duration of large flows greater than 1 cfs are reduced from about 2% to less than 1% of the time.
Biofilter (use of an underdrain)• The following biofilter example is identical to the above
example, except that each biofilter has a 2 inch underdrainexample, except that each biofilter has a 2 inch underdrain that collects filtered water back to the drainage system.
• This is a common approach when the duration of standing water needs to be reduced in marginal soils, or if the filtered stormwater is needed to be discharged to the receiving waters as a water supply (such as may be desired in drought-prone areas), or if the biofilter is desired to be ain drought prone areas), or if the biofilter is desired to be a retention device in a combined sewered area, and infiltration of the water is not desirable or needed.
Biofilter, with a 2 inch underdrain:

10
Input form for the underdrain: Output summary for biofilter example, showing reduced infiltration of runoff, but similar particulate solids reductions:
Flow-duration curves for biofilter with underdrain showing a less extreme change in the flow patterns: Example Site Designs and Evaluations
Emphasizing Bioretention• Bioretention can be most effectively used at newBioretention can be most effectively used at new
development sites; site surveys can identify the best soils, and lead to recommended amendments.
• Bioretention can be used in retrofitted applications, though more costly and not as effective.
i i d i fil i h ld b d i• Bioretention and infiltration should be used in conjunction with other stormwater controls, especially sedimentation (such as wet ponds) and energy controlling practices (such as dry ponds).

11
Modeling Combinations of Practices
• This example shows the effects of a combination of bi t ti /bi filt ti ti i thbioretention/biofiltration practices in the same area.
• Rain gardens for the homes with directly connected downspouts are combined with porous pavement driveways, and grass swales.
• These individual practices were copied from the prior examples using each practice’s copy and paste function.
Land use screen showing the rain gardens and porous pavement controls. The swales are under the “land use” drop down menu under drainage controls.
Overall benefits from these 3 sets of controls, showing about 70% reductions in runoff volume and particulate solids discharges. The receiving water conditions are also shown to improve from poor to good condition.
Flow-duration curves also show more than a 40% reduction in the peak flow expected and large changes in the runoff characteristics, likely approaching natural conditions.
12
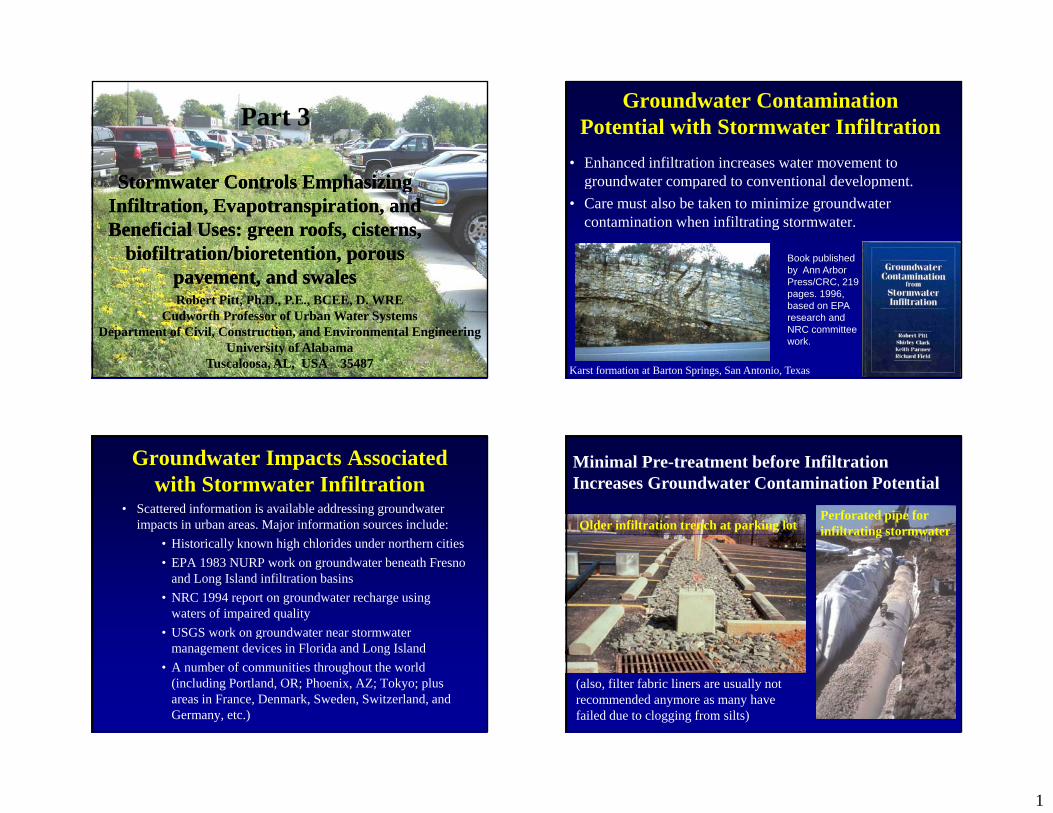
The runoff volume summary also shows the effectiveness of each control practice:
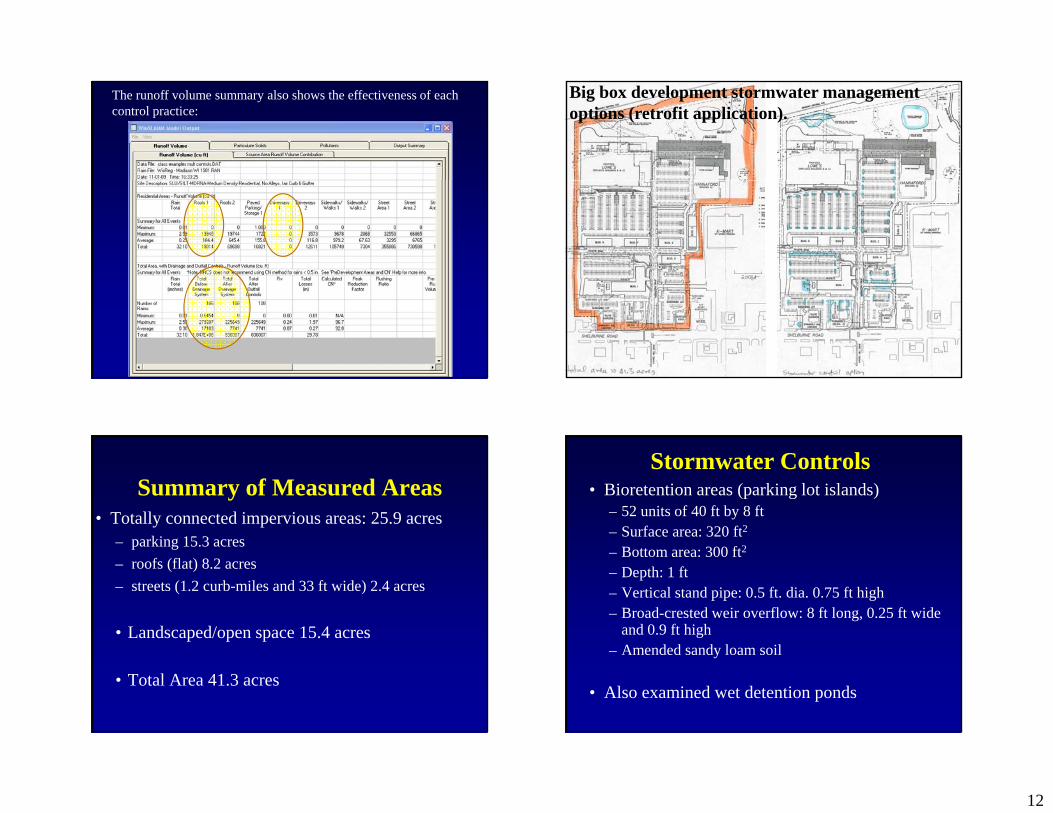
Big box development stormwater management options (retrofit application).
Summary of Measured Areas• Totally connected impervious areas: 25.9 acres
– parking 15.3 acres– roofs (flat) 8.2 acres– streets (1.2 curb-miles and 33 ft wide) 2.4 acres
• Landscaped/open space 15 4 acres• Landscaped/open space 15.4 acres
• Total Area 41.3 acres
Stormwater Controls• Bioretention areas (parking lot islands)
– 52 units of 40 ft by 8 ft– Surface area: 320 ft2 Surface area: 320 ft– Bottom area: 300 ft2
– Depth: 1 ft – Vertical stand pipe: 0.5 ft. dia. 0.75 ft high– Broad-crested weir overflow: 8 ft long, 0.25 ft wide
and 0.9 ft highand 0.9 ft high– Amended sandy loam soil
• Also examined wet detention ponds

13
Modeled Runoff Volume Changes
Base diti
With bi t ticonditions bioretention
Runoff volume (106 ft3/yr)
2.85 1.67
Average Rv 0.59 0.35
% reduction in volume
n/a 41%
Birmingham Southern College Campus (map by Jefferson County Stormwater Management Authority)
Birmingham Southern College Fraternity Row (new construction at
existing site)
Acres % of TotalRoadways 0.24 6.6%Parking 0.89 24.5Walks 0.25 6.9Roofs 0.58 16.0Landscaping 1.67 46.0Total: 3.63 100.0
Supplemental Irrigation Inches per month (example)
Average Use for 1/2 acre (gal/day)(example) (gal/day)
Late Fall and Winter (Nov-March)
1 to 1-1/2 230 - 340
Spring (April-May) 2 to 3 460 - 680
Summer (June- 4 910Summer (JuneAugust)
4 910
Fall (Sept-Oct) 2 to 3 460 - 680
Total: 28 (added to 54 inches of rain)

14
Capture and Reuse of Roof Runoff for Supplemental Irrigation
Tankage Volume (ft3) per 4 000 ft2 B ildi
Percentage of Annual Roof R ff d f I i ti4,000 ft2 Building Runoff used for Irrigation
1,000 56%
2,000 56
4,000 74
8,000 90
16,000 98
Combinations of Infiltration Controls to Reduce Runoff Volume at Birmingham Southern College Site
Total Annual Runoff (ft3/year)
Increase Compared to Undeveloped Conditions
Undeveloped 46,000 --
Conventional development 380,000 8.3XGrass swales and walkway porous pavers
260,000 5.7
Grass swales and walkway porous pavers, plus roof runoff disconnections
170,000 3.7
Grass swales and walkway porous pavers, plus bioretention for roof and parking area runoff
66,000 1.4
Elements of Conservation Design for Cedar Hills Development
(near Madison, Wisconsin, project conducted by Bill Selbig USGS and Roger Bannerman WI DNR)Selbig, USGS, and Roger Bannerman, WI DNR)
• Grass Swales• Wet Detention Pond
I filt ti B i /W tl d• Infiltration Basin/Wetland• Reduced Street Width
The most comprehensive full-scale study comparing advanced stormwater controls available.
Available at: http://pubs.usgs.gov/sir/2008/5008/pdf/sir_2008-5008.pdf

15
About 90% of the site runoff is associated with rains less than about 2.5 inches in depth Thesein depth. These are the events that need attention when trying to reduce runoff at this site. 50% of the rains, by count, are less than about 0.12 inches in depth.
Parallel study areas, comparing test with control site
ExplanationWetpond Infiltrations BasinSwales
Cedar Hill Site Design, Crossplains WI
SwalesSidewalkDrivewayHousesLawnsRoadwayWoodlot
N
500 0 500 1000 Feet
Grass swales
Infiltration area
WI DNR photosWet pond
Some of the stormwater management features at Cedar Hills site.

16
Reductions in Runoff Volume for Cedar Hills (calculated using WinSLAMM
and verified by site monitoring)Type of Control Runoff Expected Change
Volume, inches
(being monitored)
Pre-development 1.3
No Controls 6.7 515% increase
Swales + Pond/wetland + Infiltration Basin
1.5 78% decrease, compared to no
controls15% increase over pre-development
Construction Rainfall Volume L i
Percent of V l
Monitored Performance of Controls at Cross Plains Monitored Performance of Controls at Cross Plains Conservation Design DevelopmentConservation Design Development
Water Year
Phase (inches) LeavingBasin
(inches)
VolumeRetained
(%)
1999 Pre-construction 33.3 0.46 99%
2000 Active construction 33.9 4.27 87%
2001 Active construction 38.3 3.68 90%
2002
Active construction (site is
approximately 75% built-out)
29.4 0.96 97%
WI DNR and USGS data

17
Aerial Photo of Site under Construction (2006 Google Earth image)• On-site bioretention swales• Level spreaders• Large regional swales• Wet detention ponds
C iti l• Critical source area controls• Pollution prevention (no Zn!)• Buffers around sinkholes
Regional swales to collect site runoff and direct to wet detention ponds:
•Length: 1653 ft •infiltration rate in the swale:
WI swale having conventional curbs and gutters
infiltration rate in the swale: 1 in/hr
•swale bottom width: 50 ft •3H:1V side slopes •longitudinal slope: 0.026 ft/ft •Manning’s n roughness
Large swale at MS industrial site
coefficient: 0.024•typical swale depth: 1 ft
Biofilters to drain site runoff (paved parking and roofs) to regional swales:
•Top area: 4400 ft2
•Bottom area: 2000 ft2
•Depth: 2 ft•Depth: 2 ft•Seepage rate: 2 in/hr•Peak to average flow ratio: 3.8•Typical width: 10 ft•Number of biofilters: 13
(one per site)( p )
Parking lot biofilter example, Portland, OR
Wet Detention PondsThe regional swales will direct excess water into the four ponds.
The pond surface areas vary from 0.5 to 1% of the drainage areas dependingdrainage areas, depending on the amount of upland infiltration. The ponds have 3 ft. of standing water above 2 ft. of sacrificial storage. Additional storage volume
Typical pond section:
gprovides necessary peak flow control.Pond in Richmond, CA

18
Conventional DevelopmentDevelopment
Conser ationConservation Design
Conventional DevelopmentDevelopment
Conservation Design
Sediment Reductions
Volume Reductions
• Smallest storms should be captured on-site for reuse or infiltrated
Combinations of Controls Needed to Meet Many Stormwater Management Objectives
reuse, or infiltrated • Design controls to treat
runoff that cannot be infiltrated on site
• Provide controls to reduce energy of large
Pitt, et al. (2000)
reduce energy of large events that would otherwise affect habitat
• Provide conventional flood and drainage controls