Groundwater Baseline Study at Kendal Power Station ... - WML for Ashing at Kendal PS/3...monitoring...
60
May 2014 ZITHOLELE CONSULTING (PTY) LTD Groundwater Baseline Study at Kendal Power Station - Continuous Ash Disposal Facility REPORT Report Number. 12614149-12075-1 Distribution: 1 X Zitholele Consulting 1 X Project File 1 X Library Submitted to: Zitholele Consulting (Pty) Ltd Block B, Thandanani Park Matuka Close Halfway Gardens Midrand 1685 Report Number. 12614149-12075-1 Distribution: Submitted to: Zitholele Consulting
Transcript of Groundwater Baseline Study at Kendal Power Station ... - WML for Ashing at Kendal PS/3...monitoring...
May 2014
ZITHOLELE CONSULTING (PTY) LTD
Groundwater Baseline Study at Kendal Power Station - Continuous Ash Disposal Facility
RE
PO
RT
Report Number. 12614149-12075-1
Distribution:
1 X Zitholele Consulting
1 X Project File
1 X Library
Submitted to:
Zitholele Consulting (Pty) Ltd Block B, Thandanani Park Matuka Close Halfway Gardens Midrand 1685
Report Number. 12614149-12075-1
Distribution:
Submitted to:
Zitholele Consulting

GROUNDWATER BASELINE STUDY - KENDAL POWER STATION CONTINUOUS ASH DISPOSAL
May 2014 Report No. 12614149-12075-1
Executive Summary This groundwater baseline report was prepared for Zitholele Consulting (Pty) Ltd to provide a specialist
groundwater input in support of the Waste License process at Kendal Power Station and for the waste
management licencing for the continues ash disposal at the existing ash dump.
This process involves an Integrated Water Use License (IWUL) for the extension of the existing dry ashing
facility for the existing ash dump at Kendal Power Station.
Groundwater Objectives
The main objectives of the groundwater study are summarised as:
Characterise the prevailing groundwater situation;
Define the water bearing strata in the area;
Determine current groundwater level distribution and flow directions;
Determine baseline groundwater quality;
Conduct a gap analyses; and
Conduct a qualitative assessment of the impact of the extended utilisation of existing ash dump facility
on the groundwater system.
Scope of Work
The following scope of work was followed to complete the work:
Desk study;
Hydrocensus and groundwater sampling;
Groundwater conceptual model;
Gap analyses;
Qualitative Impact Assessment; and
Baseline report.
Groundwater Baseline
Desk study and Information Review
The desk study and information review include the existing hydrogeological reports, NGWD, groundwater
monitoring database and regional geology and hydrogeology maps.
Climate
The mean annual rainfall of the area of investigation is approximately 735 mm per annum and the
temperature extremes range from 27.7°C in summer to -1.89°C in winter.
Geology
The Kendal power station is mainly underlain with Karoo Sequence sediments comprising of shale,
carbonaceous shale, sandstone and coal of the Vryheid formation of the Ecca Group. A pre-Karoo diabase
sill is present to the west of the site. Medium to coarse grained porphyritic and biotite granite of the Lebowa
granite suite, part of the Bushveld Igneous Complex (BIC) together with sediments of the Transvaal
Sequence (TS) Rooiberg Group (Selons River Formation) underlie part of the continuous ash disposal site.
Hydrocensus
Two private boreholes were located in the vicinity of the ash disposal facility; boreholes were sampled to
determine groundwater quality of surrounding groundwater users.
GROUNDWATER BASELINE STUDY - KENDAL POWER STATION CONTINUOUS ASH DISPOSAL
May 2014 Report No. 12614149-12075-1
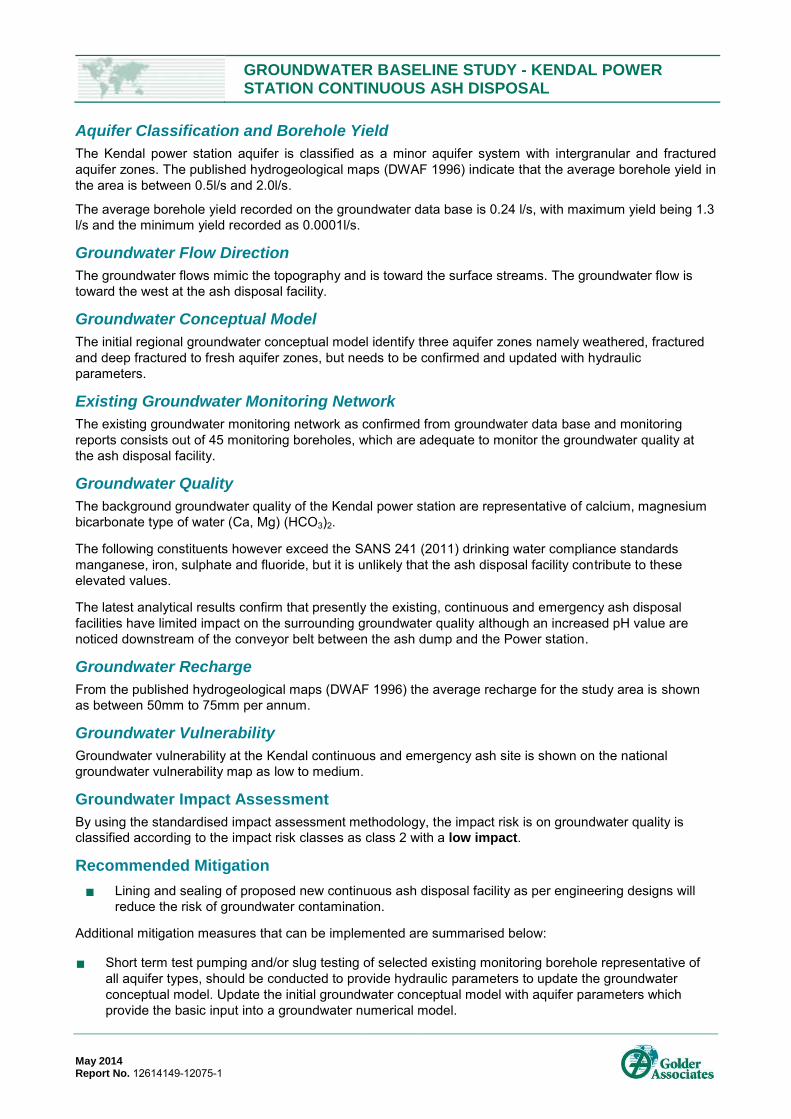
Aquifer Classification and Borehole Yield
The Kendal power station aquifer is classified as a minor aquifer system with intergranular and fractured
aquifer zones. The published hydrogeological maps (DWAF 1996) indicate that the average borehole yield in
the area is between 0.5l/s and 2.0l/s.
The average borehole yield recorded on the groundwater data base is 0.24 l/s, with maximum yield being 1.3
l/s and the minimum yield recorded as 0.0001l/s.
Groundwater Flow Direction
The groundwater flows mimic the topography and is toward the surface streams. The groundwater flow is
toward the west at the ash disposal facility.
Groundwater Conceptual Model
The initial regional groundwater conceptual model identify three aquifer zones namely weathered, fractured
and deep fractured to fresh aquifer zones, but needs to be confirmed and updated with hydraulic
parameters.
Existing Groundwater Monitoring Network
The existing groundwater monitoring network as confirmed from groundwater data base and monitoring
reports consists out of 45 monitoring boreholes, which are adequate to monitor the groundwater quality at
the ash disposal facility.
Groundwater Quality
The background groundwater quality of the Kendal power station are representative of calcium, magnesium
bicarbonate type of water (Ca, Mg) (HCO3)2.
The following constituents however exceed the SANS 241 (2011) drinking water compliance standards
manganese, iron, sulphate and fluoride, but it is unlikely that the ash disposal facility contribute to these
elevated values.
The latest analytical results confirm that presently the existing, continuous and emergency ash disposal
facilities have limited impact on the surrounding groundwater quality although an increased pH value are
noticed downstream of the conveyor belt between the ash dump and the Power station.
Groundwater Recharge
From the published hydrogeological maps (DWAF 1996) the average recharge for the study area is shown
as between 50mm to 75mm per annum.
Groundwater Vulnerability
Groundwater vulnerability at the Kendal continuous and emergency ash site is shown on the national
groundwater vulnerability map as low to medium.
Groundwater Impact Assessment
By using the standardised impact assessment methodology, the impact risk is on groundwater quality is
classified according to the impact risk classes as class 2 with a low impact.
Recommended Mitigation
Lining and sealing of proposed new continuous ash disposal facility as per engineering designs will
reduce the risk of groundwater contamination.
Additional mitigation measures that can be implemented are summarised below:
Short term test pumping and/or slug testing of selected existing monitoring borehole representative of
all aquifer types, should be conducted to provide hydraulic parameters to update the groundwater
conceptual model. Update the initial groundwater conceptual model with aquifer parameters which
provide the basic input into a groundwater numerical model.

GROUNDWATER BASELINE STUDY - KENDAL POWER STATION CONTINUOUS ASH DISPOSAL
May 2014 Report No. 12614149-12075-1
As part of the mitigation and management of the Kendal operation a numerical groundwater model
should be constructed to be able to predict the contaminant migration (if any).
Survey monitoring borehole altitudes to construct a detail groundwater piezometric contour map and to
accurately distinguish between deep and shall aquifer water levels (perched water level);
Scavenger borehole system at the two water quality outliers (AB08) may contain/deplete the
development of these local plumes although the source of potential contamination needs to be
investigated.
Part of the mitigation and management could include a deeper (intersecting the groundwater level
~3.5m below surface) subsoil drainage collection trench between the ash dump and the stream to the
west thereof. This is only necessary if contamination migration from the dumps to the stream is noticed.
At this stage it is recommended that this subsurface drain should be designed but not installed. If
contamination is noticed during monitoring it can be installed at specific contamination flow zones
(determined by monitoring). The design must be as such that the inflow in the trench is limited to
upstream and below and not from the downstream side. Thus impermeable layers at the stream side of
the trench.
The recommended numerical model can then be used to predict the impact of the trench on potential
contaminant migration.
Although existing groundwater monitoring is sufficient as baseline, expansion/optimisation of the
groundwater monitoring network is recommended to form part of the mitigation and management of the
ash dump, to cover the outline of the proposed CADF area. This will be included in the monitoring
network and will be used as a warning system for contaminant migration.
Conclusions
The following groundwater conclusions are made from the available data for Kendal Power Station ash
disposal facilities:
The site are mainly underlain by sub–horizontal sediments of the Karoo Sequence comprising of shale,
carbonaceous shale, sandstone and coal layers of the Vryheid formation of the Ecca group;
The initial regional groundwater conceptual model identify three aquifer zones namely weathered,
fractured and deep fractured to fresh aquifer zones, but needs to be confirmed and updated, from future
test pumping and borehole logs;
The average groundwater levels of the deep monitoring boreholes are 6.1mbgl and for the shallow
monitoring boreholes 2.21mbgl;
Groundwater flow mimic the topography and the direction are towards the surface streams;
The background groundwater quality of the Kendal power station are representative of calcium,
magnesium bicarbonate type of water (Ca, Mg)(HCO3)2.;
The following inorganic constituents exceed the SANS 241 (2011) drinking water compliance standards
manganese, iron, sulphate and fluoride, but it is unlikely that the ash disposal facility contribute to these
elevated values;
Other potential constituents of concern from ash disposal facilities (such as Hg, Cd and As) were not
monitored in the boreholes around the facility, so no comparison is possible;
The latest analytical results confirm the existing, continuous and emergency ash disposal facilities have
limited impact on the surrounding groundwater quality;
Groundwater information gaps which exists include:
Aquifer parameters need to be defined by short term test pumping and/or slug testing and
monitoring borehole altitudes needs to be surveyed; and

GROUNDWATER BASELINE STUDY - KENDAL POWER STATION CONTINUOUS ASH DISPOSAL
May 2014 Report No. 12614149-12075-1
Drilling of additional pairs of monitoring boreholes as indicated in Figure 11, these monitoring
borehole positions should be appropriate to reflect the existing groundwater situation in both
shallow and deep aquifer zones in the area surrounding the proposed continuous ADF and for
future monitoring purposes of possible contamination plumes migration from the ADF.
Groundwater vulnerability at the Kendal continuous and emergency ash site is shown on the national
groundwater vulnerability map as low to medium; and
According to qualitative Groundwater impact assessment, the impact risk of the ash disposal facility on
groundwater quality is classified as class 2 with a low impact, therefore it can be concluded that the
ash disposal facility has a low impact on the groundwater quality.
Recommendations
The following recommendations are made following the groundwater base line study at Kendal Power station
continuous ash disposal facility:
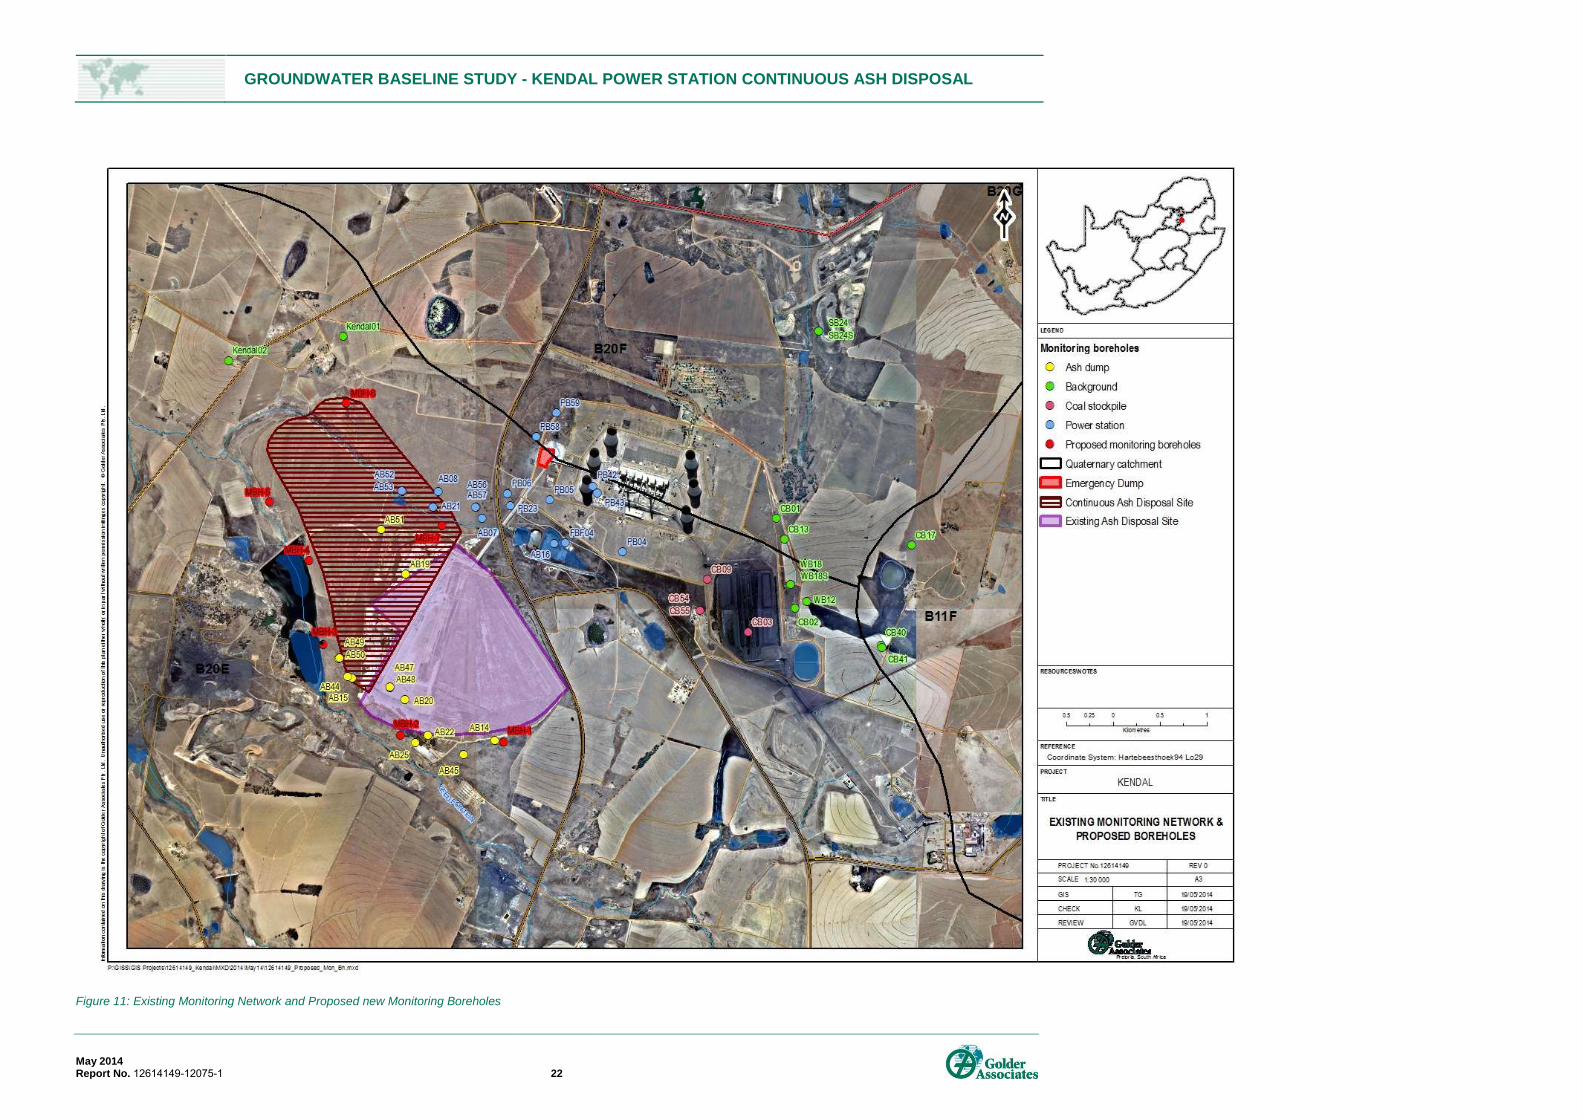
Drilling of seven pairs (deep and shallow) of additional monitoring boreholes as indicated on Figure 11.
These proposed monitoring boreholes positions (Table 20) need to be confirmed with geophysics, in
order to optimize the drilling positions and intersecting geological structures like fault zones, dolerite
dykes and geological contact zones which could act as preferred groundwater pathways;
The principle of the shallow and deep boreholes is to confirm for the presence of a shallow (perched)
aquifer within the weathered zone, whereas the deep monitoring boreholes target the aquifer in the
fracture zones of the host formation. The shallow aquifer zone will be cased and sealed off in the
deeper boreholes to minimise the risk of cross contamination. The knowledge of the different aquifer
zones is essential to understand the possible contamination impacts on the different zones;
Proposed drilling depths of deep and shallow monitoring boreholes are 40 and 15m respectively;
The shallow monitoring boreholes must be drilled at 165mm diameter to a maximum depth of 15m and
cased with 127mm ID Upvc casing through the weathered formation;
The deep monitoring borehole must be drilled at 215mm diameter to maximum depth of 40m. 12 m
solid 165mm steel casing will be installed and grouted to seal off shallow aquifer system. The remaining
depth of the borehole will be constructed as open borehole;
These monitoring boreholes will provide:
Direct geological and hydrogeological control in areas without monitoring boreholes;
Aquifer testing facilities;
Serve as future monitoring and sampling points.
The newly-drilled monitoring boreholes should be incorporated into the existing monitoring programme.
The following monitoring tasks should be conducted to be consistent with the existing WUL (Licence
no.: 04/B20E/BCEGI/1048):
Monthly monitoring of groundwater levels and quality;
Purged groundwater sampling;
The analytical suite for groundwater samples should include determinants as per existing WUL
Table 21.
A mitigation trench is proposed between the ash dump and the stream to the west thereof, should only
be implemented if contamination migration from the ash dumps to the stream is detected during
monitoring.

GROUNDWATER BASELINE STUDY - KENDAL POWER STATION CONTINUOUS ASH DISPOSAL
May 2014 Report No. 12614149-12075-1 i
Table of Contents
1.0 INTRODUCTION ........................................................................................................................................................ 1
2.0 BACKGROUND ......................................................................................................................................................... 1
3.0 KEY PROJECT OBJECTIVES .................................................................................................................................. 1
4.0 SCOPE OF WORK .................................................................................................................................................... 1
5.0 GROUNDWATER BASELINE ................................................................................................................................... 1
5.1 Desk Study and Information Reviewed ......................................................................................................... 1
5.2 Climate ......................................................................................................................................................... 3
5.2.1 Rainfall .................................................................................................................................................... 3
5.2.2 Temperature ........................................................................................................................................... 3
5.3 Geology ........................................................................................................................................................ 3
5.4 Hydrocensus ................................................................................................................................................. 5
5.5 Aquifer Classification and Borehole Yield ..................................................................................................... 6
5.6 Groundwater Levels and Flow direction ........................................................................................................ 8
5.6.1 Deep Monitoring Boreholes ..................................................................................................................... 8
5.6.2 Shallow Monitoring Boreholes ............................................................................................................... 10
5.6.3 Groundwater Flow Direction .................................................................................................................. 10
5.7 Existing Groundwater Monitoring Network .................................................................................................. 10
5.8 Groundwater Conceptual Model ................................................................................................................. 13
5.8.1 Weathered Aquifer Zone ....................................................................................................................... 13
5.8.2 Fractured Aquifer Zone ......................................................................................................................... 14
5.8.3 Deep Fractured to Fresh Aquifer Zone .................................................................................................. 14
5.9 Groundwater Quality ................................................................................................................................... 14
5.9.1 Analytical Results .................................................................................................................................. 14
5.9.1.1 Hydrocensus Results ......................................................................................................................... 14
5.9.1.2 GHT 2012/2013 Groundwater Results ............................................................................................... 16
5.9.2 Expanded Durov Diagrams ................................................................................................................... 19
5.9.2.1 Hydrocensus Groundwater Quality .................................................................................................... 19
5.9.2.2 GHT 2012/2013 Analytical Results .................................................................................................... 19
5.9.3 Groundwater Contamination Status ...................................................................................................... 20
5.10 Background Groundwater Quality ............................................................................................................... 21
5.10.1 Determination of background groundwater quality ................................................................................ 23
5.10.2 Results .................................................................................................................................................. 23
GROUNDWATER BASELINE STUDY - KENDAL POWER STATION CONTINUOUS ASH DISPOSAL
May 2014 Report No. 12614149-12075-1 ii
5.10.3 Background Groundwater Quality Conclusions ..................................................................................... 27
5.11 Groundwater recharge ................................................................................................................................ 27
5.12 Groundwater Vulnerability .......................................................................................................................... 27
6.0 GROUNDWATER QUALITATIVE IMPACT ASSESSMENT ................................................................................... 34
6.1 Impact Assessment Methodology ............................................................................................................... 34
6.1.1 Significance Assessment ...................................................................................................................... 34
6.1.2 Spatial Scale ......................................................................................................................................... 35
6.1.3 Duration Scale ...................................................................................................................................... 35
6.1.4 Degree of Probability ............................................................................................................................. 35
6.1.5 Degree of Certainty ............................................................................................................................... 36
6.1.6 Quantitative Description of Impacts....................................................................................................... 36
6.2 Groundwater Impacts ................................................................................................................................. 37
6.2.1 Significance Assessment ...................................................................................................................... 37
6.2.2 Spatial Scale ......................................................................................................................................... 37
6.2.3 Duration Scale ...................................................................................................................................... 37
6.2.4 Degree of Probability ............................................................................................................................. 37
6.2.5 Degree of Certainty ............................................................................................................................... 37
6.2.6 Quantitative Description of Impacts....................................................................................................... 37
6.2.7 Mitigation Measures .............................................................................................................................. 37
7.0 CONCLUSIONS ....................................................................................................................................................... 38
8.0 RECOMMENDATIONS ............................................................................................................................................ 39
9.0 REFERENCES ......................................................................................................................................................... 41
TABLES
Table 1: Average Precipitation for Period 2001 to 2013. ............................................................................................................ 3
Table 2: Mean Monthly Temperatures for 2001 to 2013 (Minimum and Maximum) ................................................................... 3
Table 3: Hydrocensus Borehole Information .............................................................................................................................. 6
Table 4: Hydrocensus Borehole Photo Record .......................................................................................................................... 6
Table 5: Exiting Groundwater Monitoring Borehole Information ............................................................................................... 10
Table 10: Description of the significance rating scale .............................................................................................................. 34
Table 11: Description of the spatial scale ................................................................................................................................. 35
Table 12: Description of the temporal rating scale ................................................................................................................... 35
Table 13: Description of the degree of probability of an impact occurring ................................................................................ 36
Table 14: Description of the degree of certainty rating scale.................................................................................................... 36
Table 15: Example of Rating Scale .......................................................................................................................................... 36
GROUNDWATER BASELINE STUDY - KENDAL POWER STATION CONTINUOUS ASH DISPOSAL
May 2014 Report No. 12614149-12075-1 iii
Table 16: IMPACT RISK CLASSES ......................................................................................................................................... 36
Table 17: Impact on Groundwater existing Ash Facility (unlined) ............................................................................................. 37
Table 18: Impact of new Continues Ash Facility only and Lined .............................................................................................. 38
Table 19: Impact of new Continues Ash Facility line and existing unlined ash facility .............................................................. 38
Table 20: Proposed Monitoring Boreholes ............................................................................................................................... 39
Table 21: Analytical Suite as per existing WUL ........................................................................................................................ 40
GROUNDWATER BASELINE STUDY - KENDAL POWER STATION CONTINUOUS ASH DISPOSAL
May 2014 Report No. 12614149-12075-1 iv
FIGURES
Figure 1: Locality Map ................................................................................................................................................................ 2
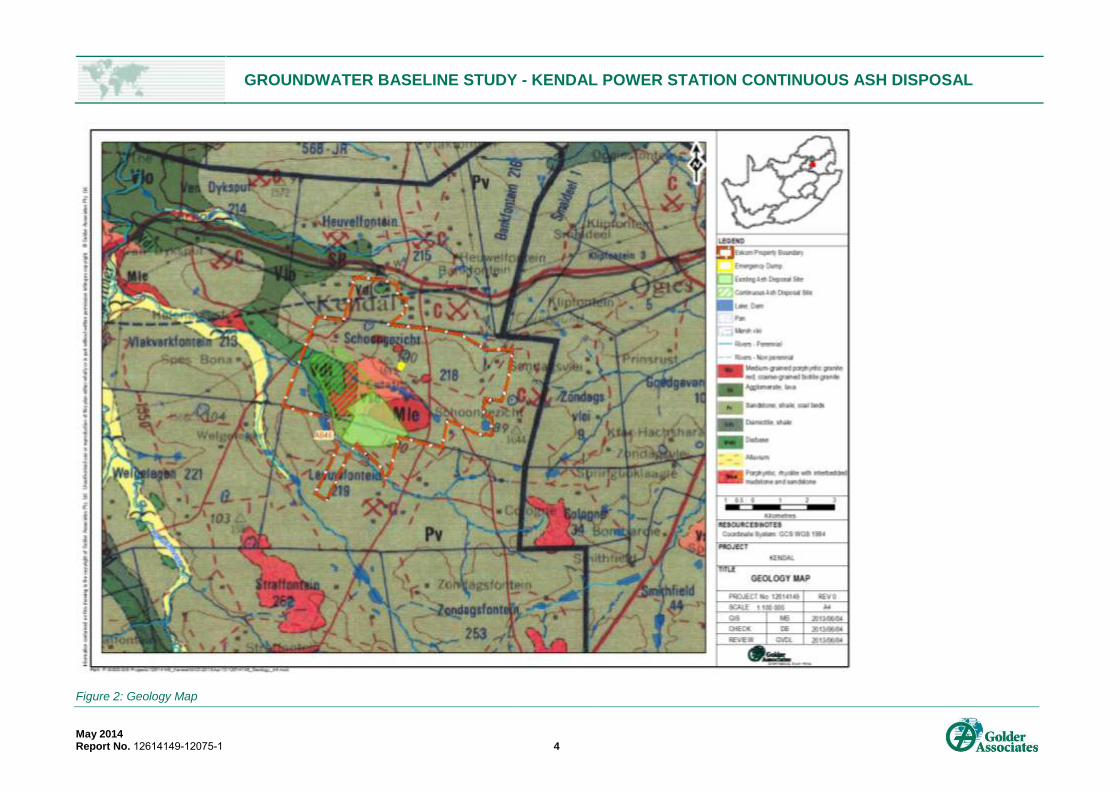
Figure 2: Geology Map ............................................................................................................................................................... 4
Figure 3: Typical Stratigraphic Section at Kendal Power Station (Homeland Mining & Energy SA, 2008) ................................. 5
Figure 4: Aquifer Classification and Average Borehole Yield ..................................................................................................... 7
Figure 5: Correlation between Altitude and Water levels of Deep Monitoring Boreholes ........................................................... 8
Figure 6: Groundwater Piezometric Contour Map ...................................................................................................................... 9
Figure 7: Existing Monitoring Network ...................................................................................................................................... 12
Figure 8: Initial Groundwater Conceptual Model ...................................................................................................................... 13
Figure 9: Expanded Durov Diagram of Hydrocensus Results .................................................................................................. 19
Figure 10: Expanded Durov Diagram – GHT Results2012_ 2013 Results ............................................................................... 20
Figure 11: Existing Monitoring Network and Proposed new Monitoring Boreholes .................................................................. 22
Figure 12: Variation of pH with time and against background values around the ADF ............................................................. 23
Figure 13: Variation of pH with time and against background values around the power station .............................................. 24
Figure 14: Variation of pH with time and against background values around the coal stockpile .............................................. 24
Figure 15: Variation of sulphates with time and against background values around the ADF .................................................. 25
Figure 16: Variation of Sulphates with time and against background values around the power station ................................... 26
Figure 17: Variation of Sulphates with time and against background values around the ADF ................................................. 26
Figure 18: Groundwater Inorganic Chemical Determinants Compared to SANS 241:2011 ..................................................... 29
Figure 19: Contour map pH as of 2012 chemical results ......................................................................................................... 30
Figure 20: Contour map of electrical conductivity as of 2012 chemical results ........................................................................ 31
Figure 21: Mean Annual Groundwater Recharge ..................................................................................................................... 32
Figure 22: Groundwater Vulnerability Map ............................................................................................................................... 33
APPENDICES
APPENDIX A Analytical Result Certificates of Hydrocensus Boreholes
APPENDIX B Document Limitations
GROUNDWATER BASELINE STUDY - KENDAL POWER STATION CONTINUOUS ASH DISPOSAL
May 2014 Report No. 12614149-12075-1 1
1.0 INTRODUCTION
Golder Associates Africa (Golder) has been appointed by Zitholele Consulting (Pty) Ltd to provide specialist
groundwater input in support of the Waste License Application process at Kendal power station and for the
waste management licencing for the continues ash disposal at the existing ash dump.
This process involves an Integrated Water Use License (IWUL) for the extension of the existing dry ashing
facility at Kendal power station.
This document reports on the baseline groundwater quality at the existing and continuous ash disposal
facility.
2.0 BACKGROUND
Kendal power station is situated in Mpumalanga Province 40km south west of Witbank and 6km west of
Ogies as indicated on Figure 1. The Kendal power station fall into three quaternary catchments namely
B20F, B20E and B11F to the east of the site. The existing and continuous ash disposal facility falls into the
B20E quaternary catchment.
Kendal is owned by Eskom and went into operation in 1988. Kendal is currently the largest coal fired power
station in the world.
3.0 KEY PROJECT OBJECTIVES
The main objectives of the groundwater study are summarised as:
Characterise the prevailing groundwater situation;
Define the water bearing strata in the area;
Determine current groundwater level distribution and flow directions;
Determine baseline groundwater quality;
Conduct a gap analyses; and
Conduct a qualitative assessment of the impact of the extended utilisation of existing ash dump facility
on the groundwater system.
4.0 SCOPE OF WORK
The following scope of work was followed to adhere to the objectives mentioned above:
Desk study;
Hydrocensus and groundwater sampling;
Groundwater conceptual model;
Gap analyses;
Qualitative Impact Assessment; and
Baseline report.
5.0 GROUNDWATER BASELINE
5.1 Desk Study and Information Reviewed
The following information and data was utilised during the desk study and information review task:
National Groundwater Database (NGDB);
1:250 000 geological map series;
1:2 500 000 Groundwater Resources map of RSA –Sheet 1 (WRC.DWAF 1995);

GROUNDWATER BASELINE STUDY - KENDAL POWER STATION CONTINUOUS ASH DISPOSAL
May 2014 Report No. 12614149-12075-1 2
Figure 1: Locality Map
GROUNDWATER BASELINE STUDY - KENDAL POWER STATION CONTINUOUS ASH DISPOSAL
May 2014 Report No. 12614149-12075-1 3
1:4 000 000 Groundwater Resources map of RSA – Sheet 2 (WRC.DWAF 1995);
1: 500 000 Hydrogeological Map Series of RSA (1996); and
Review of existing monitoring report from GHT (February 2012); and
Groundwater monitoring data base received from GHT in Aquabase format.
5.2 Climate
5.2.1 Rainfall
The Middelburg EDE farms (0516/232LO) are the closest rainfall station to Kendal power station. Rainfall
data are available for an 11.9 year period and was used to calculate the mean annual precipitation as
approximately 735 mm per annum. Average rainfall is summarised in Table 1.
Table 1: Average Precipitation for Period 2001 to 2013.
Period Jan Feb Mar Apr May Jun Jul Aug Sep Oct Nov Dec Total
1/06/2001
to10/05/2013 159.69 87.74 79.35 44.35 12.52 9.68 2.69 9.3 16.23 83.2 108.5 139.3 753
5.2.2 Temperature
Temperature extremes range from 27.7°C in summer to -1.89°C in winter. Mean monthly temperatures as
recorded at Middelburg EDE farms are listed in Table 2.
Table 2: Mean Monthly Temperatures for 2001 to 2013 (Minimum and Maximum)
Month Jan Feb Mar Apr May Jun Jul Aug Sep Oct Nov Dec
Min
(°C)
14.07 13.1 11.39 7.34 2.6 -0.72 -1.89 1.64 6 10.3 12.33 13.67
Max (°C)
27.77 28.37 27.23 24.54 22.55 20.03 19.58 22.61 26.04 27.02 26.58 27.13
5.3 Geology
Based on the published 1:250 000 geology map series (2628East Rand), the area of investigation are mainly
underlain by Karoo Sequence sediments (Figure 2). The Karoo Sequence consists of the older Dwyka
formation at the base, followed by the Ecca, Beaufort and Lebombo groups. The sediments in the areas of
investigation comprise of shale, carbonaceous shale, sandstone and coal of the Vryheid formation of the
Ecca Group.
A pre-Karoo diabase sill is present to the west of the site underling part of the continuous ash disposal site.
Medium to coarse grained porphyritic and biotite granite of the Lebowa granite suite, part of the Bushveld
Igneous Complex (BIC) together with sediments of the Transvaal Sequence (TS) Rooiberg Group (Selons
River Formation) underlie part of the continuous ash disposal site.
An east-west striking lineament (possible dolerite dyke) is present to the north of the site boundary. There
are no identified geological structures (fault zones and dykes) in the vicinity of the ash disposal facility.
These geological structure if present act as preferred groundwater flow paths.
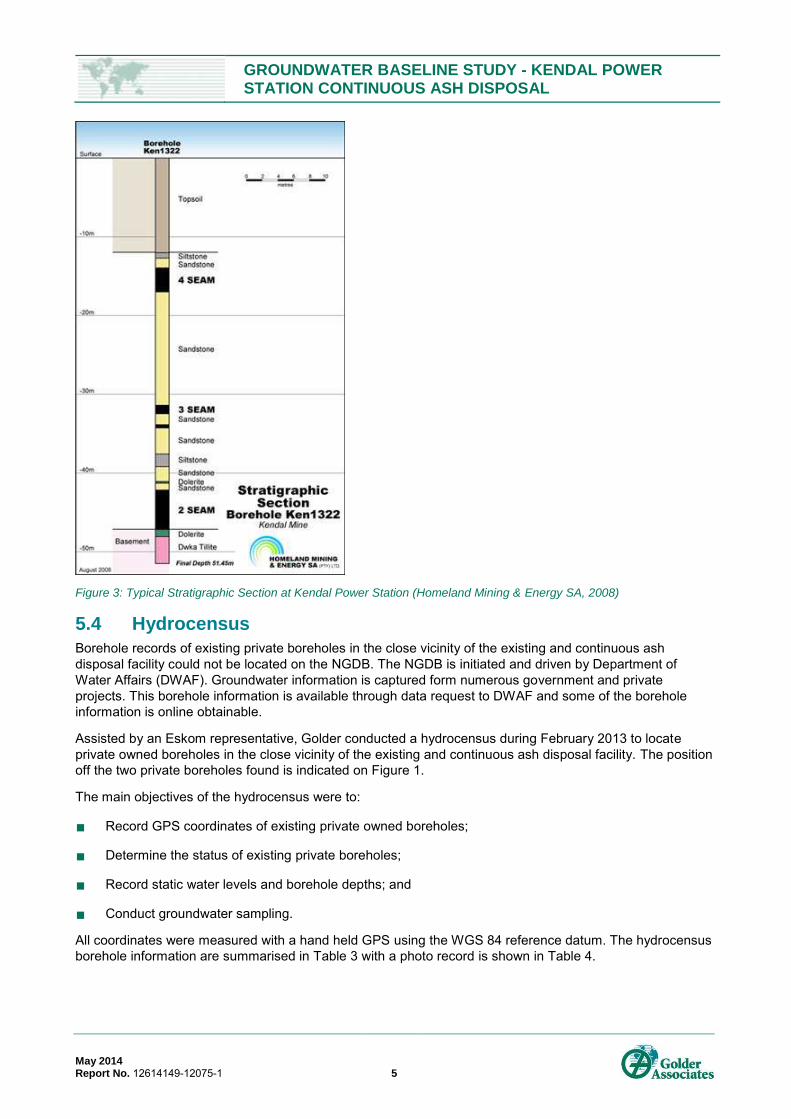
A typical stratigraphic section at Kendal power station is illustrated in Figure 3.
GROUNDWATER BASELINE STUDY - KENDAL POWER STATION CONTINUOUS ASH DISPOSAL
May 2014 Report No. 12614149-12075-1 4
Figure 2: Geology Map
GROUNDWATER BASELINE STUDY - KENDAL POWER STATION CONTINUOUS ASH DISPOSAL
May 2014 Report No. 12614149-12075-1 5
Figure 3: Typical Stratigraphic Section at Kendal Power Station (Homeland Mining & Energy SA, 2008)
5.4 Hydrocensus
Borehole records of existing private boreholes in the close vicinity of the existing and continuous ash
disposal facility could not be located on the NGDB. The NGDB is initiated and driven by Department of
Water Affairs (DWAF). Groundwater information is captured form numerous government and private
projects. This borehole information is available through data request to DWAF and some of the borehole
information is online obtainable.
Assisted by an Eskom representative, Golder conducted a hydrocensus during February 2013 to locate
private owned boreholes in the close vicinity of the existing and continuous ash disposal facility. The position
off the two private boreholes found is indicated on Figure 1.
The main objectives of the hydrocensus were to:
Record GPS coordinates of existing private owned boreholes;
Determine the status of existing private boreholes;
Record static water levels and borehole depths; and
Conduct groundwater sampling.
All coordinates were measured with a hand held GPS using the WGS 84 reference datum. The hydrocensus
borehole information are summarised in Table 3 with a photo record is shown in Table 4.

GROUNDWATER BASELINE STUDY - KENDAL POWER STATION CONTINUOUS ASH DISPOSAL
May 2014 Report No. 12614149-12075-1 6
Table 3: Hydrocensus Borehole Information
Hydrocensus Number
Latitude Longitude SWL(mbgl) Status Use Equipment Sampled
Kendal 01 26.07506 28.93734 3.6 In use Domestic Submersible 13/02/2013
Kendal 02 26.07738 28.92523 14.21 In use Domestic Submersible 13/02/2013
Table 4: Hydrocensus Borehole Photo Record
Kendal_1
Kendal_2
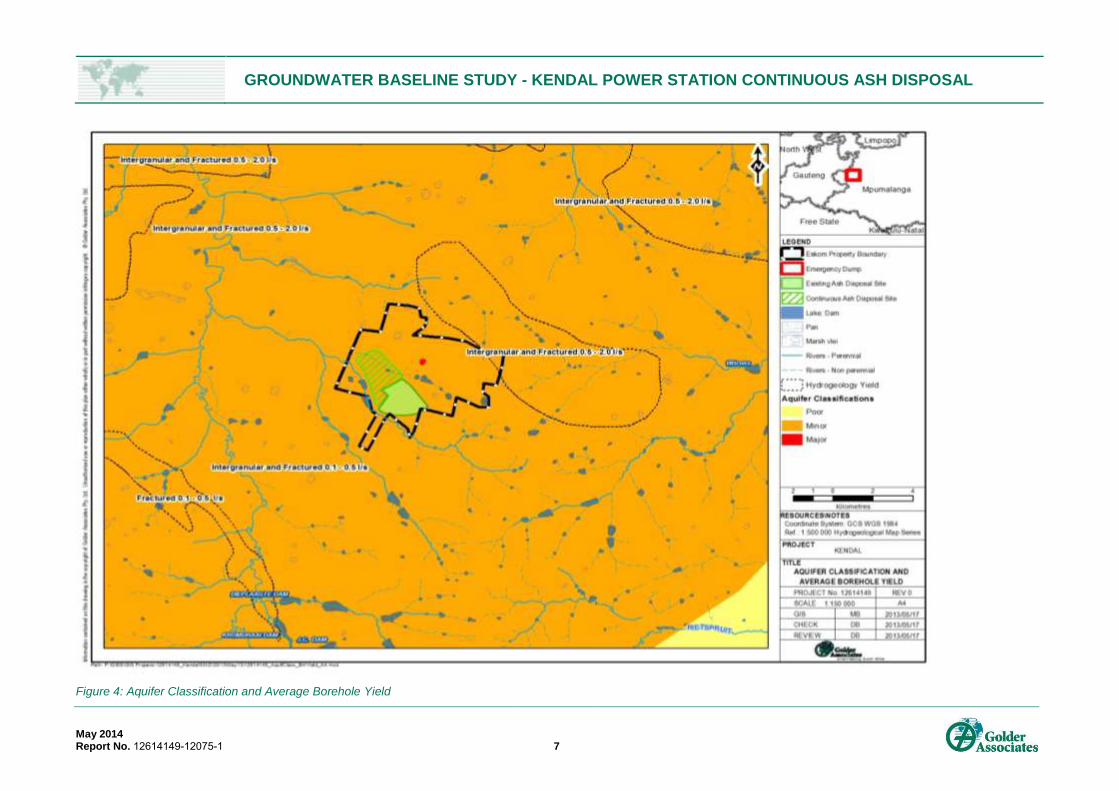
5.5 Aquifer Classification and Borehole Yield
The published hydrogeological maps series by DWAF (1996) was used to define the regional aquifer
classification (Figure 4). The aquifer is classified as a minor aquifer system with intergranular and fractured
aquifer zones.
The published hydrogeological maps (DWAF 1996) indicate that the average borehole yield in the area is
between 0.5l/s and 2.0l/s.
The average borehole yield recorded in the Eskom/GHT groundwater data base is 0.24 l/s, with maximum
yield being 1.3 l/s and the minimum yield recorded as 0.0001l/s.
GROUNDWATER BASELINE STUDY - KENDAL POWER STATION CONTINUOUS ASH DISPOSAL
May 2014 Report No. 12614149-12075-1 7
Figure 4: Aquifer Classification and Average Borehole Yield

GROUNDWATER BASELINE STUDY - KENDAL POWER STATION CONTINUOUS ASH DISPOSAL
May 2014 Report No. 12614149-12075-1 8
5.6 Groundwater Levels and Flow direction
5.6.1 Deep Monitoring Boreholes
The maximum water level recorded during 2013 for the deep monitoring boreholes at the Kendal power
station site is 17.16mbgl (metre below ground level), the minimum recorded is 1.06mbgl and the average
groundwater level is 6.1mbgl.
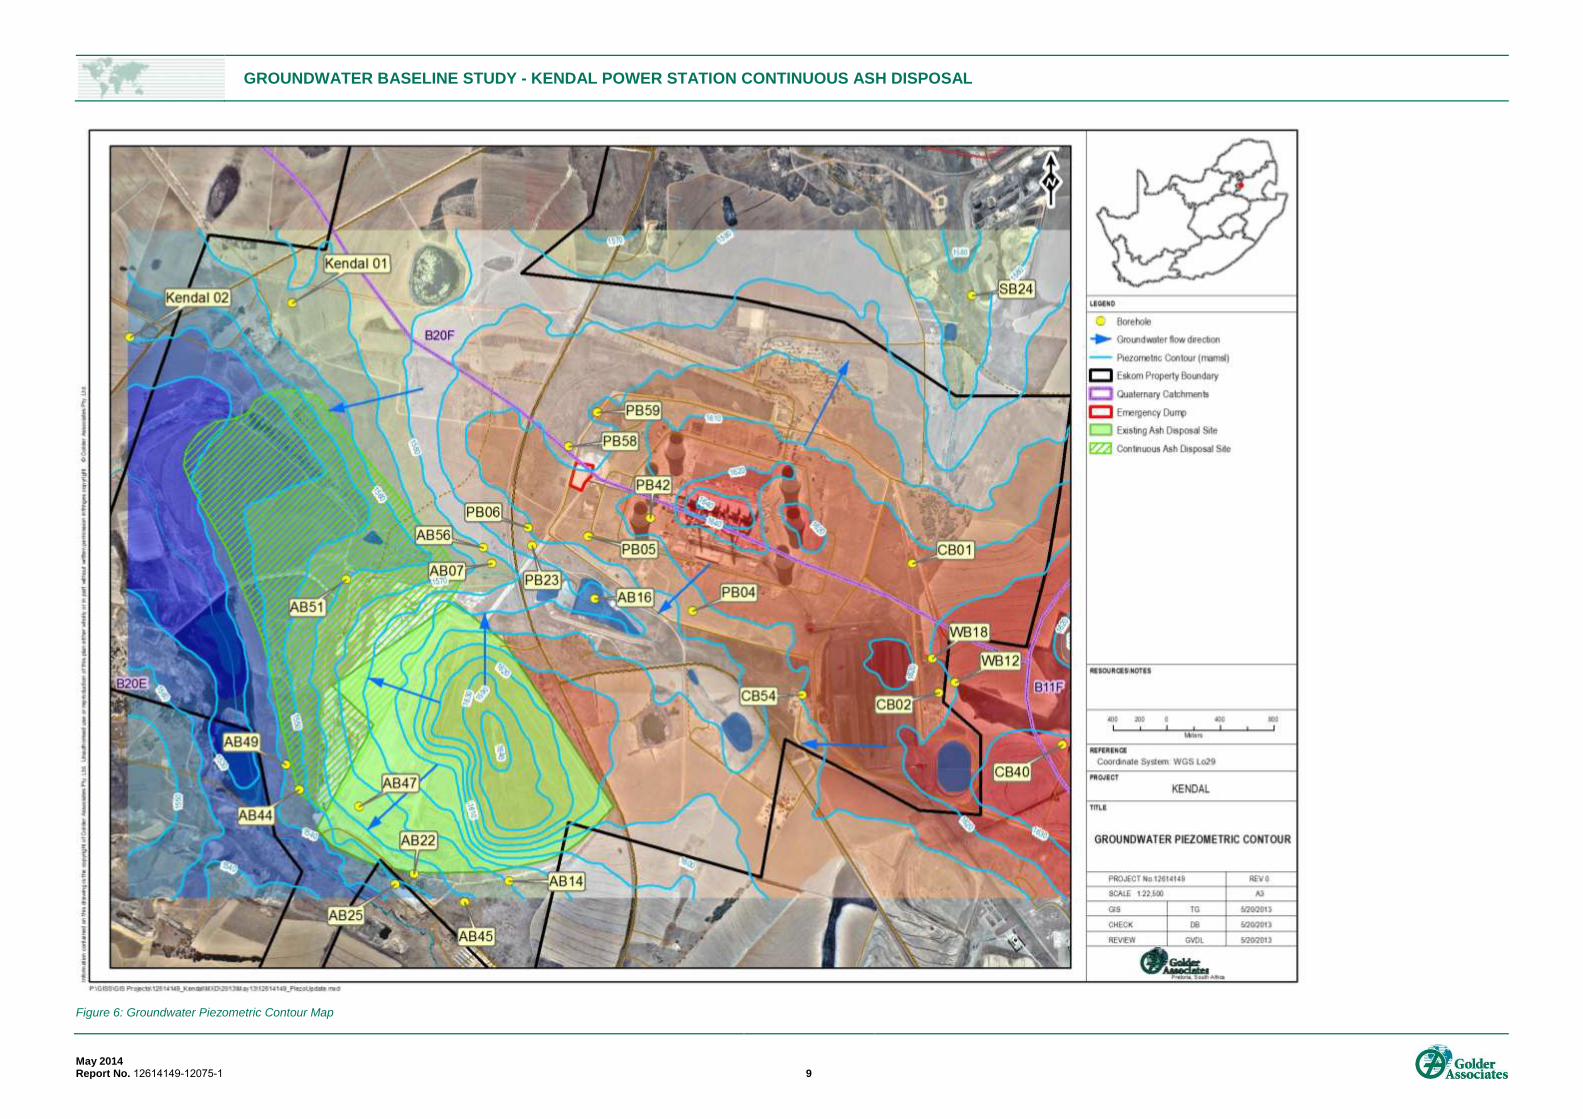
Because of seasonal water level fluctuations and different measured dates, a groundwater piezometric
contour map was constructed using only the deep water levels measured by GHT during 2013 and the water
levels of the two hydrocensus boreholes (2013).
The correlation between the altitudes and water levels of the deep monitoring boreholes are 98% (Figure 5),
therefore the assumption is made that the groundwater level will mimic the topography. The piezometric
contour map was compiled using Bayesian kriging.
Figure 5: Correlation between Altitude and Water levels of Deep Monitoring Boreholes
R² = 0.9753
1520
1540
1560
1580
1600
1620
1640
1540 1560 1580 1600 1620 1640 1660
Alt
itu
de
(m
amsl
)
Water levels (mamsl)
Altitude and Water Level Correlation
Deep Monitoring Borehole
GROUNDWATER BASELINE STUDY - KENDAL POWER STATION CONTINUOUS ASH DISPOSAL
May 2014 Report No. 12614149-12075-1 9
Figure 6: Groundwater Piezometric Contour Map
GROUNDWATER BASELINE STUDY - KENDAL POWER STATION CONTINUOUS ASH DISPOSAL
May 2014 Report No. 12614149-12075-1 10
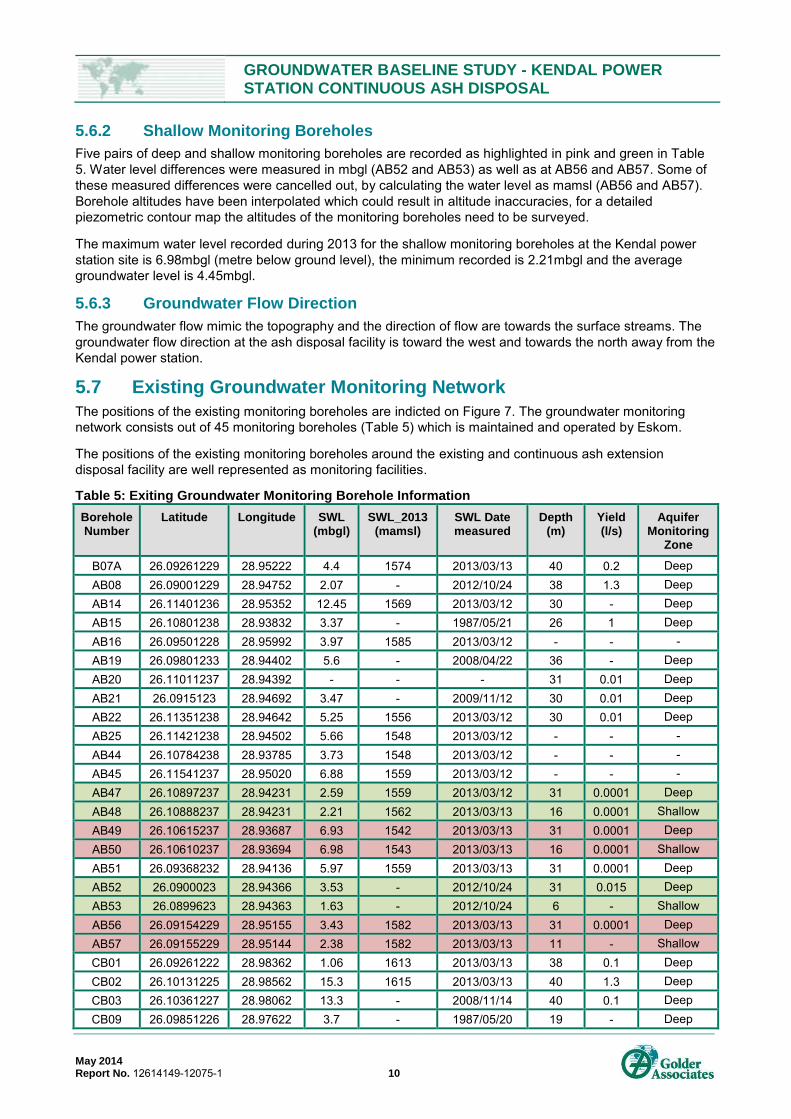
5.6.2 Shallow Monitoring Boreholes
Five pairs of deep and shallow monitoring boreholes are recorded as highlighted in pink and green in Table
5. Water level differences were measured in mbgl (AB52 and AB53) as well as at AB56 and AB57. Some of
these measured differences were cancelled out, by calculating the water level as mamsl (AB56 and AB57).
Borehole altitudes have been interpolated which could result in altitude inaccuracies, for a detailed
piezometric contour map the altitudes of the monitoring boreholes need to be surveyed.
The maximum water level recorded during 2013 for the shallow monitoring boreholes at the Kendal power
station site is 6.98mbgl (metre below ground level), the minimum recorded is 2.21mbgl and the average
groundwater level is 4.45mbgl.
5.6.3 Groundwater Flow Direction
The groundwater flow mimic the topography and the direction of flow are towards the surface streams. The
groundwater flow direction at the ash disposal facility is toward the west and towards the north away from the
Kendal power station.
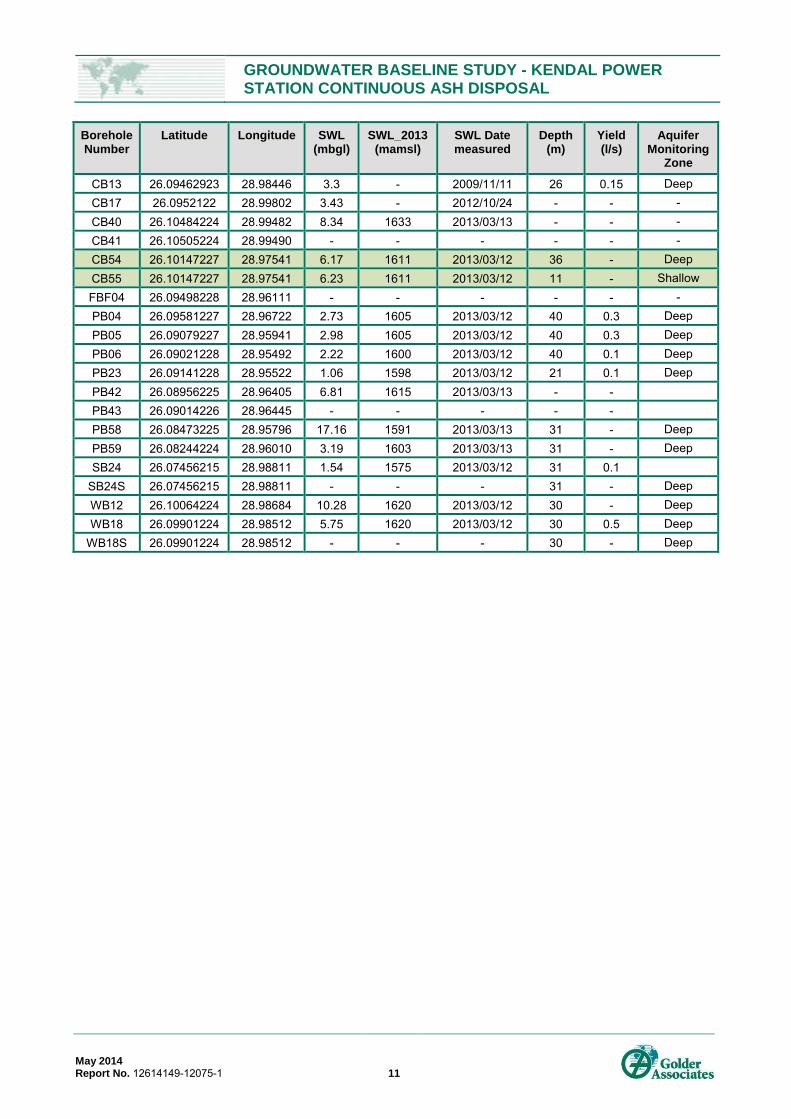
5.7 Existing Groundwater Monitoring Network
The positions of the existing monitoring boreholes are indicted on Figure 7. The groundwater monitoring
network consists out of 45 monitoring boreholes (Table 5) which is maintained and operated by Eskom.
The positions of the existing monitoring boreholes around the existing and continuous ash extension
disposal facility are well represented as monitoring facilities.
Table 5: Exiting Groundwater Monitoring Borehole Information
Borehole Number
Latitude Longitude SWL (mbgl)
SWL_2013 (mamsl)
SWL Date measured
Depth (m)
Yield (l/s)
Aquifer Monitoring
Zone
B07A 26.09261229 28.95222 4.4 1574 2013/03/13 40 0.2 Deep
AB08 26.09001229 28.94752 2.07 - 2012/10/24 38 1.3 Deep
AB14 26.11401236 28.95352 12.45 1569 2013/03/12 30 - Deep
AB15 26.10801238 28.93832 3.37 - 1987/05/21 26 1 Deep
AB16 26.09501228 28.95992 3.97 1585 2013/03/12 - - -
AB19 26.09801233 28.94402 5.6 - 2008/04/22 36 - Deep
AB20 26.11011237 28.94392 - - - 31 0.01 Deep
AB21 26.0915123 28.94692 3.47 - 2009/11/12 30 0.01 Deep
AB22 26.11351238 28.94642 5.25 1556 2013/03/12 30 0.01 Deep
AB25 26.11421238 28.94502 5.66 1548 2013/03/12 - - -
AB44 26.10784238 28.93785 3.73 1548 2013/03/12 - - -
AB45 26.11541237 28.95020 6.88 1559 2013/03/12 - - -
AB47 26.10897237 28.94231 2.59 1559
2013/03/12 31 0.0001 Deep
AB48 26.10888237 28.94231 2.21 1562
2013/03/13 16 0.0001 Shallow
AB49 26.10615237 28.93687 6.93 1542
2013/03/13 31 0.0001 Deep
AB50 26.10610237 28.93694 6.98 1543
2013/03/13 16 0.0001 Shallow
AB51 26.09368232 28.94136 5.97 1559 2013/03/13 31 0.0001 Deep
AB52 26.0900023 28.94366 3.53 - 2012/10/24 31 0.015 Deep
AB53 26.0899623 28.94363 1.63 - 2012/10/24 6 - Shallow
AB56 26.09154229 28.95155 3.43 1582 2013/03/13 31 0.0001 Deep
AB57 26.09155229 28.95144 2.38 1582 2013/03/13 11 - Shallow
CB01 26.09261222 28.98362 1.06 1613 2013/03/13 38 0.1 Deep
CB02 26.10131225 28.98562 15.3 1615 2013/03/13 40 1.3 Deep
CB03 26.10361227 28.98062 13.3 - 2008/11/14 40 0.1 Deep
CB09 26.09851226 28.97622 3.7 - 1987/05/20 19 - Deep
GROUNDWATER BASELINE STUDY - KENDAL POWER STATION CONTINUOUS ASH DISPOSAL
May 2014 Report No. 12614149-12075-1 11
Borehole Number
Latitude Longitude SWL (mbgl)
SWL_2013 (mamsl)
SWL Date measured
Depth (m)
Yield (l/s)
Aquifer Monitoring
Zone
CB13 26.09462923 28.98446 3.3 - 2009/11/11 26 0.15 Deep
CB17 26.0952122 28.99802 3.43 - 2012/10/24 - - -
CB40 26.10484224 28.99482 8.34 1633 2013/03/13 - - -
CB41 26.10505224 28.99490 - - - - - -
CB54 26.10147227 28.97541 6.17 1611 2013/03/12 36 - Deep
CB55 26.10147227 28.97541 6.23 1611 2013/03/12 11 - Shallow
FBF04 26.09498228 28.96111 - - - - - -
PB04 26.09581227 28.96722 2.73 1605 2013/03/12 40 0.3 Deep
PB05 26.09079227 28.95941 2.98 1605 2013/03/12 40 0.3 Deep
PB06 26.09021228 28.95492 2.22 1600 2013/03/12 40 0.1 Deep
PB23 26.09141228 28.95522 1.06 1598 2013/03/12 21 0.1 Deep
PB42 26.08956225 28.96405 6.81 1615 2013/03/13 - -
PB43 26.09014226 28.96445 - - - - -
PB58 26.08473225 28.95796 17.16 1591 2013/03/13 31 - Deep
PB59 26.08244224 28.96010 3.19 1603 2013/03/13 31 - Deep
SB24 26.07456215 28.98811 1.54 1575 2013/03/12 31 0.1
SB24S 26.07456215 28.98811 - - - 31 - Deep
WB12 26.10064224 28.98684 10.28 1620 2013/03/12 30 - Deep
WB18 26.09901224 28.98512 5.75 1620 2013/03/12 30 0.5 Deep
WB18S 26.09901224 28.98512 - - - 30 - Deep

GROUNDWATER BASELINE STUDY - KENDAL POWER STATION CONTINUOUS ASH DISPOSAL
May 2014 Report No. 12614149-12075-1 12
Figure 7: Existing Monitoring Network
GROUNDWATER BASELINE STUDY - KENDAL POWER STATION CONTINUOUS ASH DISPOSAL
May 2014 Report No. 12614149-12075-1 13
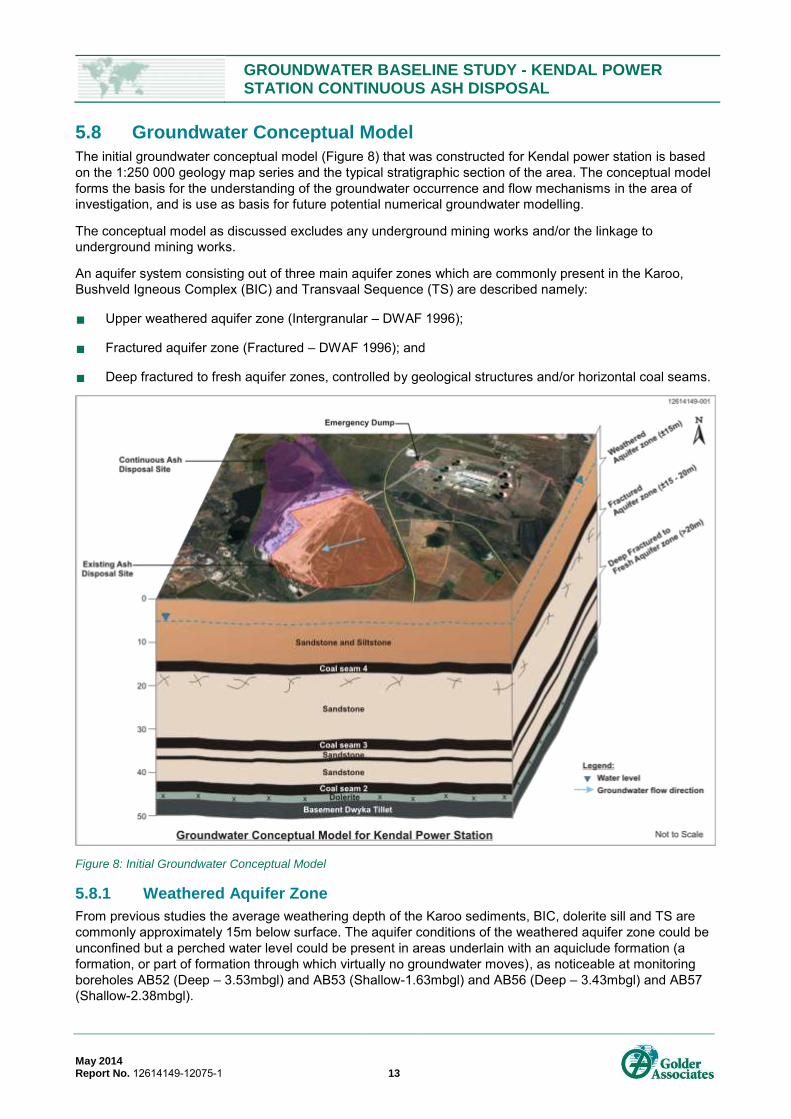
5.8 Groundwater Conceptual Model
The initial groundwater conceptual model (Figure 8) that was constructed for Kendal power station is based
on the 1:250 000 geology map series and the typical stratigraphic section of the area. The conceptual model
forms the basis for the understanding of the groundwater occurrence and flow mechanisms in the area of
investigation, and is use as basis for future potential numerical groundwater modelling.
The conceptual model as discussed excludes any underground mining works and/or the linkage to
underground mining works.
An aquifer system consisting out of three main aquifer zones which are commonly present in the Karoo,
Bushveld Igneous Complex (BIC) and Transvaal Sequence (TS) are described namely:
Upper weathered aquifer zone (Intergranular – DWAF 1996);
Fractured aquifer zone (Fractured – DWAF 1996); and
Deep fractured to fresh aquifer zones, controlled by geological structures and/or horizontal coal seams.
Figure 8: Initial Groundwater Conceptual Model
5.8.1 Weathered Aquifer Zone
From previous studies the average weathering depth of the Karoo sediments, BIC, dolerite sill and TS are
commonly approximately 15m below surface. The aquifer conditions of the weathered aquifer zone could be
unconfined but a perched water level could be present in areas underlain with an aquiclude formation (a
formation, or part of formation through which virtually no groundwater moves), as noticeable at monitoring
boreholes AB52 (Deep – 3.53mbgl) and AB53 (Shallow-1.63mbgl) and AB56 (Deep – 3.43mbgl) and AB57
(Shallow-2.38mbgl).
GROUNDWATER BASELINE STUDY - KENDAL POWER STATION CONTINUOUS ASH DISPOSAL
May 2014 Report No. 12614149-12075-1 14
5.8.2 Fractured Aquifer Zone
The average depth of the fractured aquifer zone is commonly approximately from 15 to 20m below surface,
but need to be confirmed with future borehole logs. The aquifer conditions of the fractured aquifer zone are
semi-confined where groundwater is associated with water-bearing fractures.
5.8.3 Deep Fractured to Fresh Aquifer Zone
The aquifer conditions of this aquifer zone can be describe as semi-confined and being controlled by
geological structures (dolerite intrusions and fault zones) and horizontal coal seam contact zones. There are
no known geological structures present at ash dump facility. Geological structures will act as preferred
groundwater flow paths.
5.9 Groundwater Quality
The groundwater quality results are discussed as two parts namely:
The hydrocensus analytical results; and
GHT Consulting Scientists analytical results 2012/ 2013.
5.9.1 Analytical Results
5.9.1.1 Hydrocensus Results
The analytical results of the two hydrocensus boreholes were compared to the SANS 241-1 (2011) drinking
water compliance standard, which specifies physical, aesthetic and chemical numerical limits for lifetime
consumption (Table 6) as well as the South African Water Quality Guidelines (SAWQG), Volume 1: Domestic
Use, Volume 4: Agricultural Use – Irrigation, and Volume 5: Agricultural Use – Livestock Watering (DWAF,
1996).
The major cations, anions and constituents of concern which exceeds these water compliance standards are
highlighted in Table 6 and Table 7. The analytical result certificates are listed in Annexure C.
The groundwater quality of both hydrocensus samples are of essentially good quality except for elevated
Nitrate (NO3) and Manganese values at sampling position Kendal 01 which exceeds the SANS 241 (2011)
compliance standard of 11mg/l and South African Water Quality Guidelines (SAWQG), Volume 1 – Domestic
Use –Target Range of 6 mg/l for Nitrate and the South African Water Quality Guidelines (SAWQG), Volume
1 – Domestic Use –Target Range for Manganese of 0.05 mg/l. These elevated concentrations and lower pH
of Kendal 01 is probably related to fertilizer used for irrigation purposes.

GROUNDWATER BASELINE STUDY - KENDAL POWER STATION CONTINUOUS ASH DISPOSAL
May 2014 Report No. 12614149-12075-1 15
Table 6: Analytical Results of Hydrocensus Boreholes
Location BH No.
pH TDS mg/l
EC mS/m
Ca mg/l
Mg mg/l
Na mg/l
K mg/l
Fe mg/l
Mn mg/l
M Alk. mg/l
Cl mg/l
SO4 mg/l
NO3 as N mg/l
F mg/l
Al mg/l
Ni mg/l
Se mg/l
SANS 241-1 (2011 Drinking Water
Compliance Limit
5-9.7 1200 170 - - 200 - 0.3 0.1 - 300 250 11 1.5 3.0 0.7 0.01
South African Water Quality
Guidelines (SAWQG), Volume 1 – Domestic Use –
Target Range
6.0-9.0 450 70 32 30 100 50 0.1 0.05 - 100 200 6 1.0 0.15 - 0.05
South African Water Quality
Guidelines (SAWQG), Volume
4 – Agricultural Use – Irrigation
Target Range
6.5-8.4 260 40 - - 70 - 5.0 0.02 - 100 - - 2.0 5.0 0.2 0.02
South African Water Quality
Guidelines (SAWQG), Volume
5 – Agricultural Use – Livestock
Watering Target Range
- 1000 154 1000 500 2000 - 10 10 - 1500 1000 100 2.0 5.0 1.0 0.05
Kendal Kendal
01
5.42 236 31.9 12.4 13.9 21.06 6.53 <0.05 0.099 5.8 33.1 12.2 22.1 <0.1 0.041 0.043 0.001
Kendal
02
8.01 136 19.4 17.9 14.1 6.05 2.15 <0.05 0.008 96.5 1.54 1.32 4.23 <0.1 0.008 0.004 0.001

GROUNDWATER BASELINE STUDY - KENDAL POWER STATION CONTINUOUS ASH DISPOSAL
May 2014 Report No. 12614149-12075-1 16
5.9.1.2 GHT 2012/2013 Groundwater Results
The results of 35 monitoring boreholes sampled by GHT in 2012 (Figure 7) were compared to the SANS
241-1 (2011) drinking water compliance standard, which specifies physical, aesthetic and chemical
numerical limits for lifetime consumption as well as the South African Water Quality Guidelines (SAWQG),
Volume 1: Domestic Use, Volume 4: Agricultural Use – Irrigation, and Volume 5: Agricultural Use – Livestock
Watering (DWAF, 1996). (Table 7). These are the latest results (2012/2013) available from the monitoring
data base (Aquabase format) as received from GHT Consulting Services.
The major cations, anions and constituents of concern which exceeds the SANS 241 (2011) drinking water
compliance are listed in Table 7. Highlighted values exceed these standards.
The 2012/2013 (latest) analytical results were used to describe the existing groundwater quality. Most of the
constituents of the GHT groundwater samples are below these standards. The following constituents
however exceed the relevant standards:
Manganese (Mn) - Several monitoring boreholes CB01, AB07, AB08, WM12, AB16, AB22, SB24,
PB42, AB45, AB48, AB51, AB52, CB55, AB57, PB59 and WB18S manganese (Mn) concentrations
exceeds the SANS 241-1 (2011) drinking water compliance limit of 0.1 mg/l;
Boreholes PB04 and PB05 exceeds the South African Water Quality Guidelines (SAWQG), Volume 1 –
Domestic Use –Target Range and Volume 4 Agricultural use for Irrigation Target range.
Sulphate (SO4) - Monitoring borehole AB08 sulphate (SO4) concentrations exceeds the SANS 241-
1 (2011) drinking water compliance limit of 250 mg/l. This monitoring borehole is located to the north
east of the existing and continuous as disposal site;
No groundwater analyses exceed the South African Water Quality Guidelines (SAWQG).
Fluoride (F) - Monitoring boreholes PB04, PB06, PB23, CB54 and PB58 fluoride (F) concentrations
exceeds the South African Water Quality Guidelines (SAWQG)– Agricultural Use – Livestock Watering,
irrigation and domestic use, Target Range, as well as the SANS 241-1 (2011) drinking water
compliance limit.
Iron (Fe) Monitoring borehole AB08 and AB48 iron (Fe) concentrations exceeds the SANS 241-1
(2011) drinking water compliance lower limit of 0.3 mg/l as well as the South African Water Quality
Guidelines (SAWQG)– domestic use, Target Range;
Other parameters Other parameters exceeding the South African Water Quality Guidelines
(SAWQG) in some of the boreholes are limited to EC, Ca and B.
The elevated manganese concentrations reported are present in monitoring boreholes covering the Kendal
power station site. It is therefore highly unlikely that the ash disposal facilities have an impact on the
manganese concentrations of these monitoring boreholes. Groundwater quality results from surrounding
groundwater users could confirm if this is a regional and natural trend or site specific.
The elevated sulphate level detected at AB08 is probably related to fertilizer used for irrigation purposes by
surrounding land owners, and potentially from coal mining activities.
The elevated concentrations reported fluoride is probably related to the surrounding geology in the area
comprising out of granite and diabase.
The high iron concentration reported need to be monitored in future to determine if there is a trend
noticeable.
The latest analytical results confirm that presently the existing, continuous and emergency ash disposal
facilities have very limited impact on the surrounding groundwater quality.

GROUNDWATER BASELINE STUDY - KENDAL POWER STATION CONTINUOUS ASH DISPOSAL
May 2014 Report No. 12614149-12075-1 17
Table 7: Latest Analytical Results of Monitoring Boreholes at Kendal
Location BH No. Latest
Sampling Date
pH TDS mg/l
EC mS/m
Ca mg/l
Mg mg/l
Na mg/l
K mg/l
Fe mg/l
Mn mg/l
M Alk. mg/l
Cl mg/l
SO4 mg/l
NO3 as N mg/l
Al mg/l
F mg/l
B mg/l
PO4 mg/l
SANS 241-1 (2011 Drinking Water Compliance Limit
5-9.7
1200 170 - - 200 - 0.3 0.1 - 300 250 11 3.0 1.5 - -
South African Water Quality Guidelines (SAWQG), Volume 1 – Domestic Use –Target Range
6.0-9.0
450 70 32 30 100 50 0.1 0.05 - 100 200 6 0.15 1.0 - -
South African Water Quality Guidelines (SAWQG), Volume 4 – Agricultural Use – Irrigation
Target Range
6.5-8.4
260 40 - - 70 - 5.0 0.02 - 100 - - 5.0 2.0 0.5 -
South African Water Quality Guidelines (SAWQG), Volume 5 – Agricultural Use – Livestock
Watering Target Range
- 1000 154 1000 500 2000 - 10 10 - 1500 1000 100 5.0 2.0 5.0 -
Groundwater Analytical Results 2012/2013
Kendal
CB01 20130313 7.4 -1 45.7 52.6 15.8 3.06 4.12 0.003 0.888 40 3.98 140 0.28 -1 0.32 0.01 0.02
CB02 20130313 6.3 -1 4.93 1.18 1.45 0.493 1.16 0.003 0.001 2.48 0.42 1.17 2.57 -1 0.22 0 0.01
PB04 20130312 8.2 -1 18 21 1.76 11.2 0.048 0.003 0.029 80.7 0.51 2.54 0.25 -1 3.01 0.01 0.02
PB05 20130312 6.6 -1 9.55 4.8 2.08 4.58 1.56 0.003 0.06 28.6 1.59 1.66 0.58 -1 0.17 0 0.01
PB06 20130312 8.4 -1 20.6 9.61 0.607 31.5 0.083 0.003 0.001 85.4 0.42 2.99 0.26 -1 5.05 0.06 0.01
AB07 20130313 6.5 -1 7.48 6.06 1.36 2.12 1.12 0.003 0.386 23 1.83 1.89 0.25 -1 0.06 0 0.01
AB08 20121024 6.8 -1 97.1 173.28 54.29 36.52 4.22 0.983 0.796 56.1 14.9 634.77 0.19 -1 0.06 2.23 0.01
WB12 20130312 7.3 -1 11.7 6.47 5.93 1.95 2.56 0.003 1.17 50.8 0.42 1.97 0.25 -1 0.13 0 0.01
AB14 20130312 7 -1 6.8 4.83 1.99 1.52 0.773 0.003 0.001 20.7 0.61 2.59 0.3 -1 0.15 0 0.01
AB16 20130312 6.7 -1 8.58 4.52 1.42 3.92 1.92 0.003 0.346 23.6 2.47 2.31 0.26 -1 0.26 0 0.01
CB17 20130312 7.8 -1 26.1 29.7 7.05 9.42 2.37 0.003 0.001 107 9.2 4.73 1.67 -1 0.14 0 0.02
WB18 20130312 6.9 -1 4.17 1.32 1.46 1.64 0.937 0.003 0.002 11 0.42 1.63 0.24 -1 0.32 0 0.01
AB22 20130312 7.2 -1 43.6 56.2 8.48 11.7 3.43 0.003 0.125 101 11.4 80 0.27 -1 0.17 0.09 0.01

GROUNDWATER BASELINE STUDY - KENDAL POWER STATION CONTINUOUS ASH DISPOSAL
May 2014 Report No. 12614149-12075-1 18
Location BH No. Latest
Sampling Date
pH TDS mg/l
EC mS/m
Ca mg/l
Mg mg/l
Na mg/l
K mg/l
Fe mg/l
Mn mg/l
M Alk. mg/l
Cl mg/l
SO4 mg/l
NO3 as N mg/l
Al mg/l
F mg/l
B mg/l
PO4 mg/l
PB23 20130312 9 -1 28.2 6.34 1.81 42 1.23 0.003 0.001 58.2 7.04 41.9 0.24 -1 3.67 0.04 0.01
SB24 20130312 7.2 -1 57.3 45.3 27 29.8 1.17 0.003 0.481 235 8.7 42 0.27 -1 0.37 0.02 0.01
AB25 20130312 6.2 -1 12.4 6.25 4.47 2.15 2.01 0.003 0.001 7.25 1.98 28.2 0.29 -1 0.26 0 0.01
CB40 20130312 7.2 -1 15.6 11.5 6.39 1.94 2.4 0.003 0.001 26.2 1.21 2.27 8.88 -1 0.12 0 0.06
PB42 20130313 6.5 -1 5.8 2.7 1.25 1.54 1.79 0.003 0.743 15.5 0.42 2.48 0.35 -1 0.17 0 0.01
AB44 20130312 6.7 -1 9.27 7.45 3.13 1.04 0.786 0.003 0.001 29.2 1.96 2.86 0.26 -1 0.26 0 0.01
AB45 20130312 6.4 -1 4.87 2.25 1.05 0.545 0.558 0.003 0.306 7.53 1.16 1.79 0.49 -1 0.26 0 0.01
AB47 20130312 8.1 -1 17.6 6.97 3.85 17.3 1.58 0.003 0.001 56.2 11 2.67 0.26 0.003 0.39 0.02 0.01
AB48 20130313 6.5 -1 25.8 13.1 7.71 18.6 3.14 0.973 0.498 81.9 14.7 17.4 0.27 0.003 0.49 0.07 0.01
AB49 20130313 7.4 -1 17.6 17.9 7.01 2.59 1.73 0.003 0.041 84.1 0.42 2.45 0.28 0.003 0.18 0 0.01
AB50 20130313 6.6 -1 8.65 5.36 2.73 0.757 1.13 0.003 0.001 22.8 0.47 3.22 0.65 0.003 0.11 0.01 0.01
AB51 20130313 7 -1 19.4 17.9 6.6 11.2 1.01 0.003 0.521 98 0.42 3.27 0.3 0.003 0.22 0 0.01
AB52 20121024 7.7 -1 21 23.35 8.75 12.08 1.4 0.003 0.168 112.2 3.2 6.72 0.02 0.003 0.52 0 0.01
AB53 20121024 7.3 -1 24.8 26.9 9.69 14.5 1.2 0.02 0.241 87.39 4.55 48.14 0.02 0.003 0.18 0 0.01
CB54 20130312 8.2 -1 18.3 10.3 4.82 11.5 3.92 0.003 0.001 57.5 4.17 7.87 0.27 0.003 3.29 0 0.01
CB55 20130312 6.7 -1 49.2 19.4 20.8 32.1 7.72 0.003 0.276 43.5 8.96 136 0.69 0.003 0.11 0 0.01
AB56 20130313 9.5 -1 11.2 4.49 2.45 7.33 1.02 0.003 0.001 30.7 4.52 2.91 0.27 0.003 0.27 0 0.01
AB57 20130313 7 -1 56 40.4 15.1 38.9 3.26 0.003 0.139 32.2 10.7 197 0.45 0.003 0.17 0.37 0.01
PB58 20130313 7.6 -1 68 106 14.6 11.1 8.94 0.003 0.001 287 0.42 9.05 7 0.003 1.65 0.01 0.02
PB59 20130313 6.7 -1 33.1 12 17 4.33 5.82 0.003 2.37 111 11.4 2.15 0.25 0.003 1.09 0 0.01
WB18S 20130312 7.3 -1 3.93 1.45 1.21 0.539 0.639 0.003 0.115 8.41 0.47 1.38 0.25 -1 0.14 0 0.01
SB24S 20130312 8.3 -1 52.9 37.3 27.7 33.4 0.854 0.003 0.001 257 10.7 2.57 0.26 -1 0.41 0.01 0.01
Note -1 indicates no available data

GROUNDWATER BASELINE STUDY - KENDAL POWER STATION CONTINUOUS ASH DISPOSAL
May 2014 Report No. 12614149-12075-1 19
5.9.2 Expanded Durov Diagrams
Expanded Durov diagrams were used to present the groundwater quality types. Two sets of graphs were
compiled, one set representing the hydrocensus groundwater chemistry and the second set representing the
latest (2012/2013) groundwater chemistry.
Expanded Durov diagrams graphically represent the relative percentages of anions and cations in water
samples. The cation percentages are plotted in the top part of the diagram and the anion percentages in the
left part. A projection of these cation and anion percentages onto the central area presents the chemical
signature of the major ion composition of the water. The chemical signature can be related to various
hydrochemical environments and conditions.
5.9.2.1 Hydrocensus Groundwater Quality
The groundwater quality of the two boreholes surveyed during the hydrocensus was plotted on an expanded
Durov diagram (Figure 9).
The expanded Durov diagram of the two hydrocensus samples (Figure 9) confirms two water types:
Kendal 02 Is representative of magnesium bicarbonate type (Mg)(HCO3)2, these sample represent
uncontaminated groundwater; and
Kendal 01 is representative of magnesium chloride type (Mg) Cl, the plot position on the diagram
indicates water with magnesium and chloride related contamination.
Figure 9: Expanded Durov Diagram of Hydrocensus Results
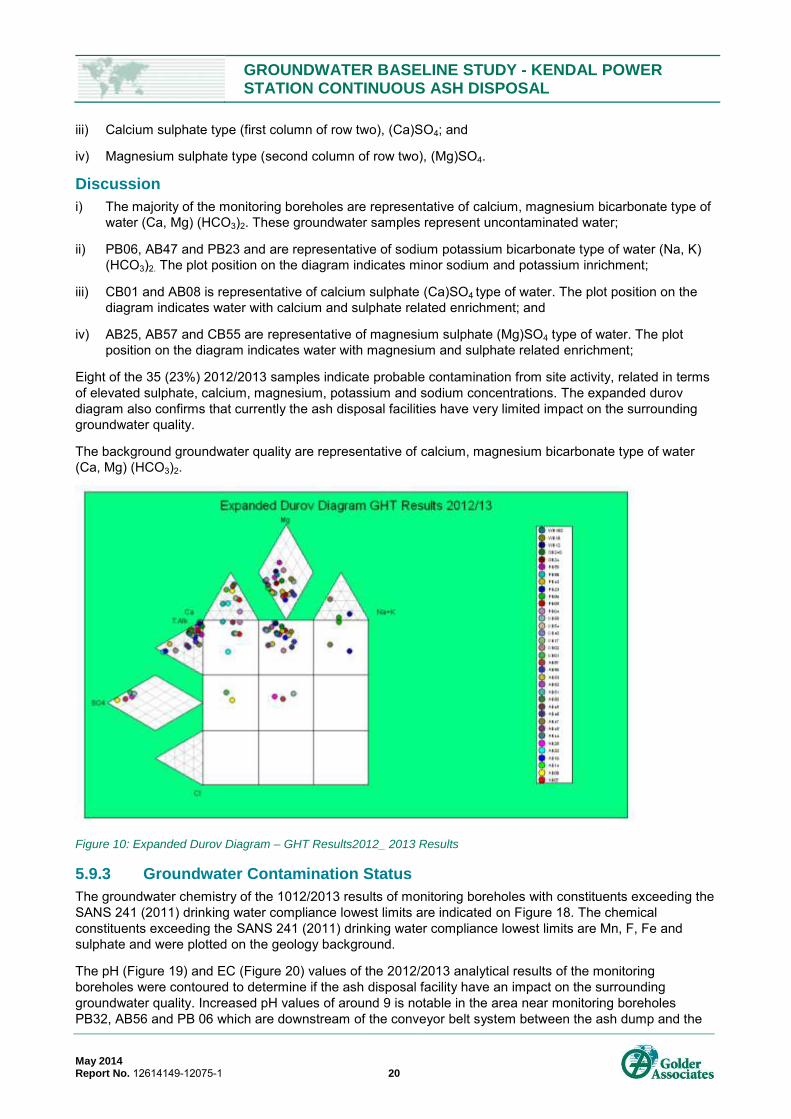
5.9.2.2 GHT 2012/2013 Analytical Results
The groundwater quality of 35 monitoring boreholes monitored by GHT was plotted on an expanded Durov
diagram (Figure 10). These analytical results are representative of the latest analytical results (2012/2013)
and were sampled during October 2012 and March 2013.
The expanded Durov diagram confirms four types of groundwater namely:
i) Calcium, magnesium bicarbonate type (first two columns of row one), (Ca, Mg)(HCO3)2;
ii) Sodium potassium bicarbonate type (third column of row one), (Na, K)(HCO3)2;
GROUNDWATER BASELINE STUDY - KENDAL POWER STATION CONTINUOUS ASH DISPOSAL
May 2014 Report No. 12614149-12075-1 20
iii) Calcium sulphate type (first column of row two), (Ca)SO4; and
iv) Magnesium sulphate type (second column of row two), (Mg)SO4.
Discussion
i) The majority of the monitoring boreholes are representative of calcium, magnesium bicarbonate type of
water (Ca, Mg) (HCO3)2. These groundwater samples represent uncontaminated water;
ii) PB06, AB47 and PB23 and are representative of sodium potassium bicarbonate type of water (Na, K)
(HCO3)2. The plot position on the diagram indicates minor sodium and potassium inrichment;
iii) CB01 and AB08 is representative of calcium sulphate (Ca)SO4 type of water. The plot position on the
diagram indicates water with calcium and sulphate related enrichment; and
iv) AB25, AB57 and CB55 are representative of magnesium sulphate (Mg)SO4 type of water. The plot
position on the diagram indicates water with magnesium and sulphate related enrichment;
Eight of the 35 (23%) 2012/2013 samples indicate probable contamination from site activity, related in terms
of elevated sulphate, calcium, magnesium, potassium and sodium concentrations. The expanded durov
diagram also confirms that currently the ash disposal facilities have very limited impact on the surrounding
groundwater quality.
The background groundwater quality are representative of calcium, magnesium bicarbonate type of water
(Ca, Mg) (HCO3)2.
Figure 10: Expanded Durov Diagram – GHT Results2012_ 2013 Results
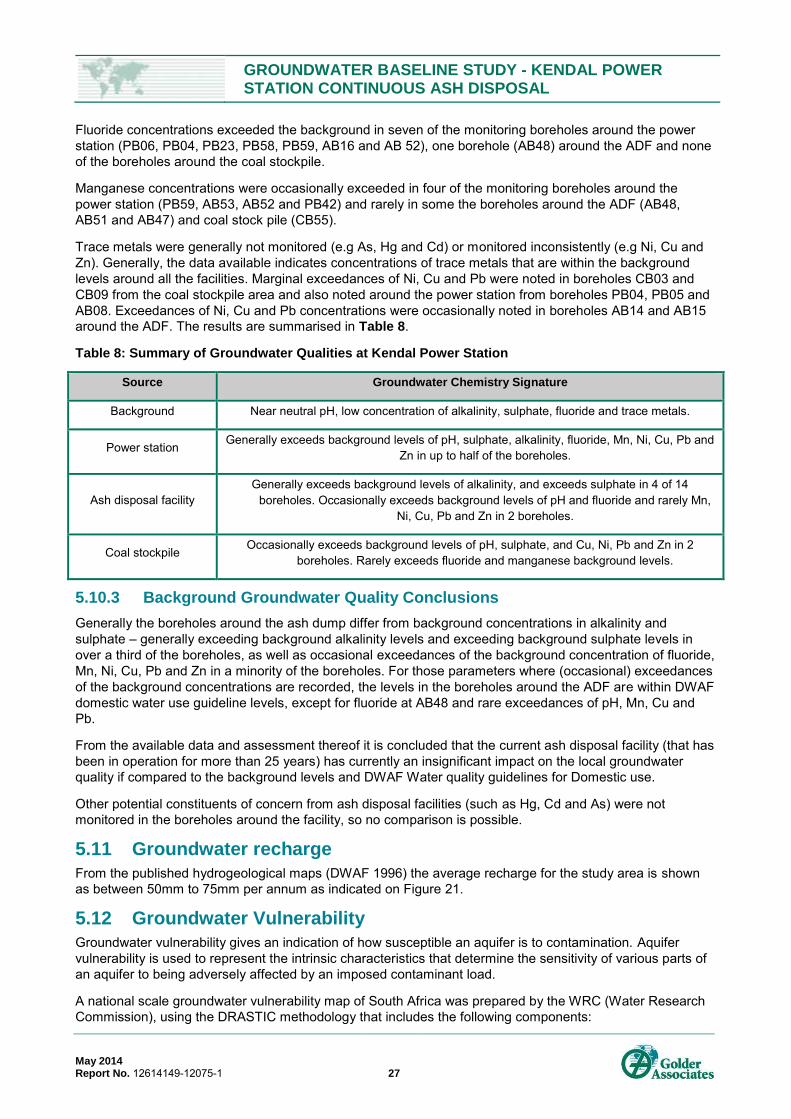
5.9.3 Groundwater Contamination Status
The groundwater chemistry of the 1012/2013 results of monitoring boreholes with constituents exceeding the
SANS 241 (2011) drinking water compliance lowest limits are indicated on Figure 18. The chemical
constituents exceeding the SANS 241 (2011) drinking water compliance lowest limits are Mn, F, Fe and
sulphate and were plotted on the geology background.
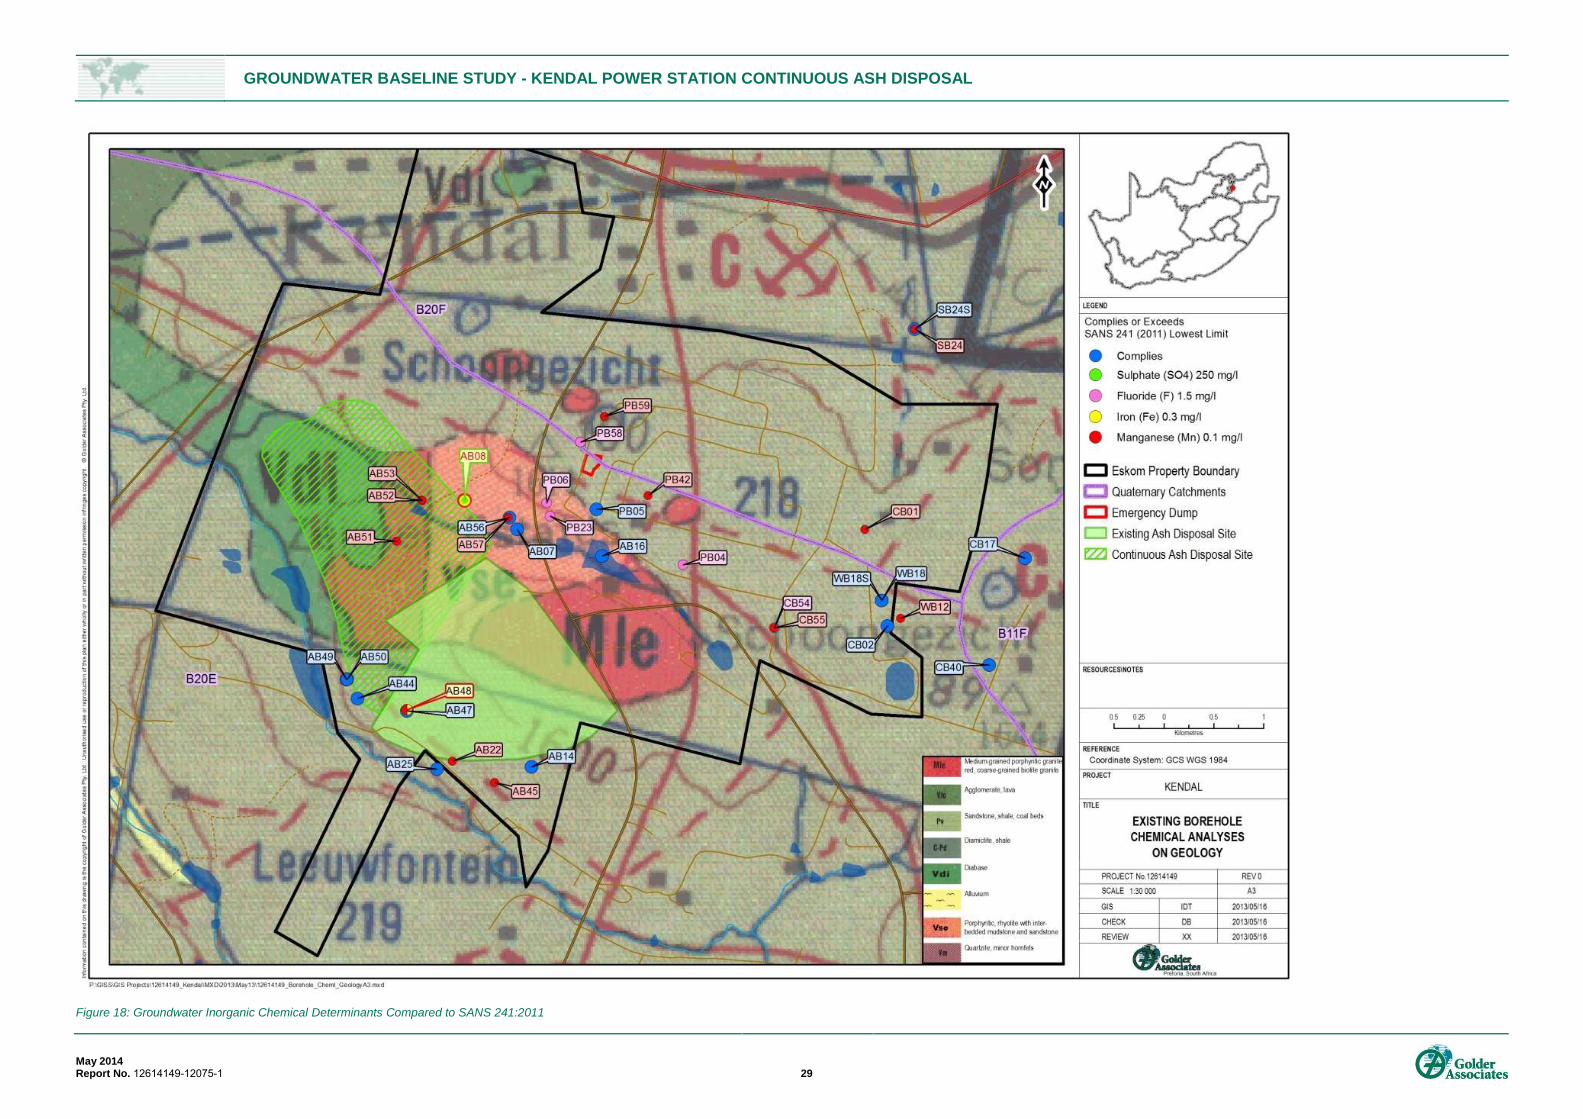
The pH (Figure 19) and EC (Figure 20) values of the 2012/2013 analytical results of the monitoring
boreholes were contoured to determine if the ash disposal facility have an impact on the surrounding
groundwater quality. Increased pH values of around 9 is notable in the area near monitoring boreholes
PB32, AB56 and PB 06 which are downstream of the conveyor belt system between the ash dump and the

GROUNDWATER BASELINE STUDY - KENDAL POWER STATION CONTINUOUS ASH DISPOSAL
May 2014 Report No. 12614149-12075-1 21
Power station. An increased in EC of maximum 90 mS/m is noticeable at monitoring position AB 08 which is
still below SANS 241 (2011) Drinking Water Standard Lowest Compliance Limit.
From the analytical results the positions of monitoring boreholes constituents exceeding the SANS 241
(2011) drinking water compliance lowest limits, it can be concluded that the ash disposal facility currently has
limited impact on the surrounding groundwater quality.
5.10 Background Groundwater Quality
The existing groundwater monitoring network consists of 45 monitoring boreholes (Figure 11). Twenty-seven
of these boreholes are for the deep aquifer, five are shallow and there is no indication of the depth of the
remaining boreholes.
The groundwater flows mimic the topography and is toward the surface streams. Figure 6 shows typical
groundwater flow directions at KPS.
As part of the baseline assessment, the background water quality at the ADF is discussed below:
Establish the background groundwater quality for Kendal power station (as a proxy for comparison
between a pre-Eskom baseline and post-Eskom impacted groundwater); and
Differentiate the impacts of the power station from those of the ash disposal facility (ADF).
GROUNDWATER BASELINE STUDY - KENDAL POWER STATION CONTINUOUS ASH DISPOSAL
May 2014 Report No. 12614149-12075-1 22
Figure 11: Existing Monitoring Network and Proposed new Monitoring Boreholes
GROUNDWATER BASELINE STUDY - KENDAL POWER STATION CONTINUOUS ASH DISPOSAL
May 2014 Report No. 12614149-12075-1 23
5.10.1 Determination of background groundwater quality
The background groundwater quality was derived by calculating the mean and standard deviation for the
concentrations of each parameter, using monitoring data from 1987 to 2013 for six boreholes which were
determined as being located upstream of KPS facilities (CD02, CD17, CD40, WB12, WB18 and WB18S, see
Figure 6) and a borehole identified during the hydrocensus (Kendal 02) that was found in the baseline study
to represent unpolluted groundwater (Golder, 2013).
5.10.2 Results
The shallow and deep aquifer groundwater quality was compared against the baseline as determined in
section 5.10. The gaps on the graphs signify absence of monitoring data. It appears from the piezometric
contouring (Figure 6) that the groundwater flows divide in the area. Thus, groundwater and impacts from the
ADF does not reach the power station and vice versa. The same applies for the power station and the
colliery to the north east of the colliery. Thus the boreholes with letters PB and AB, which occur across the
river to the north and northeast of the ADF are considered to be monitoring impacts from the power station
while all the other boreholes with letter AB are monitoring the impacts on groundwater around the ADF.
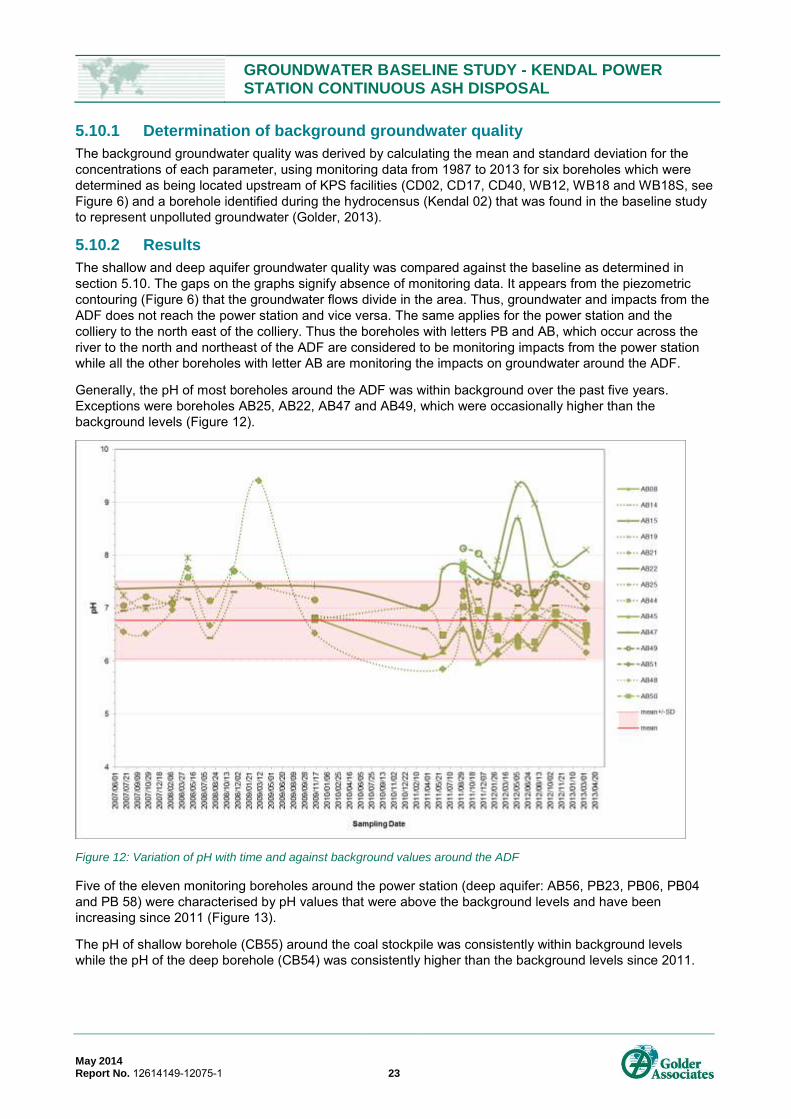
Generally, the pH of most boreholes around the ADF was within background over the past five years.
Exceptions were boreholes AB25, AB22, AB47 and AB49, which were occasionally higher than the
background levels (Figure 12).
Figure 12: Variation of pH with time and against background values around the ADF
Five of the eleven monitoring boreholes around the power station (deep aquifer: AB56, PB23, PB06, PB04
and PB 58) were characterised by pH values that were above the background levels and have been
increasing since 2011 (Figure 13).
The pH of shallow borehole (CB55) around the coal stockpile was consistently within background levels
while the pH of the deep borehole (CB54) was consistently higher than the background levels since 2011.
GROUNDWATER BASELINE STUDY - KENDAL POWER STATION CONTINUOUS ASH DISPOSAL
May 2014 Report No. 12614149-12075-1 24
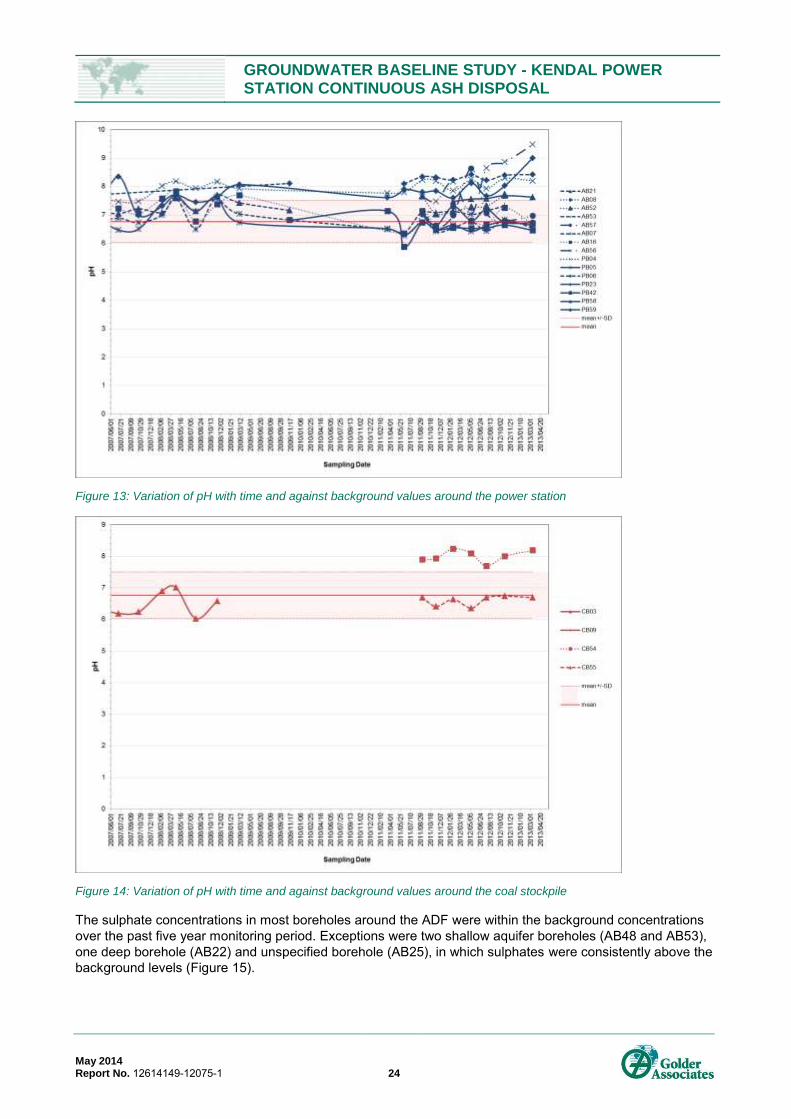
Figure 13: Variation of pH with time and against background values around the power station
Figure 14: Variation of pH with time and against background values around the coal stockpile
The sulphate concentrations in most boreholes around the ADF were within the background concentrations
over the past five year monitoring period. Exceptions were two shallow aquifer boreholes (AB48 and AB53),
one deep borehole (AB22) and unspecified borehole (AB25), in which sulphates were consistently above the
background levels (Figure 15).
GROUNDWATER BASELINE STUDY - KENDAL POWER STATION CONTINUOUS ASH DISPOSAL
May 2014 Report No. 12614149-12075-1 25
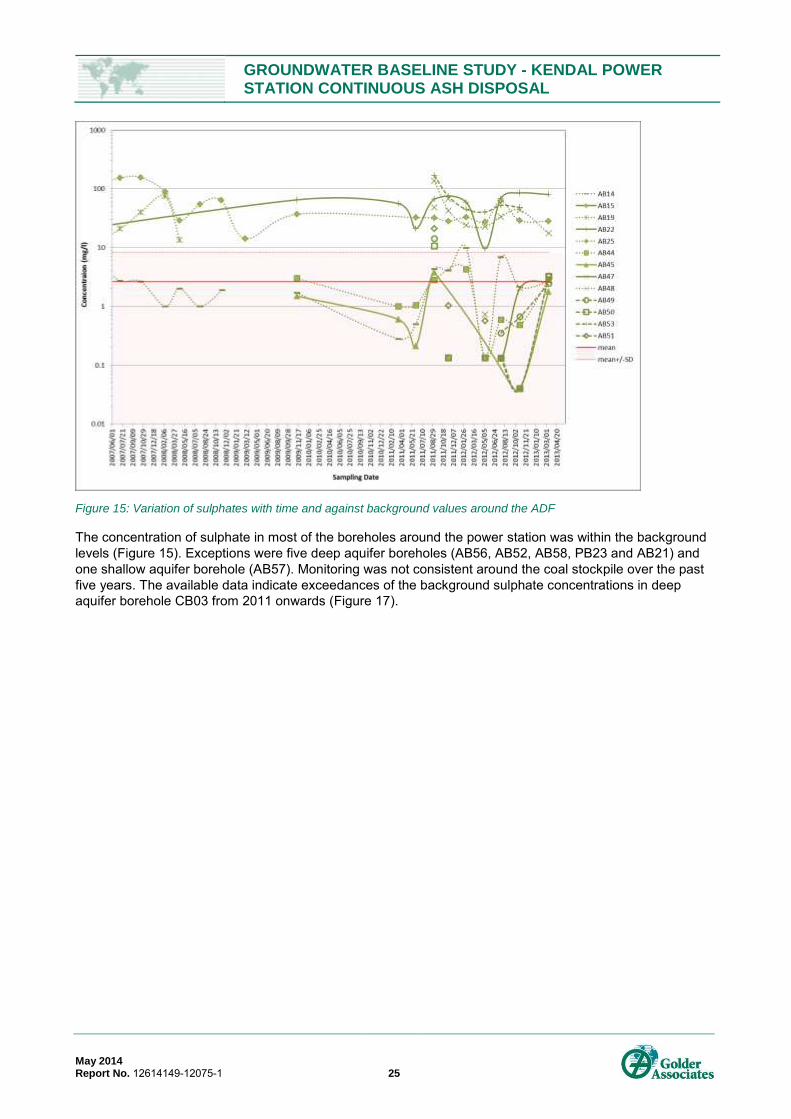
Figure 15: Variation of sulphates with time and against background values around the ADF
The concentration of sulphate in most of the boreholes around the power station was within the background
levels (Figure 15). Exceptions were five deep aquifer boreholes (AB56, AB52, AB58, PB23 and AB21) and
one shallow aquifer borehole (AB57). Monitoring was not consistent around the coal stockpile over the past
five years. The available data indicate exceedances of the background sulphate concentrations in deep
aquifer borehole CB03 from 2011 onwards (Figure 17).

GROUNDWATER BASELINE STUDY - KENDAL POWER STATION CONTINUOUS ASH DISPOSAL
May 2014 Report No. 12614149-12075-1 26
Figure 16: Variation of Sulphates with time and against background values around the power station
Figure 17: Variation of Sulphates with time and against background values around the ADF
Seven of the monitoring boreholes around the power station (boreholes PB04, PB58, PB59, PB06, PB21,
AB52 and AB53) exceeded the background alkalinity concentration over the last five years. Only three of the
monitoring boreholes around the ADF (AB49, AB44 and AB22) had alkalinity concentrations above the
background levels and all boreholes around the coal stockpile were all within the background concentrations.
GROUNDWATER BASELINE STUDY - KENDAL POWER STATION CONTINUOUS ASH DISPOSAL
May 2014 Report No. 12614149-12075-1 27
Fluoride concentrations exceeded the background in seven of the monitoring boreholes around the power
station (PB06, PB04, PB23, PB58, PB59, AB16 and AB 52), one borehole (AB48) around the ADF and none
of the boreholes around the coal stockpile.
Manganese concentrations were occasionally exceeded in four of the monitoring boreholes around the
power station (PB59, AB53, AB52 and PB42) and rarely in some the boreholes around the ADF (AB48,
AB51 and AB47) and coal stock pile (CB55).
Trace metals were generally not monitored (e.g As, Hg and Cd) or monitored inconsistently (e.g Ni, Cu and
Zn). Generally, the data available indicates concentrations of trace metals that are within the background
levels around all the facilities. Marginal exceedances of Ni, Cu and Pb were noted in boreholes CB03 and
CB09 from the coal stockpile area and also noted around the power station from boreholes PB04, PB05 and
AB08. Exceedances of Ni, Cu and Pb concentrations were occasionally noted in boreholes AB14 and AB15
around the ADF. The results are summarised in Table 8.
Table 8: Summary of Groundwater Qualities at Kendal Power Station
Source Groundwater Chemistry Signature
Background Near neutral pH, low concentration of alkalinity, sulphate, fluoride and trace metals.
Power station Generally exceeds background levels of pH, sulphate, alkalinity, fluoride, Mn, Ni, Cu, Pb and
Zn in up to half of the boreholes.
Ash disposal facility
Generally exceeds background levels of alkalinity, and exceeds sulphate in 4 of 14
boreholes. Occasionally exceeds background levels of pH and fluoride and rarely Mn,
Ni, Cu, Pb and Zn in 2 boreholes.
Coal stockpile Occasionally exceeds background levels of pH, sulphate, and Cu, Ni, Pb and Zn in 2
boreholes. Rarely exceeds fluoride and manganese background levels.
5.10.3 Background Groundwater Quality Conclusions
Generally the boreholes around the ash dump differ from background concentrations in alkalinity and
sulphate – generally exceeding background alkalinity levels and exceeding background sulphate levels in
over a third of the boreholes, as well as occasional exceedances of the background concentration of fluoride,
Mn, Ni, Cu, Pb and Zn in a minority of the boreholes. For those parameters where (occasional) exceedances
of the background concentrations are recorded, the levels in the boreholes around the ADF are within DWAF
domestic water use guideline levels, except for fluoride at AB48 and rare exceedances of pH, Mn, Cu and
Pb.
From the available data and assessment thereof it is concluded that the current ash disposal facility (that has
been in operation for more than 25 years) has currently an insignificant impact on the local groundwater
quality if compared to the background levels and DWAF Water quality guidelines for Domestic use.
Other potential constituents of concern from ash disposal facilities (such as Hg, Cd and As) were not
monitored in the boreholes around the facility, so no comparison is possible.
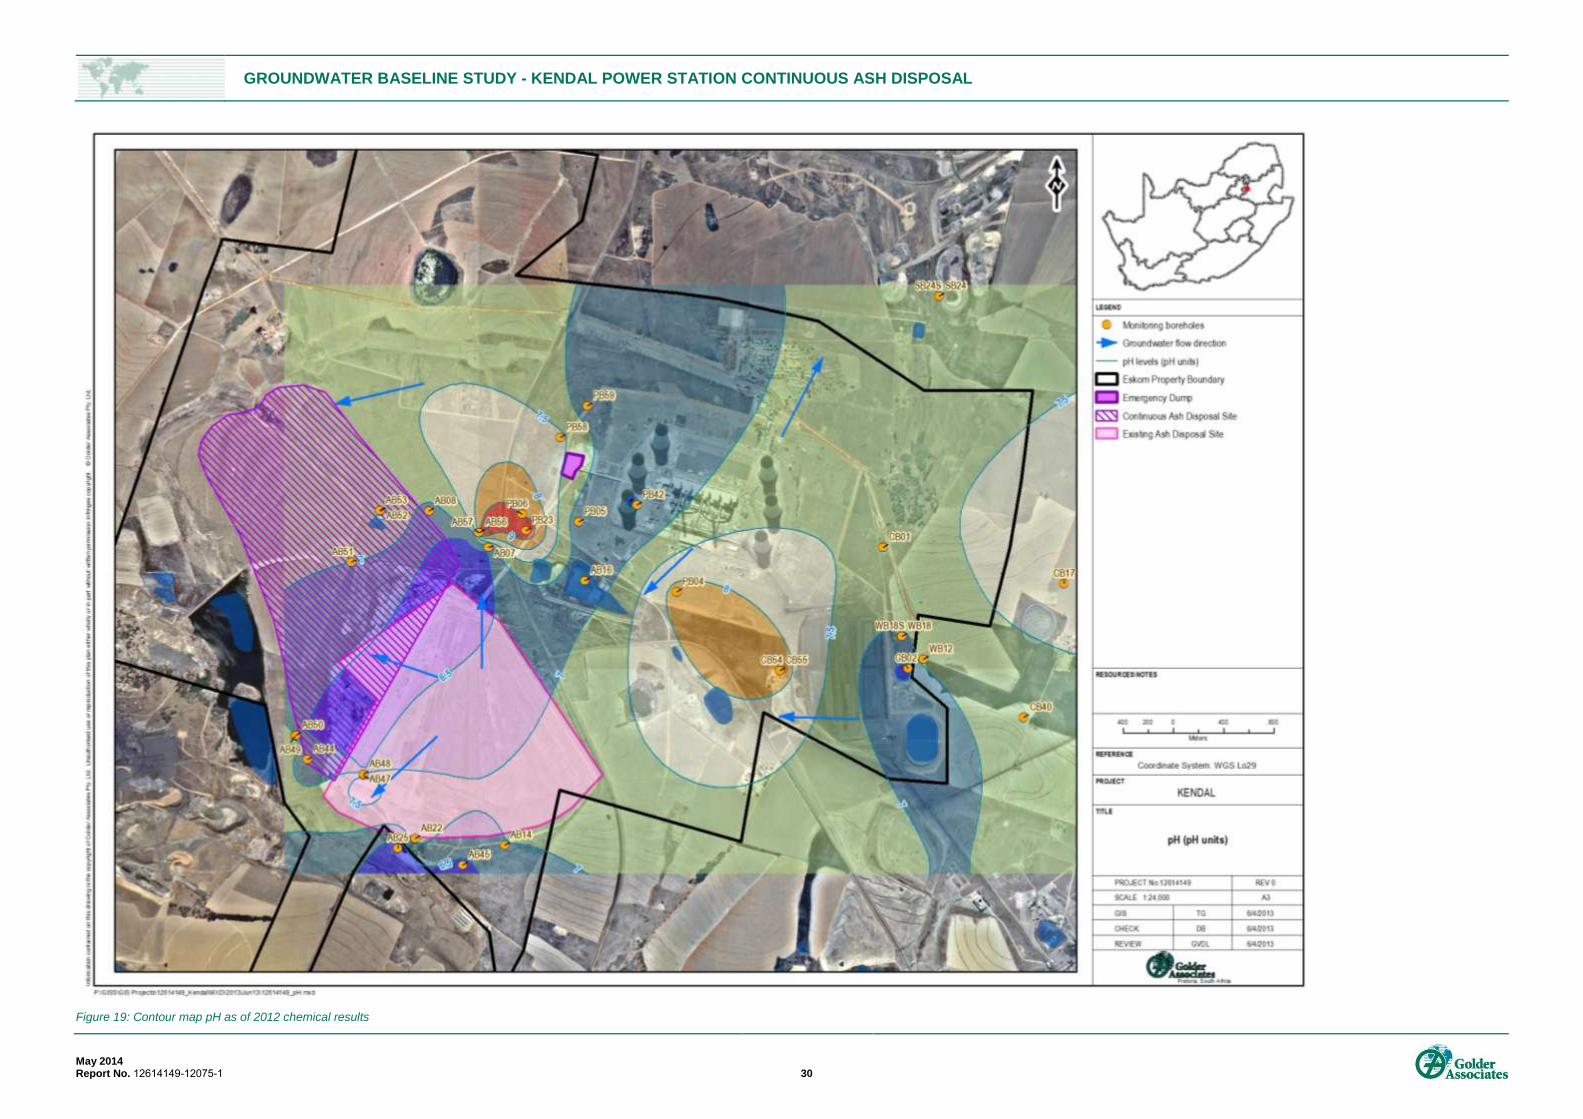
5.11 Groundwater recharge
From the published hydrogeological maps (DWAF 1996) the average recharge for the study area is shown
as between 50mm to 75mm per annum as indicated on Figure 21.
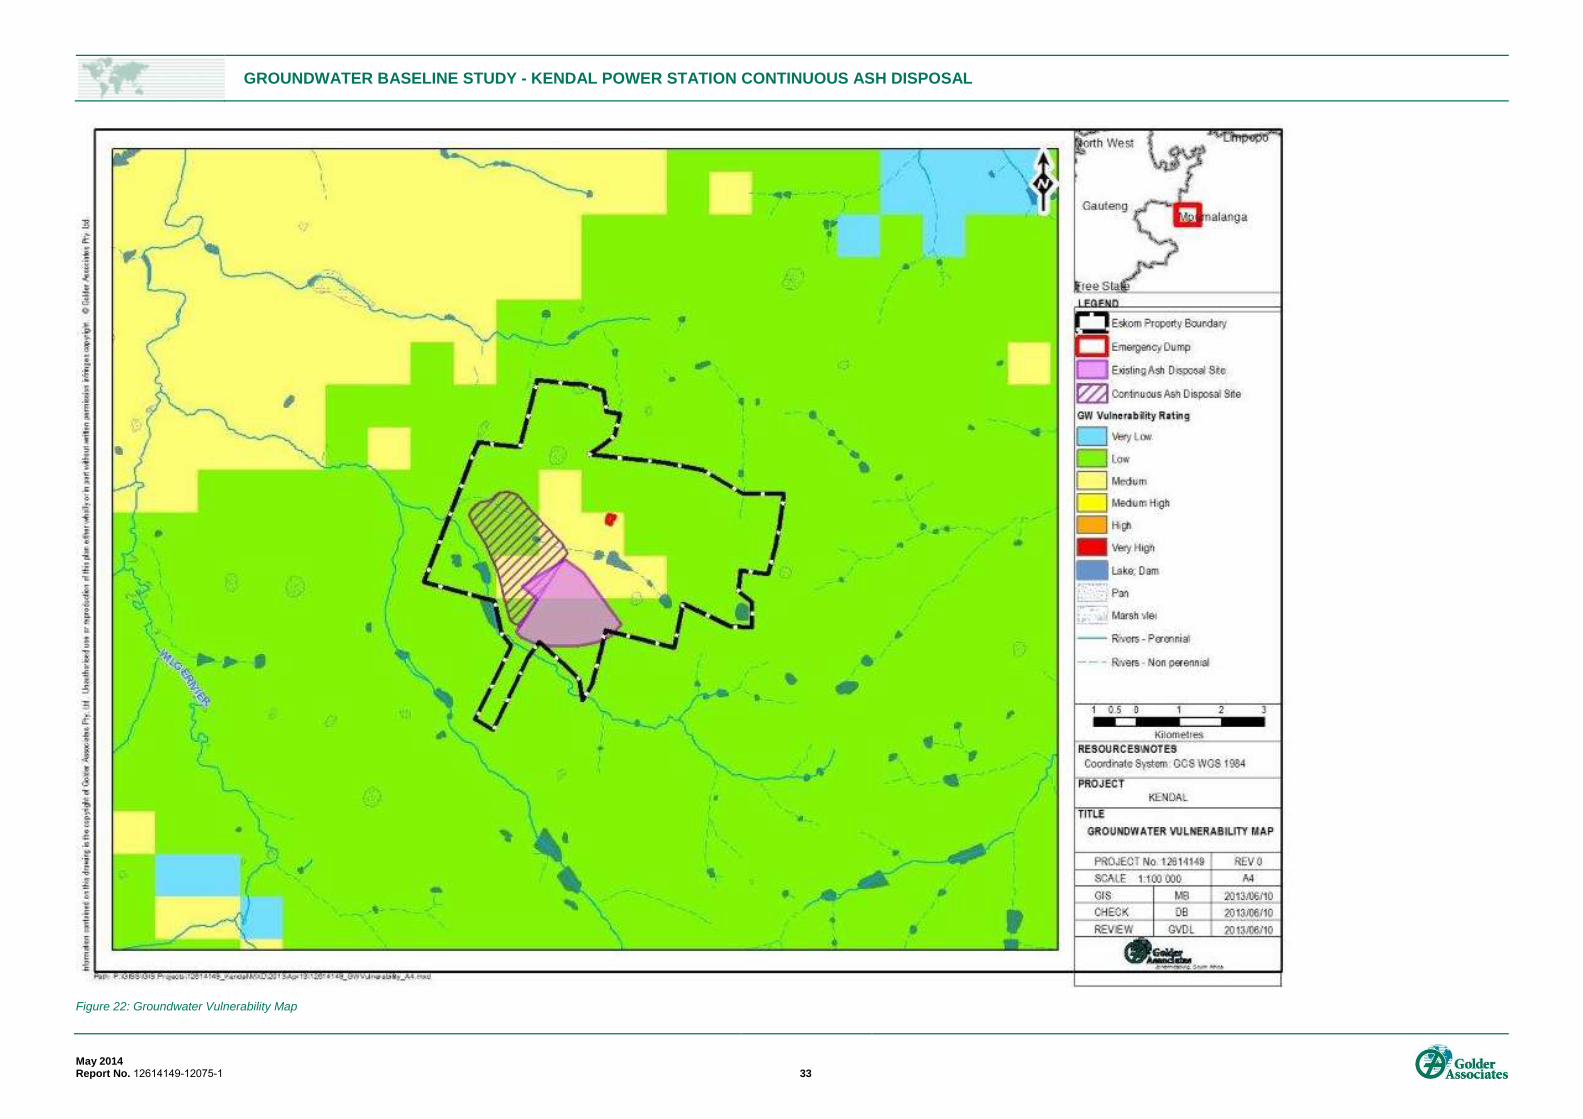
5.12 Groundwater Vulnerability
Groundwater vulnerability gives an indication of how susceptible an aquifer is to contamination. Aquifer
vulnerability is used to represent the intrinsic characteristics that determine the sensitivity of various parts of
an aquifer to being adversely affected by an imposed contaminant load.
A national scale groundwater vulnerability map of South Africa was prepared by the WRC (Water Research
Commission), using the DRASTIC methodology that includes the following components:

GROUNDWATER BASELINE STUDY - KENDAL POWER STATION CONTINUOUS ASH DISPOSAL
May 2014 Report No. 12614149-12075-1 28
Depth to groundwater;
Recharge due to rainfall;
Aquifer media;
Soil media;
Topography;
Impact of the vadose zone; and
Hydraulic Conductivity.
Groundwater vulnerability was classified into six classes ranging from very low to very high.
Groundwater vulnerability at the Kendal continuous and emergency ash site is shown on the national
groundwater vulnerability map as low to medium (Figure 22). The probability that disposal of ash on existing
and continuous and emergency site will have an impact on the groundwater is limited but needs to be
monitored.
GROUNDWATER BASELINE STUDY - KENDAL POWER STATION CONTINUOUS ASH DISPOSAL
May 2014 Report No. 12614149-12075-1 29
Figure 18: Groundwater Inorganic Chemical Determinants Compared to SANS 241:2011
GROUNDWATER BASELINE STUDY - KENDAL POWER STATION CONTINUOUS ASH DISPOSAL
May 2014 Report No. 12614149-12075-1 30
Figure 19: Contour map pH as of 2012 chemical results

GROUNDWATER BASELINE STUDY - KENDAL POWER STATION CONTINUOUS ASH DISPOSAL
May 2014 Report No. 12614149-12075-1 31
Figure 20: Contour map of electrical conductivity as of 2012 chemical results
GROUNDWATER BASELINE STUDY - KENDAL POWER STATION CONTINUOUS ASH DISPOSAL
May 2014 Report No. 12614149-12075-1 32
Figure 21: Mean Annual Groundwater Recharge
GROUNDWATER BASELINE STUDY - KENDAL POWER STATION CONTINUOUS ASH DISPOSAL
May 2014 Report No. 12614149-12075-1 33
Figure 22: Groundwater Vulnerability Map

GROUNDWATER BASELINE STUDY - KENDAL POWER STATION CONTINUOUS ASH DISPOSAL
May 2014 Report No. 12614149-12075-1 34
6.0 GROUNDWATER QUALITATIVE IMPACT ASSESSMENT
The impact assessment was conducted to determine how the proposed continuous ash disposal at the
existing and emergency dumps will affect the state of the groundwater. The Impact assessment methodology
followed was provided by Zitholele consulting in order to ensure uniformity as described below:
6.1 Impact Assessment Methodology
A standard impact assessment methodology was utilised so that a wide range of impacts can be compared
with each other. The impact assessment methodology makes provision for the assessment of impacts
against the following criteria:
Significance;
Spatial scale;
Temporal scale;
Probability; and
Degree of certainty.
A combined quantitative and qualitative methodology is used to describe impacts for each of the
aforementioned assessment criteria. A summary of each of the qualitative descriptors along with the
equivalent quantitative rating scale for each of the aforementioned criteria is given in Table 9.
Table 9: Quantitative rating and equivalent descriptors for the impact assessment criteria
Rating Significance Extent Scale Temporal Scale
1 VERY LOW Isolated sites / proposed route Incidental
2 LOW Study area Short-term
3 MODERATE Local Medium-term
4 HIGH Regional / Provincial Long-term
5 VERY HIGH Global / National Permanent
A more detailed description of each of the assessment criteria is given in the following sections.
6.1.1 Significance Assessment
Significance rating (importance) of the associated impacts embraces the notion of extent and magnitude, but
does not always clearly define these since their importance in the rating scale is very relative. For example,
the magnitude (i.e. the size) of area affected by atmospheric pollution may be extremely large (1 000 km2)
but the significance of this effect is dependent on the concentration or level of pollution. If the concentration
is great, the significance of the impact would be HIGH or VERY HIGH, but if it is diluted it would be VERY
LOW or LOW. Similarly, if 60 ha of a grassland type are destroyed the impact would be VERY HIGH if only
100 ha of that grassland type were known. The impact would be VERY LOW if the grassland type was
common. A more detailed description of the impact significance rating scale is given in Table 10 below.
Table 10: Description of the significance rating scale
Rating Description
5 Very high
Of the highest order possible within the bounds of impacts which could occur. In the case of adverse impacts: there is no possible mitigation and/or remedial activity which could offset the impact. In the case of beneficial impacts, there is no real alternative to achieving this benefit.
4 High
Impact is of substantial order within the bounds of impacts, which could occur. In the case of adverse impacts: mitigation and/or remedial activity is feasible but difficult, expensive, time-consuming or some combination of these. In the case of beneficial impacts, other means of achieving this benefit are feasible but they are more difficult, expensive, time-consuming or some combination of these.
3 Moderate
Impact is real but not substantial in relation to other impacts, which might take effect within the bounds of those which could occur. In the case of adverse impacts:

GROUNDWATER BASELINE STUDY - KENDAL POWER STATION CONTINUOUS ASH DISPOSAL
May 2014 Report No. 12614149-12075-1 35
Rating Description
mitigation and/or remedial activity are both feasible and fairly easily possible. In the case of beneficial impacts: other means of achieving this benefit are about equal in time, cost, effort, etc.
2 Low
Impact is of a low order and therefore likely to have little real effect. In the case of adverse impacts: mitigation and/or remedial activity is either easily achieved or little will be required, or both. In the case of beneficial impacts, alternative means for achieving this benefit are likely to be easier, cheaper, more effective, less time consuming, or some combination of these.
1 Very low
Impact is negligible within the bounds of impacts which could occur. In the case of adverse impacts, almost no mitigation and/or remedial activity are needed, and any minor steps which might be needed are easy, cheap, and simple. In the case of beneficial impacts, alternative means are almost all likely to be better, in one or a number of ways, than this means of achieving the benefit. Three additional categories must also be used where relevant. They are in addition to the category represented on the scale, and if used, will replace the scale.
0 No impact
There is no impact at all - not even a very low impact on a party or system.
6.1.2 Spatial Scale
The spatial scale refers to the extent of the impact i.e. will the impact be felt at the local, regional, or global
scale. The spatial assessment scale is described in more detail in Table 11.
Table 11: Description of the spatial scale
Rating Description
5 Global/National The maximum extent of any impact.
4 Regional/Provincial The spatial scale is moderate within the bounds of impacts possible, and will be felt at a regional scale (District Municipality to Provincial Level).
3 Local The impact will affect an area up to 10 km from the proposed route.
2 Study Area The impact will affect an area not exceeding the Eskom servitude.
1 Isolated Sites / proposed route
The impact will affect an area no bigger than the power line pylon footing.
6.1.3 Duration Scale
In order to accurately describe the impact it is necessary to understand the duration and persistence of an
impact in the environment. The temporal scale is rated according to criteria set out in Table 12.
Table 12: Description of the temporal rating scale
Rating Description
1 Incidental The impact will be limited to isolated incidences that are expected to occur very sporadically.
2 Short-term The environmental impact identified will operate for the duration of the construction phase or a period of less than 5 years, whichever is the greater.
3 Medium term The environmental impact identified will operate for the duration of life of facility.
4 Long term The environmental impact identified will operate beyond the life of operation.
5 Permanent The environmental impact will be permanent.
6.1.4 Degree of Probability
Probability or likelihood of an impact occurring are described as shown in Table 13 below.
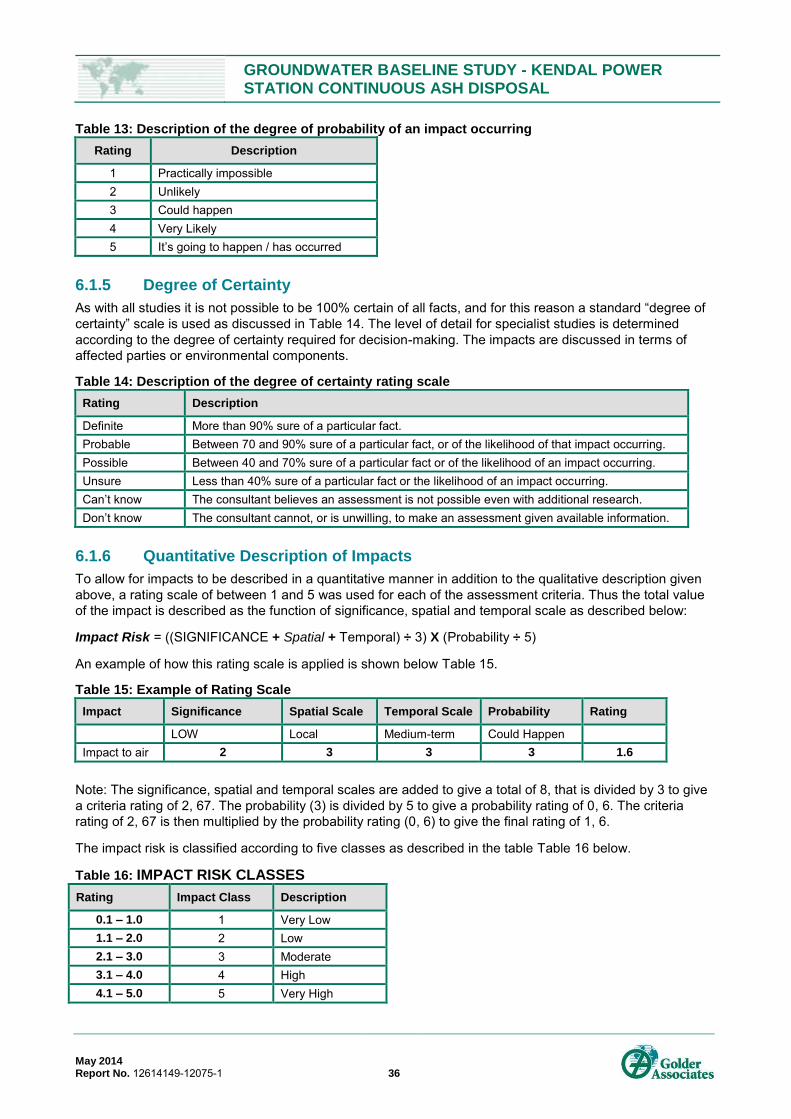
GROUNDWATER BASELINE STUDY - KENDAL POWER STATION CONTINUOUS ASH DISPOSAL
May 2014 Report No. 12614149-12075-1 36
Table 13: Description of the degree of probability of an impact occurring
Rating Description
1 Practically impossible
2 Unlikely
3 Could happen
4 Very Likely
5 It’s going to happen / has occurred
6.1.5 Degree of Certainty
As with all studies it is not possible to be 100% certain of all facts, and for this reason a standard “degree of
certainty” scale is used as discussed in Table 14. The level of detail for specialist studies is determined
according to the degree of certainty required for decision-making. The impacts are discussed in terms of
affected parties or environmental components.
Table 14: Description of the degree of certainty rating scale
Rating Description
Definite More than 90% sure of a particular fact.
Probable Between 70 and 90% sure of a particular fact, or of the likelihood of that impact occurring.
Possible Between 40 and 70% sure of a particular fact or of the likelihood of an impact occurring.
Unsure Less than 40% sure of a particular fact or the likelihood of an impact occurring.
Can’t know The consultant believes an assessment is not possible even with additional research.
Don’t know The consultant cannot, or is unwilling, to make an assessment given available information.
6.1.6 Quantitative Description of Impacts
To allow for impacts to be described in a quantitative manner in addition to the qualitative description given
above, a rating scale of between 1 and 5 was used for each of the assessment criteria. Thus the total value
of the impact is described as the function of significance, spatial and temporal scale as described below:
Impact Risk = ((SIGNIFICANCE + Spatial + Temporal) ÷ 3) X (Probability ÷ 5)
An example of how this rating scale is applied is shown below Table 15.
Table 15: Example of Rating Scale
Impact Significance Spatial Scale Temporal Scale Probability Rating
LOW Local Medium-term Could Happen
Impact to air 2 3 3 3 1.6
Note: The significance, spatial and temporal scales are added to give a total of 8, that is divided by 3 to give
a criteria rating of 2, 67. The probability (3) is divided by 5 to give a probability rating of 0, 6. The criteria
rating of 2, 67 is then multiplied by the probability rating (0, 6) to give the final rating of 1, 6.
The impact risk is classified according to five classes as described in the table Table 16 below.
Table 16: IMPACT RISK CLASSES
Rating Impact Class Description
0.1 – 1.0 1 Very Low
1.1 – 2.0 2 Low
2.1 – 3.0 3 Moderate
3.1 – 4.0 4 High
4.1 – 5.0 5 Very High
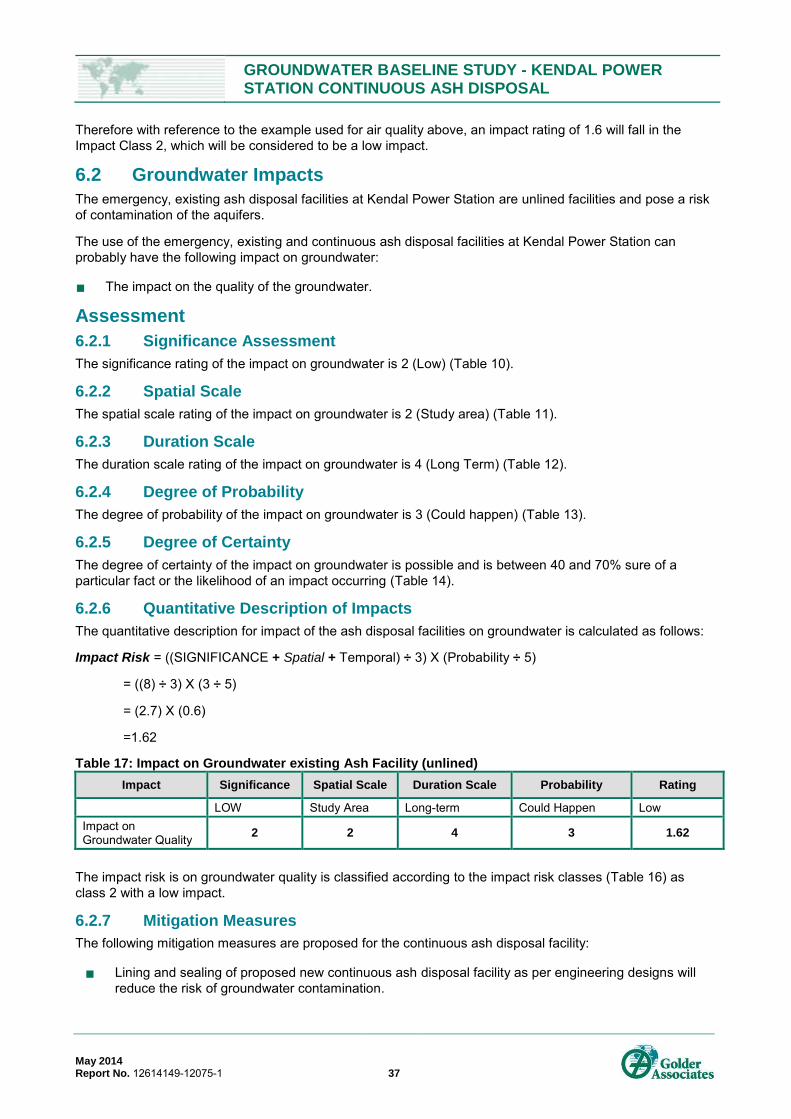
GROUNDWATER BASELINE STUDY - KENDAL POWER STATION CONTINUOUS ASH DISPOSAL
May 2014 Report No. 12614149-12075-1 37
Therefore with reference to the example used for air quality above, an impact rating of 1.6 will fall in the
Impact Class 2, which will be considered to be a low impact.
6.2 Groundwater Impacts
The emergency, existing ash disposal facilities at Kendal Power Station are unlined facilities and pose a risk
of contamination of the aquifers.
The use of the emergency, existing and continuous ash disposal facilities at Kendal Power Station can
probably have the following impact on groundwater:
The impact on the quality of the groundwater.
Assessment
6.2.1 Significance Assessment
The significance rating of the impact on groundwater is 2 (Low) (Table 10).
6.2.2 Spatial Scale
The spatial scale rating of the impact on groundwater is 2 (Study area) (Table 11).
6.2.3 Duration Scale
The duration scale rating of the impact on groundwater is 4 (Long Term) (Table 12).
6.2.4 Degree of Probability
The degree of probability of the impact on groundwater is 3 (Could happen) (Table 13).
6.2.5 Degree of Certainty
The degree of certainty of the impact on groundwater is possible and is between 40 and 70% sure of a
particular fact or the likelihood of an impact occurring (Table 14).
6.2.6 Quantitative Description of Impacts
The quantitative description for impact of the ash disposal facilities on groundwater is calculated as follows:
Impact Risk = ((SIGNIFICANCE + Spatial + Temporal) ÷ 3) X (Probability ÷ 5)
= ((8) ÷ 3) X (3 ÷ 5)
= (2.7) X (0.6)
=1.62
Table 17: Impact on Groundwater existing Ash Facility (unlined)
Impact Significance Spatial Scale Duration Scale Probability Rating
LOW Study Area Long-term Could Happen Low
Impact on Groundwater Quality
2 2 4 3 1.62
The impact risk is on groundwater quality is classified according to the impact risk classes (Table 16) as
class 2 with a low impact.
6.2.7 Mitigation Measures
The following mitigation measures are proposed for the continuous ash disposal facility:
Lining and sealing of proposed new continuous ash disposal facility as per engineering designs will
reduce the risk of groundwater contamination.
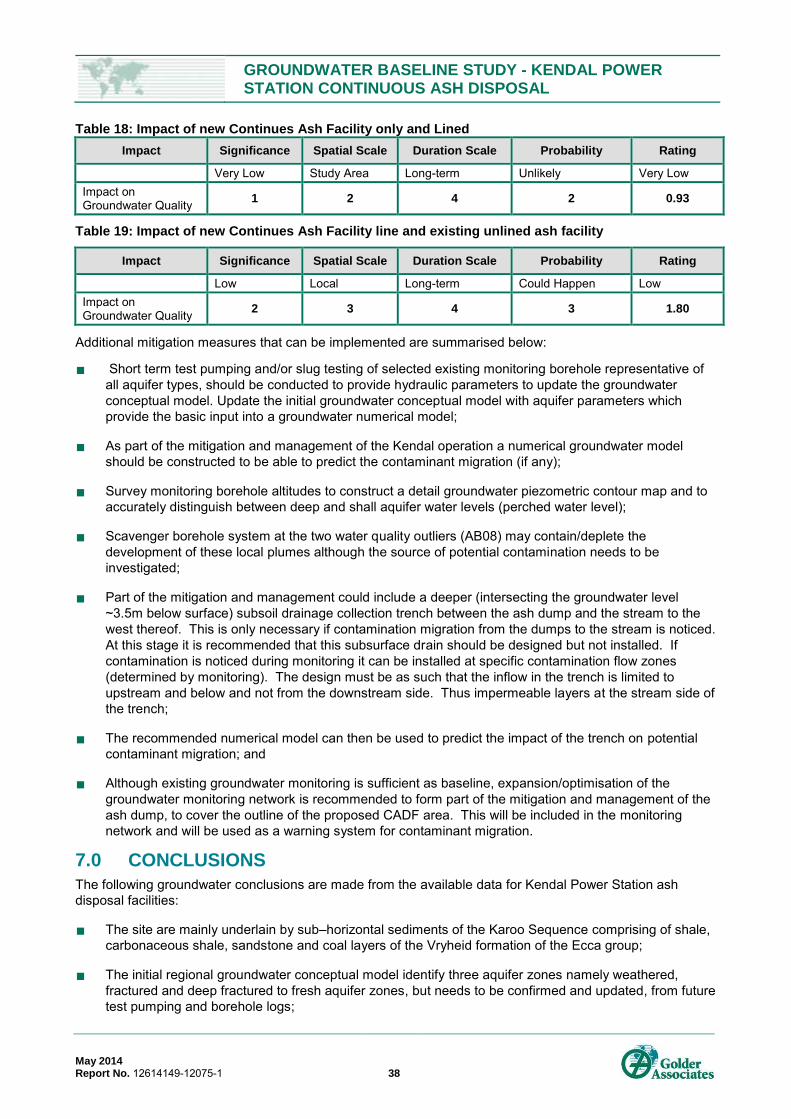
GROUNDWATER BASELINE STUDY - KENDAL POWER STATION CONTINUOUS ASH DISPOSAL
May 2014 Report No. 12614149-12075-1 38
Table 18: Impact of new Continues Ash Facility only and Lined
Impact Significance Spatial Scale Duration Scale Probability Rating
Very Low Study Area Long-term Unlikely Very Low
Impact on Groundwater Quality
1 2 4 2 0.93
Table 19: Impact of new Continues Ash Facility line and existing unlined ash facility
Impact Significance Spatial Scale Duration Scale Probability Rating
Low Local Long-term Could Happen Low
Impact on Groundwater Quality
2 3 4 3 1.80
Additional mitigation measures that can be implemented are summarised below:
Short term test pumping and/or slug testing of selected existing monitoring borehole representative of
all aquifer types, should be conducted to provide hydraulic parameters to update the groundwater
conceptual model. Update the initial groundwater conceptual model with aquifer parameters which
provide the basic input into a groundwater numerical model;
As part of the mitigation and management of the Kendal operation a numerical groundwater model
should be constructed to be able to predict the contaminant migration (if any);
Survey monitoring borehole altitudes to construct a detail groundwater piezometric contour map and to
accurately distinguish between deep and shall aquifer water levels (perched water level);
Scavenger borehole system at the two water quality outliers (AB08) may contain/deplete the
development of these local plumes although the source of potential contamination needs to be
investigated;
Part of the mitigation and management could include a deeper (intersecting the groundwater level
~3.5m below surface) subsoil drainage collection trench between the ash dump and the stream to the
west thereof. This is only necessary if contamination migration from the dumps to the stream is noticed.
At this stage it is recommended that this subsurface drain should be designed but not installed. If
contamination is noticed during monitoring it can be installed at specific contamination flow zones
(determined by monitoring). The design must be as such that the inflow in the trench is limited to
upstream and below and not from the downstream side. Thus impermeable layers at the stream side of
the trench;
The recommended numerical model can then be used to predict the impact of the trench on potential
contaminant migration; and
Although existing groundwater monitoring is sufficient as baseline, expansion/optimisation of the
groundwater monitoring network is recommended to form part of the mitigation and management of the
ash dump, to cover the outline of the proposed CADF area. This will be included in the monitoring
network and will be used as a warning system for contaminant migration.
7.0 CONCLUSIONS
The following groundwater conclusions are made from the available data for Kendal Power Station ash
disposal facilities:
The site are mainly underlain by sub–horizontal sediments of the Karoo Sequence comprising of shale,
carbonaceous shale, sandstone and coal layers of the Vryheid formation of the Ecca group;
The initial regional groundwater conceptual model identify three aquifer zones namely weathered,
fractured and deep fractured to fresh aquifer zones, but needs to be confirmed and updated, from future
test pumping and borehole logs;
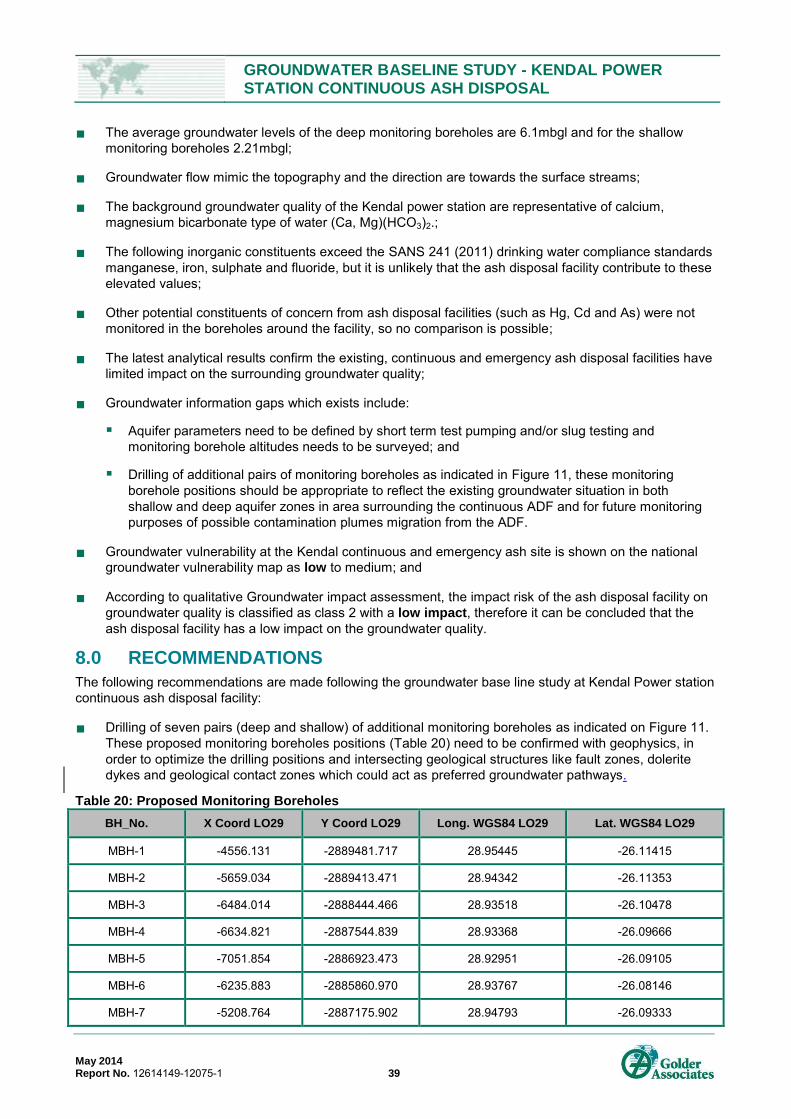
GROUNDWATER BASELINE STUDY - KENDAL POWER STATION CONTINUOUS ASH DISPOSAL
May 2014 Report No. 12614149-12075-1 39
The average groundwater levels of the deep monitoring boreholes are 6.1mbgl and for the shallow
monitoring boreholes 2.21mbgl;
Groundwater flow mimic the topography and the direction are towards the surface streams;
The background groundwater quality of the Kendal power station are representative of calcium,
magnesium bicarbonate type of water (Ca, Mg)(HCO3)2.;
The following inorganic constituents exceed the SANS 241 (2011) drinking water compliance standards
manganese, iron, sulphate and fluoride, but it is unlikely that the ash disposal facility contribute to these
elevated values;
Other potential constituents of concern from ash disposal facilities (such as Hg, Cd and As) were not
monitored in the boreholes around the facility, so no comparison is possible;
The latest analytical results confirm the existing, continuous and emergency ash disposal facilities have
limited impact on the surrounding groundwater quality;
Groundwater information gaps which exists include:
Aquifer parameters need to be defined by short term test pumping and/or slug testing and
monitoring borehole altitudes needs to be surveyed; and
Drilling of additional pairs of monitoring boreholes as indicated in Figure 11, these monitoring
borehole positions should be appropriate to reflect the existing groundwater situation in both
shallow and deep aquifer zones in area surrounding the continuous ADF and for future monitoring
purposes of possible contamination plumes migration from the ADF.
Groundwater vulnerability at the Kendal continuous and emergency ash site is shown on the national
groundwater vulnerability map as low to medium; and
According to qualitative Groundwater impact assessment, the impact risk of the ash disposal facility on
groundwater quality is classified as class 2 with a low impact, therefore it can be concluded that the
ash disposal facility has a low impact on the groundwater quality.
8.0 RECOMMENDATIONS
The following recommendations are made following the groundwater base line study at Kendal Power station
continuous ash disposal facility:
Drilling of seven pairs (deep and shallow) of additional monitoring boreholes as indicated on Figure 11.
These proposed monitoring boreholes positions (Table 20) need to be confirmed with geophysics, in
order to optimize the drilling positions and intersecting geological structures like fault zones, dolerite
dykes and geological contact zones which could act as preferred groundwater pathways.
Table 20: Proposed Monitoring Boreholes
BH_No. X Coord LO29 Y Coord LO29 Long. WGS84 LO29 Lat. WGS84 LO29
MBH-1 -4556.131 -2889481.717 28.95445 -26.11415
MBH-2 -5659.034 -2889413.471 28.94342 -26.11353
MBH-3 -6484.014 -2888444.466 28.93518 -26.10478
MBH-4 -6634.821 -2887544.839 28.93368 -26.09666
MBH-5 -7051.854 -2886923.473 28.92951 -26.09105
MBH-6 -6235.883 -2885860.970 28.93767 -26.08146
MBH-7 -5208.764 -2887175.902 28.94793 -26.09333

GROUNDWATER BASELINE STUDY - KENDAL POWER STATION CONTINUOUS ASH DISPOSAL
May 2014 Report No. 12614149-12075-1 40
The principle of the shallow and deep boreholes is to confirm the presence of a shallow (perched)
aquifer within the weathered zone, whereas the deep monitoring boreholes target the aquifer in the
fracture zones of the host formation. The shallow aquifer zone will be cased and sealed off in the
deeper boreholes to minimise the risk of cross contamination. The knowledge of the different aquifer
zones is essential to understand the possible contamination impacts on the different zones;
Proposed drilling depths of deep and shallow monitoring boreholes are 40 and 15m respectively;
The shallow monitoring boreholes must be drilled at 165mm diameter to a maximum depth of 15m and
cased with 127mm ID Upvc casing through the weathered formation;
The deep monitoring borehole must be drilled at 215mm diameter to maximum depth of 40m. 12 m
solid 165mm steel casing will be installed and grouted to seal off shallow aquifer system. The remaining
depth of the borehole will be constructed as open borehole;
These monitoring boreholes will provide:
Direct geological and hydrogeological control in areas without monitoring boreholes;
Aquifer testing facilities;
Serve as future monitoring and sampling points.
The newly-drilled monitoring boreholes should be incorporated into the existing monitoring programme.
The following monitoring tasks should be conducted to be consistent with the existing WUL (Licence
no.: 04/B20E/BCEGI/1048):
Monthly monitoring of groundwater levels and quality;
Purged groundwater sampling;
The analytical suite for groundwater samples should include determinants as listed in table below:
Table 21: Analytical Suite as per existing WUL
Variable Units
pH pH Units
Electrical Conductivity mS/m
Total Dissolved Solids(TDS) mg/l
Total Alkalinity mg/l
Major cations (Na, K, Mg, Ca) mg/l
Major anions (Cl, F, SO4) mg/l
Nitrate(NO3 as N) mg/l
Nitrite(NO2 as N) mg/l
Chemical Oxygen demand(COD) mg/l
Orthophosphate mg/l
Turbidity((as N.T.U) mg/l
Trace elements by ICP-OES scan including Fe, Mn, Al, Cu, B,Pb,Zn,Hg, Cd and As
mg/l
Total Chromium (as Cr) mg/l
Cyanides (as CN) mg/l
Silica (as SIO2) mg/l
Free and saline Ammonia NH3 (as N) mg/l
E.coli In cfu/100ml
GROUNDWATER BASELINE STUDY - KENDAL POWER STATION CONTINUOUS ASH DISPOSAL
May 2014 Report No. 12614149-12075-1 41
Proposed mitigation trench between the ash dump and the stream to the west thereof, should only be
implemented if contamination migration from the dumps to the stream is detected during monitoring.
9.0 REFERENCES
GHT Consulting Scientists (2012). Kendal Power Station, Routine Monitoring Phase 58, February 2012.
GHT Consulting Scientists Report No: RVN 601.11/1286.
GOLDER ASSOCIATES AFRICA (PTY) LTD.
Danie Brink Gerhard van der Linde
Hydrogeologist Senior Hydrogeologist/Divisional Leader
DB/GVDL/bk
Reg. No. 2002/007104/07
Directors: SAP Brown, L Greyling, RGM Heath
Golder, Golder Associates and the GA globe design are trademarks of Golder Associates Corporation.
https://afpws.golder.com/sites/p2614149specialiststudykendal/reports/12614149-12075-1/12614149-12075-1_gw_baseline_kendal_may_2014_rev_gvdl.docx
GROUNDWATER BASELINE STUDY - KENDAL POWER STATION CONTINUOUS ASH DISPOSAL
May 2014 Report No. 12614149-12075-1
APPENDIX A Analytical Result Certificates of Hydrocensus Boreholes

Golder Associates Africa (Pty) LtdHalfway House1685South AfricaRohann JordaanTel : +27 11 254 4800Fax : +27 11 315 0317E-Mail : [email protected]
FINAL CERTIFICATE OF ANALYSIS
Report Date 2013-03-05
Date Required 2013-02-25
Contract No
Order/Ref No 76380
12614149 301PT 000010 Kendel
NotesThe results relate specifically to the items tested.The report shall not be reproduced except in full, without the written approval of the laboratory.¹ SANAS accredited analysis included in the SANAS Schedule of Accredition for this laboratory.² Not SANAS accredited analysis and not included in the SANAS schedule of accreditation for this laboratory.³ Outsourced not performed by this laboratory.
Request ID: 7117 Sample ID: 330712 Received: 2013-02-15 Matrix: Water Page: 1 / 3Sample Number: KENDAL/1/13/02/2012/10:30 Revision Number: 0
Method: ¹UIS-EA-T001(pH) Completed: 2013-02-28
Parameter Value Unit Parameter Value Unit¹pH 5.42 ¹pH Temperature 21.9 Deg C
Method: ¹UIS-EA-T001(Electrical Conductivity) Completed: 2013-02-28
Parameter Value Unit Parameter Value Unit¹Total Conductivity 31.9 mS/m ¹TC Temperature 21.9 Deg C
Method: ²UIS-CP-T001(Calculated Total Dissolved Solids from EC) Completed: 2013-02-28
Parameter Value Unit Parameter Value Unit²TDS by EC * 6.5 207 mg/l ²TDS by EC * 7 223 mg/l
Method: ¹UIS-EA-T005(Total Dissolved Solids) Completed: 2013-02-28
Parameter Value Unit¹Total Dissolved Solids 236 mg/l
Method: ²UIS-CP-T003(Calculated Total Dissolved Solids by Summation) Completed: 2013-02-28
Parameter Value Unit²TDS by Summation 209 mg/l
Method: ¹UIS-EA-T001(P and Total (M) Alkalinity) Completed: 2013-02-28
Parameter Value Unit Parameter Value Unit¹P Alkalinity <0.6 mg/l CaCO3 ¹Total (M) Alkalinity 5.8 mg/l CaCO3
Method: ²UIS-TEA-T001(Disolved Cations in Water by ICP-OES) Completed: 2013-02-28
Parameter Value Unit Parameter Value Unit Parameter Value Unit²Ca 12.4 mg/l ²Fe <0.05 mg/l ²K 6.53 mg/l²Mg 13.9 mg/l ²Na 21.7 mg/l ²Si 7.69 mg/l
Method: ²UIS-EA-T008(Anions by Ion Chromatography) Completed: 2013-02-28
Parameter Value Unit Parameter Value Unit Parameter Value Unit¹F <0.1 mg/l ¹Cl 33.1 mg/l ¹NO2 <0.2 mg/l¹NO3 97.9 mg/l ¹NO3 as N 22.1 mg/l ²PO4 <0.8 mg/l¹SO4 12.2 mg/l
Method: ²UIS-CP-T002(Ion Balance Error) Completed: 2013-02-28
Parameter Value Unit Parameter Value Unit Parameter Value Unit²Sum of Cations 2.92 me/l ²Sum of Anions 3.41 me/l ²Ion Balance Error -7.8 %
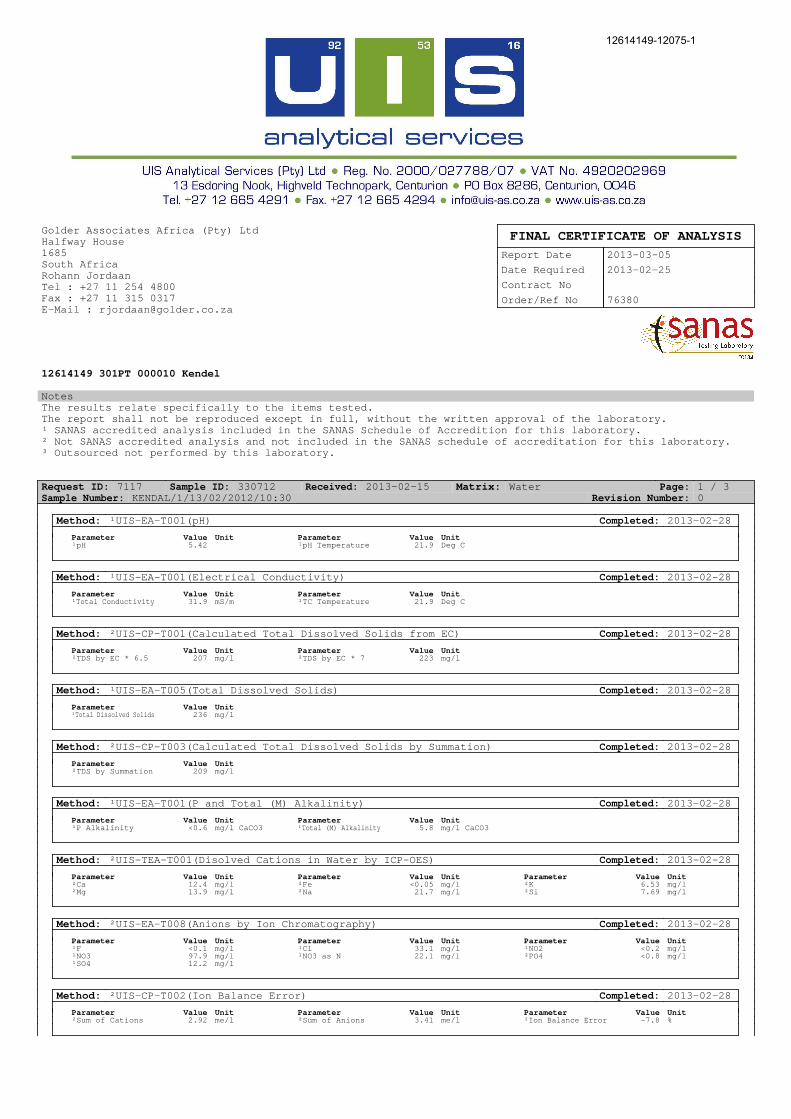
12614149-12075-1
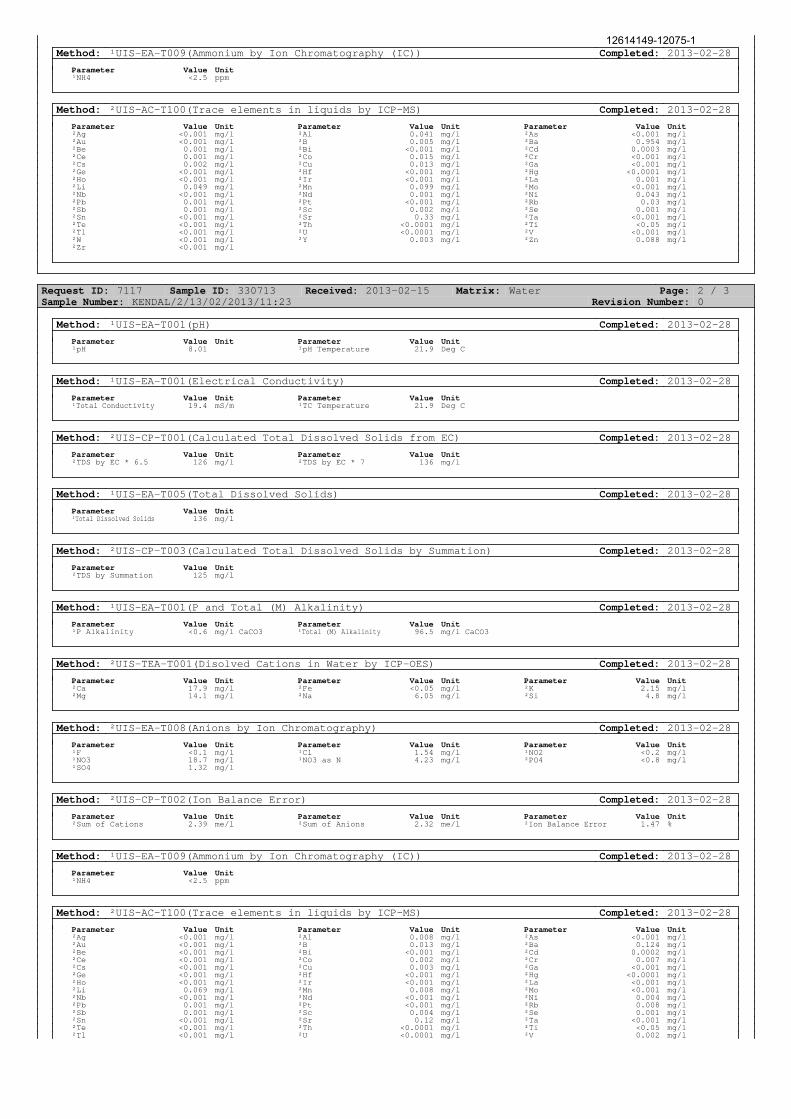
Method: ¹UIS-EA-T009(Ammonium by Ion Chromatography (IC)) Completed: 2013-02-28
Parameter Value Unit¹NH4 <2.5 ppm
Method: ²UIS-AC-T100(Trace elements in liquids by ICP-MS) Completed: 2013-02-28
Parameter Value Unit Parameter Value Unit Parameter Value Unit²Ag <0.001 mg/l ²Al 0.041 mg/l ²As <0.001 mg/l²Au <0.001 mg/l ²B 0.005 mg/l ²Ba 0.954 mg/l²Be 0.001 mg/l ²Bi <0.001 mg/l ²Cd 0.0003 mg/l²Ce 0.001 mg/l ²Co 0.015 mg/l ²Cr <0.001 mg/l²Cs 0.002 mg/l ²Cu 0.013 mg/l ²Ga <0.001 mg/l²Ge <0.001 mg/l ²Hf <0.001 mg/l ²Hg <0.0001 mg/l²Ho <0.001 mg/l ²Ir <0.001 mg/l ²La 0.001 mg/l²Li 0.049 mg/l ²Mn 0.099 mg/l ²Mo <0.001 mg/l²Nb <0.001 mg/l ²Nd 0.001 mg/l ²Ni 0.043 mg/l²Pb 0.001 mg/l ²Pt <0.001 mg/l ²Rb 0.03 mg/l²Sb 0.001 mg/l ²Sc 0.002 mg/l ²Se 0.001 mg/l²Sn <0.001 mg/l ²Sr 0.33 mg/l ²Ta <0.001 mg/l²Te <0.001 mg/l ²Th <0.0001 mg/l ²Ti <0.05 mg/l²Tl <0.001 mg/l ²U <0.0001 mg/l ²V <0.001 mg/l²W <0.001 mg/l ²Y 0.003 mg/l ²Zn 0.088 mg/l²Zr <0.001 mg/l
Request ID: 7117 Sample ID: 330713 Received: 2013-02-15 Matrix: Water Page: 2 / 3Sample Number: KENDAL/2/13/02/2013/11:23 Revision Number: 0
Method: ¹UIS-EA-T001(pH) Completed: 2013-02-28
Parameter Value Unit Parameter Value Unit¹pH 8.01 ¹pH Temperature 21.9 Deg C
Method: ¹UIS-EA-T001(Electrical Conductivity) Completed: 2013-02-28
Parameter Value Unit Parameter Value Unit¹Total Conductivity 19.4 mS/m ¹TC Temperature 21.9 Deg C
Method: ²UIS-CP-T001(Calculated Total Dissolved Solids from EC) Completed: 2013-02-28
Parameter Value Unit Parameter Value Unit²TDS by EC * 6.5 126 mg/l ²TDS by EC * 7 136 mg/l
Method: ¹UIS-EA-T005(Total Dissolved Solids) Completed: 2013-02-28
Parameter Value Unit¹Total Dissolved Solids 136 mg/l
Method: ²UIS-CP-T003(Calculated Total Dissolved Solids by Summation) Completed: 2013-02-28
Parameter Value Unit²TDS by Summation 125 mg/l
Method: ¹UIS-EA-T001(P and Total (M) Alkalinity) Completed: 2013-02-28
Parameter Value Unit Parameter Value Unit¹P Alkalinity <0.6 mg/l CaCO3 ¹Total (M) Alkalinity 96.5 mg/l CaCO3
Method: ²UIS-TEA-T001(Disolved Cations in Water by ICP-OES) Completed: 2013-02-28
Parameter Value Unit Parameter Value Unit Parameter Value Unit²Ca 17.9 mg/l ²Fe <0.05 mg/l ²K 2.15 mg/l²Mg 14.1 mg/l ²Na 6.05 mg/l ²Si 4.8 mg/l
Method: ²UIS-EA-T008(Anions by Ion Chromatography) Completed: 2013-02-28
Parameter Value Unit Parameter Value Unit Parameter Value Unit¹F <0.1 mg/l ¹Cl 1.54 mg/l ¹NO2 <0.2 mg/l¹NO3 18.7 mg/l ¹NO3 as N 4.23 mg/l ²PO4 <0.8 mg/l¹SO4 1.32 mg/l
Method: ²UIS-CP-T002(Ion Balance Error) Completed: 2013-02-28
Parameter Value Unit Parameter Value Unit Parameter Value Unit²Sum of Cations 2.39 me/l ²Sum of Anions 2.32 me/l ²Ion Balance Error 1.47 %
Method: ¹UIS-EA-T009(Ammonium by Ion Chromatography (IC)) Completed: 2013-02-28
Parameter Value Unit¹NH4 <2.5 ppm
Method: ²UIS-AC-T100(Trace elements in liquids by ICP-MS) Completed: 2013-02-28
Parameter Value Unit Parameter Value Unit Parameter Value Unit²Ag <0.001 mg/l ²Al 0.008 mg/l ²As <0.001 mg/l²Au <0.001 mg/l ²B 0.013 mg/l ²Ba 0.124 mg/l²Be <0.001 mg/l ²Bi <0.001 mg/l ²Cd 0.0002 mg/l²Ce <0.001 mg/l ²Co 0.002 mg/l ²Cr 0.007 mg/l²Cs <0.001 mg/l ²Cu 0.003 mg/l ²Ga <0.001 mg/l²Ge <0.001 mg/l ²Hf <0.001 mg/l ²Hg <0.0001 mg/l²Ho <0.001 mg/l ²Ir <0.001 mg/l ²La <0.001 mg/l²Li 0.069 mg/l ²Mn 0.008 mg/l ²Mo <0.001 mg/l²Nb <0.001 mg/l ²Nd <0.001 mg/l ²Ni 0.004 mg/l²Pb 0.001 mg/l ²Pt <0.001 mg/l ²Rb 0.008 mg/l²Sb 0.001 mg/l ²Sc 0.004 mg/l ²Se 0.001 mg/l²Sn <0.001 mg/l ²Sr 0.12 mg/l ²Ta <0.001 mg/l²Te <0.001 mg/l ²Th <0.0001 mg/l ²Ti <0.05 mg/l²Tl <0.001 mg/l ²U <0.0001 mg/l ²V 0.002 mg/l
12614149-12075-1

²W <0.001 mg/l ²Y <0.001 mg/l ²Zn 0.072 mg/l²Zr <0.001 mg/l
AUTHORISED SIGNATORY
12614149-12075-1
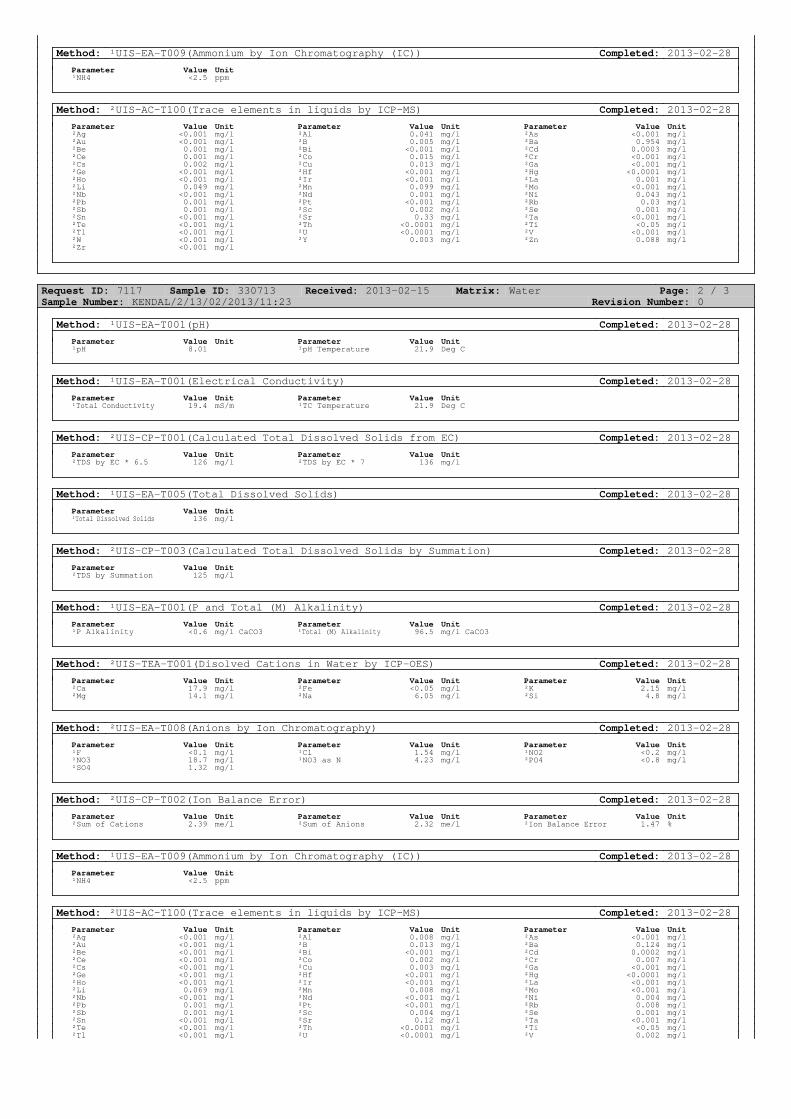
Method: ¹UIS-EA-T009(Ammonium by Ion Chromatography (IC)) Completed: 2013-02-28
Parameter Value Unit¹NH4 <2.5 ppm
Method: ²UIS-AC-T100(Trace elements in liquids by ICP-MS) Completed: 2013-02-28
Parameter Value Unit Parameter Value Unit Parameter Value Unit²Ag <0.001 mg/l ²Al 0.041 mg/l ²As <0.001 mg/l²Au <0.001 mg/l ²B 0.005 mg/l ²Ba 0.954 mg/l²Be 0.001 mg/l ²Bi <0.001 mg/l ²Cd 0.0003 mg/l²Ce 0.001 mg/l ²Co 0.015 mg/l ²Cr <0.001 mg/l²Cs 0.002 mg/l ²Cu 0.013 mg/l ²Ga <0.001 mg/l²Ge <0.001 mg/l ²Hf <0.001 mg/l ²Hg <0.0001 mg/l²Ho <0.001 mg/l ²Ir <0.001 mg/l ²La 0.001 mg/l²Li 0.049 mg/l ²Mn 0.099 mg/l ²Mo <0.001 mg/l²Nb <0.001 mg/l ²Nd 0.001 mg/l ²Ni 0.043 mg/l²Pb 0.001 mg/l ²Pt <0.001 mg/l ²Rb 0.03 mg/l²Sb 0.001 mg/l ²Sc 0.002 mg/l ²Se 0.001 mg/l²Sn <0.001 mg/l ²Sr 0.33 mg/l ²Ta <0.001 mg/l²Te <0.001 mg/l ²Th <0.0001 mg/l ²Ti <0.05 mg/l²Tl <0.001 mg/l ²U <0.0001 mg/l ²V <0.001 mg/l²W <0.001 mg/l ²Y 0.003 mg/l ²Zn 0.088 mg/l²Zr <0.001 mg/l
Request ID: 7117 Sample ID: 330713 Received: 2013-02-15 Matrix: Water Page: 2 / 3Sample Number: KENDAL/2/13/02/2013/11:23 Revision Number: 0
Method: ¹UIS-EA-T001(pH) Completed: 2013-02-28
Parameter Value Unit Parameter Value Unit¹pH 8.01 ¹pH Temperature 21.9 Deg C
Method: ¹UIS-EA-T001(Electrical Conductivity) Completed: 2013-02-28
Parameter Value Unit Parameter Value Unit¹Total Conductivity 19.4 mS/m ¹TC Temperature 21.9 Deg C
Method: ²UIS-CP-T001(Calculated Total Dissolved Solids from EC) Completed: 2013-02-28
Parameter Value Unit Parameter Value Unit²TDS by EC * 6.5 126 mg/l ²TDS by EC * 7 136 mg/l
Method: ¹UIS-EA-T005(Total Dissolved Solids) Completed: 2013-02-28
Parameter Value Unit¹Total Dissolved Solids 136 mg/l
Method: ²UIS-CP-T003(Calculated Total Dissolved Solids by Summation) Completed: 2013-02-28
Parameter Value Unit²TDS by Summation 125 mg/l
Method: ¹UIS-EA-T001(P and Total (M) Alkalinity) Completed: 2013-02-28
Parameter Value Unit Parameter Value Unit¹P Alkalinity <0.6 mg/l CaCO3 ¹Total (M) Alkalinity 96.5 mg/l CaCO3
Method: ²UIS-TEA-T001(Disolved Cations in Water by ICP-OES) Completed: 2013-02-28
Parameter Value Unit Parameter Value Unit Parameter Value Unit²Ca 17.9 mg/l ²Fe <0.05 mg/l ²K 2.15 mg/l²Mg 14.1 mg/l ²Na 6.05 mg/l ²Si 4.8 mg/l
Method: ²UIS-EA-T008(Anions by Ion Chromatography) Completed: 2013-02-28
Parameter Value Unit Parameter Value Unit Parameter Value Unit¹F <0.1 mg/l ¹Cl 1.54 mg/l ¹NO2 <0.2 mg/l¹NO3 18.7 mg/l ¹NO3 as N 4.23 mg/l ²PO4 <0.8 mg/l¹SO4 1.32 mg/l
Method: ²UIS-CP-T002(Ion Balance Error) Completed: 2013-02-28
Parameter Value Unit Parameter Value Unit Parameter Value Unit²Sum of Cations 2.39 me/l ²Sum of Anions 2.32 me/l ²Ion Balance Error 1.47 %
Method: ¹UIS-EA-T009(Ammonium by Ion Chromatography (IC)) Completed: 2013-02-28
Parameter Value Unit¹NH4 <2.5 ppm
Method: ²UIS-AC-T100(Trace elements in liquids by ICP-MS) Completed: 2013-02-28
Parameter Value Unit Parameter Value Unit Parameter Value Unit²Ag <0.001 mg/l ²Al 0.008 mg/l ²As <0.001 mg/l²Au <0.001 mg/l ²B 0.013 mg/l ²Ba 0.124 mg/l²Be <0.001 mg/l ²Bi <0.001 mg/l ²Cd 0.0002 mg/l²Ce <0.001 mg/l ²Co 0.002 mg/l ²Cr 0.007 mg/l²Cs <0.001 mg/l ²Cu 0.003 mg/l ²Ga <0.001 mg/l²Ge <0.001 mg/l ²Hf <0.001 mg/l ²Hg <0.0001 mg/l²Ho <0.001 mg/l ²Ir <0.001 mg/l ²La <0.001 mg/l²Li 0.069 mg/l ²Mn 0.008 mg/l ²Mo <0.001 mg/l²Nb <0.001 mg/l ²Nd <0.001 mg/l ²Ni 0.004 mg/l²Pb 0.001 mg/l ²Pt <0.001 mg/l ²Rb 0.008 mg/l²Sb 0.001 mg/l ²Sc 0.004 mg/l ²Se 0.001 mg/l²Sn <0.001 mg/l ²Sr 0.12 mg/l ²Ta <0.001 mg/l²Te <0.001 mg/l ²Th <0.0001 mg/l ²Ti <0.05 mg/l²Tl <0.001 mg/l ²U <0.0001 mg/l ²V 0.002 mg/l

²W <0.001 mg/l ²Y <0.001 mg/l ²Zn 0.072 mg/l²Zr <0.001 mg/l
AUTHORISED SIGNATORY
GROUNDWATER BASELINE STUDY - KENDAL POWER STATION CONTINUOUS ASH DISPOSAL
May 2014 Report No. 12614149-12075-1
APPENDIX B Document Limitations
GROUNDWATER BASELINE STUDY - KENDAL POWER STATION CONTINUOUS ASH DISPOSAL
May 2014 Report No. 12614149-12075-1
DOCUMENT LIMITATIONS
This Document has been provided by Golder Associates Africa Pty Ltd (“Golder”) subject to the following
limitations:
v) This Document has been prepared for the particular purpose outlined in Golder’s proposal and no
responsibility is accepted for the use of this Document, in whole or in part, in other contexts or for any
other purpose.
vi) The scope and the period of Golder’s Services are as described in Golder’s proposal, and are subject to
restrictions and limitations. Golder did not perform a complete assessment of all possible conditions or
circumstances that may exist at the site referenced in the Document. If a service is not expressly
indicated, do not assume it has been provided. If a matter is not addressed, do not assume that any
determination has been made by Golder in regards to it.
vii) Conditions may exist which were undetectable given the limited nature of the enquiry Golder was
retained to undertake with respect to the site. Variations in conditions may occur between investigatory
locations, and there may be special conditions pertaining to the site which have not been revealed by
the investigation and which have not therefore been taken into account in the Document. Accordingly,
additional studies and actions may be required.
viii) In addition, it is recognised that the passage of time affects the information and assessment provided in
this Document. Golder’s opinions are based upon information that existed at the time of the production
of the Document. It is understood that the Services provided allowed Golder to form no more than an
opinion of the actual conditions of the site at the time the site was visited and cannot be used to assess
the effect of any subsequent changes in the quality of the site, or its surroundings, or any laws or
regulations.
ix) Any assessments made in this Document are based on the conditions indicated from published sources
and the investigation described. No warranty is included, either express or implied, that the actual
conditions will conform exactly to the assessments contained in this Document.
x) Where data supplied by the client or other external sources, including previous site investigation data,
have been used, it has been assumed that the information is correct unless otherwise stated. No
responsibility is accepted by Golder for incomplete or inaccurate data supplied by others.
xi) The Client acknowledges that Golder may have retained sub-consultants affiliated with Golder to
provide Services for the benefit of Golder. Golder will be fully responsible to the Client for the Services
and work done by all of its sub-consultants and subcontractors. The Client agrees that it will only assert
claims against and seek to recover losses, damages or other liabilities from Golder and not Golder’s
affiliated companies. To the maximum extent allowed by law, the Client acknowledges and agrees it will
not have any legal recourse, and waives any expense, loss, claim, demand, or cause of action, against
Golder’s affiliated companies, and their employees, officers and directors.
xii) This Document is provided for sole use by the Client and is confidential to it and its professional
advisers. No responsibility whatsoever for the contents of this Document will be accepted to any person
other than the Client. Any use which a third party makes of this Document, or any reliance on or
decisions to be made based on it, is the responsibility of such third parties. Golder accepts no
responsibility for damages, if any, suffered by any third party as a result of decisions made or actions
based on this Document.
GOLDER ASSOCIATES AFRICA (PTY) LTD

Golder Associates Africa (Pty) Ltd.
P.O. Box 13776
Hatfield, 0028
Ditsela Place
1204 Park Street
Hatfield
Pretoria, 0083
South Africa
T: [+27] (12) 364 4000
Caption Text