Groundwater Availability Model (GAM) for the Yegua-Jackson … · 2011-10-26 · Groundwater...
61
Groundwater Availability Model (GAM) for the Yegua-Jackson Aquifer Stakeholder Advisory Forum (SAF#1) College Station, Texas June 24 h , 2008 Cindy Ridgeway Van Kelley and Neil Deeds
Transcript of Groundwater Availability Model (GAM) for the Yegua-Jackson … · 2011-10-26 · Groundwater...
Groundwater Availability Model (GAM) for the
Yegua-Jackson Aquifer
Stakeholder Advisory Forum (SAF#1)College Station, Texas
June 24h, 2008
Cindy RidgewayVan Kelley and Neil Deeds
Outline• General Introduction to the GAM program• Introduction to the Yegua-Jackson GAM team• Yegua-Jackson regional overview• Basics of groundwater flow• Overview of Yegua-Jackson Aquifer• Numerical groundwater modeling and the GAMs• Data collection• GAM schedule
PEC OS
WEBB
BR EWSTER
H U D SPET H
PR ESIDIO
R EEVES
C ULBER SON
VAL VER D E
D UVAL
TER R ELL
C R OC KETT
KEN EDY
FR IO
H AR RIS
HI LL
BELL
BEE
C LAY
POLK
ED WARD S
J EFF D AVIS
KER R
GAIN ES
LEON
U VALD E
H ALE
D ALLAM
IR ION
D IMMIT
LAMB
KIN G
BEXARKIN N EY
STAR R
H ALL
W ISEJ AC K
U PTON
H ID ALGO
SU TTON
C ASS
OLD HAM
ELLIS
MED IN A
KIMBLE
Z AVALA
KEN T
R USK
LEE
LYN N
GR AY
COKE
L A SALLE
MILAM
ER ATH
H AR TLEY
H UN T
BR AZO R IA
SMITH
KN OX
FLOYD
LLAN O
A N D R EWS
TYLER
TR AVISLIBER TY
J ONES
NU EC ES
R EA GAN
BOWIE
WAR D
ZAPATA
LAMAR
R EAL
N OLAN
TERR Y GAR ZA
MILLS
COLEMAN
EC TOR
TOM GR EEN
MASON
YOU N G
FALLS
C AMERON
MAT AGORD A
HAY S
BR OWN
C OOKE
JASPER
D EAF SMITH
BU R N ET
M AVERICK
HOU STON
LAVAC A
FISH ER
C OLLIN
MOOR E
FAN NIN
M OTLEY
MAR TIN
L IVE OAK
D ALLAS
EL PASO
BAILEY
B OSQU E
H AR D IN
KLEBER G
JIM HOGG
TAYLOR
C OT TLE
POTTER
DON LEY
GOLIAD
SAN SABA
ATASC OSA
D EN TON
C OR YELLC R AN E
C ONC H O
BAYLOR
D E WITT
BR OOKS
PAR KER
R U N N ELS
N AVAR RO
AR CH ER
C ARSON
C ASTR O
WOOD
SCU R R Y
CR OSBY
FAYETTE
McMU LL EN
W H AR TON
BOR D EN
CALHOU N
SH ELBY
MEN ARD
GILLESPIE
PAR MER
WILSON
D IC KEN S
SC H LEIC H ER
GR IMES
F OARD
PA NOLA
H ASKELL
BR ISC OE
RAN D ALL
D AW SON
MID LAN D
HOWAR D
Mc LEN N AN
GON ZA LES
GR AYSON R ED R IVER
SWISH ER
R OBER TS
HOC KLE Y
AN D ERSON
TAR R ANT
WALKER
L U BBOCK
VIC TOR IA
BASTR OP J EFFER SON
SH ER MAN
WH EELER
MITC H ELL
YOAKUM
STER LIN GWINKL ER
TR IN ITY
H EMPHILL
WILBA R-GER
C OMAN -C HE
WA
L LER
KAR N ES
LIPSC OMB
JAC KSON
W ILLIAMSON
R EFU G IO
WILLAC Y
LOVIN G
AU STIN
EASTLAN D
H OPKIN S
Mc C ULL OC H
BLAN C O
HAR R ISONSTEPH EN S
AN GELIN A
C ALLAH AN
C OLOR AD O
H AN SFOR D
K AU FMAN
BAN D ER A
PALO PINTO
MON T AGUE
H AMILTO N
OC H ILTR EE
C OM AL
LIMEST ON ESABINE
C OC H R AN
FORT BEN D
C H AMBER S
VAN ZAN D T
WIC H ITA
J OH N SON
STON EWALL
H EN DER SON
TITU S
FR EESTONE
MONTG OMER Y
H OOD
KEND ALL
BR AZ OS
GALVESTON
U P SH U R
H U TC H IN SON
LAMPAS AS
BU R LESON
H AR D EMAN
GU AD ALU PE
CH ILD-RE SS
ARM-STR ON G
GLAS S-C OCK
N AC OG-D OC HES
MAR ION
C ALD WELL
MAD ISON
ORAN GE
D ELTA
R AIN S
GRE GG
C AMP
MO
RR
IS
FR
AN
KLIN
ROCK-W ALL
C OLLINGS-WORTH
THR OC K-MORTON
S OM E R-V EL
SANAUGUS -
TI NE
S ANJAC IN TO
J IMWELLS
S HA CK EL-FOR D
C HERO-KE E
NEW
T ON
ROBE RT-SON
WA SH IN G-TON
AR A N-SA SS AN
P ATR IC IO
80
79
67
78
85
82
6876
6 9
81
75
77
87
71
72
73
74
84
86
83
46
47
66
53
45
54
56
50
65
38
64
41
51
16
59
42
49
39
63
48
40
61 57
44
37 55
58
62
43
60
52
36
70
29
6
14
17
35
15
9
25
3328
8
7
1 2
3
34
526
32
30
23
21 10
11
27
20
18
22
19
24
13
2
31
4
1
PEC OS
WEBB
BR EWST ER
HUDSPETH
PR ESIDIO
REEVES
CULBERSON
VAL VERDE
DUVAL
TERR ELL
CROC KETT
FRI O
HARRIS
HILL
BELL
BEE
KEN EDY
CLAY
POLK
ED WARDS
JEFF D AVIS
GAINES
LEON
KERR
UVALDE
HALE
DALLAM
KING
IRION
LAMB
DIMMI T
BEXARKINNEY
STARR
HALL
JACK
CASS
WISE
SU TTON
OLD HAM
HIDALGO
ELLIS
UPTON
ZAVAL A
MEDI NA
KIMBLE
RUSK
LEE
LYNN KEN T
GRAY
LA SAL LE
COKE
MILAM
ERATH
HARTLEY
HUNT
SMITH
KN OX
FLOYD
LLAN O
TYLER
BR AZORIA
AN DREWS
TRAVIS LIBERTY
REAGAN
JONES
ZAPAT A
LAMAR
BOWI E
NUECES
WARD
REAL
NOLAN
TERR Y GARZA
COLEMAN
MIL LS
EC TOR
YOUNG
TOM GREEN
MASON
FALLS
MAVERIC K
BU RNET
HAYS
DEAF SMIT H
JASPER
LAVACA
HOUSTON
COOKE
FISH ER
BR OWN
COL LIN
MOORE
MOTL EY
FANN IN
MARTIN
EL PASO
BAILEY
DALLAS
LIVE OAK
BOSQU E
HARDIN
JIM HOGG
TAYLOR
CAMERON
POTTER
GOLIAD
CRANE
COTTLE
DONLEY
ATASCOSA
SAN SABA
DENTON
CORYELL
BAYLOR
CONC HO
BR OOKS
RUNNELS
PAR KER
NAVARRO
AR CHER
DE WI TT
CARSON
SC URRY
MATAGORDA
CROSBY
KL EBERG
FAYETTE
SH ELBY
WOOD
CASTR O
BORDEN
MENARD
WHARTON
NEWTON
PAR MER
GILLESPIE
MCMULLEN
DICKENS
SC HLEI CHER
FOARD
HASKELL
PAN OLA
GRIMES
MID LAND
WILSON
RANDALL
BR ISCOESWISHER
DAWSON
GRAYSON
GON ZALES
HOWARD
RED RIVER
ROBERTS
HOCKLEY
TARR ANT
AN DERSON
MCLENNAN
LUBBOCK
CALHOUN
CHEROKEE
VI CTORIA
BASTROP
WALKER
SH ERMAN
YOAKUM
MIT CH ELL
STERLING
HEMPHILL
WHEELER
KAR NES
TRINITY
WINKLER
JACKSON
LIPSCOMB
LOVING
WILLIAMSON
AU STIN
EASTLAN D
REFU GIO
HOPKIN S
HARRISON
BLANCO
CALLAHAN
COLORADO
AN GELINA
MCC ULLOCH
STEPHENS
WILLACY
JEFFERSON
KAU FMAN
BAN DERA
HANSFORD
COMANCHE
MONTAGUE
PALO PINTO
JIM WELLS
LIMESTONE
COMAL
HAMILTON
OCHILTREE
WIL BARGER
SABI NE
COCH RAN
CHAMBER S
FORT BEND
VAN ZANDT
HENDERSON
STONEWALL
JOHN SON
FREESTON E
MONTGOMERY
GLASSCOCK
KEN DALL
TITUS
BR AZOS
HOOD
WICH ITA
AR MSTRONG
UPSHUR
ROBERTSON
HUTCHINSON
LAMPASAS
CHILDRESS
WA
LLER
NACOGDOC HES
SH ACKELFOR D
BU RLESON
HARDEMAN
GUADALUPE
GALVEST ON
MARION
THR OCKMOR TON
COLLIN GSWORTH
MADISON
CALDW ELL
SAN PATR ICIO
SAN JACI NTO
ARANSAS
WASHIN GTON ORANGE
DELTA
RAINS
GREGG
SA N A UG
UST IN
E
CAMP
MOR
RIS
FRAN
KLIN
SOMER-VELL
ROCK-WALL
Region F Brazos G
Panhandle
Far West Texas
Region C
East Texas
Region H
Llano Estacado
Plateau
Rio Grande
South Central Texas
Region B
Coastal Bend
Lower Colorado
North East Texas
Lavaca
P
D
K
N
B
M
L
J
O
H
I
C
E
A
GF
Groundwater Availability Modeling
Texas Water Development Board
Cindy Ridgeway
Contract Manager
Yegua-Jackson Aquifer “GAM”
• Purpose: to develop tools that can be used to help GCDs, RWPGs, and others understand and manage their groundwater resources.
• Public process: you get to see how the model is put together.
• Freely available: models are standardized, thoroughly documented. Reports available over the internet.
• Living tools: periodically updated.
What is the gamprogram?
• GCDs, RWPGs, TWDB, and others collect new information on aquifer.
• TWDB plans to update GAMs every five years with new information.
• Please share information and ideas with TWDB on aquifers and GAMs.
Livingtools
• The model– predict water levels and flows in response to
pumping and drought– effects of well fields
• Data in the model– water in storage– recharge estimates– hydraulic properties
• GMAs, GCDs and RWPGs can request runs
How do weuse GAM?
• Water Code & TWDB rules require that GCDs use GAM information, if available, for their management plans.
• TWDB rules require that RWPGs use managed available groundwater estimates, if developed in time for the planning cycle
Do we haveto use GAM?
• Managed available groundwater (MAG)…the amount of groundwater available for use.
• The State does not directly decide how much groundwater is available for use: GCDs will through GMA process.
• A GAM is a tool that can be used to assess groundwater availability once GCDs and GMAs decide on the desired future condition of the aquifer.
What isGroundwater
Availability or MAG?

• Stakeholder Advisory Forums (SAF)– hear about progress on the model– comment on model assumptions– offer information (timing is important!)
• Report review– at end of project
• Contact TWDB– contract manager
Participating inthe GAM process
Comments:Cindy Ridgeway
[email protected](512)936-2386
Texas Water Development Board1700 North Congress Avenue
P.O. Box 13231Austin, Texas 78711-3231
Web information:www.twdb.state.tx.us/gam
Outline
• General Introduction to the GAM program• Introduction to the Yegua-Jackson GAM team• Yegua-Jackson regional overview• Basics of groundwater flow• Overview of Yegua-Jackson Aquifer• Numerical groundwater modeling and the GAMs• Data collection
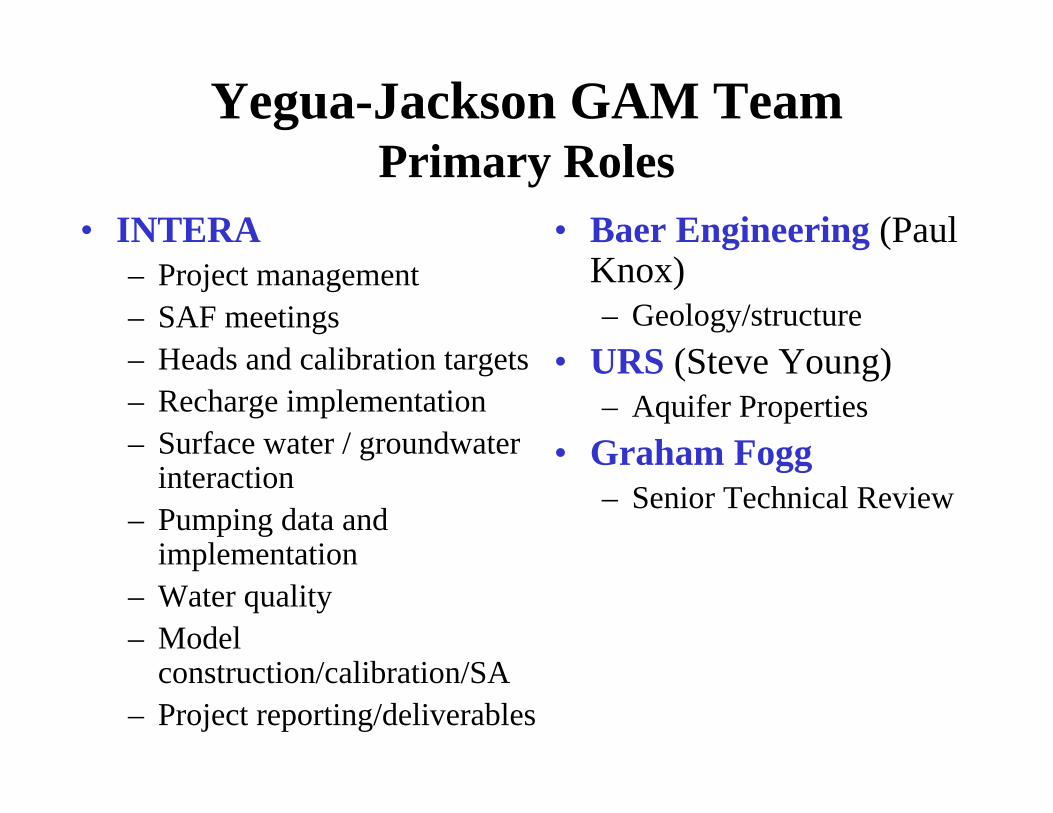
Yegua-Jackson GAM Team Primary Roles
• INTERA– Project management– SAF meetings– Heads and calibration targets– Recharge implementation– Surface water / groundwater
interaction– Pumping data and
implementation– Water quality– Model
construction/calibration/SA– Project reporting/deliverables
• Baer Engineering (Paul Knox)– Geology/structure
• URS (Steve Young)– Aquifer Properties
• Graham Fogg– Senior Technical Review
Outline• General Introduction to the GAM program• Introduction to the Yegua-Jackson GAM team• Yegua-Jackson regional overview• Basics of groundwater flow• Overview of Yegua-Jackson Aquifer• Numerical groundwater modeling and the GAMs• Data collection• GAM schedule
Webb Duval
Harris
Frio
Kenedy
Polk
Starr
Bee
Leon
Hidalgo
Tyler
Brazoria
La Salle
Liberty
Milam
Lee
Nueces
Zapata
Matagorda
Houston
Jasper
Kleberg
Cameron
Hardin
Brooks
Lavaca
Atascosa
Goliad
Wharton
Fayette
De Witt
Calhoun
Newton
Live Oak
Jefferson
Wilson
Jim Hogg
Victoria
McMullen
Tr inity
Walker
Bastrop
Gonzales
Grimes
Willacy
Colorado
Karnes
Refugio
Austin
Jackson
Angelina
Jim Wells
Fort BendGalveston
Montgomery
Brazos
Chambers
Robertson
Waller
Sabine
Burleson
Guadalupe
Caldwell
AransasSan Patricio
Madison
San Jacinto
Washington Orange
Nacogdoches
Dimmit
San Augustine
Cherokee
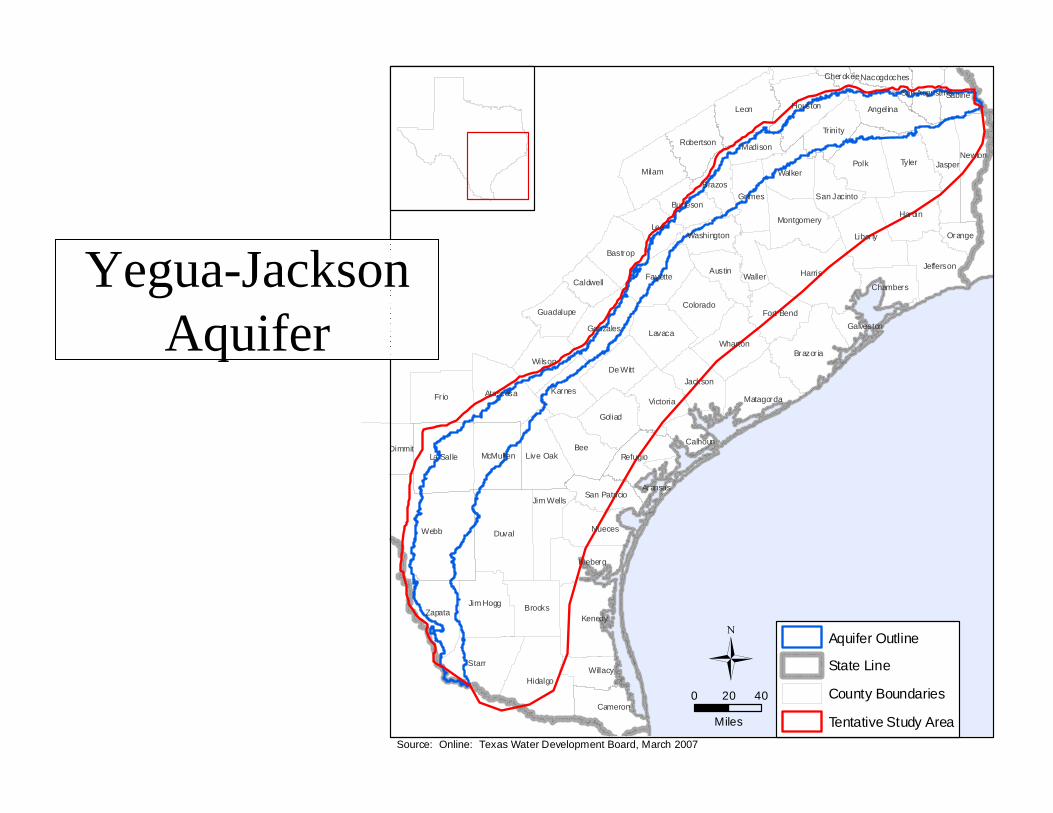
Aquifer Outline
State Line
County Boundaries
Tentative Study Area Source: Online: Texas Water Development Board, March 2007
−0 20 40
Miles
Yegua-Jackson Aquifer

14
16
15
13
12
11
8
State Line
County Boundaries
GMAs8
10
11
12
13
14
15
16 Source: Online: Texas Water Development Board, March 2007
0 20 40
Miles
10GMAs

Source: Online: Texas Water Development Board, March 2007
0 20 40
Miles
Barton Springs/Edwards Aquifer CDBee GCDBluebonnet GCDBrazoria County GCDBrazos Valley GCDClearwater UWCDCoastal Bend GCDCoastal Plains GCDColorado County GCDCorpus Christi ASRCDEdwards Aquifer AuthorityEvergreen UWCDFayette County GCDFort Bend Subsidence DistrictGuadalupe County GCDGonzales County UWCDHarris-Galveston Coastal Subsidence DistrictNeches & Trinity Valleys GCDPost Oak Savannah GCDSan Patricio County GCD
Goliad County GCDKenedy County GCDLive Oak UWCDLone Star GCDLost Pines GCDLower Trinity GCDMcMullen GCDMedina County GCDMid-East Texas GCDPecan Valley GCDPineywoods GCDPlum Creek CDRed Sands GCDRefugio GCDRusk County GCDSoutheast Texas GCDStarr County GCDTexana GCDVictoria County GCDWintergarden GCD
GCDs

Nueces
Brazos
NechesTrinity
San Jacinto
Lavaca
Nueces-Rio Grande
Guadalupe
Rio Grande
Sabine
Colorado
San Antonio
San Antonio-Nueces
Neches-Trinity
Brazos-Colorado
San Jacinto-Brazos
Colorado-Lavaca
Lavaca-Guadalupe
State Line
County Boundaries Source: Online: Texas Water Development Board, March 2007
0 20 40
Miles
River Basins

Study Area
State Line
County Boundaries
RWPGsRegionName
Brazos G
Coastal Bend
East Texas
Lavaca
Lower Colorado
Region C
Region H
Rio Grande
South Central Texas Source: Online: Texas Water Development Board, March 2007
−0 20 40
Miles
RWPGs
State Line
County Boundaries Source: Online: Texas Water Development Board, March 2007
−0 20 40
Miles
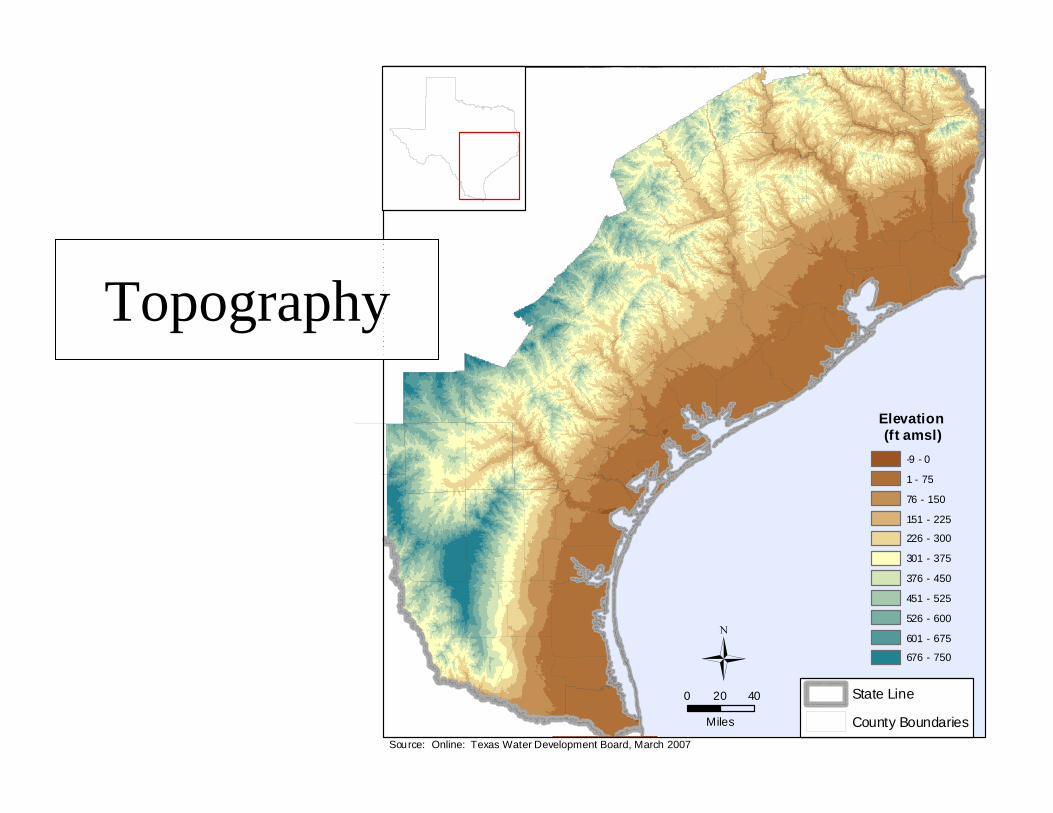
Elevation (ft amsl)
-9 - 0
1 - 75
76 - 150
151 - 225
226 - 300
301 - 375
376 - 450
451 - 525
526 - 600
601 - 675
676 - 750
Topography
State Line
County Boundaries
Study Area Source: Online: Texas Water Development Board, March 2007
0 20 40
Miles
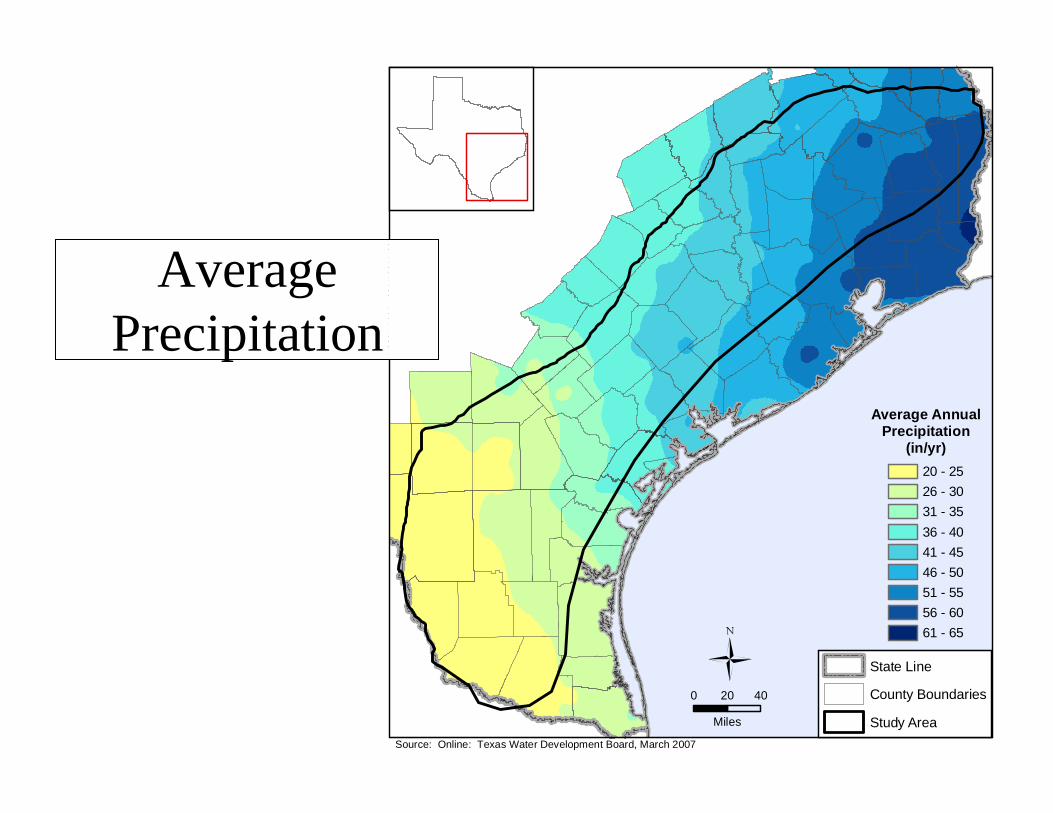
Average AnnualPrecipitation
(in/yr)20 - 2526 - 3031 - 3536 - 4041 - 4546 - 5051 - 5556 - 6061 - 65
AveragePrecipitation

Study Area
State Line
County Boundaries Source: Online: Texas Water Development Board, March 2007
0 20 40
Miles
Average AnnualTemperature
(oF)68
70
72
74
76
AverageTemperature
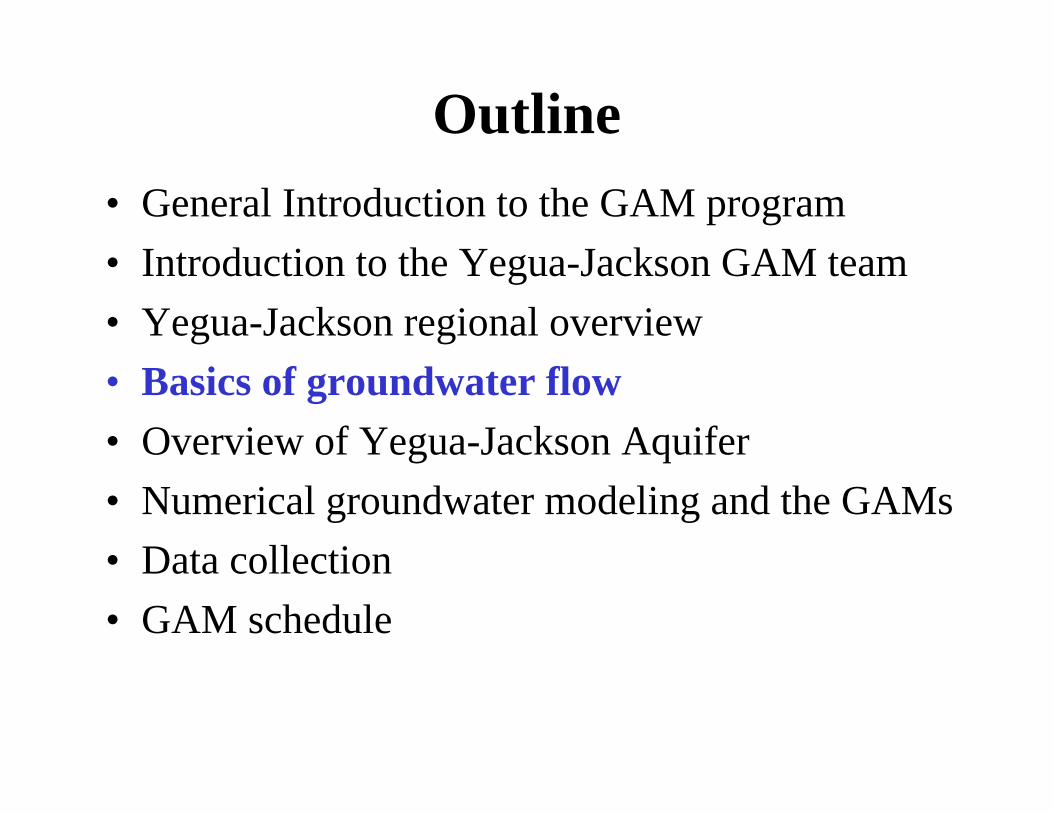
Outline• General Introduction to the GAM program• Introduction to the Yegua-Jackson GAM team• Yegua-Jackson regional overview• Basics of groundwater flow• Overview of Yegua-Jackson Aquifer• Numerical groundwater modeling and the GAMs• Data collection• GAM schedule

Groundwater Flow - Definitions• Aquifer – Water saturated permeable geologic
unit that can transmit significant quantities of water (e.g., sands & gravels).– Unconfined – water table forms the upper boundary– Confined – has overlying/underlying lower
permeabilty layers• Water table – The top of the saturated zone.• Hydraulic head – The water level in a well
expressed as an elevation.
Groundwater Flow – Definitions (cont’d)
• Hydraulic conductivity (permeability) – A physical property of the geologic media representing its ability to transmit water.
• Specific yield – The volume of water that an unconfined aquifer releases from storage per unit surface area of aquifer per unit decline in water table elevation.
• Storativity – The volume of water that a confined aquifer releases from storage per unit surface area of aquifer per unit decline in head.
Groundwater Flow – Definitions (cont’d)
• Recharge – The entry of water to the saturated zone at the water table:
Recharge = (precipitation + stream loss) minus (runoff + evapotranspiration).
• Cross-formational flow – Groundwater flow between separate geologic formations.
• Stream losses or gains – The water that is either lost or gained through the base of the stream or river.
Basic Principles of GW Flow• The primary observable quantity describing
groundwater flow is the water level as measured in a well.
• The water level expressed as elevation is termed the hydraulic head.
• The difference in hydraulic head between adjacent wells determines the direction of GW flow (from higher heads towards lower heads).
• The water table is typically a subdued replica of the topography.
Basic Principles of GW Flow (cont’d)
• The thickness and hydraulic conductivity of the aquifer material define volumetric flow rates (e.g., for pumping)– The larger the hydraulic conductivity and
thickness, the greater the flow.
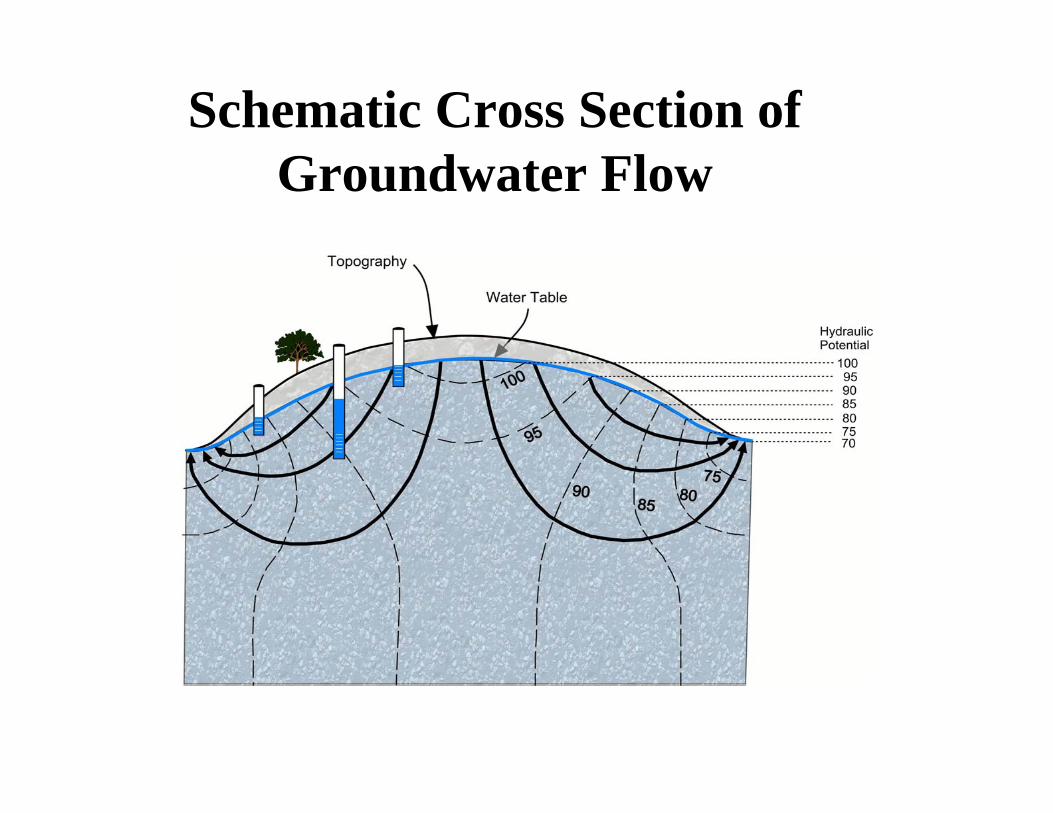
Schematic Cross Section of Groundwater Flow
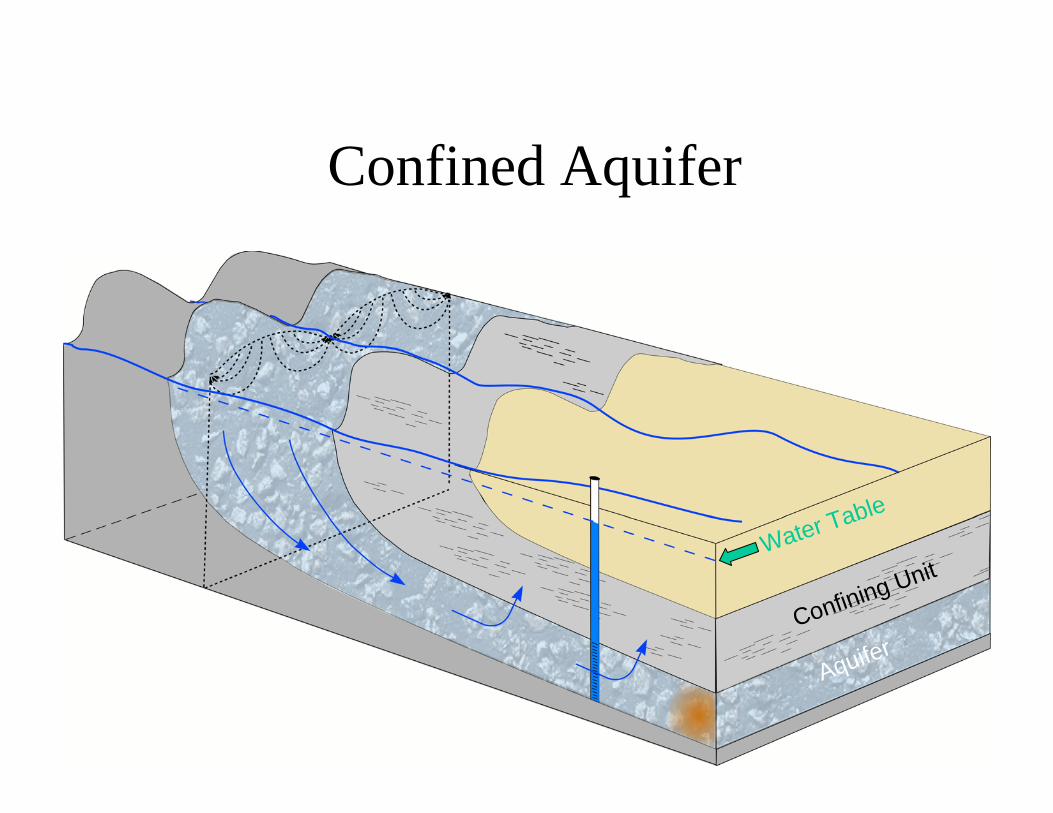
Confined Aquifer
AquiferConfining Unit
Water Table
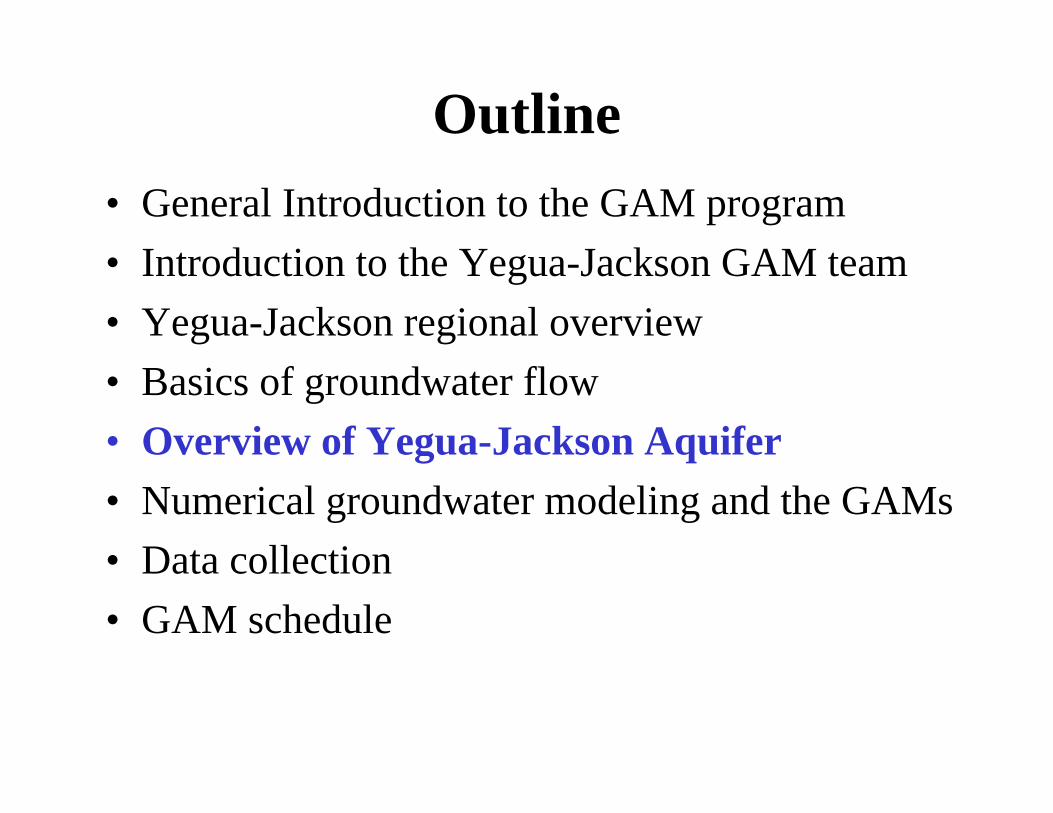
Outline• General Introduction to the GAM program• Introduction to the Yegua-Jackson GAM team• Yegua-Jackson regional overview• Basics of groundwater flow• Overview of Yegua-Jackson Aquifer• Numerical groundwater modeling and the GAMs• Data collection• GAM schedule
Webb Duval
Harris
Fr io
Kenedy
Polk
Starr
Bee
Leon
Hidalgo
Tyler
Brazoria
La Salle
Liberty
Milam
Lee
Nueces
Zapata
Matagorda
Houston
Jasper
Kleberg
Cameron
Hardin
Brooks
Lavaca
Atascosa
Goliad
Wharton
Fayette
De Witt
Calhoun
Newton
Live Oak
Jefferson
Wilson
Jim Hogg
Victoria
McMullen
Trinity
Walker
Bastrop
Gonzales
Grimes
Willacy
Colorado
Karnes
Refugio
Austin
Jackson
Angelina
Jim Wells
Fort BendGalveston
Montgomery
Brazos
Chambers
Robertson
Waller
Sabine
Burleson
Guadalupe
Caldwell
AransasSan Patricio
Madison
San Jacinto
Washington Orange
Nacogdoches
Dimmit
San Augustine
Cherokee
Aquifer Outline
State Line
County Boundaries
Tentative Study Area Source: Online: Texas Water Development Board, March 2007
−0 20 40
Miles
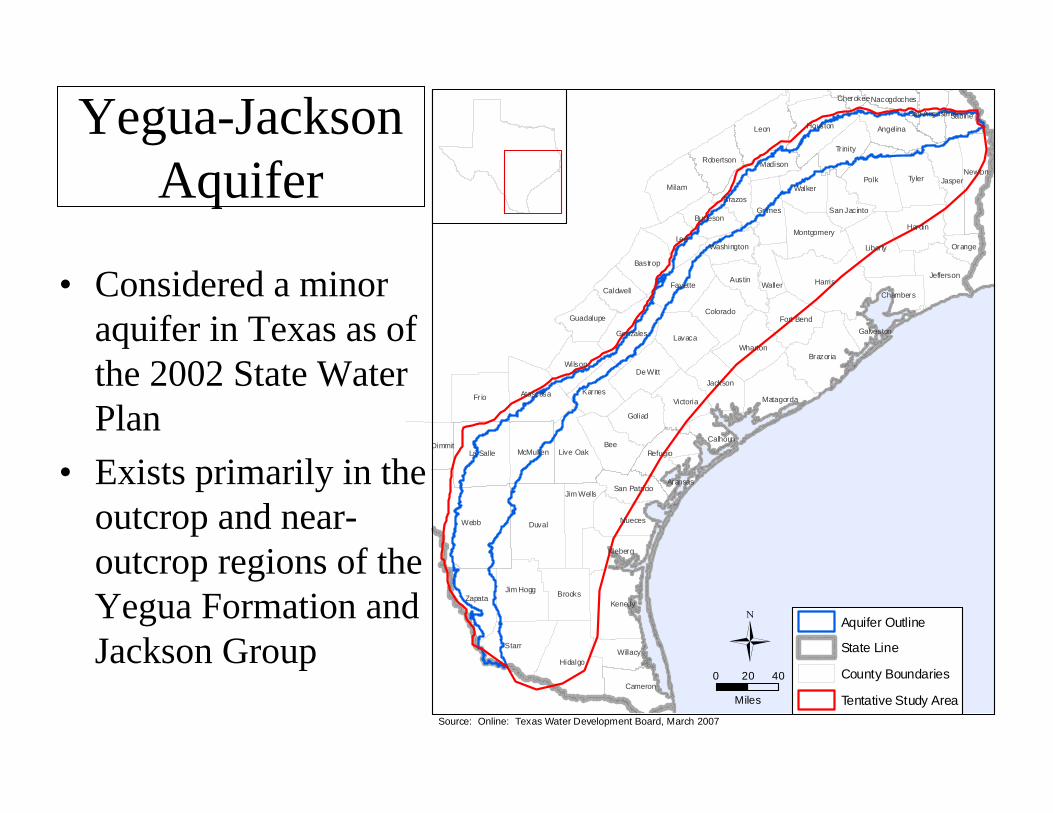
Yegua-Jackson Aquifer
• Considered a minor aquifer in Texas as of the 2002 State Water Plan
• Exists primarily in the outcrop and near-outcrop regions of the Yegua Formation and Jackson Group
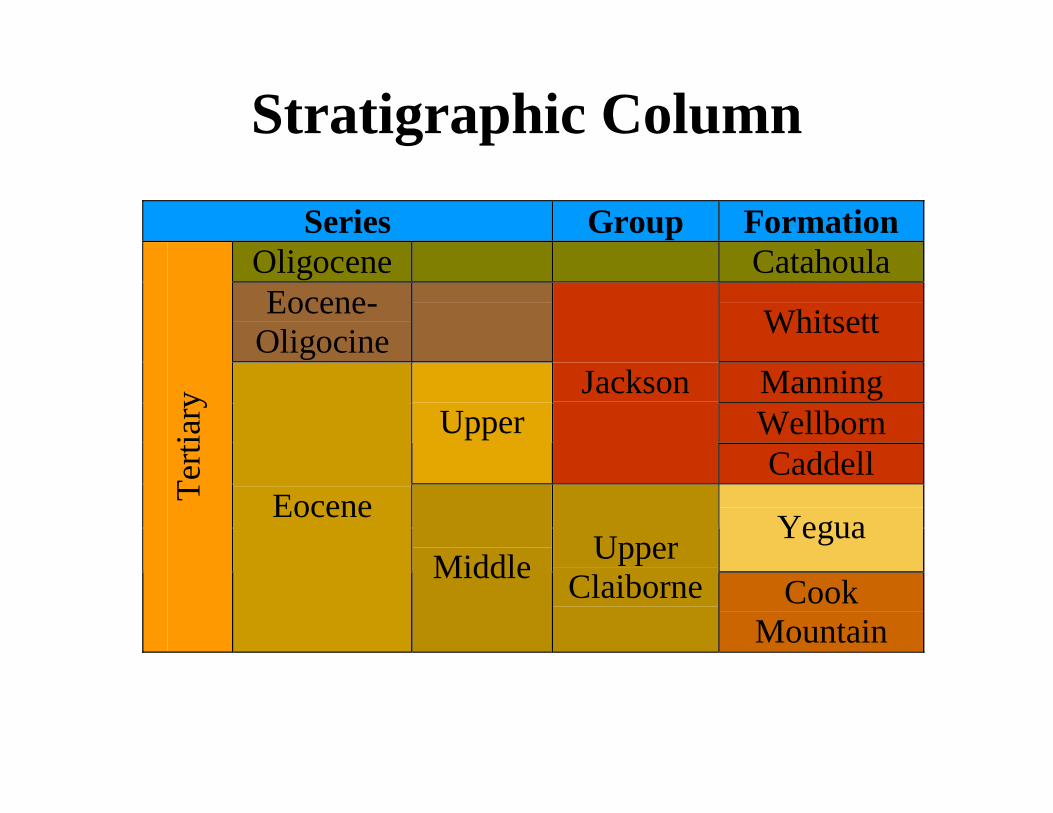
Stratigraphic Column
Series Group Formation Oligocene Catahoula Eocene-
Oligocine Whitsett
Manning Wellborn Upper
Jackson
Caddell
Yegua
Terti
ary
Eocene
Middle Upper Claiborne Cook
Mountain
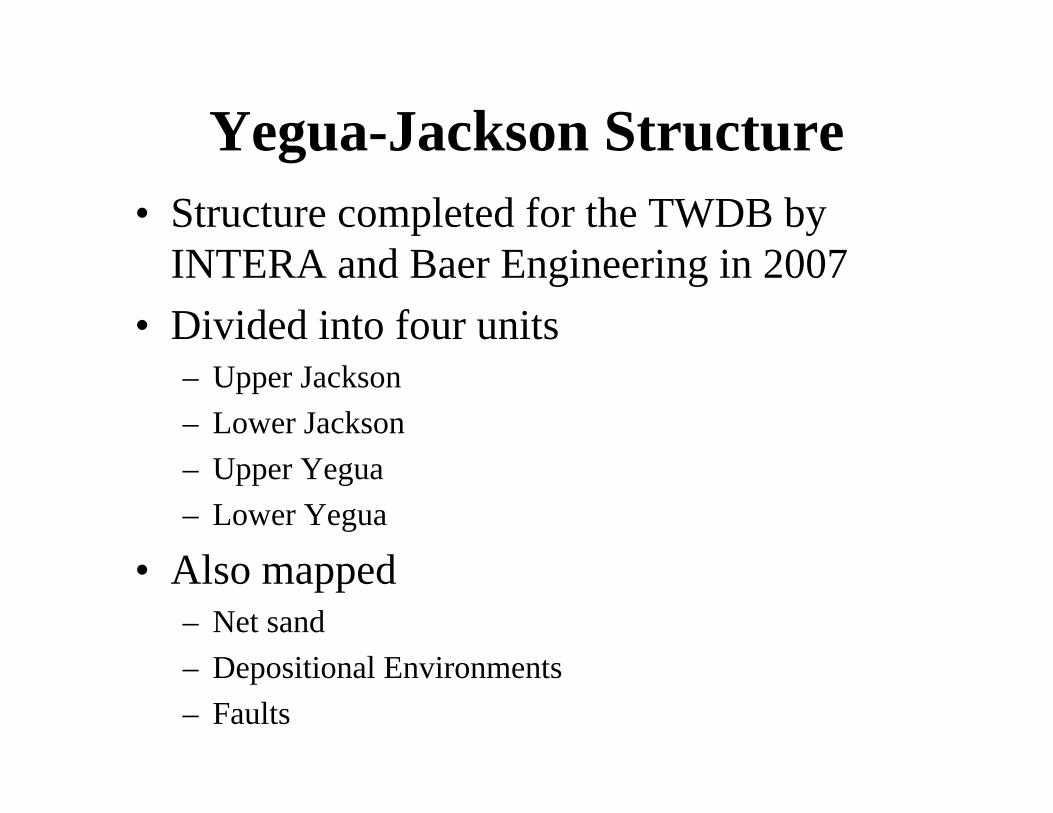
Yegua-Jackson Structure• Structure completed for the TWDB by
INTERA and Baer Engineering in 2007• Divided into four units
– Upper Jackson– Lower Jackson– Upper Yegua– Lower Yegua
• Also mapped– Net sand– Depositional Environments– Faults
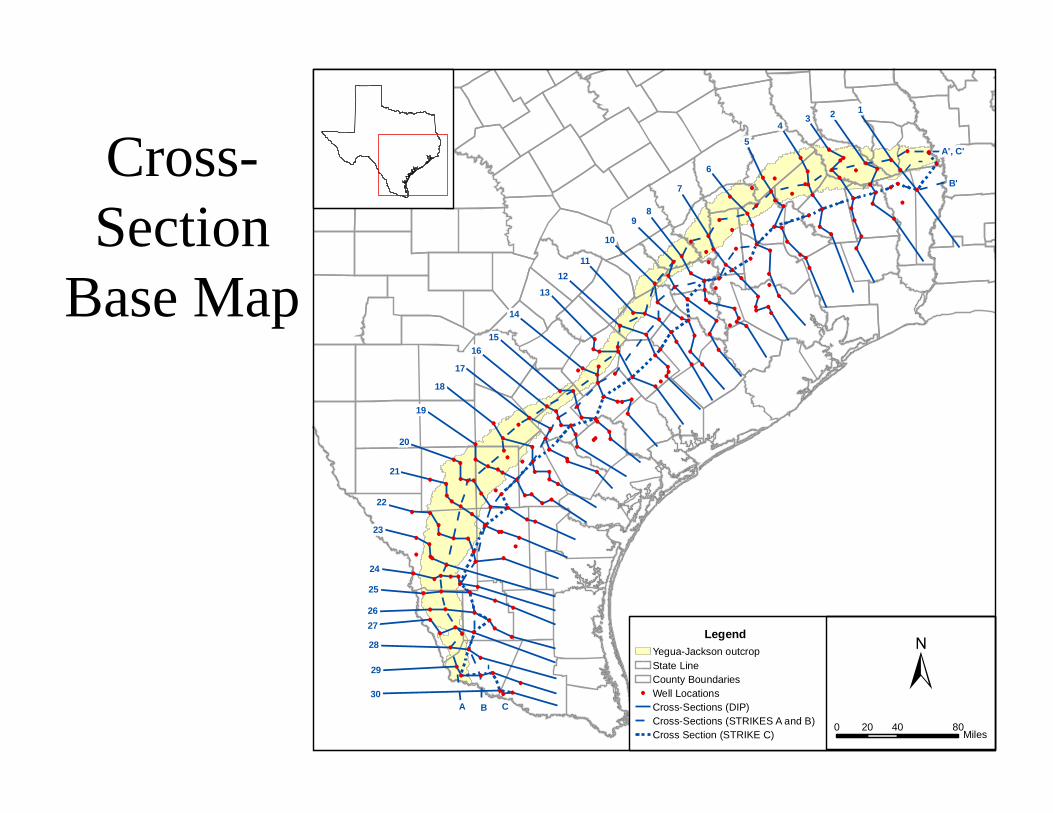
LegendYegua-Jackson outcropState LineCounty BoundariesWell LocationsCross-Sections (DIP)Cross-Sections (STRIKES A and B)Cross Section (STRIKE C)
0 40 8020Miles
124
3
5
6
7
89
10
1112
13
14
1516
17
18
19
20
21
22
23
24
25
2627
28
29
30A B C
B'
A', C'Cross-Section
Base Map
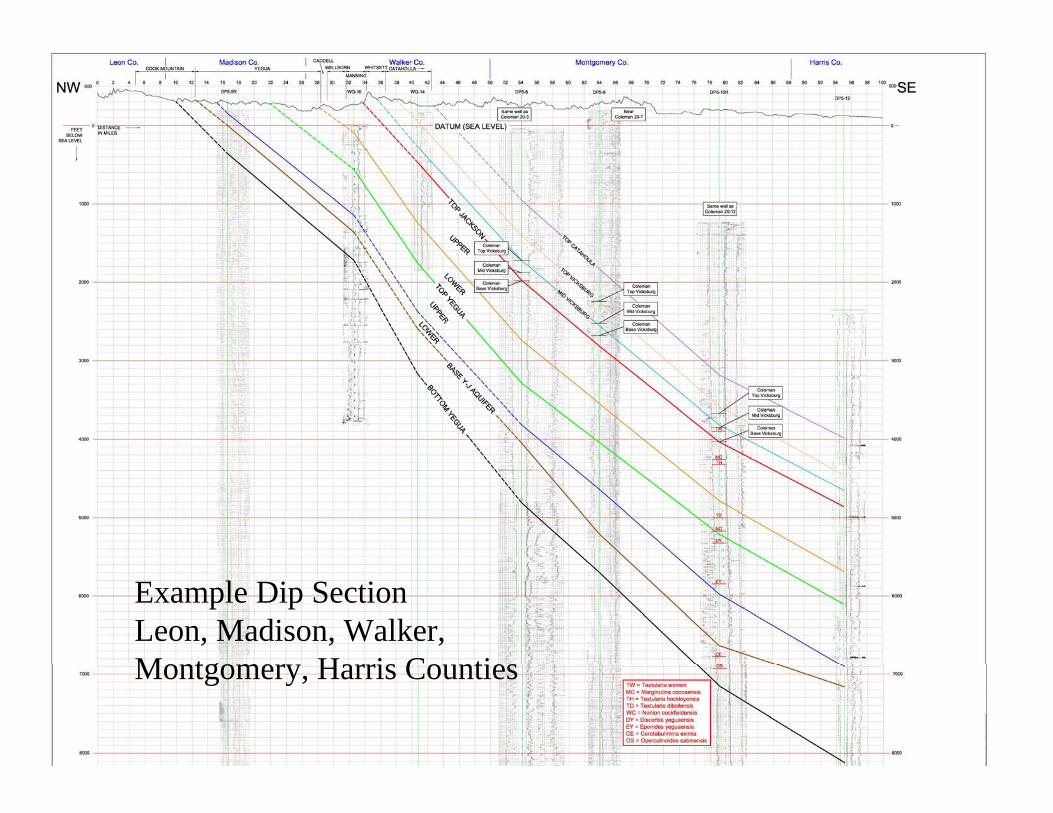
Example Dip SectionLeon, Madison, Walker, Montgomery, Harris Counties
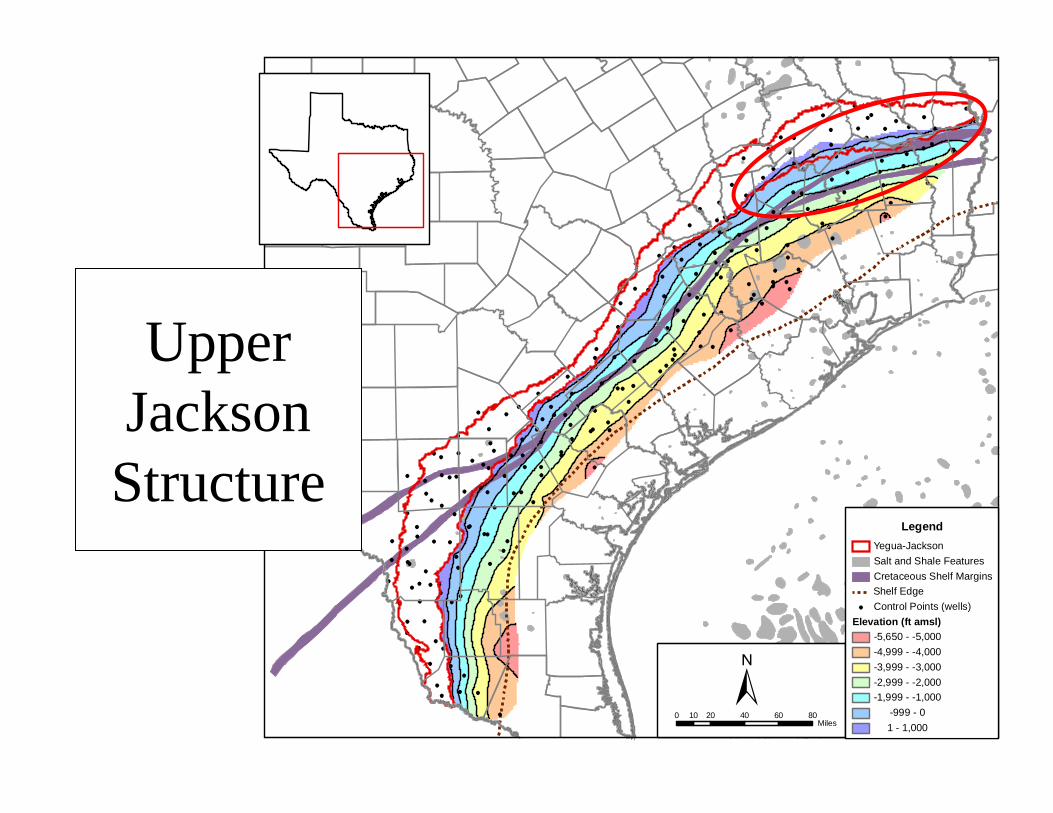
LegendYegua-JacksonSalt and Shale FeaturesCretaceous Shelf MarginsShelf EdgeControl Points (wells)
Elevation (ft amsl)-5,650 - -5,000-4,999 - -4,000-3,999 - -3,000-2,999 - -2,000-1,999 - -1,000
-999 - 01 - 1,000
0 20 40 60 8010Miles
Upper JacksonStructure

750
250
1000
500
250
500
500
250
750
750
250
250
1000
750
750
1000
500
500
250
500
250
1000
750
250
500
LegendState LineShelf EdgeYegua-Jackson outcropCounty BoundariesWell Locations
Upper Yegua Isopach (ft)10 - 250251 - 500501 - 750751 - 1,0001,001 - 1,2501,251 - 1,500
0 40 8020Miles
Sediment Input Axis(Size Relative to Sed. Vol.)
Upper Yegua
Isopach
200
300
100 0
100
00
100
0
0
200
00
200
0
100
010
0
0
0
0
0
200
0
0
100
100
100
0
300
100
100
0
0
100
0 40 8020Miles
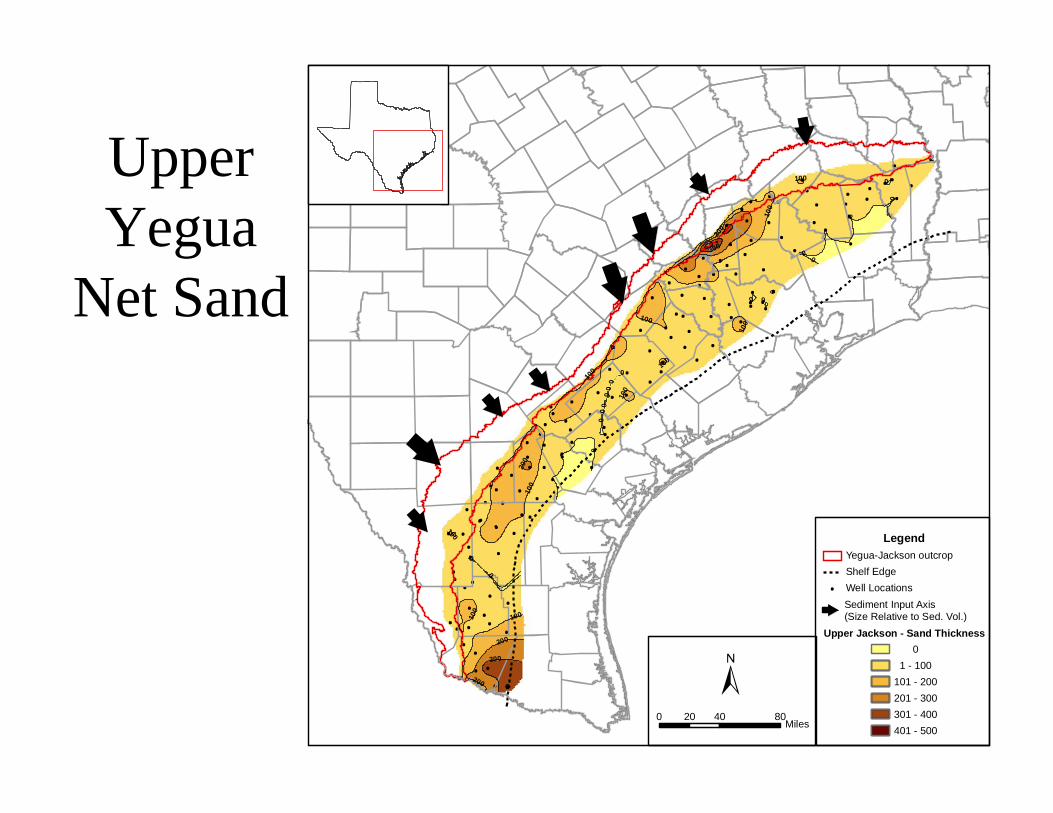
LegendYegua-Jackson outcropShelf EdgeWell Locations
Upper Jackson - Sand Thickness0
1 - 100101 - 200201 - 300301 - 400401 - 500
Sediment Input Axis(Size Relative to Sed. Vol.)
Upper Yegua
Net Sand
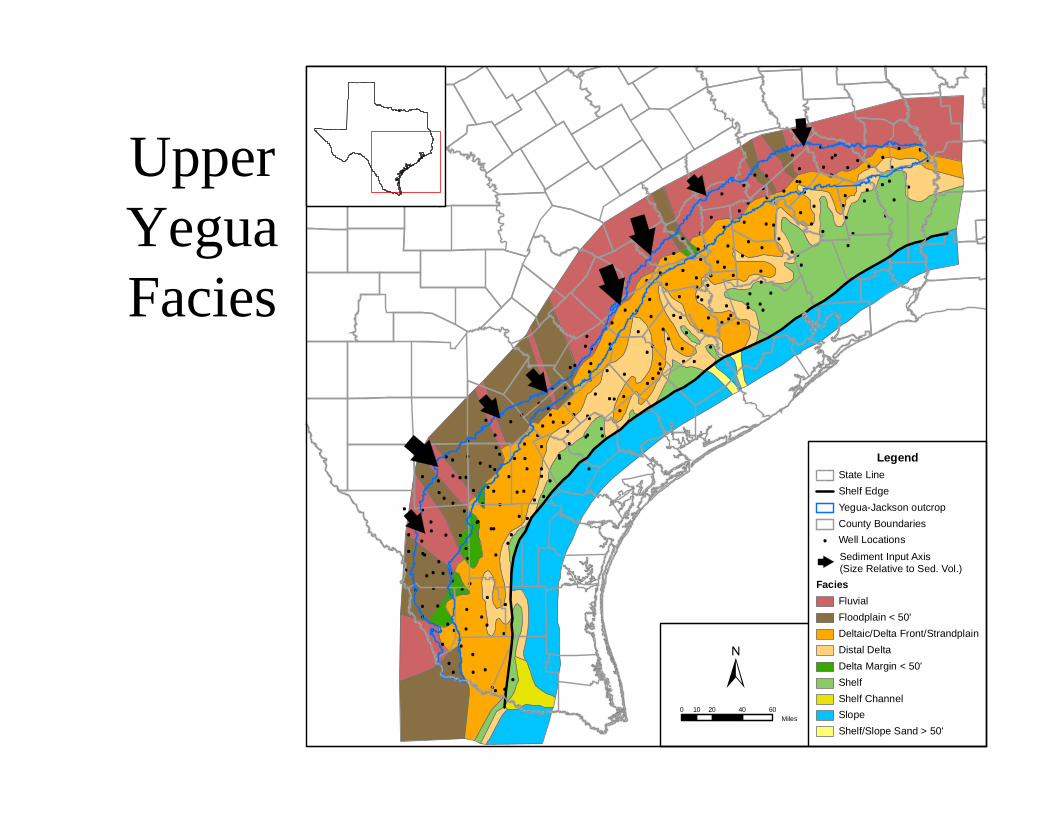
LegendState LineShelf EdgeYegua-Jackson outcropCounty BoundariesWell Locations
FaciesFluvialFloodplain < 50'Deltaic/Delta Front/StrandplainDistal DeltaDelta Margin < 50'ShelfShelf ChannelSlopeShelf/Slope Sand > 50'
0 20 40 6010Miles
Sediment Input Axis(Size Relative to Sed. Vol.)
Upper YeguaFacies

Outline• General Introduction to the GAM program• Introduction to the Yegua-Jackson GAM team• Yegua-Jackson regional overview• Basics of groundwater flow• Overview of Yegua-Jackson Aquifer• Numerical groundwater modeling and the
GAMs• Data collection• Identification of data needs• GAM schedule
Definition of a Model
Domenico (1972) defined a model as a representation of reality that attempts to explain the behavior of some aspect of reality and is always less complex than the real system it represents
Wang & Anderson (1982) defined a model as a tool designed to represent a simplifiedversion of reality
Why Groundwater Flow Models?
• In contrast to surface water, groundwater flow is difficult to observe
• Aquifers are typically complex in terms of spatial extent and hydrogeologicalcharacteristics
• A groundwater model provides the only means for integrating available data for the prediction of groundwater flow at the scale of interest
Numerical Flow Model
• A numerical groundwater flow model is the mathematical representation of an aquifer
• It uses basic laws of physics that govern groundwater flow
• In the model domain, the numerical model calculates the hydraulic head at discrete locations (determined by the grid)
• The calculated model heads can be compared to hydraulic heads measured in wells
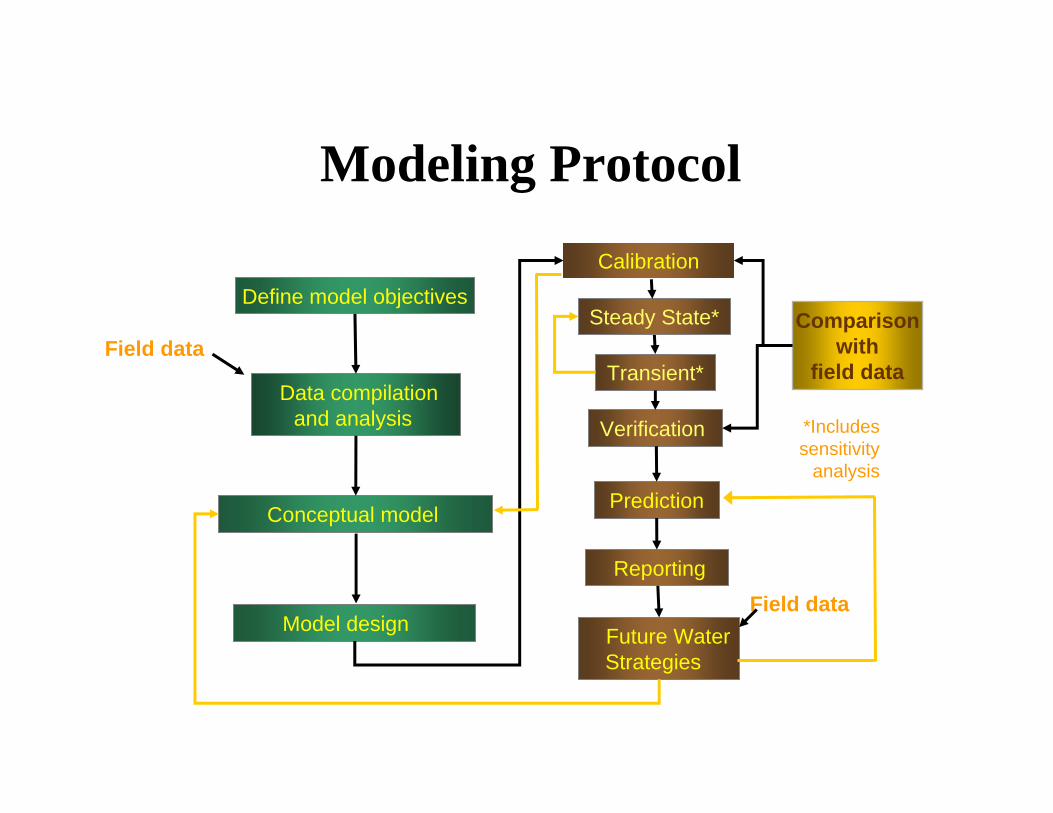
Define model objectives
Data compilation and analysis
Conceptual model
Calibration
Reporting
Verification
Future WaterStrategies
Prediction
Comparisonwith
field data
Model design
Field data
Field data
*Includes sensitivity
analysis
Modeling Protocol
Transient*
Steady State*
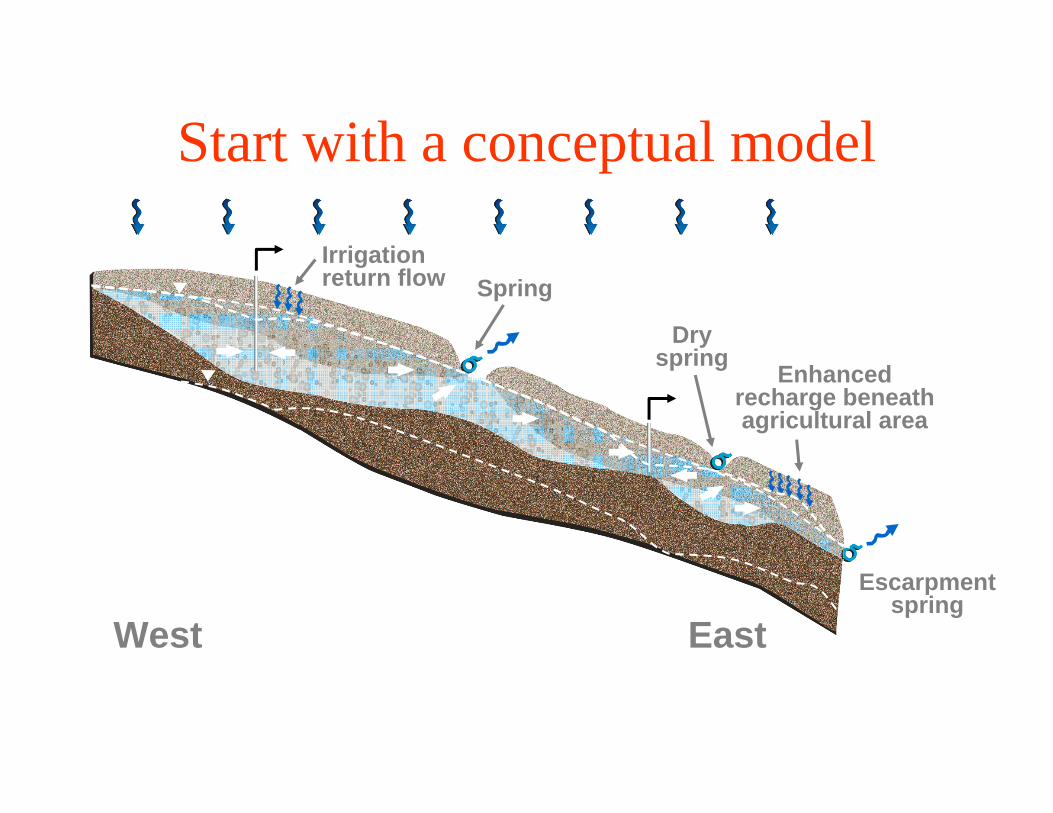
Start with a conceptual model
West East
Irrigationreturn flow
Enhancedrecharge beneathagricultural area
Spring
Dryspring
Escarpmentspring
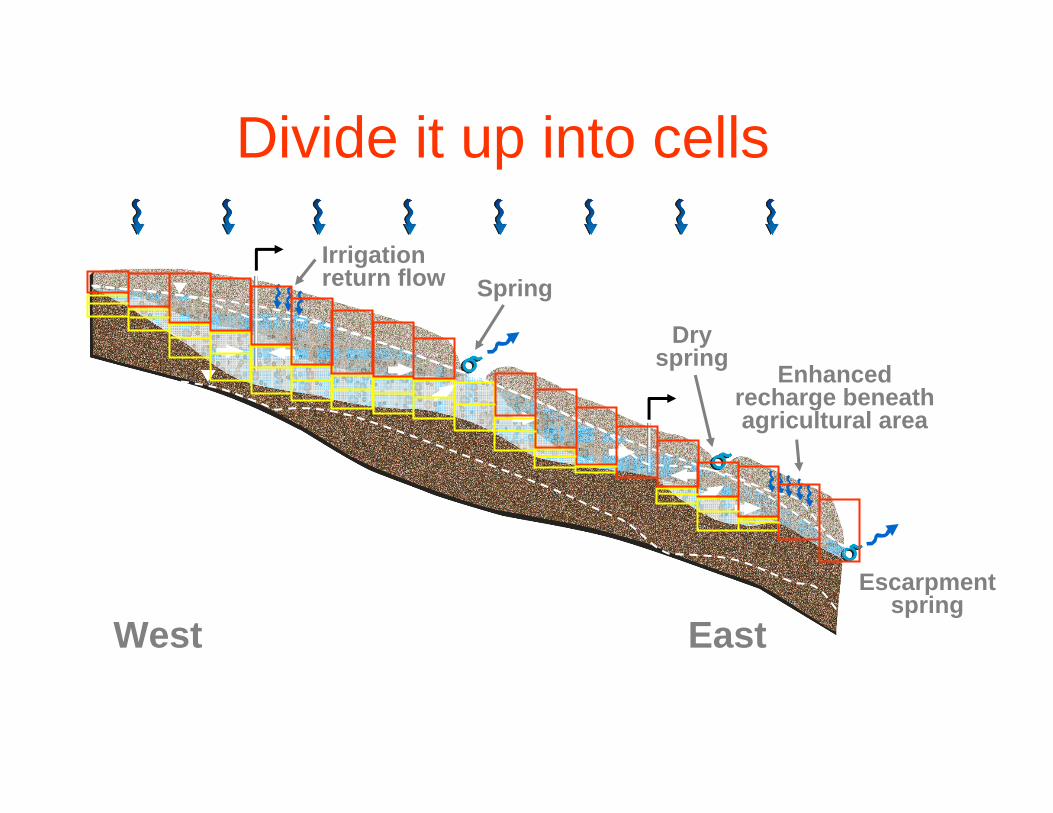
Divide it up into cells
West East
Irrigationreturn flow
Enhancedrecharge beneathagricultural area
Spring
Dryspring
Escarpmentspring
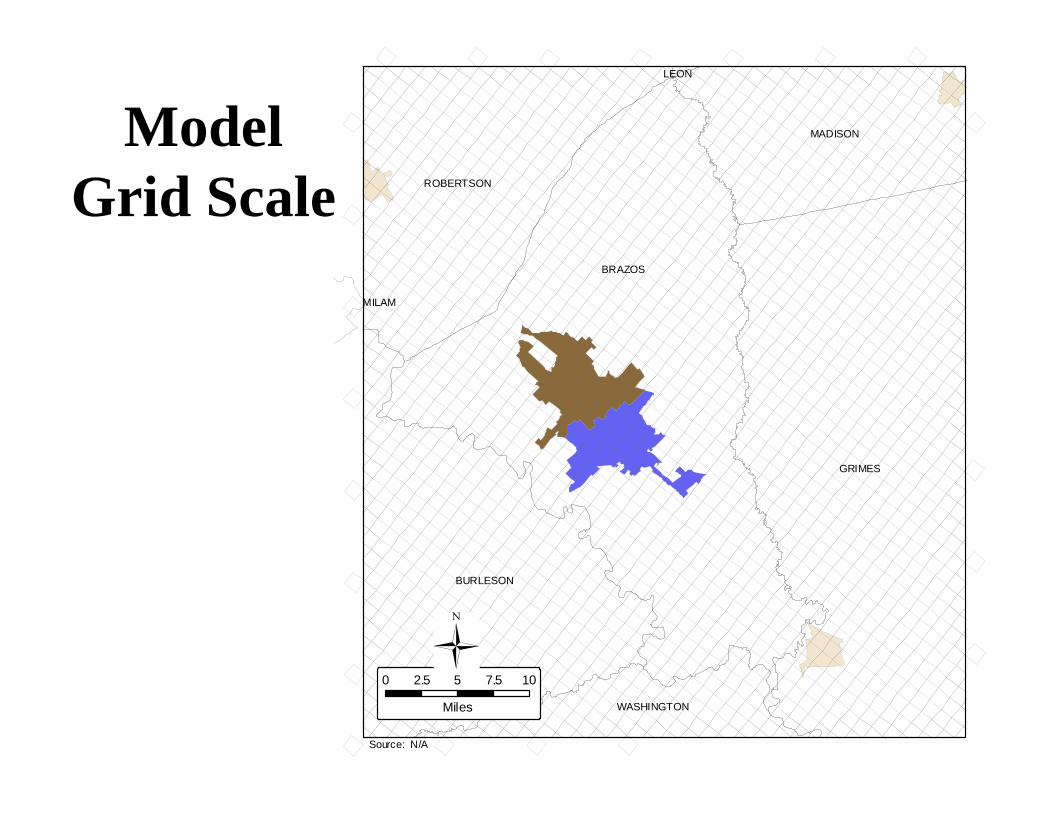
Model Grid Scale
BRAZOS
GRIMES
BURLESON
ROBERTSON
MADISON
WASHINGTON
LEON
MILAM
Source: N/A
0 2.5 5 7.5 10
Miles
−
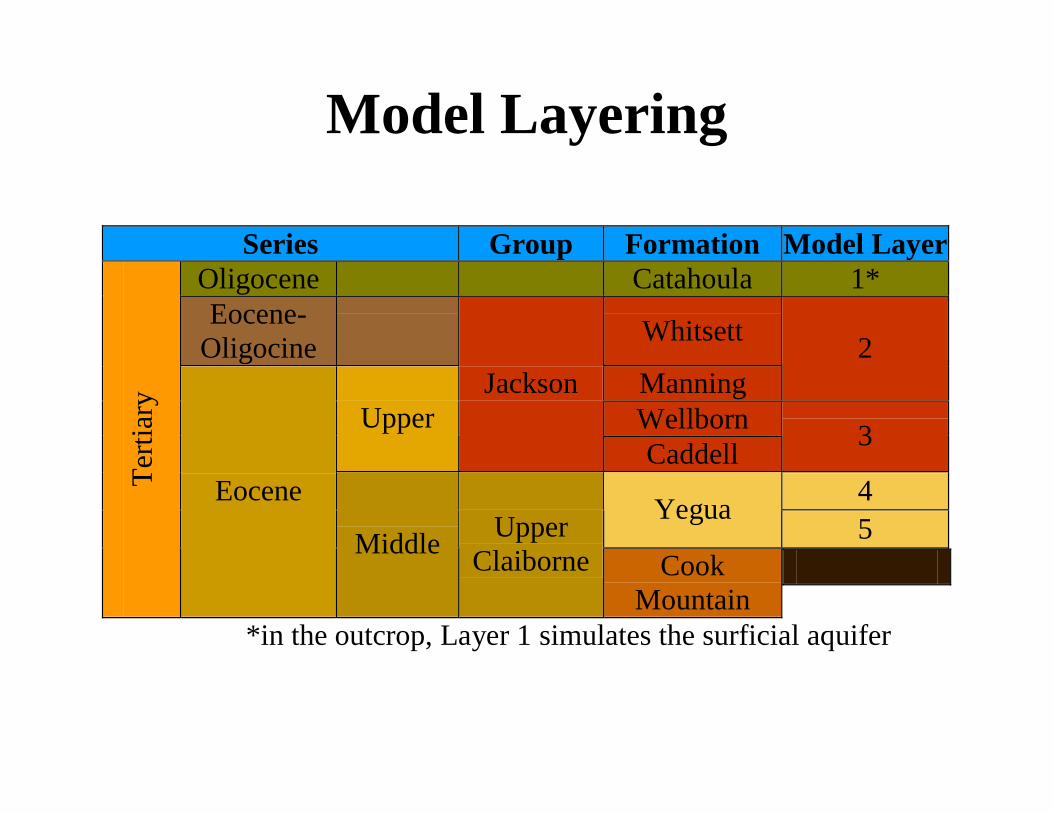
Model Layering
Series Group Formation Model LayerOligocene Catahoula 1* Eocene-
Oligocine Whitsett
Manning 2
Wellborn Upper Jackson
Caddell 3
4 Yegua 5
Terti
ary
Eocene
Middle Upper Claiborne Cook
Mountain
*in the outcrop, Layer 1 simulates the surficial aquifer
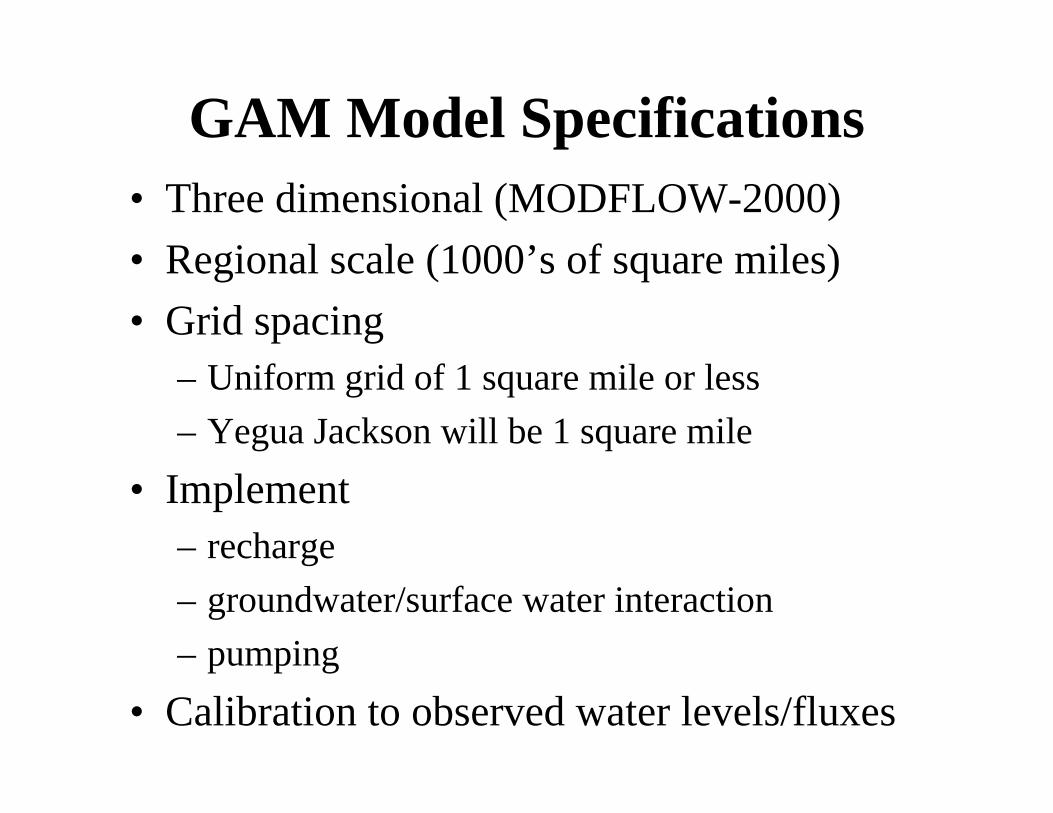
GAM Model Specifications• Three dimensional (MODFLOW-2000)• Regional scale (1000’s of square miles)• Grid spacing
– Uniform grid of 1 square mile or less– Yegua Jackson will be 1 square mile
• Implement– recharge– groundwater/surface water interaction– pumping
• Calibration to observed water levels/fluxes
MODFLOW
• Code developed by the U.S. Geological Survey• Selected by TWDB for all GAMs• Handles the relevant processes• Comprehensive documentation• Public domain – non-proprietary• Most widely used groundwater model
– USGS had 12,261 downloads of MODFLOW computer code in 2000
• Supporting interface programs available– Groundwater Vistas to be used in all GAMs
Outline• General Introduction to the GAM program• Introduction to the Yegua-Jackson GAM team• Yegua-Jackson regional overview• Basics of groundwater flow• Overview of Yegua-Jackson Aquifer• Numerical groundwater modeling and the GAMs• Data collection• GAM schedule
Data CollectionKey Data Sources
• Heads– County Reports (predevelopment)
• Evidence of artesian wells• Evidence of flowing springs
– TWDB groundwater database– GCDs?
• Water quality– TWDB groundwater database
Data CollectionKey Data Sources
• Fluxes– Baseflow
• Slade et al. (2002) gain-loss studies• Hydrograph separation analysis• San Antonio River Authority, Evergreen Underground
WCD, and Goliad GCD sponsoring groundwater-surface water interaction study on the Lower San Antonio River with the USGS.
– Springs• Brune (1981)• TWDB database

Data CollectionKey Data Sources
• Hydraulic Properties– County reports– Meyer– PWS Database– TCEQ Surface Casing Database
• Typically specific capacity tests– GCDs– Stakeholders

Outline
• General Introduction to the GAM program• Introduction to the Yegua-Jackson GAM team• Yegua-Jackson regional overview• Basics of groundwater flow• Overview of Yegua-Jackson Aquifer• Numerical groundwater modeling and the GAMs• Data collection• GAM schedule
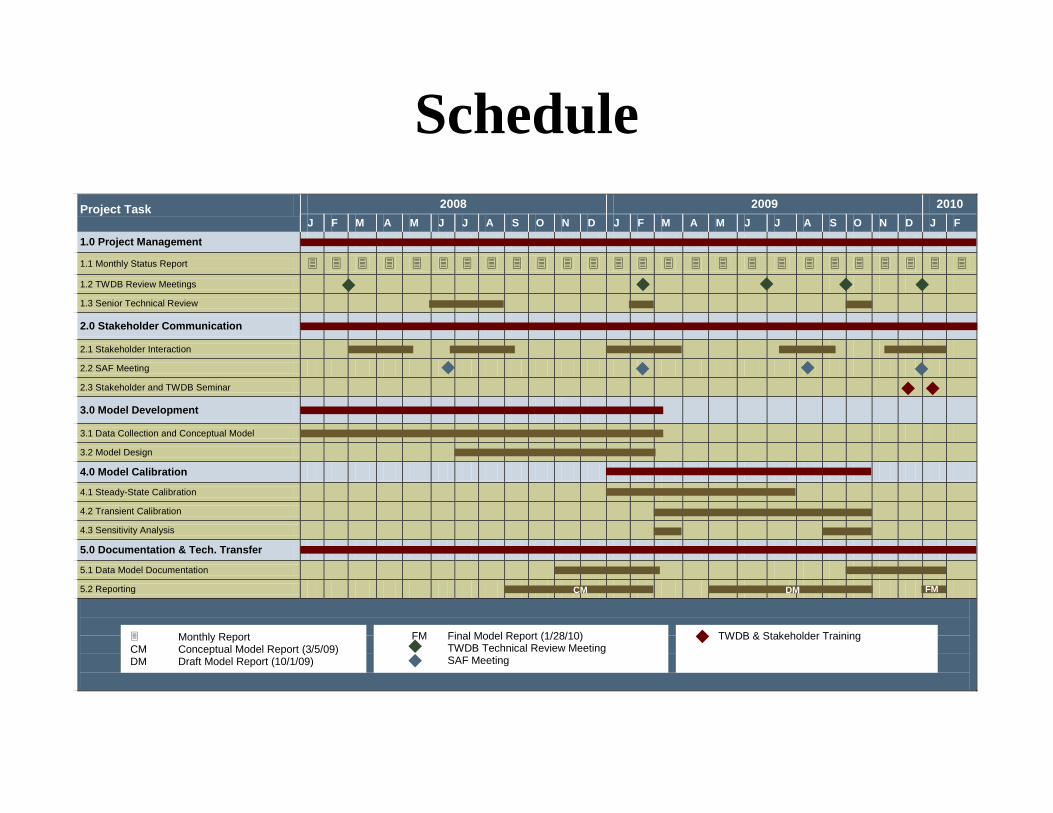
Schedule2008 2009 2010 Project Task
J F M A M J J A S O N D J F M A M J J A S O N D J F
1.0 Project Management
1.1 Monthly Status Report 1.2 TWDB Review Meetings 1.3 Senior Technical Review 2.0 Stakeholder Communication 2.1 Stakeholder Interaction 2.2 SAF Meeting 2.3 Stakeholder and TWDB Seminar 3.0 Model Development 3.1 Data Collection and Conceptual Model 3.2 Model Design 4.0 Model Calibration 4.1 Steady-State Calibration 4.2 Transient Calibration 4.3 Sensitivity Analysis 5.0 Documentation & Tech. Transfer 5.1 Data Model Documentation 5.2 Reporting
CM DM FM
Monthly Report CM Conceptual Model Report (3/5/09) DM Draft Model Report (10/1/09)
FM Final Model Report (1/28/10) TWDB Technical Review Meeting
SAF Meeting
TWDB & Stakeholder Training
Thank You – Questions?
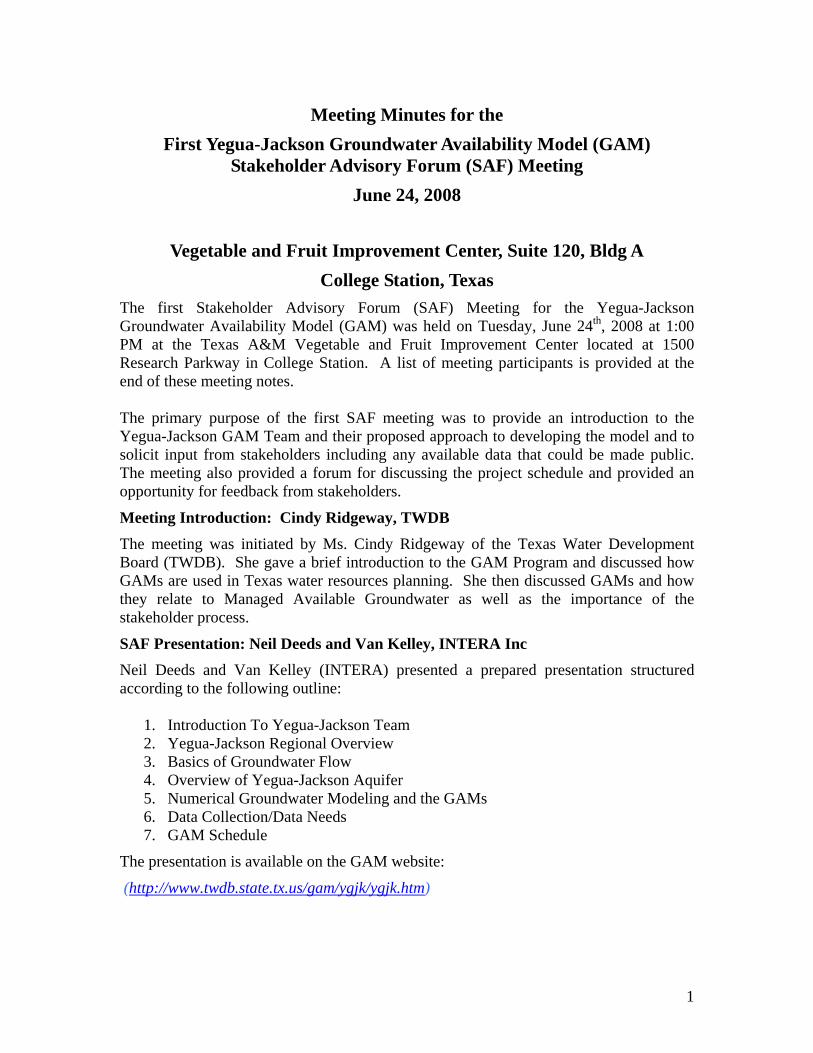
Meeting Minutes for the First Yegua-Jackson Groundwater Availability Model (GAM)
Stakeholder Advisory Forum (SAF) Meeting June 24, 2008
Vegetable and Fruit Improvement Center, Suite 120, Bldg A College Station, Texas
The first Stakeholder Advisory Forum (SAF) Meeting for the Yegua-Jackson Groundwater Availability Model (GAM) was held on Tuesday, June 24th, 2008 at 1:00 PM at the Texas A&M Vegetable and Fruit Improvement Center located at 1500 Research Parkway in College Station. A list of meeting participants is provided at the end of these meeting notes. The primary purpose of the first SAF meeting was to provide an introduction to the Yegua-Jackson GAM Team and their proposed approach to developing the model and to solicit input from stakeholders including any available data that could be made public. The meeting also provided a forum for discussing the project schedule and provided an opportunity for feedback from stakeholders.
Meeting Introduction: Cindy Ridgeway, TWDB
The meeting was initiated by Ms. Cindy Ridgeway of the Texas Water Development Board (TWDB). She gave a brief introduction to the GAM Program and discussed how GAMs are used in Texas water resources planning. She then discussed GAMs and how they relate to Managed Available Groundwater as well as the importance of the stakeholder process.
SAF Presentation: Neil Deeds and Van Kelley, INTERA Inc Neil Deeds and Van Kelley (INTERA) presented a prepared presentation structured according to the following outline:
1. Introduction To Yegua-Jackson Team 2. Yegua-Jackson Regional Overview 3. Basics of Groundwater Flow 4. Overview of Yegua-Jackson Aquifer 5. Numerical Groundwater Modeling and the GAMs 6. Data Collection/Data Needs 7. GAM Schedule
The presentation is available on the GAM website:
(http://www.twdb.state.tx.us/gam/ygjk/ygjk.htm)
1
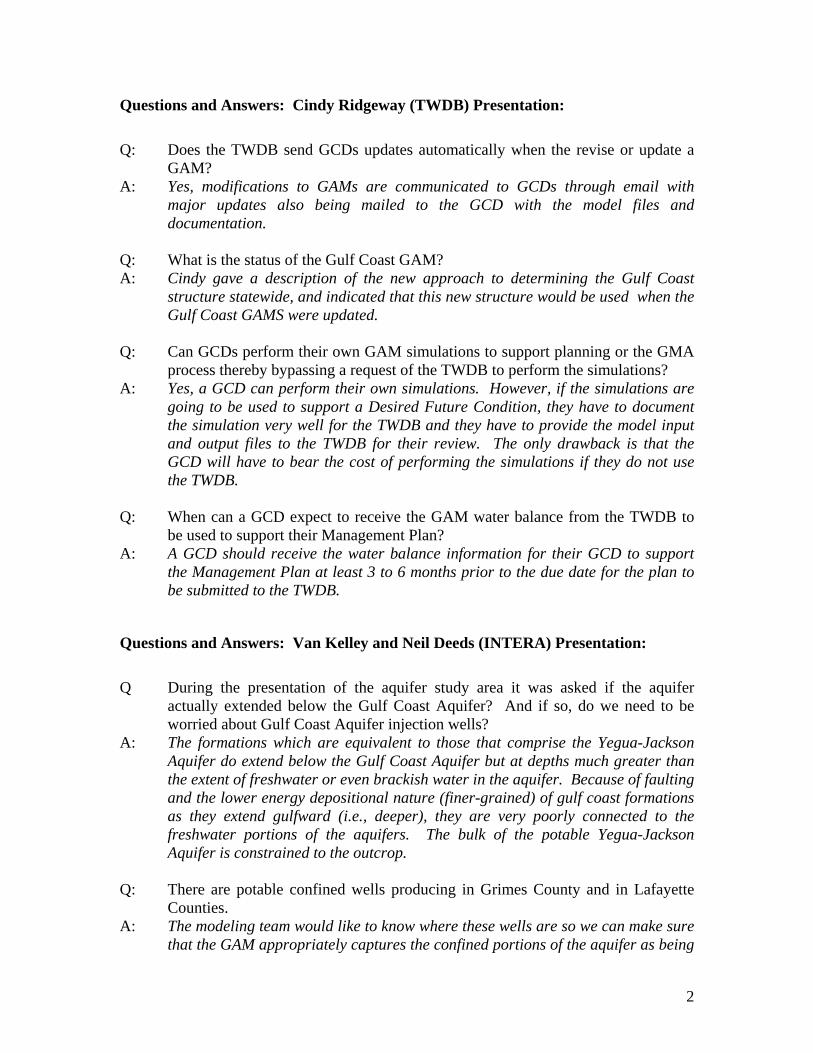
Questions and Answers: Cindy Ridgeway (TWDB) Presentation:
Q: Does the TWDB send GCDs updates automatically when the revise or update a
GAM? A: Yes, modifications to GAMs are communicated to GCDs through email with
major updates also being mailed to the GCD with the model files and documentation.
Q: What is the status of the Gulf Coast GAM? A: Cindy gave a description of the new approach to determining the Gulf Coast
structure statewide, and indicated that this new structure would be used when the Gulf Coast GAMS were updated.
Q: Can GCDs perform their own GAM simulations to support planning or the GMA
process thereby bypassing a request of the TWDB to perform the simulations? A: Yes, a GCD can perform their own simulations. However, if the simulations are
going to be used to support a Desired Future Condition, they have to document the simulation very well for the TWDB and they have to provide the model input and output files to the TWDB for their review. The only drawback is that the GCD will have to bear the cost of performing the simulations if they do not use the TWDB.
Q: When can a GCD expect to receive the GAM water balance from the TWDB to
be used to support their Management Plan? A: A GCD should receive the water balance information for their GCD to support
the Management Plan at least 3 to 6 months prior to the due date for the plan to be submitted to the TWDB.
Questions and Answers: Van Kelley and Neil Deeds (INTERA) Presentation: Q During the presentation of the aquifer study area it was asked if the aquifer
actually extended below the Gulf Coast Aquifer? And if so, do we need to be worried about Gulf Coast Aquifer injection wells?
A: The formations which are equivalent to those that comprise the Yegua-Jackson Aquifer do extend below the Gulf Coast Aquifer but at depths much greater than the extent of freshwater or even brackish water in the aquifer. Because of faulting and the lower energy depositional nature (finer-grained) of gulf coast formations as they extend gulfward (i.e., deeper), they are very poorly connected to the freshwater portions of the aquifers. The bulk of the potable Yegua-Jackson Aquifer is constrained to the outcrop.
Q: There are potable confined wells producing in Grimes County and in Lafayette
Counties. A: The modeling team would like to know where these wells are so we can make sure
that the GAM appropriately captures the confined portions of the aquifer as being
2
well connected to the outcrop. In developing the Yegua-Jackson structure, it was noted that there were portions of the aquifer where potable groundwater existed in confined portions of the aquifer. For each control well, we made estimates of fresh groundwater versus brackish and saline groundwater. We could map a depth to freshwater surface.
It was requested that INTERA develop a depth to poor groundwater quality for the upper and lower Yegua and Jackson aquifer units and post it on the TWDB website.
3
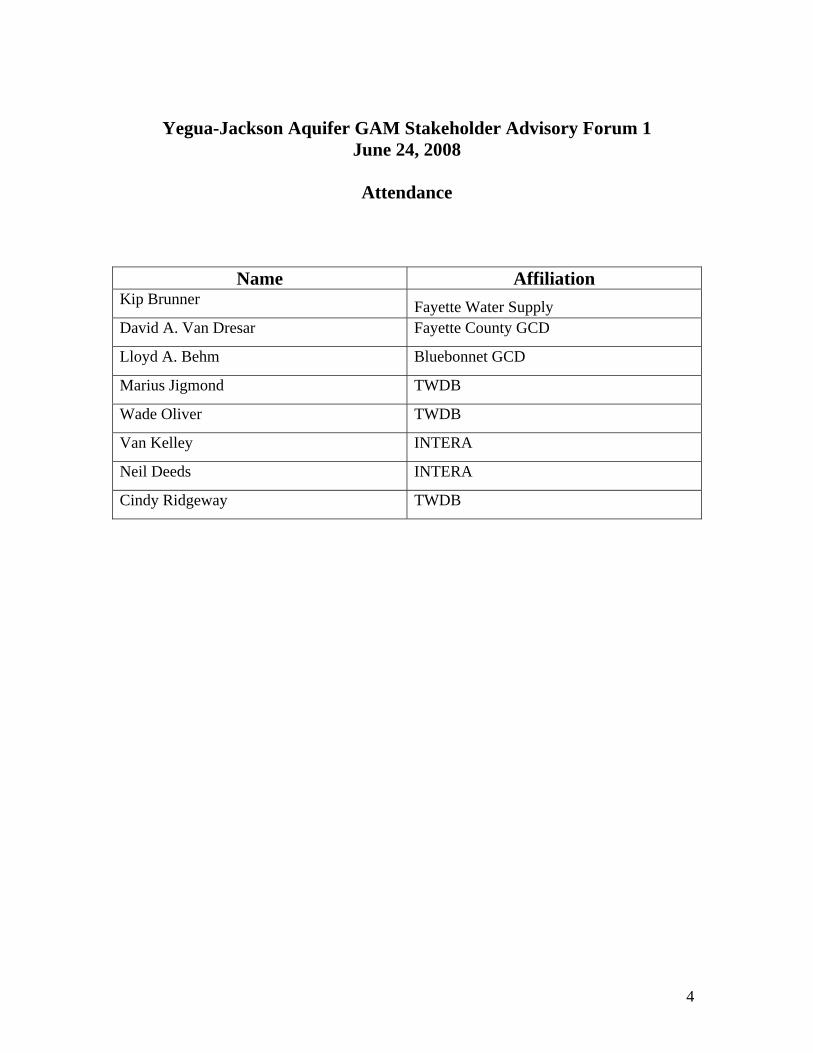
Yegua-Jackson Aquifer GAM Stakeholder Advisory Forum 1
June 24, 2008
Attendance
Name Affiliation Kip Brunner Fayette Water Supply David A. Van Dresar Fayette County GCD
Lloyd A. Behm Bluebonnet GCD
Marius Jigmond TWDB
Wade Oliver TWDB
Van Kelley INTERA
Neil Deeds INTERA
Cindy Ridgeway TWDB
4