Groundwater and well-water quality in Alluvial aquifer … and well-water quality in Alluvial...
24
Groundwater and well-water quality in Alluvial aquifer of Central Gujarat Sunderrajan Krishnan 1 , Sanjiv Kumar 2 , Doeke Kampman 3 and Suresh Nagar 4 1 International Water Management Institute(IWMI), Elecon campus, Anand, Gujarat - 388120 2 Xavier Institute of Development and Studies, Jabalpur, Madhya Pradesh (Intern in IWMI) 3 Trent University, Netherlands (Intern in IWMI) 4 Central Groundwater Board, Ahmedabad Division ABSTRACT Contamination of aquifers is an increasing problem in several parts of India. This, along with scarcity of groundwater resources due to increase in water demand and also by reduction in recharge of groundwater from changing landuse, combine to further compound the problem. In Gujarat state of Western India, a variety of groundwater pollution problems have emerged in the past two decades. High Salinity, Fluoride, Nitrate and pollution from industrial effluents have caused contamination of aquifers in different parts of the state. The Mahi right Bank command (MRBC) aquifer is the Southern tip of the Alluvial North Gujarat aquifer. The drinking water requirement of Anand and Kheda districts that overlay this aquifer is dependant mainly on groundwater. The rural areas are mostly dependant on the Village Panchayat managed water supply system and a combination of private and government handpumps apart from regional piped water supply in some areas. The general lack of awareness of water quality allows the spread of water-borne diseases, especially during the monsoon season. A combination of organizations –IWMI, FES and some medical organizations - came together to assess the extant of biological contamination of well-water after heavy floods in July 2006 and create awareness among the users to follow proper treatment procedures. Well water even from deep sources was highly contaminated till a period of a week after flooding. Apart from such short-term problems in water quality, there are potential longer term problems that arrive from the use of agricultural chemicals. The current levels of Nitrate studied from some samples taken just after monsoon and repeated 4 months later are below the safety limit in the deeper aquifer which is used for drinking water. However, Total dissolved Solids (TDS) and salinity are above potable limits with trend increasing towards the coast; the causes are attributed to inherent salinity and coastal sea-water intrusion. These contamination problems of groundwater distribute themselves in a different way among people due to existing social inequities. For eg. several handpumps used by rural communities have failed, therefore causing them to access poor quality water from open wells. The awareness for and practice of water treatment procedures also are highly variable, ranging from domestic Reverse Osmosis (RO) systems used by affluent urban communities and non-Resident Indian (NRI)-donated community based systems in rural communities to simple cloth based filtration prevalent widely in rural areas. Increased monitoring of the aquifer, spreading awareness among people and using proper water treatment procedures are required in this area.
Transcript of Groundwater and well-water quality in Alluvial aquifer … and well-water quality in Alluvial...
Groundwater and well-water quality in Alluvial aquifer of Central Gujarat
Sunderrajan Krishnan1, Sanjiv Kumar2, Doeke Kampman3 and Suresh Nagar4
1 International Water Management Institute(IWMI), Elecon campus, Anand, Gujarat - 388120 2 Xavier Institute of Development and Studies, Jabalpur, Madhya Pradesh (Intern in IWMI) 3 Trent University, Netherlands (Intern in IWMI) 4 Central Groundwater Board, Ahmedabad Division ABSTRACT Contamination of aquifers is an increasing problem in several parts of India. This, along with scarcity of groundwater resources due to increase in water demand and also by reduction in recharge of groundwater from changing landuse, combine to further compound the problem. In Gujarat state of Western India, a variety of groundwater pollution problems have emerged in the past two decades. High Salinity, Fluoride, Nitrate and pollution from industrial effluents have caused contamination of aquifers in different parts of the state. The Mahi right Bank command (MRBC) aquifer is the Southern tip of the Alluvial North Gujarat aquifer. The drinking water requirement of Anand and Kheda districts that overlay this aquifer is dependant mainly on groundwater. The rural areas are mostly dependant on the Village Panchayat managed water supply system and a combination of private and government handpumps apart from regional piped water supply in some areas. The general lack of awareness of water quality allows the spread of water-borne diseases, especially during the monsoon season. A combination of organizations –IWMI, FES and some medical organizations - came together to assess the extant of biological contamination of well-water after heavy floods in July 2006 and create awareness among the users to follow proper treatment procedures. Well water even from deep sources was highly contaminated till a period of a week after flooding. Apart from such short-term problems in water quality, there are potential longer term problems that arrive from the use of agricultural chemicals. The current levels of Nitrate studied from some samples taken just after monsoon and repeated 4 months later are below the safety limit in the deeper aquifer which is used for drinking water. However, Total dissolved Solids (TDS) and salinity are above potable limits with trend increasing towards the coast; the causes are attributed to inherent salinity and coastal sea-water intrusion. These contamination problems of groundwater distribute themselves in a different way among people due to existing social inequities. For eg. several handpumps used by rural communities have failed, therefore causing them to access poor quality water from open wells. The awareness for and practice of water treatment procedures also are highly variable, ranging from domestic Reverse Osmosis (RO) systems used by affluent urban communities and non-Resident Indian (NRI)-donated community based systems in rural communities to simple cloth based filtration prevalent widely in rural areas. Increased monitoring of the aquifer, spreading awareness among people and using proper water treatment procedures are required in this area.
1. Introduction and picture of Gujarat Gujarat has a hydrogeology representative of almost all aquifer types and depositional and formation eras. The western Saurashtra is part of the Deccan Basaltic terrain with flat to medium slopes except for some places such as Junagadh to the South and Chotila in the North. Kutch is characterized by complex geology of Limestone, Clay, Sandstone and alluvial stretches. The central Alluvial plains of Gujarat consist of North-South ranging aquifers which are vast deposits of rivers flowing from the Aravallis. The South parts of the state possesses areas of hilly terrain known as the Dangs. The North-Eastern region of the State comprises of the Aravalli mountain range whose aquifers are of hard rock Crystalline nature. The Sabarmati, Mahi, Narmada and the Tapi are the major rivers which flow across the Alluvial terrain. The hydrology of the State shows high variation with a humid environment in South Gujarat to highly arid climate of Kutch. The average rainfall varies from a high of 2500 mm in the South-East to a low of 300 mm in the North-West parts of Kutch. In general, the trend is that of higher rainfall in the East and South and lower average rainfall in the North and West. Also typical is the high degree of variability of inter-annual rainfall in the more arid areas (Kumar, 2005).
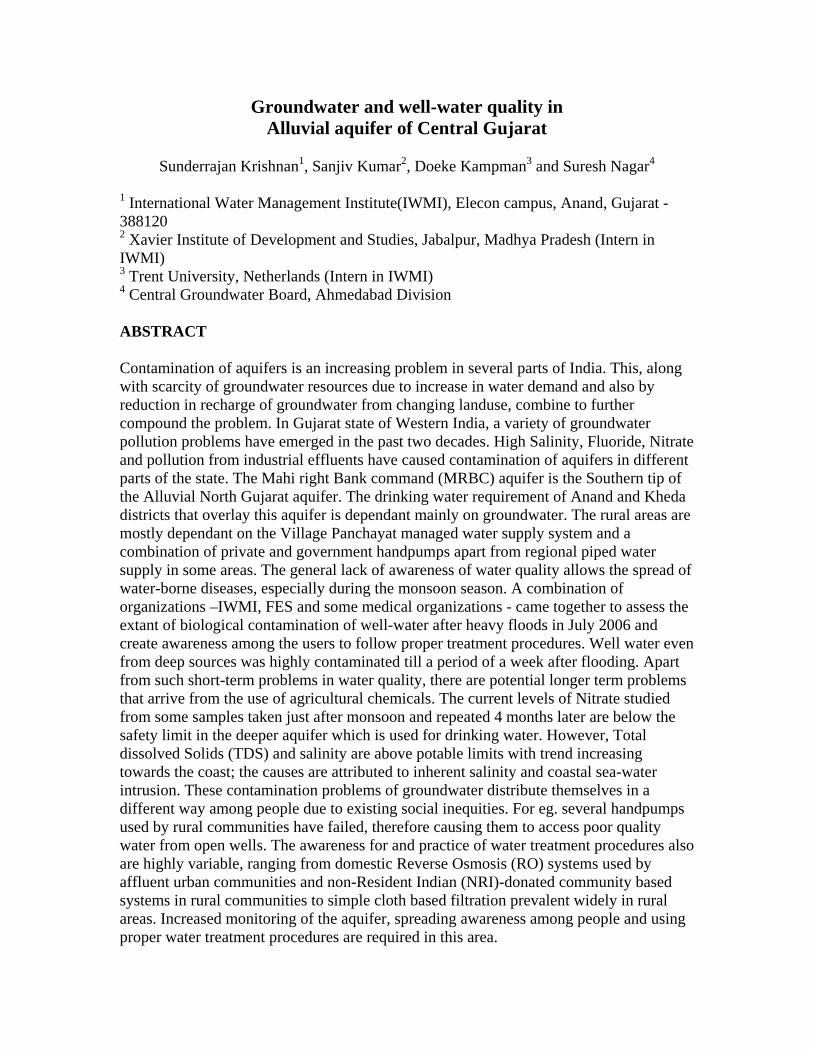
Figure 1: Aquifers of Gujarat 1.2 Groundwater quality Aquifers in Gujarat are beset with numerous quality problems, some of which are increasing in intensity over the years. Having a longest coastline of 1600 km in the country, sea water intrusion into aquifers and inherent salinity is a common problem all across Gujarat right from Kutch and Saurashtra to Vadodara and Valsad. Excessive Fluoride is another problem in groundwater of North Gujarat, some parts of Saurashtra
and some pockets of South Gujarat. Over the years, excessive amounts of Nitrate are surfacing in groundwater in various parts of the state. In addition to all this, Gujarat has various pockets of high industrial activity where large amounts of effluents are released, sometimes directly into wells. High amounts of toxic waste have been detected in aquifers of South and Central Gujarat. 1.2.1 Causes of Salinity, Fluoride and Nitrate Saline water being denser occupies the lower layer than fresh water. However, simple calculations can show that under equilibrium conditions between fresh inland water and sea water, a depletion of water table can result in the depth of saline water below sea-level t reduce by forty times as compared with drop in water tables above sea-level. Intensification of groundwater use in the coastal areas combined with decreased recharge of fresh groundwater into inland aquifers have resulted in a steady ingress of sea water in various parts of Gujarat. Especially because of Alluvial aquifers and gently topography, the ingress is aided more in these areas. For example, in Anand district, sea water intrusion is a serious problem in the coastal Khambat Taluka with Total dissolved Solids (TDS) upto 5000 and Electrical Conductivity of around 10,000. But as one moves inwards around 60-80 km to Anand town, the TDS reduces to around 500 and Electrical Conductivity to around 1000 which is still beyond safety limits, but more potable. Fluoride is present in several minerals such as Apatite and Hornblende are found in rocks of Igneous origin. Especially, Crystalline formations of the Aravallis which underlie deeper aquifers of North Gujarat have induced large amounts of Fluoride. Southern parts of Saurashtra such as Amreli district have also shown high amounts of fluoride content in groundwater. Other areas within the Deccan Trappes such as in South and Central Gujarat also show increasing amounts of Fluoride. Increasing use of Nitrate-based fertilizers that are not fully consumed by plants result in leaching of excess Nitrates into aquifers. Further, human and animal faeces also contribute to rise of Nitrate content in groundwater. In soils with poor drainage, Nitrates accumulate and the concentration increases over the years. Especially in the semi-arid Basaltic areas of Saurashtra, Nitrate accumulation in the weathered zone has resulted in concentrations greater than the safety limit of 40 mg/l (Agarwal et al, 1999). 1.2.3. Impacts of Industrial Pollution Toxic substances releases from industries need to be treated according to norms laid by the Pollution Control Board. But, many industries release their effluents without proper treatment causing harmful heavy metals and chemicals to be released into the environment. Groundwater in this belt has been severely affected in various pockets and severe health impacts have been witnessed. Some of detected chemicals beyond safety limits are Mercury, Chromium and Lead. The seepage of these contaminants through the vadose zone down to the aquifer would be a process dependent on the specific arrangement of soil layers and their saturation profile. One can expect that high recharge events such as floods would assume the responsibility of flushing these chemicals from
the adsorbed soil layers down to the water table. Once these chemicals reach the water table, they can get transported through the local and regional flow system onto drinking water wells. In some areas, aquifers would have been permanently affected, with the requirement of having to seal off some areas to avoid further contamination of adjacent areas. The Mahi Kadana canal irrigation system is regarded as one of the successful surface water irrigation ventures of the Indian government. Being assured of a high 75% dependability of reservoir capacity, the irrigation system has helped a high agricultural growth in the command areas. Though faced by water logging problems in the initial years, development of groundwater-based irrigation through tubewells and a thriving market for local groundwater has addressed this problem too in most of the command areas. The command area studied here is the Mahi right bank command (MRBC) that covers entire Anand district and Nadiad and Matar Talukas of Kheda district. 2. Aquifer and water supply 2.1 Aquifer characteristics
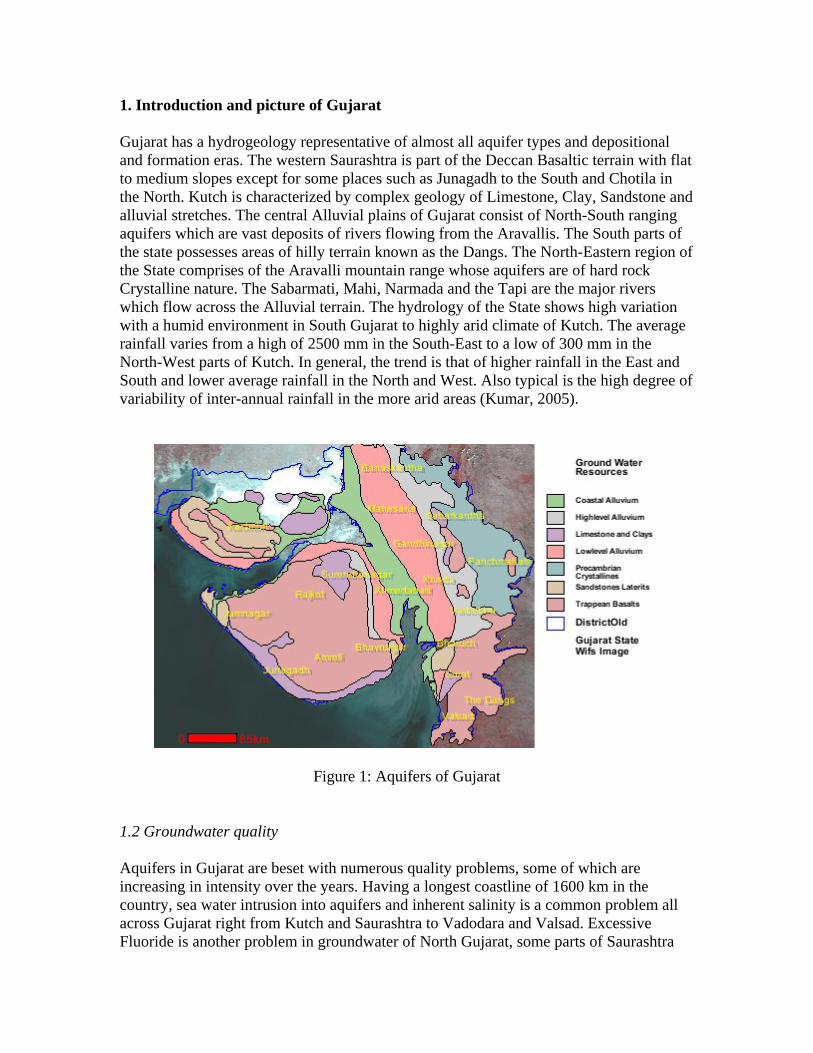
Figure 2: Aquifer cross-section (east-west) across MRBC aquifer
The Mahi Right Bank Command aquifer (MRBC) is primarily an agricultural area with few major industries. It encompasses Anand district and few Blocks of Kheda district.
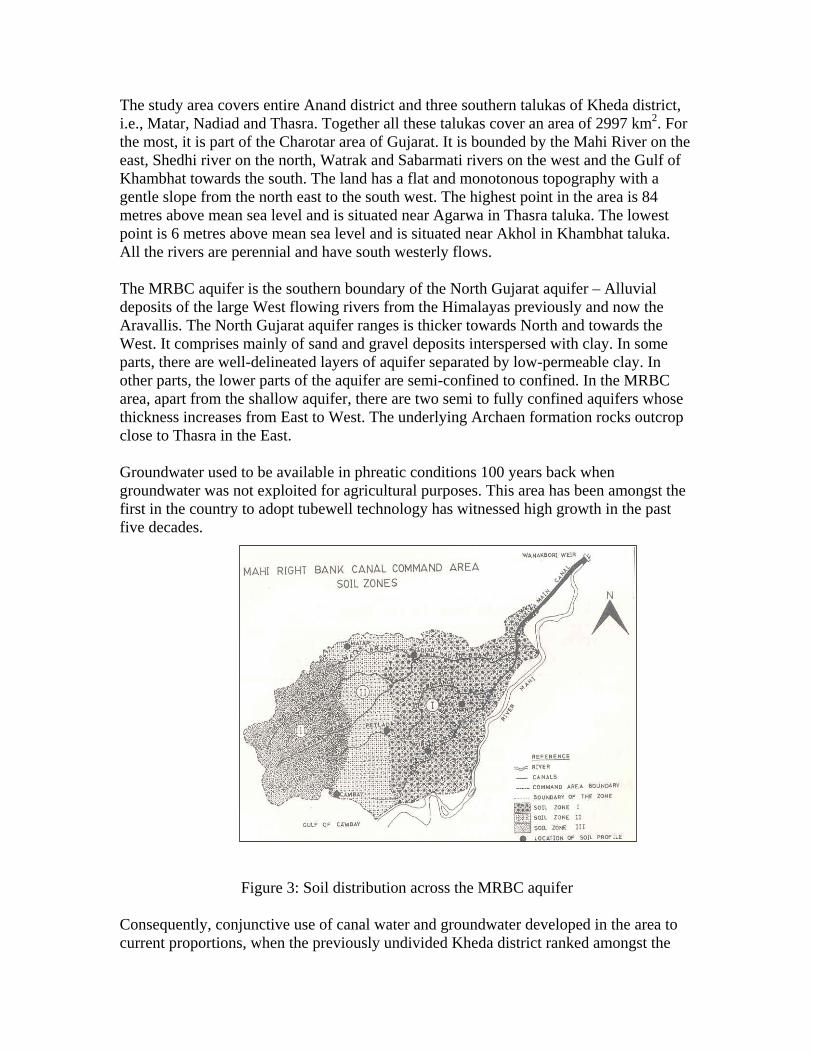
The study area covers entire Anand district and three southern talukas of Kheda district, i.e., Matar, Nadiad and Thasra. Together all these talukas cover an area of 2997 km2. For the most, it is part of the Charotar area of Gujarat. It is bounded by the Mahi River on the east, Shedhi river on the north, Watrak and Sabarmati rivers on the west and the Gulf of Khambhat towards the south. The land has a flat and monotonous topography with a gentle slope from the north east to the south west. The highest point in the area is 84 metres above mean sea level and is situated near Agarwa in Thasra taluka. The lowest point is 6 metres above mean sea level and is situated near Akhol in Khambhat taluka. All the rivers are perennial and have south westerly flows. The MRBC aquifer is the southern boundary of the North Gujarat aquifer – Alluvial deposits of the large West flowing rivers from the Himalayas previously and now the Aravallis. The North Gujarat aquifer ranges is thicker towards North and towards the West. It comprises mainly of sand and gravel deposits interspersed with clay. In some parts, there are well-delineated layers of aquifer separated by low-permeable clay. In other parts, the lower parts of the aquifer are semi-confined to confined. In the MRBC area, apart from the shallow aquifer, there are two semi to fully confined aquifers whose thickness increases from East to West. The underlying Archaen formation rocks outcrop close to Thasra in the East. Groundwater used to be available in phreatic conditions 100 years back when groundwater was not exploited for agricultural purposes. This area has been amongst the first in the country to adopt tubewell technology has witnessed high growth in the past five decades.
Figure 3: Soil distribution across the MRBC aquifer Consequently, conjunctive use of canal water and groundwater developed in the area to current proportions, when the previously undivided Kheda district ranked amongst the
most agriculturally prosperous districts of the India. Groundwater conditions in some parts of the canal head areas are water logged for some parts of the year. But, on the whole, water table is found at 40-80 feet below ground level. Few wells access this shallow groundwater table and reach out to the deeper two layers. Most irrigation wells are between 120 ft to 200 ft, with some going upto 300 ft and 350 ft also. 2.1.1 Soil type In the project area the soil layers are more than 200 metres deep. They were formed by alluvial deposits carried by Mahi, Sabarmati, Watrak and Shedhi rivers. In the north eastern part, soils are coarse grained, mostly comprising sand and silt. They gradually become finer towards south west. In the Bhal region (the west part of Tarapur and Khambhat taluka), the soils are heavy black and clayey type (Central Ground Water Board, 1995). Towards the west the hydraulic conductivity is less than 0.03 cm/hour, but 39%, mostly in the north eastern part, has hydraulic conductivity values between 0.5-5.0 cm/hour (Water Technology Centre, Delhi, 1983). The area can be divided into three soil zones (see figure 3.2): Zone I, near the head of the system, represents well drained non-calcareous sandy loam soils with low salinity. Zone II has somewhat calcareous soils, varying from sandy to clayey soils with relatively high salinity. Zone III, consists of imperfectly drained clayey soils with relatively high salinity and CaCO3 content 2.1.2 Rainfall
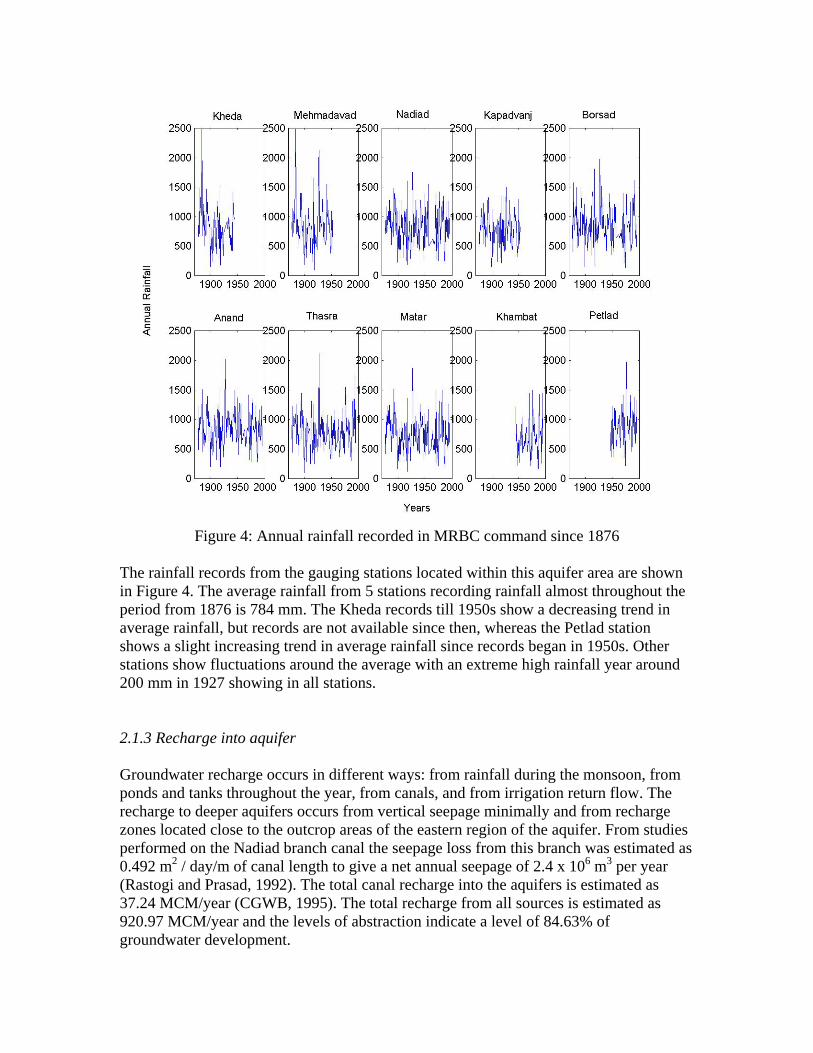
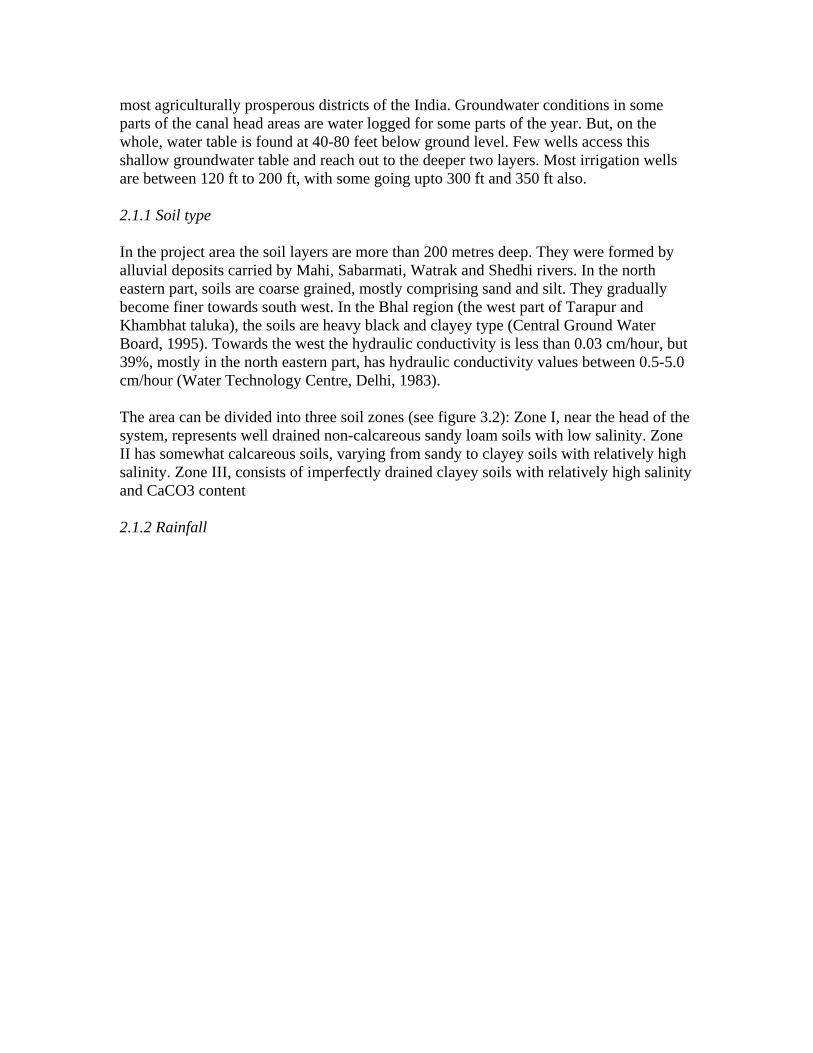
Figure 4: Annual rainfall recorded in MRBC command since 1876
The rainfall records from the gauging stations located within this aquifer area are shown in Figure 4. The average rainfall from 5 stations recording rainfall almost throughout the period from 1876 is 784 mm. The Kheda records till 1950s show a decreasing trend in average rainfall, but records are not available since then, whereas the Petlad station shows a slight increasing trend in average rainfall since records began in 1950s. Other stations show fluctuations around the average with an extreme high rainfall year around 200 mm in 1927 showing in all stations. 2.1.3 Recharge into aquifer Groundwater recharge occurs in different ways: from rainfall during the monsoon, from ponds and tanks throughout the year, from canals, and from irrigation return flow. The recharge to deeper aquifers occurs from vertical seepage minimally and from recharge zones located close to the outcrop areas of the eastern region of the aquifer. From studies performed on the Nadiad branch canal the seepage loss from this branch was estimated as 0.492 m2 / day/m of canal length to give a net annual seepage of 2.4 x 10⁶ m3 per year (Rastogi and Prasad, 1992). The total canal recharge into the aquifers is estimated as 37.24 MCM/year (CGWB, 1995). The total recharge from all sources is estimated as 920.97 MCM/year and the levels of abstraction indicate a level of 84.63% of groundwater development.
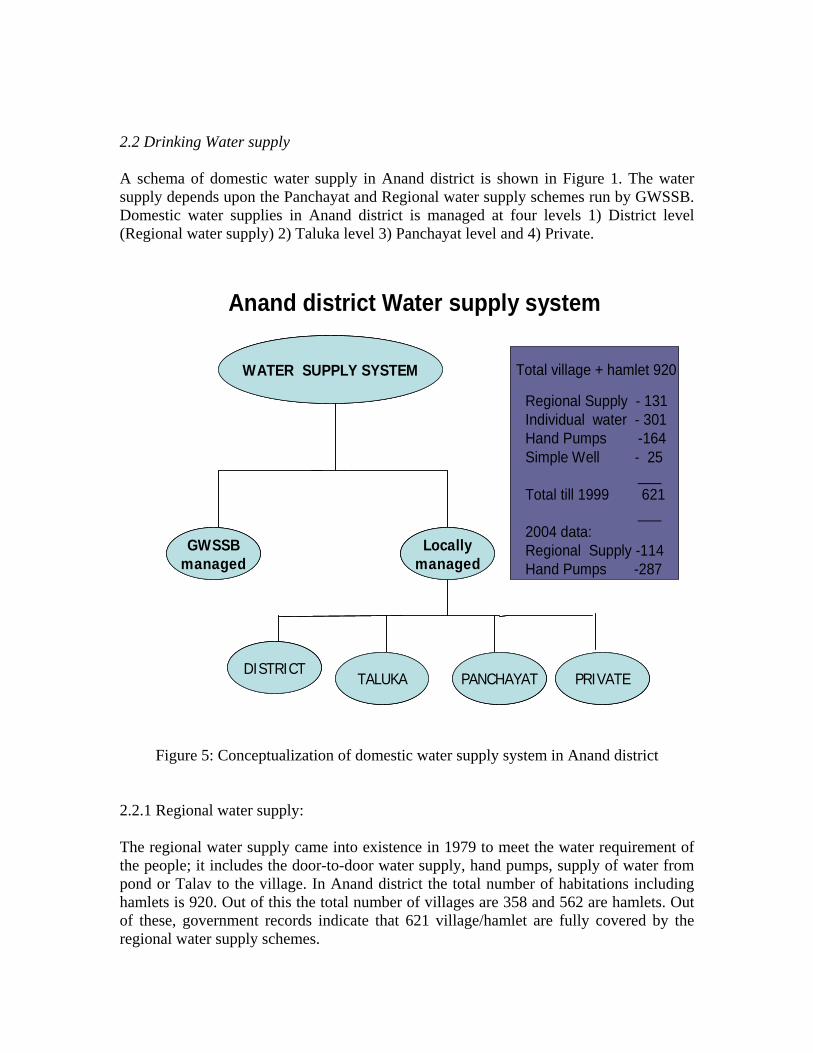
2.2 Drinking Water supply A schema of domestic water supply in Anand district is shown in Figure 1. The water supply depends upon the Panchayat and Regional water supply schemes run by GWSSB. Domestic water supplies in Anand district is managed at four levels 1) District level (Regional water supply) 2) Taluka level 3) Panchayat level and 4) Private.
WATER SUPPLY SYSTEM
GWSSBmanaged
Locallymanaged
DISTRICTTALUKA PANCHAYAT PRIVATE
Anand district Water supply system
Total village + hamlet 920
Regional Supply - 131Individual water - 301Hand Pumps -164Simple Well - 25
___Total till 1999 621
___2004 data:Regional Supply -114Hand Pumps -287
WATER SUPPLY SYSTEM
GWSSBmanaged
Locallymanaged
DISTRICTTALUKA PANCHAYAT PRIVATE
WATER SUPPLY SYSTEM
GWSSBmanaged
Locallymanaged
DISTRICTTALUKA PANCHAYAT PRIVATE
Figure 5: Conceptualization of domestic water supply system in Anand district
2.2.1 Regional water supply: The regional water supply came into existence in 1979 to meet the water requirement of the people; it includes the door-to-door water supply, hand pumps, supply of water from pond or Talav to the village. In Anand district the total number of habitations including hamlets is 920. Out of this the total number of villages are 358 and 562 are hamlets. Out of these, government records indicate that 621 village/hamlet are fully covered by the regional water supply schemes.
The Regional water supply in Anand district is mainly managed by three sources namely Vank Talav Regional water supply scheme, Gorad Regional water supply scheme and Milrampura Regional water supply scheme. Vank Talav Regional water supply scheme comes under the Tarapur Taluka, from where water is treated in the water treatment plant and then supplied to different villages. From Vank Talav Regional water supply scheme a total of 18 villages get water in the areas. The Gorad Regional water supply scheme come under Tarapur Taluka , from this water supply scheme a total of 20 villages get supply water. The Milrampura Regional water supply scheme, operating for the past 30 years , covers the Khambhat and Tarapur Taluka. Water is supplied to the different part of Khambhat and Tarapur Taluka. Regional water supply scheme. Milrampura Regional supply water provides there services from the last 30 years. About, 301 villages are covered with the individual water supply supported by regional water supply. A total no of 164 village is covered by hand pumps, and only 25 village is covered with simple well. Out of 8 Taluka of Anand district 287 villages including 164 villages is covered by the hand pumps till 2002 (data provided by the GWSSB Anand). A total no of 1852 hand pumps was installed by the GWSSB in these villages, with an average of 6 hand pumps in each village and hamlet. 2.2.2 Panchayat Based Supply The water supply in the rural areas is mainly based on Panchayat based bore well. Local Panchayat of the particular areas have the entire responsibilities of water supply in the villages, primarily in the main part of the village which does not include the surrounding hamlets. Ground water is pumped and collected in the overhead tank from where water is supplied to the entire village. In the tank, water is generally treated by using chlorine powder mostly during monsoon; the entire responsibility of treating water is entrusted upon the local Panchayat. Through the tank, water is supplied through pipeline which in the best case would have a door-to-door connection throughout the village. The pipeline system within the village is constructed by the local panchayat. Several stand posts are also provided by the Panchayat so that poor people who does not have pipeline connection can fetch their drinking water from the stand posts. The local Panchayat has power to collect water tax from the villagers. The Panchayat sets a marginal price to pay as water tax. The villagers have to pay water tax per year collectively. The Local Panchayat is also utilizes funds from the local MLA and MP for proper operation of water supply. This fund is mainly used for the drilling of hand pumps and bore wells in the village. This fund is generally used in the several hamlets of the village
where door–to-door connectivity of pipeline has not yet reached or is unreachable due to geographical factors.
These local water supply systems suffered from the following problems: - Lowering of water levels and drying up the community water sources - Burning of the motors and other mechanical failures - Leakages in taps and mechanical failure - Improper maintenance
The entire responsibilities of operation and maintenance of drinking water supply is in the hand of the local Panchayat. The local Panchayat maintains the operation and maintenance using the tax paid by the villagers and the fund by the local MP and MLA. Due to shortage of adequate funds and technical manpower with the village Panchayat, crises situations became common. In such situations, rural people depended upon the village ponds for domestic water uses including human consumption. Water from this natural water system is often contaminated by human and animal wastes. These leads to the several health risks in the form of water-diseases such as Cholera, Diarrhea and Jaundice. 2.2.3 Private Supply of water In the study area, water supply to the villagers not only depends upon the government sector, but several NGOs and Non-Resident Indians (NRIs) help to provide pure drinking water in the villages. This type of organization not only provides the infrastructure facility for water supply in the villages but also the entire responsibility of operation and maintenance of the water supply system and also the overhead storage tank is carried out by this organization itself. Several NRIs have deposited money in the bank which is further used in the payment of water tax for the villagers. 3. Addressing post-flood biological contamination of well-water Frequent epidemics, especially during monsoon are a common aspect of the southern and central parts of Gujarat. This region is endemic to various water-borne diseases such as Cholera, Leptospirosis and Malaria. Several relatively minor ailments such as Diarrhoea are more common during the monsoon. There were extreme rainfall events in South and Central Gujarat in the early part of July, 2006. In certain parts of Anand district, there was rainfall of 800 mm in a span of 2 days that is almost close to the long-time annual average for this area. There have been similar rainfall events of this magnitude in the past perhaps occurring once in 20-30 years. The concentration of rainfall in a few days compounded with land-use changes occurring rapidly contributed to large water-logging and disruption of daily life. Most importantly, there is always a danger of epidemics breaking out after such floods arising due to different factors – inundation of wells under
contaminated sewage water, wading through such flooded water. There is contamination of groundwater as well as well-water in such circumstances. Well water can be contaminated directly when sewage water enters the well during inundation. Groundwater can become contaminated when sewage water seeps through the aquifer that is especially fast during saturated conditions. Therefore, even deep sources of water cannot be trusted to be safe from biological contamination during such times. Anand-based research-cum-action NGO, Foundation for Ecological Security (FES) coordinated relief efforts during and after the floods in Anand and Kheda districts of Gujarat. Several researchers from the IWMI-Tata program (ITP) attended an initial coordination meeting held in the FES campus on 2nd July. This meeting was attended by representatives from several NGOs and individuals interested in volunteering for relief efforts. During this meeting, it came out that drinking water is an urgent need in flood-affected areas and there is indication of diseases breaking out due to the floods. With our prior interest on this problem, the ITP team felt that a good contribution that can be made for this relief effort would be to assess the level of contamination in well-water and see how the drinking water problem in such places can be addressed. Our objectives were: 1. To obtain a regional picture of contamination of well-water in flood affected areas, 2. Suggest alternatives to those affected by such contamination Taking into account the urgency, we went to the second objective directly in the form of creating and distributing an awareness poster for proper precaution to be taken. In this, we were assisted by Dr. Balachandani (local medical practitioner) and Dr Vashisht (District Medical Officer) who gave their recommendations for practical suggestions. This awareness poster was printed in Gujarati and English language newspapers in the area. A copy in English is attached in the Appendix. The poster was also made available to FES teams that spanned across the affected areas. To address objective 1., we started forming the network of institutions that would be necessary to coordinate our quick assessment effectively. Here different nodes of our network are listed: 1. Overall Coordination: ITP team 2. Data collection and awareness: FES and field team 3. Water quality testing: BVM College and Karamsad Medical 4. Medical advice: Karamsad Medical, Dr Balachandani and Dr Vashisht The process cycle that was set in place is described below: Step 1: ITP team gathers clean water bottles, provides labels and instruction for data collection to FES staff along with awareness posters (Day 0) Step 2: FES staff collects water samples from their field visits and returns it to ITP team along with some basic data on the sample such as source and depth. (Day 1)
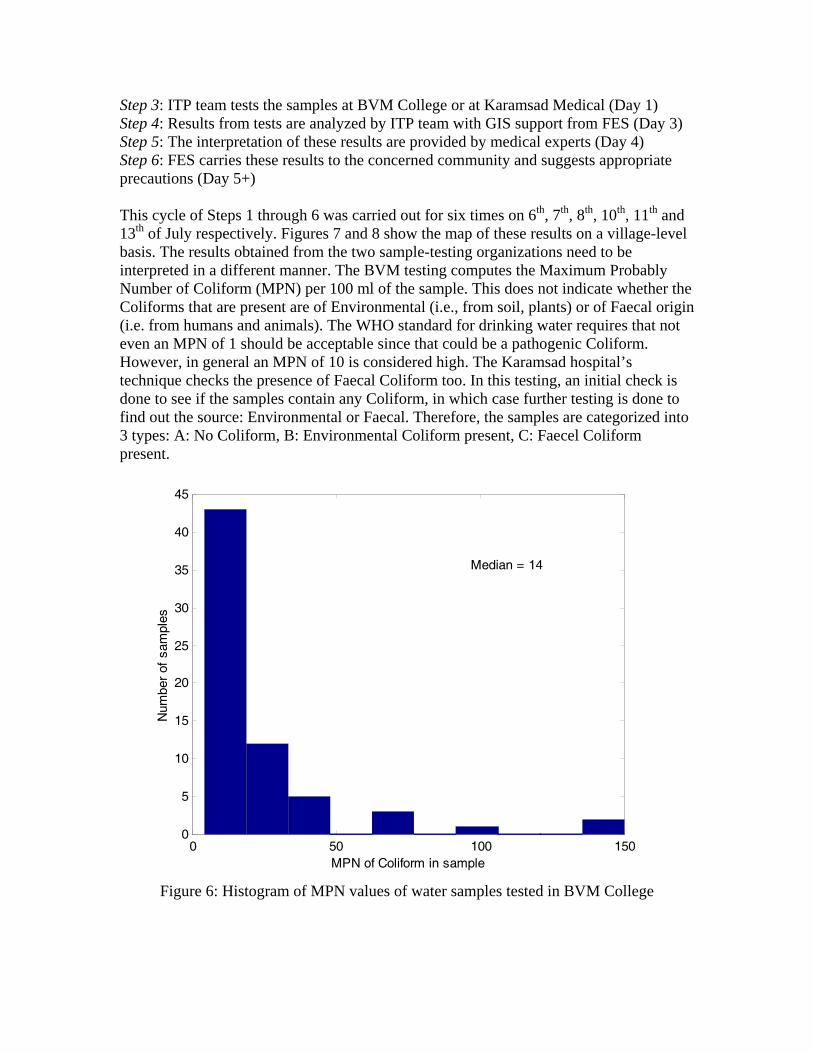
Step 3: ITP team tests the samples at BVM College or at Karamsad Medical (Day 1) Step 4: Results from tests are analyzed by ITP team with GIS support from FES (Day 3) Step 5: The interpretation of these results are provided by medical experts (Day 4) Step 6: FES carries these results to the concerned community and suggests appropriate precautions (Day 5+) This cycle of Steps 1 through 6 was carried out for six times on 6th, 7th, 8th, 10th, 11th and 13th of July respectively. Figures 7 and 8 show the map of these results on a village-level basis. The results obtained from the two sample-testing organizations need to be interpreted in a different manner. The BVM testing computes the Maximum Probably Number of Coliform (MPN) per 100 ml of the sample. This does not indicate whether the Coliforms that are present are of Environmental (i.e., from soil, plants) or of Faecal origin (i.e. from humans and animals). The WHO standard for drinking water requires that not even an MPN of 1 should be acceptable since that could be a pathogenic Coliform. However, in general an MPN of 10 is considered high. The Karamsad hospital’s technique checks the presence of Faecal Coliform too. In this testing, an initial check is done to see if the samples contain any Coliform, in which case further testing is done to find out the source: Environmental or Faecal. Therefore, the samples are categorized into 3 types: A: No Coliform, B: Environmental Coliform present, C: Faecel Coliform present.
0 50 100 1500
5
10
15
20
25
30
35
40
45
MPN of Coliform in sample
Num
ber
of s
ampl
es
Median = 14
Figure 6: Histogram of MPN values of water samples tested in BVM College
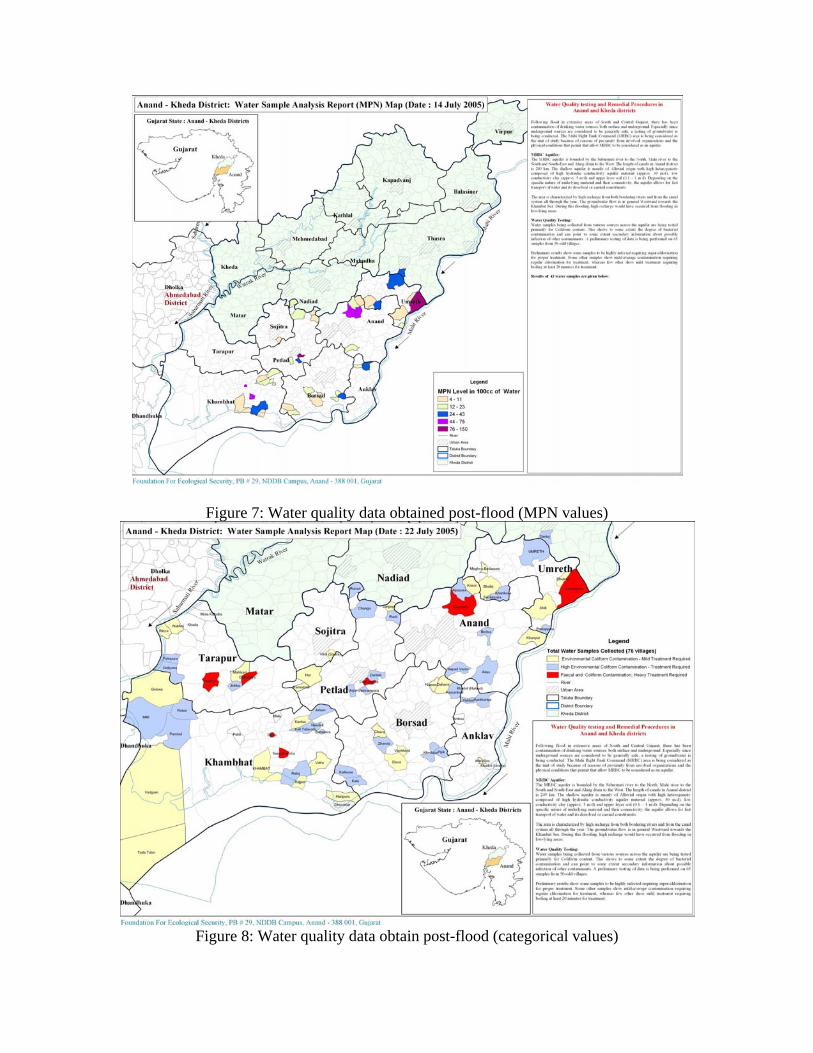
Figure 7: Water quality data obtained post-flood (MPN values)
Figure 8: Water quality data obtain post-flood (categorical values)
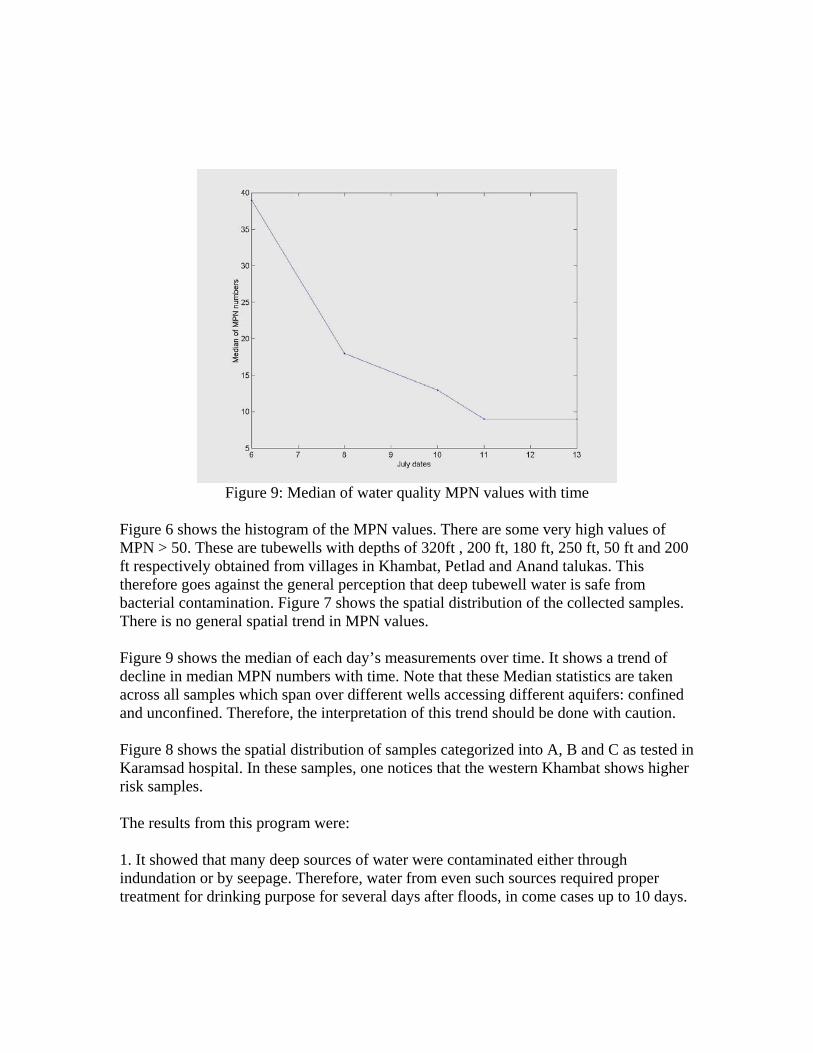
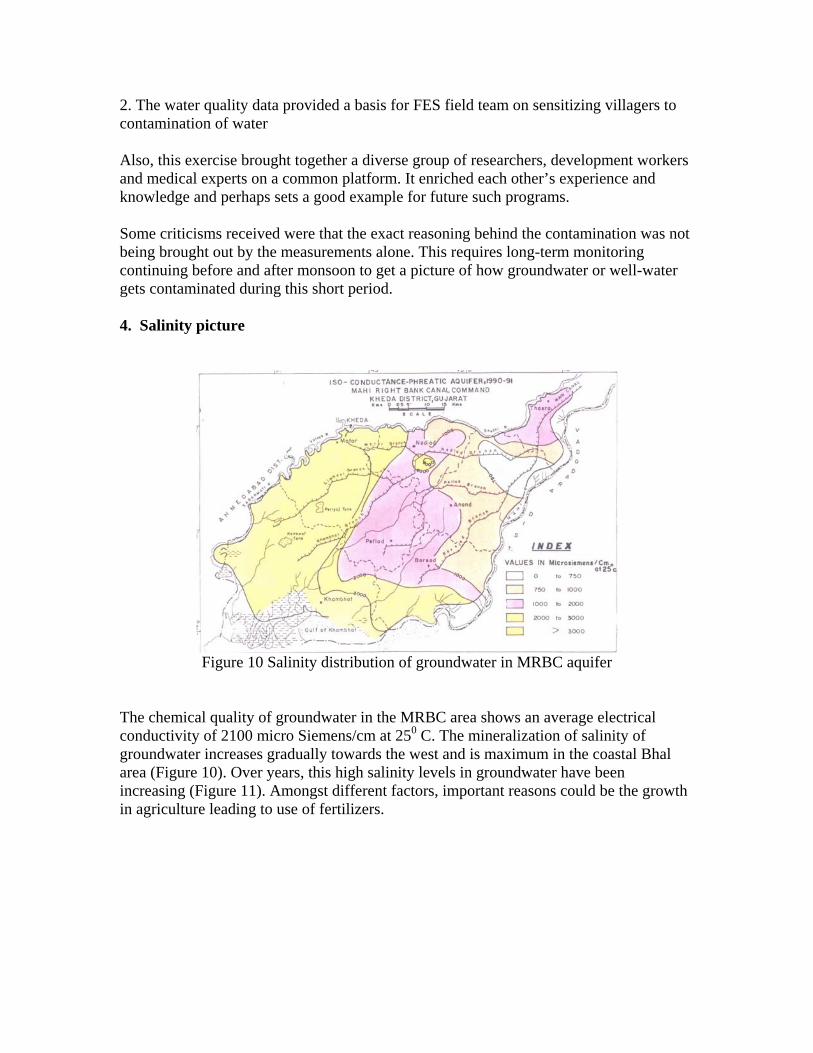
Figure 9: Median of water quality MPN values with time
Figure 6 shows the histogram of the MPN values. There are some very high values of MPN > 50. These are tubewells with depths of 320ft , 200 ft, 180 ft, 250 ft, 50 ft and 200 ft respectively obtained from villages in Khambat, Petlad and Anand talukas. This therefore goes against the general perception that deep tubewell water is safe from bacterial contamination. Figure 7 shows the spatial distribution of the collected samples. There is no general spatial trend in MPN values. Figure 9 shows the median of each day’s measurements over time. It shows a trend of decline in median MPN numbers with time. Note that these Median statistics are taken across all samples which span over different wells accessing different aquifers: confined and unconfined. Therefore, the interpretation of this trend should be done with caution. Figure 8 shows the spatial distribution of samples categorized into A, B and C as tested in Karamsad hospital. In these samples, one notices that the western Khambat shows higher risk samples. The results from this program were: 1. It showed that many deep sources of water were contaminated either through indundation or by seepage. Therefore, water from even such sources required proper treatment for drinking purpose for several days after floods, in come cases up to 10 days.
2. The water quality data provided a basis for FES field team on sensitizing villagers to contamination of water Also, this exercise brought together a diverse group of researchers, development workers and medical experts on a common platform. It enriched each other’s experience and knowledge and perhaps sets a good example for future such programs. Some criticisms received were that the exact reasoning behind the contamination was not being brought out by the measurements alone. This requires long-term monitoring continuing before and after monsoon to get a picture of how groundwater or well-water gets contaminated during this short period. 4. Salinity picture
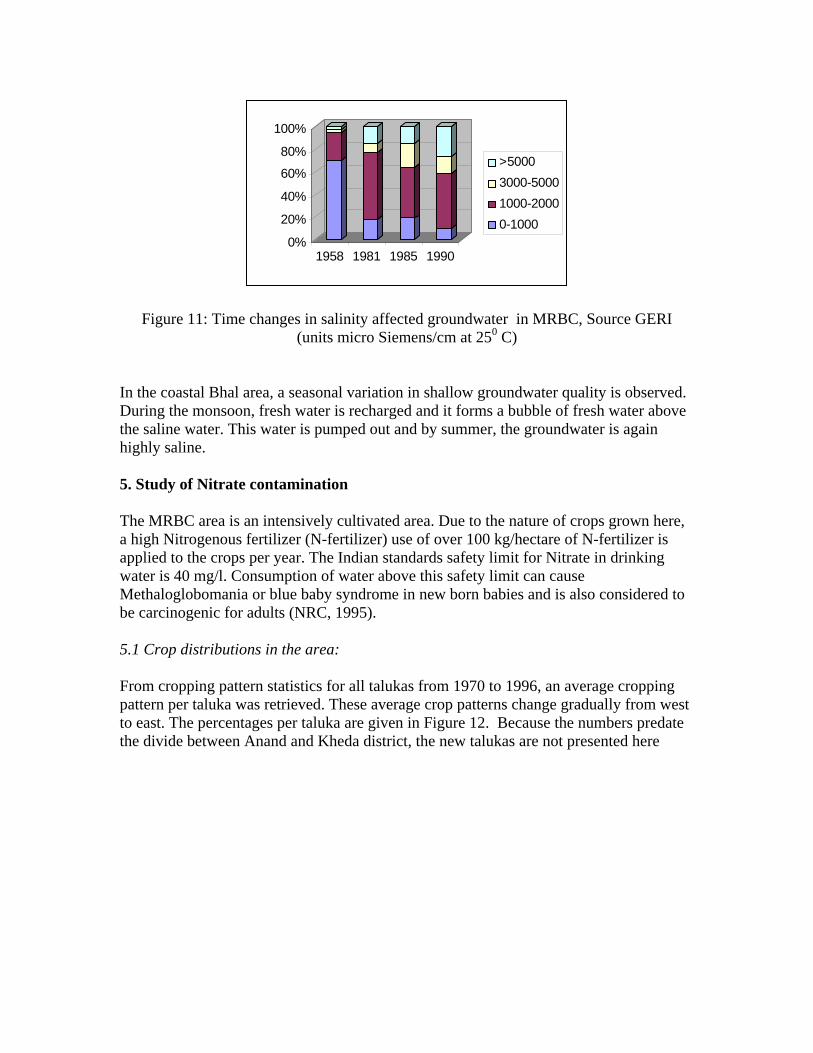
Figure 10 Salinity distribution of groundwater in MRBC aquifer
The chemical quality of groundwater in the MRBC area shows an average electrical conductivity of 2100 micro Siemens/cm at 250 C. The mineralization of salinity of groundwater increases gradually towards the west and is maximum in the coastal Bhal area (Figure 10). Over years, this high salinity levels in groundwater have been increasing (Figure 11). Amongst different factors, important reasons could be the growth in agriculture leading to use of fertilizers.
0%
20%
40%
60%
80%
100%
1958 1981 1985 1990
>50003000-50001000-20000-1000
Figure 11: Time changes in salinity affected groundwater in MRBC, Source GERI (units micro Siemens/cm at 250 C)
In the coastal Bhal area, a seasonal variation in shallow groundwater quality is observed. During the monsoon, fresh water is recharged and it forms a bubble of fresh water above the saline water. This water is pumped out and by summer, the groundwater is again highly saline. 5. Study of Nitrate contamination
The MRBC area is an intensively cultivated area. Due to the nature of crops grown here, a high Nitrogenous fertilizer (N-fertilizer) use of over 100 kg/hectare of N-fertilizer is applied to the crops per year. The Indian standards safety limit for Nitrate in drinking water is 40 mg/l. Consumption of water above this safety limit can cause Methaloglobomania or blue baby syndrome in new born babies and is also considered to be carcinogenic for adults (NRC, 1995). 5.1 Crop distributions in the area: From cropping pattern statistics for all talukas from 1970 to 1996, an average cropping pattern per taluka was retrieved. These average crop patterns change gradually from west to east. The percentages per taluka are given in Figure 12. Because the numbers predate the divide between Anand and Kheda district, the new talukas are not presented here
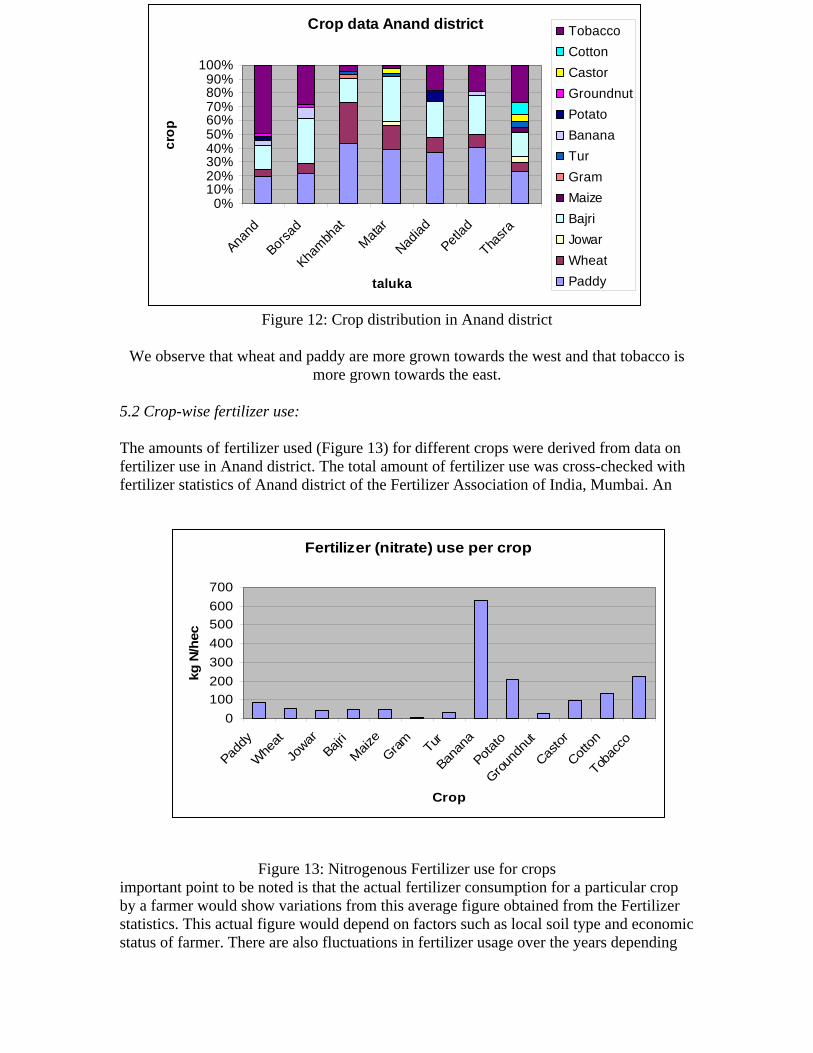
Figure 12: Crop distribution in Anand district
We observe that wheat and paddy are more grown towards the west and that tobacco is more grown towards the east.
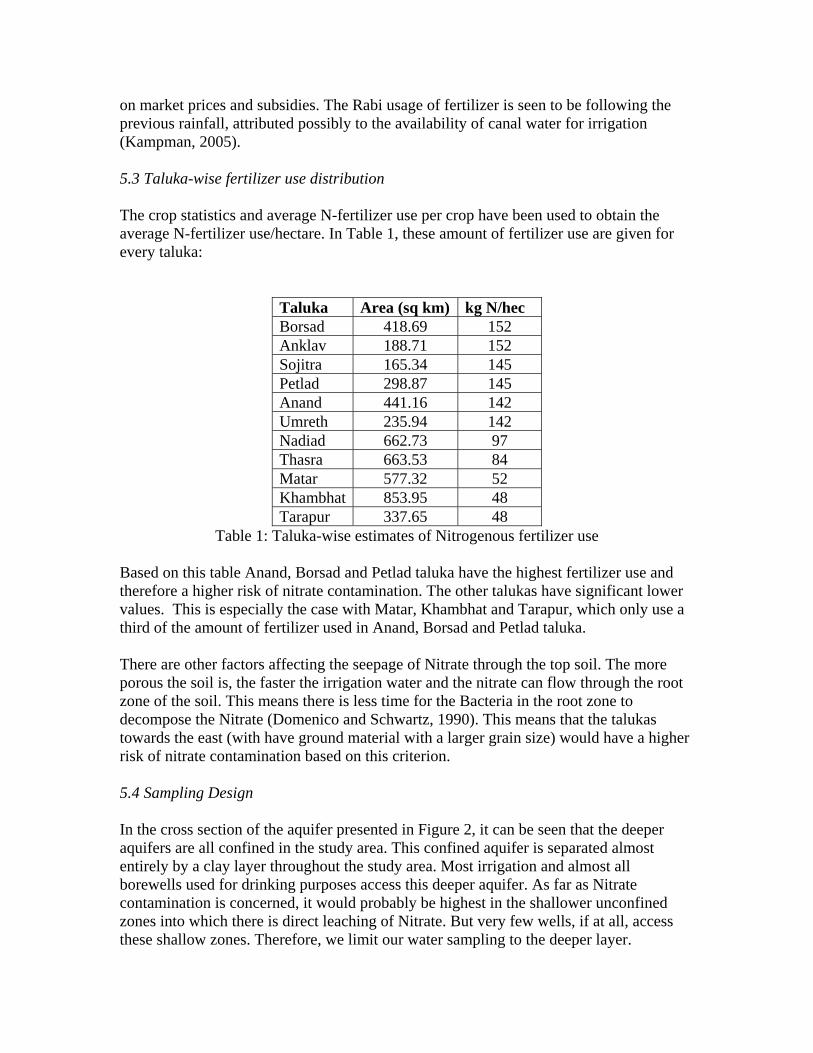
5.2 Crop-wise fertilizer use: The amounts of fertilizer used (Figure 13) for different crops were derived from data on fertilizer use in Anand district. The total amount of fertilizer use was cross-checked with fertilizer statistics of Anand district of the Fertilizer Association of India, Mumbai. An
Figure 13: Nitrogenous Fertilizer use for crops important point to be noted is that the actual fertilizer consumption for a particular crop by a farmer would show variations from this average figure obtained from the Fertilizer statistics. This actual figure would depend on factors such as local soil type and economic status of farmer. There are also fluctuations in fertilizer usage over the years depending
Crop data Anand district
0%10%20%30%40%50%60%70%80%90%
100%
Anand
Borsad
Khambh
atMata
r
Nadiad
Petlad
Thasra
taluka
crop
TobaccoCottonCastorGroundnutPotatoBananaTurGramMaizeBajriJowarWheatPaddy
Fertilizer (nitrate) use per crop
0100200300400500600700
Paddy
Whe
at
Jowar
Bajri
Maize
Gram Tur
Banan
a
Potato
Ground
nut
Castor
Cotton
Tobac
co
Crop
kg N
/hec
on market prices and subsidies. The Rabi usage of fertilizer is seen to be following the previous rainfall, attributed possibly to the availability of canal water for irrigation (Kampman, 2005). 5.3 Taluka-wise fertilizer use distribution The crop statistics and average N-fertilizer use per crop have been used to obtain the average N-fertilizer use/hectare. In Table 1, these amount of fertilizer use are given for every taluka:
Taluka Area (sq km) kg N/hec Borsad 418.69 152 Anklav 188.71 152 Sojitra 165.34 145 Petlad 298.87 145 Anand 441.16 142 Umreth 235.94 142 Nadiad 662.73 97 Thasra 663.53 84 Matar 577.32 52 Khambhat 853.95 48 Tarapur 337.65 48
Table 1: Taluka-wise estimates of Nitrogenous fertilizer use Based on this table Anand, Borsad and Petlad taluka have the highest fertilizer use and therefore a higher risk of nitrate contamination. The other talukas have significant lower values. This is especially the case with Matar, Khambhat and Tarapur, which only use a third of the amount of fertilizer used in Anand, Borsad and Petlad taluka. There are other factors affecting the seepage of Nitrate through the top soil. The more porous the soil is, the faster the irrigation water and the nitrate can flow through the root zone of the soil. This means there is less time for the Bacteria in the root zone to decompose the Nitrate (Domenico and Schwartz, 1990). This means that the talukas towards the east (with have ground material with a larger grain size) would have a higher risk of nitrate contamination based on this criterion. 5.4 Sampling Design In the cross section of the aquifer presented in Figure 2, it can be seen that the deeper aquifers are all confined in the study area. This confined aquifer is separated almost entirely by a clay layer throughout the study area. Most irrigation and almost all borewells used for drinking purposes access this deeper aquifer. As far as Nitrate contamination is concerned, it would probably be highest in the shallower unconfined zones into which there is direct leaching of Nitrate. But very few wells, if at all, access these shallow zones. Therefore, we limit our water sampling to the deeper layer.
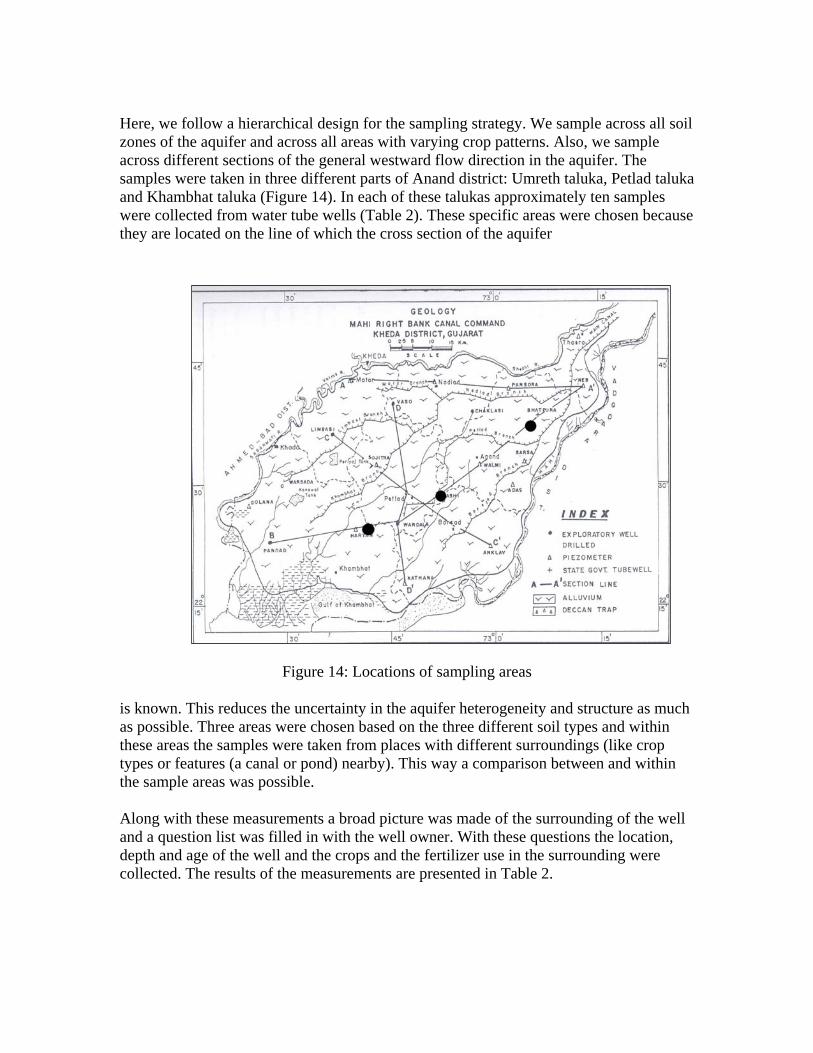
Here, we follow a hierarchical design for the sampling strategy. We sample across all soil zones of the aquifer and across all areas with varying crop patterns. Also, we sample across different sections of the general westward flow direction in the aquifer. The samples were taken in three different parts of Anand district: Umreth taluka, Petlad taluka and Khambhat taluka (Figure 14). In each of these talukas approximately ten samples were collected from water tube wells (Table 2). These specific areas were chosen because they are located on the line of which the cross section of the aquifer
Figure 14: Locations of sampling areas
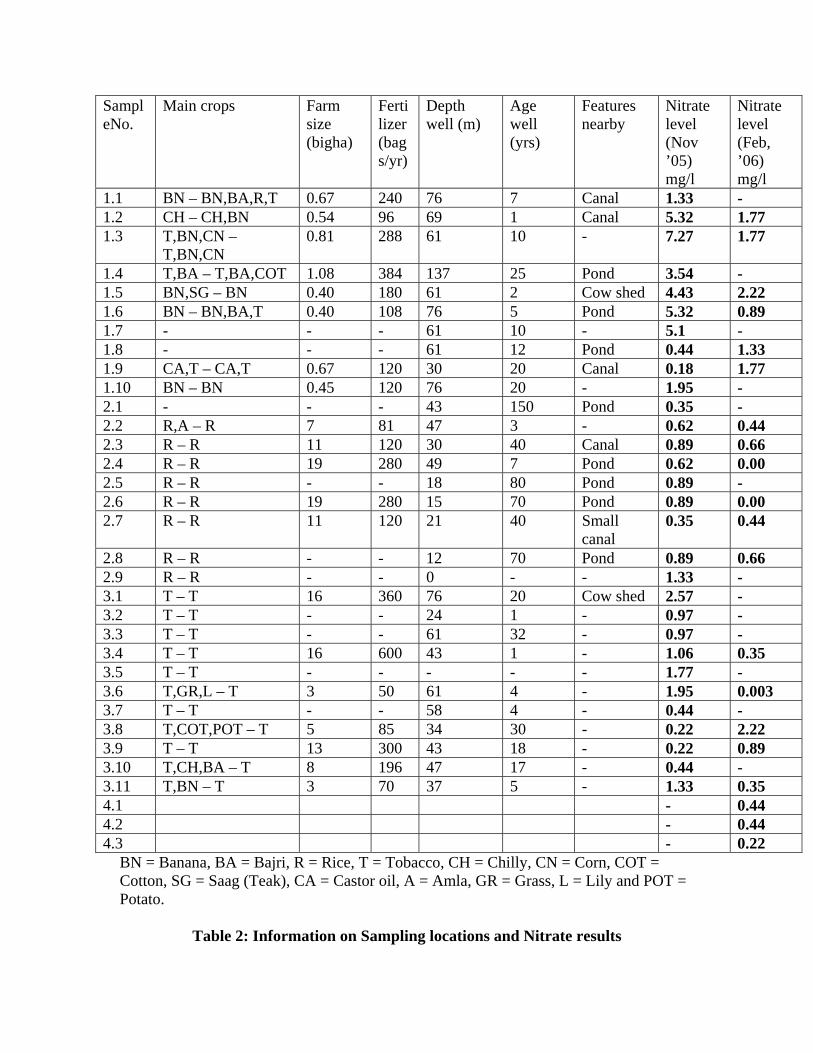
is known. This reduces the uncertainty in the aquifer heterogeneity and structure as much as possible. Three areas were chosen based on the three different soil types and within these areas the samples were taken from places with different surroundings (like crop types or features (a canal or pond) nearby). This way a comparison between and within the sample areas was possible. Along with these measurements a broad picture was made of the surrounding of the well and a question list was filled in with the well owner. With these questions the location, depth and age of the well and the crops and the fertilizer use in the surrounding were collected. The results of the measurements are presented in Table 2.
SampleNo.
Main crops Farm size (bigha)
Fertilizer (bags/yr)
Depth well (m)
Age well (yrs)
Features nearby
Nitrate level (Nov ’05) mg/l
Nitrate level (Feb, ’06) mg/l
1.1 BN – BN,BA,R,T 0.67 240 76 7 Canal 1.33 - 1.2 CH – CH,BN 0.54 96 69 1 Canal 5.32 1.77 1.3 T,BN,CN –
T,BN,CN 0.81 288 61 10 - 7.27 1.77
1.4 T,BA – T,BA,COT 1.08 384 137 25 Pond 3.54 - 1.5 BN,SG – BN 0.40 180 61 2 Cow shed 4.43 2.22 1.6 BN – BN,BA,T 0.40 108 76 5 Pond 5.32 0.89 1.7 - - - 61 10 - 5.1 - 1.8 - - - 61 12 Pond 0.44 1.33 1.9 CA,T – CA,T 0.67 120 30 20 Canal 0.18 1.77 1.10 BN – BN 0.45 120 76 20 - 1.95 - 2.1 - - - 43 150 Pond 0.35 - 2.2 R,A – R 7 81 47 3 - 0.62 0.44 2.3 R – R 11 120 30 40 Canal 0.89 0.66 2.4 R – R 19 280 49 7 Pond 0.62 0.00 2.5 R – R - - 18 80 Pond 0.89 - 2.6 R – R 19 280 15 70 Pond 0.89 0.00 2.7 R – R 11 120 21 40 Small
canal 0.35 0.44
2.8 R – R - - 12 70 Pond 0.89 0.66 2.9 R – R - - 0 - - 1.33 - 3.1 T – T 16 360 76 20 Cow shed 2.57 - 3.2 T – T - - 24 1 - 0.97 - 3.3 T – T - - 61 32 - 0.97 - 3.4 T – T 16 600 43 1 - 1.06 0.35 3.5 T – T - - - - - 1.77 - 3.6 T,GR,L – T 3 50 61 4 - 1.95 0.003 3.7 T – T - - 58 4 - 0.44 - 3.8 T,COT,POT – T 5 85 34 30 - 0.22 2.22 3.9 T – T 13 300 43 18 - 0.22 0.89 3.10 T,CH,BA – T 8 196 47 17 - 0.44 - 3.11 T,BN – T 3 70 37 5 - 1.33 0.35 4.1 - 0.44 4.2 - 0.44 4.3 - 0.22
BN = Banana, BA = Bajri, R = Rice, T = Tobacco, CH = Chilly, CN = Corn, COT = Cotton, SG = Saag (Teak), CA = Castor oil, A = Amla, GR = Grass, L = Lily and POT = Potato.
Table 2: Information on Sampling locations and Nitrate results
In general the values are very low (0 to 7 mg/L). This possibly shows that there is very less vertical seepage from the top shallow aquifers which would contain higher concentrations of Nitrate into these deeper confined layers. The nitrate levels that were found all fall within the boundaries of how much nitrate natural water can contain (< 10 mg/L). So there is no sign of nitrate contamination due to agricultural sources in the deeper aquifer. In general, the second set of measurements taken in February, 2006 show lower values than the first set of measurements. The difference between the areas The difference between the three sample locations is quite significant. The samples taken from Petlad are the highest (up to more than 7 mg/L). This is followed by Umreth area, which has much lower nitrate levels (up to almost 3 mg/L). And the samples from Khambhat area have the lowest values (not more than 1.3 mg/L). These results support the preliminary analysis, which points out that Petlad (together with Anand and Borsad) have the highest use of fertilizer in the area. Also the soil type supports this result (the hydraulic conductivity in towards the west is lower in clay-dominated areas and thus more degradation of nitrates by bacteria in the top soil zone results in lesser nitrates leaching). 6. Synthesis and future recommendations The MRBC aquifer shows an increase in salinity levels over the years, but this does not show up in the Nitrate levels from deep aquifers. The probable reason could be that the confining clay layer prevents the transport of Nitrates to the lower layers. Further detailed monitoring of shallower groundwater can clear this possibility. During monsoons, there is contamination of well water from bacterial Coliforms. This water is not potable and requires strong treatment such as Chlorination or boiling for more than 10 minutes. This is almost a sure precaution against spread of several water-borne diseases and can prevent the spread of Diarrhoea and Cholera during and after monsoon. In a period of around 10 days from flooding, the bacterial contamination in wells shows signs of declination. The partnership between IWMI, FES and some medical practitioners led to a water sampling and awareness program after the flood. This partnership can be developed further into a long term monitoring of the aquifer and taking the results of these studies to the users as done here. Apart from these, there are potential risks in this area coming from earlier pesticide use. These need to be assessed with future studies. One important contaminant ignored in this study has been that of possible fluoride contamination in this aquifer. The reason has been that in these areas, one does not observe significant incidences of Fluorosis. However, GWSSB data indicates that there are some pockets in central parts of Anand district in Borsad and Petlad talukas with fluoride levels higher than 1 mg/l. In some other areas close to Thasra, there are villages which suffer from skin afflictions suspected
to be due to water. Such reports need to be further investigated and seen if they are linked with water quality. The well water sampling network chosen here samples across various factors such as soil type, crops and aquifer flow direction. This network can be used to fix a longer term monitoring for observing quality changes in this aquifer. Comparing the groundwater quality of the MRBC aquifer with several other aquifers in Gujarat, it can be seen that the MRBC aquifer is relatively in a better quality from the existing data on water quality. Apart from high salinity and TDS, other parameters seem to be within WHO safety limits. Any further planning of industries should accompany proper treatment of waste so that this quality is maintained. The domestic water requirement of almost all population living here is dependant on groundwater. It is imperative that the quality remains to safe. Acknowledgements The authors thank Foundation for Ecological Security (FES) for help in collecting data and participating in the other studies conducted for this paper. We thank Central Groundwater Board (CGWB), Ahmedabad for sharing their relevant reports with us. Several members of the ITP team were involved in coordinated the flood water sampling study: Dr. Rajnarayan Indu, Nirmalya Choudhary, Amrita Sharma, Shilp Verma. We thank Karamsad hospital, BVM Engineering College and Dr. Balchandani for using their facilities and for guidance. Also we thank Dr. Vashisht, District Medical Officer, for his information on incidences of diseases in the study areas. REFERENCES Agarwal G. D., S. K. Lunkad and T. Malkhed, 1999, Diffuse Agricultural Nitrate Pollution of Groundwaters in India, Water Science Technology, Vol. 39, pp. 67-75 CGWB, Studies on Conjunctive Use of Surface Water and Groundwater Resources in Mahi-Kadana Irrigation Project, Gujarat, 1995 Domenico, P.A., and F.W. Schwartz, 1990. Physical and Chemical Hydrogeology. John Wiley & Sons, New York. Kampman, D., 2005, Nitrate Contamination in Mahi Right Bank Canal Aquifer, Anand district, Intern Report submitted to IWMI-Tata Water Policy Programme Kumar, D., 2005, Rural Water Supply and Sanitation in Gujarat: sector assessment study, report submitted to WASMO, Government of Gujarat NRC, 1995, Nitrate and Nitrite in Drinking water, Subcommittee on Nitrate and Nitrite in Drinking Water, Committee on Toxicology, National Research Council

Rastogi, A. K. and B. Prasad, 1992, FEM Modeling to investigate seepage losses from the lined Nadiad branch canal, India, Journal of Hydrology, 138, Pg. 153-168
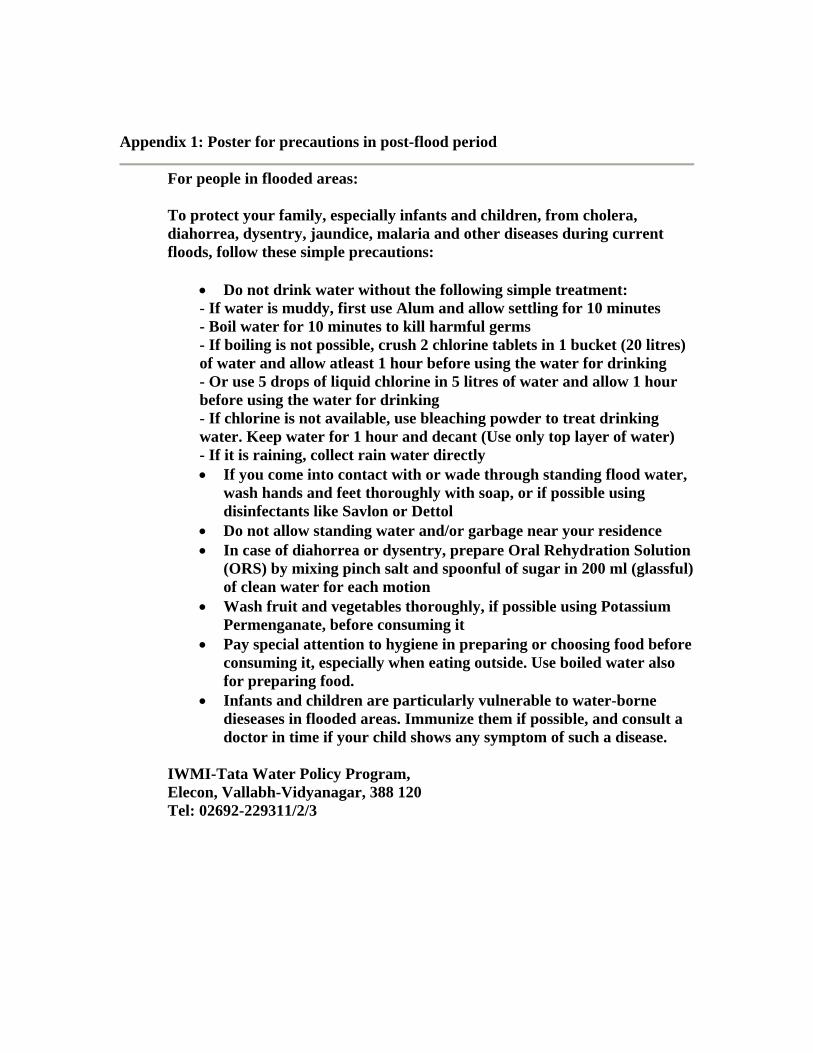
Appendix 1: Poster for precautions in post-flood period
For people in flooded areas: To protect your family, especially infants and children, from cholera, diahorrea, dysentry, jaundice, malaria and other diseases during current floods, follow these simple precautions:
• Do not drink water without the following simple treatment: - If water is muddy, first use Alum and allow settling for 10 minutes - Boil water for 10 minutes to kill harmful germs - If boiling is not possible, crush 2 chlorine tablets in 1 bucket (20 litres) of water and allow atleast 1 hour before using the water for drinking - Or use 5 drops of liquid chlorine in 5 litres of water and allow 1 hour before using the water for drinking - If chlorine is not available, use bleaching powder to treat drinking water. Keep water for 1 hour and decant (Use only top layer of water) - If it is raining, collect rain water directly • If you come into contact with or wade through standing flood water,
wash hands and feet thoroughly with soap, or if possible using disinfectants like Savlon or Dettol
• Do not allow standing water and/or garbage near your residence • In case of diahorrea or dysentry, prepare Oral Rehydration Solution
(ORS) by mixing pinch salt and spoonful of sugar in 200 ml (glassful) of clean water for each motion
• Wash fruit and vegetables thoroughly, if possible using Potassium Permenganate, before consuming it
• Pay special attention to hygiene in preparing or choosing food before consuming it, especially when eating outside. Use boiled water also for preparing food.
• Infants and children are particularly vulnerable to water-borne dieseases in flooded areas. Immunize them if possible, and consult a doctor in time if your child shows any symptom of such a disease.
IWMI-Tata Water Policy Program, Elecon, Vallabh-Vidyanagar, 388 120 Tel: 02692-229311/2/3