GROUND-WATER HYDROLOGY - IN.gov · Ground-Water Hydrology 21 unconsolidated aquifer. The annual...
25
Ground-Water Hydrology 19 GROUND-WATER HYDROLOGY Ground-water supplies are obtained from aquifers, which are subsurface units of rock and unconsolidated sediments capable of yielding water in usable quantities to wells and springs. The hydrologic characteristics of aquifers and natur- al chemistry of ground water determine the availability and suitability of ground-water resources for specific uses. Ground-Water Resources Ground water is the part of precipitation that enters the ground and percolates downward through unconsolidated materials and openings in bedrock until it reaches the water table (figure 8). The water table is the surface below which all openings in the rock or unconsolidated materials are filled with water. Water entering this zone of saturation is called recharge. Ground water, in response to gravity, moves from areas of recharge to areas of discharge. In a general way, the configu- ration of the water table approximates the overlying topogra- phy (figure 8). In valleys and depressions where the land sur- face intersects the water table, water is discharged from the ground-water system to become part of the surface-water sys- tem. The interaction between ground water and surface water can moderate seasonal water-level fluctuations in both sys- tems. During dry periods base flow, or ground-water dis- charge to streams, can help maintain minimum stream flows. Conversely, during flood stages surface water can recharge the ground-water system by vertical recharge on the water- covered flood plain and bank storage through streambed sed- iments. The net effect of ground-water recharge is a reduction in flood peaks and replenishment of available ground-water supplies. Aquifer properties that affect ground-water availability include aquifer thickness and the size, number, and degree of interconnection of pore spaces within the aquifer material. These properties affect the ability of an aquifer to store and transmit ground water. Porosity, the ratio of void space to unit volume of rock or soil, is an index of how much ground water the aquifer can store. Permeability, a property largely con- trolled by size and interconnection of pore spaces within the material, affects the fluid-transmitting capacity of materials. The water-transmitting characteristics of an aquifer are expressed as hydraulic conductivity and transmissivity. Hydraulic conductivity is a measure of the rate that water will move through an aquifer; it is usually expressed in gallons per day through a cross section of one square foot under a unit hydraulic gradient. Transmissivity is equal to the hydraulic conductivity multiplied by the saturated thickness of the aquifer. The storage characteristic of an aquifer is expressed as the storage coefficient. Pore spaces in bedrock occur as fractures, solution features, and/or openings between grains composing the rock. In unconsolidated deposits all of the pores are intergranular. However, fine-grained deposits such as clays and silts may also have secondary porosity, commonly in the form of frac- tures. The size, shape, and sorting of material determine the amount and interconnection of intergranular pores. Sand and gravel deposits have a high proportion of pore space and high permeability; whereas, fine-grained or clay-rich deposits have a greater proportion of pores, but a lower degree of per- meability. Aquifers have porosity and permeability sufficient to absorb, store, and transmit water in usable quantities. Aquitards consist of materials with low permeability that restrict ground-water movement. An aquitard overlying an aquifer may limit the recharge to the aquifer but may also pro- tect the aquifer from surface contamination. Where an aquitard overlies an aquifer, the water in the aquifer is said to be confined because the aquitard prevents or restricts upward movement of water from the aquifer. Such an aquifer is referred to as a confined or artesian aquifer. Water in confined aquifers exists under hydrostatic pressure that exceeds atmospheric pressure; and wells completed in confined aquifers have water levels that rise above the water- bearing formation until the local hydrostatic pressure in the well is equal to the atmospheric pressure. Such wells may or may not be flowing wells (figure 8). A measure of the pressure of water in a confined aquifer is referred to as the potentio- metric level. In contrast, water in an unconfined aquifer exists under atmospheric pressure; and wells that are completed in such aquifers have water levels that correspond to the local water table. An unconfined aquifer is also referred to as a water table aquifer, and the spatial distribution of water levels in wells in unconfined aquifers is shown on a water table map. Water level maps for confined and unconfined aquifers are typically referred to as potentiometric surface maps. As a well discharges water from an aquifer the water level drops in the well. The drop in water level, which is called drawdown, creates a hydraulic gradient and causes ground water around the well to flow toward the well. If an uncon- fined or confined aquifer is being pumped, an overall lower- ing of either the water table or the potentiometric surface, respectively, occurs around the well. The zone being influ- enced by pumpage is called the cone of depression. An increase in the pumping rate usually creates a larger cone of depression that may induce more recharge to the aquifer. However, the natural rate of recharge to confined aquifers is limited by the thickness and hydraulic properties of the con- fining layers. Ground-water levels The ground-water level within an aquifer fluctuates con- stantly in response to rainfall, evapotranspiration, barometric pressure, ground-water movement (including recharge and dis- charge), and ground-water pumpage. However, the response time for most natural ground-water level fluctuations is con- trolled predominantly by the local and regional geology.
Transcript of GROUND-WATER HYDROLOGY - IN.gov · Ground-Water Hydrology 21 unconsolidated aquifer. The annual...
Ground-Water Hydrology 19
GROUND-WATER HYDROLOGY
Ground-water supplies are obtained from aquifers, whichare subsurface units of rock and unconsolidated sedimentscapable of yielding water in usable quantities to wells andsprings. The hydrologic characteristics of aquifers and natur-al chemistry of ground water determine the availability andsuitability of ground-water resources for specific uses.
Ground-Water Resources
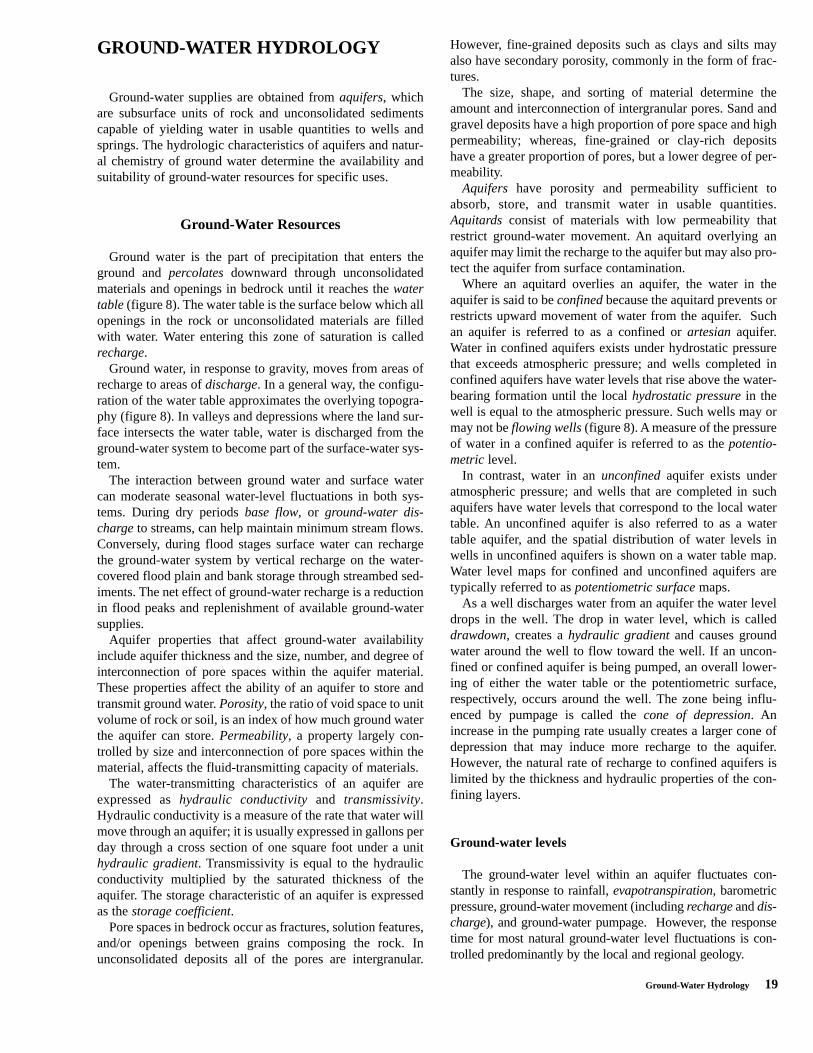
Ground water is the part of precipitation that enters theground and percolates downward through unconsolidatedmaterials and openings in bedrock until it reaches the watertable (figure 8). The water table is the surface below which allopenings in the rock or unconsolidated materials are filledwith water. Water entering this zone of saturation is calledrecharge.
Ground water, in response to gravity, moves from areas ofrecharge to areas of discharge. In a general way, the configu-ration of the water table approximates the overlying topogra-phy (figure 8). In valleys and depressions where the land sur-face intersects the water table, water is discharged from theground-water system to become part of the surface-water sys-tem.
The interaction between ground water and surface watercan moderate seasonal water-level fluctuations in both sys-tems. During dry periods base flow, or ground-water dis-charge to streams, can help maintain minimum stream flows.Conversely, during flood stages surface water can rechargethe ground-water system by vertical recharge on the water-covered flood plain and bank storage through streambed sed-iments. The net effect of ground-water recharge is a reductionin flood peaks and replenishment of available ground-watersupplies.
Aquifer properties that affect ground-water availabilityinclude aquifer thickness and the size, number, and degree ofinterconnection of pore spaces within the aquifer material.These properties affect the ability of an aquifer to store andtransmit ground water. Porosity, the ratio of void space to unitvolume of rock or soil, is an index of how much ground waterthe aquifer can store. Permeability, a property largely con-trolled by size and interconnection of pore spaces within thematerial, affects the fluid-transmitting capacity of materials.
The water-transmitting characteristics of an aquifer areexpressed as hydraulic conductivity and transmissivity.Hydraulic conductivity is a measure of the rate that water willmove through an aquifer; it is usually expressed in gallons perday through a cross section of one square foot under a unithydraulic gradient. Transmissivity is equal to the hydraulicconductivity multiplied by the saturated thickness of theaquifer. The storage characteristic of an aquifer is expressedas the storage coefficient.
Pore spaces in bedrock occur as fractures, solution features,and/or openings between grains composing the rock. Inunconsolidated deposits all of the pores are intergranular.
However, fine-grained deposits such as clays and silts mayalso have secondary porosity, commonly in the form of frac-tures.
The size, shape, and sorting of material determine theamount and interconnection of intergranular pores. Sand andgravel deposits have a high proportion of pore space and highpermeability; whereas, fine-grained or clay-rich depositshave a greater proportion of pores, but a lower degree of per-meability.
Aquifers have porosity and permeability sufficient toabsorb, store, and transmit water in usable quantities.Aquitards consist of materials with low permeability thatrestrict ground-water movement. An aquitard overlying anaquifer may limit the recharge to the aquifer but may also pro-tect the aquifer from surface contamination.
Where an aquitard overlies an aquifer, the water in theaquifer is said to be confined because the aquitard prevents orrestricts upward movement of water from the aquifer. Suchan aquifer is referred to as a confined or artesian aquifer.Water in confined aquifers exists under hydrostatic pressurethat exceeds atmospheric pressure; and wells completed inconfined aquifers have water levels that rise above the water-bearing formation until the local hydrostatic pressure in thewell is equal to the atmospheric pressure. Such wells may ormay not be flowing wells (figure 8). A measure of the pressureof water in a confined aquifer is referred to as the potentio-metric level.
In contrast, water in an unconfined aquifer exists underatmospheric pressure; and wells that are completed in suchaquifers have water levels that correspond to the local watertable. An unconfined aquifer is also referred to as a watertable aquifer, and the spatial distribution of water levels inwells in unconfined aquifers is shown on a water table map.Water level maps for confined and unconfined aquifers aretypically referred to as potentiometric surface maps.
As a well discharges water from an aquifer the water leveldrops in the well. The drop in water level, which is calleddrawdown, creates a hydraulic gradient and causes groundwater around the well to flow toward the well. If an uncon-fined or confined aquifer is being pumped, an overall lower-ing of either the water table or the potentiometric surface,respectively, occurs around the well. The zone being influ-enced by pumpage is called the cone of depression. Anincrease in the pumping rate usually creates a larger cone ofdepression that may induce more recharge to the aquifer.However, the natural rate of recharge to confined aquifers islimited by the thickness and hydraulic properties of the con-fining layers.
Ground-water levels
The ground-water level within an aquifer fluctuates con-stantly in response to rainfall, evapotranspiration, barometricpressure, ground-water movement (including recharge and dis-charge), and ground-water pumpage. However, the responsetime for most natural ground-water level fluctuations is con-trolled predominantly by the local and regional geology.

20 Ground-Water Resource Availability, West Fork and White River Basin
Unconfined(Water Table) Aquifer
Aquitard
Confined(Artesian) Aquifer
Water-Table Well
Artesian Well
Potentiometric Surfaceof Confined Aquifer
Flowing Artesian Well
Stream
Water Table ofUnconfined Aquifer
Bedrock Aquifer
Recharge of Aquifersby Precipitation
Arrow represents ground-water flow direction
To study natural or man-induced stresses on an aquifer, anobservation well is completed in the aquifer of interest andthe water level is monitored periodically. Significant fluctua-tions in the water level in the observation well may be an indi-cation of natural or man-induced stresses on the aquifer.
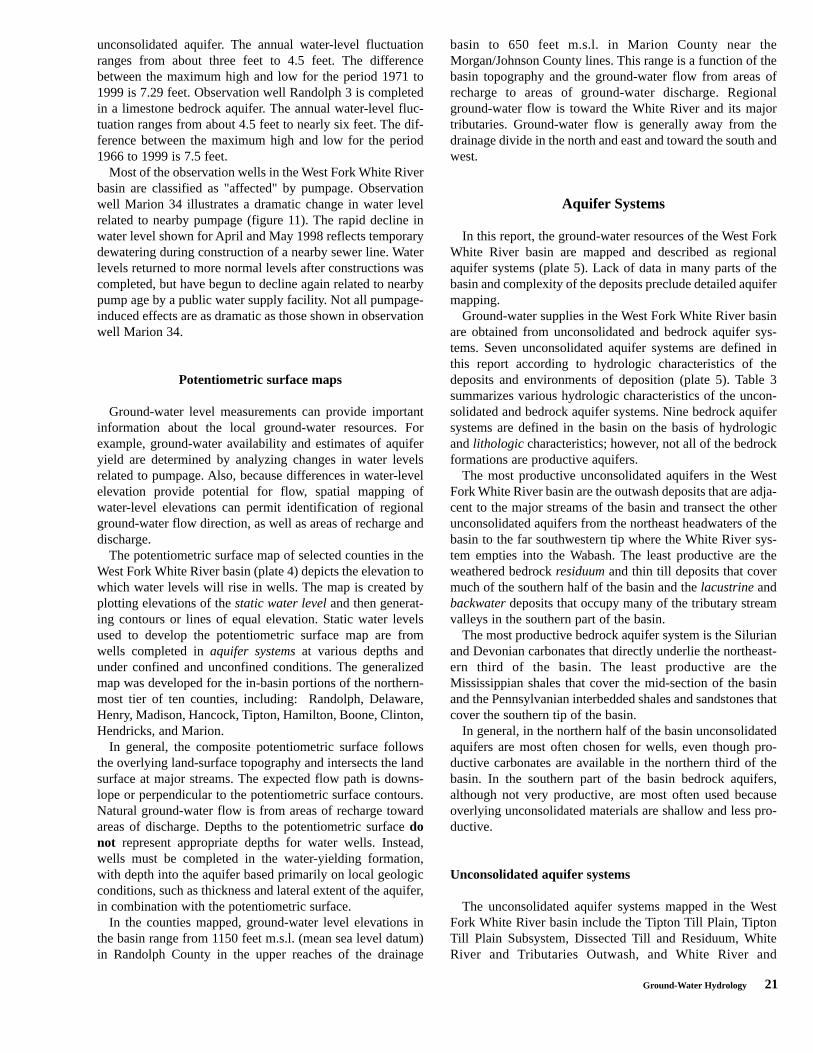
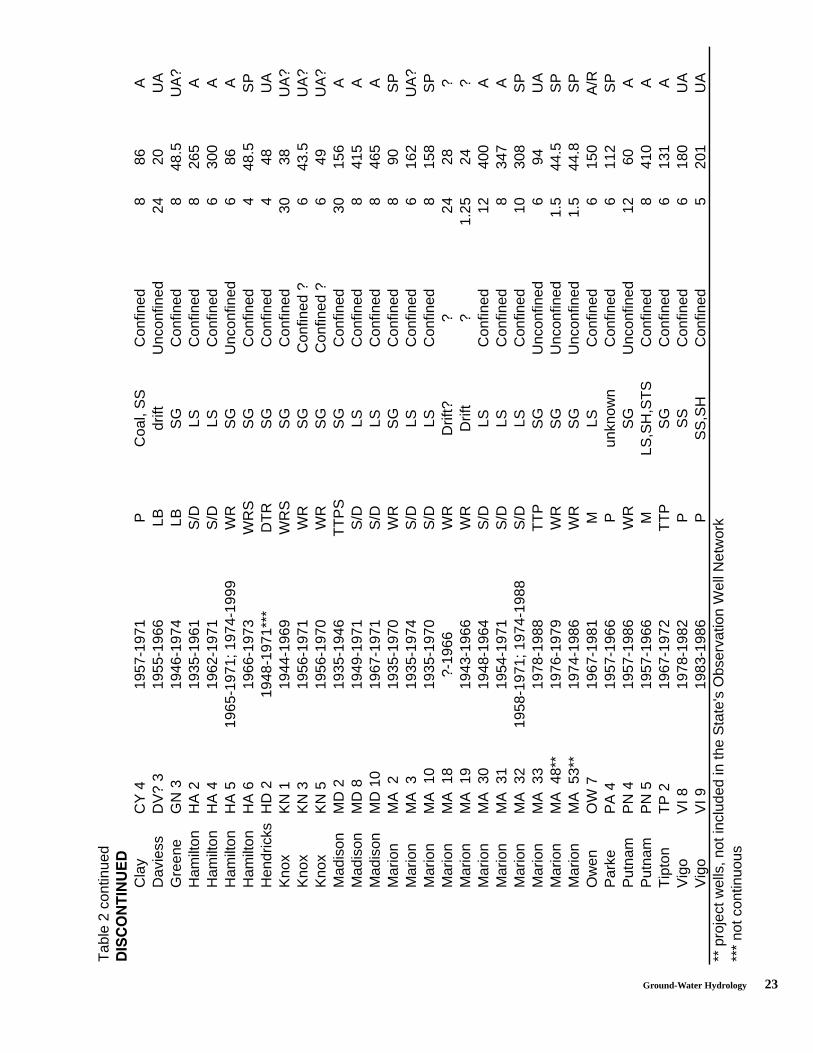
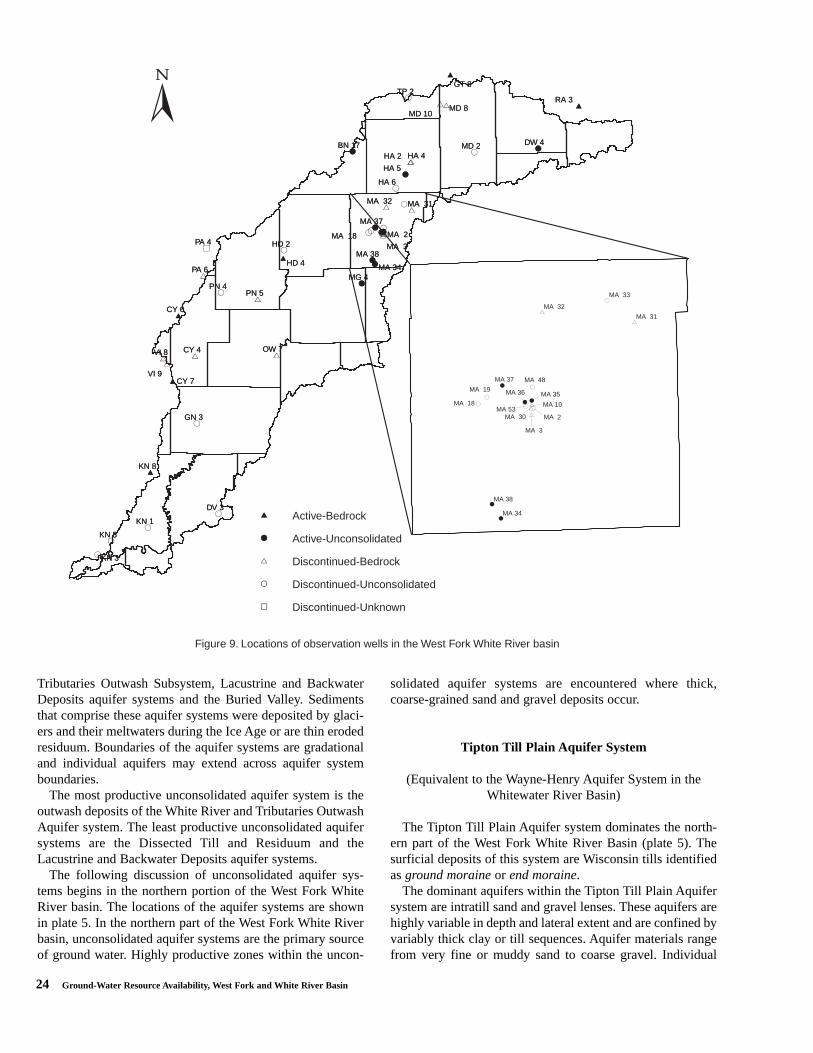
The observation well monitoring program in the West ForkWhite River basin was started in 1935 by the U.S. GeologicalSurvey (USGS) in cooperation with the Indiana Departmentof Natural Resources. Currently, the observation well net-work in the West Fork White River basin includes 10 activeobservation wells and 30 discontinued observation wells(table 2, figure 9). In addition, five active observation wellsare located just beyond the basin boundary. Table 2 alsoincludes information on two discontinued project wells wherewater level data have been collected in Marion County. Waterlevel is recorded automatically in each of the active observa-tion wells. Records of ground-water levels are collected peri-odically by the U.S. Geological Survey and published annu-ally in water-resource data reports.
Observation wells in the West Fork White River are cate-gorized into three groups: 1) unaffected by pumpage, 2)affected by pumpage, and 3) special purpose. However, clas-sification can be difficult in cases where the observation wellhas a short period of record. The observation wells in thebasin that are categorized as "special purpose" were moni-tored in the past for various purposes including earthquakeresponse, but have all been discontinued.
Of the eight active observation wells completed in uncon-solidated deposits in the basin, two record natural water-levelfluctuations, five record water-levels that are definitely
affected by pumpage, and one records water-levels that maybe affected by pumpage. One of the two bedrock wells in thebasin records natural water-level fluctuations, the otherrecords water levels affected by pumpage.
Hydrologic data are often presented in water years(October through September) instead of calendar years(January through December) because the annual peak in riverstage commonly occurs from December to June. If a majorprecipitation event occurs from late December to earlyJanuary and calendar year data are used for plotting, the sin-gle event can be interpreted as two annual peaks in two cal-endar years.
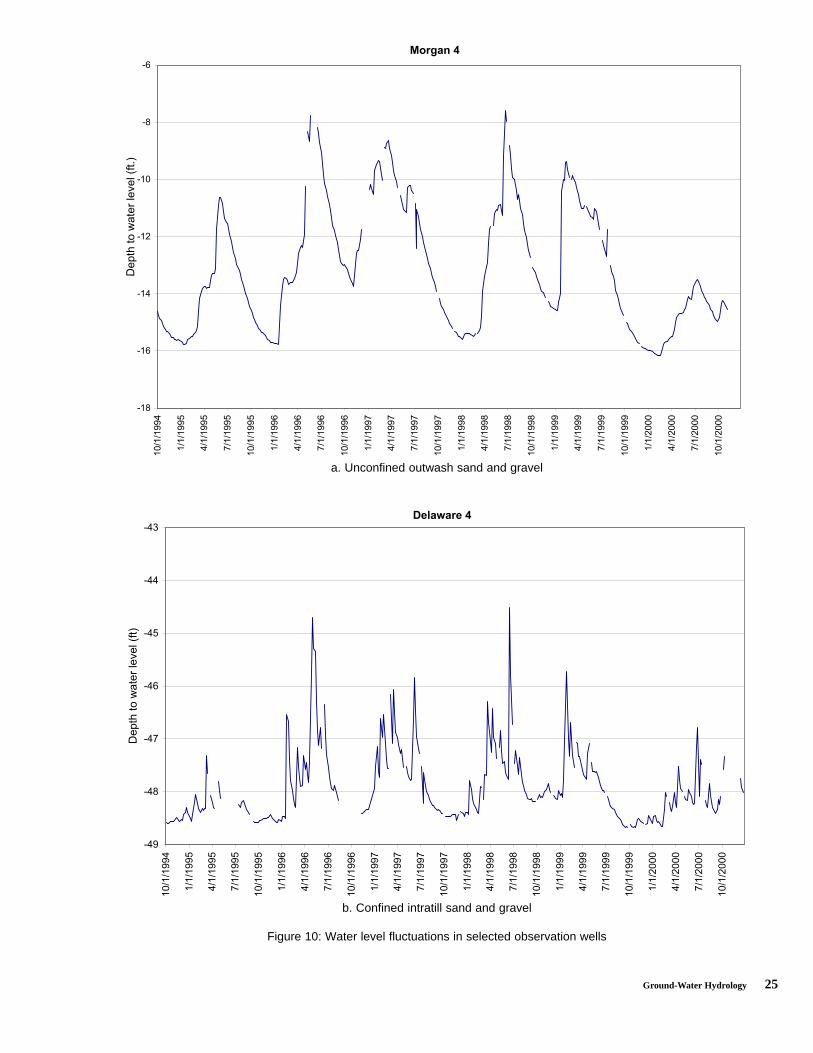
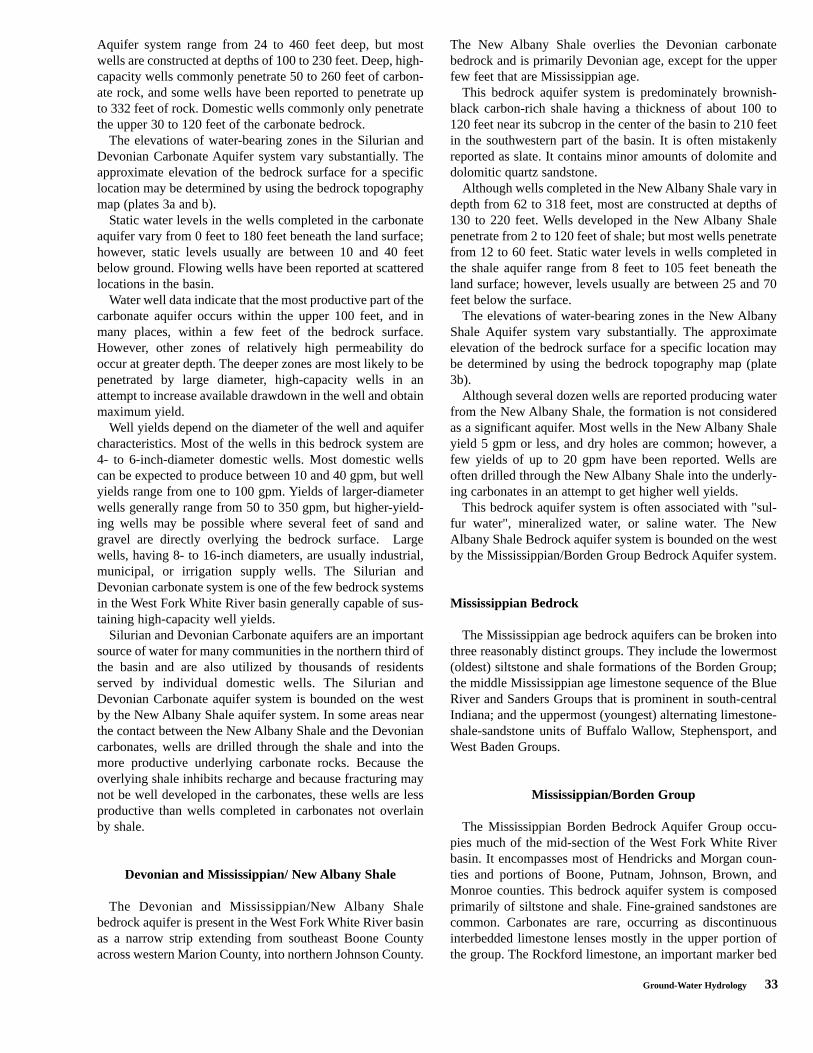
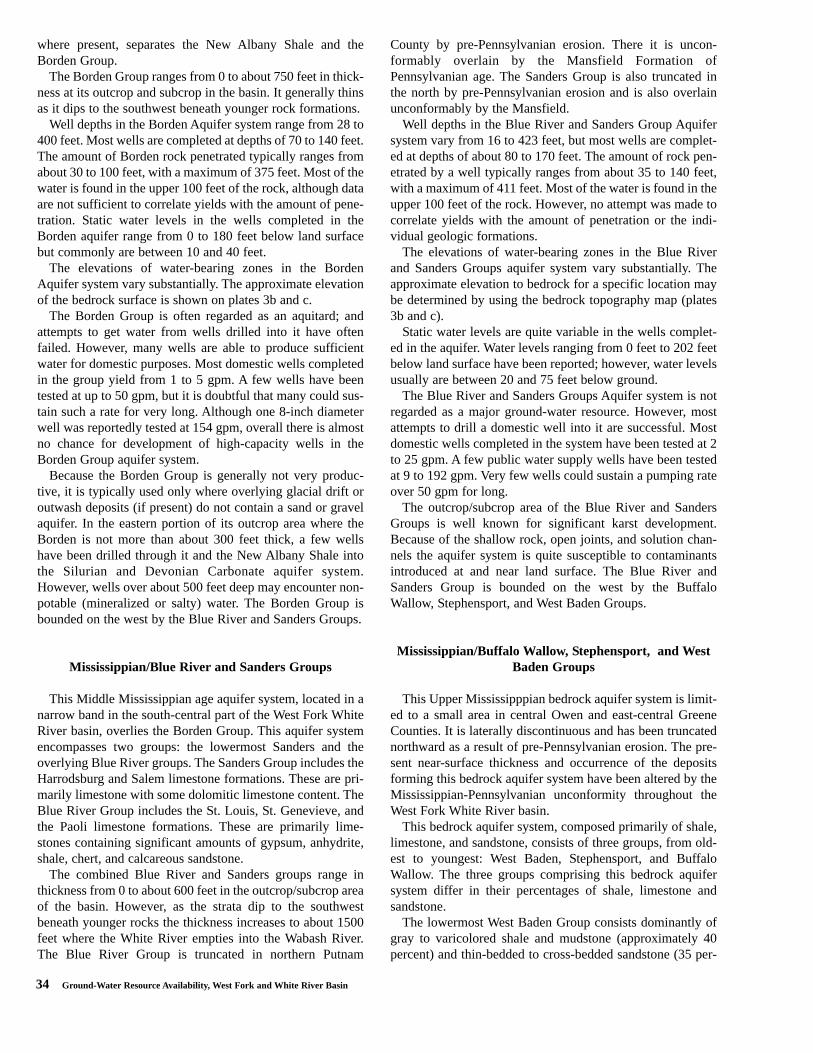
Normal temporal trends in the ground-water levels areillustrated by the hydrographs of Morgan 4, Delaware 4, andRandolph 3 (figures 10a, b, and c). All three observation wellsare classified as "unaffected". Ground-water levels in aquifersare highest during the wet season of spring, and decline dur-ing summer and fall because of increased evapotranspirationand reduced recharge. The fluctuations are the result of nat-ural stresses, and thus may indicate trends in the natural ratesof ground-water recharge and discharge from the aquifers. Allthree hydrographs reveal lower ground-water levels duringthe latter part of 1999 and early 2000 as a result of droughtconditions.
Observation well Morgan 4 is completed in a shallowunconfined aquifer. The annual water-level fluctuation rangesfrom about five feet to eight feet. The difference between themaximum high and low for the period 1978 to 1999 is 13.16feet.
Observation well Delaware 4 is completed in a confined
Figure 8: Aquifer types and ground-water movement
Ground-Water Hydrology 21
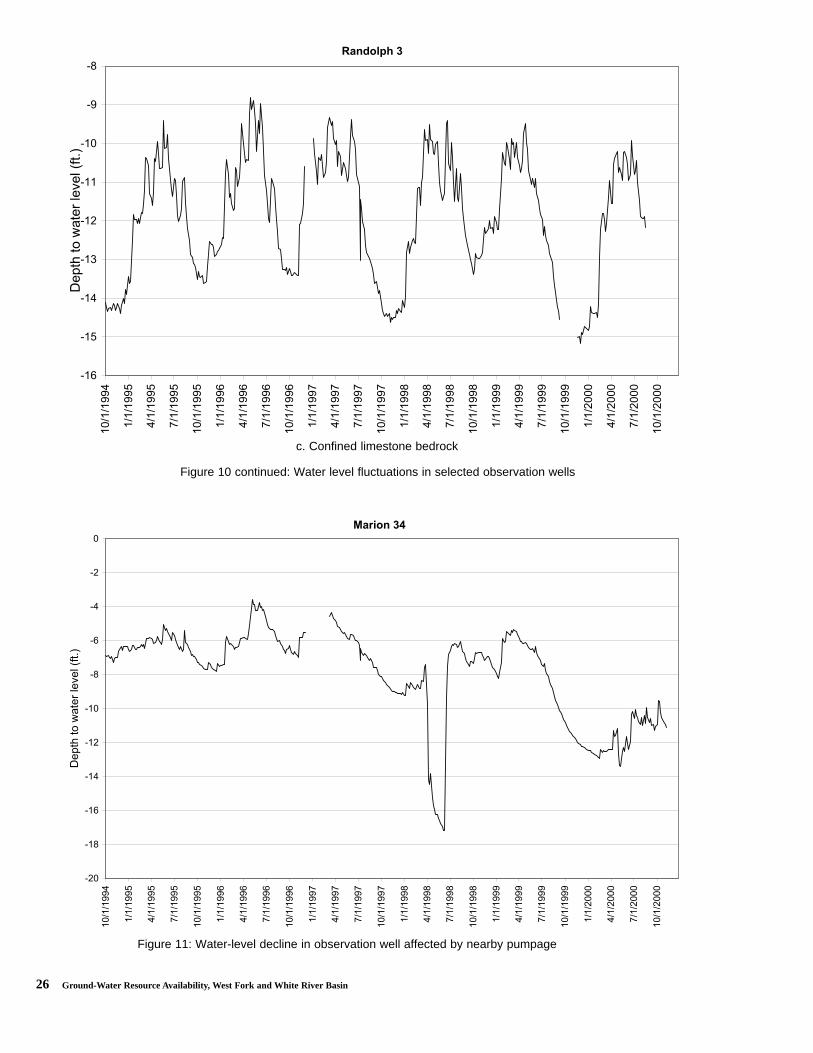
unconsolidated aquifer. The annual water-level fluctuationranges from about three feet to 4.5 feet. The differencebetween the maximum high and low for the period 1971 to1999 is 7.29 feet. Observation well Randolph 3 is completedin a limestone bedrock aquifer. The annual water-level fluc-tuation ranges from about 4.5 feet to nearly six feet. The dif-ference between the maximum high and low for the period1966 to 1999 is 7.5 feet.
Most of the observation wells in the West Fork White Riverbasin are classified as "affected" by pumpage. Observationwell Marion 34 illustrates a dramatic change in water levelrelated to nearby pumpage (figure 11). The rapid decline inwater level shown for April and May 1998 reflects temporarydewatering during construction of a nearby sewer line. Waterlevels returned to more normal levels after constructions wascompleted, but have begun to decline again related to nearbypump age by a public water supply facility. Not all pumpage-induced effects are as dramatic as those shown in observationwell Marion 34.
Potentiometric surface maps
Ground-water level measurements can provide importantinformation about the local ground-water resources. Forexample, ground-water availability and estimates of aquiferyield are determined by analyzing changes in water levelsrelated to pumpage. Also, because differences in water-levelelevation provide potential for flow, spatial mapping ofwater-level elevations can permit identification of regionalground-water flow direction, as well as areas of recharge anddischarge.
The potentiometric surface map of selected counties in theWest Fork White River basin (plate 4) depicts the elevation towhich water levels will rise in wells. The map is created byplotting elevations of the static water level and then generat-ing contours or lines of equal elevation. Static water levelsused to develop the potentiometric surface map are fromwells completed in aquifer systems at various depths andunder confined and unconfined conditions. The generalizedmap was developed for the in-basin portions of the northern-most tier of ten counties, including: Randolph, Delaware,Henry, Madison, Hancock, Tipton, Hamilton, Boone, Clinton,Hendricks, and Marion.
In general, the composite potentiometric surface followsthe overlying land-surface topography and intersects the landsurface at major streams. The expected flow path is downs-lope or perpendicular to the potentiometric surface contours.Natural ground-water flow is from areas of recharge towardareas of discharge. Depths to the potentiometric surface donot represent appropriate depths for water wells. Instead,wells must be completed in the water-yielding formation,with depth into the aquifer based primarily on local geologicconditions, such as thickness and lateral extent of the aquifer,in combination with the potentiometric surface.
In the counties mapped, ground-water level elevations inthe basin range from 1150 feet m.s.l. (mean sea level datum)in Randolph County in the upper reaches of the drainage
basin to 650 feet m.s.l. in Marion County near theMorgan/Johnson County lines. This range is a function of thebasin topography and the ground-water flow from areas ofrecharge to areas of ground-water discharge. Regionalground-water flow is toward the White River and its majortributaries. Ground-water flow is generally away from thedrainage divide in the north and east and toward the south andwest.
Aquifer Systems
In this report, the ground-water resources of the West ForkWhite River basin are mapped and described as regionalaquifer systems (plate 5). Lack of data in many parts of thebasin and complexity of the deposits preclude detailed aquifermapping.
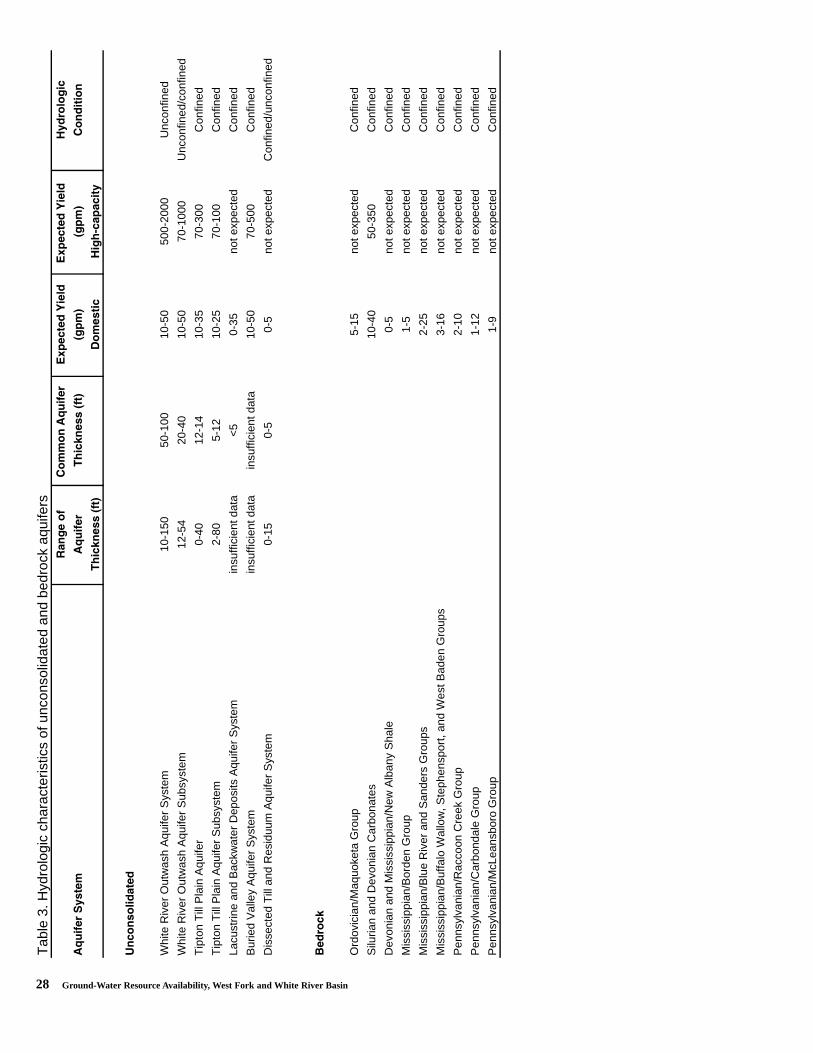
Ground-water supplies in the West Fork White River basinare obtained from unconsolidated and bedrock aquifer sys-tems. Seven unconsolidated aquifer systems are defined inthis report according to hydrologic characteristics of thedeposits and environments of deposition (plate 5). Table 3summarizes various hydrologic characteristics of the uncon-solidated and bedrock aquifer systems. Nine bedrock aquifersystems are defined in the basin on the basis of hydrologicand lithologic characteristics; however, not all of the bedrockformations are productive aquifers.
The most productive unconsolidated aquifers in the WestFork White River basin are the outwash deposits that are adja-cent to the major streams of the basin and transect the otherunconsolidated aquifers from the northeast headwaters of thebasin to the far southwestern tip where the White River sys-tem empties into the Wabash. The least productive are theweathered bedrock residuum and thin till deposits that covermuch of the southern half of the basin and the lacustrine andbackwater deposits that occupy many of the tributary streamvalleys in the southern part of the basin.
The most productive bedrock aquifer system is the Silurianand Devonian carbonates that directly underlie the northeast-ern third of the basin. The least productive are theMississippian shales that cover the mid-section of the basinand the Pennsylvanian interbedded shales and sandstones thatcover the southern tip of the basin.
In general, in the northern half of the basin unconsolidatedaquifers are most often chosen for wells, even though pro-ductive carbonates are available in the northern third of thebasin. In the southern part of the basin bedrock aquifers,although not very productive, are most often used becauseoverlying unconsolidated materials are shallow and less pro-ductive.
Unconsolidated aquifer systems
The unconsolidated aquifer systems mapped in the WestFork White River basin include the Tipton Till Plain, TiptonTill Plain Subsystem, Dissected Till and Residuum, WhiteRiver and Tributaries Outwash, and White River and
22 Ground-Water Resource Availability, West Fork and White River Basin
Tab
le 2
. S
umm
ary
of a
ctiv
e an
d di
scon
tinue
d w
ells
Wel
l num
ber:
U.S
.Geo
logi
cal S
urve
y co
unty
cod
e an
d w
ell n
umbe
r. W
ell l
ocat
ions
are
sho
wn
in fi
gure
9.
Per
iod
of r
ecor
d: R
efer
s to
cal
enda
r ye
ar, w
heth
er o
r no
t dat
a en
com
pass
es e
ntire
yea
r.A
quife
r sy
stem
: W
R, W
hite
Riv
er a
nd T
ribut
arie
s O
utw
ash;
WR
S, W
hite
Riv
er a
nd T
ribut
arie
s O
utw
ash
Sub
syst
em;
TT
P, T
ipto
n T
ill P
lain
; TT
PS
, Tip
ton
Till
Pla
in S
ubsy
stem
; BV
, Bur
ied
Val
ley;
DT
R, D
isse
cted
Till
and
Res
iduu
m;
LB, L
acus
trin
e an
d B
ackw
ater
Dep
osits
; S, S
iluria
n; D
, Dev
onia
n; M
, Mis
siss
ippi
an; P
, Pen
nsyl
vani
an
Aqu
ifer
type
: S
G, s
and
and
grav
el; L
S, l
imes
tone
; SS
, san
dsto
ne; S
H, s
hale
; ST
S, s
iltst
one
A
quife
r cl
assi
ficat
ion:
A, a
ffect
ed b
y pu
mpi
ng; A
/R, a
ffect
ed b
y a
river
; UA
, una
ffect
ed b
y pu
mpi
ng; S
P, s
peci
al p
urpo
se
Wel
lP
erio
dA
quife
rA
quife
rA
quife
rW
ell
Wel
lA
quife
rS
tatu
sC
ount
ynu
mbe
rof
rec
ord
syst
emT
ype
Con
ditio
nD
iam
eter
Dep
thC
lass
(in.)
(ft.)
������
Boo
neB
N 1
719
86-
TT
PS
GC
onfin
ed6
171.
8A
?C
lay
CY
6 *
1987
-P
SS
Con
fined
640
0A
Cla
yC
Y 7
*19
88-
PS
SC
onfin
ed6
121
UA
Del
awar
eD
W 4
1966
-197
1; 1
974-
pres
ent
TT
PS
GC
onfin
ed6
91U
AG
rant
GT
8*
1966
-197
1; 1
974-
pres
ent
S/D
LSC
onfin
ed6
35U
AH
endr
icks
HD
419
66-1
971;
197
4-pr
esen
tM
SS
Con
fined
685
AK
nox
KN
8*
1989
-P
SS
,SH
,Coa
lC
onfin
ed6
137
UA
Mar
ion
MA
34
1986
-W
RS
GU
ncon
fined
666
AM
ario
nM
A 3
519
87-
WR
SG
Con
fined
683
AM
ario
nM
A 3
619
87-
WR
SG
Con
fined
670
.6A
Mar
ion
MA
37
1988
-W
RS
SG
Unc
onfin
ed6
74A
Mar
ion
MA
38
1997
-W
RS
GU
ncon
fined
664
AM
orga
nM
G 4
1978
-W
RS
GU
ncon
fined
664
UA
Par
keP
A 6
1967
-197
1; 1
981-
pres
ent
PS
SC
onfin
ed6
155
UA
Ran
dolp
h R
A 3
*19
66-
S/D
LSC
onfin
ed6
54U
A*C
Y6,
CY
7, G
T8,
KN
8, a
nd R
A3
are
near
, but
out
side
the
basi
n bo
unda
ry
Ground-Water Hydrology 23
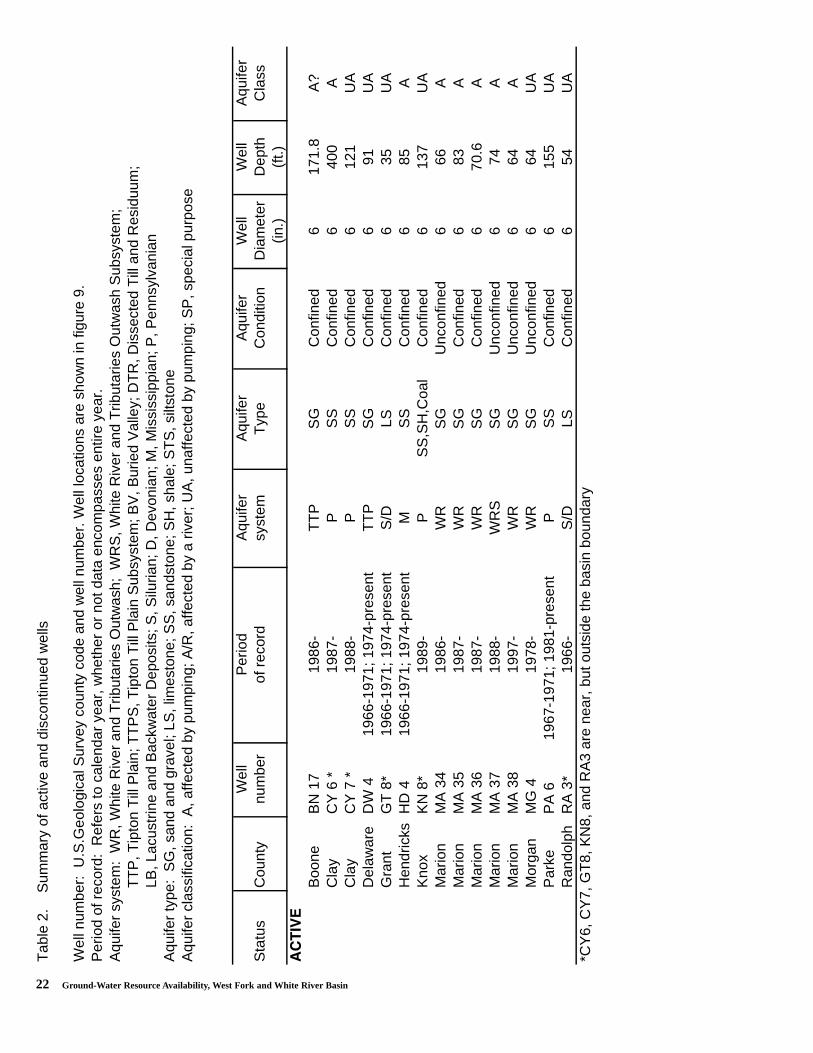
Tab
le 2
con
tinue
d���������
Cla
yC
Y 4
1957
-197
1P
Coa
l, S
SC
onfin
ed8
86A
Dav
iess
DV
? 3
1955
-196
6LB
drift
Unc
onfin
ed24
20U
AG
reen
eG
N 3
1946
-197
4LB
SG
Con
fined
848
.5U
A?
Ham
ilton
HA
219
35-1
961
S/D
LSC
onfin
ed8
265
AH
amilt
onH
A 4
1962
-197
1S
/DLS
Con
fined
630
0A
Ham
ilton
HA
519
65-1
971;
197
4-19
99W
RS
GU
ncon
fined
686
AH
amilt
onH
A 6
1966
-197
3W
RS
SG
Con
fined
448
.5S
PH
endr
icks
HD
219
48-1
971*
**D
TR
SG
Con
fined
448
UA
Kno
xK
N 1
1944
-196
9W
RS
SG
Con
fined
3038
UA
?K
nox
KN
319
56-1
971
WR
SG
Con
fined
?6
43.5
UA
?K
nox
KN
519
56-1
970
WR
SG
Con
fined
?6
49U
A?
Mad
ison
MD
219
35-1
946
TT
PS
SG
Con
fined
3015
6A
Mad
ison
MD
819
49-1
971
S/D
LSC
onfin
ed8
415
AM
adis
onM
D 1
019
67-1
971
S/D
LSC
onfin
ed8
465
AM
ario
nM
A 2
1935
-197
0W
RS
GC
onfin
ed8
90S
PM
ario
nM
A 3
1935
-197
4S
/DLS
Con
fined
616
2U
A?
Mar
ion
MA
10
1935
-197
0S
/DLS
Con
fined
815
8S
PM
ario
nM
A 1
8?-
1966
WR
Drif
t??
2428
?M
ario
nM
A 1
919
43-1
966
WR
Drif
t?
1.25
24?
Mar
ion
MA
30
1948
-196
4S
/DLS
Con
fined
1240
0A
Mar
ion
MA
31
1954
-197
1S
/DLS
Con
fined
834
7A
Mar
ion
MA
32
1958
-197
1; 1
974-
1988
S/D
LSC
onfin
ed10
308
SP
Mar
ion
MA
33
1978
-198
8T
TP
SG
Unc
onfin
ed6
94U
AM
ario
nM
A 4
8**
1976
-197
9W
RS
GU
ncon
fined
1.5
44.5
SP
Mar
ion
MA
53*
*19
74-1
986
WR
SG
Unc
onfin
ed1.
544
.8S
PO
wen
OW
719
67-1
981
MLS
Con
fined
615
0A
/RP
arke
PA
419
57-1
966
Pun
know
nC
onfin
ed6
112
SP
Put
nam
PN
419
57-1
986
WR
SG
Unc
onfin
ed12
60A
Put
nam
PN
519
57-1
966
MLS
,SH
,ST
SC
onfin
ed8
410
AT
ipto
nT
P 2
1967
-197
2T
TP
SG
Con
fined
613
1A
Vig
oV
I 819
78-1
982
PS
SC
onfin
ed6
180
UA
Vig
oV
I 919
83-1
986
PS
S,S
HC
onfin
ed5
201
UA
** p
roje
ct w
ells
, not
incl
uded
in th
e S
tate
's O
bser
vatio
n W
ell N
etw
ork
**
* no
t con
tinuo
us
24 Ground-Water Resource Availability, West Fork and White River Basin
Active-Bedrock
Active-Unconsolidated
Discontinued-Bedrock
Discontinued-Unconsolidated
Discontinued-Unknown
Figure 9. Locations of observation wells in the West Fork White River basin
MA 53MA 10
MA 38
MA 2
MA 37
MA 36 MA 35
MA 34
MA 3
MA 48
MA 33
MA 32
MA 31
MA 30
MA 18
MA 19
CY 4
DV 3
GT 8
RA 3
HA 2 HA 4
MD 8
OW 7
PN 5
DW 4
HA 5
MG 4
GN 3
HA 6
HD 2
KN 1
KN 5
MD 2
PN 4
TP 2
CY 6
CY 7
HD 4
KN 8
PA 6
VI 8
VI 9
PA 4
MD 10
MA 3
BN 17
MA 34
MA 37
MA 2
MA 38
MA 18
MA 31MA 32
KN 3
CY 4
DV 3
GT 8
RA 3
HA 2 HA 4
MD 8
OW 7
PN 5
DW 4
HA 5
MG 4
GN 3
HA 6
HD 2
KN 1
KN 5
MD 2
PN 4
TP 2
CY 6
CY 7
HD 4
KN 8
PA 6
VI 8
VI 9
PA 4
MD 10
MA 3
BN 17
MA 34
MA 37
MA 2
MA 38
MA 18
MA 31MA 32
KN 3
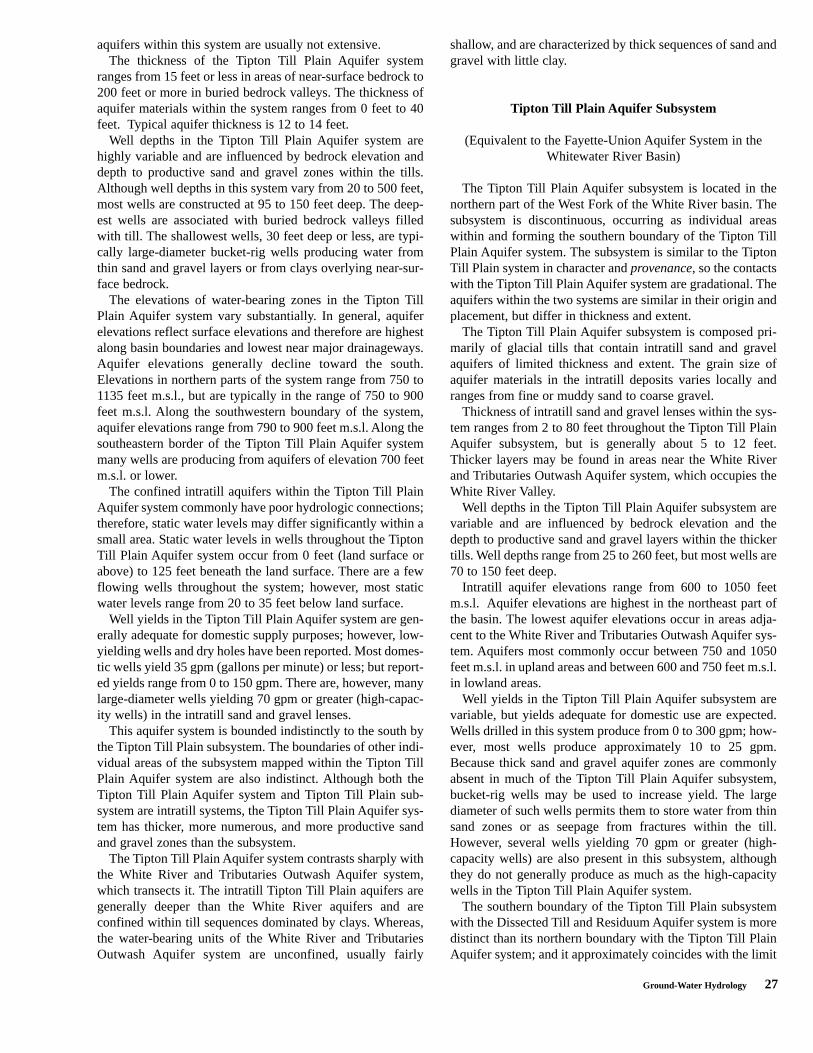
Tributaries Outwash Subsystem, Lacustrine and BackwaterDeposits aquifer systems and the Buried Valley. Sedimentsthat comprise these aquifer systems were deposited by glaci-ers and their meltwaters during the Ice Age or are thin erodedresiduum. Boundaries of the aquifer systems are gradationaland individual aquifers may extend across aquifer systemboundaries.
The most productive unconsolidated aquifer system is theoutwash deposits of the White River and Tributaries OutwashAquifer system. The least productive unconsolidated aquifersystems are the Dissected Till and Residuum and theLacustrine and Backwater Deposits aquifer systems.
The following discussion of unconsolidated aquifer sys-tems begins in the northern portion of the West Fork WhiteRiver basin. The locations of the aquifer systems are shownin plate 5. In the northern part of the West Fork White Riverbasin, unconsolidated aquifer systems are the primary sourceof ground water. Highly productive zones within the uncon-
solidated aquifer systems are encountered where thick,coarse-grained sand and gravel deposits occur.
Tipton Till Plain Aquifer System
(Equivalent to the Wayne-Henry Aquifer System in theWhitewater River Basin)
The Tipton Till Plain Aquifer system dominates the north-ern part of the West Fork White River Basin (plate 5). Thesurficial deposits of this system are Wisconsin tills identifiedas ground moraine or end moraine.
The dominant aquifers within the Tipton Till Plain Aquifersystem are intratill sand and gravel lenses. These aquifers arehighly variable in depth and lateral extent and are confined byvariably thick clay or till sequences. Aquifer materials rangefrom very fine or muddy sand to coarse gravel. Individual
Ground-Water Hydrology 25
��������
���
���
���
���
���
��
��
�������
�����
�����
�����
������
������
������
������
�������
������
������
������
�������
������
������
������
�������
�����
�����
�����
������
��������
��������
��������
���������
� ��������
�� ��� � �������
�������
��
���
���
���
��
���
���
�������
�����
�����
�����
������
������
������
������
�������
������
������
������
�������
������
������
������
�������
�����
�����
�����
������
��������
��������
��������
���������
� ��������
�� ��� � ������
a. Unconfined outwash sand and gravel
b. Confined intratill sand and gravel
Figure 10: Water level fluctuations in selected observation wells
26 Ground-Water Resource Availability, West Fork and White River Basin
���������
���
��
���
���
���
���
���
�
��
�������
�����
�����
�����
������
������
������
������
�������
������
������
������
�������
������
������
������
�������
�����
�����
�����
������
��������
��������
��������
���������
� ��������
�� ��� � �������
���������
���
���
���
���
���
���
��
��
��
��
�
�������
�����
�����
�����
������
������
������
������
�������
������
������
������
�������
������
������
������
�������
�����
�����
�����
������
��������
��������
��������
���������
� ��������
�� ��� � �������
c. Confined limestone bedrock
Figure 10 continued: Water level fluctuations in selected observation wells
Figure 11: Water-level decline in observation well affected by nearby pumpage
Ground-Water Hydrology 27
aquifers within this system are usually not extensive.The thickness of the Tipton Till Plain Aquifer system
ranges from 15 feet or less in areas of near-surface bedrock to200 feet or more in buried bedrock valleys. The thickness ofaquifer materials within the system ranges from 0 feet to 40feet. Typical aquifer thickness is 12 to 14 feet.
Well depths in the Tipton Till Plain Aquifer system arehighly variable and are influenced by bedrock elevation anddepth to productive sand and gravel zones within the tills.Although well depths in this system vary from 20 to 500 feet,most wells are constructed at 95 to 150 feet deep. The deep-est wells are associated with buried bedrock valleys filledwith till. The shallowest wells, 30 feet deep or less, are typi-cally large-diameter bucket-rig wells producing water fromthin sand and gravel layers or from clays overlying near-sur-face bedrock.
The elevations of water-bearing zones in the Tipton TillPlain Aquifer system vary substantially. In general, aquiferelevations reflect surface elevations and therefore are highestalong basin boundaries and lowest near major drainageways.Aquifer elevations generally decline toward the south.Elevations in northern parts of the system range from 750 to1135 feet m.s.l., but are typically in the range of 750 to 900feet m.s.l. Along the southwestern boundary of the system,aquifer elevations range from 790 to 900 feet m.s.l. Along thesoutheastern border of the Tipton Till Plain Aquifer systemmany wells are producing from aquifers of elevation 700 feetm.s.l. or lower.
The confined intratill aquifers within the Tipton Till PlainAquifer system commonly have poor hydrologic connections;therefore, static water levels may differ significantly within asmall area. Static water levels in wells throughout the TiptonTill Plain Aquifer system occur from 0 feet (land surface orabove) to 125 feet beneath the land surface. There are a fewflowing wells throughout the system; however, most staticwater levels range from 20 to 35 feet below land surface.
Well yields in the Tipton Till Plain Aquifer system are gen-erally adequate for domestic supply purposes; however, low-yielding wells and dry holes have been reported. Most domes-tic wells yield 35 gpm (gallons per minute) or less; but report-ed yields range from 0 to 150 gpm. There are, however, manylarge-diameter wells yielding 70 gpm or greater (high-capac-ity wells) in the intratill sand and gravel lenses.
This aquifer system is bounded indistinctly to the south bythe Tipton Till Plain subsystem. The boundaries of other indi-vidual areas of the subsystem mapped within the Tipton TillPlain Aquifer system are also indistinct. Although both theTipton Till Plain Aquifer system and Tipton Till Plain sub-system are intratill systems, the Tipton Till Plain Aquifer sys-tem has thicker, more numerous, and more productive sandand gravel zones than the subsystem.
The Tipton Till Plain Aquifer system contrasts sharply withthe White River and Tributaries Outwash Aquifer system,which transects it. The intratill Tipton Till Plain aquifers aregenerally deeper than the White River aquifers and are confined within till sequences dominated by clays. Whereas,the water-bearing units of the White River and TributariesOutwash Aquifer system are unconfined, usually fairly
shallow, and are characterized by thick sequences of sand andgravel with little clay.
Tipton Till Plain Aquifer Subsystem
(Equivalent to the Fayette-Union Aquifer System in theWhitewater River Basin)
The Tipton Till Plain Aquifer subsystem is located in thenorthern part of the West Fork of the White River basin. Thesubsystem is discontinuous, occurring as individual areaswithin and forming the southern boundary of the Tipton TillPlain Aquifer system. The subsystem is similar to the TiptonTill Plain system in character and provenance, so the contactswith the Tipton Till Plain Aquifer system are gradational. Theaquifers within the two systems are similar in their origin andplacement, but differ in thickness and extent.
The Tipton Till Plain Aquifer subsystem is composed pri-marily of glacial tills that contain intratill sand and gravelaquifers of limited thickness and extent. The grain size ofaquifer materials in the intratill deposits varies locally andranges from fine or muddy sand to coarse gravel.
Thickness of intratill sand and gravel lenses within the sys-tem ranges from 2 to 80 feet throughout the Tipton Till PlainAquifer subsystem, but is generally about 5 to 12 feet.Thicker layers may be found in areas near the White Riverand Tributaries Outwash Aquifer system, which occupies theWhite River Valley.
Well depths in the Tipton Till Plain Aquifer subsystem arevariable and are influenced by bedrock elevation and thedepth to productive sand and gravel layers within the thickertills. Well depths range from 25 to 260 feet, but most wells are70 to 150 feet deep.
Intratill aquifer elevations range from 600 to 1050 feetm.s.l. Aquifer elevations are highest in the northeast part ofthe basin. The lowest aquifer elevations occur in areas adja-cent to the White River and Tributaries Outwash Aquifer sys-tem. Aquifers most commonly occur between 750 and 1050feet m.s.l. in upland areas and between 600 and 750 feet m.s.l.in lowland areas.
Well yields in the Tipton Till Plain Aquifer subsystem arevariable, but yields adequate for domestic use are expected.Wells drilled in this system produce from 0 to 300 gpm; how-ever, most wells produce approximately 10 to 25 gpm.Because thick sand and gravel aquifer zones are commonlyabsent in much of the Tipton Till Plain Aquifer subsystem,bucket-rig wells may be used to increase yield. The largediameter of such wells permits them to store water from thinsand zones or as seepage from fractures within the till.However, several wells yielding 70 gpm or greater (high-capacity wells) are also present in this subsystem, althoughthey do not generally produce as much as the high-capacitywells in the Tipton Till Plain Aquifer system.
The southern boundary of the Tipton Till Plain subsystemwith the Dissected Till and Residuum Aquifer system is moredistinct than its northern boundary with the Tipton Till PlainAquifer system; and it approximately coincides with the limit
28 Ground-Water Resource Availability, West Fork and White River Basin
Tab
le 3
. Hyd
rolo
gic
char
acte
ristic
s of
unc
onso
lidat
ed a
nd b
edro
ck a
quife
rs� ������
���������������
��������������
���������������
!��������
���������!"���
�������
�#��$��""�%��&
%���&
%���&
���������
�#��$��""�%��&
����"���
��#'� � ���!
�����"���� ���
Whi
te R
iver
Out
was
h A
quife
r S
yste
m10
-150
50-1
0010
-50
500-
2000
Unc
onfin
ed
Whi
te R
iver
Out
was
h A
quife
r S
ubsy
stem
12-5
420
-40
10-5
070
-100
0U
ncon
fined
/con
fined
Tip
ton
Till
Pla
in A
quife
r0-
4012
-14
10-3
570
-300
Con
fined
Tip
ton
Till
Pla
in A
quife
r S
ubsy
stem
2-80
5-12
10-2
570
-100
Con
fined
Lacu
strin
e an
d B
ackw
ater
Dep
osits
Aqu
ifer
Sys
tem
insu
ffici
ent d
ata
<5
0-35
not e
xpec
ted
Con
fined
Bur
ied
Val
ley
Aqu
ifer
Sys
tem
insu
ffici
ent d
ata
insu
ffici
ent d
ata
10-5
070
-500
Con
fined
Dis
sect
ed T
ill a
nd R
esid
uum
Aqu
ifer
Sys
tem
0-15
0-5
0-5
not e
xpec
ted
Con
fined
/unc
onfin
ed
(�����$
Ord
ovic
ian/
Maq
uoke
ta G
roup
5-15
not e
xpec
ted
Con
fined
Silu
rian
and
Dev
onia
n C
arbo
nate
s10
-40
50-3
50C
onfin
ed
Dev
onia
n an
d M
issi
ssip
pian
/New
Alb
any
Sha
le0-
5no
t exp
ecte
dC
onfin
ed
Mis
siss
ippi
an/B
orde
n G
roup
1-5
not e
xpec
ted
Con
fined
Mis
siss
ippi
an/B
lue
Riv
er a
nd S
ande
rs G
roup
s2-
25no
t exp
ecte
dC
onfin
ed
Mis
siss
ippi
an/B
uffa
lo W
allo
w, S
teph
ensp
ort,
and
Wes
t Bad
en G
roup
s3-
16no
t exp
ecte
dC
onfin
ed
Pen
nsyl
vani
an/R
acco
on C
reek
Gro
up2-
10no
t exp
ecte
dC
onfin
ed
Pen
nsyl
vani
an/C
arbo
ndal
e G
roup
1-12
not e
xpec
ted
Con
fined
Pen
nsyl
vani
an/M
cLea
nsbo
ro G
roup
1-9
not e
xpec
ted
Con
fined
Ground-Water Hydrology 29
of the Wisconsin glacial advance. The unglaciated area of thesouthern half of the West Fork White River Basin, whichincludes the Dissected Till and Residuum Aquifer system,contrasts sharply with the thick glacial cover of the TiptonTill Plain Aquifer subsystem.
Dissected Till and Residuum Aquifer System
(Equivalent to the Dearborn Aquifer System in theWhitewater River Basin)
The Dissected Till and Residuum Aquifer system, coveringmuch of the southern half of the West Fork White RiverBasin, has the most limited ground-water resources of theunconsolidated aquifer systems in the basin. Unconsolidatedmaterials of the Dissected Till and Residuum consist of thin,eroded residuum and predominantly pre-Wisconsin tills.
Clay commonly overlies the bedrock in the Dissected Tilland Residuum Aquifer system, but thin layers of intratill sandand gravel may be present. The water-bearing sand and grav-el lenses may approach 15 feet in total thickness, but are morecommonly 0 to 5 feet thick. Well depths in these aquifersrange from 20 to 200 feet; although most wells are less than75 feet deep. The deepest wells are in the northern part of theaquifer system near the boundary with the Tipton Till PlainAquifer subsystem.
Aquifer elevations are typically between 450 and 850 feetm.s.l. Because the unconsolidated materials covering thebedrock are so thin in most places, the aquifer elevationsclosely match the elevation of the bedrock surface. Therefore,the highest aquifer elevations are at the northern end of theaquifer system, whereas the lower elevations are towards thesouthern end. Static water levels in wells developed in theseaquifers range from flowing to 180 feet beneath the surface;but most static water levels range from 10 to 50 feet beneathground level.
Well yields range from 0 to 150 gpm, but yields of 0 to 5gpm are more common. Dry holes are also common in partsof the counties south of Morgan and Hendricks counties.Large-diameter bucket-rig wells may produce water from thinsands, gravels, or clay or till units in this system.
The Dissected Till and Residuum Aquifer system is tran-sected by the White River and Tributaries Outwash Aquifersystem. The boundary between these two systems is sharplydefined by geologic materials, aquifer elevations, and wateravailability.
White River and Tributaries Outwash Aquifer System
The White River and Tributaries Outwash Aquifer systemoccupies the valleys of the White River and its major tribu-taries. The system has a very wide main trunk with long, nar-row, north-south to northeast-southwest trending tributariesthat transect the other unconsolidated aquifer systems in thebasin.
The system contains large volumes of sand and gravel that
were deposited by glaciers and that fill the present majorstream valleys. As the glaciers melted, the sediment containedwithin them was delivered to adjacent streams in quantitiestoo large for the streams to transport. As a result, theincreased sediment load was stored in the valleys as verticaland lateral accretionary deposits. As long as the retreatingglaciers continued to provide sediment in quantities too largefor the streams to transport, the valleys continued to be filled.In this way, thick deposits of outwash sand and gravel accu-mulated in the valleys of the White River and its tributaries,forming the most prolific aquifer system in the basin.
The sand and gravel deposits of the White River andTributaries Outwash Aquifer system range from less than 20feet to more than 200 feet in thickness. Throughout the basin,the thick sands and gravels of the White River and TributariesOutwash Aquifer system abruptly contrast with the clay-richor bedrock environments of the surrounding aquifer systems.However, not all the sand and gravel is saturated with water.Actual aquifer thickness of the White River and TributariesOutwash Aquifer system ranges from 10 to 150 feet, but mostof the system has an aquifer thickness between 50 and 100feet.
The elevation of the aquifer system varies uniformly fromnorth to south. Along the northern extent of the aquifer sys-tem in Henry and Delaware Counties, the top of the aquifersystem is present at about 850-900 feet m.s.l. Where the sys-tem leaves the state in Knox and Gibson Counties, the eleva-tion is approximately 400 feet m.s.l. for the upper terraces andapproximately 350 feet m.s.l. for the modern flood plain.
Because the system is largely unconfined, static water lev-els are more consistent than in the surrounding aquifer sys-tems. Average static water levels of 25 feet or less are com-mon throughout the system.
The White River and Tributaries Outwash Aquifer systemis by far the most productive aquifer system in the basin andhas the potential to consistently meet the needs of high-capac-ity water users. Well yields of 500 gpm or greater can beexpected throughout most of the system. Presently, there area few wells that have the capacity to produce up to 2000 gpm.
White River and Tributaries Outwash AquiferSubsystem
In some areas of the White River and Tributaries OutwashAquifer system, thick zones of sand and gravel have beencovered by a layer of clay or till. The areas are surficially sim-ilar to the Tipton Till Plain Aquifer system, but are deposi-tionally related to the White River and Tributaries OutwashAquifer system. These areas have, therefore, been named theWhite River and Tributaries Outwash Aquifer subsystem.
The White River and Tributaries Outwash Aquifer subsys-tem is very similar to the White River and TributariesOutwash Aquifer system but is less productive, contains thin-ner sand and gravel zones, and contains greater amounts ofclay material. Sand and gravel zones in the subsystem rangein thickness from 12 to 54 feet, but are typically 20 to 40 feetthick. The upper portions of the sand and gravel zones in the
30 Ground-Water Resource Availability, West Fork and White River Basin
system, however, are commonly unsaturated.The White River and Tributaries Outwash Aquifer subsys-
tem has well depths ranging from 30 to 170 feet below sur-face, but they are typically about 70 feet below surface.Aquifer materials in the subsystem occur at elevations rang-ing from 850 feet m.s.l. in the northern part of the basin, to350 feet m.s.l. in the southern part of the basin. Static waterlevels in the wells in the subsystem occur between 10 and 125feet below the land surface, but commonly occur at 20 to 40feet beneath the surface.
Domestic wells in the White River and Tributaries OutwashAquifer subsystem yield from 10 to 50 gpm; but high-capac-ity wells producing up to 1000 gpm have been reported. Thelargest yields in this subsystem are in the northern portion ofthe basin, adjacent to the thick till cover of the Tipton TillPlain Aquifer system.
Buried Valley Aquifer System
The Buried Valley Aquifer system consists of aquifer mate-rials deposited in pre-glacial bedrock valleys in the West Forkof the White River basin. During valley development, layersof bedrock were dissected to create valleys that were subse-quently filled with unconsolidated glacial sediment of vari-able thickness. Although there are additional buried bedrockvalleys in the West Fork White River basin, only the largerburied valleys that contain significant water-bearing sedi-ments have been included as mapped units of the BuriedValley Aquifer system.
There are two significant buried bedrock valleys located inWest Fork White River basin; both cut into Mississippianbedrock. One, a narrow valley having appreciable outwash,trends northeast/southwest in southern Hendricks, Morgan,Putnam, and Owen Counties. The other, part of a largerburied valley system that extends into Putnam andMontgomery Counties in the Middle Wabash River basin, isin northwestern Hendricks County.
Wells in the Buried Valley Aquifer system are completed atdepths ranging from 75 to 250 feet, although well depthsranging from 100 to 175 feet are most common. Static waterlevels in the wells range from 10 to 80 feet below the groundsurface, but static water levels between 25 and 40 feet belowground surface are most common. Domestic wells typicallyyield from 10 to 50 gpm, but high-capacity wells may yieldas much as 300 to 1000 gpm. The highest yields are found inthe buried valley in northwestern Hendricks County.
Lacustrine and Backwater Deposits Aquifer System
The Lacustrine and Backwater Deposits Aquifer system,located primarily in the southern third of the basin, is made upof discontinuous bodies of deposits extending along areas ofoutwash close to the West Fork White River Valley. Thedeposits were formed in bodies of currentless or relativelystagnant lake water and are marked by soft silt and clay.These lake deposits are generally confined to valleys that are
tributary to the principle through valleys of southern Indiana,which carried most of the meltwater that poured from thewaning ice sheets.
The larger valleys, like the White River, were choked withsand and gravel carried from the glaciers by meltwater. In thelarger valleys, thick deposits of this material dammed andponded tributary streams, creating lakes. Today, thickdeposits of silt and clay sometimes called "slack water clay"mark the locations of these glacial lakes.
Also, when massive amounts of water were being releasedfrom the glaciers as they were retreating, from time to time,the existing valley was not sufficient to contain the water.Any pre-existing drainages or low spots in the bedrock sur-face were points of water collection. Temporary lakes formedin these areas, leaving fine-grained glaciolacustrine deposits.
The overall scarcity of productive zones of sand and grav-el in this aquifer system is apparent from the number ofground-water wells completed in the underlying bedrockaquifers. Sand and gravel lenses, when present, are common-ly less than 5 feet thick and are either confined within theglaciolacustrine deposits, or are directly overlying bedrock.Large-diameter bucket-rig wells are often employed whenother means of extracting seepage from the fine-graineddeposits are not available. Wells that penetrate the Lacustrineand Backwater Deposits Aquifer system commonly havedepths that range from 30 to 70 feet, but some have depths ofup to 120 feet. Static water levels in wells penetrating theaquifer system are typically less than 25 feet below the landsurface.
Yields from domestic wells range from 0 (dry holes) to 35gpm, but no known high-capacity well is completed in theaquifer system.
Bedrock aquifer systems
The occurrence of bedrock aquifers depends on the originalcomposition of the rocks and subsequent changes whichinfluence the hydraulic properties. Post-depositional process-es which promote jointing, fracturing, and solution activity ofexposed bedrock generally increase the hydraulic conductiv-ity of the upper portion of bedrock aquifer systems. Becausepermeability is usually greatest near the bedrock surface, theupper bedrock units are generally the most productiveaquifers. In the West Fork White River basin, rock typesexposed at the bedrock surface range from unproductiveshales to highly productive limestones and dolomites (plate 1).
The Silurian-Devonian Carbonate aquifer system, presentin the northern third of the basin is the most laterally exten-sive and productive bedrock aquifer system in the basin.Solution-enlarged joints in this system yield water in quanti-ty generally adequate for domestic, industrial, or municipaluse. This bedrock aquifer system is a major aquifer over wideareas in northern part of the state where it directly underliesglacial drift.
Bedrock aquifer systems in the basin are overlain byunconsolidated deposits of varying thickness (plate 6 and fig-ure 5). In northwest Hamilton County, as much as 400 feet of
Ground-Water Hydrology 31
unconsolidated material overlies bedrock. Many other areasin the basin, especially in the southern part, have 50 feet orless of unconsolidated material overlying bedrock. Most ofthe bedrock aquifers in the basin are under confined condi-tions. In other words, the water level (potentiometric surface)in wells completed in the aquifer rises above the top of theaquifer.
In places, sand and gravel aquifers are located immediate-ly overlying the bedrock surface. Many of these materials arefound in association with buried bedrock valleys but alsooccur elsewhere along the bedrock surface. Where unconsol-idated aquifers are in contact with the Silurian and DevonianCarbonate aquifer system, the two aquifers are hydraulicallylinked and have very similar hydraulic gradients.
The yield of a bedrock aquifer depends on its hydrauliccharacteristics and the nature of the overlying deposits. Shaleand glacial till act as aquitards, restricting recharge to under-lying bedrock aquifers. However, fracturing and/or jointingmay occur in aquitards, which can increase recharge to theunderlying aquifers.
On a general basis, the incidence of mineralized or evensaline ground water in Indiana increases rapidly at bedrockdepths below 300 feet, and even shallower in some areas.Therefore, a discussion and evaluation of the ground-waterpotential of the bedrock aquifers is essentially confined tothose geologic units lying above the expected limits of non-potable water.
In this report nine bedrock aquifer systems are identifiedfor the West Fork White River basin based on bedrock surfacelithology. They are, from east to west and oldest to youngest:Ordovician/Maquoketa Group; Silurian-DevonianCarbonate; Devonian and Mississipppian/NewAlbany Shale; Mississippian/Borden Group;Mississippian/Blue River and Sanders Groups;Mississippian/Buffalo Wallow, Stephensport, andWest Baden Groups; Pennsylvanian/Raccoon CreekGroup; Pennsylvanian/Carbondale Group; and thePennsylvanian/McLeansboro Group (plates 1 and 5).Hydraulic properties within the nine aquifer systems are high-ly variable.
Although this type of two-dimensional mapping is useful,it should be remembered that the Silurian-DevonianCarbonate rocks extend beneath the Devonian andMississippian/New Albany Shale Aquifer system (plate 1)and are used as a water supply within the latter's boundaries.This is also true for other aquifer systems that extend beneathless productive systems.
The bedrock aquifer systems extend across the basin gen-erally as a series of northwest/southeast trending bands ofvarying widths, equal approximately to their exposure at thebedrock surface (plates 1 and 5). In an area southwest of thebasin's midsection, the nearly parallel bands of bedrockbecome truncated and overlapping. The overlapping pattern isthe result of a long period of erosion that beveled entire sys-tems of older rocks. Subsequent burial of the erosion surfaceby sedimentation during Pennsylvanian time created one ofthe most widespread regional unconformities in the world,the Mississippian-Pennsylvanian unconformity. Younger
Pennsylvanian age rocks overlap onto progressively olderMississippian age rocks at increasing distances north of theOhio River.
In general, bedrock aquifers are not used as much as theunconsolidated aquifers in the northern part of the West ForkWhite River basin because adequate ground water is usuallyavailable from the shallower unconsolidated materials. In thesouthern part of the basin, however, bedrock aquifers aremore commonly used because the unconsolidated materialsoverlying the bedrock typically consist of relatively thin, non-productive glacial till or weathered bedrock residuum.
Ordovician/Maquoketa Group
The Maquoketa Group of Ordovician age is present at thebedrock surface in small areas in Randolph, Delaware, Henry,and Madison counties (plate 5). It is the least extensivebedrock aquifer system in the West Fork White River basin.The rocks in this group are the oldest at the bedrock surfacein the basin, exposed only in preglacial valleys that have sincebeen filled with glacial drift. The group consists of interbed-ded shales and limestones. Gray calcareous shale dominatesthe group, but brown carbonaceous shale characterizes thelowermost part of the group. Limestone, which constitutesabout 20 percent of the group, is most abundant in the upperpart.
The thickness of the Maquoketa Group is highly variablebecause the top of the group is an erosional disconformity andhas local relief of more than 100 feet due to preglacial erosionof the bedrock surface (plate 1).
Wells completed in the Ordovician bedrock aquifer systemin the West Fork White River basin range from 112 to 600feet deep. Well depth depends upon bedrock elevation andunconsolidated material thickness. The bedrock surface ele-vation for a specific area may be estimated using plate 3a.The thickness of unconsolidated material for an area may beestimated by using plate 6 or figure 5. The amount of pene-tration of wells into bedrock in this aquifer system is alsohighly variable, and ranges from about 10 to more than 290feet. Data are not sufficient to correlate yields with theamount of penetration. Static water levels in wells developedin this system range from 0 to 60 feet beneath the land sur-face, but are usually between 10 and 50 feet below ground.
In general, because of the high shale content, theMaquoketa Group is considered as an aquitard having pooryield potential. However, in the West Fork White River basinhigher yields are reported than in other parts of the statebecause there is higher limestone content in the upper part ofthe group. The moderate yield potential in the basin is relatedto joints and solution cavities that formed in the limestoneunits.
Well yields from the Maquoketa Group, as indicated bydrillers' tests, range from 0 to 200 gpm. Yields of 5 to 15 gpmare typical and yields above 15 gpm are not common. Somedry holes (for practical purposes) have been reported.
Because the Maquoketa is generally not highly productiveit is typically used only when the overlying drift does not con-
32 Ground-Water Resource Availability, West Fork and White River Basin
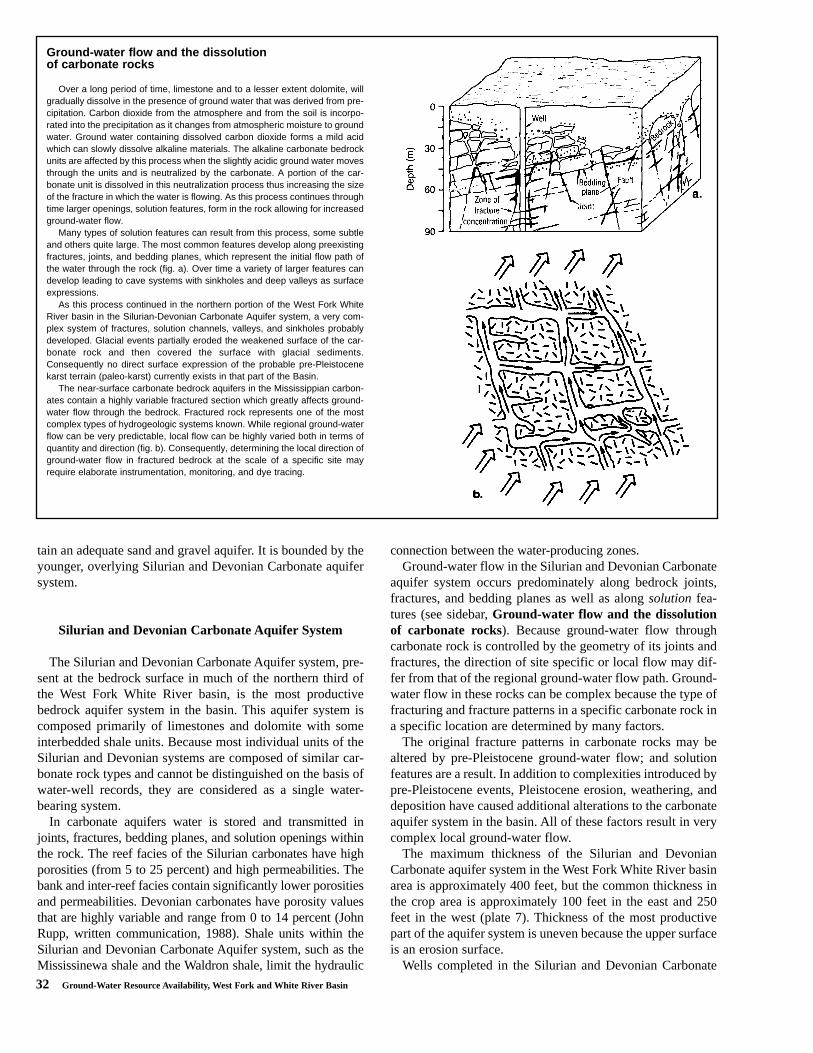
Ground-water flow and the dissolution of carbonate rocks
Over a long period of time, limestone and to a lesser extent dolomite, willgradually dissolve in the presence of ground water that was derived from pre-cipitation. Carbon dioxide from the atmosphere and from the soil is incorpo-rated into the precipitation as it changes from atmospheric moisture to groundwater. Ground water containing dissolved carbon dioxide forms a mild acidwhich can slowly dissolve alkaline materials. The alkaline carbonate bedrockunits are affected by this process when the slightly acidic ground water movesthrough the units and is neutralized by the carbonate. A portion of the car-bonate unit is dissolved in this neutralization process thus increasing the sizeof the fracture in which the water is flowing. As this process continues throughtime larger openings, solution features, form in the rock allowing for increasedground-water flow.
Many types of solution features can result from this process, some subtleand others quite large. The most common features develop along preexistingfractures, joints, and bedding planes, which represent the initial flow path ofthe water through the rock (fig. a). Over time a variety of larger features candevelop leading to cave systems with sinkholes and deep valleys as surfaceexpressions.
As this process continued in the northern portion of the West Fork WhiteRiver basin in the Silurian-Devonian Carbonate Aquifer system, a very com-plex system of fractures, solution channels, valleys, and sinkholes probablydeveloped. Glacial events partially eroded the weakened surface of the car-bonate rock and then covered the surface with glacial sediments.Consequently no direct surface expression of the probable pre-Pleistocenekarst terrain (paleo-karst) currently exists in that part of the Basin.
The near-surface carbonate bedrock aquifers in the Mississippian carbon-ates contain a highly variable fractured section which greatly affects ground-water flow through the bedrock. Fractured rock represents one of the mostcomplex types of hydrogeologic systems known. While regional ground-waterflow can be very predictable, local flow can be highly varied both in terms ofquantity and direction (fig. b). Consequently, determining the local direction ofground-water flow in fractured bedrock at the scale of a specific site mayrequire elaborate instrumentation, monitoring, and dye tracing.
tain an adequate sand and gravel aquifer. It is bounded by theyounger, overlying Silurian and Devonian Carbonate aquifersystem.
Silurian and Devonian Carbonate Aquifer System
The Silurian and Devonian Carbonate Aquifer system, pre-sent at the bedrock surface in much of the northern third ofthe West Fork White River basin, is the most productivebedrock aquifer system in the basin. This aquifer system iscomposed primarily of limestones and dolomite with someinterbedded shale units. Because most individual units of theSilurian and Devonian systems are composed of similar car-bonate rock types and cannot be distinguished on the basis ofwater-well records, they are considered as a single water-bearing system.
In carbonate aquifers water is stored and transmitted injoints, fractures, bedding planes, and solution openings withinthe rock. The reef facies of the Silurian carbonates have highporosities (from 5 to 25 percent) and high permeabilities. Thebank and inter-reef facies contain significantly lower porositiesand permeabilities. Devonian carbonates have porosity valuesthat are highly variable and range from 0 to 14 percent (JohnRupp, written communication, 1988). Shale units within theSilurian and Devonian Carbonate Aquifer system, such as theMississinewa shale and the Waldron shale, limit the hydraulic
connection between the water-producing zones.Ground-water flow in the Silurian and Devonian Carbonate
aquifer system occurs predominately along bedrock joints,fractures, and bedding planes as well as along solution fea-tures (see sidebar, Ground-water flow and the dissolutionof carbonate rocks). Because ground-water flow throughcarbonate rock is controlled by the geometry of its joints andfractures, the direction of site specific or local flow may dif-fer from that of the regional ground-water flow path. Ground-water flow in these rocks can be complex because the type offracturing and fracture patterns in a specific carbonate rock ina specific location are determined by many factors.
The original fracture patterns in carbonate rocks may bealtered by pre-Pleistocene ground-water flow; and solutionfeatures are a result. In addition to complexities introduced bypre-Pleistocene events, Pleistocene erosion, weathering, anddeposition have caused additional alterations to the carbonateaquifer system in the basin. All of these factors result in verycomplex local ground-water flow.
The maximum thickness of the Silurian and DevonianCarbonate aquifer system in the West Fork White River basinarea is approximately 400 feet, but the common thickness inthe crop area is approximately 100 feet in the east and 250feet in the west (plate 7). Thickness of the most productivepart of the aquifer system is uneven because the upper surfaceis an erosion surface.
Wells completed in the Silurian and Devonian Carbonate
Ground-Water Hydrology 33
Aquifer system range from 24 to 460 feet deep, but mostwells are constructed at depths of 100 to 230 feet. Deep, high-capacity wells commonly penetrate 50 to 260 feet of carbon-ate rock, and some wells have been reported to penetrate upto 332 feet of rock. Domestic wells commonly only penetratethe upper 30 to 120 feet of the carbonate bedrock.
The elevations of water-bearing zones in the Silurian andDevonian Carbonate Aquifer system vary substantially. Theapproximate elevation of the bedrock surface for a specificlocation may be determined by using the bedrock topographymap (plates 3a and b).
Static water levels in the wells completed in the carbonateaquifer vary from 0 feet to 180 feet beneath the land surface;however, static levels usually are between 10 and 40 feetbelow ground. Flowing wells have been reported at scatteredlocations in the basin.
Water well data indicate that the most productive part of thecarbonate aquifer occurs within the upper 100 feet, and inmany places, within a few feet of the bedrock surface.However, other zones of relatively high permeability dooccur at greater depth. The deeper zones are most likely to bepenetrated by large diameter, high-capacity wells in anattempt to increase available drawdown in the well and obtainmaximum yield.
Well yields depend on the diameter of the well and aquifercharacteristics. Most of the wells in this bedrock system are4- to 6-inch-diameter domestic wells. Most domestic wellscan be expected to produce between 10 and 40 gpm, but wellyields range from one to 100 gpm. Yields of larger-diameterwells generally range from 50 to 350 gpm, but higher-yield-ing wells may be possible where several feet of sand andgravel are directly overlying the bedrock surface. Largewells, having 8- to 16-inch diameters, are usually industrial,municipal, or irrigation supply wells. The Silurian andDevonian carbonate system is one of the few bedrock systemsin the West Fork White River basin generally capable of sus-taining high-capacity well yields.
Silurian and Devonian Carbonate aquifers are an importantsource of water for many communities in the northern third ofthe basin and are also utilized by thousands of residentsserved by individual domestic wells. The Silurian andDevonian Carbonate aquifer system is bounded on the westby the New Albany Shale aquifer system. In some areas nearthe contact between the New Albany Shale and the Devoniancarbonates, wells are drilled through the shale and into themore productive underlying carbonate rocks. Because theoverlying shale inhibits recharge and because fracturing maynot be well developed in the carbonates, these wells are lessproductive than wells completed in carbonates not overlainby shale.
Devonian and Mississippian/ New Albany Shale
The Devonian and Mississippian/New Albany Shalebedrock aquifer is present in the West Fork White River basinas a narrow strip extending from southeast Boone Countyacross western Marion County, into northern Johnson County.
The New Albany Shale overlies the Devonian carbonatebedrock and is primarily Devonian age, except for the upperfew feet that are Mississippian age.
This bedrock aquifer system is predominately brownish-black carbon-rich shale having a thickness of about 100 to120 feet near its subcrop in the center of the basin to 210 feetin the southwestern part of the basin. It is often mistakenlyreported as slate. It contains minor amounts of dolomite anddolomitic quartz sandstone.
Although wells completed in the New Albany Shale vary indepth from 62 to 318 feet, most are constructed at depths of130 to 220 feet. Wells developed in the New Albany Shalepenetrate from 2 to 120 feet of shale; but most wells penetratefrom 12 to 60 feet. Static water levels in wells completed inthe shale aquifer range from 8 feet to 105 feet beneath theland surface; however, levels usually are between 25 and 70feet below the surface.
The elevations of water-bearing zones in the New AlbanyShale Aquifer system vary substantially. The approximateelevation of the bedrock surface for a specific location maybe determined by using the bedrock topography map (plate3b).
Although several dozen wells are reported producing waterfrom the New Albany Shale, the formation is not consideredas a significant aquifer. Most wells in the New Albany Shaleyield 5 gpm or less, and dry holes are common; however, afew yields of up to 20 gpm have been reported. Wells areoften drilled through the New Albany Shale into the underly-ing carbonates in an attempt to get higher well yields.
This bedrock aquifer system is often associated with "sul-fur water", mineralized water, or saline water. The NewAlbany Shale Bedrock aquifer system is bounded on the westby the Mississippian/Borden Group Bedrock Aquifer system.
Mississippian Bedrock
The Mississippian age bedrock aquifers can be broken intothree reasonably distinct groups. They include the lowermost(oldest) siltstone and shale formations of the Borden Group;the middle Mississippian age limestone sequence of the BlueRiver and Sanders Groups that is prominent in south-centralIndiana; and the uppermost (youngest) alternating limestone-shale-sandstone units of Buffalo Wallow, Stephensport, andWest Baden Groups.
Mississippian/Borden Group
The Mississippian Borden Bedrock Aquifer Group occu-pies much of the mid-section of the West Fork White Riverbasin. It encompasses most of Hendricks and Morgan coun-ties and portions of Boone, Putnam, Johnson, Brown, andMonroe counties. This bedrock aquifer system is composedprimarily of siltstone and shale. Fine-grained sandstones arecommon. Carbonates are rare, occurring as discontinuousinterbedded limestone lenses mostly in the upper portion ofthe group. The Rockford limestone, an important marker bed
34 Ground-Water Resource Availability, West Fork and White River Basin
where present, separates the New Albany Shale and theBorden Group.
The Borden Group ranges from 0 to about 750 feet in thick-ness at its outcrop and subcrop in the basin. It generally thinsas it dips to the southwest beneath younger rock formations.
Well depths in the Borden Aquifer system range from 28 to400 feet. Most wells are completed at depths of 70 to 140 feet.The amount of Borden rock penetrated typically ranges fromabout 30 to 100 feet, with a maximum of 375 feet. Most of thewater is found in the upper 100 feet of the rock, although dataare not sufficient to correlate yields with the amount of pene-tration. Static water levels in the wells completed in theBorden aquifer range from 0 to 180 feet below land surfacebut commonly are between 10 and 40 feet.
The elevations of water-bearing zones in the BordenAquifer system vary substantially. The approximate elevationof the bedrock surface is shown on plates 3b and c.
The Borden Group is often regarded as an aquitard; andattempts to get water from wells drilled into it have oftenfailed. However, many wells are able to produce sufficientwater for domestic purposes. Most domestic wells completedin the group yield from 1 to 5 gpm. A few wells have beentested at up to 50 gpm, but it is doubtful that many could sus-tain such a rate for very long. Although one 8-inch diameterwell was reportedly tested at 154 gpm, overall there is almostno chance for development of high-capacity wells in theBorden Group aquifer system.
Because the Borden Group is generally not very produc-tive, it is typically used only where overlying glacial drift oroutwash deposits (if present) do not contain a sand or gravelaquifer. In the eastern portion of its outcrop area where theBorden is not more than about 300 feet thick, a few wellshave been drilled through it and the New Albany Shale intothe Silurian and Devonian Carbonate aquifer system.However, wells over about 500 feet deep may encounter non-potable (mineralized or salty) water. The Borden Group isbounded on the west by the Blue River and Sanders Groups.
Mississippian/Blue River and Sanders Groups
This Middle Mississippian age aquifer system, located in anarrow band in the south-central part of the West Fork WhiteRiver basin, overlies the Borden Group. This aquifer systemencompasses two groups: the lowermost Sanders and theoverlying Blue River groups. The Sanders Group includes theHarrodsburg and Salem limestone formations. These are pri-marily limestone with some dolomitic limestone content. TheBlue River Group includes the St. Louis, St. Genevieve, andthe Paoli limestone formations. These are primarily lime-stones containing significant amounts of gypsum, anhydrite,shale, chert, and calcareous sandstone.
The combined Blue River and Sanders groups range inthickness from 0 to about 600 feet in the outcrop/subcrop areaof the basin. However, as the strata dip to the southwestbeneath younger rocks the thickness increases to about 1500feet where the White River empties into the Wabash River.The Blue River Group is truncated in northern Putnam
County by pre-Pennsylvanian erosion. There it is uncon-formably overlain by the Mansfield Formation ofPennsylvanian age. The Sanders Group is also truncated inthe north by pre-Pennsylvanian erosion and is also overlainunconformably by the Mansfield.
Well depths in the Blue River and Sanders Group Aquifersystem vary from 16 to 423 feet, but most wells are complet-ed at depths of about 80 to 170 feet. The amount of rock pen-etrated by a well typically ranges from about 35 to 140 feet,with a maximum of 411 feet. Most of the water is found in theupper 100 feet of the rock. However, no attempt was made tocorrelate yields with the amount of penetration or the indi-vidual geologic formations.
The elevations of water-bearing zones in the Blue Riverand Sanders Groups aquifer system vary substantially. Theapproximate elevation to bedrock for a specific location maybe determined by using the bedrock topography map (plates3b and c).
Static water levels are quite variable in the wells complet-ed in the aquifer. Water levels ranging from 0 feet to 202 feetbelow land surface have been reported; however, water levelsusually are between 20 and 75 feet below ground.
The Blue River and Sanders Groups Aquifer system is notregarded as a major ground-water resource. However, mostattempts to drill a domestic well into it are successful. Mostdomestic wells completed in the system have been tested at 2to 25 gpm. A few public water supply wells have been testedat 9 to 192 gpm. Very few wells could sustain a pumping rateover 50 gpm for long.
The outcrop/subcrop area of the Blue River and SandersGroups is well known for significant karst development.Because of the shallow rock, open joints, and solution chan-nels the aquifer system is quite susceptible to contaminantsintroduced at and near land surface. The Blue River andSanders Group is bounded on the west by the BuffaloWallow, Stephensport, and West Baden Groups.
Mississippian/Buffalo Wallow, Stephensport, and WestBaden Groups
This Upper Mississipppian bedrock aquifer system is limit-ed to a small area in central Owen and east-central GreeneCounties. It is laterally discontinuous and has been truncatednorthward as a result of pre-Pennsylvanian erosion. The pre-sent near-surface thickness and occurrence of the depositsforming this bedrock aquifer system have been altered by theMississippian-Pennsylvanian unconformity throughout theWest Fork White River basin.
This bedrock aquifer system, composed primarily of shale,limestone, and sandstone, consists of three groups, from old-est to youngest: West Baden, Stephensport, and BuffaloWallow. The three groups comprising this bedrock aquifersystem differ in their percentages of shale, limestone andsandstone.
The lowermost West Baden Group consists dominantly ofgray to varicolored shale and mudstone (approximately 40percent) and thin-bedded to cross-bedded sandstone (35 per-
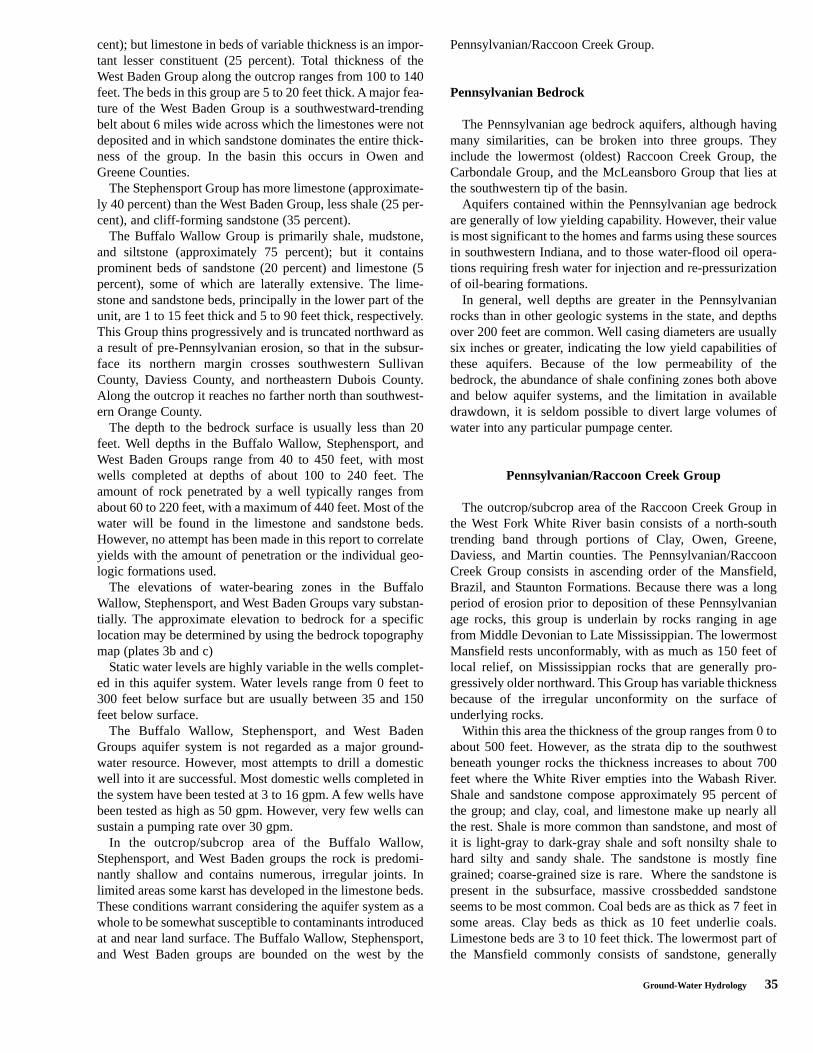
Ground-Water Hydrology 35
cent); but limestone in beds of variable thickness is an impor-tant lesser constituent (25 percent). Total thickness of theWest Baden Group along the outcrop ranges from 100 to 140feet. The beds in this group are 5 to 20 feet thick. A major fea-ture of the West Baden Group is a southwestward-trendingbelt about 6 miles wide across which the limestones were notdeposited and in which sandstone dominates the entire thick-ness of the group. In the basin this occurs in Owen andGreene Counties.
The Stephensport Group has more limestone (approximate-ly 40 percent) than the West Baden Group, less shale (25 per-cent), and cliff-forming sandstone (35 percent).
The Buffalo Wallow Group is primarily shale, mudstone,and siltstone (approximately 75 percent); but it containsprominent beds of sandstone (20 percent) and limestone (5percent), some of which are laterally extensive. The lime-stone and sandstone beds, principally in the lower part of theunit, are 1 to 15 feet thick and 5 to 90 feet thick, respectively.This Group thins progressively and is truncated northward asa result of pre-Pennsylvanian erosion, so that in the subsur-face its northern margin crosses southwestern SullivanCounty, Daviess County, and northeastern Dubois County.Along the outcrop it reaches no farther north than southwest-ern Orange County.
The depth to the bedrock surface is usually less than 20feet. Well depths in the Buffalo Wallow, Stephensport, andWest Baden Groups range from 40 to 450 feet, with mostwells completed at depths of about 100 to 240 feet. Theamount of rock penetrated by a well typically ranges fromabout 60 to 220 feet, with a maximum of 440 feet. Most of thewater will be found in the limestone and sandstone beds.However, no attempt has been made in this report to correlateyields with the amount of penetration or the individual geo-logic formations used.
The elevations of water-bearing zones in the BuffaloWallow, Stephensport, and West Baden Groups vary substan-tially. The approximate elevation to bedrock for a specificlocation may be determined by using the bedrock topographymap (plates 3b and c)
Static water levels are highly variable in the wells complet-ed in this aquifer system. Water levels range from 0 feet to300 feet below surface but are usually between 35 and 150feet below surface.
The Buffalo Wallow, Stephensport, and West BadenGroups aquifer system is not regarded as a major ground-water resource. However, most attempts to drill a domesticwell into it are successful. Most domestic wells completed inthe system have been tested at 3 to 16 gpm. A few wells havebeen tested as high as 50 gpm. However, very few wells cansustain a pumping rate over 30 gpm.
In the outcrop/subcrop area of the Buffalo Wallow,Stephensport, and West Baden groups the rock is predomi-nantly shallow and contains numerous, irregular joints. Inlimited areas some karst has developed in the limestone beds.These conditions warrant considering the aquifer system as awhole to be somewhat susceptible to contaminants introducedat and near land surface. The Buffalo Wallow, Stephensport,and West Baden groups are bounded on the west by the
Pennsylvanian/Raccoon Creek Group.
Pennsylvanian Bedrock
The Pennsylvanian age bedrock aquifers, although havingmany similarities, can be broken into three groups. Theyinclude the lowermost (oldest) Raccoon Creek Group, theCarbondale Group, and the McLeansboro Group that lies atthe southwestern tip of the basin.
Aquifers contained within the Pennsylvanian age bedrockare generally of low yielding capability. However, their valueis most significant to the homes and farms using these sourcesin southwestern Indiana, and to those water-flood oil opera-tions requiring fresh water for injection and re-pressurizationof oil-bearing formations.
In general, well depths are greater in the Pennsylvanianrocks than in other geologic systems in the state, and depthsover 200 feet are common. Well casing diameters are usuallysix inches or greater, indicating the low yield capabilities ofthese aquifers. Because of the low permeability of thebedrock, the abundance of shale confining zones both aboveand below aquifer systems, and the limitation in availabledrawdown, it is seldom possible to divert large volumes ofwater into any particular pumpage center.
Pennsylvanian/Raccoon Creek Group
The outcrop/subcrop area of the Raccoon Creek Group inthe West Fork White River basin consists of a north-southtrending band through portions of Clay, Owen, Greene,Daviess, and Martin counties. The Pennsylvanian/RaccoonCreek Group consists in ascending order of the Mansfield,Brazil, and Staunton Formations. Because there was a longperiod of erosion prior to deposition of these Pennsylvanianage rocks, this group is underlain by rocks ranging in agefrom Middle Devonian to Late Mississippian. The lowermostMansfield rests unconformably, with as much as 150 feet oflocal relief, on Mississippian rocks that are generally pro-gressively older northward. This Group has variable thicknessbecause of the irregular unconformity on the surface ofunderlying rocks.
Within this area the thickness of the group ranges from 0 toabout 500 feet. However, as the strata dip to the southwestbeneath younger rocks the thickness increases to about 700feet where the White River empties into the Wabash River.Shale and sandstone compose approximately 95 percent ofthe group; and clay, coal, and limestone make up nearly allthe rest. Shale is more common than sandstone, and most ofit is light-gray to dark-gray shale and soft nonsilty shale tohard silty and sandy shale. The sandstone is mostly finegrained; coarse-grained size is rare. Where the sandstone ispresent in the subsurface, massive crossbedded sandstoneseems to be most common. Coal beds are as thick as 7 feet insome areas. Clay beds as thick as 10 feet underlie coals.Limestone beds are 3 to 10 feet thick. The lowermost part ofthe Mansfield commonly consists of sandstone, generally
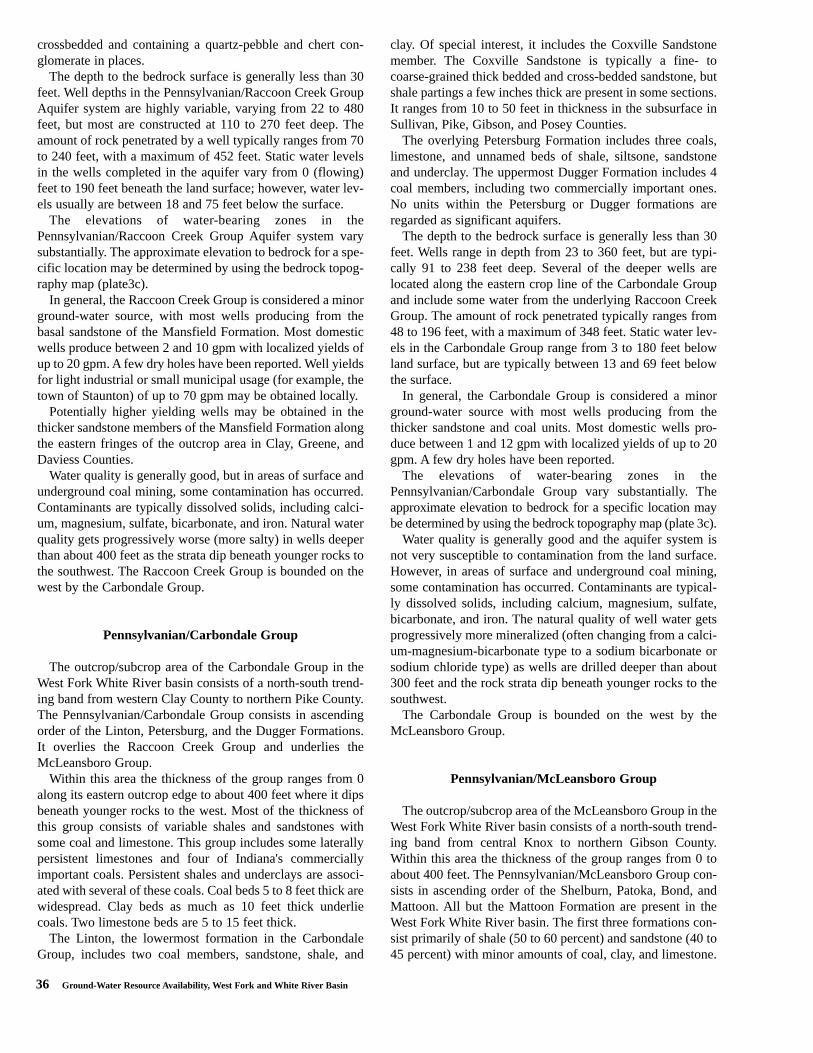
36 Ground-Water Resource Availability, West Fork and White River Basin
crossbedded and containing a quartz-pebble and chert con-glomerate in places.
The depth to the bedrock surface is generally less than 30feet. Well depths in the Pennsylvanian/Raccoon Creek GroupAquifer system are highly variable, varying from 22 to 480feet, but most are constructed at 110 to 270 feet deep. Theamount of rock penetrated by a well typically ranges from 70to 240 feet, with a maximum of 452 feet. Static water levelsin the wells completed in the aquifer vary from 0 (flowing)feet to 190 feet beneath the land surface; however, water lev-els usually are between 18 and 75 feet below the surface.
The elevations of water-bearing zones in thePennsylvanian/Raccoon Creek Group Aquifer system varysubstantially. The approximate elevation to bedrock for a spe-cific location may be determined by using the bedrock topog-raphy map (plate3c).
In general, the Raccoon Creek Group is considered a minorground-water source, with most wells producing from thebasal sandstone of the Mansfield Formation. Most domesticwells produce between 2 and 10 gpm with localized yields ofup to 20 gpm. A few dry holes have been reported. Well yieldsfor light industrial or small municipal usage (for example, thetown of Staunton) of up to 70 gpm may be obtained locally.
Potentially higher yielding wells may be obtained in thethicker sandstone members of the Mansfield Formation alongthe eastern fringes of the outcrop area in Clay, Greene, andDaviess Counties.
Water quality is generally good, but in areas of surface andunderground coal mining, some contamination has occurred.Contaminants are typically dissolved solids, including calci-um, magnesium, sulfate, bicarbonate, and iron. Natural waterquality gets progressively worse (more salty) in wells deeperthan about 400 feet as the strata dip beneath younger rocks tothe southwest. The Raccoon Creek Group is bounded on thewest by the Carbondale Group.
Pennsylvanian/Carbondale Group
The outcrop/subcrop area of the Carbondale Group in theWest Fork White River basin consists of a north-south trend-ing band from western Clay County to northern Pike County.The Pennsylvanian/Carbondale Group consists in ascendingorder of the Linton, Petersburg, and the Dugger Formations.It overlies the Raccoon Creek Group and underlies theMcLeansboro Group.
Within this area the thickness of the group ranges from 0along its eastern outcrop edge to about 400 feet where it dipsbeneath younger rocks to the west. Most of the thickness ofthis group consists of variable shales and sandstones withsome coal and limestone. This group includes some laterallypersistent limestones and four of Indiana's commerciallyimportant coals. Persistent shales and underclays are associ-ated with several of these coals. Coal beds 5 to 8 feet thick arewidespread. Clay beds as much as 10 feet thick underliecoals. Two limestone beds are 5 to 15 feet thick.
The Linton, the lowermost formation in the CarbondaleGroup, includes two coal members, sandstone, shale, and
clay. Of special interest, it includes the Coxville Sandstonemember. The Coxville Sandstone is typically a fine- tocoarse-grained thick bedded and cross-bedded sandstone, butshale partings a few inches thick are present in some sections.It ranges from 10 to 50 feet in thickness in the subsurface inSullivan, Pike, Gibson, and Posey Counties.
The overlying Petersburg Formation includes three coals,limestone, and unnamed beds of shale, siltsone, sandstoneand underclay. The uppermost Dugger Formation includes 4coal members, including two commercially important ones.No units within the Petersburg or Dugger formations areregarded as significant aquifers.
The depth to the bedrock surface is generally less than 30feet. Wells range in depth from 23 to 360 feet, but are typi-cally 91 to 238 feet deep. Several of the deeper wells arelocated along the eastern crop line of the Carbondale Groupand include some water from the underlying Raccoon CreekGroup. The amount of rock penetrated typically ranges from48 to 196 feet, with a maximum of 348 feet. Static water lev-els in the Carbondale Group range from 3 to 180 feet belowland surface, but are typically between 13 and 69 feet belowthe surface.
In general, the Carbondale Group is considered a minorground-water source with most wells producing from thethicker sandstone and coal units. Most domestic wells pro-duce between 1 and 12 gpm with localized yields of up to 20gpm. A few dry holes have been reported.
The elevations of water-bearing zones in thePennsylvanian/Carbondale Group vary substantially. Theapproximate elevation to bedrock for a specific location maybe determined by using the bedrock topography map (plate 3c).
Water quality is generally good and the aquifer system isnot very susceptible to contamination from the land surface.However, in areas of surface and underground coal mining,some contamination has occurred. Contaminants are typical-ly dissolved solids, including calcium, magnesium, sulfate,bicarbonate, and iron. The natural quality of well water getsprogressively more mineralized (often changing from a calci-um-magnesium-bicarbonate type to a sodium bicarbonate orsodium chloride type) as wells are drilled deeper than about300 feet and the rock strata dip beneath younger rocks to thesouthwest.
The Carbondale Group is bounded on the west by theMcLeansboro Group.
Pennsylvanian/McLeansboro Group
The outcrop/subcrop area of the McLeansboro Group in theWest Fork White River basin consists of a north-south trend-ing band from central Knox to northern Gibson County.Within this area the thickness of the group ranges from 0 toabout 400 feet. The Pennsylvanian/McLeansboro Group con-sists in ascending order of the Shelburn, Patoka, Bond, andMattoon. All but the Mattoon Formation are present in theWest Fork White River basin. The first three formations con-sist primarily of shale (50 to 60 percent) and sandstone (40 to45 percent) with minor amounts of coal, clay, and limestone.
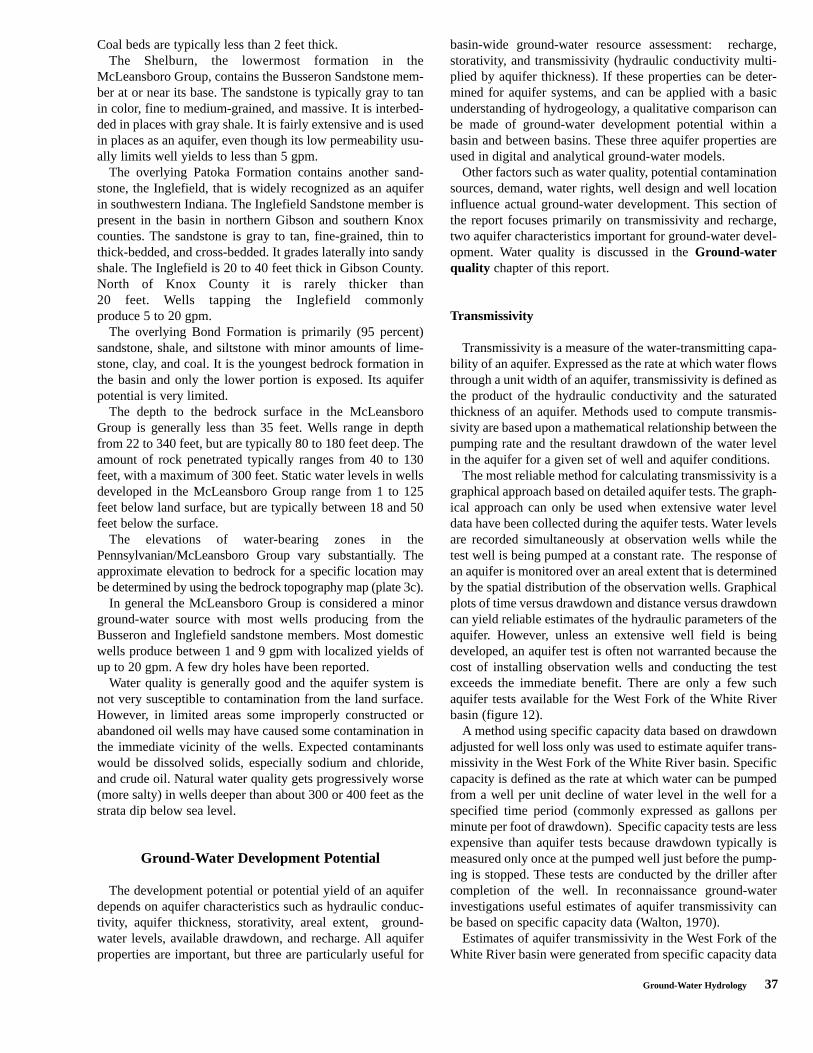
Ground-Water Hydrology 37
Coal beds are typically less than 2 feet thick.The Shelburn, the lowermost formation in the
McLeansboro Group, contains the Busseron Sandstone mem-ber at or near its base. The sandstone is typically gray to tanin color, fine to medium-grained, and massive. It is interbed-ded in places with gray shale. It is fairly extensive and is usedin places as an aquifer, even though its low permeability usu-ally limits well yields to less than 5 gpm.
The overlying Patoka Formation contains another sand-stone, the Inglefield, that is widely recognized as an aquiferin southwestern Indiana. The Inglefield Sandstone member ispresent in the basin in northern Gibson and southern Knoxcounties. The sandstone is gray to tan, fine-grained, thin tothick-bedded, and cross-bedded. It grades laterally into sandyshale. The Inglefield is 20 to 40 feet thick in Gibson County.North of Knox County it is rarely thicker than 20 feet. Wells tapping the Inglefield commonly produce 5 to 20 gpm.
The overlying Bond Formation is primarily (95 percent)sandstone, shale, and siltstone with minor amounts of lime-stone, clay, and coal. It is the youngest bedrock formation inthe basin and only the lower portion is exposed. Its aquiferpotential is very limited.
The depth to the bedrock surface in the McLeansboroGroup is generally less than 35 feet. Wells range in depthfrom 22 to 340 feet, but are typically 80 to 180 feet deep. Theamount of rock penetrated typically ranges from 40 to 130feet, with a maximum of 300 feet. Static water levels in wellsdeveloped in the McLeansboro Group range from 1 to 125feet below land surface, but are typically between 18 and 50feet below the surface.
The elevations of water-bearing zones in thePennsylvanian/McLeansboro Group vary substantially. Theapproximate elevation to bedrock for a specific location maybe determined by using the bedrock topography map (plate 3c).
In general the McLeansboro Group is considered a minorground-water source with most wells producing from theBusseron and Inglefield sandstone members. Most domesticwells produce between 1 and 9 gpm with localized yields ofup to 20 gpm. A few dry holes have been reported.
Water quality is generally good and the aquifer system isnot very susceptible to contamination from the land surface.However, in limited areas some improperly constructed orabandoned oil wells may have caused some contamination inthe immediate vicinity of the wells. Expected contaminantswould be dissolved solids, especially sodium and chloride,and crude oil. Natural water quality gets progressively worse(more salty) in wells deeper than about 300 or 400 feet as thestrata dip below sea level.
Ground-Water Development Potential
The development potential or potential yield of an aquiferdepends on aquifer characteristics such as hydraulic conduc-tivity, aquifer thickness, storativity, areal extent, ground-water levels, available drawdown, and recharge. All aquiferproperties are important, but three are particularly useful for
basin-wide ground-water resource assessment: recharge,storativity, and transmissivity (hydraulic conductivity multi-plied by aquifer thickness). If these properties can be deter-mined for aquifer systems, and can be applied with a basicunderstanding of hydrogeology, a qualitative comparison canbe made of ground-water development potential within abasin and between basins. These three aquifer properties areused in digital and analytical ground-water models.
Other factors such as water quality, potential contaminationsources, demand, water rights, well design and well locationinfluence actual ground-water development. This section ofthe report focuses primarily on transmissivity and recharge,two aquifer characteristics important for ground-water devel-opment. Water quality is discussed in the Ground-waterquality chapter of this report.
Transmissivity
Transmissivity is a measure of the water-transmitting capa-bility of an aquifer. Expressed as the rate at which water flowsthrough a unit width of an aquifer, transmissivity is defined asthe product of the hydraulic conductivity and the saturatedthickness of an aquifer. Methods used to compute transmis-sivity are based upon a mathematical relationship between thepumping rate and the resultant drawdown of the water levelin the aquifer for a given set of well and aquifer conditions.
The most reliable method for calculating transmissivity is agraphical approach based on detailed aquifer tests. The graph-ical approach can only be used when extensive water leveldata have been collected during the aquifer tests. Water levelsare recorded simultaneously at observation wells while thetest well is being pumped at a constant rate. The response ofan aquifer is monitored over an areal extent that is determinedby the spatial distribution of the observation wells. Graphicalplots of time versus drawdown and distance versus drawdowncan yield reliable estimates of the hydraulic parameters of theaquifer. However, unless an extensive well field is beingdeveloped, an aquifer test is often not warranted because thecost of installing observation wells and conducting the testexceeds the immediate benefit. There are only a few suchaquifer tests available for the West Fork of the White Riverbasin (figure 12).
A method using specific capacity data based on drawdownadjusted for well loss only was used to estimate aquifer trans-missivity in the West Fork of the White River basin. Specificcapacity is defined as the rate at which water can be pumpedfrom a well per unit decline of water level in the well for aspecified time period (commonly expressed as gallons perminute per foot of drawdown). Specific capacity tests are lessexpensive than aquifer tests because drawdown typically ismeasured only once at the pumped well just before the pump-ing is stopped. These tests are conducted by the driller aftercompletion of the well. In reconnaissance ground-waterinvestigations useful estimates of aquifer transmissivity canbe based on specific capacity data (Walton, 1970).
Estimates of aquifer transmissivity in the West Fork of theWhite River basin were generated from specific capacity data
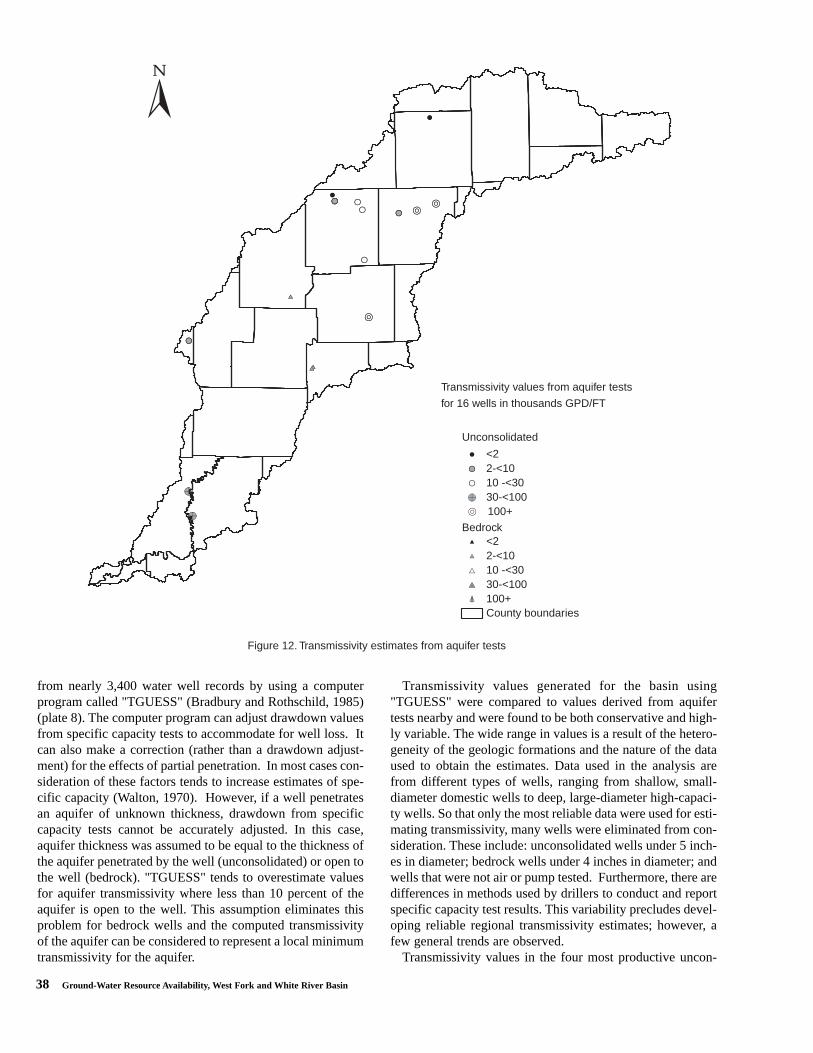
38 Ground-Water Resource Availability, West Fork and White River Basin
from nearly 3,400 water well records by using a computerprogram called "TGUESS" (Bradbury and Rothschild, 1985)(plate 8). The computer program can adjust drawdown valuesfrom specific capacity tests to accommodate for well loss. Itcan also make a correction (rather than a drawdown adjust-ment) for the effects of partial penetration. In most cases con-sideration of these factors tends to increase estimates of spe-cific capacity (Walton, 1970). However, if a well penetratesan aquifer of unknown thickness, drawdown from specificcapacity tests cannot be accurately adjusted. In this case,aquifer thickness was assumed to be equal to the thickness ofthe aquifer penetrated by the well (unconsolidated) or open tothe well (bedrock). "TGUESS" tends to overestimate valuesfor aquifer transmissivity where less than 10 percent of theaquifer is open to the well. This assumption eliminates thisproblem for bedrock wells and the computed transmissivityof the aquifer can be considered to represent a local minimumtransmissivity for the aquifer.
Transmissivity values generated for the basin using"TGUESS" were compared to values derived from aquifertests nearby and were found to be both conservative and high-ly variable. The wide range in values is a result of the hetero-geneity of the geologic formations and the nature of the dataused to obtain the estimates. Data used in the analysis arefrom different types of wells, ranging from shallow, small-diameter domestic wells to deep, large-diameter high-capaci-ty wells. So that only the most reliable data were used for esti-mating transmissivity, many wells were eliminated from con-sideration. These include: unconsolidated wells under 5 inch-es in diameter; bedrock wells under 4 inches in diameter; andwells that were not air or pump tested. Furthermore, there aredifferences in methods used by drillers to conduct and reportspecific capacity test results. This variability precludes devel-oping reliable regional transmissivity estimates; however, afew general trends are observed.
Transmissivity values in the four most productive uncon-
#
#S
#S
#S
#0
#0
R
RR
#
#
#
#
#
Transmissivity values from aquifer tests
for 16 wells in thousands GPD/FT
Figure 12. Transmissivity estimates from aquifer tests
<22-<1010 -<3030-<100
<22-<1010 -<3030-<100100+County boundaries
Unconsolidated
Bedrock
100+

Ground-Water Hydrology 39
solidated aquifer systems typically range from about 1,400 to150,000 gpd/ft. (table 4) The Buried Valley, Dissected Tilland Residuum, and Lacustrine and Backwater Depositsaquifer systems lacked sufficient data to determine typicaltransmissivity ranges. The most transmissive unconsolidatedaquifers generally occur in the White River valley wherelocally thick outwash deposits are present. The highest trans-missivity values are found in well-constructed high-capacitywells. Although many domestic wells are completed in high-ly transmissive outwash materials, the high-capacity wells areusually constructed to maximize production with well screensthat are properly sized to the aquifer materials. High-capaci-ty wells are usually more efficient at producing water fromaquifers because they have smaller well losses. The resultingestimated transmissivity values are often greater than domes-tic wells in the same aquifer material. For specific capacitytests on low-capacity wells, pumping rates tend to be chosento confirm the minimum necessary production, rather than todetermine the maximum yield as with high-capacity wells.
Nearly 90 percent of the bedrock wells in the basin, forwhich transmissivity values have been estimated, are devel-oped in one of four bedrock aquifer systems: Raccoon CreekGroup; Blue River and Sanders Groups; Borden Group; or theSilurian and Devonian Carbonates. For bedrock aquifers inthe basin, typical transmissivity values range from about 40to 3,800 gpd/ft. (table 4). The Silurian and DevonianCarbonate aquifer system has by far the greatest transmissiv-ity of those with enough data available to determine typicalranges. The least transmissive bedrock aquifer systems arethe Carbondale Group and the Raccoon Creek Group.
Interpretation of many transmissivity values is complicated
by the fact that the thickness of many aquifers, especiallybedrock, is not well defined. A given transmissivity valuecould result from a thick sequence of relatively low-perme-ability materials or from a thin sequence of relatively high-permeability materials. Another complication is that somewells are open to more than one aquifer system and thus maynot be properly assigned to the dominant aquifer. It must benoted that there are areas where transmissivity data are sparse(e.g., Greene County). This is due to a general lack of com-plete and reliable well construction and specific capacity testdata on records for wells in those areas.
Recharge
In general, ground water is recharged by that portion of pre-cipitation that infiltrates through the soil profile to underlyingaquifers that have the ability to absorb, store, and transmitwater. Aquifer yield is dependent upon aquifer permeability,aquifer storage, saturated thickness, available drawdown,areal extent, and upon the number, spacing, diameter, andpumping rates of the wells that tap the aquifer. The ultimatedevelopment potential of an aquifer is often equated to thetotal natural recharge to the aquifer. However, recharge willvary considerably from year to year due to climatic variationsand will vary somewhat with pumping. Pumping can increaseeffective recharge by lowering the water level in relativelyshallow aquifers, thereby reducing evapotranspiration losses.Vertical recharge to confined aquifers is proportional to thehead difference between the aquifers and overlying sourcebeds. Pumping can increase this head differential. By using
Table 4 Typical transmissivity ranges for aquifer systems.
���������!"��� �� �"��""�)��!�%���*��&
�����"���� �������������!"���"
White River and Tributaries Outwash Aquifer System 14,690-150,560White River and Tributaries Outwash Aquifer Subsystem 1,940-54,870Tipton Till Plain Aquifer System 2,950-29,700Tipton Till Plain Aquifer Subsystem 1,370-11,700Buried Valley Aquifer System *Lacustrine and Backwater Deposits Aquifer System *Dissected Till and Residuum Aquifer System *
(�����$����������!"���"
Ordovician/Maquoketa Group *Silurian and Devonian Carbonates 190-3,810Devonian and Mississippian/New Albany Shale 110-1,130Mississippian/Borden Group 120-1,680Mississippian/Blue River and Sanders Groups 80-1,050Mississippian/Buffalo Wallow,Stephensport, andWest Baden Groups 40-730Pennsylvanian/Raccoon Creek Group 40-330Pennsylvanian/Carbondale Group 40-290Pennsylvanian/McLeansboro Group 120-960
* not enough data is available to determine typical ranges of transmissivity values for these aquifer systems
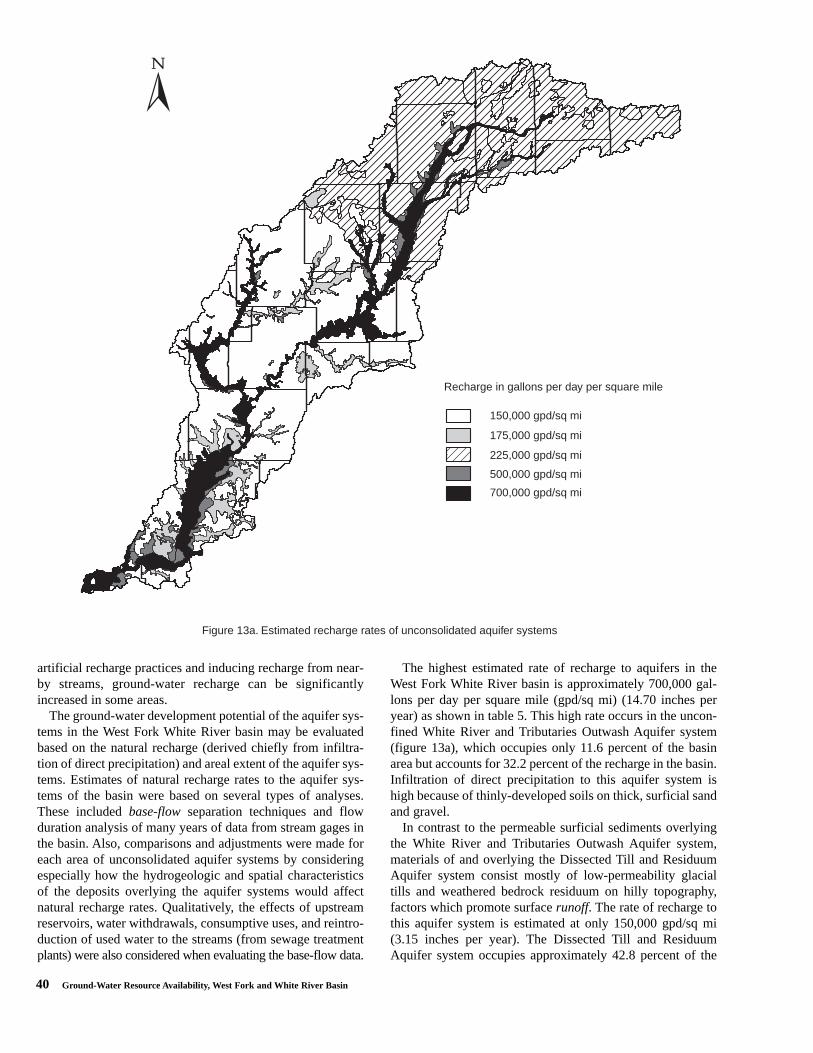
40 Ground-Water Resource Availability, West Fork and White River Basin
artificial recharge practices and inducing recharge from near-by streams, ground-water recharge can be significantlyincreased in some areas.
The ground-water development potential of the aquifer sys-tems in the West Fork White River basin may be evaluatedbased on the natural recharge (derived chiefly from infiltra-tion of direct precipitation) and areal extent of the aquifer sys-tems. Estimates of natural recharge rates to the aquifer sys-tems of the basin were based on several types of analyses.These included base-flow separation techniques and flowduration analysis of many years of data from stream gages inthe basin. Also, comparisons and adjustments were made foreach area of unconsolidated aquifer systems by consideringespecially how the hydrogeologic and spatial characteristicsof the deposits overlying the aquifer systems would affectnatural recharge rates. Qualitatively, the effects of upstreamreservoirs, water withdrawals, consumptive uses, and reintro-duction of used water to the streams (from sewage treatmentplants) were also considered when evaluating the base-flow data.
The highest estimated rate of recharge to aquifers in theWest Fork White River basin is approximately 700,000 gal-lons per day per square mile (gpd/sq mi) (14.70 inches peryear) as shown in table 5. This high rate occurs in the uncon-fined White River and Tributaries Outwash Aquifer system(figure 13a), which occupies only 11.6 percent of the basinarea but accounts for 32.2 percent of the recharge in the basin.Infiltration of direct precipitation to this aquifer system ishigh because of thinly-developed soils on thick, surficial sandand gravel.
In contrast to the permeable surficial sediments overlyingthe White River and Tributaries Outwash Aquifer system,materials of and overlying the Dissected Till and ResiduumAquifer system consist mostly of low-permeability glacialtills and weathered bedrock residuum on hilly topography,factors which promote surface runoff. The rate of recharge tothis aquifer system is estimated at only 150,000 gpd/sq mi(3.15 inches per year). The Dissected Till and ResiduumAquifer system occupies approximately 42.8 percent of the
150,000 gpd/sq mi
175,000 gpd/sq mi
225,000 gpd/sq mi
500,000 gpd/sq mi
Recharge in gallons per day per square mile
Figure 13a. Estimated recharge rates of unconsolidated aquifer systems
700,000 gpd/sq mi

Ground-Water Hydrology 41
basin area but accounts for only 25.3 percent of the rechargein the basin.
The northern part of the basin has considerably less ruggedtopography than the southern part and surficial sediments arepredominantly silty-clay till deposits of Wisconsin age. Thesedeposits limit recharge to the Tipton Till Plain Aquifer systemand subsystem to an estimated 225,000 gpd/sq mi (4.73 inch-es per year). These two aquifer systems cover 36.9 percent ofthe total area of the basin and account for 32.7 percent of therecharge.
Rates of recharge to bedrock aquifers in the West ForkWhite River basin are generally low, ranging from an esti-
mated 25,000 to 100,000 gpd/sq mi. (0.53 to 2.1 inches peryear) as shown in table 5. Locally, where the Silurian andDevonian Carbonates Aquifer system is overlain by outwashsand and gravel, it is expected to have a significantly higherrecharge rate than where it is covered by glacial till. The otherbedrock aquifer systems typically have very low rechargerates. The water-bearing rock units themselves generallyhave low permeability values. And, in many places there arebedrock units of even lower permeability, situated above thebetter water-bearing units, which severely limit verticalrecharge.
25,000 gpd/sq mi
50,000 gpd/sq mi
75,000 gpd/sq mi
100,000 gpd/sq mi
Recharge in gallons per day per square mile
Figure 13b. Estimated recharge rates of bedrock aquifer systems
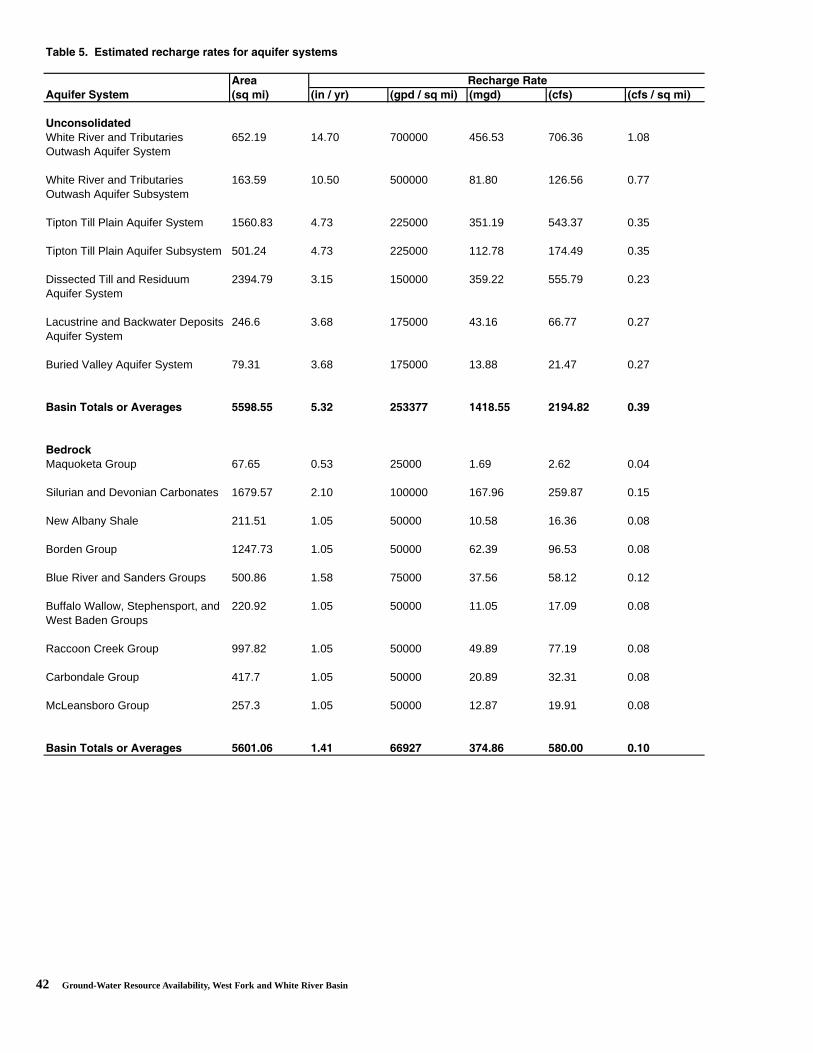
42 Ground-Water Resource Availability, West Fork and White River Basin
� +���,-���"��� �������# ����� ��"����� �������"!"���"
���
���������!"��� %"����& %���*�!�& %����*�"����& %���& %��"& %��"�*�"����&
�����"���� ���
White River and Tributaries 652.19 14.70 700000 456.53 706.36 1.08Outwash Aquifer System
White River and Tributaries 163.59 10.50 500000 81.80 126.56 0.77Outwash Aquifer Subsystem
Tipton Till Plain Aquifer System 1560.83 4.73 225000 351.19 543.37 0.35
Tipton Till Plain Aquifer Subsystem 501.24 4.73 225000 112.78 174.49 0.35
Dissected Till and Residuum 2394.79 3.15 150000 359.22 555.79 0.23Aquifer System
Lacustrine and Backwater Deposits 246.6 3.68 175000 43.16 66.77 0.27Aquifer System
Buried Valley Aquifer System 79.31 3.68 175000 13.88 21.47 0.27
( "������ �"�����)�� ��" ,,./-,, ,-01 1,0022 343/-,, 13.4-/1 5-0.
(�����$
Maquoketa Group 67.65 0.53 25000 1.69 2.62 0.04
Silurian and Devonian Carbonates 1679.57 2.10 100000 167.96 259.87 0.15
New Albany Shale 211.51 1.05 50000 10.58 16.36 0.08
Borden Group 1247.73 1.05 50000 62.39 96.53 0.08
Blue River and Sanders Groups 500.86 1.58 75000 37.56 58.12 0.12
Buffalo Wallow, Stephensport, and 220.92 1.05 50000 11.05 17.09 0.08West Baden Groups
Raccoon Creek Group 997.82 1.05 50000 49.89 77.19 0.08
Carbondale Group 417.7 1.05 50000 20.89 32.31 0.08
McLeansboro Group 257.3 1.05 50000 12.87 19.91 0.08
( "������ �"�����)�� ��" ,653-56 3-43 66.12 024-/6 ,/5-55 5-35
���# ����� ��
Ground-Water Quality 43
GROUND-WATER QUALITY
The geochemistry of ground water may influence the utili-ty of aquifer systems as sources of water. The types and con-centrations of dissolved constituents in the water of an aquifersystem determine whether the resource, without prior treat-ment, is suitable for drinking-water supplies, industrial pur-poses, irrigation, livestock watering, or other uses. Changesin the concentrations of certain constituents in the water of anaquifer system, whether because of natural or anthropogeniccauses, may alter the suitability of the aquifer system as asource of water. Assessing ground-water quality and develop-ing strategies to protect aquifers from contamination are nec-essary aspects of water-resource planning.
Sources of ground-water quality data
The quality of water from the aquifer systems defined inthe Aquifer Systems section of the Ground-Water Hydrologychapter is described using selected inorganic chemical analy-ses from 372 wells (157 completed in unconsolidateddeposits and 215 completed in bedrock) in the West ForkWhite River basin. Sources of ground-water quality data aredomestic, commercial or livestock-watering wells sampledduring a 1989 and 1990 cooperative effort between theIndiana Department of Natural Resources, Division of Water(DOW) and the Indiana Geological Survey (IGS). The loca-tions of ground-water chemistry sites used in the analysis aredisplayed on plate 9, and selected water-quality data fromindividual wells are listed in appendices 1 and 2.
The intent of the water-quality analysis is to characterizethe natural ground-water chemistry of the West Fork WhiteRiver basin. Specific instances of ground-water contamina-tion are not evaluated. In cases of contamination, chemicalconditions are likely to be site-specific and may not representtypical ground-water quality in the basin. Therefore, availabledata from identified sites of ground-water contaminationwere not included in the data sets analyzed for this publica-tion. Samples collected from softened or otherwise treatedwater were also excluded from the analysis because thechemistry of the water was altered from natural conditions.
Factors in the assessment of ground-water quality
Major dissolved constituents in the ground water of theWest Fork White River basin include calcium, magnesium,sodium, chloride, sulfate, and bicarbonate. Less abundantconstituents include potassium, iron, manganese, strontium,zinc, fluoride, and nitrate. Other chemical characteristics dis-cussed in this report include pH, alkalinity, hardness, totaldissolved solids (TDS), and radon.
Although the data from well-water samples in the WestFork White River basin are treated as if they represent thechemistry of ground water at a distinct point, they actuallyrepresent the average concentration of an unknown volume of
water in an aquifer. The extent of aquifer representationdepends on the depth of the well, hydraulic conductivity ofthe aquifer, thickness and areal extent of the aquifer, and rateof pumping. For example, the chemistry of water sampledfrom high-capacity wells may represent average ground-water quality for a large cone of influence (Sasman and oth-ers, 1981). Also, because much of the bedrock in the southernpart of the basin does not produce much ground water, it isnot uncommon for bedrock wells to be deep and to intersectseveral different bedrock units. Because the quality of watermay vary substantially from different zones individual wellsmay show an unusual mixture of ground water types.
To further complicate analysis of the ground-water chem-istry data in this basin, the bedrock in the southern third of thebasin was formed in complex depositional environments result-ing in complex horizontal and vertical relationships of variousbedrock units. In addition, there is an extensive major uncon-formity (old erosion surface) of Mississippian/Pennsylvanianage. Erosion and subsequent deposition of bedrock materialthat occurred during this time period has resulted in younger ormore recent bedrock overlapping onto bedrock of differentages and types.
The order in which ground water encounters strata of dif-ferent mineralogical composition can exert an important con-trol on the water chemistry (Freeze and Cherry, 1979).Considering that hydrogeologic systems in the basin containnumerous types of strata arranged in a wide variety of geo-metric configurations, it is not unreasonable to expect that inmany areas the chemistry of ground water exhibits complexspatial patterns that are difficult to interpret, even when goodstratigraphic and hydraulic head information is available.
The nature of the bedrock in the southern two-thirds of theWest Fork White River basin makes the use of aquifer sys-tems to describe ground-water quality somewhat problemat-ic. The boundaries of the bedrock aquifer systems are definedby 2-dimensional mapping techniques. Although this type ofmapping is useful, it should be remembered that more pro-ductive aquifer systems extend beneath less productive sys-tems and are often used as a water supply within the bound-aries of the latter.
In addition to the factors discussed above, the chemistry oforiginal aquifer water may be altered to some degree by con-tact with plumbing, residence time in a pressure tank, methodof sampling, and time elapsed between sampling and labora-tory analysis. In spite of these limitations, results of sampleanalyses provide valuable information concerning ground-water quality characteristics of aquifer systems.
Analysis of data
Graphical and statistical techniques are used to analyze theavailable ground-water quality data from the West ForkWhite River basin. Graphical analyses are used to display theareal distribution of dissolved constituents throughout thebasin, and to describe the general chemical character of theground water of each aquifer system. Statistical analyses pro-vide useful generalizations about the water quality of the