Gross Domestic Product by Industry Fourth Quarter and Year ...Overall, 17 of 22 industry groups...
14
EMBARGOED UNTIL RELEASE AT 8:30 A.M. EDT, MONDAY, APRIL 6, 2020 BEA 20-17 Technical: Thomas Howells Edward Morgan (301) 278-9586 (301) 278-9541 [email protected] Media: Jeannine Aversa (301) 278-9003 [email protected] Gross Domestic Product by Industry Fourth Quarter and Year 2019 Retail trade, finance and insurance, and utilities were the leading contributors to the increase in U.S. economic growth in the fourth quarter of 2019, according to gross domestic product (GDP) by industry statistics released by the Bureau of Economic Analysis. An increase in private services-producing industries was partly offset by a slight decrease in goods-producing industries; the government sector increased. Overall, 17 of 22 industry groups contributed to the 2.1 percent increase in real GDP in the fourth quarter. • For retail trade, real value added—a measure of an industry’s contribution to GDP—increased 7.4 percent in the fourth quarter, primarily reflecting an increase in other retail, which includes gasoline stations and nonstore retailers. • Finance and insurance increased 5.1 percent in the fourth quarter. The largest contributor to the increase was securities, commodity contracts, and investments. -2 -1 0 1 2 3 4 5 2018:Q4 2019:Q1 2019:Q2 2019:Q3 2019:Q4 Percent Change Real GDP and Real Value Added by Sector GDP Private Goods Private Services Government U.S. Bureau of Economic Analysis Seasonally adjusted annual rates
Transcript of Gross Domestic Product by Industry Fourth Quarter and Year ...Overall, 17 of 22 industry groups...

EMBARGOED UNTIL RELEASE AT 8:30 A.M. EDT, MONDAY, APRIL 6, 2020 BEA 20-17
Technical: Thomas Howells Edward Morgan
(301) 278-9586(301) 278-9541
Media: Jeannine Aversa (301) 278-9003 [email protected]
Gross Domestic Product by Industry Fourth Quarter and Year 2019
Retail trade, finance and insurance, and utilities were the leading contributors to the increase in U.S. economic growth in the fourth quarter of 2019, according to gross domestic product (GDP) by industry statistics released by the Bureau of Economic Analysis. An increase in private services-producing industries was partly offset by a slight decrease in goods-producing industries; the government sector increased. Overall, 17 of 22 industry groups contributed to the 2.1 percent increase in real GDP in the fourth quarter.
• For retail trade, real value added—a measure of an industry’s contribution to GDP—increased 7.4percent in the fourth quarter, primarily reflecting an increase in other retail, which includes gasolinestations and nonstore retailers.
• Finance and insurance increased 5.1 percent in the fourth quarter. The largest contributor to theincrease was securities, commodity contracts, and investments.
-2
-1
0
1
2
3
4
5
2018:Q4 2019:Q1 2019:Q2 2019:Q3 2019:Q4
Percent Change
Real GDP and Real Value Added by Sector
GDP Private Goods Private Services Government
U.S. Bureau of Economic Analysis Seasonally adjusted annual rates

• Utilities increased 23.3 percent in the fourth quarter, primarily reflecting an increase in electricpower generation.
• Nondurable goods manufacturing decreased 2.8 percent, primarily reflecting decreases in food andbeverage and tobacco products as well as petroleum and coal products.
• Other services, except government, decreased 1.6 percent, in the fourth quarter. The largestcontributors to the decrease were repair and maintenance as well as personal and laundry services.
• Mining decreased 1.6 percent, primarily reflecting a decrease in support activities for mining.
Other highlights
Real GDP growth in the fourth quarter was the same as that in the third quarter. Upturns in finance and insurance, utilities, and construction were largely offset by downturns in nondurable goods manufacturing and wholesale trade, and a slowdown in professional, scientific, and technical services.
• Construction increased 1.4 percent in the fourth quarter, after decreasing 2.1 percent in the third.
• Nondurable goods manufacturing decreased 2.8 percent, after increasing 10.1 percent, primarilyreflecting a downturn in petroleum and coal products.
• Wholesale trade was unchanged in the fourth quarter, after increasing 3.0 percent in the third.
• Professional, scientific, and technical services increased 1.5 percent, after increasing 5.6 percent,primarily reflecting a slowdown in miscellaneous professional, scientific, and technical services.
-20
-15
-10
-5
0
5
10
15
20
25
2019:Q3 2019:Q4
Percent Change
Real Value Added by IndustryMining
Utilities
Nondurable goods
Retail trade
Finance and insurance
Other services, exceptgovernment
U.S. Bureau of Economic AnalysisU.S. Bureau of Economic Analysis Seasonally adjusted annual rates
- 2 -
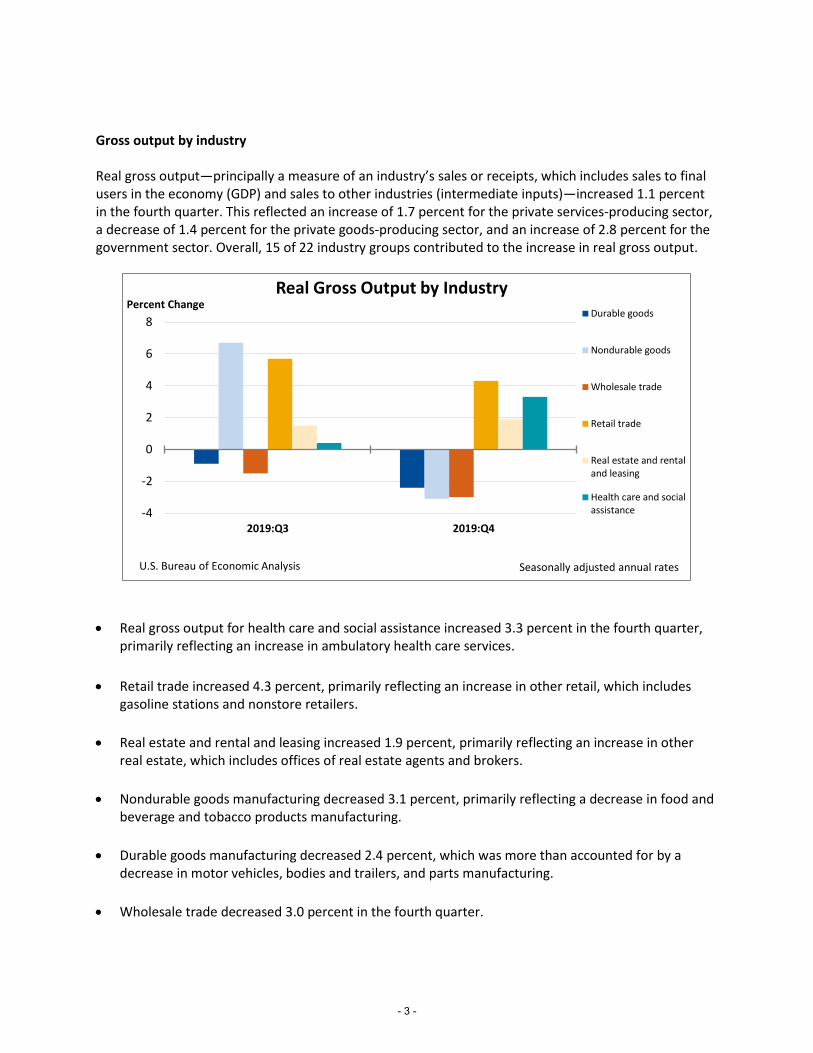
Gross output by industry
Real gross output—principally a measure of an industry’s sales or receipts, which includes sales to final users in the economy (GDP) and sales to other industries (intermediate inputs)—increased 1.1 percent in the fourth quarter. This reflected an increase of 1.7 percent for the private services-producing sector, a decrease of 1.4 percent for the private goods-producing sector, and an increase of 2.8 percent for the government sector. Overall, 15 of 22 industry groups contributed to the increase in real gross output.
• Real gross output for health care and social assistance increased 3.3 percent in the fourth quarter,primarily reflecting an increase in ambulatory health care services.
• Retail trade increased 4.3 percent, primarily reflecting an increase in other retail, which includesgasoline stations and nonstore retailers.
• Real estate and rental and leasing increased 1.9 percent, primarily reflecting an increase in otherreal estate, which includes offices of real estate agents and brokers.
• Nondurable goods manufacturing decreased 3.1 percent, primarily reflecting a decrease in food andbeverage and tobacco products manufacturing.
• Durable goods manufacturing decreased 2.4 percent, which was more than accounted for by adecrease in motor vehicles, bodies and trailers, and parts manufacturing.
• Wholesale trade decreased 3.0 percent in the fourth quarter.
-4
-2
0
2
4
6
8
2019:Q3 2019:Q4
Percent ChangeReal Gross Output by Industry
Durable goods
Nondurable goods
Wholesale trade
Retail trade
Real estate and rentaland leasing
Health care and socialassistance
U.S. Bureau of Economic Analysis Seasonally adjusted annual rates
- 3 -

2019 GDP by Industry
Real GDP increased 2.3 percent in 2019 (from the 2018 annual level to the 2019 annual level). The private goods- and services-producing sectors, as well as the government sector, contributed to the increase. Growth was widespread, with 20 of 22 industry groups contributing to the increase. Professional, scientific, and technical services; finance and insurance; and information were the leading contributors to the increase in real GDP in 2019.
• For professional, scientific, and technical services, real value added increased 5.5 percent in 2019,after increasing 5.2 percent in 2018. The 2019 increase primarily reflected increases inmiscellaneous professional, scientific, and technical services as well as computer systems design.
• Finance and insurance increased 3.3 percent in 2019, after decreasing 1.9 percent in 2018. The 2019increase followed two consecutive years of decline and primarily reflected an increase in insurancecarriers and related activities.
• Information services increased 4.6 percent in 2019, after increasing 8.5 percent in 2018. The 2019increase primarily reflected increases in data processing, internet publishing, and other informationservices as well as publishing industries.
* * *
Next release – July 6, 2020 at 8:30 A.M. EDT for: Gross Domestic Product by Industry: First Quarter 2020
-1
0
1
2
3
4
2016 2017 2018 2019
Percent Change
Real GDP and Real Value Added by Sector
GDP Private Goods Private Services Government
U.S. Bureau of Economic Analysis Seasonally adjusted annual rates
- 4 -

Additional Information
Resources
Additional resources available at www.bea.gov:
• Stay informed about BEA developments byreading the BEA blog, signing up for BEA’s email subscription service, or following BEA on Twitter@BEA_News.
• Historical time series for these estimates can be accessed in BEA’s interactive data application.
• Access BEA data by registering for BEA’s Dataapplication programming interface (API).
• For more on BEA’s statistics, see our monthlyonline journal, the Survey of Current Business.
• BEA's news release schedule
• Industry Concepts and Methods: Concepts andMethods of the U.S. Input-Output Accounts
Definitions
Gross domestic product (GDP) or value added is the value of the goods and services produced by the nation’s economy less the value of the goods and services used up in production. GDP is also equal to the sum of personal consumption expenditures, gross private domestic investment, net exports of goods and services, and government consumption expenditures and gross investment.
Gross output (GO) is the value of the goods and services produced by the nation’s economy. It is principally measured using industry sales or receipts, including sales to final users (GDP) and sales to other industries (intermediate inputs).
Current-dollar estimates are valued in the prices of the period when the transactions occurred—that is, at “market value.” Also referred to as “nominal estimates” or as “current-price estimates.”
Real values are inflation-adjusted estimates—that is, estimates that exclude the effects of price changes.
Statistical conventions
Annual rates. Quarterly values are expressed at seasonally-adjusted annual rates (SAAR), unless otherwise specified. Dollar changes are calculated as the difference between these SAAR values. For detail, see the FAQ “Why does BEA publish estimates at annual rates?”
Quantities and prices. Quantities, or “real” measures, and prices are expressed as index numbers with a specified reference year equal to 100 (currently 2012). Quantity and price indexes are calculated using a Fisher-chained weighted formula that incorporates weights from two adjacent periods (quarters for quarterly data and annuals for annual data). “Real” dollar series are calculated by multiplying the published quantity index by the current-dollar value in the reference year (2012) and then dividing by 100. Percent changes calculated from chained-dollar levels and quantity indexes are conceptually the same; any differences are due to rounding.
Chained-dollar values are not additive because the relative weights for a given period differ from those of the reference year. In tables that display chained-dollar values, the value of the "Not allocated by industry" line reflects the difference between the first line and the sum of the most detailed lines. For the real value added by industry table, this value also reflects differences in source data used to estimate GDP by industry and the expenditures measure of real GDP.
List of News Release Tables
Table 1. Real Value Added by Industry Group: Percent Change from Preceding Period Table 2. Contributions to Percent Change in Real GDP by Industry Group Table 3. Chain-Type Price Indexes for Value Added by Industry Group: Percent Change from Preceding Period Table 4. Contributions to Percent Change in the GDP Price Index by Industry Group Table 5. Value Added by Industry Group Table 5a. Value Added by Industry Group as a Percentage of GDP Table 6. Real Gross Output by Industry Group: Percent Change from Preceding Period Table 7. Chain-Type Price Indexes for Gross Output by Industry Group: Percent Change from Preceding Period Table 8. Gross Output by Industry Group
- 5 -

April 6, 2020
I II III IV I II III IV
1 Gross domestic product 2.9 2.3 2.5 3.5 2.9 1.1 3.1 2.0 2.1 2.1
2 Private industries 3.2 2.6 2.8 3.8 3.2 1.3 3.8 1.9 2.4 2.0
3 Agriculture, forestry, fishing, and hunting -1.4 4.4 0.4 7.9 -4.5 4.9 3.0 9.3 7.8 3.0
4 Mining 3.3 14.6 -15.2 12.4 2.7 11.3 26.0 23.5 7.7 -1.6
5 Utilities -0.2 2.1 -12.9 13.3 -5.5 3.0 -3.5 18.1 -15.3 23.3
6 Construction 2.2 0.0 5.3 -2.1 0.7 -3.4 3.8 -0.3 -2.1 1.4
7 Manufacturing 3.9 0.7 3.4 1.9 4.6 2.2 -3.6 0.4 4.3 -1.0
8 Durable goods 4.7 1.8 4.1 2.8 2.3 4.2 1.3 1.0 0.1 0.5
9 Nondurable goods 2.9 -0.6 2.4 0.7 7.5 -0.2 -9.6 -0.3 10.1 -2.8
10 Wholesale trade 1.6 0.8 0.0 -1.8 5.4 7.6 -0.8 -6.7 3.0 0.0
11 Retail trade 3.5 3.5 6.3 0.1 3.0 -2.6 8.8 0.2 8.2 7.4
12 Transportation and warehousing 4.0 0.0 9.3 -0.1 3.4 1.5 -0.6 -2.9 -1.0 1.6
13 Information 8.5 4.6 6.5 16.9 5.0 4.8 1.5 4.4 5.6 3.1
14 Finance, insurance, real estate, rental, and leasing 1.2 2.2 1.3 3.3 1.8 -2.5 7.7 2.4 -1.4 2.1
15 Finance and insurance -1.9 3.3 -3.6 0.4 4.6 -10.4 20.9 2.0 -5.3 5.1
16 Real estate and rental and leasing 3.0 1.6 4.2 5.0 0.3 2.3 0.8 2.6 0.8 0.4
17 Professional and business services 5.4 5.2 4.1 5.2 6.0 2.5 6.9 6.3 5.5 1.9
18 Professional, scientific, and technical services 5.2 5.5 6.4 5.6 4.9 1.9 8.0 7.4 5.6 1.5
19 Management of companies and enterprises 7.1 8.0 -0.6 5.4 10.9 -0.5 15.8 7.1 8.6 2.6
20 Administrative and waste management services 4.6 3.0 1.7 4.1 5.6 6.2 -0.9 3.2 3.2 2.5
21 Educational services, health care, and social assistance 3.1 2.8 6.0 2.0 3.1 2.8 4.3 0.7 3.2 2.9
22 Educational services 1.1 0.8 3.1 0.9 2.2 4.1 -1.7 -4.4 6.8 2.3
23 Health care and social assistance 3.5 3.1 6.5 2.2 3.3 2.5 5.3 1.6 2.6 3.0
24 Arts, entertainment, recreation, accommodation, and food services 2.6 0.9 -0.1 8.9 0.8 2.1 -1.2 -2.0 4.4 -0.1
25 Arts, entertainment, and recreation 4.0 1.1 -1.0 16.3 -0.1 -0.4 2.8 -2.6 1.4 -1.2
26 Accommodation and food services 2.1 0.8 0.3 6.3 1.1 3.0 -2.5 -1.8 5.5 0.3
27 Other services, except government 3.1 0.4 3.2 4.8 1.3 1.9 -0.9 -1.9 2.6 -1.6
28 Government 0.8 0.5 0.5 1.3 0.9 -0.2 -1.6 3.1 0.0 2.7
29 Federal 0.3 0.2 0.3 0.6 0.3 -2.0 -5.1 7.6 2.0 2.7
30 State and local 1.0 0.6 0.7 1.6 1.2 0.6 0.1 1.1 -0.8 2.7
Addenda:
31 Private goods-producing industries1
3.2 1.9 1.9 2.2 3.1 1.9 0.8 2.5 3.2 -0.3
32 Private services-producing industries2
3.2 2.7 3.0 4.2 3.2 1.1 4.5 1.7 2.1 2.6
Table 1. Real Value Added by Industry Group: Percent Change from Preceding Period
2018
Source: U.S. Bureau of Economic Analysis
2018 2019Line
2. Consists of utilities; wholesale trade; retail trade; transportation and warehousing; information; finance, insurance, real estate, rental, and leasing; professional and
business services; educational services, health care, and social assistance; arts, entertainment, recreation, accommodation, and food services; and other services, except
government.
1. Consists of agriculture, forestry, fishing, and hunting; mining; construction; and manufacturing.
2019
Seasonally adjusted at annual rates
- 6 -

April 6, 2020
I II III IV I II III IV
Percent change at annual rate:
1 Gross domestic product 2.9 2.3 2.5 3.5 2.9 1.1 3.1 2.0 2.1 2.1
Percentage points at annual rates:
2 Private industries 2.77 2.25 2.41 3.31 2.76 1.11 3.27 1.64 2.06 1.79
3 Agriculture, forestry, fishing, and hunting -0.01 0.04 0.00 0.07 -0.04 0.04 0.02 0.07 0.06 0.02
4 Mining 0.05 0.22 -0.26 0.20 0.05 0.18 0.38 0.33 0.11 -0.02
5 Utilities 0.00 0.03 -0.22 0.20 -0.09 0.05 -0.06 0.26 -0.26 0.33
6 Construction 0.09 0.00 0.21 -0.08 0.03 -0.14 0.16 -0.01 -0.09 0.06
7 Manufacturing 0.44 0.08 0.37 0.21 0.51 0.25 -0.40 0.05 0.47 -0.10
8 Durable goods 0.30 0.11 0.26 0.18 0.15 0.26 0.09 0.06 0.01 0.03
9 Nondurable goods 0.14 -0.03 0.11 0.03 0.36 -0.02 -0.49 -0.01 0.46 -0.14
10 Wholesale trade 0.10 0.05 0.00 -0.10 0.31 0.44 -0.05 -0.41 0.18 0.00
11 Retail trade 0.19 0.19 0.34 0.01 0.16 -0.14 0.46 0.01 0.43 0.39
12 Transportation and warehousing 0.13 0.00 0.28 0.00 0.11 0.05 -0.02 -0.09 -0.03 0.05
13 Information 0.43 0.24 0.33 0.82 0.26 0.25 0.08 0.22 0.29 0.16
14 Finance, insurance, real estate, rental, and leasing 0.25 0.47 0.27 0.70 0.39 -0.54 1.55 0.51 -0.31 0.43
15 Finance and insurance -0.15 0.25 -0.28 0.04 0.35 -0.83 1.45 0.16 -0.42 0.38
16 Real estate and rental and leasing 0.40 0.21 0.55 0.66 0.04 0.30 0.11 0.35 0.11 0.06
17 Professional and business services 0.66 0.65 0.51 0.65 0.73 0.31 0.85 0.78 0.68 0.25
18 Professional, scientific, and technical services 0.39 0.41 0.47 0.42 0.36 0.14 0.59 0.55 0.42 0.12
19 Management of companies and enterprises 0.13 0.15 -0.01 0.10 0.20 -0.01 0.28 0.13 0.16 0.05
20 Administrative and waste management services 0.14 0.09 0.05 0.13 0.17 0.19 -0.03 0.10 0.10 0.08
21 Educational services, health care, and social assistance 0.27 0.24 0.51 0.18 0.27 0.24 0.37 0.06 0.28 0.25
22 Educational services 0.01 0.01 0.04 0.01 0.03 0.05 -0.02 -0.06 0.08 0.03
23 Health care and social assistance 0.26 0.23 0.47 0.17 0.24 0.19 0.39 0.12 0.19 0.22
24 Arts, entertainment, recreation, accommodation, and food services 0.11 0.04 0.00 0.36 0.03 0.09 -0.05 -0.09 0.18 0.00
25 Arts, entertainment, and recreation 0.04 0.01 -0.01 0.17 0.00 0.00 0.03 -0.03 0.02 -0.01
26 Accommodation and food services 0.07 0.02 0.01 0.19 0.03 0.09 -0.08 -0.06 0.17 0.01
27 Other services, except government 0.07 0.01 0.07 0.10 0.03 0.04 -0.02 -0.04 0.05 -0.03
28 Government 0.10 0.06 0.07 0.16 0.12 -0.02 -0.19 0.37 0.01 0.33
29 Federal 0.01 0.01 0.01 0.02 0.01 -0.08 -0.20 0.28 0.08 0.10
30 State and local 0.09 0.05 0.06 0.14 0.10 0.05 0.01 0.09 -0.07 0.23
Addenda:
31 Private goods-producing industries1
0.57 0.34 0.33 0.39 0.55 0.33 0.15 0.43 0.55 -0.04
32 Private services-producing industries2
2.20 1.91 2.08 2.91 2.21 0.78 3.12 1.21 1.50 1.83
Source: U.S. Bureau of Economic Analysis
Line
1. Consists of agriculture, forestry, fishing, and hunting; mining; construction; and manufacturing.
2018 2019
Table 2. Contributions to Percent Change in Real GDP by Industry Group
2019
2. Consists of utilities; wholesale trade; retail trade; transportation and warehousing; information; finance, insurance, real estate, rental, and leasing; professional and
business services; educational services, health care, and social assistance; arts, entertainment, recreation, accommodation, and food services; and other services, except
government.
Note. Percentage-point contributions do not sum to the percent change in real gross domestic product because the industry details are calculated using source data and
methodologies that differ from those used to calculate growth in the top-line, expenditure-based measure of real GDP.
2018
Seasonally adjusted at annual rates
- 7 -

April 6, 2020
I II III IV I II III IV
1 Gross domestic product 2.4 1.8 2.3 3.2 2.0 1.6 1.1 2.4 1.8 1.3
2 Private industries 2.4 1.6 2.3 3.6 1.6 1.6 0.3 3.0 1.4 1.5
3 Agriculture, forestry, fishing, and hunting -3.3 -2.7 -0.1 -1.4 -20.8 3.3 -9.2 2.6 11.1 4.5
4 Mining 16.8 -19.3 33.2 9.3 14.9 -20.8 -41.4 -11.6 -28.5 5.9
5 Utilities 3.6 0.6 17.0 -7.7 1.8 7.5 4.0 -14.4 23.3 -17.4
6 Construction 3.9 5.6 3.1 7.7 4.2 6.6 5.6 6.2 5.1 3.3
7 Manufacturing 2.2 0.9 0.8 4.0 0.5 2.5 -1.0 2.6 -2.4 3.7
8 Durable goods 0.6 1.7 -0.8 1.6 3.8 0.7 3.1 0.7 0.8 0.5
9 Nondurable goods 4.3 -0.1 2.9 7.3 -3.5 5.0 -6.1 5.1 -6.5 8.0
10 Wholesale trade 2.4 4.6 -0.7 7.3 0.6 2.0 6.2 9.3 2.7 2.0
11 Retail trade 0.4 0.6 -2.1 7.2 -2.5 3.7 -1.6 3.2 -0.7 -5.3
12 Transportation and warehousing 3.3 4.1 0.0 7.2 3.6 7.3 3.8 2.9 1.9 1.7
13 Information -1.4 0.3 -2.9 0.6 -0.7 -3.3 2.3 3.1 -1.5 0.0
14 Finance, insurance, real estate, rental, and leasing 4.0 2.2 4.0 3.6 4.2 1.4 -0.8 4.1 3.8 1.8
15 Finance and insurance 7.5 0.5 9.4 8.5 4.7 0.7 -8.4 5.4 4.2 0.0
16 Real estate and rental and leasing 2.0 3.1 1.0 1.0 3.8 1.8 3.8 3.4 3.6 2.9
17 Professional and business services 0.9 1.0 2.0 1.5 -0.2 0.4 1.8 1.3 0.8 1.4
18 Professional, scientific, and technical services 1.2 1.1 2.1 2.3 0.0 0.1 2.2 1.2 0.6 1.5
19 Management of companies and enterprises -1.3 -1.9 2.2 -3.0 -2.1 -0.7 -3.8 -0.6 -2.2 0.5
20 Administrative and waste management services 1.4 2.7 1.7 2.2 0.3 1.6 4.7 2.7 3.4 1.6
21 Educational services, health care, and social assistance 1.7 2.1 0.8 2.9 1.2 2.9 1.4 2.1 3.0 2.0
22 Educational services 2.5 2.3 1.9 3.7 2.1 1.9 2.6 3.3 0.9 1.8
23 Health care and social assistance 1.6 2.1 0.6 2.8 1.0 3.0 1.2 1.9 3.3 2.1
24 Arts, entertainment, recreation, accommodation, and food services 2.9 3.5 5.3 1.3 3.2 2.3 5.4 4.7 0.7 4.8
25 Arts, entertainment, and recreation 2.0 2.6 3.1 3.5 3.8 2.0 2.0 3.7 -0.7 7.2
26 Accommodation and food services 3.2 3.8 6.1 0.6 2.9 2.4 6.7 5.1 1.1 4.0
27 Other services, except government 2.4 4.0 2.1 2.6 3.5 3.4 4.9 4.5 2.5 6.3
28 Government 2.9 2.9 3.4 2.6 3.4 3.0 4.4 0.0 4.6 0.6
29 Federal 3.1 2.6 4.1 2.9 2.9 3.9 8.2 -4.9 2.1 1.2
30 State and local 2.8 3.0 3.1 2.5 3.6 2.7 2.8 2.3 5.7 0.3
Addenda:
31 Private goods-producing industries1
3.5 -0.2 3.8 5.1 1.5 0.9 -4.5 2.1 -2.7 3.8
32 Private services-producing industries2
2.2 2.1 2.0 3.2 1.6 1.8 1.6 3.2 2.4 0.9
Source: U.S. Bureau of Economic Analysis
Line 2018 2019
Table 3. Chain-Type Price Indexes for Value Added by Industry Group: Percent Change from Preceding Period
2019
2. Consists of utilities; wholesale trade; retail trade; transportation and warehousing; information; finance, insurance, real estate, rental, and leasing; professional and
business services; educational services, health care, and social assistance; arts, entertainment, recreation, accommodation, and food services; and other services, except
government.
1. Consists of agriculture, forestry, fishing, and hunting; mining; construction; and manufacturing.
2018
Seasonally adjusted at annual rates
- 8 -
April 6, 2020
I II III IV I II III IV
Percent change at annual rate:
1 Gross domestic product 2.4 1.8 2.3 3.2 2.0 1.6 1.1 2.4 1.8 1.3
Percentage points at annual rates:
2 Private industries 2.14 1.41 2.04 3.15 1.41 1.41 0.26 2.58 1.19 1.29
3 Agriculture, forestry, fishing, and hunting -0.03 -0.02 0.00 -0.01 -0.19 0.02 -0.07 0.02 0.08 0.04
4 Mining 0.25 -0.35 0.47 0.15 0.24 -0.40 -0.86 -0.19 -0.50 0.08
5 Utilities 0.06 0.01 0.25 -0.13 0.03 0.11 0.06 -0.24 0.33 -0.30
6 Construction 0.16 0.23 0.12 0.31 0.17 0.26 0.22 0.25 0.21 0.13
7 Manufacturing 0.25 0.11 0.10 0.46 0.06 0.29 -0.11 0.29 -0.27 0.40
8 Durable goods 0.04 0.11 -0.05 0.10 0.23 0.04 0.20 0.05 0.05 0.03
9 Nondurable goods 0.21 0.00 0.15 0.36 -0.17 0.25 -0.30 0.24 -0.32 0.37
10 Wholesale trade 0.14 0.27 -0.04 0.42 0.03 0.12 0.36 0.53 0.16 0.12
11 Retail trade 0.02 0.03 -0.12 0.39 -0.14 0.20 -0.09 0.18 -0.04 -0.30
12 Transportation and warehousing 0.10 0.13 0.00 0.22 0.11 0.23 0.12 0.09 0.06 0.05
13 Information -0.07 0.01 -0.15 0.03 -0.04 -0.17 0.12 0.16 -0.08 0.00
14 Finance, insurance, real estate, rental, and leasing 0.83 0.45 0.82 0.76 0.86 0.29 -0.17 0.86 0.80 0.38
15 Finance and insurance 0.56 0.04 0.68 0.63 0.35 0.06 -0.67 0.41 0.31 0.00
16 Real estate and rental and leasing 0.27 0.41 0.14 0.13 0.50 0.23 0.50 0.45 0.48 0.38
17 Professional and business services 0.11 0.13 0.25 0.19 -0.03 0.05 0.23 0.17 0.11 0.17
18 Professional, scientific, and technical services 0.09 0.09 0.16 0.18 0.00 0.01 0.16 0.10 0.04 0.11
19 Management of companies and enterprises -0.03 -0.04 0.04 -0.06 -0.04 -0.01 -0.08 -0.01 -0.04 0.01
20 Administrative and waste management services 0.04 0.08 0.05 0.07 0.01 0.05 0.14 0.08 0.11 0.05
21 Educational services, health care, and social assistance 0.15 0.18 0.07 0.25 0.10 0.25 0.12 0.18 0.26 0.18
22 Educational services 0.03 0.03 0.02 0.05 0.03 0.02 0.03 0.04 0.01 0.02
23 Health care and social assistance 0.12 0.15 0.05 0.21 0.07 0.22 0.09 0.14 0.25 0.15
24 Arts, entertainment, recreation, accommodation, and food services 0.12 0.15 0.22 0.06 0.13 0.10 0.22 0.19 0.03 0.20
25 Arts, entertainment, and recreation 0.02 0.03 0.03 0.04 0.04 0.02 0.02 0.04 -0.01 0.08
26 Accommodation and food services 0.10 0.12 0.18 0.02 0.09 0.07 0.20 0.15 0.04 0.12
27 Other services, except government 0.05 0.08 0.04 0.05 0.07 0.07 0.10 0.09 0.05 0.13
28 Government 0.36 0.35 0.41 0.33 0.41 0.37 0.53 0.01 0.55 0.07
29 Federal 0.12 0.10 0.15 0.11 0.11 0.15 0.30 -0.19 0.08 0.05
30 State and local 0.24 0.25 0.26 0.22 0.30 0.23 0.24 0.20 0.47 0.03
Addenda:
31 Private goods-producing industries1
0.63 -0.04 0.69 0.90 0.28 0.18 -0.82 0.37 -0.48 0.65
32 Private services-producing industries2
1.51 1.45 1.35 2.25 1.13 1.24 1.08 2.22 1.67 0.64
Source: U.S. Bureau of Economic Analysis
Line 2018 2019 2018
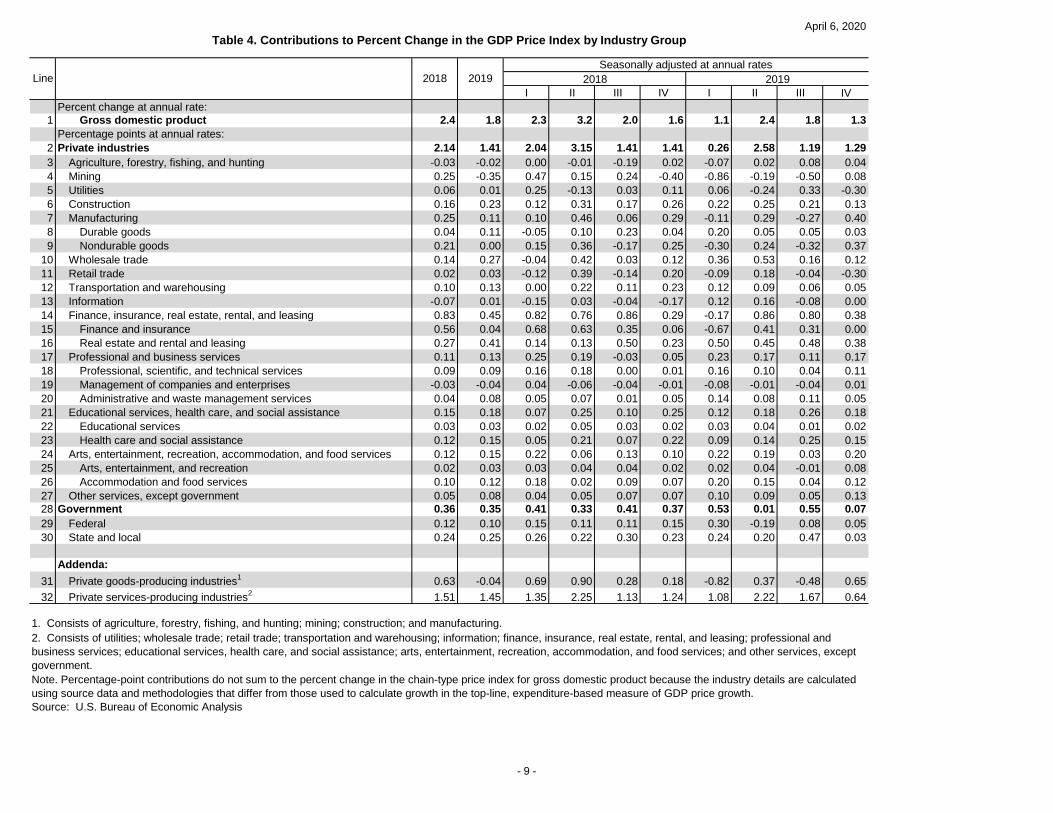
Table 4. Contributions to Percent Change in the GDP Price Index by Industry Group
2019
2. Consists of utilities; wholesale trade; retail trade; transportation and warehousing; information; finance, insurance, real estate, rental, and leasing; professional and
business services; educational services, health care, and social assistance; arts, entertainment, recreation, accommodation, and food services; and other services, except
government.
Note. Percentage-point contributions do not sum to the percent change in the chain-type price index for gross domestic product because the industry details are calculated
using source data and methodologies that differ from those used to calculate growth in the top-line, expenditure-based measure of GDP price growth.
1. Consists of agriculture, forestry, fishing, and hunting; mining; construction; and manufacturing.
Seasonally adjusted at annual rates
- 9 -

April 6, 2020
I II III IV I II III IV
1 Gross domestic product 20,580.2 21,427.7 20,163.2 20,510.2 20,749.8 20,897.8 21,098.8 21,340.3 21,542.5 21,729.1
2 Private industries 18,035.6 18,796.8 17,654.9 17,977.5 18,190.0 18,320.0 18,503.1 18,724.7 18,897.2 19,062.1
3 Agriculture, forestry, fishing, and hunting 166.5 169.2 169.4 172.1 160.5 163.8 161.1 165.7 173.4 176.6
4 Mining 346.6 320.3 328.8 346.4 361.3 350.1 324.6 331.7 310.8 314.0
5 Utilities 325.9 334.6 322.6 326.3 323.1 331.4 331.8 332.7 336.3 337.8
6 Construction 839.1 886.6 824.3 835.3 845.4 851.6 871.4 883.9 890.3 900.8
7 Manufacturing 2,321.2 2,359.9 2,274.8 2,308.1 2,337.2 2,364.7 2,337.6 2,355.0 2,365.5 2,381.3
8 Durable goods 1,296.4 1,342.7 1,272.4 1,286.2 1,305.7 1,321.4 1,336.0 1,341.7 1,344.8 1,348.2
9 Nondurable goods 1,024.8 1,017.2 1,002.4 1,022.0 1,031.4 1,043.3 1,001.6 1,013.4 1,020.7 1,033.1
10 Wholesale trade 1,212.2 1,278.1 1,184.4 1,200.1 1,217.8 1,246.6 1,262.9 1,269.0 1,287.2 1,293.4
11 Retail trade 1,126.9 1,172.9 1,110.8 1,130.6 1,131.7 1,134.4 1,153.9 1,163.6 1,184.6 1,189.6
12 Transportation and warehousing 658.1 684.5 640.6 651.7 663.0 677.2 682.5 682.3 683.8 689.5
13 Information 1,067.7 1,120.3 1,029.3 1,071.8 1,083.1 1,086.8 1,097.3 1,117.6 1,128.8 1,137.4
14 Finance, insurance, real estate, rental, and leasing 4,301.6 4,491.7 4,218.2 4,291.2 4,355.0 4,342.0 4,413.9 4,485.6 4,511.6 4,555.5
15 Finance and insurance 1,567.3 1,627.9 1,534.6 1,567.8 1,603.7 1,563.2 1,603.5 1,633.0 1,627.4 1,647.6
16 Real estate and rental and leasing 2,734.3 2,863.8 2,683.7 2,723.4 2,751.2 2,778.8 2,810.4 2,852.6 2,884.2 2,907.9
17 Professional and business services 2,579.4 2,742.2 2,525.4 2,567.2 2,603.2 2,622.0 2,678.0 2,727.9 2,770.1 2,792.7
18 Professional, scientific, and technical services 1,546.4 1,649.1 1,512.8 1,542.7 1,561.2 1,569.0 1,608.1 1,642.0 1,666.9 1,679.3
19 Management of companies and enterprises 394.9 418.2 389.5 391.6 399.8 398.6 409.4 415.8 422.2 425.4
20 Administrative and waste management services 638.1 674.8 623.1 632.9 642.1 654.4 660.4 670.1 681.0 687.9
21 Educational services, health care, and social assistance 1,792.5 1,881.4 1,760.5 1,782.1 1,801.0 1,826.2 1,851.7 1,864.7 1,893.1 1,916.1
22 Educational services 255.5 263.5 251.1 253.9 256.7 260.5 261.0 260.2 265.1 267.7
23 Health care and social assistance 1,536.9 1,617.9 1,509.4 1,528.2 1,544.3 1,565.7 1,590.7 1,604.5 1,628.0 1,648.4
24 Arts, entertainment, recreation, accommodation, and food services 860.6 898.5 838.5 859.3 867.6 877.0 886.1 891.8 902.9 913.4
25 Arts, entertainment, and recreation 227.4 236.0 218.4 228.8 230.8 231.7 234.5 235.1 235.5 238.9
26 Accommodation and food services 633.2 662.5 620.1 630.5 636.8 645.3 651.6 656.7 667.4 674.5
27 Other services, except government 437.2 456.6 427.4 435.1 440.3 446.1 450.4 453.2 458.9 464.1
28 Government 2,544.6 2,630.9 2,508.3 2,532.7 2,559.8 2,577.8 2,595.7 2,615.6 2,645.3 2,667.0
29 Federal 790.8 813.3 781.7 788.4 794.8 798.3 803.7 808.3 816.6 824.6
30 State and local 1,753.8 1,817.6 1,726.6 1,744.3 1,765.0 1,779.5 1,792.1 1,807.3 1,828.7 1,842.4
Addenda:
31 Private goods-producing industries1
3,673.4 3,735.9 3,597.2 3,662.0 3,704.3 3,730.2 3,694.7 3,736.4 3,740.0 3,772.6
32 Private services-producing industries2
14,362.1 15,060.9 14,057.6 14,315.5 14,485.6 14,589.8 14,808.4 14,988.3 15,157.2 15,289.5
Table 5. Value Added by Industry Group
Source: U.S. Bureau of Economic Analysis
Line2018 2019
Note. Detail may not add to total due to rounding.
2018 2019
2. Consists of utilities; wholesale trade; retail trade; transportation and warehousing; information; finance, insurance, real estate, rental, and leasing; professional and
business services; educational services, health care, and social assistance; arts, entertainment, recreation, accommodation, and food services; and other services, except
government.
1. Consists of agriculture, forestry, fishing, and hunting; mining; construction; and manufacturing.
Billions of dollars
Seasonally adjusted at annual rates
- 10 -

April 6, 2020
I II III IV I II III IV
1 Gross domestic product 100.0 100.0 100.0 100.0 100.0 100.0 100.0 100.0 100.0 100.0
2 Private industries 87.6 87.7 87.6 87.7 87.7 87.7 87.7 87.7 87.7 87.7
3 Agriculture, forestry, fishing, and hunting 0.8 0.8 0.8 0.8 0.8 0.8 0.8 0.8 0.8 0.8
4 Mining 1.7 1.5 1.6 1.7 1.7 1.7 1.5 1.6 1.4 1.4
5 Utilities 1.6 1.6 1.6 1.6 1.6 1.6 1.6 1.6 1.6 1.6
6 Construction 4.1 4.1 4.1 4.1 4.1 4.1 4.1 4.1 4.1 4.1
7 Manufacturing 11.3 11.0 11.3 11.3 11.3 11.3 11.1 11.0 11.0 11.0
8 Durable goods 6.3 6.3 6.3 6.3 6.3 6.3 6.3 6.3 6.2 6.2
9 Nondurable goods 5.0 4.7 5.0 5.0 5.0 5.0 4.7 4.7 4.7 4.8
10 Wholesale trade 5.9 6.0 5.9 5.9 5.9 6.0 6.0 5.9 6.0 6.0
11 Retail trade 5.5 5.5 5.5 5.5 5.5 5.4 5.5 5.5 5.5 5.5
12 Transportation and warehousing 3.2 3.2 3.2 3.2 3.2 3.2 3.2 3.2 3.2 3.2
13 Information 5.2 5.2 5.1 5.2 5.2 5.2 5.2 5.2 5.2 5.2
14 Finance, insurance, real estate, rental, and leasing 20.9 21.0 20.9 20.9 21.0 20.8 20.9 21.0 20.9 21.0
15 Finance and insurance 7.6 7.6 7.6 7.6 7.7 7.5 7.6 7.7 7.6 7.6
16 Real estate and rental and leasing 13.3 13.4 13.3 13.3 13.3 13.3 13.3 13.4 13.4 13.4
17 Professional and business services 12.5 12.8 12.5 12.5 12.5 12.5 12.7 12.8 12.9 12.9
18 Professional, scientific, and technical services 7.5 7.7 7.5 7.5 7.5 7.5 7.6 7.7 7.7 7.7
19 Management of companies and enterprises 1.9 2.0 1.9 1.9 1.9 1.9 1.9 1.9 2.0 2.0
20 Administrative and waste management services 3.1 3.1 3.1 3.1 3.1 3.1 3.1 3.1 3.2 3.2
21 Educational services, health care, and social assistance 8.7 8.8 8.7 8.7 8.7 8.7 8.8 8.7 8.8 8.8
22 Educational services 1.2 1.2 1.2 1.2 1.2 1.2 1.2 1.2 1.2 1.2
23 Health care and social assistance 7.5 7.6 7.5 7.5 7.4 7.5 7.5 7.5 7.6 7.6
24 Arts, entertainment, recreation, accommodation, and food services 4.2 4.2 4.2 4.2 4.2 4.2 4.2 4.2 4.2 4.2
25 Arts, entertainment, and recreation 1.1 1.1 1.1 1.1 1.1 1.1 1.1 1.1 1.1 1.1
26 Accommodation and food services 3.1 3.1 3.1 3.1 3.1 3.1 3.1 3.1 3.1 3.1
27 Other services, except government 2.1 2.1 2.1 2.1 2.1 2.1 2.1 2.1 2.1 2.1
28 Government 12.4 12.3 12.4 12.3 12.3 12.3 12.3 12.3 12.3 12.3
29 Federal 3.8 3.8 3.9 3.8 3.8 3.8 3.8 3.8 3.8 3.8
30 State and local 8.5 8.5 8.6 8.5 8.5 8.5 8.5 8.5 8.5 8.5
Addenda:
31 Private goods-producing industries1
17.8 17.4 17.8 17.9 17.9 17.8 17.5 17.5 17.4 17.4
32 Private services-producing industries2
69.8 70.3 69.7 69.8 69.8 69.8 70.2 70.2 70.4 70.4
Source: U.S. Bureau of Economic Analysis
Note. Detail may not add to total due to rounding.
Line
2. Consists of utilities; wholesale trade; retail trade; transportation and warehousing; information; finance, insurance, real estate, rental, and leasing; professional and
business services; educational services, health care, and social assistance; arts, entertainment, recreation, accommodation, and food services; and other services, except
government.
1. Consists of agriculture, forestry, fishing, and hunting; mining; construction; and manufacturing.
Table 5a. Value Added by Industry Group as a Percentage of GDP
2018 20192018 2019
- 11 -

April 6, 2020
I II III IV I II III IV
1 All industries 2.9 2.1 2.2 3.4 3.2 1.4 1.8 2.0 2.5 1.1
2 Private industries 3.1 2.1 2.3 3.5 3.4 1.5 1.9 1.7 2.7 0.9
3 Agriculture, forestry, fishing, and hunting -0.5 1.6 -4.2 4.2 -1.9 2.1 0.4 3.5 1.7 3.3
4 Mining 12.7 4.5 5.3 24.8 11.8 7.8 3.6 1.7 -5.9 -2.8
5 Utilities 0.5 -2.0 -7.3 10.3 -6.2 -0.4 -7.5 2.9 -9.5 14.9
6 Construction -0.4 -0.1 0.1 -0.5 0.7 -5.4 5.4 -3.2 -0.1 2.8
7 Manufacturing 2.3 1.3 1.5 0.4 5.6 1.5 1.7 -1.5 2.7 -2.7
8 Durable goods 4.0 1.4 3.5 0.2 9.7 2.4 3.0 -3.8 -0.9 -2.4
9 Nondurable goods 0.6 1.2 -0.5 0.5 1.6 0.5 0.4 1.0 6.7 -3.1
10 Wholesale trade 3.3 -0.4 0.9 2.8 2.2 1.4 1.1 -5.4 -1.5 -3.0
11 Retail trade 3.3 2.6 3.4 0.8 2.8 -1.6 2.8 4.7 5.7 4.3
12 Transportation and warehousing 2.8 -0.7 4.6 4.8 1.4 3.2 -5.6 -1.6 -1.7 3.7
13 Information 7.2 5.2 10.2 8.7 7.1 3.5 3.8 6.4 6.3 3.1
14 Finance, insurance, real estate, rental, and leasing 1.9 2.8 2.1 1.1 -0.1 2.4 4.4 3.7 3.4 1.1
15 Finance and insurance 1.2 3.4 0.8 -1.3 -0.5 4.6 5.6 3.3 5.9 0.1
16 Real estate and rental and leasing 2.4 2.3 3.1 3.0 0.3 0.8 3.5 3.9 1.5 1.9
17 Professional and business services 5.5 3.5 3.8 6.1 6.0 2.8 0.6 4.8 5.9 1.6
18 Professional, scientific, and technical services 5.4 3.4 5.0 7.3 2.7 2.4 0.2 6.5 7.6 -0.5
19 Management of companies and enterprises 5.6 6.9 -1.9 2.1 10.0 -2.6 15.0 7.6 6.8 2.4
20 Administrative and waste management services 5.9 1.9 4.8 5.9 11.0 6.9 -5.8 -0.3 1.8 5.7
21 Educational services, health care, and social assistance 2.6 2.7 0.7 3.6 5.1 1.0 2.9 3.8 0.7 3.2
22 Educational services -1.2 1.1 -4.2 -1.7 4.6 -0.9 1.4 -0.2 3.0 2.6
23 Health care and social assistance 3.2 3.0 1.4 4.4 5.1 1.3 3.1 4.3 0.4 3.3
24 Arts, entertainment, recreation, accommodation, and food services 3.4 1.8 2.1 10.3 4.1 -0.3 -1.3 3.3 4.8 -2.8
25 Arts, entertainment, and recreation 4.0 3.1 3.6 14.9 2.6 3.3 3.2 2.0 2.1 -2.7
26 Accommodation and food services 3.2 1.3 1.6 8.9 4.5 -1.4 -2.7 3.7 5.7 -2.8
27 Other services, except government 4.1 1.4 1.0 8.5 5.5 2.0 -2.7 -1.7 4.8 4.2
28 Government 1.4 1.8 1.1 2.2 1.3 0.4 1.0 4.4 1.2 2.8
29 Federal 2.3 2.6 2.4 3.5 2.1 0.0 0.0 9.3 2.0 3.5
30 State and local 1.0 1.4 0.6 1.6 1.0 0.5 1.5 2.3 0.8 2.5
Addenda:
31 Private goods-producing industries1
2.3 1.3 1.2 1.9 4.8 0.7 2.5 -1.4 1.6 -1.4
32 Private services-producing industries2
3.4 2.4 2.7 4.1 2.9 1.8 1.7 2.9 3.1 1.7
Source: U.S. Bureau of Economic Analysis
Line 2018 2019 2018
Table 6. Real Gross Output by Industry Group: Percent Change from Preceding Period
2019
2. Consists of utilities; wholesale trade; retail trade; transportation and warehousing; information; finance, insurance, real estate, rental, and leasing; professional and
business services; educational services, health care, and social assistance; arts, entertainment, recreation, accommodation, and food services; and other services, except
government.
1. Consists of agriculture, forestry, fishing, and hunting; mining; construction; and manufacturing.
Seasonally adjusted at annual rates
- 12 -

April 6, 2020
I II III IV I II III IV
1 All industries 3.1 1.2 4.1 3.2 2.2 1.5 -0.3 2.1 0.7 0.9
2 Private industries 3.0 1.1 4.1 3.2 2.1 1.4 -0.5 2.2 0.6 0.9
3 Agriculture, forestry, fishing, and hunting 0.3 -0.9 1.7 -0.2 -6.9 2.6 -4.2 0.8 3.1 1.7
4 Mining 11.5 -11.5 22.4 5.4 10.1 -9.4 -27.5 -8.2 -18.6 4.4
5 Utilities 4.3 -0.1 15.1 -5.4 3.3 9.1 -1.6 -11.2 13.5 -11.7
6 Construction 4.4 3.5 5.2 6.6 3.6 4.1 2.7 3.9 2.6 1.6
7 Manufacturing 4.4 -0.5 6.9 4.7 1.7 -0.5 -3.4 2.1 -4.1 1.6
8 Durable goods 2.6 0.9 3.0 4.5 2.2 1.1 1.4 -0.4 -0.3 -0.6
9 Nondurable goods 6.4 -2.0 11.1 4.9 1.3 -2.2 -8.3 4.8 -8.0 4.0
10 Wholesale trade 2.4 3.3 1.0 4.7 1.4 2.0 3.9 5.8 2.2 1.7
11 Retail trade 1.2 0.9 0.0 4.5 -0.2 3.1 -0.6 2.0 0.4 -3.1
12 Transportation and warehousing 4.3 2.5 4.1 5.7 3.5 4.3 0.1 3.5 1.3 1.0
13 Information 0.0 0.6 -0.2 0.9 0.4 -0.5 1.3 1.8 -0.6 0.9
14 Finance, insurance, real estate, rental, and leasing 3.8 1.9 4.5 3.3 3.8 1.8 -0.6 3.2 3.3 0.2
15 Finance and insurance 5.3 0.9 7.0 5.4 3.8 1.1 -4.8 4.5 3.1 -2.3
16 Real estate and rental and leasing 2.7 2.7 2.7 1.7 3.7 2.3 2.8 2.3 3.4 2.2
17 Professional and business services 1.3 1.2 2.5 1.4 0.7 0.7 1.6 1.2 1.1 1.3
18 Professional, scientific, and technical services 1.5 1.2 2.5 1.9 0.8 0.6 1.9 1.1 1.0 1.4
19 Management of companies and enterprises -0.1 -0.7 2.3 -1.3 0.0 -0.3 -1.8 -0.1 -0.7 0.4
20 Administrative and waste management services 1.7 2.0 2.6 1.8 0.9 1.5 2.9 2.1 2.3 1.6
21 Educational services, health care, and social assistance 1.9 1.9 1.8 2.4 1.5 2.4 1.4 1.8 2.6 1.8
22 Educational services 2.3 2.0 2.4 2.7 2.0 2.0 2.2 2.4 1.1 1.4
23 Health care and social assistance 1.8 1.9 1.7 2.3 1.4 2.5 1.2 1.8 2.8 1.9
24 Arts, entertainment, recreation, accommodation, and food services 2.5 2.5 4.6 0.8 3.1 2.3 3.3 2.8 1.0 3.1
25 Arts, entertainment, and recreation 2.1 2.2 3.6 2.8 3.3 1.8 1.5 3.0 -0.3 5.5
26 Accommodation and food services 2.6 2.7 4.9 0.2 3.0 2.5 3.9 2.7 1.5 2.4
27 Other services, except government 2.4 2.9 2.8 2.3 2.8 2.8 3.2 3.3 2.2 2.9
28 Government 3.5 2.1 4.2 3.2 3.2 3.0 1.5 1.1 2.3 1.4
29 Federal 3.3 2.2 4.5 3.3 2.6 3.0 5.0 -2.2 1.4 1.2
30 State and local 3.5 2.1 4.1 3.1 3.4 2.9 -0.1 2.6 2.7 1.4
Addenda:
31 Private goods-producing industries1
4.6 -0.6 7.2 4.8 2.2 -0.2 -4.3 1.6 -3.6 1.8
32 Private services-producing industries2
2.4 1.8 2.9 2.6 2.1 2.0 0.9 2.4 2.1 0.6
Table 7. Chain-Type Price Indexes for Gross Output by Industry Group: Percent Change from Preceding Period
2019
Source: U.S. Bureau of Economic Analysis
2018 2019Line 2018
1. Consists of agriculture, forestry, fishing, and hunting; mining; construction; and manufacturing.
2. Consists of utilities; wholesale trade; retail trade; transportation and warehousing; information; finance, insurance, real estate, rental, and leasing; professional and
business services; educational services, health care, and social assistance; arts, entertainment, recreation, accommodation, and food services; and other services, except
government.
Seasonally adjusted at annual rates
- 13 -

April 6, 2020
I II III IV I II III IV
1 All industries 36,593.3 37,806.9 35,843.6 36,427.9 36,917.2 37,184.6 37,324.0 37,700.6 38,005.2 38,197.8
2 Private industries 32,631.1 33,690.9 31,950.3 32,482.8 32,928.3 33,163.0 33,277.6 33,599.3 33,868.5 34,018.4
3 Agriculture, forestry, fishing, and hunting 446.6 449.8 447.1 451.5 441.4 446.6 442.2 446.9 452.3 457.9
4 Mining 623.8 576.7 577.5 618.5 651.5 647.7 603.0 592.8 554.6 556.5
5 Utilities 509.3 498.3 504.6 510.0 506.0 516.6 504.6 493.4 496.7 498.5
6 Construction 1,608.4 1,661.9 1,583.7 1,607.5 1,624.3 1,618.1 1,650.5 1,652.8 1,663.0 1,681.4
7 Manufacturing 6,217.0 6,265.9 6,100.4 6,175.8 6,288.0 6,303.9 6,276.3 6,284.8 6,260.6 6,242.1
8 Durable goods 3,168.3 3,242.3 3,089.4 3,124.9 3,215.3 3,243.8 3,279.2 3,244.6 3,235.0 3,210.4
9 Nondurable goods 3,048.7 3,023.6 3,011.0 3,050.9 3,072.7 3,060.1 2,997.1 3,040.1 3,025.6 3,031.7
10 Wholesale trade 2,040.8 2,098.0 1,999.6 2,036.8 2,054.7 2,072.2 2,097.8 2,098.0 2,101.8 2,094.4
11 Retail trade 1,862.8 1,929.2 1,837.2 1,860.9 1,873.1 1,880.0 1,890.1 1,921.4 1,950.1 1,955.1
12 Transportation and warehousing 1,266.1 1,288.5 1,228.7 1,260.5 1,275.8 1,299.5 1,281.1 1,286.8 1,285.6 1,300.6
13 Information 1,833.5 1,941.5 1,782.5 1,823.8 1,856.9 1,870.7 1,894.4 1,932.6 1,959.5 1,979.3
14 Finance, insurance, real estate, rental, and leasing 6,972.4 7,303.4 6,866.1 6,940.6 7,004.5 7,078.3 7,145.4 7,267.5 7,388.0 7,412.5
15 Finance and insurance 3,029.1 3,160.6 2,983.9 3,013.3 3,038.1 3,081.0 3,085.2 3,144.8 3,215.0 3,197.3
16 Real estate and rental and leasing 3,943.3 4,142.8 3,882.1 3,927.3 3,966.4 3,997.3 4,060.2 4,122.7 4,173.1 4,215.2
17 Professional and business services 4,109.1 4,303.2 4,011.2 4,084.9 4,151.9 4,188.3 4,211.8 4,274.4 4,347.8 4,378.8
18 Professional, scientific, and technical services 2,375.9 2,487.1 2,321.7 2,374.1 2,394.9 2,413.1 2,425.5 2,471.1 2,523.0 2,528.9
19 Management of companies and enterprises 635.7 674.9 628.5 629.6 644.7 640.0 659.7 671.8 681.7 686.4
20 Administrative and waste management services 1,097.4 1,141.1 1,061.0 1,081.2 1,112.3 1,135.2 1,126.5 1,131.6 1,143.1 1,163.4
21 Educational services, health care, and social assistance 2,893.4 3,029.3 2,832.6 2,874.5 2,921.0 2,945.4 2,976.3 3,017.6 3,042.5 3,080.7
22 Educational services 369.6 381.2 365.7 366.5 372.5 373.5 376.8 378.9 382.7 386.5
23 Health care and social assistance 2,523.8 2,648.0 2,466.9 2,508.0 2,548.4 2,571.9 2,599.5 2,638.7 2,659.7 2,694.2
24 Arts, entertainment, recreation, accommodation, and food services 1,508.2 1,573.7 1,463.4 1,502.8 1,529.3 1,537.1 1,544.6 1,568.0 1,590.5 1,591.6
25 Arts, entertainment, and recreation 362.5 381.9 347.7 362.4 367.7 372.4 376.8 381.6 383.3 385.8
26 Accommodation and food services 1,145.6 1,191.8 1,115.8 1,140.5 1,161.6 1,164.7 1,167.8 1,186.4 1,207.2 1,205.8
27 Other services, except government 739.7 771.5 715.7 734.6 749.7 758.7 759.4 762.3 775.4 788.9
28 Government 3,962.2 4,116.0 3,893.3 3,945.1 3,988.9 4,021.6 4,046.5 4,101.3 4,136.7 4,179.4
29 Federal 1,201.1 1,259.3 1,177.1 1,196.9 1,210.8 1,219.7 1,234.7 1,255.5 1,266.2 1,280.9
30 State and local 2,761.1 2,856.6 2,716.2 2,748.2 2,778.1 2,801.9 2,811.8 2,845.8 2,870.6 2,898.5
Addenda:
31 Private goods-producing industries1
8,895.9 8,954.4 8,708.7 8,853.3 9,005.2 9,016.3 8,972.0 8,977.3 8,930.5 8,937.9
32 Private services-producing industries2
23,735.2 24,736.5 23,241.5 23,629.5 23,923.1 24,146.7 24,305.5 24,622.0 24,938.0 25,080.5
Source: U.S. Bureau of Economic Analysis
2018 2019 2018Line
Billions of dollars
Table 8. Gross Output by Industry Group
2019
2. Consists of utilities; wholesale trade; retail trade; transportation and warehousing; information; finance, insurance, real estate, rental, and leasing; professional and
business services; educational services, health care, and social assistance; arts, entertainment, recreation, accommodation, and food services; and other services, except
government.
1. Consists of agriculture, forestry, fishing, and hunting; mining; construction; and manufacturing.
Seasonally adjusted at annual rates
- 14 -