
Gridded Biome-BGC Simulation with Explicit Fire-disturbance Sinkyu Kang, John Kimball, Steve W....
26
Gridded Biome-BGC Simulation with Explicit Fire-disturbance Sinkyu Kang, John Kimball, Steve W. Running Numerical Terradynamic Simulation Group, School of Forestry, Univeristy of Montan
-
Upload
aidan-kane -
Category
Documents
-
view
221 -
download
1
Transcript of Gridded Biome-BGC Simulation with Explicit Fire-disturbance Sinkyu Kang, John Kimball, Steve W....

Gridded Biome-BGC Simulation with Explicit
Fire-disturbance
Sinkyu Kang, John Kimball, Steve W. RunningNumerical Terradynamic Simulation Group,
School of Forestry, Univeristy of Montan

Purpose
• Demonstrate Gridded Biome-BGC run in BOREAS.
• Illustrate Biome-BGC modification for explicit fire-disturbance simulation
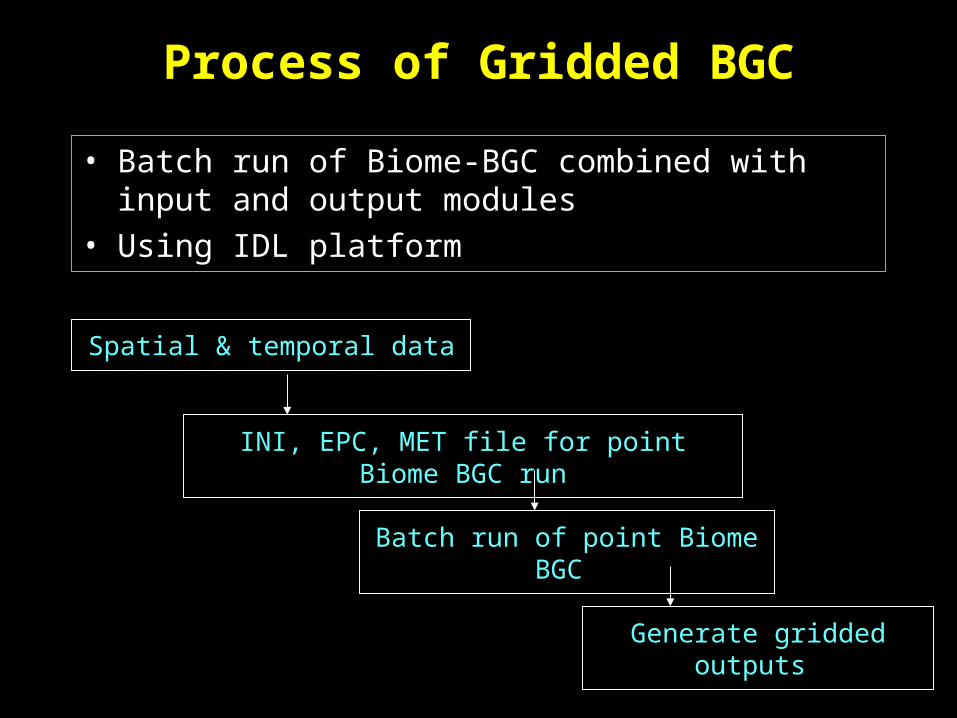
Process of Gridded BGC
• Batch run of Biome-BGC combined with input and output modules
• Using IDL platform
Spatial & temporal data
INI, EPC, MET file for point Biome BGC run
Batch run of point Biome BGC
Generate gridded outputs

Considering Explicit Fire-Disturbance
Raw Data Size and location
Year Month Day LON(dd) LAT(dd) Start_Date Size (ha)1959 5 24 -105.586 54.318 5/24/1960 242.911959 6 8 -104.206 53.602 6/8/1959 323.881959 5 24 -101.002 52.605 5/24/1959 216.5991959 5 21 -100.846 52.387 5/21/1959 251.0121959 5 23 -100.87 52.569 5/23/1959 291.4981959 5 22 -100.978 52.598 5/22/1959 595.1421959 7 15 -100.233 56.483 7/15/1959 663.1581960 8 24 -105.95 55.55 8/24/1960 9311.741960 7 22 -105.8 55.67 7/22/1960 728.741960 8 14 -105.77 56.52 8/14/1960 21246.961960 8 10 -105.45 55.52 8/10/1960 2429.1491960 7 26 -104.558 54.699 7/26/1960 16963.561960 8 18 -103.63 56.3 8/18/1960 404.851960 8 9 -103.57 56.35 8/9/1960 364.37
Radius (km) Rows Cols1 32 81 40 161 52 351 55 361 53 361 52 361 6 405 17 62 15 78 5 73 17 97 27 141 8 201 7 20
Before 1959: constant fire mortality
After 1959: external fire mortality from the raw data

Generate fire grid0 0 0 0 0 0 0 0 0 0
0 0 0 0 0 0 0 0 0 0
0 0 0 0 0 0 0 0 0 0
0 0 0 0 0 0 0 0 0 0
0 0 0 0 0 0 0 0 0 0
0 0 0 0 0 0 0 0 0 0
0 0 0 0 0 0 0 0 0 0
0 0 0 0 0 0 0 0 0 0
0 1 0 0 0 0 0 0 0 0
0 0 1 1 1 0 0 0 0 0
0 0 1 1 1 0 0 0 0 0
0 0 1 1 1 0 0 0 0 0
0 0 1 1 1 0 0 0 0 0
0 0 1 1 1 0 0 0 0 0
0 0 0 0 0 0 0 0 0 0
0 0 0 0 0 0 0 0 0 0
0 0 0 0 0 0 0 0 0 0
0 0 0 0 0 0 0 0 0 0
0 0 0 0 0 0 0 0 0 0
0 0 0 0 0 0 0 0 0 0
0 0 0 0 0 0 0 0 0 0
0 0 0 0 0 0 0 0 0 0
0 0 0 0 0 0 0 0 0 0
0 0 0 0 0 0 0 0 0 0
0 0 0 0 0 0 0 0 0 0
0 1 0 0 0 0 0 0 0 0
0 0 1 1 1 0 0 0 0 0
0 0 1 1 1 0 0 0 0 0
0 0 1 1 1 0 0 0 0 0
0 0 1 1 1 0 0 0 0 0
0 0 1 1 1 0 0 0 0 0
0 0 0 0 0 0 0 0 0 0
0 0 0 0 0 0 0 0 0 0
0 0 0 0 0 0 0 0 0 0
Year
1971 01972 01973 01974 01975 01976 01977 01978 01979 01980 11981 01982 01983 01984 01985 01986 01987 01988 01989 11990 0
cell[i,j] annual fire file
Considering Explicit Fire-Disturbance
87
83
84
85
86

Considering Explicit Fire-Disturbance
1.0 (DIM) multiplier for shortwave radiation CO2_CONTROL (keyword - do not remove) 1 (flag) 0=constant 1=vary with file 2=constant, file for Ndep286.923 (ppm) constant atmospheric CO2 concentration kco21862.txt (file) annual variable CO2 filename FIRE_CONTROL (keyword - do not remove) 1 (flag) 0=constant fire mortality 1=vary with file fire-5-14.txt (file) annual variable fire mortality (year fire_mortality) SITE (keyword) start of site physical constants block
Modifed INI & EPC files
Run Modified Biome-BGC
ECOPHYS ENF-cool (wet conifer) 1 (flag) 1 = WOODY 0 = NON-WOODY …………………………………………………….0.005 (1/yr) annual whole-plant mortality fraction 0.005 (1/yr) mean annual fire mortality fraction 0.26 (1/yr) annual carbon fraction consumed by fire 1.5 (ratio) (ALLOCATION) new fine root C : new leaf C1.1 (ratio) (ALLOCATION) new stem C : new leaf C

0
50
100
150
200
250
1900 1920 1940 1960 1980 2000
Year
ET (
mm
/y)
& N
PP
(g
C/m
2/y
)
0
2
4
6
8
10
LA
I (m
2/m
2)
ET NPP LAI
ET
(m
m/y
) &
NP
P (
gC/m
2/y)
LA
I (m
2/m
2)
Dai
ly f
ire
mor
talit
y
Constant fire mortality > 1959 < Explicit fire occurrence
Internal fire-disturbance External fire-disturbance

Modification of Biome-BGC
Biome-BGC v.411 47 source files 8 header files 2 library files
In this study, even this small change demanded
modification of 7 source files modification of 4 header files addition of a new subroutine source file

Application to the Boreal Forest Biome
Grid size (simulation unit): 66 columns and 60 rows (ca. 660300km2)
Each simulation uses identical land cover and soil property over the entire grid identical spatial meteorological variable (1994~1996)
Every simulation differs in land cover types (DBF, Grass, DC, WC) constant or varying ambient CO2 and internal or external fire-
disturbance Nine climate change scenario (control, 2oC, 20%
precipitation)
Total 108 cases of gridded Biome-BGC runs
Experimental Design

660km
300km
Land Cover

Topography
N
N

Climate (3-yr mean)
Tmax Tmin
Precipitation Radiation

Sample Result 1 – Land cover
DBF(412, 87.5 g/m2)
Grass(347, 48.6 g/m2)
WC(140, 8.7 g/m2)
DC(279, 26.2 g/m2)

Sample Result 2 – CO2
Difference (23, 2.8 g/m2)
Const. CO2 – Increasing CO2
WC, Const. CO2(140, 8.7 g/m2)
WC, Increasing CO2(163, 11.1 g/m2)

Sample Result 3 - FireDifference (-1.4, 3.7 g/m2)
External fire – Increasing CO2
WC, External fire(161, 11.8 g/m2)
WC, Increasing CO2(163, 11.1 g/m2)
130
150
170
Constant Increasing Fire
NPP (
gC
/m2)

Sample Result 4 – Climate Change
PRCP*TEMP: PRCP(-1,0,+1), TEMP(-1,0,+1), EX: +1-1 (1.2*prcp & -2 of Temp.)
00
+10 -10
+1+1 +1-1 -1+1 -1-1
DBF, Const. CO2

Climate Scenario
0.8P
1.2P(+2T)
1.2P
0.8P(-2T)
0.8P(+2T)
1.2P(-2T)
300 350 400 450 500
C
1.2P
0.8P
1.2P(+2T)
1.2P(- 2T)
0.8P(+2T)
0.8P(- 2T)
NPP (gC/m2)

Future consideration
Model InitializationSpin-up run: – initialize soil and vegetation variable at balanced
equilibrium condition– time consuming process as number of gridcells increase
Extrapolation from satellite measurement: – satellite-driven LAI initialize vegetation carbon variables
using allometry rules (Landsat & MODIS in watershed and regional scale)
Replace model phenology with RS phenology (ex. MODIS)

MOD17: daily PSN (MOD17A2)
BGC: daily PSN with spin-up simulation
MOD15-BGC: daily PSN using input LAI from MOD15
0
2
4
6
0 60 120 180 240 300 360
MOD17
BGC
MOD15- BGCP
SN
(gC
m-2 d
-1)
yearday
Grass
Reinitialize usingsatellite-driven LAI + allometry from spin-up simulation

0
1
2
3
4
5
6
7
8
0 60 120 180 240 300 360
Yearday
LA
I (m
2/m
2)
MODIS
BGC
COOP. Weather Station, Alabama

0
2
4
6
8
0 60 120 180 240 300 360
yearday
Pro
jecte
d L
AI
(m2/m
2)
Ulsan Daekwalryung
Warm (13.3 oC)
Cool (6.2 oC)
90
100
110
120
130
140
90 100 110 120 130 140
Predicted (Model- S, yearday)
Ob
serv
ed
(yeard
ay)
MAE = 1.7Bias = 1.7
90
100
110
120
130
140
90 100 110 120 130 140
Predicted (Model- 8, yearday)
Ob
serv
ed
(yeard
ay)
MAE = 4.9Bias = -4.9
90
100
110
120
130
140
1995 1996 1997 1998 1999 2000 2001 2002year
yeard
ay
Model-SModel-8
KBmean
TSTTsum )1(
1
)()2(j
otavgsum CTTT
)()3( 30TfTST

Meteorological Data
Soil Data
1.Respiration 2.Temperature 3.Water content 4.SOM
Field LAI
DEM
Spatially-explicit estimations
RS
NDVI
Field sampling & measurement
LAI-NDVI model
Meteorological Models 1.Air temperature 2.Precipitation 3.Solar radiation 4.Vapor pressure deficit
Soil respiration
model
Soil moisture
model
Soil temperature
model
Model Overview

0
1
2
3
4
5
6
0 61 122 183 244 305 366
LA
I
Leaf emergency (Je) (Ta-5oC) > 88oC
End of litterfall (Jb) (Ta-10oC) < -150oC
Maximum LAI (Jm)(Aug. 15 in this study)
LAI model
max1))(exp(
1))(exp(LAI
JJ
JJLAI
m
e
LAI-NDVI model
LAI model

NDVI (Landsat TM,
August, 1991)
Mean 0.55
STDEV 0.13
(solid dots are locations where LAI was measured.)

LAI-NDVI model
Landsat TM image in Aug. 1991
LAI measured in Aug. 1998 and 1999 using LI-COR 2000

120 (0~3.8 m2 m-2) 125 130
135 140 145
LAI-NDVI Model : Leaf Emergence and Expand