Grid Portal Testing - Worcester Polytechnic Institute (WPI)
86
CS-GXS-0601 Grid Portal Testing submitted to the Faculty of the Worcester Polytechnic Institute in partial fulfillment of the requirements for the Degree of Bachelor of Science by _______________________________ Ramon Harrington Date: _______________________________ Danielle Martin Date: _______________________________ Carsten Winsnes Date: Professor Gábor Sárközy, Major Advisor 1
Transcript of Grid Portal Testing - Worcester Polytechnic Institute (WPI)

CS-GXS-0601
Grid Portal Testing
submitted to the Faculty
of the
Worcester Polytechnic Institute
in partial fulfillment of the requirements for the
Degree of Bachelor of Science
by
_______________________________
Ramon Harrington Date:
_______________________________
Danielle Martin Date:
_______________________________
Carsten Winsnes Date:
Professor Gábor Sárközy, Major Advisor
1

Abstract
This project encompasses the design and development of a system for the P-GRADE
Portal located at MTA-SZTAKI; this system will allow the portal to test the grids it
interfaces with and report on the state of resources within the grids. This grid testing is
important because it allows portal administrators and users to be able to understand the
current state of the grid and its resources.
2

Acknowledgments We would like to thank WPI and MTA SZTAKI for allowing us the opportunity to create
a grid testing system for the P-GRADE Portal. Everyone at the Laboratory of Parallel
and Distributed Systems was very supportive of us and was able to provide us with all the
resources we needed. Prof. Dr. Péter Kacsuk has done a superb job overseeing the
project. We would like to thank József Patvarczki for preparing us for our project along
with Gábor Hermann and Krisztián Karóczkai for the help they provided during the
development. Also, we appreciate the help from Ádám Kornafeld and Atilla Marosi in
making us feel welcome and easing the transition to living in Budapest. We would like
to thank Miklós Kozlovszky for the guidance and support he offered us throughout the
project. Most importantly, we would like to thank Gábor Sárközy for making this project
possible and giving us the opportunity for such an amazing experience.
3

TABLE OF CONTENTS
ABSTRACT .................................................................................................................................................. 2 ACKNOWLEDGMENTS............................................................................................................................ 3 LISTING OF TABLES ................................................................................................................................ 6 1 PROJECT STATEMENT ........................................................................................................................ 7
1.1 THE EXISTING SYSTEM ................................................................................................................ 7 1.2 THE NEED FOR GRID TESTING...................................................................................................... 7 1.3 OUR END RESULTS....................................................................................................................... 8
2 BACKGROUND ................................................................................................................................. 9 2.1 HISTORY OF GRIDS AND GRID COMPUTING.................................................................................. 9 2.2 APPLICATIONS OF GRIDS............................................................................................................ 10 2.3 GRID TECHNOLOGIES ................................................................................................................. 10
2.3.1 The Globus Toolkit ............................................................................................................... 11 2.3.2 Condor.................................................................................................................................. 11 2.3.3 Parallel Programming.......................................................................................................... 12 2.3.4 MPI....................................................................................................................................... 12 2.3.5 PVM...................................................................................................................................... 12
2.4 SZTAKI’S LPDS AND P-GRADE ............................................................................................. 13 2.4.1 What is P-GRADE ................................................................................................................ 14 2.4.2 How P-GRADE Works.......................................................................................................... 14
2.5 THE PGRADE PORTAL.............................................................................................................. 15 2.5.1 Portlets ................................................................................................................................. 20
2.6 GRID TESTING............................................................................................................................ 20 2.6.1 Why Testing is Necessary ..................................................................................................... 21 2.6.2 Complexity of Grid Testing................................................................................................... 22 2.6.3 How to Test........................................................................................................................... 22 2.6.4 Benefits of Results................................................................................................................. 23 2.6.5 Our Grid Testing Solution .................................................................................................... 24
2.6.5.1 Workflow Repository................................................................................................................. 24 2.6.5.2 Data Logging ............................................................................................................................. 25 2.6.5.3 Result Visualization ................................................................................................................... 25
3 METHODOLOGY ........................................................................................................................... 26 3.1 TECHNOLOGIES INVOLVED IN IMPLEMENTATION ....................................................................... 26
3.1.1 Portals & Portlets................................................................................................................. 26 3.1.2 Gridsphere:........................................................................................................................... 26 3.1.3 JSP........................................................................................................................................ 28 3.1.4 Perl ....................................................................................................................................... 29 3.1.5 XML ...................................................................................................................................... 30 3.1.6 DOM..................................................................................................................................... 31 3.1.7 MySQL.................................................................................................................................. 32 3.1.8 DBI ....................................................................................................................................... 33 3.1.9 Google Maps API ................................................................................................................. 34 3.1.10 Java.................................................................................................................................. 35
3.1.10.1 Eclipse........................................................................................................................................ 36 3.2 WORKFLOW REPOSITORY .......................................................................................................... 38 3.3 TEST LOGGING ........................................................................................................................... 40 3.4 TEST WORKFLOW VISUALIZATION............................................................................................. 42
3.4.1 Portal Visualization.............................................................................................................. 43 3.4.1.1 Workflow Log Parsing............................................................................................................... 43 3.4.1.2 Naming Convention ................................................................................................................... 44
4

3.4.1.3 Local Visualization .................................................................................................................... 47 3.4.1.4 Centralized Database.................................................................................................................. 49
3.4.2 Central Visualizations .......................................................................................................... 50 3.4.2.1 Grid Map Visualization.............................................................................................................. 51 3.4.2.2 Collective Grid Status ................................................................................................................ 52 3.4.2.3 Regular Log Processing ............................................................................................................. 52
4 IMPLEMENTATION ...................................................................................................................... 54 4.1 WORKFLOW REPOSITORY .......................................................................................................... 54
4.1.1 Defining the Template Directory .......................................................................................... 54 4.1.2 The Table of Actual Parameters ........................................................................................... 55 4.1.3 Macro Substitution ............................................................................................................... 55
4.2 THE LOGGER .............................................................................................................................. 58 4.2.1 Log Inside the Portal ............................................................................................................ 60
4.2.1.1 Live Logging.............................................................................................................................. 60 4.2.1.2 Creating the Panel ...................................................................................................................... 61 4.2.1.3 Providing Information to the Panel ............................................................................................ 63
4.3 VISUALIZING TEST RESULTS ...................................................................................................... 63 5 EVALUATION ................................................................................................................................. 70
5.1 SUBSTITUTION EVALUATION...................................................................................................... 70 5.2 LOGGER EVALUATION ............................................................................................................... 70 5.3 VISUALIZATION EVALUATION.................................................................................................... 72
6 CONCLUSIONS ............................................................................................................................... 75 6.1 THE FINAL SUBSTITUTION SYSTEM............................................................................................ 75 6.2 THE FINAL LOGGING SYSTEM .................................................................................................... 75 6.3 THE FINAL VISUALIZATION SYSTEM.......................................................................................... 76 6.4 FUTURE IMPLEMENTATION......................................................................................................... 76
6.4.1 The Future of the Logging System ........................................................................................ 77 6.4.2 Grid Status Alerts ................................................................................................................. 77
7 WORKS CITED ............................................................................................................................... 78 APPENDIX A ARCHITECTURE OF THE VISUALIZATION SYSTEM.......................................... 82 APPENDIX B POSSIBLE GRID STATES.............................................................................................. 83 APPENDIX C NAMING CONVENTION TREE ................................................................................... 84 APPENDIX D BEFORE AND AFTER THE KEY SUBSTITUTION .................................................. 85 APPENDIX E LOGGING ARCHITECTURE........................................................................................ 86
5

Listing of Tables TABLE 3.1 – POSSIBLE JSP TAGS THAT CAN EXIST ALONG WITH PRESENTATION CODE ……………...29 TABLE 3.2 – THE VISUALIZATION COLOR SCHEME……………………………………………………….52 TABLE 4.1 – FORMAL PARAMETER DEFINITIONS…………………………………………………………55 Listing of Figures FIGURE 2.1 – THE WORKFLOW TAB OF THE P-GRADE INTERFACE…………………………………….19 FIGURE 2.2 – USING THE WORKFLOW EDITOR……………………………………………………………20 FIGURE 3.1 – AN EXAMPLE OF A GENERIC GRIDSPHERE PORTAL………………………………………..27 FIGURE 3.2 – DIAGRAM OF THE ECLIPSE PLATFORM……………………………………………………..37 FIGURE 3.3 – THE ECLIPSE WORKBENCH…………………………………………………………………38 FIGURE 3.4 – A TEMPLATE FILE: MULTIPREMLOC.JDL………………………………………………….39 FIGURE 3.5 – A FULLY SUBSTITUTED FILE………………………………………………………………...40 FIGURE 3.6 – TEST WORKFLOW NAMING CONVENTION………………………………………………….45 FIGURE 3.7 – TYPES OF TEST WORKFLOWS……………………………………………………………….49 FIGURE 4.1 – TAP HEADER……………………………………………………………………………...…55 FIGURE 4.2 – SAMPLE LOG FILE…………………………………………………………………………...59 FIGURE 4.3 – THE STATISTICS PANEL……………………………………………………………………..62 FIGURE 4.4 – TEST WORKFLOW RESULTS………………………………………………………………...65 FIGURE 4.5 – VISUALIZING THE BROKER TESTS………………………………………………………….67 FIGURE 4.6 – GRID STATUS MAP…………………………………………………………………………..68 FIGURE 5.1 – STRESS TEST RESULTS………………………………………………………………………72
6
1 Project Statement
The goal of our project is to implement a system which would enable portals to test the
grids with which they interface and display the results for the administrators and users of
the portals. The system will be implemented in three parts; the creation of a repository of
test workflows, the implementation of a logging mechanism from within the portal and
the development of a system for visualization of the results. These three tools will work
in combination with the P-GRADE portal which has been developed by MTA-SZTAKI,
located in Budapest, Hungary.
1.1 The Existing System The P-GRADE Portal, which is being developed by SZTAKI, provides a web interface
for PGRADE systems. Using the portal, users are able to create and manage workflows
with the help of the Workflow Manager and Editor. These workflows define a structure
of jobs which are to be executed by a grid. Once these workflows are created, they can
be submitted to a grid and monitored through the portal. The portal is able to support
multiple users which are simultaneously interacting with grids by creating and submitting
workflows. The interface provided by the portal hides many of the details of the grid
which are trivial to the user.
1.2 The Need for Grid Testing
Grid computing offers an incredible potential to allow users to utilize an array of remote,
dedicated resources, and portals only increase this potential by providing a user-friendly
interface to manage grid details; however problems may arise for some users. When
7

submitting workflows to the portal, problems may occur in either the portal or the grid, as
the complexity of a grid can make it unreliable. Testing available grids will help to
identify and fix problems in the grids and portals alike and will give users a handle on the
stability of grids they may try to use. Adding grid testing capability to the portal would
allow for the visualization of detailed results based on certain grids and their resources.
1.3 Our End Results
In completing this project, our goal was to create a system that would allow the PGRADE
Portal to monitor the status of grids. To implement this system, we had to organize the
development of the various parts of this project so they would integrate well. The
individual parts of our projected needed to be able to communicate effectively with either
of the other parts.
Our project consisted of three parts which needed to be developed: a workflow
repository, a logging mechanism for the portal and a method for collecting and
visualizing the data. The workflow repository was created by using a parameter file to
fill in a template workflow. These test workflows are then able to be run by the portal to
test the underlying grids. The portal was enhanced to provide logging capabilities for
workflows. By accessing the results of test workflows performed by the portal,
visualizations were created by scripts which ran parallel to the portal. The details of how
these parts perform and interact are discussed in later in this paper.
8

2 Background
2.1 History of Grids and Grid Computing Researchers around the world rely on computers as an aid in solving complex problems.
Computers are used to perform calculations that would otherwise take humans enormous
amounts of time to complete. Computers are able to process the data much faster than
humans but still have their own limitations. As the complexity of a problem increases, so
does the amount of computing power needed to solve it. Even with the rapid
development of computer technology, individual computers have not been able to keep
up with the growing need [3].
The solution to this problem is to pool resources together and create a system that is more
powerful than the individual parts. By connecting computers together, they are able to
share resources and work cooperatively in performing a task. This is the basic
framework and goal of a grid. A grid can aggregate a variety of hardware and software
resources that are geographically separated [1].
When compared to other technologies, grids stand out because of the level of integration
that can be achieved between different resources. With most existing distributed
computing technologies, they perform one task very well but are inappropriate when
applied to different situations. For example, application and storage service providers are
great in accomplishing their own tasks. However, with most of their current services, it is
very difficult to create a system that uses multiple different service providers together.
Grids are the solution to these types of problems because of their ability to seamlessly
and dynamically integrate an array of resources [2].
9

2.2 Applications of Grids Grids have been used in many areas of research because of their incredible computing
power. One of these uses is employed in meteorological forecasting where it is
computationally expensive because of the complex calculations that need to be
performed. The calculations can be broken into smaller parts by looking at small
volumes of the atmosphere. However, each of these small volumes heavily affects the
volumes adjacent to it [3]. MEANDER [4] is an example of a weather nowcasting
application that uses grids to perform computationally intensive calculations. Developed
by the Hungarian Meteorological Service (HMS), MEANDER is able to analyze and
predict an ultra-short range weather phenomenon that may be potentially dangerous. For
a system such as this to be useful, it needed to be able to process the data in a very short
period of time. The developers of MEANDER were able accomplish this goal by
parallelizing the program using grids to execute it [4].
With many similarly useful applications, grids are being constructed around the world.
• EGRID [41]
• HunGrid [42]
• SEE-GRID [43]
• UK NGS [44]
• VOCE [45]
2.3 Grid Technologies There was a significant amount of technology that needed to be developed before grids
could as useful as they are today. Part of the goal of a grid is to be able to connect
10

multiple types of resources in a consistently useful manner. Unlike previously,
developers now had to be able to handle completely heterogeneous environments. These
variations mean there needs to be common protocols in place for individual resources to
be able to communicate and work effectively [3].
2.3.1 The Globus Toolkit
The Globus Toolkit [5], developed by the Globus Alliance, was a big step toward solving
these problems. The Globus Toolkit provides many protocols and services that are
necessary for many current grid implementations such as security, resource access,
resource management, data movement and resource discovery. This addressed many
common problems that affected all grids, within a common framework. This served as a
base for which many different grids could be built on. Others were free to use, modify
and update the Globus Toolkit to fit their needs because it was released as open-source
software. The toolkit was able to solve a lot of problems many developers had, and in a
way that was not cumbersome [5].
2.3.2 Condor Another very important step was the development of Condor [6]. Condor is a workflow
management system developed at the University of Wisconsin. Condor controls
scheduling and resource monitoring and management for user-submitted jobs. Jobs are
placed in a queue and Condor decides where and when each job will run. This
technology is very important to a grid because there are many potential resources on a
grid, and decisions need to be made about where jobs should go. Condor-G is able to fill
this role for grids. It is an implementation of Condor which makes use of the Globus
11

Toolkit. Technologies like Condor and the Globus Toolkit provide the foundation for
grids [6].
2.3.3 Parallel Programming Once these grids are established, the next goal is to find ways to use them efficiently.
Prior to the use of grids, programs would just run on a single machine. With grids
however, there are several machines involved and to take advantage of this, a new
approach of programming was needed. One way of doing this was to break up programs
into smaller parts that can be sent to multiple resources and executed simultaneously.
This is known as parallel programming and works well within a grid environment; it
allows large programs that would take a long time to run on a single machine to be
distributed across a grid, thus finishing faster [4].
2.3.4 MPI MPI, Message Passing Interface [7], has been created as one of the possible solutions to
this problem. The MPI Forum created MPI as a way for programs running in different
address spaces to be able to communicate and synchronize. Data is passed between the
address spaces in messages that are sent and received [7]. MPI was designed to fulfill the
needs of many computer architectures and as a result, allows for portable programs. This
meant that an MPI program can be copied to, compiled and run on a computer with a
different architecture. This is important for heterogeneous grids that contain many
different types of resources [8].
2.3.5 PVM
12

Parallel Virtual Machine, PVM [8], works in a similar manner to MPI in that it also
provides a way for programs to communicate through passing messages. One of the
important differences between PVM and MPI is that PVM provides for interoperability in
addition to portability. Not only can PVM programs be copied to, compiled and run on
machines with different architectures, these different instances of the program are still
able to communicate together. This takes the portability to another level and is even
more useful in a heterogeneous environment [8].
Both PVM and MPI have their place within grids by allowing for heterogeneous
environments. MPI typically works better within a single cluster of similar machines. In
this environment, MPI can cut down overhead because it does not provide for
functionality that is not necessary. PVM works well between different clusters allowing
them to work together. By mixing MPI and PVM, parallel programs can be run
efficiently across heterogeneous grids which takes advantage of the benefits of both
without the drawbacks [9].
2.4 SZTAKI’s LPDS and P-GRADE The host of this project is the Laboratory of Parallel and Distributed Systems (LPDS) of
The Computer and Automation Research Institute, Hungarian Academy of Sciences
(MTA SZTAKI) [29]. This lab is governed by the Hungarian Academy of Sciences and
plays a leading role in the research of cluster and grid technologies in Hungary. LPDS
has an extensive history in establishing Grid infrastructures; it has participated in nearly
all and led several of the many Hungarian Grid projects including DemoGrid,
ClusterGrid, SuperGrid, Chemistry Grid, Hungarian Grid, SuperClusterGrid [29].
13

Not only has SZTAKI participated in most Hungarian projects, but several European
endeavors as well. The lab was a member of the European DataGrid project, led the Grid
Monitoring workpackage of the European GridLab project as well as the Automatic
performance Analysis and Grid Computing WP of the European APART-2 project [29].
LPDS serves as the Central-European Regional Training Center of EGEE and contributes
to many of the organization’s workpackages, and additionally, the lab leads the Grid
Middleware WP of the European SEEGRID project and is a partner in the EU CoreGRID
and GridCoord projects as well [29].
2.4.1 What is P-GRADE One of the LPDS’ main ventures has been the creation of the Parallel Grid Run-time and
Application Development Environment (P-GRADE)[31] which is described as “a unique
and complete solution for development and execution of parallel applications on
supercomputers, clusters, and Grid systems”[31]. P-GRADE provides a high-level
graphical interface such that users need not have programming experience in order to use
various parallel and distributed platforms. This environment provides for use of
“transparent” supercomputer, cluster and Grid resources [31].
2.4.2 How P-GRADE Works
This P-GRADE technology is composed of several different technologies and layers.
The language in which it is implemented is called GRAphical Process Net Language
(GRAPNEL)[30]. This graphical language hides many of the low level communication
details through the hierarchical design levels of predefined scalable communication
14

templates ranging from graphical to textual. A graphical editor (GRED) [30] assists the
PGRADE user in manipulation of GRAPNEL programs, both of which were developed
by the LPDS.
Once satisfactorily edited, the textual and graphical information of the program is saved
and can be debugged utilizing DIWIDE [30], a distributed graphical and C/C++ debugger
which provides commands to create breakpoints, step-by-step execution of the program,
animation, etc. Monitoring of the application is provided through two tools, GRM and
Mercury. GRM locally monitors and gathers data from both the user’s system and the
resource host on which the application is running. A Mercury monitor [30] works very
similarly and is used in the case that a firewall is setup between Grids. Mercury’s sensors
gather data for measuring and performance that can be transferred to consumers when
required [30].
2.5 The PGRADE Portal The term ‘web portal’ is a relatively new term and has multiple definitions associated
with it. According to Gridsphere.org, “most definitions classify a portal as a gateway web
site that offers a set of services” [27]. These web sites can be simple HTML pages or
complex scripts, which provide dynamic content. Advanced portals allow the concept of
users and groups. These users and groups may also have the opportunity to customize
their environment with various different options. It is important to note that portals can
consist of many different technologies. One specific portal used in this project is the
Gridsphere [27].
15
Grisphere technology provides an open source web portal in which developers can
develop and run applications. This technology forms the basis of the P-GRADE portal,
the official portal of several European production Grids, specifically SEE-Grid and Hun-
Grid [29].
While theoretically, computational grids have incredible potential to enable users to
access a range of remote resources, without “generally accepted standards” to allow for
wide range sharing and the collaboration of users, executing such a system has proven to
be inefficient [31]. A solution to these difficulties introduces “workflow-oriented grid
portals” which overcomes the two general weaknesses of basic grid work [31].
Initially, portals served as an interface with two purposes: grid application developer and
executor environment. However, as grid technology evolved and the number of
individual grids increased, concurrent resource use between grids went unsupported,
resulting in the isolation of grid groups and requiring users to use another portal and
possibly modify their code in order to comply with the environment. The lack of
collaborative tools, which could “exploit underlying services much more efficiently than
single-user applications,” also lowered the potential power of grid computing [31].
In order to overcome these shortcomings, a new generation of grid portals must be
introduced. The spectrum of portal capability makes it necessary to classify portals and
their capacity to handle the work load for both concurrent isolated and collaborative
16

users. Of the proposed classification categories of grid portals, the P-GRADE Portal [31]
is the most comprehensive, providing the following functions:
• defining grid environments
• creation and modification of workflow applications
• managing grid certificates
• controlling the execution of workflow applications of grid resources
• monitoring and visualizing the progress of workflows and their component jobs
The P-GRADE Grid Portal aims to answer these questions by Grid users:
• How to cope with the large variety of the various Grid systems?
• How to develop/create new Grid applications?
• How to port applications between Grid systems?
• How to port legacy applications to Grid systems?
• How to execute Grid applications?
• How to observe the application execution in the Grid?
• How to tackle performance issues?
• How to execute Grid applications over several Grids in a transparent way? [33]
Workflow applications can be developed both individually and collaboratively. The
workflow-oriented P-GRADE Portal contains a workflow manager which processes grid
certificates for job execution and file transfer in both the individual and collaborative
environments. These two aspects make the P-Grade Portal successful by harnessing
resource power through managing resources and technical details as well as supporting
collaborative work for users.
The main features of the P-GRADE Portal are as follows:
17
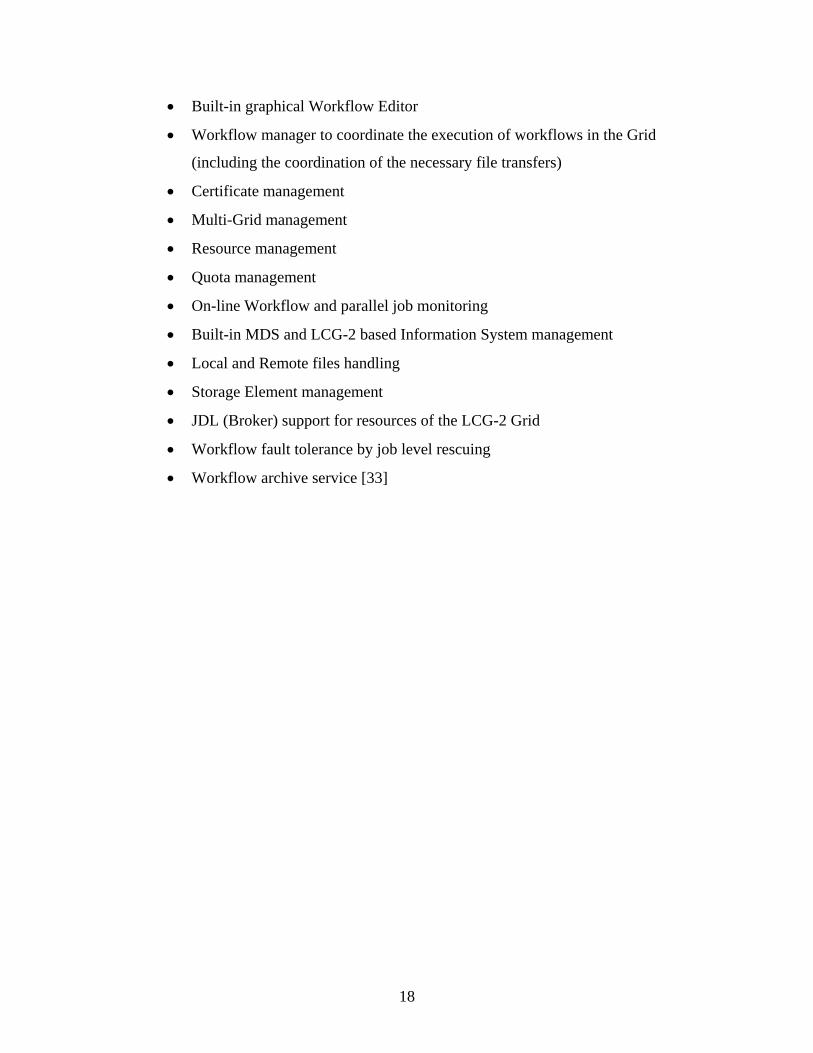
• Built-in graphical Workflow Editor
• Workflow manager to coordinate the execution of workflows in the Grid
(including the coordination of the necessary file transfers)
• Certificate management
• Multi-Grid management
• Resource management
• Quota management
• On-line Workflow and parallel job monitoring
• Built-in MDS and LCG-2 based Information System management
• Local and Remote files handling
• Storage Element management
• JDL (Broker) support for resources of the LCG-2 Grid
• Workflow fault tolerance by job level rescuing
• Workflow archive service [33]
18
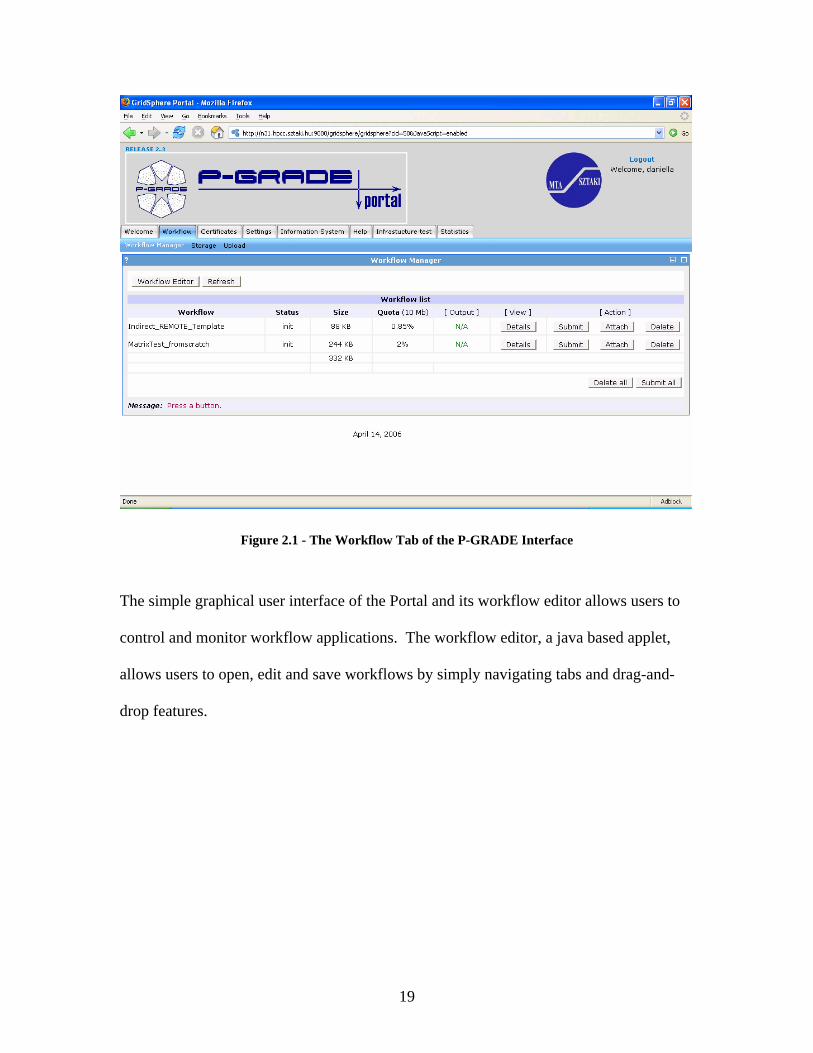
Figure 2.1 - The Workflow Tab of the P-GRADE Interface
The simple graphical user interface of the Portal and its workflow editor allows users to
control and monitor workflow applications. The workflow editor, a java based applet,
allows users to open, edit and save workflows by simply navigating tabs and drag-and-
drop features.
19

Figure 2.2 - Using the Workflow Editor
2.5.1 Portlets A relatively new concept is the portlet [37], which subdivides the portal into different
parts. The first attempt of a portlet was develop for the Jakarta Jetspeed project [37]. This
is an open source project which introduced the concept. IBM also supports a Portlet API
called WebSphere [37]. This API is cleaner and more robust than the Jetspeed project
[37]. In 2003, Java deployed its own version of the Portlet API called Java Specification
Request (JSR) [38]. This portlet revolutionized Portlet development and is now supported
by many of the major players, including IBM and SUN [37].
2.6 Grid Testing
20

The portal utilizes grid-computing technology to run programs that require a large
amount of resources to run. Currently the system has no way to tell if the grid is actually
up and running before the program is submitted to the grid. If it fails, the user simply
needs to re-submit to the grid and hope for the best. Since these programs can take quite
some time to run, it would be beneficial to test the grid before the program is run. This
way the user can see the status of the grid, and avoid submitting to the grid if there are
problems with it. Not only is this good for users submitting to the grid, but also for the
administrators of the grid. They will be able to get the status of the whole grid or specific
parts and react accordingly. Also, looking farther down the road, these results would be
good for research purposes. Since grid computing is relatively new, there is a lot to learn
and results of these tests could be useful.
2.6.1 Why Testing is Necessary The users access the grid through the web-based P-GRADE portal, where they can
submit jobs and see the progress of their workflow. When submitting their jobs through
the portal, there are at least two potential obstacles: problems can occur either in the
portal itself or the grid. It is very important to determine what the cause of the problem is
so the proper administrators can be contacted to fix the problem. The complexity of the
grid’s resource organization can make it quite unreliable, and there is currently no way to
test this by potential customers of the P-GRADE portal.
Logging of different tests over the grid through the portal will give users a useful tool
through which to display the reliability of the portal versus the grid. If trials fail while
testing the portal, another test utilizing command line operations can be used to identify
21
the source of the problem. If the test results show that the portal was the cause of the
problem, appropriate administration is notified in order to examine the problem more
closely.
2.6.2 Complexity of Grid Testing Executing a grid reliability assessment is a complicated task. Grids consist of a very
complex network of computers which can provide service to a multitude of different
usage scenarios. Each grid can be made up of more than one virtual organization, each of
which may need to be tested independently of each other.
There are many unanswered questions regarding the testing process. Some of the many
examples include:
• When should the gird be tested?
• How often to test the grid?
• What types of tests are appropriate?
• Who should run the test?
The answers to these questions may differ, depending on how the grid is set up. Even a
single grid can offer many different answers to the questions above because virtual
organizations are themselves unique. A single test could possibly be sufficient for one,
but not for another.
2.6.3 How to Test Although there is not one single way to test any single grid, there are some basic views
on how it can be properly tested. One idea is to run a small workflow through the grid
before running the actual one. The workflow must be small enough not to waste users’
22

time or delay them too long. Another thought is to use the results from previously run
workflows as the basis for the status of a grid or virtual organization. The idea is to read
this information from a log file and then to filter out unnecessary data. Using a
combination of these methods might give a proper representation of the status of the grid.
Running a simulation before each workflow might be overwhelming to the system or
inconvenient for the user. One theory suggests that the tests should be triggered by a
routine at given intervals that records the results of the tests.
Once a testing methodology is decided upon, designing the appropriate tests is essential.
There are many different factors involved in creating tests for grids; test workflows
consist of dynamic features based on input, output, resource, etc. These tests range from
testing entire grids to the individual computing elements in the grid. In order to retrieve a
reliable simulation, the test must be properly chosen based on the properties of the
intended workflow that is about to be run.
2.6.4 Benefits of Results The test results will prove to be useful for the portal and most likely grid computing in
general. The user of the grid will save time if made aware of the current status of the grid
before running any workflows. The portal will relay this status and show which resources
are running and which are not. A user may then choose to run tasks on proper resources.
Furthermore, if a user chooses a broker, the broker will identify which resources are
available based on the results.
The administrators and users alike will benefit from the knowledge of the test results.
Distinguishing which resources are or are not available will enable all users to identify
23

solutions for potential problems. Administrators who monitor several different portals
and grids will be able to see everything on one screen, rather than looking at the
individual statistics from each portal. This enables the support of grids and portals to be
much easier and more efficient. In the future, administrators will be able to use this
information to improve the grids and virtual organizations in order to make them more
reliable.
2.6.5 Our Grid Testing Solution
Our proposed grid testing solution is comprised of three main parts which will combine
to thoroughly test grid availability and provide accurate feedback to the user using visual
representations. The three components are, roughly, as follows:
1. Create and upload a test workflow repository
2. Create a log of live data gathered from test workflows
3. Use information from the log to exhibit the results
These elements will all work together utilizing various technologies in order to produce
output that will be useful for administration personnel and users alike.
2.6.5.1 Workflow Repository
The first step is to establish a repository of simple workflows which tests a range of
scenarios. As previously discussed, there are many variables involved in defining a
workflow, including virtual organization, resource, storage and computing elements. The
repository is created with these various factors in mind; they are used to define a Table of
Parameters in which variables are defined and the many possible scenarios are listed. A
24

workflow whose files contain the delimited variables is established as a template in
which for each test, a scenario, or specific entries from a single row of data is inserted.
The result is a repository, or directory, of simple, specific workflows which can be
uploaded and run through the portal.
2.6.5.2 Data Logging
Once the test workflows have been submitted, an xml log will be created inside the
portal. This log is based on live data which reflects the status of the various workflows
which were submitted. The portal allows for users to conveniently access a live view of
the running log within the interface.
2.6.5.3 Result Visualization
The previously created log file is parsed to create visualizations of the test results. Using
a predefined naming convention, the parser determines the purpose of each test and
creates various visualizations for each type of test. In the case of a test workflow which
uses a broker, the parser also determines the status of a grid and displays this status on a
map depicting the grid location.
25

3 Methodology
3.1 Technologies Involved in Implementation A wide range of technologies were employed in order to implement the Grid testing
solution. Several of these were required because of the nature of the previously existing
P-GRADE and Portal technology, however others were chosen for their efficiency or
flexibility.
3.1.1 Portals & Portlets Portals and Portlets allow for relatively quick deployment of a web portal. Additionally,
the portlets allow developers to easily customize the portal. Furthermore, users can also
easily customize their environment using tools developed based on the Portlet API.
Together they prove to be a powerful tool for providing information on the web. Using
the Portal as a container of portlets, the site is given consistency and flexibility.
3.1.2 Gridsphere: Gridsphere is an advanced portal that allows for easy development of web portals without
having to spend time on some standard requirements. This includes user and group
management. Users can easily be added and removed as well as become parts of groups
with other users. Developers can set up as little or as much as they want in the portal.
None of the parts are mandatory; instead they are just tools for the developer, to help
speed things along. This shell allows developers to concentrate more on the features
within the portal, rather than mundane tasks.
26

Figure 3.1 - An example of a generic Grisphere Portal
This portal is a “portlet container and a collection of core services and portlets” [27]. The
Gridsphere framework is broken into a few parts, Layer Engine, Portlet Model, and Porlet
Services. Together these make up the Gridsphere portal. The Layout Engine is
responsible for the layout of the page - the way the user sees the information on the page.
The Portlet Model defines the portlets within the portal. Finally the Portlet Service serves
as “an architecture for the development of portlet services that provide functionality to
portlets [27].”
he developers of Gridsphere had several options of Portlet APIs for the portal. Although
ahead of the JSR release, developers still had the option of Jetspeed or IBM Portlet
API’s. Jetspeed was too dependant on third party software and IBM’s API proved to be
more robust and simple, thus IBM’s WebSphere became the backbone of the Gridsphere
Portlet technology. After the release of JSR, immediate development of support for the
technology began. Today both IBM and JSR technologies are supported.
T
27
3.1.3 JSP JavaServer Pages (JSP) [28] provides dynamic content to web pages. Java.com states,
“JavaServer Pages technology allows web developers and designers to easily develop and
maintain dynamic web pages that leverage existing business systems” [28]. They define
JSP as, “simply an HTML web page that contains additional bits of code that execute
application logic to generate dynamic content” [28]. These “bits of code” include
JavaBeans and JDBC objects [28]. JavaBeans include existing java classes and JDBC
allows database access to retrieve information for the page.
One big advantage of JSP is that rather than compiling the class then deploying it to the
web server, JSP pages are compiled at runtime. Therefore, JSP pages can be easily edited
and displayed without having to recompile a class every time a change is made. Another
capability using JSP is displaying Java and other presentation code (i.e. HTML,
JavaScript) to be present on the same page, allowing for powerful web design.
JSP code is encapsulated in specialized tags, while the presentation code remains separate
and in its pure form; the page is then complied into a Java servlet which allows the
creation of dynamic web-content. There are different tags that provide different results.
Each tag has different advantages and is used in different parts of a JSP page. The
diagram below displays the different tags and their meaning.
28

Tag Meaning
<%-- … --%> Comment < %! … %> Declaration of variables or Methods
<%@ .... %> Include files, define attributes and tag libraries
<%= .... %> Convert value of expression to string and write to output
<% ..... %> Code
Table 3.1 - Possible JSP tags that can exist along with presentation code
3.1.4 Perl Perl, the Practical Extraction and Reporting Language [17], is a language that was
designed to process text files, perform computations on the data and print it out again.
Perl is a very lightweight and portable language; the same Perl program can run on nearly
any platform. The language further excels because it combines many of the features seen
in C, sed, awk and sh. This gives Perl many useful file manipulating abilities that would
typically be much more difficult to access in other programming languages [26].
Perl uses a syntax that is closely related to C and this similarity lowers the learning curve
of Perl for anyone who has used C. One of the important differences of Perl and C is that
Perl is an interpreted language unlike C which is a compiled language. Being an
interpreted language allows Perl programs to be developed much quicker than would be
possible in a compiled language. When changes are made to a Perl program, no
rebuilding needs to be done in order to run it again. The downside of Perl being an
interpreted language is that it runs slower than an equivalent program written in a
compiled language. The Perl code must be converted to a format that is compatible with
29

the machine, making it able to execute; this is already done for compiled languages. This
does not mean that Perl is slow, but strictly in terms of performance, it is relatively
slower than C. Perl does have an advantage in situations where development time is
limited and the performance of the program is not critical [25].
3.1.5 XML The Extensible Markup Language, XML[10], is a special markup language that is used to
create other markup languages. XML was developed by the XML Working Group in
1996 and is a restricted form of SGML, the Standard Generalized Markup Language[10].
A markup language is used to combine data with information describing the data [11].
XML provides a way of sharing data with vastly different systems through this common
medium. This ability allowed XML to become very popular as a simple method of
communicating data across the Internet because data is stored in a consistent and
structured format. Many other methods of data interchange are in proprietary formats
and not as easily exchanged or editable. XML was designed to be authored and
maintained easily. The data is stored in such a way that not only is it easily accessible by
computer systems; humans can also read it and edit it with simple text editors [10].
Many different languages have been developed with the use of XML to create a structure
for the data. RSS, XHTML and SVG are three of the most common XML-based
languages used in the Internet. The formats of these languages were written using XML
and this allows applications to interact with these languages without prior knowledge
[10].
30
When using XML, data is stored in what are known as XML documents. These
documents consist of storage elements called entities which may hold parsed or unparsed
data. The document begins with a root entity that recursively contains other entities.
This approach gives the document the structure of a tree. In order for an application to
use this information, it uses a software module known as an XML processor. The
process interacts with the documents directly and is able to give the application an easy to
use interface to the data. XML processors are available for many different programming
languages and they can vary in the type of interface that is provided. With the use of an
XML processor, different applications on different systems are able to communicate
easily [12].
3.1.6 DOM The Document Object Model, DOM [13], provides a method for representing and
interacting with the contents of XML and HTML documents. The World Wide Web
Consortium, W3C, developed a specification for DOM that would not be vendor specific
because DOM began as independent implementations in various web browsers. Through
the work of W3C, DOM is completely independent of a platform or a language. It
describes an application programming interface, API, for which a program will use in
order to access a document [13].
DOM represents documents in the form of a tree with the entire document as the root.
This serves two purposes, the model is easy to understand because the format follows the
structure of XML and HTML documents and processing is made easy because the
branches of the tree are easily accessible. DOM allows an application to navigate
31

between branches at any time. Many XML processors and parsers exist that implement
DOM in an array of programming languages [14].
There are many other XML processing technologies that have different characteristics
than DOM. The Simple API for XML, SAX [15], is one of these other processors and it
had some advantages and disadvantages of DOM. To represent a document using DOM,
it must be completely loaded into memory [14]. SAX takes a different approach and
allows for sequential access of data that is being streamed. As a result, SAX requires far
less memory and uses less time to process XML. However, SAX becomes much harder
to work with in situations where the application needs random access to the XML
document [15].
3.1.7 MySQL MySQL [17] is a flexible and scalable database server which is available under the GNU
General Public License [17]. It is able to run on many different platforms including
UNIX, Linux and Windows. It is a high-performance server that can be adapted to meet
the needs of a specific application. MySQL uses many performance-enhancing
techniques to be able to handle high-volume traffic. The database engine can handle this
traffic while still being reliable [18]. MySQL is used in many traffic websites on the
Internet such as Slashdot, Wikipedia, CNET Networks and Friendster where it handles
more than 1.5 billion queries a day [19]. MySQL works well for general purpose
database application because it can store nearly any type of data. The application that
interfaces with the database is responsible for interpreting the data in a meaningful way.
32

RRDtool [20] was considered as an alternative database for MySQL in our application.
RRDtool stores data in what is known as a Round Robin Database, RRD. This design
stores data in cycles. This means that when all the empty storage units for data are filled,
the database it will begin to overwrite the oldest data. This type of database works
especially well with time-series data. Typically with time-series data, you want to look at
changes over time and this is where RRDtool excels. RRDtool combines features that are
able to perform calculations on time-series data in real-time [20]. RRDtool is then able to
create PNG, Portable Network Graphics [21], images that display graphs of the data.
RRDtool and MySQL both provide databases that can store data but each can be more
appropriate in different scenarios. RRDtool performs well when handling time-series
data and provides very useful functions when retrieving data. A database made with
RRDtool contains only data relating to the change in one parameter over time. However,
it has some limitations with data that does not fit this format. Queries to the database are
based on time periods, and return information pertaining to data online from that time
period. Using RRDtool, there is no way to store information in a single database about
multiple parameters. This contrasts heavily with the type of data and queries used with
MySQL. With MySQL, queries can be made on any part of the stored data; thus many
different parameters can be stored within a single database.
3.1.8 DBI DBI [16] is a Database Interface module written for Perl to provide a layer of abstraction
when working with databases. Perl scripts can interact with DBI instead of having to
interface with the database itself. The script does not need to be aware of the specific
33

details that are required for a particular database. DBI handles these details and provides
the script with a common method of communication with different types of databases.
DBI is able to load a DBD, Database Driver, module which has a specific vendor library
and communicates directly with the database. Using DBI, a Perl script can interface with
such databases as Oracle, MySQL, Access and any other that has a DBD module. This
provides a Perl developer with much freedom because there are not many restrictions on
what type of database must be used. A script that is written to communicate with an
Oracle database can communicate with a MySQL database with only minor changes [16].
3.1.9 Google Maps API Google Maps [22] is a service provided by Google that displays maps of the world over
the Internet. These maps are easy to use and allow users to input terms and search for
places around the world. The interface allows the user to navigate around the world,
zoom in and out and switch between several image modes which includes satellite
imaging. The Google Maps system is based on asynchronous network requests by
Javascript embedded in the webpage that transfers data using XML. This technique is
known as Ajax and it allows for a new level of interactivity through a webpage. The
maps are able to dynamically change without the web browser needed to reload the entire
webpage. Data is downloaded in the background through XML files which the Javascript
can display on the page seamlessly [22].
The Google Maps API provides a way for web developers to customize Google Maps for
specific applications. To access the API, Javascript must be embedded within a webpage
[23]. The API provides a way to control the different aspects of how the map is
34

displayed. A transparent image overlay above the map can display pointers, in the form
of icons, to locations on the map. These icons can be completely customized with the use
of the API. The API also supports event-handling which allows the map to dynamically
change as the user clicks on the map. This provides a web developer with a standard and
convenient method for precise control over the user interface [24].
One of the important features of the Ajax approach used by the Google Maps API is that
with a completely static HTML file, dynamic content can be generated. Javascript within
the HTML file is able to download an XML document which contains data that dictates
what is displayed on the map. This is allows the HTML to be simplified because it does
not need to contain data within itself which is especially important with dynamically
changing data. The API thus abstracts the data communication from the display
technology, keeping the code easier to maintain [24].
3.1.10 Java Developing added functionality in the P-GRADE portal means developing in the
language of the portal - Java. Java [34] is a high level object oriented language,
developed roughly 15 years ago at Sun Microsystems. This language is compiled via the
Java virtual machine through executed bytecode instructions. Much of the syntax used for
programming in this language is inherited from similar languages like C and C++.
The language was developed with 5 primary goals in mind:
1. It should use the object-oriented programming methodology.
2. It should allow the same program to be executed on multiple operating systems.
3. It should contain built-in support for using computer networks.
35

4. It should be designed to execute code from remote sources securely.
5. It should be easy to use and borrow the good parts of older object-oriented
languages like C++. [34]
The object oriented nature of Java helps to make software more reusable between
projects and provides a more stable foundation for a software system's design, making
larger, more realistic projects easier to manage. Java’s platform independence allows for
Java programs to run similarly on a wide spectrum of hardware – virtually anywhere.
Another important feature of Java is its garbage collector; this automatic clean-up of
unused objects prevents memory leaks and memory de-allocation crashes [34].
Java can be used to create standalone applications, applets, servlets and swing
applications. To date, the Java platform has been taken advantage of by over 4 million
software developers while it powers more than 2.5 billion devices including:
• over 700 million PCs
• over 1 billion mobile phones and other handheld devices
• 1.25 billion smart cards
• plus set-top boxes, printers, web cams, games, car navigation systems,
lottery terminals, medical devices, parking payment stations, etc. [35]
3.1.10.1 Eclipse
In order to develop and compile the Java code for this project, a powerful and popular
development platform named Eclipse [36] was used. Eclipse has been designed to be
extremely flexible and is essentially a collection of plug-ins which can be manipulated or
36

extended. Eclipse allows its user to create generic projects, edit files in a generic text
editor, and share the projects and files with a Concurrent Versions System (CVS) server.
Figure 3.2 - Diagram of the Eclipse Platform
37

Figure 3.3 - The Eclipse Workbench
3.2 Workflow Repository The collection of test workflows which will be submitted to the portal is created through
a substitution process. This substitution occurs between several files and results in a
destination directory if specific workflows. To do this, a decompressed workflow is
altered to represent a template directory, in which the workflow-specific data in each file
has been substituted with formal parameter keys encased in delimiters, for example
<<wf>> or <<se>>. Figure 3._ is an example of a template file for the workflow
template.
38

Figure 3.4 - A template file, MultipRemLoc.jdl
The Table of Parameters (TAP) is a tab delimited text file which has been defined by
listing the key data of all possible workflow scenarios. The head row of this table
represents the keys used in the template files while each consecutive row represents the
data necessary to define a single test workflow. For each possible workflow, the template
directory is processed and the appropriate variables replaced. The next figure is an
example of the previous .jdl template file.
39

Figure 3.5 - A fully substituted file
After all rows of the TAP have been processed, the new workflows are then compressed
and uploaded into the portal.
3.3 Test Logging There are many requirements for the logging capability of the portal. The first is access to
live results from the portal itself through a Java class which provides the needed
information. The second is the actual logging of the information. This would include a
class which could process the data and filter out the needed information. Once it is
filtered, the data needs to be organized so it can be read later. Not only does the data need
to be kept for statistic purposes, but it also should be shown on the portal.
40

In order to communicate with the grid, we relied on some existing technologies within
the portal. The portal provides us with a class, ‘quota’, which feeds live results from the
grid itself. We decided to use this existing technology to save time and concentrate our
efforts on the logging system itself.
The implementation of the logger involved a few design decisions. There are many
options to take the data and organize it in a way that can be easily parsed out for later use.
We decided to use XML to keep the data organized. Most programming languages have a
parser to handle it and it is a standard way to keep information organized. The logger will
be called by the existing ‘quota’ class. Once called it will take the data and create an
XML version. Once it is formatted correctly, the information is stored in a log file for
later reference.
The final piece to implement is the living logging view within the portal. This is useful
for people using the portal to see what is actually going on. There will be other statistics
within the portal, but these will not be a live representation. A log at the live log will
prove to be useful for those using it. To make sure that there is only one instance of this
‘XMLData’ class in use at any time, a special Singleton class will be used. Instead of
calling a constructor, the developer gets in the current instance of the class. This insures
that everything is added and viewed from the same instance. Without this class it would
be very difficult to guarantee that there is no data loss or that it is all added to the same
instance of the class.
41

We also decided to take further advantage of this class and add a few counters to provide
live statistics of the portal. Since all the information needed is provided to this class, by
implementing a few counters we can show very useful information. The two counters we
decided on were number of successes and number of failures. These numbers will show
the users of the portal extremely useful statistics in regards to how dependable the grids
are over some period of time.
The log panel itself will be kept in a simple table and the panes will be an extension of
the existing portal. We decided to put it in under a new “Statistics” Tab in order to keep it
separate from the static results. The title “Latest Runs” suggests that it is a live feed. Here
the user is able to see all the information which is stored in the log. After some
deliberation, we decided to limit the amount of views the user can see. However, if we
are going to limit the data, we need to make it easy to change the limit that is displayed
on the page. In order to do this, our class will have a function to call to change the limit
easily. In the case that no limit is set, the system will default to a limit of 10. The two
important numbers should be kept at the top for easy viewing. A quick glance at this pane
will show the users an accurate count of how many successes and failures there have
been over time.
3.4 Test Workflow Visualization The goal of the test workflow visualization is to interpret the results of the test workflows
which are submitted to the various grids and visualize the results through the web. The
logs of test workflows should be parsed and the status of the various functionalities of the
various grids displayed. Each portal should display the results of the test workflows
42

submitted to it, categorized by the type of test which was performed. Also, each portal
should update the status of its broker to a centralized server. This server then will be able
to visualize the status of all the grids in an easily understandable format.
3.4.1 Portal Visualization
The first section of the visualization process is taken by the individual portals. Each
portal is responsible for processing the results of tests it performed on its associated grid.
The three steps involved in this section of the visualization process are parsing the log,
storing the appropriate results in the central database and building a web page with the
results of the latest tests.
3.4.1.1 Workflow Log Parsing The test workflow log which is generated by the portal must be parsed before any
visualization is performed. Parsing the log file refers to two separate tasks. First, the log
is formatted as an XML file to hold the data and there must be some way of getting to
this data. An XML parser must be used to read the file and extract all of the relevant data
which is in the log. It is important to be able to retrieve only the latest information about
the tests from the log.
The visualizations are based on the current state of the grid which we can only determine
from the latest results. The latest results take precedence over any prior results.
Selecting the latest results from the log is done by extracting only those results which
were performed on the most recent day. The XML used in the log groups the results by
43

which day they were performed, and this provides quick access to only this information.
It is possible that this set of results can contain multiple results for a specific workflow if
it was executed more than once during the day. In order to solve this problem, we loop
through the set of results beginning with the oldest, storing the results in another data
structure, and any newer results of the same workflow will simply overwrite older data.
At this point, all of the current test workflow results will be loaded into memory.
The next step interprets the test workflows to understand the meaning of the results.
Without some way of determining the purpose of the test, the result is useless. There
must be some method of extracting from the log what parts of the grid were tested. The
most obvious way to do this was to write the purpose of the test into the name of each test
workflow. This naming convention could then be parsed and understood by the system.
The tests could then be categorized by the type of test which was performed which is
useful for the visualization and for understanding the state of the grid as a whole.
3.4.1.2 Naming Convention A special naming convention needed to be agreed upon that could accurately depict the
purpose of each test within the name of the workflow. In order to determine what a
workflow tested, this information was encoded into the name of that workflow. There
were five different classes of information that was stored into the name of the workflow.
The format for workflow names follows the structure of a binary tree and each workflow
name is built up by concatenating the nodes of the tree until a leaf-node is reached.
44

Figure 3.6 – Test Workflow Naming Convention
3.4.1.2.1 Unique or Complex The top level represents if the workflow is unique or complex. A unique workflow only
uses a single job to perform a test. These tests are able to determine the functionality of
very specific parts of the grids. A complex workflow contains multiple jobs that are used
to test parts of the grid that cannot be fully tested with a single job. For example: in order
to fully test the ability of a storage element to receive data from one computing element
and pass it along to another computing element a workflow with at least two jobs is
45

required. If only one job is used, and the workflow fails, it is not possible to know if the
error was a result of the computing element used or the storage element.
3.4.1.2.2 Broker or Direct
Of unique tests, there are two types of workflows that can be created. These test
workflows involve either the use of a broker or direct submission to a specific resource
within a grid. When a broker is used for a test, the workflow is submitted to the broker
and the broker becomes responsible for determining which resources are needed to
process the jobs involved. In practice, most portal users take advantage of the broker and
do not concern themselves with which specific resources are being used. The other type
of workflow at this level is known as direct. A direct workflow bypasses the broker and
sends the job to a specific resource. This is useful when there is a very specific resource
that should be tested, and all other potential confounding factors are eliminated.
3.4.1.2.3 Computing Element or Free Choice The two possible choices for test workflows that use a broker are workflows that have a
defined computing element and those which do not. A defined computing element tells
the broker which computing element it should send the job to. The broker is used, but its
only function is to pass the job along. The other option is to give the broker a free choice
for the computing element to use. In this case, the broker will look at the various
computing elements available and make a determination of which to send the job to.
3.4.1.2.4 Storage Element or No Defined Storage Element
46

This level is similar to the computing element level that precedes it. The test workflow
may define a specific storage element to be used by the broker. This reduces the
importance of the broker in this type of test as it does not need to make a decision. When
there is no defined storage element, the broker must select which one to use.
3.4.1.2.5 Sequential or MPI
All unique test workflows may use either sequential or MPI jobs because the computing
elements on the grids support both types of jobs. Sequential jobs are typical single
process programs but MPI jobs use multiple processes that communicate with each other.
This is the last choice when creating a workflow.
3.4.1.3 Local Visualization
With the test workflow results fully parsed, it is possible to display this information. We
decided that the most convenient way to accomplish this was to create tables which
would visualize the logs. Since there are several types of tests that could be performed, it
seemed natural that there should be several tables with each one corresponding to a type
of test. This would make reading the results easier for the users. When the results are
strictly in a list as they are in the log, it is very difficult for the user to read. By
separating the results into categories, the user can more easily find information about the
grid. Each table will contain common information about the workflow, such as time
completed and status when finished, but also information specific to a type of test such as
the computing element which was used.
47

There are five categories of workflows which could be used to test the grids. Each of
these categories of tests would have a table that would be displayed on each portal. The
first category is the broker test, which uses a broker but does not specify a computing or
storage element. The result of this type of test is used to determine the state of the entire
grid. If the broker is unable to distribute a workflow properly to resources in a grid, the
grid is unusable for most users. The next type of tests is known as a simple test because
it only tests the functionality of a specific computing element or storage element. In this
table it is important to differentiate between tests of storage elements and computing
elements because the same resource can have the functionality of both.
After simple tests, the next types of tests are complex tests which use the broker. These
tests involve a specified computing element and a storage element. The test uses a broker
but is still referred to as a complex test because the computing and storage element must
both work, and work together in order for the test to be successful. The fourth test is
known as a direct test because it bypasses the broker completely and sends the job within
the workflow directly to a resource.
The last type of test is the complex test which involves testing aspects of the grid which
cannot be done with a workflow that consists of only a single job. There is no easy way
of knowing the purpose of the test at this point because there are many possible complex
tests that could be performed. Instead of trying to create a table that would handle all of
these, we felt it would make more sense to just display the result of the workflow. This
allows for flexibility in the system to handle any complex test more easily since it does
48

not need to parse out all the information from the complex test. The user is capable of
doing this and keeps the system simple and reliable.
Figure 3.7 – Types of Test Workflows
3.4.1.4 Centralized Database
Once the test workflows have been visualized, the next step is to store the results of the
broker tests in a central location. The goal is to collect the results of the broker tests from
the different portals in a single location which all of the portal will communicate with.
This database can then be used to create visualizations of states of all the grids which the
portals interface with. This creates a separation between the two types of visualizations
which are being created.
49

Since the central database must be accessed by the various portals, communication
between the portal and the central database is very important. There are two concerns,
the accessibility of the central database and the amount of data that must be transferred to
and stored in it. The database must be secure to ensure the integrity of the results but
allow geographically dispersed portals to connect to it. Also, we want to minimize the
amount of information which needs to be stored in the central database. We do not want
to flood the database with all of the information from all the tests which are performed.
There may potentially be many grids in the future which are being tested and this would
greatly expand the amount data stored in central database. There are two things which
help limit this data. First, the data which is specific to the resources in a grid are kept
locally within a portal and not transferred to the central database; only the broker tests are
stored in the central database. Second, when the result of a test workflow is stored in the
central database, any previous result of that test is overwritten. This ensures that only the
latest information is kept in the database.
3.4.2 Central Visualizations
There are two visualizations of the grid states which will be created using the data stored
in the centralized database. At this point, all of the data which has been stored in the
database is useful because they are all broker tests of different grids. This means the data
does not need to be filtered to determine the type of test as it was by each portal. Each
test workflow evaluation indicates the current state of the grid which it was performed
on.
50

Each grid can possibly be one of three different states depending on the result of the most
recently tested workflow performed on it. The potential states for a grid are good, bad or
unknown and while their meanings may be obvious, the method for determining them is
not as simple. The current state of a grid is time-sensitive because the grid is dynamic
and the individual resources are constantly changing. This means that as the result of a
test ages, it becomes outdated after a period of time and the data may have become
invalid. The expiration time is a variable which may be configured for each portal. A
grid is considered to be in a good state if the most recent test workflow completed
successfully and the expiration time for this test has not passed. Once the result of a
successful test workflow expires, the grid status is considered to be unknown. Finally, if
the most recent test workflow failed, regardless of the length of time which has passed
since the test was performed, the grid is considered to be in a bad state.
3.4.2.1 Grid Map Visualization
The current states of all the grids are displayed on single map. This map should be
updated regularly using the current information stored in the database. Each grid should
have a point on the map which follows a color code that corresponds to the state of the
grid. The map introduces a fourth state for a grid which is only used here because the
map has access to its own list of grids which may not be consistent with the grids
represented in the database. This list of grids contains the geographical locations of the
grids with respect to the map. The fourth state represents grids which may be known by
the map but do not any results stored in the database. The mapping of the state to the
corresponding color is listed below.
51

Status Color
Good Green
Bad Red
Unknown Yellow
No Results Black
Table 3.2 – The Visualization Color Scheme
3.4.2.2 Collective Grid Status
The central server displays a table of test workflow results which is similar to the tables
that are generated by each portal. The data which is displayed in this table comes directly
from the central database. Since all these tests are similar because they are broker tests
there is no filtering that needs to be done. This table depicts the status of the grids by
displaying the results of all the current broker tests.
3.4.2.3 Regular Log Processing
There are two possible methods for creating the visualizations, either to perform the
computations at regularly scheduled intervals or to build the visualizations in real-time.
Both of these options have their own advantages and disadvantages. Creating the
visualizations in real-time is beneficial because they are always accurate with respect to
the data in current test results; all the visualizations are recreated when new data is
52

received. If the processing is not performed in real-time there will be delay before the
most recent results are displayed through the visualizations.
Depending on the size of the interval, there will be periods of time when the
visualizations are not accurate and display an incorrect state for a grid. There is a
disadvantage to real-time processing; it requires significantly more computational
resources. Any time the result of a test workflow is received, all of the visualizations
would need to be rebuilt. There is a one-to-one correspondence between the number of
test workflows which are run and the number times the entire visualization process must
be performed. In the case where the processing is only done at scheduled intervals, all
new results are processed together at a single time.
The machines which are providing for the portal are already very busy machines, and we
felt that the benefits of real-time visualizations were not enough to justify the extra
processing. The portals must interact with many users simultaneously and handle all
interfaces with the grids on behalf of the users. This is their primary role and we did not
want to put a burden on the machines through our testing. We felt that the delay in which
the visualizations were created was acceptable for Sztaki’s purposes.
53

4 Implementation
4.1 Workflow Repository
4.1.1 Defining the Template Directory To establish the template directory from which the test workflows and subsequent
repository will be derived, a simple workflow (containing no more than three jobs and no
more than two ports) is defined using the Workflow Editor of the portal. This workflow
will then be downloaded from the portal and decompressed into a Source Directory on a
desktop machine. The decompressed directory contains many different kinds of files,
particularly .grid, .jdl, .wrk and .descr. files which contain pieces of information that
change depending on the different workflows, or critical parameters. In the template
files, these critical parameters will be represented by a set of simple special keys and
encased by delimiters: <<Formal_Parameter>>. This substitution is done manually and
the files are saved as the Template Directory.
54

Formal Parameter Name Explanation wf Source Workflow name
wf_dest Name of workflow to be generated.
Name must be defined in accordance with the automatic visualization system
vo<jobseq> Virtual organization of the selected job
<jobseq> is integer in the range 1..3
se Storage Element destination host
r<jobseq> direct resource with jobmanager of the selected
job
<jobseq> is integer in the range 1..3
f<jobseq><portseq> Logical name of the eventual remote file
belonging to the selected port of the selected job
<jobseq> is integer in the range 1..3
<portseq> is integer in the range 1..2
e<jobseq> List of environment variables of the selected job
It is just a string following the syntax in the JDL
Table 4.1 - Formal Parameter Definitions
4.1.2 The Table of Actual Parameters The TAP is a simple tab delimited text file, based on the multitude of workflow
scenarios. The top row represents the Formal Parameters which have been positioned in
files in the Template Directory while each consecutive row of the table corresponds to a
single workflow and the columns are filled in according to the goal of the test workflow.
This table is filled in manually for a full functionality test.
wf wf_dest se vo1 r1 f11 f12 e1 vo2 r2 f21 f22 e2 vo3 r3 f31 f32 e3
Figure 4.1 - TAP Header
4.1.3 Macro Substitution
55

Once the Template Directory and TAP have been defined, a Destination Directory is then
created using a set of substitution rules. A loop is used to step through the TAP one row
at a time, creating a complete workflow for each row of the file. Template files
“<wf>_files” are replaced with “<wf_dest>_files” where <wf_dest> coincides with the
previously mentioned naming conventions. For example: <wf>_remote.wrk will become
<wf_dest>_remote.wrk. The rules for the specific substitutions in these particular
template files are as follows:
1. Virtual organization substitution: search in .descr and .grid files to substitute
the value of <<vo<jobseq>>>. If vo<jobseq> contains “_LCG2_BROKER” in a
new file <jobid>.grid, the prefix of vo<jobseq> (value of vo<jobseq> -
“_LCG2_BROKER”) must be substituted in the file <jobid>/<jobid>.jdl as the
value of the template <<vo<jobseq>>>.
2. Resource substitution:
• Search in .descr files to substitute the template value of <<r<jobseq>>>.
In this file <<r<jobseq>>> must be substituted by the host part of the
normal resource and by the string “jobmanager” if vo<jobseq> was of
LCG2 type.
• Search the file <wf>_remote.wrk to substitute all occurrences of
<<r<jobseq>>>. In this file, <<r<jobseq>>> must be substituted by the
full actual value of the normal resource and by the string
“jobmanager:/default” if vo<jobseq> was of LCG2 type. The name of the
newly created file will be <wf>_P<id>_remote.wrk.
56

If vo<jobseq> contains “_LCG2_BROKER” in the new <jobid>.grid file,
the file <jobid>/<jobid>.jdl must be searched and <<r<jobseq>>>
substituted. In this file, <<r<jobseq>>> must be substituted by the host
part of the normal resource and by the string “jobmanager” if vo<jobseq>
was of LCG2 type.
3. Remote path substitution: Search the file <wf>_remote.wrk to substitute all
occurrences of <<f<jobseq><portseq>>>. The new file name will be
<wf>_P<id>_remote.wrk. If vo<jobseq> contains “_LCG2_BROKER” in the
new file <jobid>.grid, the file <jobid>/<jobid>.jdl must be searched and
<<f<jobseq><portseq>>> substituted.
4. Environment path substitution: If vo<jobseq> contains “_LCG2_BROKER” in
a new file <jobid>.grid, <<e<jobseq>>> must be substituted in the file
<jobid>/<jobid>.jdl.
5. Storage element value substitution: <<se>> Must be substituted whenever it
references <jobid>/<jobid>.jdl files.
The code for this substitution is contained in two Java files, one of which handles the file
input and output and one which performs the substitutions. The program employs
regular expressions, file handling and parsing algorithms. After substitution has been
completed, the workflows of the Destination Directory are compressed in tar.gz format
and are uploaded and submitted in the portal.
57

4.2 The Logger The development of the logger started with a simple program that logged information to a
file, which allowed for easier testing and debugging. Writing to this simple file went
according to plan with only minor issues. The biggest issue was: if the file existed or not
and if so, should we append data rather than create a new file or overwrite the file. This
was solved through some simple logic to find the file or create it if necessary.
The next step was to convert the output to XML format. Unfortunately the support for
XML in Java isn’t as abundant as it is in other languages and the research for this part of
the project was longer than expected. Implementation of the DOM parser was very useful
here. It allows the program to add data to elements and then attach the elements to a root
element. Once the DOM object was built a simple output steam is used to save the data to
a file.
The most difficult aspect was maintaining the original data while appending a new entry
onto the log. In order to do this DOM requires reading the current file into a document
object then appending an element to the object and re-outputting the document object to a
file. Although not the most memory efficient way to handling a log file, it keeps the data
very organized and we saved time by using the easy DOM interface.
During the development of the logger, the design of the log file was changed to make it
more convenient to read. Rather than several XML tags wrapped in to one logger tag, the
file was sorted by date so it would be easier to read and parse out the necessary data. In
order to implement this, the logger now has to look for current date tags to see if it exists.
58

If the tag does not exist it creates the tag and files the log under that date. Similarly if the
date does exist the log is filed under the proper tag.
Figure 4.2 – Sample Log File
After all the local testing was done and files were properly created and formatted the
logger was put in to the portal for live testing. A problem was immediately discovered
with the logger. We have been testing and debugging with Java 1.5_02 while the portal
runs on Java 1.4.2. It turns out that the classes for the DOM parser have slightly different
API’s for these versions of Java. The logger was brought back to the local testing and
debugging stage, excect now Java 1.4.2 was used. After a few minor changes it was ready
to go. It was then seamlessly implemented in the portal.
The last problem with the logger was the results that were logged. It was noted that some
strange data was being entered in to the log file. The logger was tested and it turned out
59

the problem was with the portal itself. The function that interfaced with the portal was not
providing the correct data to the logger. The portal team was contacted and shortly there
after a fix was issued.
4.2.1 Log Inside the Portal This part was much more complicated than logging to the log file itself. There were no
interfaces or panels created for the portal, so all of this had to be created from scratch.
The actual logging itself was also more complicated because a Singleton class had to be
used to insure that there is only one instance of the live logging class running at any
given time. Any more than one instance running the live logging system would cause it to
be inaccurate, because different entries could exist in different instances.
4.2.1.1 Live Logging The first step of the live logging class, XMLDataEntity, was to create an entity object
that holds the necessary data. This includes all the data that is provided by the log itself.
The entity has a constructor that takes user, workflow, job, status, and time as parameters.
This data is then accessible through a series of get methods in the entity class.
Next a Singleton class had to be implemented to hold a list of the XMLDataEntity
objects. The list is kept as a vector in the XMLData class. XMLData holds all the last log
entries up to a certain limit. The class provides a setLimit() function to set the limit or a
default of 10 entries is used. The class ensures a single instance because the constructor
to the class is private and a public getInstance() class is used to refer to the class. The
60

instance allows access to the list of latest logs along with some vital statistics including
the number of successful and failed workflows and the total number of workflows.
To populate the list of latest logs, every time an entry is entered in the log it is also added
to the XMLData instance. The instance is built in to the logger function that deals directly
with the xml file. Other classes can then use the getList() function to get the list from the
class. When the limit has been reached the oldest data is removed from the instance. This
limit can be easily set to any whole number greater than zero.
4.2.1.2 Creating the Panel The portal uses a few XML files to display panels in the portal. A new entry for a
‘Statistics’ panel was created. This name suggests some further extension, but for now it
shows the live logging system. The portal relies on three XML files, porletl.xml,
layout.xml, and szupergrid.xml. Porletl.xml is responsible for displaying the content on
the page, while layout.xml and szupergrid.xml are used for the layout of the panel itself.
61

Figure 4.3 – The Statistics Panel
The layout was a basic panel, similar to the currently used panels, only with some minor
variable changes. These layout.xml and szupergrid.xml are identical files and have to
remain the same in order for the system to work. This knowledge came later on from the
portal team, so many problems occurred when figuring out why the portal was not
working after edits where made to layout.xml. Not only was the panel not displaying
properly, but the portal itself crashed when these files were even slightly different.
Once the layout was established, it needs to refer to a node in the porletl.xml file. Editing
this file was also easy, using existing entries as examples. This refers to a class file in the
system that provides content to the page.
62

4.2.1.3 Providing Information to the Panel The portal uses Java and JSP to perform all the actions necessary. JSP and presentation
languages are used to provide the panel with information the user requested. Under this
layer is Java which is the heart of the portal itself. JSP is able to interface with the Java
and display it on a web page.
The Java class file referred to in portlet.xml has a defined template with specified
functions to implement. A doView() function for example provides the portlet with the
information to display on the page. Although other functions exist in the template file, the
doView() function is the only one this simple portlet needs to implement.
Within this doView() function the instance of the live logging class is referred to. The
getList() function is called to provide the class with the live log. The vector returned by
the function is then passed on to a JSP file which displays the information in a table. An
entity class was built for the log entries which makes it easy to retrieve the data. The
vector is comprised of these objects. For each item in the vector get methods are called
for the appropriate data.
4.3 Visualizing Test Results The visualizations were implemented using two separate Perl scripts, one which
processes the local workflows and another which visualizes the grid information stored in
the central database. This provides separation between the two types of visualizations
and gives them the freedom to be run on independent machines. Between the two Perl
scripts there is a MySQL database which both scripts must interface with. This MySQL
63

database acts as the channel of communication between the two scripts. It only holds
information pertaining to the broker tests which have been performed.
The first Perl script, which is known as portal-test-filter.pl, runs on the same machine as a
portal and processes the data which is in the test workflow log. This script parses the log,
visualizes the results in a table and passes on the correct information to the central
database. Reading the log involves using the DOM parser to parse the test workflow log
and extract the useful information. Using DOM, the script loads the entire XML file into
memory. Then, using some of the DOM functions, it is able to move to the last branch of
the document which contains only the entries from the most recent day. The script loops
through all of these log entries and extracts all of the information. As this is taking
place, the script performs the parsing of the workflow names which provides even more
information about the test workflow. All of this important information about each
workflow is then stored in a hash table which provides the script an quick method for
accessing the data.
At this point, the script generates HTML which displays the test workflow results in easy
to read tables. The workflows are grouped by the type of test which was performed and
each type is shown by its own table. There are five tables built and each has a slightly
different set of columns which is customized to the type of test. There was one important
factor that was taken into account when the tables were created; the tables would be
displayed through the portal. This means that in order for the tables to visually fit the
same style as the portal, care had to be taken with the formatting. In order to create a
seamless style, the same Cascading Style Sheet[39] which is used by the portal was
64

referenced by the html generated by the script. This would give the tables the same style
of appearance as the rest of the portal and any differences in implementation would be
completely invisible to the user.
Figure 4.4 - Test Workflow Results
The next step for this Perl script was to store the results of the broker tests in the
centralized database. This was done using the DBI module for Perl which is able to
handle database communication with the MySQL server which stored the data. For each
of the broker tests, the script sends all of the necessary information to the database which
includes two more parameters which are not used in the local visualizations. One of
these parameters is the hostname and port of the portal which performed the test. This is
used as a unique identifier which is necessary if multiple portals are running the same test
workflow. The other extra parameter is the amount of time in seconds which can pass
before the result of a test expires. Not all portals may want to perform tests as frequently
65

and this expiration time provides each portal a way of informing the central server what it
feels is a reasonable amount of time for a test result to be valid.
Since only the most recent results are significant to the centralized server, it is completely
unnecessary to keep any old information within the database. All old information would
be replaced by newer information and never be used again if the same test was performed
again more recently. In order to keep the table free of this extraneous information, the
script will delete the previous result of a test, if it exists, before inserting the newer data.
This is done through MySQL using what is known as a “REPLACE INTO” query. This
type of query will compare the keys of data which it wishes to insert with the keys of data
already in the table. Any rows in the table with matching keys will be deleted before the
new row is inserted. This eliminates any possibility of unnecessary data in the database
because it will be overwritten by the newer data.
The second script, which is known as central-test-filter.pl, manages the visualizations of
the broker test results stored on the central database. The Perl script accesses the
database using DBI for communication. This is just a simple MySQL query as all the
data stored in the database is important at this point; there is no insignificant data stored
in the database. The script then uses this information to generate HTML tables which
also follow the same formatting style as the previous script. The tables are then able to
be seamlessly displayed through the portal because of the consistent formatting. The
script then uses the data to update the map which displays the current status of each grid.
66

Figure 4.5 – Visualizing the Broker Tests
The grid status map was implemented using the Google Maps API which provided a
convenient way to create a map. The API handles all of the details of generating the
images needed to display the map and provides an interface for the Perl script to make
modifications to the map. The map is actually a static HTML file which loads an XML
file containing the states of the grids with the use of JavaScript. The Perl script only
needs to be able to generate a new XML file which the map will be able to parse in order
to change the map. This is especially convenient because the HTML does not need to be
modified and is completely static. It can be served anywhere and only needs access to
the current XML which contains the data it needs to display.
67

Figure 4.6 - Grid Status Map
The Perl script generates a new XML for the grid status map using the results stored in
the database and a test file which contains a list of grids. This file is a reference which
the script uses to find the corresponding portal and the geographical location of each grid.
Since the unique portal identifier is stored in the grid with the test workflow results, the
script is able to map this to the actual name of the grid which the portal interfaces with.
A point on the map is created for each of these grids using the latitude and longitude of
the grid which is stored in the reference file. Then each of these points is given a status
which will be displayed using the color coding defined earlier. All of this information is
then formatted as XML and written to a file which is readable by the map.
The two Perl scripts both have been written to read from their own respective
configuration files. These configuration files are simple text files which contain
68
parameters that are relevant to the script. This gives the administrators of the portals the
ability to control the scripts by modifying some of the values. The configurable options
include the hostname, username and password to be used with the MySQL server because
it is entirely possible that these values may change in the future. There are several more
options in each of the configuration files but they have comments in each of them
explaining what various parameters control.
Both Perl scripts needed a way to be able to process the data and generate the HTML
only at regular intervals. After the script ran, the HTML needed to be saved somewhere
until the next time the script was executed. To solve this problem, both scripts are
executed using what is known as a wrapper which is a simple program that interfaces
with the script directly. These wrappers are executed and store the HTML output of the
script in static files which are later displayed through the portal. Both of these wrappers
are implemented as simple Bash scripts that redirect the output of Perl script it interfaces
with.
69

5 Evaluation
5.1 Substitution Evaluation
Once completed and the simple thorough testing of the program’s methods has been
completed, the entire program must be evaluated. Testing the substitution method was a
simple process that employed Template Directories and TAP’s of varying complexity.
Initial templates included single files and the TAP represented but a single workflow.
However, a single file workflow is unrealistic as all workflows require multiple files
including .jdl, .owner, .dat, and .wrk.
A very simple workflow was developed using the portals Workflow Editor. A simple
script was created as an executable and the single job test workflow was created. This
workflow could be processed and uploaded into the portal for testing purposes.
Subsequently, a TAP with multiple simple workflows was used and these workflows
uploaded as well. Upon success, it is safe to create more complex workflows which
involve more complicated processing. These complex workflows represent realistic tests
which will provide the data necessary to produce the log files.
5.2 Logger Evaluation For localized testing before deploying the logger to the Portal, a tool called J-Unit was
employed. This is an external tool used to test part or all of Java code. This was
especially helpful when testing the logger. This allowed us to create log files after
70

different changes were made. Furthermore, any problems which arose were easily
debugged locally without adding to the complexity of the grid.
Once the logger was deployed to the portal, testing was more involved. At first, many
workflows were run in order to trigger the right actions and produce the log file. Later,
the portal team was able to create a simple test app for us. This was very helpful in
testing the logger inside the portal.
Using the simple test app a stress test was performed on the logging system. The test
shows that the time to log a file increases as the log grows. This is to be expected since
the DOM parser was used to produce the file. The parser reads in the whole document
before appending data to the end. It is an important piece of information for the portal
administrators. After a certain amount of time the log should be cleared. The graph below
shows the average times after 10 tests were run on the system.
71

Figure 5.1 - Stress Test Results
5.3 Visualization Evaluation
Testing the visualization portion of the system was done in three separate phases, each
testing a different aspect of the system. The functionality of both scripts was tested
individually and then afterwards the two scripts were tested together as a single unit. We
began by evaluating the scripts individually in order to find issues on a smaller scale first.
It would be easier to find problems by initially involving only a single script. As an
effect of the goal of each script, testing the functionality of the scripts would involve
manual inspection of the output. The tests had to involve the creation of sample data that
simulate the different types of data that could be found in the test workflow log. This
process was repeated during and after the development of the visualization scripts.
72

The first test to be performed was to verify that the script which handled the local
visualizations on the portal worked properly. This was done by creating a sample XML
file which contained simulated results of each type of test workflow. The data in the
sample log included examples of all the different possible test workflow names. The
ability of the script to be able to support all the different type of test workflows was very
important because each is handled differently.
The next step was to test the script which visualized the status of all the grids. This script
received its data from the MySQL database stored on the centralized server. In order to
evaluate the functionality of this script, sample data was created in the database. This
data simulated the results of broker tests performed on all the different grids. With this
data in place, the script was executed and the HTML and grid status map were generated.
These had to be inspected manually to determine if all the data and color mapping was
correct. Then after a period of time, the script was run again to determine if it could
handle the expiration of a result and change the state of a grid from good to unknown;
these tests were ultimately successful.
Once these smaller tests were completed, a test of the two scripts working in combination
was performed. The scripts were set up to run using every minute using CRON[40] on
the test server. Then sample workflows were created through the portal which followed
the naming convention. After the workflows were submitted and either failed or finished,
the scripts would process the data which was entered into the log file and create the
proper visualizations. This was verified by looking at the various tables created and the
grid status map. As a result of the broker tests, the map was able to visualize the change
73

in state of a grid and display this on the map. The grid was represented by a green point
for a period of time because of the successful workflow and after the result expired, the
grid status changed to unknown and the point became yellow. The results of this
demonstrated that the visualizations as a whole worked together and the data was able to
flow correctly.
74

6 Conclusions We developed a testing interface that is complete with test workflows, logging system,
and visualized results. This was the first attempt of any kind to test the grids through the
portals, which enables monitoring of different grids. We offer some future
recommendations for the next version of this system.
6.1 The Final Substitution System
The final substitution system will accept a manually defined text file which represents
previously chosen parameters and a template directory of files which have had the critical
information removed and the correct keys inserted with their delimiters. The system
processes this directory and file via simple Java algorithms, some of which include
directory navigation, file parsing, and regular expressions. The program consistently and
dynamically maintains information regarding the list of parameters, the given row of
workflow information, the directory paths involved and various counters. Virtually
nothing in the program is hard-coded and all running information is based on the
arguments given at runtime. When executed it will simply return a specified directory
full of the generated workflows indicated by the TAP.
6.2 The Final Logging System Our logging system provides live data from the portal to both a log file and the portal. All
the data is nicely organized by date and time in XML format. When special tests are run
through the portal they are filtered into a separate log file so they can be evaluated to
determine the status of the grid. The live data gives portal users current information from
75

the grid. The administrators of the grid can easily set a limit for the live log to hold,
depending on what their system can handle or what they want to support. Although not
displayed in the portal, important counters are kept in the live log system including total
number of runs, total number of successful workflows, and total number of failed
workflows.
6.3 The Final Visualization System The visualization system which was created for the project provides a basic structure for
displaying and interpreting the results of test workflows. It provides a means for
extracting and properly parsing the information from the workflow log. Also a method
has been created for collecting the results of tests in a centralized location and from this a
script is able to make a determination on the state of a grid. The system also implements
a graphical method for displaying the states of all the grids. The visualization system
provides a solution to the problem and offers a structure which could easily be expanded
in the future.
6.4 Future Implementation The system which was created as part of this project provides the basic functionality of a
testing and monitoring system for the portal. However, there are many more features
which could be added tothe basic structure which was implemented. Prior to our project,
the portal had no means for logging the results of workflows or monitoring the status of a
grid. With these capabilities in place, the potential has been created for more advanced
portal and grid monitoring.
76

6.4.1 The Future of the Logging System Some improvements can be made to the logging system. Instead of implementing a DOM
parser to write data to the log, SAX parser could be used. In this case, only part of the
XML file would be written into the system before appending the new data to the log.
Currently the whole XML file has to be reparsed before appending data. Another
improvement to the logging system would be presenting live statistics within the portal.
A percentage of fail and success rates for certain grids could be very useful to users and
administrators alike.
6.4.2 Grid Status Alerts One of the possible features which could be implemented using the visualization system
would be grid monitoring alerts. The scripts are able to determine the current status of a
grid and display this, which is very useful for portal administrators and users; this could
potentially be taken to the next step. For example, a cursor pass-over could raise a small
window with more detailed data. The system aslo has to potential to be more proactive
and send alerts in the form of emails which would notify administrators of problems as
they arise. The grid testing and monitoring would allow administrators to find and debug
problems with the grids more easily.
77

7 Works Cited
[1] Kacsuk, P., Sipos, G. “Multi-Grid, Multi-User Workflows in the P-GRADE Grid Portal.” MTA SZTAKI, 2006.
[2]Foster, I., Kesselman, C., Tuecke, S. “The Anatomy of the Grid: Enabling Scalable Virtual Organizations.” 2001.
[3] "The Grid Café." 2005. CERN. 13 Apr. 2005 <http://gridcafe.web.cern.ch/gridcafe/index.html>.
[4]Lovas, R., Kascuk, P., Horváth, Á., Horányi, A. “Application of P-Grade Development Environment in Meteorology.” MTA SZTAKI, 2003.
[5] Foster, Ian. “Globus Toolkit Version 4: Software for Service-Oriented Systems.”
[6] "Condor: High Throughput Computing." 2005. Dept. of CS, UW-Madison. 13 Apr. 2006 <http://www.cs.wisc.edu/condor/description.html>.
[7] "Message Passing Interface." 1999. MCS Division, Argonne National Laboratory. 12 Apr. 2006 <http://www-unix.mcs.anl.gov/mpi/>.
[8] Geist, G., Kohl, J., Papadopoulos, P. “PVM and MPI: A Comparison of Features.” 1996.
[9] Kacsuk, P., Sipos, G., & Farkas, F. “World-wide Parallel Processing by the P-GRADE Grid Portal” MTA SZTAKI, 2004.
[10] "XML." Wikipedia. 10 Apr. 2006. Wikimedia Foundation. 13 Apr. 2006 <http://en.wikipedia.org/wiki/XML>.
[11] "Markup Language." Wikipedia. 7 Apr. 2006. Wikimedia Foundation. 13 Apr. 2006 <http://en.wikipedia.org/wiki/Markup_language>.
[12] "Extensible Markup Language (XML) 1.0 (Second Edition)." W3C. 6 Oct. 2000. 13 Apr. 2006 <http://www.w3.org/TR/2000/REC-xml-20001006.html>.
78
[13] "Document Object Model." W3C. 19 Jan. 2005. 13 Apr. 2006 <http://www.w3.org/DOM/>.
[14] "Document Object Model." Wikipedia. 9 Apr. 2006. Wikimedia Foundation. 13 Apr. 2006 <http://en.wikipedia.org/wiki/Document_object_model>.
[15] "Simple API for XML." Wikipedia. 29 Mar. 2006. Wikimedia Foundation. 13 Apr. 2006 <http://en.wikipedia.org/wiki/Simple_API_for_XML>.
[16] Dominus, Mark-Jason. "A Short Guide to DBI." Perl.Com. 22 Oct. 1999. O'Reilly Media, Inc. 13 Apr. 2006 <http://www.perl.com/lpt/a/1999/10/DBI.html>.
[17] "GNU General Public License." GNU Project. 7 June 2005. Free Software Foundation. 13 Apr. 2006 <http://www.gnu.org/copyleft/gpl.html>.
[18] "Top Ten Reasons to Use MySQL." MySQL. 2005. MySQL AB. 13 Apr. 2006 <http://www.mysql.com/why-mysql/toptenreasons.html>.
[19] MySQL." Wikipedia. 11 Apr. 2006. Wikimedia Foundation. 13 Apr. 2006 <http://en.wikipedia.org/wiki/Mysql>.
[20] Bogaerdt, Alex Van Den. "Rrdtutorial." RRDtool. Mar. 2006. 25 Mar. 2006 <http://oss.oetiker.ch/rrdtool/tut/rrdtutorial.en.html>.
[21] Roelofs, Greg. "Portable Network Graphics." Libpng.Org. 29 Jan. 2006. 13 Apr. 2006 <http://www.libpng.org/pub/png/>.
[22] "Google Maps." Wikipedia. 5 Apr. 2006. Wikimedia. 13 Apr. 2006 <http://en.wikipedia.org/wiki/Google_maps>.
[23] "Google Maps API: Frequently Asked Questions." Google. 2006. Google Inc. 22 Mar. 2006 <http://www.google.com/apis/maps/faq.html>.
[24] "Google Maps API Documentation." Google. 2006. Google Inc. 22 Mar. 2006 <http://www.google.com/apis/maps/documentation/>.
79

[25] Compiled V Interpreted V Virtual Machine Languages." Well House Consultants. Mar. 2006. Well House Consultants LTD. 13 Apr. 2006 <http://www.wellho.net/solutions/perl-parrot-perl-s-new-virtual-machine.html>.
[26] Allen, Jon. "Perl." PerlDoc. 9 Apr. 2006. The Perl Foundation. 13 Apr. 2006 <http://perldoc.perl.org/perl.html>.
[27] Novotny, Jason, Michael Russell, and Oliver Wehrens. "GridSphere: an Advanced Portal Framework." Gridsphere.Org. Gridsphere. 13 Apr. 2006 <http://www.gridsphere.org/gridsphere/wp-4/Documents/France/gridsphere.pdf>.
[28] McPherson, Scott. "JavaServer Pages: a Developer's Perspective." Sun Developer Network. Apr. 2000. Sun Microsystems. 13 Apr. 2006 <http://java.sun.com/developer/technicalArticles/Programming/jsp/>.
[29] “Laboratory of Parallel and Distributed Systems.” MTA SZTAKI. 2002-2006. MTA-SZTAKI LPDS. 19 April 2006 <http://www.lpds.sztaki.hu/>.
[30] “Tools of P-GRADE.” P-GRADE. 2003. MTA-SZTAKI. 19 April 2006<http://www.lpds.sztaki.hu/pgrade/main.php?m=2>.
[31] “Highlights – The Development Environment.” P-GRADE. 2002–2006 . MTA-SZTAKI LPDS. 19 April 2006. <http://www.lpds.sztaki.hu/index.php?menu=pgrade&&load=pgrade.php>.
[32] Kacsuk, Peter, and Sipos, Gergely. “Multi-Grid, Multi-User Workflows in the P-GRADE Grid Portal.” Journal of Grid Computing Volume 3, Numbers 3-4, September 2005: pp 221-238.
[33] “What is the P-GRADE Portal?” P-GRADE Grid Portal. 2004-2005. MTA-SZTAKI LPDS. 19 April 2006. <http://www.lpds.sztaki.hu/pgportal/>.
[34] “Java Programming Language.” Wikipedia. April 2006. Wikimedia. 19 April 2006. <http://en.wikipedia.org/wiki/Java_programming_language>.
80

[35] “Learn About Java Technology.” Java.com. 2005. Sun Microsystems. 19 April 2006. <http://java.com/en/about/>.
[36] “The Official Eclipse FAQs.” Eclipsepedia. March 2006. Eclipse. 19 April 2006. < http://wiki.eclipse.org/index.php/The_Official_Eclipse_FAQs>.
[37] "What is Jetspeed?" Apache Portals. 19 Apr. 2006 <http://portals.apache.org/jetspeed-1/>.
[38] "JSR 168: Portlet Specification." Java Community Process. Sun Microsystems. 19 Apr. 2006 <http://www.jcp.org/en/jsr/detail?id=168>.
[39] "Cascading Style Sheets." W3C. 13 Apr. 2006. World Wide Web Consortium. 18 Apr. 2006 <http://www.w3.org/Style/CSS/>.
[40] "Newbie: Intro to Cron." UnixGeeks.Org. 30 Dec. 1999. 18 Apr. 2006 <http://www.unixgeeks.org/security/newbie/unix/cron-1.html>.
[41] "About EGRID." EGRID. 10 Apr. 2006. Italian Ministry for Education and Research. 18 Apr. 2006 <http://www.egrid.it/about/>. [42] "The HunGrid VO." RMKI Computing Center. 2006. RMKI. 18 Apr. 2006 <http://www.lcg.kfki.hu/?hungrid&hungridgeneral>. [43] "South Eastern European GRid-Enabled EInfrastructure Development." SEE-GRID. 2006. Greek Research and Technology Network. 18 Apr. 2006 <http://www.see-grid.org/>. [44] NGS." National Grid Service. 2006. National Grid Service. 18 Apr. 2006 <http://www.ngs.ac.uk/>. [45] "VOCE." Enabling Grids for E-SciencE. 2006. CESNET. 18 Apr. 2006 <http://egee.cesnet.cz/cms/opencms/en/voce/>.
81

Appendix A Architecture of the Visualization System
82

Appendix B Possible Grid States State Color Meaning
(Result of most recent broker test)
Good Green Successful
Bad Red Failure
Unknown Yellow Successful, but expired
No Results Black No test results in database
83

Appendix C Naming Convention Tree
84

Appendix D Before and After the Key Substitution
85

Appendix E Logging Architecture
86