Grid Network Services Use Cases from the e-Science Community
60
GFD-I-122 Tiziana Ferrari, INFN (Editor) Category: Informational Grid High-Performance Networking Research Group Last revision: Dec 12, 2007 Version: 3.0 Editor: [email protected] 1 Grid Network Services Use Cases from the e-Science Community Status of This Memo This memo provides information to the Grid community about network services use cases. It does not define any standards or technical recommendations. Distribution is unlimited. Copyright Notice Copyright © Open Grid Forum (2007). All Rights Reserved. Abstract Network services are specialized in the handling of network-related or network- resident resources. A network service is further labeled as a Grid network service whenever it has roles and/or interfaces that are deemed to be specific to a Grid infrastructure. We provide a high-level, structured description of some well-understood Grid network services use cases. The purpose is to facilitate the identification of network services critical to the Grid middleware and user applications in e- science, and to identify relationships.
Transcript of Grid Network Services Use Cases from the e-Science Community
GFD-I-122 Tiziana Ferrari, INFN (Editor)
Category: Informational
Grid High-Performance Networking Research Group Last revision: Dec 12, 2007
Version: 3.0
Editor: [email protected] 1
Grid Network Services Use Cases from the
e-Science Community
Status of This Memo
This memo provides information to the Grid community about network services use cases. It does not define any standards or technical recommendations. Distribution is unlimited.
Copyright Notice
Copyright © Open Grid Forum (2007). All Rights Reserved.
Abstract
Network services are specialized in the handling of network-related or network-resident resources. A network service is further labeled as a Grid network service whenever it has roles and/or interfaces that are deemed to be specific to a Grid infrastructure.
We provide a high-level, structured description of some well-understood Grid network services use cases. The purpose is to facilitate the identification of network services critical to the Grid middleware and user applications in e-science, and to identify relationships.
GFD-I-122 Tiziana Ferrari, INFN (Editor)
Category: Informational
Grid High-Performance Networking Research Group Last revision: Dec 12, 2007
Version: 3.0
Editor: [email protected] 2
Contents
Abstract.................................................................................................................1
1. Introduction ..................................................................................................3
2. Path-oriented use cases ..............................................................................3
2.1 Visualization Session ................................................................................3
2.2 Large Data Streaming coordinated with Job Execution ...........................9
2.3 High Energy Physics File Replica Management Use Cases...................12
2.4 Emergency Medical Technician Application with Integrated Wireless Sensors............................................................................................................22
2.5 Distributed Aircraft Maintenance Environment (DAME) ..........................27
2.6 Networked Supercomputing....................................................................32
2.7 Very Long Baseline Interferometry..........................................................42
3. Knowledge-based use cases .....................................................................48
3.1 Passively Monitored Data .......................................................................48
3.2 Administrative Setup of Schedules of Measurements.............................51
3.3 Service Optimization ...............................................................................55
4. Acknowledgements....................................................................................59
5. Security Considerations .............................................................................59
6. Authors Information....................................................................................59
7. Intellectual Property Statement..................................................................59
8. Disclaimer ..................................................................................................60
9. Full Copyright Notice..................................................................................60

GFD-I.122 Dec 12, 2007
1. Introduction
Network services are specialized in the handling of network-related or network-resident resources. A network service is further labeled as a Grid network service whenever it has roles and/or interfaces that are deemed to be specific to a Grid infrastructure.
We provide a high-level, structured description of some well-understood Grid network services use cases. The purpose is to facilitate the identification of network services critical to the Grid middleware and user applications and to identify relationships between different Grid network services.
Use cases are divided in two groups: path-oriented and knowledge-based. The former group includes use cases with various specific connectivity service level requirements, while the latter includes information-oriented use cases related to network monitoring and usage scenarios of performance data.
The list of use-cases detailed in this document is non-comprehensive. Additional use cases will be included in a new companion recommendation.
2. Path-oriented use cases
This section illustrates a number of use cases aiming at the usage of different types of network connectivity. In what follows we detail the individual scenarios.
2.1 Visualization Session
Contributors: Gigi Karmous-Edwards (MCNC Institute), Jason Leigh (University of Illinois at Chicago), Inder Monga (Nortel Networks Laboratories)
2.1.1 Use case summary
Visualization is one of the key methods used to represent data (raw or processed) and is used extensively by almost all fields of specialization for instance e-sciences, medicine, engineering and digital art. A visualization session may either use data-sets available either locally or remotely. Remote visualization, tele-immersion, collaborative visualization, tele-operation, and distributed simulation analysis are examples of applications requiring a significant amount of Grid resources (network resources included). Also, parallelizing techniques have proved promising in three areas:
1. server-side functions,
2. client side functions,
3. object rendering.
With regards to the latter area, rendering and display have stringent bandwidth, latency and jitter requirements, especially when remote. In the latter use-case we focus on requirements of compute and data-intensive visualization sessions.
GFD-I.122 Dec 12, 2007
2.1.2 Customers
The customers are applications requiring visualization analysis of very large data sets on the order of terabytes to petabytes from remote locations.
Grid Resource Brokers catering to applications requiring Grid-assisted visualization like remote visualization, tele-immersion, collaborative visualization, tele-operation, and distributed simulation analysis.
2.1.3 Scenarios
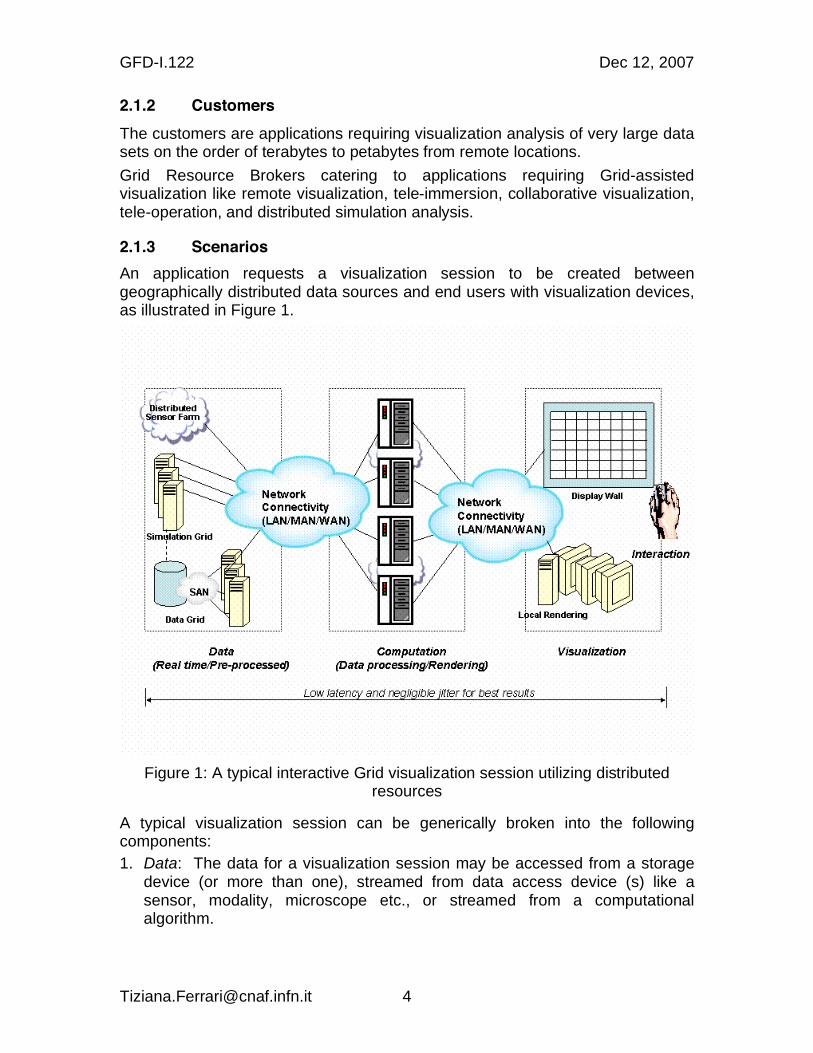
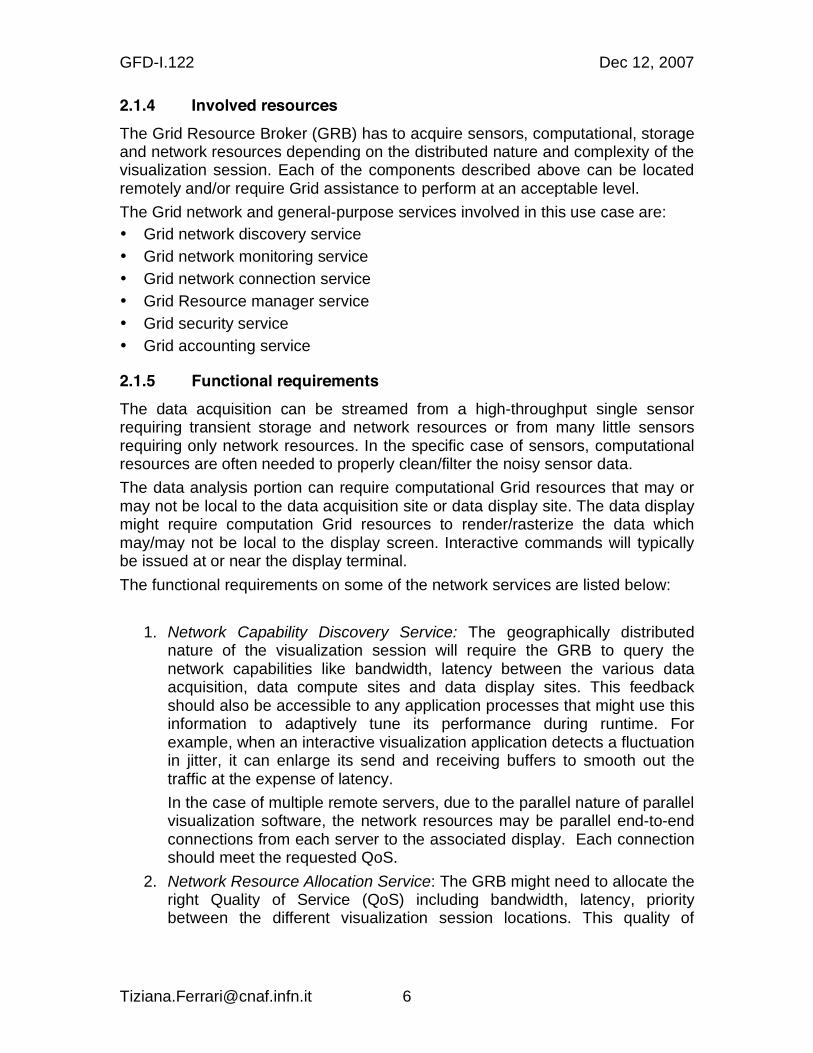
An application requests a visualization session to be created between geographically distributed data sources and end users with visualization devices, as illustrated in Figure 1.
Figure 1: A typical interactive Grid visualization session utilizing distributed resources
A typical visualization session can be generically broken into the following components:
1. Data: The data for a visualization session may be accessed from a storage device (or more than one), streamed from data access device (s) like a sensor, modality, microscope etc., or streamed from a computational algorithm.
GFD-I.122 Dec 12, 2007
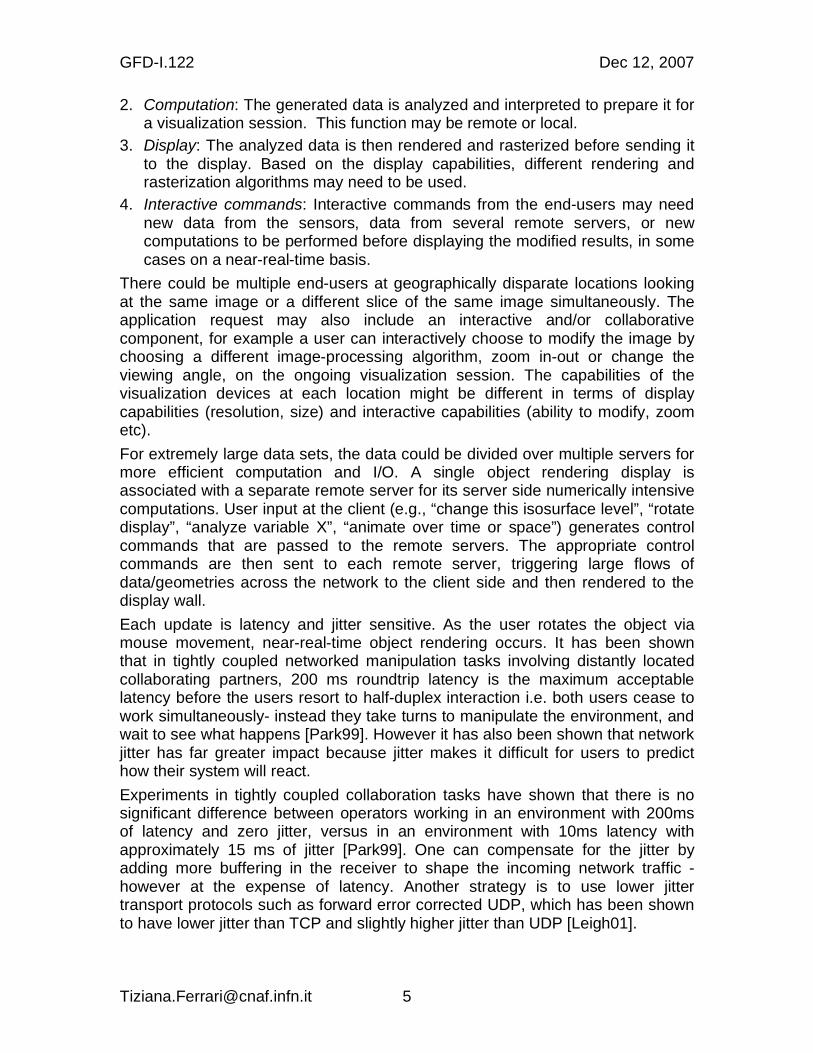
2. Computation: The generated data is analyzed and interpreted to prepare it for a visualization session. This function may be remote or local.
3. Display: The analyzed data is then rendered and rasterized before sending it to the display. Based on the display capabilities, different rendering and rasterization algorithms may need to be used.
4. Interactive commands: Interactive commands from the end-users may need new data from the sensors, data from several remote servers, or new computations to be performed before displaying the modified results, in some cases on a near-real-time basis.
There could be multiple end-users at geographically disparate locations looking at the same image or a different slice of the same image simultaneously. The application request may also include an interactive and/or collaborative component, for example a user can interactively choose to modify the image by choosing a different image-processing algorithm, zoom in-out or change the viewing angle, on the ongoing visualization session. The capabilities of the visualization devices at each location might be different in terms of display capabilities (resolution, size) and interactive capabilities (ability to modify, zoom etc).
For extremely large data sets, the data could be divided over multiple servers for more efficient computation and I/O. A single object rendering display is associated with a separate remote server for its server side numerically intensive computations. User input at the client (e.g., “change this isosurface level”, “rotate display”, “analyze variable X”, “animate over time or space”) generates control commands that are passed to the remote servers. The appropriate control commands are then sent to each remote server, triggering large flows of data/geometries across the network to the client side and then rendered to the display wall.
Each update is latency and jitter sensitive. As the user rotates the object via mouse movement, near-real-time object rendering occurs. It has been shown that in tightly coupled networked manipulation tasks involving distantly located collaborating partners, 200 ms roundtrip latency is the maximum acceptable latency before the users resort to half-duplex interaction i.e. both users cease to work simultaneously- instead they take turns to manipulate the environment, and wait to see what happens [Park99]. However it has also been shown that network jitter has far greater impact because jitter makes it difficult for users to predict how their system will react.
Experiments in tightly coupled collaboration tasks have shown that there is no significant difference between operators working in an environment with 200ms of latency and zero jitter, versus in an environment with 10ms latency with approximately 15 ms of jitter [Park99]. One can compensate for the jitter by adding more buffering in the receiver to shape the incoming network traffic - however at the expense of latency. Another strategy is to use lower jitter transport protocols such as forward error corrected UDP, which has been shown to have lower jitter than TCP and slightly higher jitter than UDP [Leigh01].
GFD-I.122 Dec 12, 2007
2.1.4 Involved resources
The Grid Resource Broker (GRB) has to acquire sensors, computational, storage and network resources depending on the distributed nature and complexity of the visualization session. Each of the components described above can be located remotely and/or require Grid assistance to perform at an acceptable level.
The Grid network and general-purpose services involved in this use case are:
• Grid network discovery service
• Grid network monitoring service
• Grid network connection service
• Grid Resource manager service
• Grid security service
• Grid accounting service
2.1.5 Functional requirements
The data acquisition can be streamed from a high-throughput single sensor requiring transient storage and network resources or from many little sensors requiring only network resources. In the specific case of sensors, computational resources are often needed to properly clean/filter the noisy sensor data.
The data analysis portion can require computational Grid resources that may or may not be local to the data acquisition site or data display site. The data display might require computation Grid resources to render/rasterize the data which may/may not be local to the display screen. Interactive commands will typically be issued at or near the display terminal.
The functional requirements on some of the network services are listed below:
1. Network Capability Discovery Service: The geographically distributed nature of the visualization session will require the GRB to query the network capabilities like bandwidth, latency between the various data acquisition, data compute sites and data display sites. This feedback should also be accessible to any application processes that might use this information to adaptively tune its performance during runtime. For example, when an interactive visualization application detects a fluctuation in jitter, it can enlarge its send and receiving buffers to smooth out the traffic at the expense of latency.
In the case of multiple remote servers, due to the parallel nature of parallel visualization software, the network resources may be parallel end-to-end connections from each server to the associated display. Each connection should meet the requested QoS.
2. Network Resource Allocation Service: The GRB might need to allocate the right Quality of Service (QoS) including bandwidth, latency, priority between the different visualization session locations. This quality of
GFD-I.122 Dec 12, 2007
service reservation might depend on a pre-negotiated SLA for the visualization session.
3. Network SLA Monitoring Service: This service might be used to monitor the ongoing network QoS for the visualization session and prompt the GRB, and in turn the application, in case the SLA negotiated is violated.
4. Network Advanced Reservation Service: This service may be used if the visualization/collaborative session is planned in advance and the requirements for the session are known. This works well especially when the data acquisition devices are one-of-a-kind and require prior reservation as well by the GRB.
5. Network Security Service: It is possible for the visualization session to pass non-trusted network service providers. In this case, encryption, VPN, firewall or other network services might be requested by the GRB. However the type of encryption requested should be negotiated with the application so that the overhead of encryption does not incur a severe performance penalty.
6. Network AAA Service: The GRB might need Authorization before allocating network resources and might need accounting records to provide to the application the amount of network resource used in a visualization session.
2.1.6 Security considerations
Signed and authorized requests from GRB will ensure no attacks or modifications to the network services requested.
2.1.7 Performance considerations
GRB’s discovery of the computation and display capabilities as well as network capabilities between sites could modify the performance requirements of the computational aspect or the network aspect of visualization sessions. For example, a display with low resolution and low network bandwidth connection will require a different rasterization algorithm to be run remotely and visualization data to be streamed to that display.
A high-resolution display with a lot of processing capability might have the analyzed data streamed to it over a high-bandwidth network connection so the rendering of the data before display happens on the local compute cluster. Yet another scenario is for the rendering to occur on a larger rendering servers (such as the TeraGrid visualization cluster) and the pixels multicasted to the remote viewers. In these scenarios a 1000 x 1000 pixel 30 frames-per-second animation sequence requires a throughput of approximately 680 Mbit/s (assuming that the graphics is uncompressed.)
An optimistic 10:1 compression will require approximately 68 Mbit/s. However many high-end research laboratories are making greater use of ultra-high resolution tiled displays with resolutions as high as 100 megapixels (such as the
GFD-I.122 Dec 12, 2007
Electronic Visualization Laboratory’s LambdaVision system). Streaming graphics to fill a 100 megapixel display will require between 6.8 Gbit/s and 68 Gbit/s.
In the case of multiple remote servers for a single client side display, the following performance considerations are critical. Parallel high bandwidth end-to-end connection between each server and its associated client side display may be inefficient and very expensive to maintain for the duration of the visualization session. However, relying on the Internet or sharing of a single connection via statistical multiplexing may result in increase of jitter due to fairness queuing.
Dedicated end-to-end connections between servers and displays are critical for reducing jitter and latency. It might be possible to reconfigure the network resources rapidly enough to allow each data transfer to have an end-to-end dedicated channel for the time necessary to transfer a particular server side update to the associated display and then release the resources for the next server.
2.1.8 Use case situation analysis
The visualization use case has been discussed in research papers and presentations. There have been examples of such use-case implemented for certain science experiments.
2.1.9 References
[Foster99] Distance Visualization: Data Exploration on the Grid, Ian Foster et. al.; IEEE Computer, 32 (12), 1999, pp. 36-43.
[Leigh01] Adaptive Networking for Tele-Immersion, in Proc. of Immersive Projection Technology/Eurographics Virtual Environments Workshop (IPT/EGVE), Leigh, J., Yu, O., Schonfeld, D., Ansari, R., et al., Stuttgart (DE), May 2001 (http://www.evl.uic.edu/cavern/papers/jleigh_EGVEIpt2001.pdf).
[Leigh04] Network Requirements of Ultra-High Resolution Visualization and Collaboration Environments--An Applications Perspective, Jason Leigh et. al.; MSNC workshop on Optical Control Planes for the Grid Community, Apr 2004, Chicago (IL).
[Misegades03] Parallel Processing Changes the Performance Equation; Misegades, K.; White paper, Jul 2003
(http://www.ensight.com/oct2001/parallel.html).
[Park99] Effects of Network Characteristics on Human Performance in a Collaborative Virtual Environment, K. Park, Kenyon, R.; in Proc. of IEEE Virtual Reality, Houston (TX), 1999 (http://www.evl.uic.edu/cavern/hci/index.html)
[Romberg03] Application Steering in a Collaborative Environment; Romberg, M. et alt.; in Proc. of the ACME/IEEE SC2003 Conference, Phoenix, 2003
(http://www.sc-conference.org/sc2003/global.html#sched).
GFD-I.122 Dec 12, 2007
2.2 Large Data Streaming coordinated with Job Execution
Contributor: Volker Sander (Aachen University of Applied Sciences)
2.2.1 Use Case Summary
The coordinated use of multiple resources is particularly challenging in Grid infrastructures, due to the distributed nature of the resources involved in complex workflows with internal dependencies. A Grid network service guaranteeing the timely access to remote resources, allows the synchronization of the individual components of a complex workflow, with a consequent gain in terms of resource usage efficiency.
In the specific case of data access, high-throughput file transport with deadline allows the synchronization of job execution with the transfer of input data. For example, input data can be pre-staged while in the meantime the corresponding job is waiting for being executed. The coordination of data streaming and job execution can be effectively used by any Grid application that is oriented to the processing of large volumes of data, such as [HEP], as described in grater detail in Section 2.3.
2.2.2 Customers
Scientific computing relies on the availability of appropriate computational capabilities. Existing and emerging virtual organization will provide access to multiple high-performance computing facilities to serve science and engineering with the demanded computational capabilities.
In order to ease the use of such an infrastructure, advances in resource management will allow end-users to specify a workflow that is handed to a community scheduler responsible of resource selection and job submission. In order to build these future resource management functions, the coordination of data streaming and job execution gives the ability to explicitly consider the relocation of data in advanced scheduling algorithms. Consequently, there are two types of customers:
1. resource management services – such as community schedulers [SNAP] dynamically mapping workflows to resources;
2. end-users negotiating a particular time frame for the remote execution of their programs, such as visualization and steering applications typically served by a supercomputer platform.
2.2.3 Scenarios
Large-scale supercomputing is expected to produce data at a similar rate than large-scale experiments. In order to post-process the computed results, high-throughput transfers are often required to stage the data at the related computational resources. Similarly, high-end scientific computing also processes

GFD-I.122 Dec 12, 2007
large amounts of input data that, from a performance perspective, should be accessible as efficiently as possible. Local parallel file systems are well suited for supporting the demanded I/O capabilities, even when data has to be staged to the respective file systems.
Community schedulers need to control multiple distributed computational resources in order to serve individual workflows. By modeling of the data transport as an individual service with a predictable termination time, the scheduler can potentially create a service level agreement for the entire workflow, assuring a specific end-time even in case of input data not yet available locally.
2.2.4 Involved Resources
Data has to be staged from one source to one or mode destination nodes. The demanded service assures that the data transport from source to destination finishes before a given time. This requires adequate transport capabilities and the use of appropriate transport protocols.
2.2.5 Functional Requirements
The support of file transfer with deadline requires:
o mechanisms for the enforcement of the synchronization of the data streaming and processing tasks to be selected according to the timing constraints;
o the ability to negotiate the guarantee parameters, such as the amount of guaranteed bandwidth, the end-points, and the time interval;
o the availability of transport protocols guaranteeing high performance and efficiency;
o the effective use of network resources during data streaming.
2.2.6 Service Utilization
This service is intended to support the map of abstract workflows to Grid environments. The related service agreement is negotiated by the user – either an end-user or a high-level service such as a community scheduler. The service is triggered through signaling by the user or a proxy, while the provisioning is performed by the service provider, i.e. some management software that assures a timely provisioning according to the established agreement.
2.2.7 Security considerations
During the signaling phase the user has to provide appropriate policy information that refers to the existing agreement and that assures its right to use this agreement.
Access to the service is explicitly granted by a management system that implements the appropriate admission control. Appropriate AAA-mechanisms are required.
GFD-I.122 Dec 12, 2007
2.2.8 Performance Considerations
1. Negotiation and claiming of service parameters
Efficient factory mechanisms are required to implement agreement negotiation. Appropriate authorization mechanisms have to be applied when the service is claimed, particularly because the network is composed of multiple administrative domains.
2. Service usage
Deadline file transport will likely rely on traffic differentiation for getting a share of unused bandwidth and assuring a negotiated level of service. Of course, the challenge of effectively using the guaranteed service level remains.
2.2.9 Use Case Situation Analysis
The implementation of a High-Throughput file transfer with deadline has been analyzed in the context of the General-purpose Architecture for Reservation and Allocation (GARA) [GARA], a former research thread of the Globus Project (now Globus Alliance), and in the context of the German government funded project Path-Allocation in Backbone Networks (PAB) [PAB]. Scientific papers have been published in [MCL] and [E2E].
2.2.10 References
[E2E] End-to-End Quality of Service for High-End Applications. I. Foster, M. Fidler, A. Roy, V. Sander und L. Winkler. Elsevier Computer Communications Journal, 2004. In press.
[GARA] GARA: A Uniform Quality of Service Architecture. A. Roy und V. Sander. “Grid Resource Management: State of the Arth and Future Trends”, Edited by J. Nabrzyski, J. Schopf und J. Weglarz, Kluwer Academic Publisher, 2003 (ISBN 1-4020-7575-8).
[HEP] High-Performance Networks for High-Impact Science, Report, High-Performance Network Planning Workshop, Aug 2002
(http://www.doecollaboratory.org/meetings/hpnpw/finalreport/highperformance_networks.pdf#page=20).
[MCL] Multi-Class-Applications for a Parallel Usage of a Guaranteed Rate and a Scavenger Service. M. Fidler und V. Sander. In Proceedings of IEEE/ACM CCCGrid GAN 2003, May 2003.
[PAB] The Path-Allocation in Backbone Networks Project (http://www.pab.rwth-aachen.de)
[SNAP] SNAP: A Protocol for Negotiating Service Level Agreements and Coordinating Resource Management in Distributed Systems. K. Czajkowski, I. Foster, C. Kesselman., V. Sander und S. Tuecke. Lecture Notes in Computer Science, Nov 2002.
GFD-I.122 Dec 12, 2007
2.3 High Energy Physics File Replica Management Use Cases
Contributors: Peter Clarke (University of Edinburgh), Paul D. Mealor, Peter Kunszt (Swiss National Supercomputing Centre)
2.3.1 Summary of Use Cases
The High Energy Physics experiments will record data sets of several petabytes per year. The analysis of the recorded data requires the transmission of raw data to remote sites for processing and the exchange or the processing results.
Data centers are divided into four Tiers: Tier-0 is the experiment itself; Tier-0 and Tier-1 sites each have all the raw data; Tier-2 and 3 sites have subsets of raw and processed data. Tier-1 sites are distributed so that large geographical areas (on the scale of a country) each have one in.
Data is typically streamed from the detectors and resides on disk for a while before being translated to tape. While the files are on disk, Tier-1 sites can pull over any files they are interested in. Tier-1 processed data is then exchanged with other Tier-1 sites.
In this section we detail three distinct file transfer use cases, which are taken from the computing architecture proposed in the framework of the EGEE project [EGEE], with the addition of information specific to the support of High Energy Physics experiments [DJRA1.1]. These are:
1. the retrieval of raw data from a Tier-0 to a Tier-1 site;
2. data reprocessing;
3. the file transfer needed for remote job execution.
The file transfer scenarios indicated above, represent the functioning of the Data Scheduler architecture, which is detailed in what follows.
For each Virtual Organisation (VO), a top-level Data Scheduler maintains a list of transfers required which cannot be handled locally. At each Site, a VO Fetcher Service polls the VO Data Scheduler for new transfers to Storage Elements (SEs) at that Site. Any transfers it finds are added to a list maintained by the Transfer Service. The Transfer Service maintains a list of all transfers to that Site, which includes transfers routed via the Fetcher Service, or from a local File Placement Service. There will be one Fetcher Service per VO at each Site.
The File Placement Service is the Grid User’s interaction point with the Data Scheduler and the Transfer Services, and it is also responsible for updating the VO catalogues after successful completion of the transfer.
The site Transfer Service is tied to managing a (set of) Network Channels that are defined to the given site. These channels are either dedicated links between two sites with well-defined bandwidth and usage policies, or general-purpose

GFD-I.122 Dec 12, 2007
shared links that may be used according to a site configurable policy. The Transfer Service keeps the transfer state for all transfer jobs in its internal persistent Queue. A set of extensible Transfer Agents operate on this queue to manage the state of transfers, assigning them to Channels or changing their priority according to policies,
Figure 2 shows the various entities involved in a transfer. The dashed lines indicate processes that depend upon the actual implementations of the Transfer API: the Transfer Service makes calls to the Transfer API to make a transfer which is limited to parameters supplied by the Transfer Service (for example, a timeout for the file to be transferred is a parameter). If the Transfer API is a ‘simplistic’ API like plain gridftp, the Transfer Service may manage the transfer itself through one of its Transfer Agents. The implementation of the Transfer API ultimately ensures that the Final Transfer occurs, a possible implementation being grid-url-copy and another srm-cp (the managed transfer operation of Storage Resource Managers [SRM]).
Figure 2: The entities involved in a transfer in the Data Scheduler Architecture
GFD-I.122 Dec 12, 2007
2.3.2 HEP Use Case 1: Retrieval of raw data from a Tier-0 to a Tier-1 site
CERN will produce a lot of data from the Large Hadron Collider [LHC]. In this use case the data is streamed from the detectors and resides on disk for a while before being translated to tape. While the files are on disk, Tier-1 sites can pull over any files they are interested in.
After the files are migrated to tape, retrieving the data will involve staging them to disk first, and this is time-consuming and inefficient. Each Tier-1 site will be interested in different pieces of the data, partitioned by experiment but also on activities within each experiment.
While the data is being recorded and constantly pushed to tape, there is only a certain time window within which the data is initially available for migration to the Tier-1 sites, so the data transfer services have to make the most efficient use of this window, maximising the available bandwidth.
a) Actors
The Tier-1 site File Transfer Service is responsible for pulling the data from the Tier-0 site. The Tier-0 site needs to publish at all times what data is currently available on disk, and for how long. A Transfer Agent of the Tier-1 Transfer Service will then select the files for transfer based on site and site-local VO policies.
b) Stakeholders and interests
• The Tier-1 Site requires that any interesting data is transferred in to an SE at that site, before it is migrated to tape at CERN.
• The Tier-1 Site also requires that any bandwidth reservations it makes are made use of.
• The Tier-0 centre: must not exceed its physical bandwidth capability.
c) Main success scenario
1. The LHC experiments stream raw data to disk at CERN as it is recorded.
2. A Site File Transfer Service at the Tier-1 Site is notified as to what data is available, and decides which files are of interest to the site.
3. The FTS might reserve bandwidth from CERN to the Site to ensure that all the data files are transferred in time. Bandwidth reservation is always done within well-defined Network Channels between Tier0 and Tier1 sites. Some channels will be dedicated network links, like between CERN and Fermilab.
4. For each file, the FTS then requests that that file is transferred to an SE at the Tier-1 Site, before the files are migrated to tape. This request process may be done as a batch transfer job
5. The data on disk at CERN is then migrated to tape.
GFD-I.122 Dec 12, 2007
2.3.3 HEP Use Case 2: Data reprocessing
Data reprocessing is structured in a sequence of phases, as detailed below.
Initially, following a period of data-taking, each of the Tier-1 sites has a copy of the raw data set for an experiment. This data set is approximately 2 PB in size per year per experiment. These data have already been processed once (as soon as they were recorded). This process takes the data from the raw form to Event Summary Data (ESD) form, with a volume reduction of a factor of 10. Raw and ESD data have a simple file format.
Subsequently, the experiment management decides that enough further detector calibration has been performed for a complete data re-processing cycle to be performed. This requires that the complete raw data set is passed through and reprocessed again from Raw to ESD data. The responsibility for this is handed to the data re-processing Tsar.
Then, as the data sets are replicated at several sites using the processes described in Scenario 1, a process occurs (not described here) to select three sites which will each run 1/3 of the reprocessing. The sites are widely geographically separated (for example, one in the Asia-Pacific area, one in the EU and one in the US).
The Tsar requires that the re-processing is completed within two weeks of commencement (again assume the enough CPU has been identified for this). During this process the re-processed ESD data is produced pseudo-continuously, and results in the ability to produce a set of interim ESD files on a daily basis.
The Tsar also requires that the re-processed ESD data is distributed to all Tier-1 sites throughout the World and that this should be complete within 1 week of the finish of re-processing.
The Tsar will use some Data Distribution Service which will take responsibility for arranging all logistics of data delivery, making in turn use of the site File Transfer Services or the VO Data Schedulers. The Tsar will want to hand off responsibility for completion, and merely be notified when the job is done.
a) Actors
• Experiment management: require that all current raw data is reprocessed to ESD form by some time (known from here as the Computation Deadline, and of the order of two weeks), and the reprocessed data is distributed to all of the Tier-1 centres by some Deadline (of the order of three weeks). The experiment management may also have agreements with certain computer centres to allow the majority of reprocessing computation to be carried out at a few centres.
• Data Reprocessing Tsar: is an automated process that ensures that the raw data is reprocessed and redistributed by the Deadline.

GFD-I.122 Dec 12, 2007
b) Stakeholders and interests
The Compute Element (CE) administration requires that any allocations of computational and network resources are not exceeded.
c) Main success scenario
1. The experiment management cause the Data Reprocessing Tsar to start reprocessing raw data to ESD form.
2. For each raw data set, the Data Reprocessing Tsar submits a job to the Grid. The jobs must finish by the Computation Deadline. The choice of CE to which to submit the each job may be manually decided, or may be decided by middleware based upon the SEs to which output data should be sent.
3. Each job reprocesses the raw data into ESD data.
4. As ESD data files are produced, the Data Reprocessing Tsar copies the output ESD data files to all of the Tier-1 centers, one of the constraints of the transfer is that it must be complete before the Deadline.
Note that this scenario is relevant when a file is transferred by the Site Transfer Service because of the constraints implied by the Data Reprocessing Tsar.

GFD-I.122 Dec 12, 2007
2.3.4 HEP Use Case 3: Job Submission
The Resource Broker chooses a CE from a list (calculated cost of using each CE), and submits a job to the selected CE to be run later. The CE can retrieve any data replicas known before the job runs via the getBestReplica function (defined in greater detail at the end of the paragraph), or the job itself can retrieve data replicas after it has run. Either of these may request a transfer1. The job submission use case is illustrated in Figure 3.
Submit Job
Get CE List
Check Costs
Run JobGet Best Replica
Submit Job
Resource Broker
User (UI)
File Placement Service
Request a transfer
Compute Element
Figure 3: A use-case diagram showing a user submitting a job to a Resource Broker
a) Actors
The User requires that a job is run according to any deadlines he has.
b) Stakeholders and interests
• The CE administration requires that the user does not exceed his/her allocated resources.
• The SE and Network administrations require that the user does not exceed his/her allocated resources.
• The experiment administration requires that the Job makes the best use of all resources allocated to that experiment.
1 Figure 3 only shows the case of the running job in the CE.

GFD-I.122 Dec 12, 2007
c) Main success scenario
1. The User submits a job via his user interface to the Resource Broker. The job specification contains all the restrictions and requirements on the CE that must run it, as well as a list of required logical files, plus the physical filenames of any data produced by it.
2. The Resource Broker obtains a list of CEs capable of running the job.
3. The Resource Broker locates all the physical locations of the required logical files.
4. For each CE and for each required logical file, the Resource Broker calculates the cost of retrieving all the replicas of that logical file, and of placing any output files onto their target SE. The Resource Broker selects the CE for which the total cost would be lowest. This cost can include the cost of transferring the files over the network. Alternatively, the cost can be indirectly minimized by selecting the CE which is local to a SE having all or the largest amount of requested files.
5. The Resource Broker passes the job on to the CE, where it is queued.
6. The CE eventually runs the job.
7. The job requests each logical file should be transferred to the local SE (at least, it requests that each logical file should be made available to it, and local middleware is configured with the SE to use).
8. The job runs.
9. The job transfers any output files to the designated SE and pins the files for the lifetime of the job.
10. The job will release the files after the job has completed. However, the files may simply stay on the SE, depending on the cleanup policy or lifetime management capabilities of the given SE.
The Resource Broker makes use of various resources related to replica managements: the SEs and Replica Catalogue being the main items. It also uses the CE of a site to run a job. File transfer may benefit from the capability to reserve storage space prior to start. If reservation is needed, a Service Level Agreement (SLA) needs to be negotiated.
GFD-I.122 Dec 12, 2007
The getBestReplica function relies on reasonably good information about the state of the network to decide on a source for the file replica. Incorrect data entering the information system could result in files being sourced inefficiently as a denial-of-service attack against either the smooth-running of the Grid or of the networks themselves.
Very many small and not-so-small transfers will occur in the Grid environment, due to all the ways this use-case is referenced. Sites within a lower-numbered Tier are more likely to contain the replicas required, however file replicas may ultimately exist at any Tier site and for performance, the getBestReplica function must be able to compare any pair of SEs. Data should be available for any likely candidate which might hold a file replica.
2.3.5 File transfer scenarios
Two data transfer scenarios are applicable to the HEP use cases described above: Transfer based on user requests and Transfer based on subscription/notification.. In what follows we individually detail these transfer scenarios.
1. Transfer by request
The primary actor in this use case is the entity which can request a file transfer, including computational jobs, replica management middleware and so on, as well as a real user. The entity is denoted as X in what follows. X may require that a particular file be made available on an SE, while the Site management aims at the best use of all resources for all transfers.
This file transfer scenario has to address a number of needs. First of all, the site has agreements with the VOs to provide a certain level of service for file transfers in order to avoid allowing the VOs to exceed their agreements. Secondly, each VO may want to ensure both that it makes best use of its agreements with each Site, and that the users do not violate policy. Finally, the User needs to transfer a file to the Target SE, eventually registering the file in the VO replica catalogues after successful transfer.
The file transfer is organized as follows:
1. The User requests of his/her local File Placement Service that a file be transferred. As a source he/she may specify a Logical File Name, in which case the FPS has to determine the best suitable source, most probably based on some Network Monitoring metrics. The target may be either a fully qualified target URL or just the name of the target site or target SE.
2. The File Placement Service requests of the VO Data Scheduler that that particular replica should be transferred to the Target SE if the target is not
GFD-I.122 Dec 12, 2007
local, otherwise the FPS adds all transfers to the local Transfer Service queue.
3. After some time, the VO Fetcher Service at the Target Site polls the VO Data Scheduler for any new transfers to SEs at that Site. If the target was local, this step is omitted.
4. The Fetcher Service adds any new transfers to the Transfer Service at the Target Site.
5. For each file it has listed, the Transfer Service manages the transfer of the file.
2. Transfer by subscription/notification
Based on an event, the Site Transfer Service receives transfer jobs. Conceivably this happens as the transfer is added by another entity, a data subscription or notification service, or periodically according to some site policy using a custom Transfer Agent.
The Site Transfer Service takes care of scheduling these transfers according to site and VO policy just like all the other transfer requests.
2.3.6 File Transfer Optimization
It may happen that the file cannot be transferred according to the limitations without requesting other services.
Transfer of high-priority files may request the support of a service for guaranteed delivery time, where available. As network bandwidth is typically shared by multiple concurrent users, an admission control system must be in place for this eventuality.
The FTS will have site and VO policy enforcement Agents running on constantly sorting the transfer queue. Users with immediate transfer request and the authorization to do so based on these policies will be automatically elevated to the top of the queue.
Most of the transfers in the HEP use case are usually done from the data source (Tier0) site to the Tier 1 sites, and from these to the higher-numbered tiers. The transfers will be scheduled based on the available bandwidth and available disk space as advertised by the involved SEs and the configured network channels. Channels are managed individually by transfer Agents. It is foreseeable that the tier topology will be enforced for transfers, i.e. there are no direct transfers possible between Tier0 and Tier2s, and inter-Tier2 transfers are only possible for the Tier2s ‘linked’ to the same Tier1. Otherwise the data will have an extra routed copy at the intermediate Tiers. For the HEP model, such a data flow optimizes already most of the usage.
GFD-I.122 Dec 12, 2007
Another optimization of the transfer may be achieved by selecting the best source for transfer if there are more than one replicas of a file available. Let’s call such an optimized transfer function getBestReplica. Its logic may be described as follows:
1. The actor calls the getBestReplica function, passing the logical name of the file it requires and the target site or SE.
2. getBestReplica locates all the replicas of the logical file by contacting the Replica Catalog. If the logical file already exists on the target SE, the function simply returns immediately.
3. getBestReplica calculates the total cost of making each replica available on the target SE, including transfer times
4. getBestReplica requests that the best replica be transferred to the target SE.
2.3.7 References
[EGEE] EGEE: Enabling Grids for E-science in Europe;
(http://egee-intranet.web.cern.ch/egee-intranet/gateway.html)
[DJRA1.1] Architecture and Planning, EGEE Project Deliverable DJRA1.1
(https://edms.cern.ch/document/476451/)
[LHC] The Large Hadron Collider Home Page (http://lhc.web.cern.ch/lhc/) [SRM] The Storage Resource Manager, work in progress, Grid Storage Management WG, GGF (http://www.ogf.org/gf/group_info/view.php?group=gsm-wg).

GFD-I.122 Dec 12, 2007
2.4 Emergency Medical Technician Application with Integrated Wireless Sensors
Contributor: Mark Gaynor (Boston University)
2.4.1 Use case summary and background
iRevive is an Emergency Medical Technician (EMT) application [INT,APP,IREV] with integrated real-time medical vital sign wireless sensors [RT,MON], allowing electronic Patient Care Records (PCRs) from the point of first patient contact.
Each iRevive patient has an attached real-time medical sensor that records vital sign data and also serves as a dynamic patient tag, allowing EMTs to record procedures performed on each patient. iRevive integrates the sensor data of each patient into the PCR for efficient and error free data entry, creating a more consistent and complete PCR. This sensor integration enables triaging of mass casualty events quickly.
Our application allows EMTs to use wireless handheld devices such as Personal Digital Assistants (PDAs), tablet PCs, or other experimental devices utilizing heads up display and voice activation technology. The application infrastructure is based on emerging health care standards such as XML encoded data following Health Level 7 [HLS] and the DEEDS database standards within a SOAP envelope (i.e. web services).
The two Grid applications in the above description are the interaction between the PDAs and the sensors, and the access to data, which needs to be accumulated, aggregated and stored. This use case will focus on the first type because of the unique requirements of the wireless sensors.
2.4.2 Customers
The primary users for this system are EMT teams in the field with patients. Secondary users are researchers that access data from aggregated PCRs in later data mining applications.
2.4.3 Scenario
The main actors are the EMTs with their PDAs and the patients with their real-time sensors with integrated GPS.
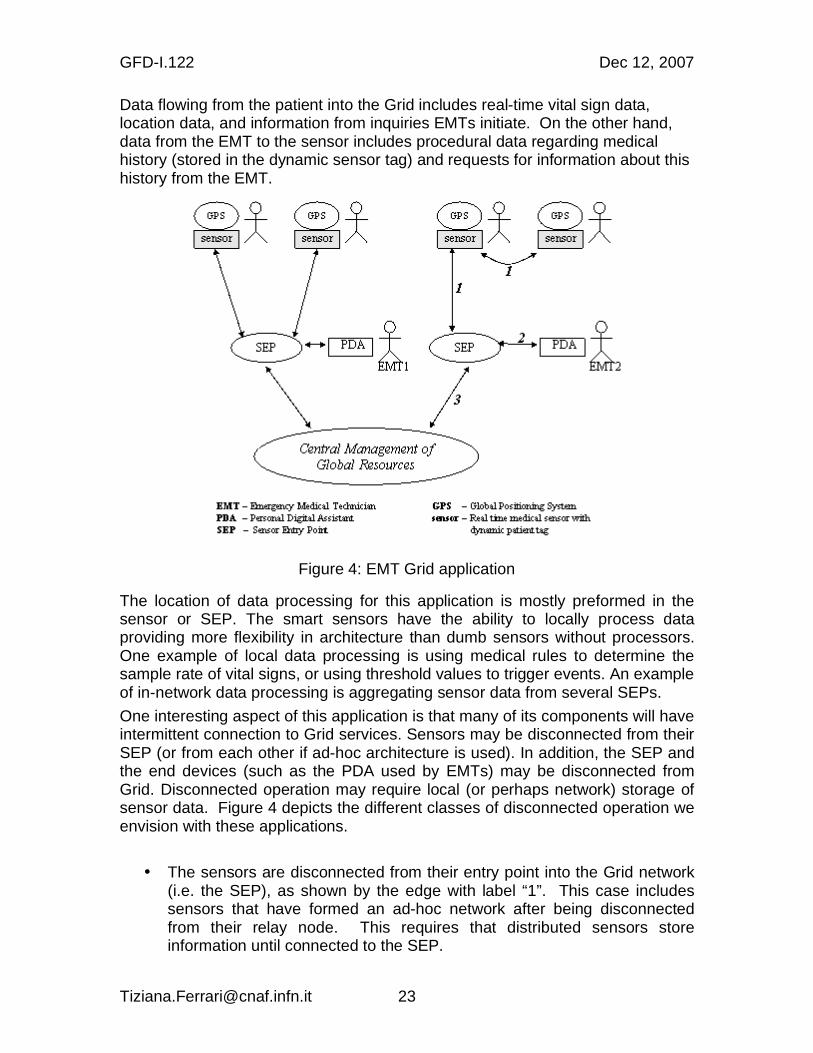
Figure 4 illustrates a simple scenario of iRevive along with the flow of data from sensors to applications and from applications to sensors. In this figure each EMT has a group of patients, and each patient has a real-time sensor relaying vital signs and location of the patient into the Grid infrastructure. A central database (which may be replicated by tradition methods) aggregates data from the distributed EMT teams, which can be seen as Grid nodes in a distributed data environment.
GFD-I.122 Dec 12, 2007
Data flowing from the patient into the Grid includes real-time vital sign data, location data, and information from inquiries EMTs initiate. On the other hand, data from the EMT to the sensor includes procedural data regarding medical history (stored in the dynamic sensor tag) and requests for information about this history from the EMT.
Figure 4: EMT Grid application
The location of data processing for this application is mostly preformed in the sensor or SEP. The smart sensors have the ability to locally process data providing more flexibility in architecture than dumb sensors without processors. One example of local data processing is using medical rules to determine the sample rate of vital signs, or using threshold values to trigger events. An example of in-network data processing is aggregating sensor data from several SEPs.
One interesting aspect of this application is that many of its components will have intermittent connection to Grid services. Sensors may be disconnected from their SEP (or from each other if ad-hoc architecture is used). In addition, the SEP and the end devices (such as the PDA used by EMTs) may be disconnected from Grid. Disconnected operation may require local (or perhaps network) storage of sensor data. Figure 4 depicts the different classes of disconnected operation we envision with these applications.
• The sensors are disconnected from their entry point into the Grid network (i.e. the SEP), as shown by the edge with label “1”. This case includes sensors that have formed an ad-hoc network after being disconnected from their relay node. This requires that distributed sensors store information until connected to the SEP.

GFD-I.122 Dec 12, 2007
• The EMT end device (a PDA in this example) is disconnected from the Grid (see edge “2”). This requires storage of data inside the Grid network infrastructure until the end devices are connected.
• The central database is disconnected from the SEP (edge “3”). The Grid infrastructure needs to store sensor data temporally until connectivity is restored, as in the previous case.
2.4.4 Involved resources
The resources involved in the scenario described above are:
• Grid services for the enforcement of the Quality of Service (QoS) requirements of the EMT application;
• Network storage.
2.4.5 Functional requirements
This use case requires the following network services:
• Network Resource Allocations Service: the EMT application may need the GRB to allocate bandwidth, latency, and packet loss rates.
• Network Security and AAA Service: data must be end-to-end encrypted. In addition, multi class authorization and secure authentication is required for the EMT application.
2.4.6 Service utilization
• The Data Grid needs to be searched to discover data availability.
• Reliable data transport needs to be provided by the network connecting the SEP and the EMT with a mobile wireless device.
• The EMT application requirements – expressed in terms of bandwidth, latency and packet loss rate – need to be guaranteed.
• Grid security is required, as specified in the Section below.
2.4.7 Security considerations
Medical applications require a multi-layered security architecture that meets (or exceeds) the High-Performance Parallel Interface standards. Our application utilizes a hierarchical structure including: end-to-end data encryption, authentication, and authorization. Traditional transport layer end-to-end encryption such as TLS and IP layer security (such as the IP Security Protocol [R2401]) is adequate.
Users are authenticated with traditional password technologies such that passwords are never transmitted over the network in plain text. The EMT application supports different authorization levels, including the following categories of data access: data that allow patient identification and aggregated data with identifying information hidden.
GFD-I.122 Dec 12, 2007
2.4.8 Performance considerations
Real-time vital sign data might be critical to proper care, so QoS is required for latency, packet loss rate and bandwidth. Different sensors and different applications will require different QoS profiles. Furthermore, QoS network requirements will be dynamic as conditions change. The monitoring of the pulse and blood oxygen levels in a patient is an example. When normal, these vital signs might have a slow sampling rate, but as sensors detect that the levels cross a normal threshold, network bandwidth and latency requirements increase because more frequent sampling is required as the data is more critical.
Different patients with different symptoms (and thus different sensors, i.e. maybe an ekg) have different QoS profiles that dynamically change along with the patients’ conditions. One important attribute of sensor networks is the tradeoff between CPU cycles and network bandwidth (between the sensors and SEP). In general, CPU cycles use less energy than sending bits, which implies data filtering and processing should sometimes be preformed on the sensors [G37].
The dynamic bandwidth is defined by the sampling rate of vital signs, and the data size of each sample. Pulse rates require at most 2 B to represent blood oxygen content, a percentage which can be represented in 2 B with .01 accuracy. Under normal conditions a reading every 60 seconds is adequate, however, the sampling rate will increase to once per second after a threshold event.
Acceptable levels of latency and packet loss rate are a current topic of research. We believe that latency in the one-second range, and moderate packet loss rate (%10 - %20) from sensor to SEP, are normally acceptable. In addition, not only does the packet loss rate depend on the sampling rate, but also on condition of the patient. For example, a non-critical patient with a high vital sign-sampling rate can accept a higher packet loss rate.
2.4.9 Use case situation analysis
An example of Grid EMT data management application is the National Health Spine in the United Kingdom. This 10-year contract awarded to BT to design a system that will manage electronic patient records.
2.4.10 References
[APP] Gaynor, M., Moulton, S, Welsh, M, Rowan, A, LaCombe, E, and Wynne, J.; Wireless Sensor Network Applications; in Proc. of the Americas Conference on Information Systems (AMCIS 2004), Aug 2004.
[G37] Sander, V.; Networking Issues for Grid Infrastructure; GFD.37, GGF, Nov 2004.
[INT] Gaynor, M., Welsh, M., Moulton, S., Rowan, A., LaCombe, E., and Wynne, J.;b Integrating Wireless Sensor Networks with the Grid. IEEE Internet Computing Journal, Jul/Aug 2004, pp. 32-39.
GFD-I.122 Dec 12, 2007
[IREV] Tollefsen, W, Myung, D, Gaynor, M, and Moulton, S. iRevive, a Pre-hospital Mobile Database; Int. Journal of Healthcare Technology Management (IJHTM), Summer 2004.
[MON] Welsh, M, Myung, D, Gaynor, M and Moulton, S.; Resuscitation Monitoring with a Wireless Sensor Network; poster, American Heart Association, Resuscitation Science Symposium. Circulation 108:1037, Supp. IV, Oct 2003.
[HLS] Health Level Seven (http://www.hl7.org/).
[R2401] Kent, S.; Atkinson, R.; Security Architecture for the Internet Protocol, RFC 2401, Nov 1998.
037, Supp. IV, Oct 2003.
[RT] Myung, D, Duncan, B, Malan, D, Welsh, M, Gaynor, M, and Moulton, S. Vital Dust; Wireless Sensors and a Sensor Network for Real-Time Patient Monitoring; poster, 8th Annual New England Regional Trauma Conference, Nov 2003, Burlington (MA).

GFD-I.122 Dec 12, 2007
2.5 Distributed Aircraft Maintenance Environment (DAME)
Contributors: Martyn Fletcher, Tom Jackson, Jim Austin (University of York)
2.5.1 Use case summary
The Distributed Aircraft Maintenance Environment (DAME) [Austin] provides a Grid-based, collaborative and interactive workbench of remote services and tools for use by human experts. It currently supports remote analysis of vibration and performance data by various geographically dispersed users: local engineers and remote experts. The diagnosis environment is built around a workflow system, and an extensive set of data analysis tools and services, which can provide automated diagnosis for known conditions. Where automated diagnosis is not possible DAME provides remote experts with a collaborative and interactive diagnosis and analysis environment.
2.5.2 Customers
The customers for the operational system are the primary actors: Maintenance Engineers, Maintenance Analysts and Domain Experts who use the system to assist in the analysis and diagnosis of engine conditions. The system is made up of applications performing the analysis (and requiring possible transport) of very large data sets on the order of terabytes from remote locations.
The DAME tools and services, which are used to provide diagnosis and prognosis of engine conditions, are the “network customers” and these include:
• Signal processing tools and services – to detect known conditions.
• Search tools and services – to allow the searching of historical fleet archives and current data archives for similar data amounting to terabytes of data.
• Case based reasoning tools and services – to provide advice based on symptoms and cases.
2.5.3 Scenarios
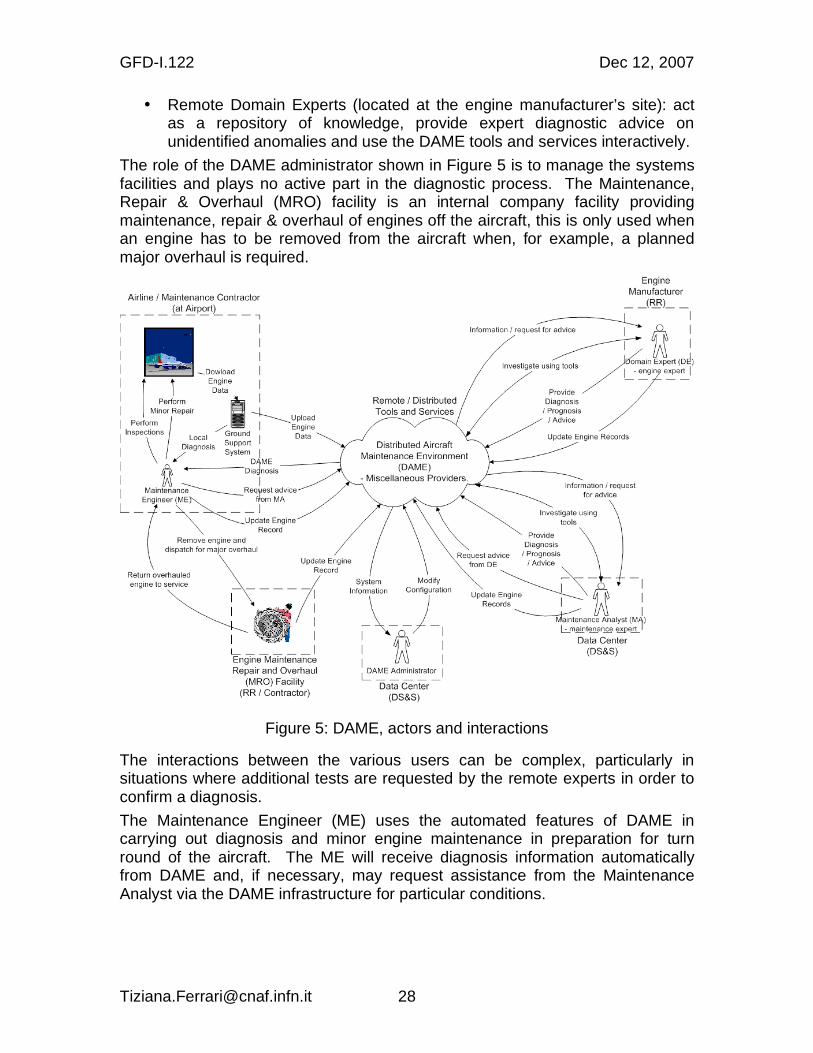
Figure 5 illustrates the actors and interactions with the system, which is shown as the cloud in the centre.
The diagnostic process includes the following actors:
• Maintenance Engineers (located at airports): carry out engine diagnosis and maintenance activities.
• Remote Maintenance Analysts (located at the data centre): provide technical advice, coordinate analysis and brokerage and use the DAME tools and services interactively.
GFD-I.122 Dec 12, 2007
• Remote Domain Experts (located at the engine manufacturer’s site): act as a repository of knowledge, provide expert diagnostic advice on unidentified anomalies and use the DAME tools and services interactively.
The role of the DAME administrator shown in Figure 5 is to manage the systems facilities and plays no active part in the diagnostic process. The Maintenance, Repair & Overhaul (MRO) facility is an internal company facility providing maintenance, repair & overhaul of engines off the aircraft, this is only used when an engine has to be removed from the aircraft when, for example, a planned major overhaul is required.
Figure 5: DAME, actors and interactions
The interactions between the various users can be complex, particularly in situations where additional tests are requested by the remote experts in order to confirm a diagnosis.
The Maintenance Engineer (ME) uses the automated features of DAME in carrying out diagnosis and minor engine maintenance in preparation for turn round of the aircraft. The ME will receive diagnosis information automatically from DAME and, if necessary, may request assistance from the Maintenance Analyst via the DAME infrastructure for particular conditions.

GFD-I.122 Dec 12, 2007
The Maintenance Analyst (MA) uses DAME tools and services interactively to determine the course of action and will inform the ME of the decision. If the MA desires he can refer the condition to the Domain Expert for further advice.
The Domain Expert (DE) uses DAME tools and services interactively to determine the course of action and will provide advice and informed decisions to the MA and ME.
An overview of the typical diagnostic scenario including escalation to the remote experts (Maintenance Analyst and possibly Domain Expert) is described below.
1. An aircraft lands and data from on-wing system (QUICK see [Nairac]), is automatically downloaded to the associated local Ground Support System (GSS).
2. QUICK and its GSS indicate whether any abnormality (this is a detected condition for which there is a known cause) or novelty (this is a detected deviation from normality for which there is currently no known cause) has been detected.
3. DAME executes an automatic workflow to determine its diagnosis. This is a standard pre-programmed diagnostic sequence.
4. Depending on the result of the QUICK and DAME automatic diagnoses there are three outcomes:
a. Everything is normal – the engine is ready for the next flight.
b. A condition, which has a known cause, has been detected. This can be resolved by immediate maintenance action or planned for future maintenance action, as appropriate.
c. A condition, which currently does not have a clear cause, has been detected or there is some ambiguity about the cause. This case is referred to the remote experts (a Maintenance Analyst and possible a Domain Expert) for consideration.
2.5.4 Involved resources
In the deployment of DAME, GridFTP may be used in the download of raw data.
The most intensive computing application is the use of the engine simulations – the number of simulations will depend eventually on the demands of the Domain Experts using the system.
All activities will all take place under control of the workflow system, which orchestrates the DAME services and tools and transfers data between them.
2.5.5 Functional requirements
Remote experts may want to consider and review the current data, search and review historical data in detail and run various tools including simulations and signal processing tools in order to evaluate a particular situation. Each aircraft flight can produce up to 1 Gigabyte of data per engine, which, when scaled to the fleet level, represents a collection rate of the order of terabytes of data per year. The storage of this data also requires vast data repositories that may be

GFD-I.122 Dec 12, 2007
distributed across many geographic and operational boundaries. DAME provides a diagnostic infrastructure to allow enhanced condition monitoring and diagnosis using geographically dispersed data, services and experts.
The significant requirements on the infrastructure are:
• The diagnostic processes require collaboration between Maintenance Engineers, Maintenance Analysts and Domain Experts from different organizations: airline, support contractors and engine manufacturer. These individuals are geographically dispersed and need to deploy a range of different engineering and computational tools to analyze the problem.
• To allow appropriate access by users to the data from the engine under consideration.
• To allow appropriate access by users to the terabytes of historical data from the engine under consideration and other similar engines.
• The ability to search the vast stores of historical vibration and performance data. Advanced pattern matching and data mining methods are used to search for matches to novel features detected in the vibration data. These services are able to operate on the large volumes of data and must be able to return the results in a time that meets operational demands.
• Provide signal processing and engine simulation tools using data from the engine or historical data.
• The diagnostic process must be completed in a timely and dependable manner commensurate with the turn round times of the aircraft.
The DAME system is advisory so the data and results transfer must be reliable and have integrity to be effective for the business case.
2.5.6 Security considerations
Elements of the raw data and data transferred between tools and services has confidentiality requirements which must be protected during transfer.
2.5.7 Performance considerations
Significant network scenarios are:
a. Download of raw engine data from the aircraft to the ground – this starts the automatic workflow for the DAME diagnosis for the Maintenance Engineer.
b. The movement of raw data to its store on the ground, for various reasons there are two options in early deployments:
a. Deployments where all data is moved to one centralised store. Potentially, tens of terabytes of data per day from a worldwide operation would eventually need to be transported over networks to the central store and data management centre. Here the raw data (high bandwidth) is effectively taken to the tools and services with
GFD-I.122 Dec 12, 2007
results (low bandwidth) being passed to the workflow system and then on to the geographically dispersed users.
b. Deployments where a distributed store (at the airports) would be used. Larger airport data stores would, potentially, need to store around 1TB per day, if all aircraft landing produced data, however the transfer would only take place over the local networks within the airport. Tools and services would be locally resident at the airport. Here the tools and services are taken to the raw data with results being passed back to a centralised workflow system and then to the geographically dispersed users.
All diagnoses and escalation through all experts must take place within the turn round time of the aircraft, this includes all executed workflow including all service execution and data transit times have to take place within the turn round time of the aircraft.
2.5.8 Use case situation analysis
The system has been developed with industrial customers (Rolls-Royce plc and Data Systems and Solutions LLC) and a proof of concept demonstrator produced. Industrial deployment with is now in progress as part of the BROADEN (Business Resource Optimization for Aftermarket and Design on Engineering Networks) project, this is a UK Department of Trade and Industry (DTI) Inter Enterprise Computing Technology Call Project.
2.5.9 Acknowledgements
This work was undertaken as part of the DAME project, with grateful assistance from Rolls-Royce plc, Data Systems & Solutions LLC and Cybula Ltd and the teams at the Universities of York, Leeds, Sheffield and Oxford. This research was supported by the UK Engineering and Physical Sciences Research Council (Grant GR/R67668/01) and through contributions from Rolls-Royce plc, and Data Systems and Solutions LLC.
2.5.10 References
[Austin] Austin, Jackson, et al, Chapter 5, Predictive Maintenance: Distributed Aircraft Engine Diagnostics, in The Grid: 2nd Edition, edited by Ian Foster and Carl Kesselman. MKP/Elsevier , Oct 2003.
[Nairac] Nairac A, Townsend N, Carr R, King S, Cowley P, Tarassenko L. A system for the analysis of jet engine vibration data; Integrated Computer-Aided Engineering, 53-65, 1999.
GFD-I.122 Dec 12, 2007
2.6 Networked Supercomputing
Contributors: Peter Tomsu (Cisco Corporate Consulting)
2.6.1 Use case summary and background
Many enterprises use High Performance Compute (HPC) clusters to run commercial HPC applications in order to increase the enterprise’s profitability and competitiveness. These applications offer significant advantages, especially considering the amount of time saved to generate results, as this may reduce the risk of development, or enable investments to be better aligned and spent, or reduce products to market time [Phillips06-HPC].
While the use of these parallel HPC applications usually starts in a single data center with local networked supercomputing, a clear trend can be seen today towards operating distributed data centers, which then requires the appropriate WAN technologies to support networked supercomputing in a distributed way. We will concentrate on this use case to describe the needs for local, as well as distributed high performance computing and thus understand networked supercomputing as covering both: the local and the distributed implementations.
Traditionally, HPC applications have been running on monolithic supercomputers, which have been prohibitively expensive for many companies to acquire and operate. A recent development that uses very similar ideas as traditional supercomputing is HPC clusters. HPC clusters are made up of multiple (sometimes many thousands) industry-standard computers that use cluster software and high-performance network interconnects to run parallel applications at a fraction of the cost of traditional supercomputers. A key element of HPC clusters is the network: the local area and the wide area network (see Figure 6).
For the local aspects of parallel computing, the ability to exchange messages with other nodes within the cluster – referred to as Inter Process Communications (IPC) – is paramount. This requires a high-performance local
network to allow these exchanges. In the context of HPC, end-to-end message latency is a key metric in determining the efficiency of a particular technology. In
this context, message latency is defined as the time it takes to transfer a single zero-payload message from one processor to another processor, and includes all elements within the transmission path: communications stack latency,
interface card latency, serialization delay, network switching latency, etc.
However, other communications are required within the HPC cluster, such as how files are accessed and managed, that are often overlooked. Additionally, HPC applications have differing requirements such as how frequently and how much data is exchanged during execution of the application. Understanding these requirements is critical when choosing a particular HPC solution.
Depending upon the application, HPCs can be divided into three sub-categories:

GFD-I.122 Dec 12, 2007
• Parametric execution - Parametric execution is used for applications that cannot be parallelized, and consequently the application runs on a single compute node. What parametric execution leverages is that, although the application cannot share information between nodes, if different input data is sent to different nodes running the same application, the nodes can compute their information in parallel, thereby speeding up the operation. As parametric execution does not exchange messages between nodes, a parametric execution HPC cluster is latency insensitive, but may be bandwidth intensive depending upon the application.
• Loosely coupled applications - Loosely coupled applications require minimal interaction with other cluster nodes, as they can perform the entire computation autonomously. Loosely coupled clusters are generally latency insensitive and CPU intensive, and require moderate to high bandwidth network interconnects. Other commonly encountered classifications are massively parallel, embarrassingly parallel and nearly embarrassingly parallel. These applications share the much same characteristics as loosely coupled applications, although there are variations on sensitivity to latency and bandwidth consumed.
• Tightly coupled applications - Tightly coupled applications require information to be periodically exchanged with other nodes (either all nodes or subsets of nodes) in the form of messages. Tightly couple applications are generally latency sensitive and CPU intensive, and generate bursty, unpredictable traffic patterns as data is exchanged. Because time spent communicating is time spent not processing data, tightly coupled applications require low latency and high bandwidth network interconnects.
For the wide area aspects of networked supercomputing, it is important what needs to be achieved by distributed HPC clusters. This can start from simple backup data centers and range towards distributing the processing power for HPC applications. If application distribution is intended, then it becomes even more important to manage data exchange during execution, and which scheduling and network control mechanisms to use. Furthermore, the adoption of existing protocol stacks to high performance networking is crucial, most important to mention new versions of TCP for high performance networking [Hassan] or High Speed TCP (HSTCP) [UCL].
2.6.2 Customers
Many enterprises are looking towards GRID computing to enable sharing of information, such as part of an extended supply chain management, or for research and development purposes. In this context, Grid is often associated with utility computing, where compute resources can be scaled-up or down according to demand, and where compute power can be purchased on a per-CPU, per-hour basis. Grids are also associated with scavenger-type applications such as Folding@home and Seti@home, which use spare CPU cycles on distributed PCs to perform computations. The distribution of this processing

GFD-I.122 Dec 12, 2007
power over wide area networks adds an additional dimension for control of networked supercomputing.
2.6.3 Scenarios
Historically HPC applications have run on monolithic supercomputers prohibitively expensive to all but a few enterprises or well funded government projects. On the other hand, HPC clusters, that utilize industry-standard computers interconnected using a standards-based network, have radically changed the economics of supercomputing. Most supercomputers consist of a number of processors, memory and input/output (I/O) interfaces interconnected using a proprietary backplane and proprietary operating systems, to enable execution of computationally demanding applications. HPC clusters utilize much the same principles as supercomputers to execute the same applications with the exception that they utilize cost-effective industry standard components to provide scalable supercomputer performance.
HPC clusters are an evolution of the federation concept in which the processor nodes are industry-standard servers interconnected using a standards-based, high-performance network and communications protocols (see Figure 6). A key aspect of HPC performance is the characteristics and performance of the network that provides communications between nodes and resources within the HPC cluster located in a data center (physically the same site).
This can be further extended by distributing these data centers to different remote locations either within a city, a metro area, a country or even worldwide. It is very important to keep in mind that especially the used WAN network technologies have to be optimized for the application’s bandwidth, delay and performance requirements we already discussed earlier. Today there are multiple transport formats, which can be combined like DWDM, SONET/SDH, G.709, FCIP, Metro Ethernet and the according control plane, most likely GMPLS or extensions to standards based GMPLS, in order to accommodate Grid applications needs.
At the heart of HPC clusters is the network – the local area network in the data center, as well as the wide area network to connect remote data centers [Bell]. HPC applications use the concept of message passing to exchange information between nodes in the data center during the computation of a problem. To facilitate this exchange between the processors, a high performance network fabric is required to reduce communications delay and facilitate large volumes of data movement. For many applications, Gigabit Ethernet is a good choice for IPC network connectivity, as it is relatively inexpensive high-speed network technology.
As the HPC environment grows or if applications that require ultra-low latency IPC are deployed, InfiniBand technology [Phillips06-IB] that offers high density 10 Gb/s, very low latency switching becomes a viable technology.

GFD-I.122 Dec 12, 2007
Whether this message passing in some cases would be also appropriate via the WAN needs to be further investigated, today’s applications do this inside the data center.
Figure 6: Evolution from supercomputer via HPC towards networked supercomputing via WAN
2.6.4 Involved resources
Within HPC, each node within the cluster needs to be able to communicate with different resources (storage, for example) and to other nodes for control and inter-process communications. Generically, communications within a cluster can be broken down into four operations (see also Figure 7): • Access network – The access network provides user access to the cluster to
allow job scheduling and viewing of graphical data. It may also provide connectivity to remote resources such as Network Attached Storage (NAS) or other clusters within the context of a Grid.
• Management network – The management network is the clusters command
and control network that enables the master node to schedule, start, checkpoint, and stop work that is executed on the cluster. It also allows the nodes to be monitored for troubleshooting purposes.
• Storage or I/O network – In most HPC environments the cluster nodes
download data from an external NAS or Storage Area Network (SAN) into their local disk and then perform the necessary calculations before writing the result back to the NAS or SAN. This requires high-speed access between the NAS/SAN systems and the cluster nodes.
• IPC network – The IPC network provides high speed connectivity between
cluster nodes such that IPC messages can be exchanged. Because the IPC
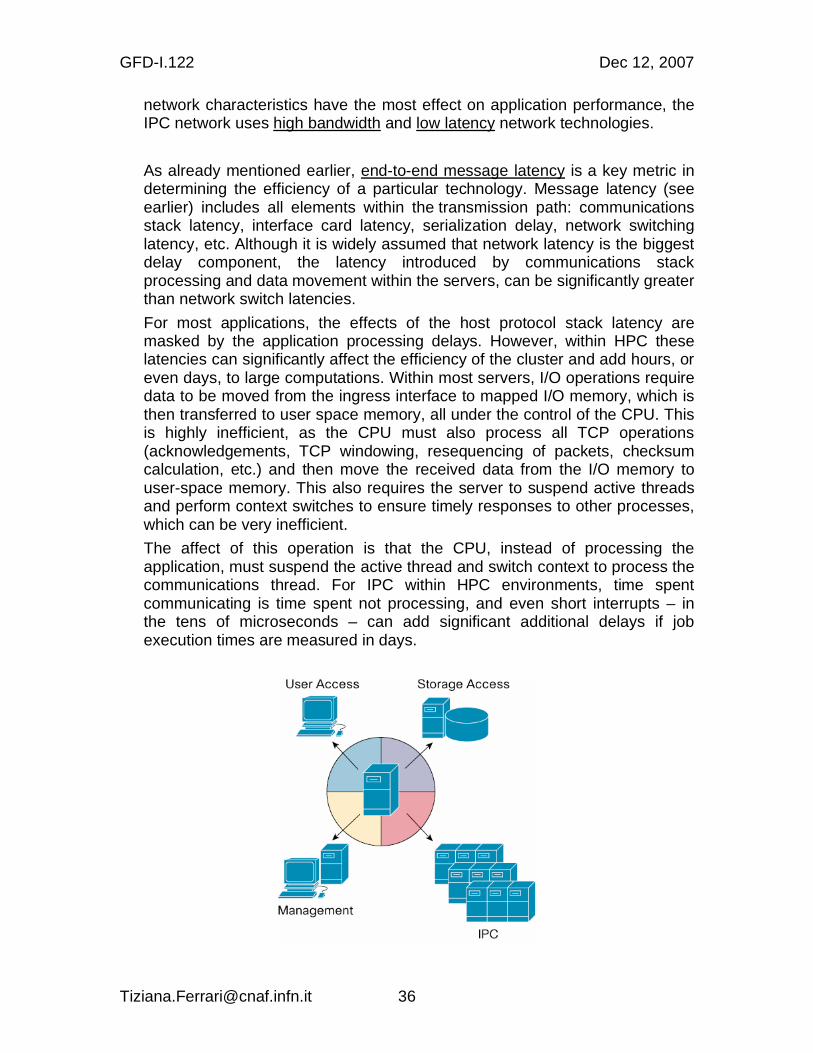
GFD-I.122 Dec 12, 2007
network characteristics have the most effect on application performance, the IPC network uses high bandwidth and low latency network technologies.
As already mentioned earlier, end-to-end message latency is a key metric in determining the efficiency of a particular technology. Message latency (see earlier) includes all elements within the transmission path: communications stack latency, interface card latency, serialization delay, network switching latency, etc. Although it is widely assumed that network latency is the biggest delay component, the latency introduced by communications stack processing and data movement within the servers, can be significantly greater than network switch latencies.
For most applications, the effects of the host protocol stack latency are masked by the application processing delays. However, within HPC these latencies can significantly affect the efficiency of the cluster and add hours, or even days, to large computations. Within most servers, I/O operations require data to be moved from the ingress interface to mapped I/O memory, which is then transferred to user space memory, all under the control of the CPU. This is highly inefficient, as the CPU must also process all TCP operations (acknowledgements, TCP windowing, resequencing of packets, checksum calculation, etc.) and then move the received data from the I/O memory to user-space memory. This also requires the server to suspend active threads and perform context switches to ensure timely responses to other processes, which can be very inefficient.
The affect of this operation is that the CPU, instead of processing the application, must suspend the active thread and switch context to process the communications thread. For IPC within HPC environments, time spent communicating is time spent not processing, and even short interrupts – in the tens of microseconds – can add significant additional delays if job execution times are measured in days.
GFD-I.122 Dec 12, 2007
Figure 7: Connections in HPC
2.6.5 Functional requirements 1. Access Network - The I/O network provides access to and from resources
that are external to the HPC cluster nodes. Within HPC, typically only the master or head node communicates with an external user. All other nodes are slave nodes controlled and managed by the master node.
The programming interface for the master node is typically based upon a remote shell command line environment using Telnet, SSH, or other, to initiate a particular job. Although the management access protocols (SSH, etc.) only consume a few kbit/s of bandwidth, other connectivity requirements may require higher bandwidth. For Grid applications, where multicluster jobs are executed (multiclaster jobs are distributed over several HPC clusters either locally or remotely), depending upon the design of the Message Passing Interface (MPI) collectives, slave nodes may be required to communicate with other nodes in remote clusters. Additionally, if graphical, real-time representation of the data is required, considerable bandwidth may be consumed.
The overriding characteristic of the access network is that the resources accessing the cluster, or being accessed by the cluster, may be geographically remote and, although bandwidth may be a consideration, low latency typically is not required. However, as external, potentially untrusted, devices may be accessing the cluster, security, QoS and availability become considerations, as they directly impact the user’s experience of the “service”.
Given these attributes, Gigabit Ethernet and TCP/IP are ideal candidates for access network connectivity as they provide high bandwidth, ubiquitous transport that supports robust services such as QoS, security, and IP multicast.
2. Management Network - The management network provides communication
between the master and slave nodes, which enable the master node to determine the operational status of the slave nodes, schedule work for the slaves, and start, checkpoint, and stop jobs as necessary.
The management network also provides mechanisms whereby each node can periodically report its health and operational status to the master node using heartbeat messages. Many management tools are available (e.g., Platform Rocks, Ganglia, Scali’s Manage, and IBM’s cluster systems management and extreme cluster administration toolkit).
The overriding characteristics of the management network are that the resources being accessed are generally local to the cluster and neither high bandwidth nor low latency is a consideration, and a degree of over-subscription can be tolerated. Given these attributes, Gigabit Ethernet and IP are ideal candidates for access network connectivity. Additionally, IP Multicast may be a requirement, if IP multicast is used for reporting statistics to a
GFD-I.122 Dec 12, 2007
master node (given the topology between a master node with many attached slave nodes).
System management software products (like Cisco’s VFrame), which create virtual “compute services” by programming and coordinating a fabric of server switches, help to manage HPC network environments. A server switch is a new class of data center infrastructure that provides a platform to interconnect discrete server resources together into a high performance fabric, and to connect that server fabric with shared pools of I/O and storage resources.
When those resources are mapped together, it creates a virtual “compute service”. Similar to how a VLAN operates in the Ethernet world today, a compute service groups physical servers, storage resources, and IP resources into resource pools. Provisioning of these compute services is guaranteed based on any number of criteria, including: business application, time-of-day, required compute power, or standby servers for higher availability.
3. Storage Network - The storage network provides access to the data that is to be computed by the master and slave nodes within the HPC cluster. Within HPC, there are several strategies that may be employed with respect to how data is stored and accessed by the HPC nodes.
At the lowest level, data may be accessed in one of two ways: at the file level using an external file system (commonly referred to as NAS), or at the block level (using either Direct Attached Storage – DAS, which includes the server physical hard drive, or Storage Area Network – SAN) using either Fibre Channel or InfiniBand attached storage using the SCSI or SCSI RDMA Protocol (SRP) respectively.
File access is familiar to most people and is relatively simple. A user of an application requests a particular file from a NAS. The NAS is responsible for retrieving files, file locking, and determining where the file is saved to on the physical hard disks. By contrast, block-level storage requires the application to manage where the file is physically stored on the hard disks. Most applications use file access and file managers to manage how the files are saved to hard drive. For example, desktop applications such as Microsoft Word save files using a meaningful name and the Windows operating system NTFS writes the file to the physical disk.
Block-level access is used for DAS and SAN attached storage using SCSI as an access protocol. Block-level access can achieve higher transaction rates that are typical in decision support systems (databases) clusters, but can present problems with file security and locking, and making the file content available to other nodes.
Although Fibre Channel is the most widely deployed SAN technology, it is not commonly implemented on the HPC cluster slave nodes as it requires another interface type to be supported, which may require larger servers to accommodate the Fibre Channel Host Bus Adapter (HBA).

GFD-I.122 Dec 12, 2007
Block access can also used to access InfiniBand storage using SRP. InfiniBand-attached storage allows high speed block access to by providing significant advantages for transactional applications, such as database clusters. Another option for block level access to remote storage is to use iSCSI over IP, although this has not been widely adopted.
By contrast, file-level access enables an application to simply request a file, (or sub-set of a file) from the NAS, which then returns the file to the
requestor. This is a simpler model for application developers, as the application does not need to manage how data is written to the storage disk arrays and simplifies file sharing, locking and secure file access. NAS can
also be used as a consolidation point for file storage and can be deployed with different storage redundancy options, such as RAID, to provide data protection and disaster recovery. NAS also provides a central point at which
files can be managed to provide archival services, in the event that data needs to be retrieved for future analysis. Another advantage is that because NAS protocols are based upon IP, the file system can be placed anywhere
within the network.
However, if a large number of HPC nodes are accessing the NAS, this can present a significant problem in terms of data input/output (I/O) and bandwidth, if large volumes of data are required to be served. To enable the I/O throughput of the NAS to be scaled several strategies may be employed.
One solution is to utilize multiple NAS I/O interfaces (or I/O nodes) and load-balancing techniques to improve performance. Another solution is the use of parallel file systems. Using parallel file system, the file data (which may be in the order of PB) is broken down into discrete chunks and distributed across a number of servers called I/O nodes.
A meta-data server manages the distribution and location of the chunks, and also manages data redundancy by striping the data across multiple disks. When a file is requested, the meta-data server respond with the location of the file and the requestor then reads the file from the location specified within the response. Parallel file systems provide a relatively low-cost, high throughput file sharing solution for HPC and non-HPC file systems by using multiple standards-based servers as I/O nodes. Although NFS is widely used for NAS access, many HPC clusters utilize parallel file systems such as parallel virtual file system (PVFS), IBM's general parallel file system (GPFS), Lustre, or iBrix to scale storage I/O performance.
Although it is fairly simple to characterize the access and management networks, the storage network presents a large number of choices that, depending upon the application, requires different solutions. Consequently, the choice of network technology can only be made in the context of understanding the application requirements. In this respect, InfiniBand, Ethernet, and Fiber Channel may all play a role as part of an HPC storage solution as either access technologies, or as part of a NAS or SAN solution.
The most common HPC storage solution is NAS that may be accessed by the HPC nodes across the management network or using a dedicated Ethernet
GFD-I.122 Dec 12, 2007
interface. The NAS in itself may implement a SAN, using Fibre Channel to manage disk attachment, although this is entirely transparent to the HPC nodes.
Fiber Channel is the most widely adopted SAN network fabric due to the maturity of the products and broad industry support. InfiniBand attached storage is a relatively new product offering that delivers high-speed access to disk resources that is well suited to high-performance file servers and database clusters.
4. Inter Process Communication Network - The IPC network provides the
connectivity required to transfer information between the HPC cluster nodes during run time. The amount of information transferred between the nodes using messages in terms of bandwidth and frequency is entirely dependant upon the application type and the application communication patterns (see loosely coupled and tightly coupled applications we already discussed).
Having a good understanding of the application traffic patterns, and how those patterns may be affected by using a different message-passing model, can change the choice of IPC technology, over-subscription rates, and the design of the IPC network. In the context of HPC, end-to-end message latency is a key metric in determining the efficiency of a particular technology.
2.6.6 Security considerations
Appropriate management and virtualization software will ensure no unauthorized modifications and attacks to the HPC networking services.
2.6.7 Performance considerations
The choice of network to meet the application requirements for access, management, storage, and IPC are ultimately dictated by performance. Of real interest to the HPC user is the time to complete a particular operation, the efficiency of the cluster nodes, and the required time to completion. However, if a user is able to accept slightly lower CPU efficiency, or slightly longer run times, then different decisions can be made with respect to technology.
As an example, for loosely coupled applications Gigabit Ethernet is a good IPC network solution, albeit at a slightly lower CPU efficiency than InfiniBand, caused by slightly higher network switching delays (1 Gbit/s vs. 10 Gbit/s serialization). As a hypothetical example, if 32 nodes using InfiniBand as an IPC network complete a computation in four hours, but would require 36 nodes to complete the same computation in the same time using Gigabit Ethernet as an IPC network, this may be an acceptable trade off in terms of cost, ease of use, and familiarity to the user.
However, if a computation ran for 12 hours on 1024 InfiniBand attached nodes and required an additional 400 nodes to complete the same computation using a Gigabit Ethernet IPC network, the additional cost in terms of compute nodes and attendant power and cooling may outweigh the cost benefits of Ethernet.

GFD-I.122 Dec 12, 2007
An additional consideration is the size of the cluster. If the HPC cluster is small, a single Ethernet switch may be adequate to support the performance and connectivity requirements required for a particular application. For larger clusters, separate network interfaces and networks may be required to meet the performance required by the application and business requirements. Ultimately, HPC cluster technology design decisions are based upon the performance required for particular HPC applications.
2.6.8 Use case situation analysis
The network is a critical component of HPC. Although HPC design is often focused on the requirements for the IPC component of the HPC cluster, other connectivity must be taken into consideration such as storage, management and user access. Additionally, as HPC has now moved into mainstream enterprise deployments, considerations such as the security, scalability and availability of the HPC network components must all be considered.
2.6.9 References
[Bell] An Evaluation of Current High Performance Networks, Computational Research Division, Lawrence Berkeley National Laboratory, Computer Science Division, University of California at Berkeley (http://upc.lbl.gov/).
[Hassan] Hassan, M.; Jain, R.; High Performance TCP/IP Networking: Concepts, Issues and Solutions, Prentice Hall, 2003, ISBN: 0130646342.
[Phillips06-HPC] HPC Networking: The Foundation for Networked Supercomputers, Cisco White Paper Public, (http://www.cisco.com/application/pdf/en/us/guest/products/ps6421/c1244/cdccont_0900aecd8043bb6c.pdf).
[Phillips06-IB] Understanding Infiniband, Cisco White Paper Public, (http://www.cisco.com/application/pdf/en/us/guest/products/ps6421/c1244/cdccont_0900aecd8043ba1d.pdf).
[Sloan06] Network Virtualization Solutions, Cisco White Paper Public.
[UCL] High Speed TCP (http://www.hep.ucl.ac.uk/~ytl/tcpip/highspeedtcp/hstcp/index.html).

GFD-I.122 Dec 12, 2007
2.7 Very Long Baseline Interferometry
Contributors: Richard Hughes-Jones (University of Manchester), Mattew Strong, Ralph Spencer (Jodrell Bank Observatory)
2.7.1 Use case summary and background
The detail with which celestial objects can be studied, is limited by both sensitivity and angular resolution. In radio astronomy the atmosphere does not limit the resolution, and the use of stable atomic clocks means that signals can be added coherently even if received by telescopes separated by the size of the Earth. Very Long Baseline Interferometry (VLBI) is an aperture synthesis technique that utilizes radio telescopes from around the world, to combine astronomical data in order to achieve high angular resolution observations. The telescopes observe the same cosmic radio source simultaneously, and currently the data and the time from the atomic clocks are recorded on magnetic tapes or disk packs. After shipment, these magnetic tapes or disk packs are then replayed at the correlator, and the data processed.
The interferometer technique allows signals to be multiplied together from each pair of telescopes to give Fourier components. These can be transformed, and non-linear algorithms applied to produce images of the sky enabling study of the angular structure of radio sources at resolutions better than a millarcsecond. Typically around 10 telescopes are used so that a range of baselines is obtained and hence there is a good coverage of Fourier components. In addition, accurate positions of the telescopes can be obtained with respect to the celestial sphere, and this is used in geodesy and Earth rotation studies.
Coherence at each telescope is maintained by atomic hydrogen maser clocks accurate to 1 part in 1015. The Global Positioning System (GPS) of satellites is used to give absolute timing to an accuracy of 100 ns, and more accurate timing comes from the astronomical data set itself.
The sensitivity, or signal to noise ratio, is proportional to B where B is the
bandwidth and the integration time, and all state-of-the-art observations are noise limited. Bandwidths of several hundred MHz are now in common use in modern telescopes. Multi-bit sampling at the Nyquist rate can therefore give user data rates of 1 Gbit/s or higher.
With the emergence of affordable high data rate national and international links the VLBI community is beginning to transfer astronomical data via the academic Internet [HDRT]. Science data is being regularly transmitted at rates up to 256 Mbit/s with special tests operating at 512 Mbit/s of user data. However, as Radio Telescopes are deliberately located at remote sites to reduce the radio interference, installation of high speed links to the telescope can sometimes be difficult.
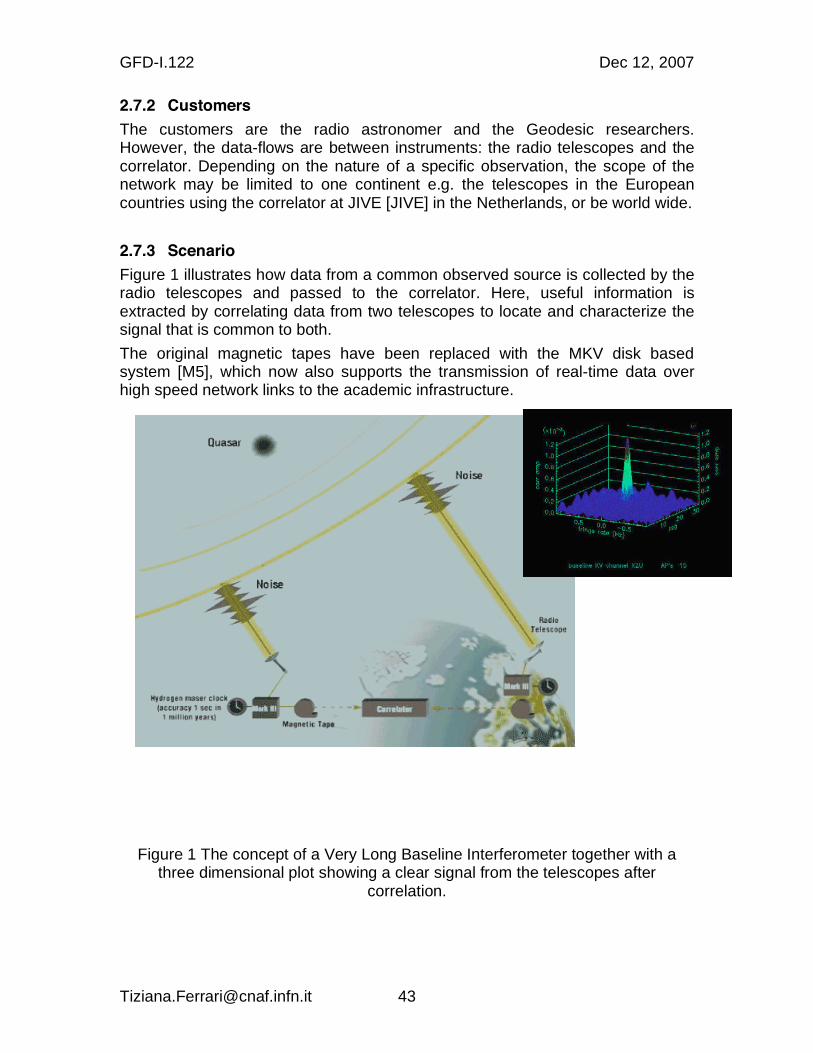
GFD-I.122 Dec 12, 2007
2.7.2 Customers
The customers are the radio astronomer and the Geodesic researchers. However, the data-flows are between instruments: the radio telescopes and the correlator. Depending on the nature of a specific observation, the scope of the network may be limited to one continent e.g. the telescopes in the European countries using the correlator at JIVE [JIVE] in the Netherlands, or be world wide.
2.7.3 Scenario
Figure 1 illustrates how data from a common observed source is collected by the radio telescopes and passed to the correlator. Here, useful information is extracted by correlating data from two telescopes to locate and characterize the signal that is common to both.
The original magnetic tapes have been replaced with the MKV disk based system [M5], which now also supports the transmission of real-time data over high speed network links to the academic infrastructure.
Figure 1 The concept of a Very Long Baseline Interferometer together with a three dimensional plot showing a clear signal from the telescopes after
correlation.

GFD-I.122 Dec 12, 2007
2.7.4 Involved resources
Figure 2 illustrates the European radio telescopes linked to the correlator at JIVE using the National Research Networks of each country and GEANT2, the European research network backbone. These instruments and infrastructure are typical of e-VLBI systems around the world.
Figure 2. The European e-VLBI network.
2.7.5 Functional requirements
Data Transfer Network Requirements
The e-VLBI data transmission requirements are very specific, and they apply to the network infrastructure and also determine whether a transmission protocol is suitable or not. In addition to this, it is desirable that the protocol should leave enough flexibility for extensions to the system in the future. Currently TCP/IP is in common use, UDP/IP is being tested for real-time streaming, and it is planed to test DCCP/IP. The following points detail the requirements of a transmission systems and protocol for use with moving e-VLBI data in real-time [PROT]:
1. Fast transport (>0.5 Gbit/s) through long, large capacity networks. The network may be shared with other users or use an Optical Private Network.
2. Fairly reliable transmission. Although e-VLBI can operate with some packet loss, this is thought to be at the 2% level from theoretical calculations [PLOSS] for the current systems. In order for the correlator to
GFD-I.122 Dec 12, 2007
maintain synchronization of the data from the two telescopes, it depends on receiving time stamps from headers in the application data stream.
3. The network transfer rates are controlled by the application, the data arrives from the telescope at a constant bit rate.
4. Bounded latency. One way delay for link (jitter) should remain constant ensuring timely delivery of data.
5. Bit wise correct data. Data which arrive should be bit wise correct.
6. Lost packets must be detected by the receiver and reported to the application.
7. Low re-ordering such that data can be placed in the correct order in a simple manner by the application in the receiver.
8. Packet duplication must be minimal.
9. For distributed correlation on Grid systems there is the requirement to send the same portion of data from a given telescope to different remote nodes. For example, a given compute node may only correlate one pair of telescopes.
10. It must be possible to monitor and test the network before any astronomical experiment takes place to ensure good connectivity during the experiment
User Access Network Requirements The results of the correlation process need to be accessed by different researchers world wide. Normally this access would use the standard packet- switched academic network. Conventional tools such as scp are used and operate over TCP/IP.
2.7.6 Service utilization
The current MkV software can either record data on local disk sub-systems or stream the data in real time to the correlator using TCP/IP. When using the current Academic network or the UKLight switched light-paths, at low data rates, such as 128, or 256 Mbit/s, real time data streaming works well, however at higher rates there are frequent difficulties with the correlation loosing synchronization. With data recorded on the local disk sub-systems, the disk pack can be physically transferred to the correlator lab or the data can be read back and sent using TCP/IP to a disk sub-system at the correlator. Often these ‘offline’ data transfer rates are much lower than expected.
The MERLIN set of Radio Telescopes in the UK is now being upgraded to eMERLIN by connecting the telescopes to a new correlator at Jodrell Bank at 30 Gbit/s using three 10 Gbit channels over dark fibre links. To ensure low cost, this work is using proprietary transmitters, receivers and amplifiers to drive the WAN links; for these point to point links, the add-drop facilities of SDH systems are not required.

GFD-I.122 Dec 12, 2007
The European Union FABRIC project aims to demonstrate data transmission at 4 Gbit/s over an Optical Private Network constructed from the new switched lightpath services being offered by Dante and the National Research Networks. The linked EXPReS project will demonstrate high rate data flows from selected European telescopes to the correlator at JIVE as well as investigated the possibility of using Grid computing for correlation.
With the above projects work is in progress to develop a more effective VLBI data block (called a VLBI frame). For example one could use jumbo Ethernet frames with each jumbo frame containing its own VLBI maser timestamp. In this case all Ethernet frames are equivalent, and there is no need to be concerned about loosing synchronization of the correlator.
The MkVB program at Haystack has developed new PC hardware that should be capable of reliable transmissions at 512 Mbit/s and 1 Gbit/s over the academic network.
2.7.7 Performance considerations
Unlike most other users of digital recorders, in VLBI the value of a single bit is negligible. The signal collected by the telescopes is broadband Gaussian noise. Useful information is extracted by correlating data from two telescopes to locate and characterize the signal that is common to both. This is revealed after averaging over many millions of samples, often effectively for 12 hours or more.
Errors in the data from one antenna are thus eliminated in the process. Error rates or packet loss can therefore be high by normal communication standards, at 1 in 105 bits or even occasionally 1 in 104. Precise timing is of far greater importance however. The detailed structure and location of the radio source can only be deduced with a precise knowledge of the geometry of the antenna array relative to the celestial sphere. Where the telescopes were when each sample was collected is of vital importance. Time information is therefore recorded with the astronomical data and steps are taken to ensure its accuracy.
The very nature of the Earth rotation synthesis technique requires the observations on each source to last several hours. Data are recorded continuously over each session (i.e. weeks) except for short breaks for tape changes, telescope slewing and receiver changes. The total amount of data processed per session can be up to 1015 bits. This is reduced by the correlator and subsequent processing to an image of a radio source of a few 100 MB for perhaps every 8 hours of observation.
As mentioned above, the structure or format of the VLBI data is the same as that required for the old tape systems. Each VLBI frame contains data from one sampled frequency band together with a header containing the related time stamp. Typically 32 frequency bands are recorded simultaneously which means that a set of VLBI headers occur about every 53 standard 1500 B MTU Ethernet frames. Thus if UDP/IP is being used, it is important to know that an Ethernet
GFD-I.122 Dec 12, 2007
frame has been lost to allow the application to keep the data from each telescope in step.
2.7.8 Security considerations
The VLBI real-time data does not have any security requirements. Appropriate system management of the operating system and application software will ensure no unauthorized access and reduce denial of service attacks.
2.7.9 References
[HDRT] High Data Rate Transmission in High Resolution Radio Astronomy, Hughes-Jones, R.; Parsley, S.; Spencer, R.; FGCS Special Issue: IGRID2002 Vol 19 (2003) No 6.
[JIVE] Very Long Baseline Interferometry in Europe (http://www.jive.nl/)
[M5] Mark 5 disk-based gbps vlbi data system, Whitney, A. (http://web.haystack.mit.edu/mark5/paper.pdf)
[PROT] Protocol Investigation for eVLBI Data Transfer; Strong, M.; Spencer, R.; Hughes-Jones, R.; Casey, S.; EXPReS/FABRIC Strategic Document: FABRIC-1.2.1.001v1 for EU Project Number 026642, May 2006
[PLOSS] Packet Loss in High Data Rate Internet Data Transfer for eVLBI,; Spencer, R.; Hughes-Jones, R.; Mathews, A.; O’Toole, S.; in Proc. of the 7th European VLBI Network Symposium, Toledo (Spain), Oct 2004

GFD-I.122 Dec 12, 2007
3. Knowledge-based use cases
This section includes use cases that are about the collection and usage of network performance information. In what follows we illustrated in detail the various use cases.
3.1 Passively Monitored Data
Contributors: Mark J. Leese (Daresbury Laboratory), Paul D. Mealor
3.1.1 Use case summary
Administrative personnel require real data from network components for monitoring purposes; administrators must be confident that the performance they see is that experienced by Grid users.
3.1.2 Customers
Administrative personnel are the only group likely to specifically require passively monitored data. Other clients (such as middleware or users) specifically do not require that information comes from any particular source, as long as it is reliable.
3.1.3 Scenarios
Characterization of file-transfer usage
An administrator wishes to characterize file transfer usage at his site. He requires statistical summaries of the targets and sources of transfers and the size of files transferred.
Early warning fault detection
1) An administrator runs software which will warn him if users (Grid jobs) start to experience poor performance.
2) That software runs as a background process. It subscribes to listen to transfer rate statistics taken from real use of file transfer software; ideally it only needs to listen to changes in the statistics, and it only needs to listen for information that directly involve resources at the administrator’s site.
3) The software will notify the administrator by email when performance (which may be based on one or more metrics) for a significant number of users’ transfers drops below a certain threshold.
GFD-I.122 Dec 12, 2007
4) Once the administrator has been notified of problems, he needs to be able to track down exactly where the faults lie. As a first step, this could involve discovering which particular resources are involved in the poor performance.
3.1.4 Involved resources
All CEs and SEs can produce information.
3.1.5 Functional requirements
Clients must be able to discover what passively monitored information is available. For other use-cases in this document, the monitoring information need only be associated with a particular SE or CE. In this use-case, the client needs to know whether the monitored information is actually generated on machines that make up the SEs or CEs.
Clients must be able to extract monitored information that was made by a (set of) specific tool(s), in this case, the tool is the file-transfer monitoring software.
3.1.6 Service utilization
Monitoring information needs to be retrieved through Grid portals and has to be displayed in graphical form in order to aid the administrative personnel during the problem solving phase
3.1.7 Security considerations
Information related to file transfers can pose a risk to users’ privacy. Data must be anonymized to ensure that individuals cannot be identified, and the contents of files cannot be divined.
3.1.8 Performance considerations
Information that might be passively monitored, such as application data throughput [NMH], can be created on a very large scale (for example, every single file transfer within the Grid might produce a tuple). Conversely, the measurement of such information through active techniques requiring the active injection of test traffic, is more likely to perturb the behavior of the system under monitoring, and is consequently more invasive and less scalable.
Statistical summaries of these data might be very useful (particularly because it anonymizes the data, as explained above), but some useful information might be lost because of the summarization process.
3.1.9 Use case situation analysis
The GridFTP data transfer application was instrumented in order to log performance information related to real transfer sessions [GFTP] in the
GFD-I.122 Dec 12, 2007
framework of various initiatives. Within the DataTAG European collaboration [EDT] GridFTP was instrumented with NetLogger [NL] and the performance information published into the Grid Information system. Similarly, Grid3 has deployed a NetLogger-instrumented version of globus-url-copy using pyGlobus, for the monitoring the status of Grid3 sites [grid3, QR]. The Grid3 collaboration has deployed an international Data Grid with dozens of sites and thousands of processors. The facility is operated jointly by the U.S. Grid projects iVDGL, GriPhyN and PPDG, and the U.S. participants in the LHC experiments ATLAS and CMS.
3.1.10 References
[EDT] Instrumenting GridFTP with NetLogger, DataTAG project (http://datatag.web.cern.ch/datatag/WP3/grid_app_mon/instrumenting.htm)
[GFTP] Allcock, W.; GridFTP: Protocol Extensions to FTP for the Grid, GFD.20, Open Grid Forum, Apr 2003.
[grid3] An Application Grid Laboratory for Science
(http://www.ivdgl.org/grid2003/).
[NMH] Lowekamp, B.; Tierny, B.; Cottrell, L. et al.; A Hierarchy of Network Performance Characteristics for Grid Applications and Services, GFD.23, Open Grid Forum, May 2004.
[NL] Tierney, B.; Gunter, D.; NetLogger: A Toolkit for Distributed System Performance Tuning and Debugging, Dec 2002
(http://www-didc.lbl.gov/papers/NetLogger.overview.pdf).
[QR] Quarterly Report for the Distributed Monitoring Framework (DFM) project, Oct 2003 (http://dsd.lbl.gov/DMF/reports/DMF-quarterly-Oct-03.html).
GFD-I.122 Dec 12, 2007
3.2 Administrative Setup of Schedules of Measurements
Contributors: Mark J. Leese (Daresbury Laboratory), Paul D. Mealor (University College London)
3.2.1 Use case summary
Network performance data are gathered through measurement sessions, which can be triggered on a regular basis or on-demand. This use case addresses the latter scenario.
Administrators require regularly scheduled and ad-hoc measurements for a variety of reasons, as explained in what follows. On-demand measurement schedules can be of various types: a single ad-hoc measurements, temporary schedules and permanent schedules.
3.2.2 Customers
Clients that may be interested in triggering on-demand measurement sessions are both administrators and middleware agents:
• administrators interested in the network state monitoring and availability of data for network problem diagnosis;
• administrators wishing to manually set up measurements to aid middleware in optimizing the functions of the Grid;
• administrators monitoring the performance of a Grid site to ensure that network resources are well provisioned and SLAs are being kept to;
• middleware services requiring measurements in response to changes in system configuration or usage patterns.
3.2.3 Scenarios
Administrator setting up a single ad-hoc measurement
1. An administrator wishes to make a single measurement between two end-points, either of which might be outside his immediate control.
o The administrator knows the metric and certain parameters for the measurement, plus the names of the two endpoints. These parameters might include application-level and protocol-stack-level settings, as well as more exotic settings, such as requiring a particular type of service.
2. The administrator must be able to retrieve a measurement of the metric with the parameters and endpoints he specified after the measurement is completed.
GFD-I.122 Dec 12, 2007
Administrator setting up a temporary schedule of measurements
1. An administrator wishes to set up a series of regular measurements for a short period of time, in order to monitor an expected change, or for troubleshooting purposes.
o The administrator knows the metric and certain parameters for the measurement. These parameters might include application-level and protocol-stack-level settings, as well as more exotic settings, such as requiring a particular type of service.
o He also knows the approximate frequency at which measurements should be made.
o Finally, he knows that no more measurements should be made after some cut-off time, as they might be intrusive.
2. The user will watch the results of measurements as they are made.
3. After some time, the user decides that more measurements must be made past the original cut-off time.
4. After further time, the user decides that he has all the information he needs, and so stops the measurements altogether.
Administrator setting up a permanent schedule of measurements
1. An administrator wishes to set up a permanent schedule of regular measurements between two end-points. The results of these measurements might be used for a number of reasons:
o to inject new information into the Grid information systems for use by optimization services;
o to allow changes in the state of the networks to be flagged quickly, and so provide early warning of failures or other problems;
o to ensure that service-level agreements are kept to.
2. The administrator must instantiate regular measurements between two nodes either of which may be outside his immediate control.
o The administrator knows the metric and certain parameters for the measurement. These parameters might include application-level and protocol-stack-level settings, as well as more specific settings, such as requiring a particular type of service.
o He also knows the approximate frequency at which measurements should be made. However, the exact timing of these measurements may not be important, as long as the average frequency over the lifetime of the schedule approaches the desired frequency.
Setting up a permanent schedule of measurements for use by other middleware
1. An administrator wishes to set up a permanent schedule of regular measurements to characterize the connection between two resources on the
GFD-I.122 Dec 12, 2007
Grid. The results of these measurements might be used by other middleware for optimization purposes.
2. The administrator knows the names of the resources (that is, the name of a CE and a SE, for example). The names of the monitoring points themselves are unknown, and either of them might be outside the direct control of the administrator.
3. The administrator wants to ensure that no duplication of effort occurs: that is, if measurements are already being made which are applicable to the resources, these measurements are not duplicated for the new resources.
4. The measurement schedule should effectively run for the lifetime of the Grid, unless the resources change, or different types or volumes of information are required. Therefore:
o the administrator may wish to change any of the settings of the schedule; or
o the administrator may wish to cancel the measurements altogether.
3.2.4 Involved resources
o The endpoints of the measurements must not be loaded (processor or otherwise) such that measurement results are perturbed.
o The networks in between the endpoints are usually fairly passively – they can be thought of as passive conduits of data. However, in certain cases (when measuring SLAs for example), the networks may be affected by other network services, such as bandwidth allocation services.
3.2.5 Functional requirements
o The user requires some control over monitoring nodes that he cannot directly control.
o The user must be able to schedule a great number of repeated measurements, between nodes.
o The user must be able to discover what monitoring nodes and information are available and associated with particular resources.
o To monitor SLAs, the user must be able to discover what advanced services are available between two monitoring nodes, and then must be able to make use of them when measurements are made.
3.2.6 Service utilization
See Section 3.2.3 for a detailed description of the service usage scenarios.
3.2.7 Security considerations
o Making intrusive measurements between dedicated and privileged machines on a network can result in poor network performance for other users. The
GFD-I.122 Dec 12, 2007
potential for a service to be used as a platform for denial-of-service attacks is very great.
o Only authenticated and authorized customers are allowed to set up a schedule of measurements.
o This mechanism could be used as a method for injecting bad information into the Grid information system, if, for example, a measurement could be engineered to appear unfavorable. If the results of users’ measurements are used by other Grid components, appropriate safeguards must be in place to ensure that those measurements cannot adversely affect the operation of the Grid.
3.2.8 Performance considerations
NA
3.2.9 Use case situation analysis
The support of on-demand measurement schedules is currently under study in a number of related frameworks such as the Internet2 End to End Performance initiative [I2], the DANTE performance monitoring initiative [perfmonit] and the European project EGEE [JRA4].
Standardization of signaling messages for the setup of measurement schedules is currently under definition by the Network Monitoring working group of the GGF [REP,REQ].
3.2.10 References
[EDG] Grid Network Monitoring. Demonstration of Enhanced Monitoring Tools; Deliverable D of the DataGrid project (http://edms.cern.ch/document/334883)
[EGEE] Definition of standardized network measurement query/response interfaces, Deliverable DJRA4.2 of the EGEE project
(http://edms.cern.ch/document/533215).
[I2] Internet2 End to End Performance Initiative (http://e2epi.internet2.edu/)
[perfmonit] Performance monitoring initiative (http://archive.dante.net/tf-ngn/perfmonit/)
[REP] Measurement Report Schema Requirements, Network Measurement Working Group, GGF, work in progress.
[REQ] Network Measurements Request Schema Requirements, Network Measurement Working Group, GGF, work in progress.
[I2] Internet2 End to End Performance Initiative (http://e2epi.internet2.edu/)
GFD-I.122 Dec 12, 2007
3.3 Service Optimization
Contributor: Tiziana Ferrari (Istituto Nazionale di Fisica Nucleare)
3.3.1 Use case summary
Network performance information can be used to optimize the behavior of both user applications and middleware in Grids. In fact, network performance metrics can be composed to generate a projected view of the status of a given network path. This type of information can be used then to drive the networked behavior of software agents to minimize the overall cost of transmission involved in a complex workflow .
Cost models can vary depending on the application and/or middleware requirements, and depend on a set of network performance metrics. Network costs can be used to select the preferable destination nodes (clients, servers etc) from a set of candidates.
3.3.2 Customers
The network cost can be useful in a number of scenarios. Resource brokers and data replication managers are two examples of possible customers who could use this information to optimize their networked sessions. The scenarios are described in the following paragraphs.
3.3.3 Scenarios
Grid job scheduling
One of the main capabilities of a Resource Broker is the selection of resources (CEs in this case) from a list of candidates that are often geographically distributed. This decision can be taken according to various selection rules. These selection criteria are based on job requirements (such as the software environment available on a given CE, the amount of free disk space, available CPU, etc), and network performance data defining the quality of data transmission on network paths connecting CEs to the relevant input data sources.
In order to do so, the cost of a given network path needs to be estimated on the basis of historic or estimated future network performance. This scenario is organized in a sequence of logical steps.
1. The user submits a job description to the broker. The job description contains information such as:
o logical names of the data required for the job;
o the SE on which the job output files should be stored;
o constraints on the maximum job processing time, processor and software platforms characteristics, etc.
2. The Resource Broker finds all the CEs that match the job requirements.
GFD-I.122 Dec 12, 2007
3. The Resource Broker discovers the location of all the replicas of the logical data files required by the job through the support of replica catalogues.
4. For each CE, the Resource Broker finds the total cost involved in making replicas available to the job. If required by the job, this computation takes into account the cost of staging job output files to a user-specified SE.
5. Finally, the Resource Broker selects the best candidate for job execution (CEs and SEs) which minimize the total cost.
The efficiency of network resource utilization and input and output data transfer increases when network costs are considered, as the exchange of input and output files can generate considerable load across the Grid.
Resource Brokers can increase the efficiency of the system in several respects, depending on the cost model adopted. Network-oriented cost models aim at minimizing the load of traffic exchanged from/to CEs and the overall usage of network resources. Conversely, job-oriented models aim at the minimization of latency experienced from job submission to the end of its execution, or the maximization of the number of jobs completed per time interval.
Data replication
Estimated network costs can be used to improve the efficiency of data management among different SEs, e.g., to select the best replica of a given file (if there are copies in different SEs), to identify the most appropriate SEs when a given amount of data has to be replicated, and to manage input/output data fragments in a single SE.
For example, in the last use case, it may happen that input/output data for a given job, are fragmented and distributed among a number of SEs. If the fragments need to be gathered into a single SE, then the most appropriate SE has to be identified. The cost model can be based on principles such as the minimization of the amount of data exchanged between SEs, the identification of the SE with the lowest packet loss probability or with the maximum incoming available bandwidth.
Adaptive remote file access
In some job execution scenarios, an application may decide what file/files it needs to access only at run time. In this case the information about the identity of the input files accessed is missing and it can not be used by a Resource Broker during the matchmaking phase to statically allocate suitable CEs to the application. For this reason, it becomes important to provide the application itself with that the possibility to dynamically adapt the source of its input file at run time.
The optimization can be based on the dynamic adjustment of the SE set that the application is using as the file access pattern changes, by taking into account the
GFD-I.122 Dec 12, 2007
network performance experienced on the paths connecting the CE to the SEs in use.
3.3.4 Involved resources
o Storage Elements;
o Compute Elements;
o Network connections used to transfer files.
3.3.5 Functional requirements
A cost must be calculable for every Grid resource, such as CEs and SEs. Changes in the performance of networks associated with resources should quickly be made available to brokering and optimization middleware so that resources are optimally used.
3.3.6 Service utilization
See Section 3.3.3.
3.3.7 Security considerations
Information about the state of the networks and components of the Grid might be useful in targeting malicious attacks.
Incorrect information associated with resources might result in poor decisions by brokering middleware. Injecting bad information into the system might constitute an effective denial-of-service attack as certain resources are swamped, while others remain unused.
3.3.8 Performance considerations
The use of network cost information in the workload management scenario requires scalability and good responsiveness from the server, as the number of jobs handled by resource brokers can be considerable. For each job the completion of the resource discovery phase may require multiple cost estimation requests.
3.3.9 Use case situation analysis
A prototype of a service addressing the first scenario described in this document has been implemented in the framework of the EU project DataGrid [D7-4]. The following documents provide information about features and implementation details [FG, NCES].
GFD-I.122 Dec 12, 2007
3.3.10 References
[D7-4] Final Report on Network Infrastructure and Services, DataGrid Deliverable 7-4, Jan 2004 (https://edms.cern.ch/document/414132).
[FG] Ferrari, T.; Giacomini, F.; Network Monitoring for GRID Performance Optimization, Computer Communications Journal, Vol 27 (2004), pp. 1357-1363.
[NCES] The Network Cost Estimation Service (http://ccwp7.in2p3.fr/nces/).

GFD-I.122 Dec 12, 2007
4. Acknowledgements
The authors are very grateful to Franco Travostino for his support and guidance, and to Javier Orellana and Afrodite Sevasti for their comments.
5. Security Considerations
Security issues are discussed individually for each use case under the respective section heading “Security considerations”.
6. Authors Information
Jim Austin, University of York, jim.austin(at)cs.york.ac.uk
Peter Clarke, University of Edinburgh, Clarke(at)nesc.ac.uk
Tiziana Ferrari, Istituto Nazionale di Fisica Nucleare, Tiziana.Ferrari(at)cnaf.infn.it (Editor)
Martyn Fletcher, University of York, martyn.fletcher(at)cs.york.ac.uk
Mark Gaynor, Boston University, mgaynor(at)bu.edu
Richard Hughes-Jones, Univ. of Manchester, R. Hughes-Jones(at)man.ac.uk
Tom Jackson, University of York, tom.jackson(at)cs.york.ac.uk
Gigi Karmous-Edwards, MCNC Institute, gigi(at)mcnc.org
Peter Kunszt, Swiss National Supercomputing Centre, peter.kunszt(at)cscs.ch
Mark J. Leese, Daresbury Laboratory, M.J.Leese(at)dl.ac.uk
Jason Leigh, University of Illinois at Chicago, spiff(at)uic.edu
Paul D. Mealor
Inder Monga, Nortel Networks Laboratories, imonga(at)nortelnetworks.com
Volker Sander, Aachen University of Applied Sciences, Germany, v.sander(at)fh-aachen.de
Ralph Spencer, Jodrell Bank Observatory, res(at)jb.man.ac.uk
Matt Strong, Jodrell Bank Observatory, mstrong(at)jb.man.ac.uk
Peter Tomsu, Cisco Corporate Consulting, ptomsu(at)cisco.com
7. Intellectual Property Statement
The OGF takes no position regarding the validity or scope of any intellectual property or other rights that might be claimed to pertain to the implementation or use of the technology described in this document or the extent to which any license under such rights might or might not be available; neither does it represent that it has made any effort to identify any such rights. Copies of claims

GFD-I.122 Dec 12, 2007
of rights made available for publication and any assurances of licenses to be made available, or the result of an attempt made to obtain a general license or permission for the use of such proprietary rights by implementers or users of this specification can be obtained from the OGF Secretariat.
The OGF invites any interested party to bring to its attention any copyrights, patents or patent applications, or other proprietary rights which may cover technology that may be required to practice this recommendation. Please address the information to the OGF Executive Director.
8. Disclaimer
This document and the information contained herein is provided on an “As Is” basis and the OGF disclaims all warranties, express or implied, including but not limited to any warranty that the use of the information herein will not infringe any rights or any implied warranties of merchantability or fitness for a particular purpose.
9. Full Copyright Notice
Copyright (C) Open Grid Forum (applicable years). All Rights Reserved.
This document and translations of it may be copied and furnished to others, and derivative works that comment on or otherwise explain it or assist in its implementation may be prepared, copied, published and distributed, in whole or in part, without restriction of any kind, provided that the above copyright notice and this paragraph are included on all such copies and derivative works. However, this document itself may not be modified in any way, such as by removing the copyright notice or references to the OGF or other organizations, except as needed for the purpose of developing Grid Recommendations in which case the procedures for copyrights defined in the OGF Document process must be followed, or as required to translate it into languages other than English.
The limited permissions granted above are perpetual and will not be revoked by the OGF or its successors or assignees.


![[Smart Grid Market Research] Brazil: The Smart Grid Network, Zpryme Smart Grid Insights, October 2011](https://static.fdocuments.net/doc/165x107/577d20871a28ab4e1e931ff6/smart-grid-market-research-brazil-the-smart-grid-network-zpryme-smart-grid.jpg)