
Grid Energy Storage Introductory Training for the New Mexico … · Energy (kWh) = Voltage (V)...
103
Sandia National Laboratories is a multi-mission laboratory managed and operated by National Technology and Engineering Solutions of Sandia, LLC, a wholly owned subsidiary of Honeywell International, Inc., for the U.S. Department of Energy’s National Nuclear Security Administrati on under contract DE-NA0003525 DAN BORNEO – SANDIA NATIONAL LABORATORIES RAY BYRNE – SANDIA NATIONAL LABORATORIES JEREMY TWITCHELL – PACIFIC NORTHWEST NATIONAL LABORATORY January 9, 2019 SAND2018-13308 PE Grid Energy Storage Introductory Training for the New Mexico Renewable Energy Storage Working Group Santa Fe
-
Upload
trinhthien -
Category
Documents
-
view
219 -
download
1
Transcript of Grid Energy Storage Introductory Training for the New Mexico … · Energy (kWh) = Voltage (V)...

Sandia National Laboratories is a multi-mission laboratory managed and operated by National Technology and Engineering Solutions of Sandia, LLC, a wholly
owned subsidiary of Honeywell International, Inc., for the U.S. Department of Energy’s National Nuclear Security Administration under contract DE-NA0003525
DAN BORNEO – SANDIA NATIONAL LABORATORIESRAY BYRNE – SANDIA NATIONAL LABORATORIES
JEREMY TWITCHELL – PACIFIC NORTHWEST NATIONAL LABORATORY
January 9, 2019SAND2018-13308 PE
Grid Energy Storage
Introductory Training for the New Mexico
Renewable Energy Storage Working Group
Santa Fe

2
Agenda
Welcome
Technologies, terms and fundamentals
Demonstrations and case studies
BREAK
Valuation, applications, and resilience
Regulatory proceedings and state policies
Resources

3
Tesla Charging stations Vandalized
3
• The charging stations looked to be pushed back on their pads with one almost off.
• Three of the chargers were missing.
www.richiejeep.com/2018-Cisco-TX-Supercharger/
'Total waste of Creme Eggs': vandals stuff sweets into electric car chargerSOPHIE WILLIAMSThursday 21 June 2018 15:56

4
Innovation : Something to Consider
One of the first gasoline powered cars ~1891 by Henry Nadig of Allentown, Pa. Courtesy of American Automobile Museum, Allentown, Pa.
The “NADIG”

5
Innovation: Something to Consider
Quotes about the Nadig in 1891*Blasted as a “dangerous device” – backfiring caused fires
Car not allowed on the streets during the day as it “frightened”
the horses
Constable served notice; drivers/operators could be arrested for
creating a “public nuisance”
“Shouts of ‘Get a horse!’ were followed by the grand insult of
the day – “Cabbages thrown at the hapless Nadig.”
* Whelan, Frank “Did Auto Age First Dawn in the Valley? Allentown Mechanic Built One of Country’s First Gas-powered Cars” Sept, 14,
1989 The Morning Call

6
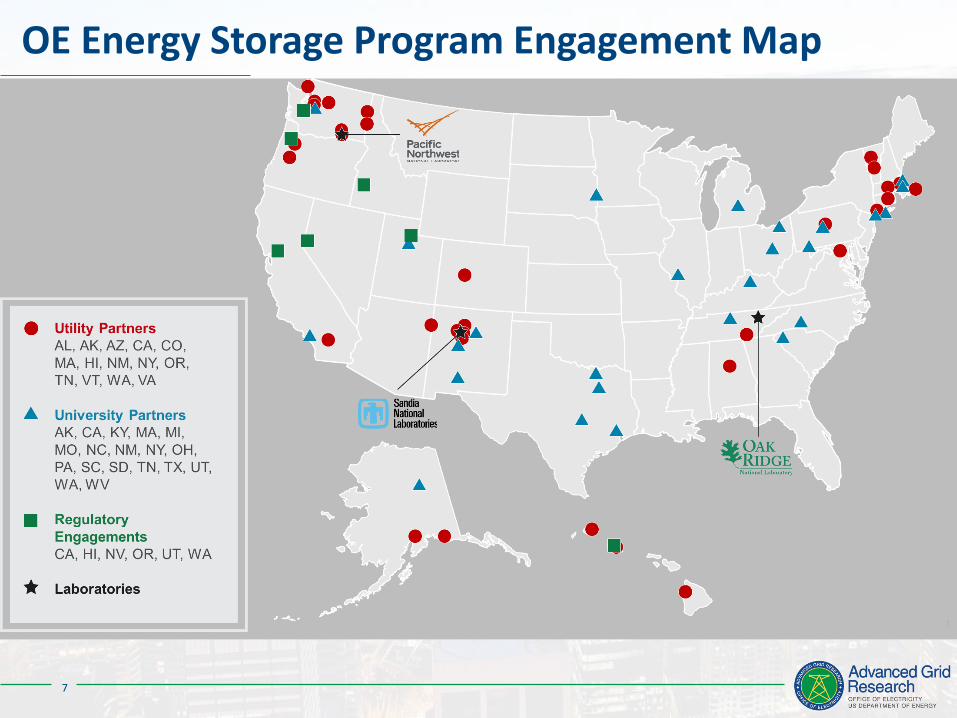
DOE Energy Storage Program Overview
The Department of Energy’s Grid Energy Storage report (2013) identified a four-
pronged strategy to overcoming the barriers to energy storage deployment:
Cost-competitive energy storage technology development;
Validated reliability and safety;
Equitable regulatory environment; and
Industry acceptance.
7
OE Energy Storage Program Engagement Map

8
Industry Acceptance Program
Provide independent analysis
Application(s) benefit and ROI analysis
Power and energy requirements
Technology review and system testing
Support the development and implementation of grid-tied ES projects
RFI/RFP development
Design and Procurement Support
Application/Economic analysis
Commissioning Plan Development
Monitor and analyze operational ES Projects
Application optimization
Operational performance
Develop public information programs
Webinars
Workshops and presentations

9
Energy Storage:
Technologies, Terms, and Fundamentals

10
Source: DOE Global Energy Storage Databasehttp://www.energystorageexchange.org/
Energy Storage Comparison
Globally
• 1.7 GW - Battery Energy Storage
• ~170 GW - Pumped Storage Hydropower
U.S.
• 0.33 GW BES
• 22.7 GW PHS
% of U.S. Generation Capacity
• 0.03% Battery Energy Storage
• 2.2% Battery + Pumped Storage
Grid Energy Storage Deployments
Li-ion78%
Flow5%
Na-metal12%
Pb-acid5%
Other0%
0.0
1.0
2.0
3.0
4.0
5.0
Li-ion Flow Na-metal Pb-acid
Average Duration Discharge (hrs)

11
Growth in Battery Energy Storage over Past Decade
However
Grid-Scale Energy Storage still < 0.1% of U.S. Generation Capacity
EV’s < 1% of vehicles sold in U.S.
Source: GTM Research / ESA | U.S. Energy Storage Monitor Q2 2018
KEYFront of Meter
Non -
Residential
Residential
Current Grid Storage Deployments

12
Energy Storage Performance Ranges
1
10
100
1000
10000
100000
1000000
0.01 0.1 1 10
Dis
char
ge P
ow
er
Discharge Duration (hrs)
1 GW
1 MW
1 kW
Sup
erca
p
TVA PHS1.6 GW22 hrs
Battery Energy Storage
CAESFl
ywh
eels
100

13
Basic Battery Terminology
Electrochemical Cell: Cathode(+), Anode (-), and Electrolyte (ion conducting
intermediate)
Energy (kWh) = Voltage (V) difference between anode and cathode multiplied by
amount of ion the electrodes are able to store - given as Ah of capacity
Energy Density (Wh/kg or Wh/L): used to measure the energy density of battery.
Note: number often given for cell, pack, and system
Generally: pack = ½ cell energy density, and system is fraction of the pack.
$/kWh = capital cost of the energy content of storage device.

14
Elements of Battery Energy Storage
NOTE: All–in can increase cost by 2-4x.
Storage
• Storage device
• Battery Management & Protection (BMS)
• Racking
• $/KWh
• Efficiency
• Cycle life
Balance of Plant
• Housing
• Wiring
• Climate control
• Fire protection
• Permits
• $
Power Control System (PCS)
• Bi-directional Inverter
• Switchgear
• Transformer
• Interconnection
• $/KW
Energy management System (EMS)
• Charge / Discharge
• Load Management
• Ramp rate control
• Grid Stability
• Monitoring
• $
• DER control
• Synchronization
• Islanding
• Microgrid
• $
Site Management System (SMS)

15
Lithium-ion Batteries
Advantages
High energy density
Better cycle life than Lead - Acid
Decreasing costs – Stationary on coattails
of increasing EV.
Ubiquitous – Multiple vendors
Fast response
Higher efficiency* (Parasitic loads like
HVAC often not included)
Applications
Traditionally a power battery but cost
decreases and other factors allow them to
used in energy applications SCE Tehachapi plant, 8MW - 32MWh.
SCE/Tesla 20MW -80MWh Mira Loma Battery Facility

16
Source: Z. Yang JOM September 2010, Volume 62, Issue 9, pp 14-23
Lithium-ion: Basic Chemistries

17
Lithium-ion: Basic Chemistries
ChemistrySpecific Capacity
Potentialvs. Li+/Li
LiCoO2 273 / 160 3.9
LiNiO2 274 / 180 3.6
LiNixCoyMnzO2
~ 270 / 150~180
3.8
LiNixCoyAlzO2 ~ 250 / 180 3.7
LiMn2O4 148 / 130 4.1
LiMn1.5Ni0.5O4 146 / 130 4.7
LiFePO4 170 / 160 3.45
LiMnPO4
171 / 80~150
4.1
LiNiPO4 166 / - 5.1
LiCoPO4
166 / 60~130
4.8
Chemistry Specific Capacity Potentialvs. Li+/Li
Soft Carbon < 700 < 1
Hard Carbon 600 < 1
Li4Ti5O12 175 / 170 1.55
TiO2 168 / 168 1.85
SnO2 782 / 780 < 0.5
Sn 993 / 990 < 0.5
Si 4198 / < 3500 0.5 ~ 1
Cathodes
Anodes
NMC – LG/Volt
LFP
LTO
NCA - Tesla
iphone

18
Energy Density of Li-ion Chemistries

19
Tesla Battery Pack: 85 kWh
http://insideevs.com/look-inside-a-tesla-model-s-battery-pac/
7,104 cells
http://club.dx.com/forums/forums.dx/threadid.457734
18650 cell format used in 85 kWh Tesla battery
A system like 20MW -80MWh Mira Loma Battery Storage Facility
would require at least 6.7 million of these 18650 cells
Why this form factor?

20
Li-ion Batteries: SOA
For grid applications
Costs coming down in lithium-ion batteries. However, BOM constitute ~70-80% of cell cost.
Need lower manufacturing costs, currently in the $300-400M range for a 1GWh of manufacturing capacity
Grid batteries in addition to low BOM and cost of manufacturing
Excess capacity in the large format automotive batteries driving the market for applications in the grid
However
Safety and reliability continues to be significant concerns
Power control and safety adds significant cost to Li ion storage
Packaging and thermal management add significant costs
Deep discharge cycle life issues for energy applications (1000 cycles for automotive)
Takeaway: Need to manage the battery to limit the DoD, charge, ambient temperature.
21
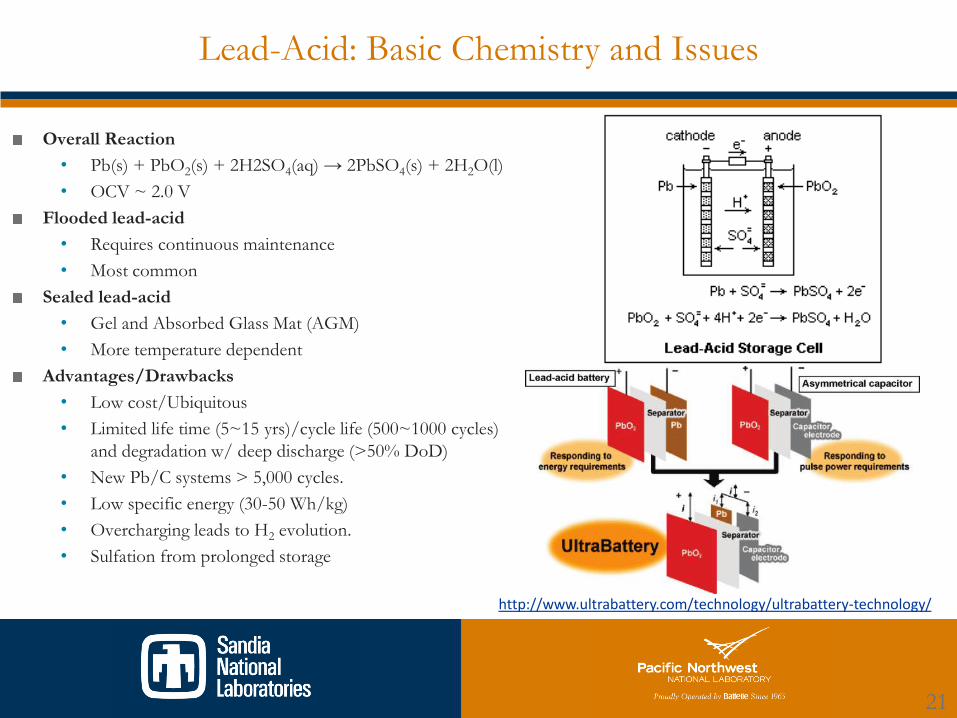
Lead-Acid: Basic Chemistry and Issues
Overall Reaction
• Pb(s) + PbO2(s) + 2H2SO4(aq) → 2PbSO4(s) + 2H2O(l)
• OCV ~ 2.0 V
Flooded lead-acid
• Requires continuous maintenance
• Most common
Sealed lead-acid
• Gel and Absorbed Glass Mat (AGM)
• More temperature dependent
Advantages/Drawbacks
• Low cost/Ubiquitous
• Limited life time (5~15 yrs)/cycle life (500~1000 cycles)
and degradation w/ deep discharge (>50% DoD)
• New Pb/C systems > 5,000 cycles.
• Low specific energy (30-50 Wh/kg)
• Overcharging leads to H2 evolution.
• Sulfation from prolonged storage
http://www.ultrabattery.com/technology/ultrabattery-technology/

22
Advanced Lead Acid: Testing at Sandia#
http://www.sandia.gov/batterytesting/docs/LifeCycleTestingEES.pdf

23
Sodium Metal Batteries (NaS, NaNiCl2..)
Two primary Sodium chemistriesNaS mature grid technology developed in 1960’s
High energy density -Long discharge cycles
Fast response- Long life
High operating temperature (250-300C)
530 MW/3700MWh installed primarily in Japan (NGK)
NaNiCl2, (Zebra)mature, more stable than NaS. Developed in South Africa in 1980’s
FIAMM in limited production
Large cells and stable chemistry
Lower temperature than NaS
Cells loaded in discharge mode
Addition of NaAlCl4 leads to a closed circuit on failure
High efficiency, low discharge
Long warm up time (16 hr)
Neither NaS nor NaNiCl2 are at high volumes of production for economies of scale
NGK 34MW - 245 MWh NaS, Rokkasho, Japan
FIAMM Sonick Na-NiCl2 Battery Module

24
Na-Metal Batteries: Basic Chemistry
Batteries consisting of molten sodium anode and β"-Al2O3 solid electrolyte (BASE).
Use of low-cost, abundant sodium → low cost
High specific energy density (120~240 Wh/kg)
Good specific power (150-230 W/kg)
Good candidate for energy applications (4-6 hrsdischarge)
Operated at relatively high temperature (300~350C)
Sodium-sulfur (Na-S) battery
2Na + xS → Na2Sx (x = 3~5)
E = 2.08~1.78 V at 350C
Sodium-nickel chloride (Zebra) battery
2Na + NiCl2→ 2NaCl + Ni
E = 2.58V at 300C
Use of catholyte (NaAlCl4)

25
Na-Metal Batteries: Advantages/Issues
Temperature
Less over-temperature concerns, typical operating window 200-350C. additional
heaters needed when not in use.
At < 98°C, Na metal freezes out, degree of distortion to cell dictated by SOC of
battery (amount of Na in anode)
Charging/Discharging Limitations
Safety Concerns
Solid ceramic electrolyte keeps reactive elements from contact. Failure in electrolyte can lead to exothermic reaction (Na-S)
26
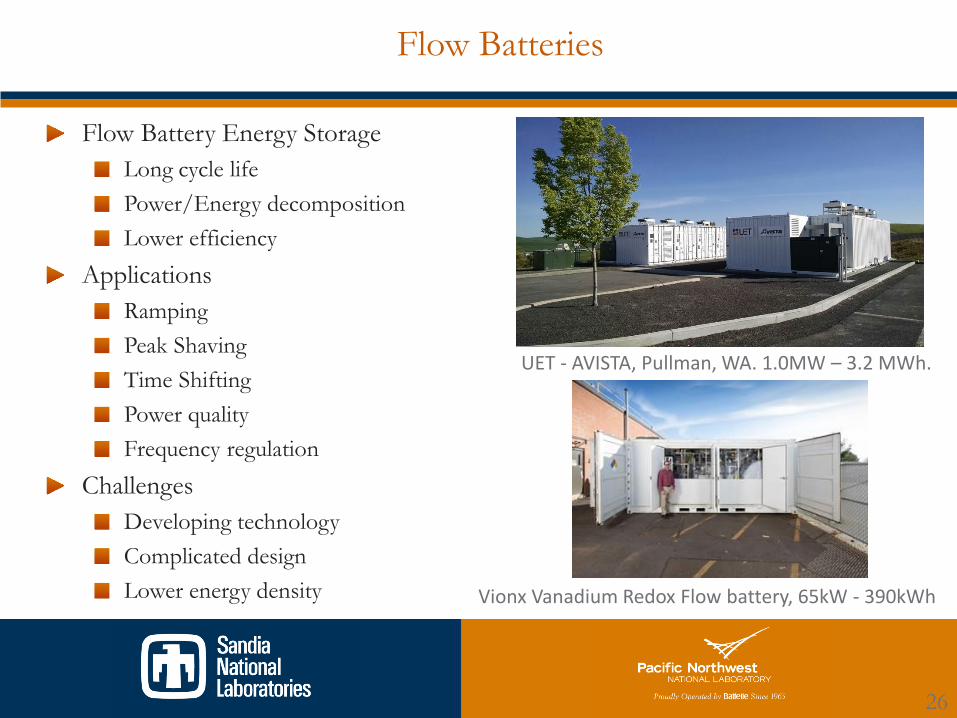
Flow Batteries
Flow Battery Energy Storage
Long cycle life
Power/Energy decomposition
Lower efficiency
Applications
Ramping
Peak Shaving
Time Shifting
Power quality
Frequency regulation
Challenges
Developing technology
Complicated design
Lower energy density
UET - AVISTA, Pullman, WA. 1.0MW – 3.2 MWh.
Vionx Vanadium Redox Flow battery, 65kW - 390kWh

27
Key Aspects➢ Power and Energy are separate enabling greater flexibility and safety.
➢ Suitable for wide range of applications 10’s MW to ~ 5 kw
➢ Wide range of chemistries available.
➢ Low energy density ~ 30 Whr/kg
➢ Lower energy efficiency
Redox Flow Battery: Basic Chemistry

28
Flow Batteries - Future
The flexibility of redox flow battery technology offers the potential to capture
multiple value streams from a single storage device.
Current research has demonstrated high power conditions can be achieved with
minimal impact in stack efficiency.
Next generation RFB technology based on Aqueous Soluble Organics (ASO)
being developed to replace vanadium species.
Continued cost reductions in Li-ion technology will be driven by EV/PHEV
deployments. RFB may be able to achieve similar cost targets at ~ 100X lower
production volume.

29
High Energy Density Li and Metal Air Batteries
All metal air batteries (Li-air, Zn-air) have the potential to deliver high energy
densities at low cost, challenges with recharging have so far precluded
commercialization of the technology
Lot of startup activity in Metal-Air batteries
Technology not mature, decade or more away
Potential fundamental problems
Li-Air combines difficulties of air and lithium electrodes
Breakthroughs needed in cheap catalysts, more stable and conductive ceramic
separators
Developing a robust air electrode is a challenge, need major breakthroughs
Li-S suffers from major problems of self discharge and poor life
breakthroughs needed for life of Li electrode, low cost separator
Note: Looking for operational data to evaluate claims.

30
Rechargeable Alkaline Batteries
Primary Chemistries
NiMH
Ni-Fe
Zn-Ni
Zn-MnO2
For low cost grid storage applications, Zn-MnO2 has compelling
attributes.

31
History of Rechargeable
Zn-MnO2 Alkaline Batteries
Long history of research on making Zn-
MnO2 rechargeable.
Several commercial products based on
cylindrical formats (Rayovac, BTI).
All focused on cylindrical designs for
consumer markets.
J. Daniel-Ivad and K. Kordesch, “Rechargeable Alkaline Manganese Technology: Past-Present-Future,” ECS Annual Meeting, May 12-17, 2002
Cylindrical cells
No flexibility to change criticalparameters.
• Traditionally primary batteries• Lowest bill of materials cost, lowest
manufacturing capital expenses• Established supply chain for high
volume manufacturing• Readily be produced in larger form
factors for grid applications• Do not have the temperature
limitations of Li-ion/Pb-acid• Are inherently safer, e.g. are EPA
certified for landfill disposal.❖ Until recently reversibility of Zn/MnO2
has been challenging

32
Lithium Ion Battery Prices
2018
~$200/kWh Pack
$400-$450/kWh
system

33
Cell price is not only driver for further cost reduction
Cell
Pack
X 1.4
System
X 2.0
Installed
X 1.3
$80/kWh cell
$~300/kWh installed

34
Future cost reduction requires addressing the entire suite of
barriers for continued deployment of energy storage
Safety and Reliability Industrial
Acceptance
Regulatory Support
Redox Flow Sodium
Cost Competitive Technologies
Zn-MnO2 Cell
Pack
X 1.4
System
X 2.0
Installed
X 1.3

35
Energy Storage Systems
The process of making batteries into energy storage requires a significant level
of systems integration including packaging, thermal management systems,
power electronics and power conversion systems, and control electronics.
System and engineering aspects represent a significant cost and component, and
system-level integration continues to present significant opportunities for
further research.
Words to the wise: 1. Have an overall system integrator (Prime).2. Assure the Prime is experienced with batteries.
36
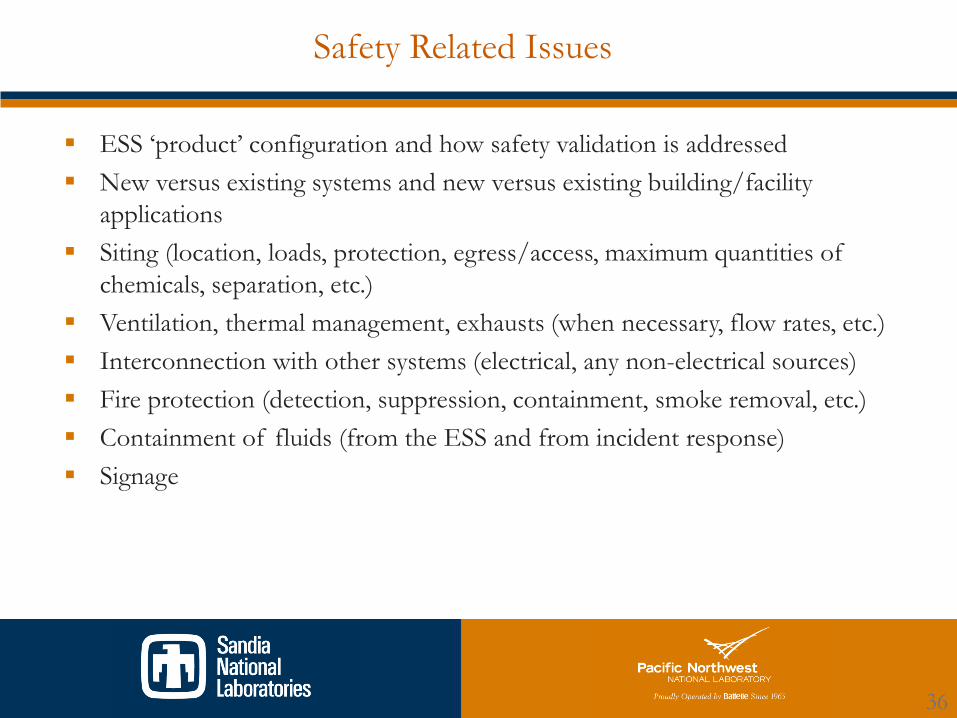
Safety Related Issues
▪ ESS ‘product’ configuration and how safety validation is addressed
▪ New versus existing systems and new versus existing building/facility
applications
▪ Siting (location, loads, protection, egress/access, maximum quantities of
chemicals, separation, etc.)
▪ Ventilation, thermal management, exhausts (when necessary, flow rates, etc.)
▪ Interconnection with other systems (electrical, any non-electrical sources)
▪ Fire protection (detection, suppression, containment, smoke removal, etc.)
▪ Containment of fluids (from the ESS and from incident response)
▪ Signage

37
Improving Storage Safety
Development of
Inherently Safe Cells
• Safer cell chemistries
• Non-flammable electrolytes
• Shutdown separators
• Non-toxic battery materials
• Inherent overcharge protection
Safety Devices and
Systems
• Cell-based safety devices
• current interrupt devices
• positive T coefficient
• Protection circuit module
• Battery management system
• Charging systems designed
Effective Response to
Off-Normal Events
• Suppressants
• Containment
• Advanced monitoring and controls

38
Safety through Codes and Standards
▪ Many ESS safety related issues are identical or similar to those associated
with other technologies
▪ Some safety issues are unique to energy storage in general and others
only to a particular energy storage technology
▪ Current codes and standards provide a basis for documenting and
validating system safety
▪ prescriptively
▪ through alternative methods and materials criteria
▪ Codes and standards are being updated and new ones developed
to address gaps between ESS technology/applications and criteria
needed to foster initial and ongoing safety

39
Introduction to PNNL/SNL Protocol
A set of best practices for characterizing ESS and measuring and reporting their performances
Available at http://www.sandia.gov/ess/publication/
7 Applications
Peak Shaving - Using an ESS to discharge during on-peak periods for electric power while charging the ESS during off-peak periods
Frequency Regulation - Regulate the electric power frequency by providing up regulation by discharging an ESS and providing down regulation by charging
Islanded Microgrids - Using an ESS as an electrical island separated from the utility grid
Renewables Firming (PV, Wind) - Using an ESS to supplement renewable energy generation to provide steady power output
Power Quality - Mitigating voltages sags by injecting real power from ESS for a few seconds
Frequency Control-Using a discharge/charge from an ESS to make up for a sudden loss of generation or load

40
SNL & PNNL Protocol for Evaluation of ES Systems
Companies looking for an accurate
method to gauge how well large
batteries and other grid-scale energy
storage systems work use these
evaluation guidelines, called the
Energy Storage Performance Protocol.
The guidelines currently evaluate three
energy storage performance uses: • Peak Shaving
• Frequency Regulation
• Islanded Microgrids
Additional Lab Protocols: • Duty Cycle for ESS Firming
• Duty Cycle for PV Smoothing
41
PNNL Documents for Evaluation of ES Systems

42
SNL Documents for Evaluation of ES Systems
43
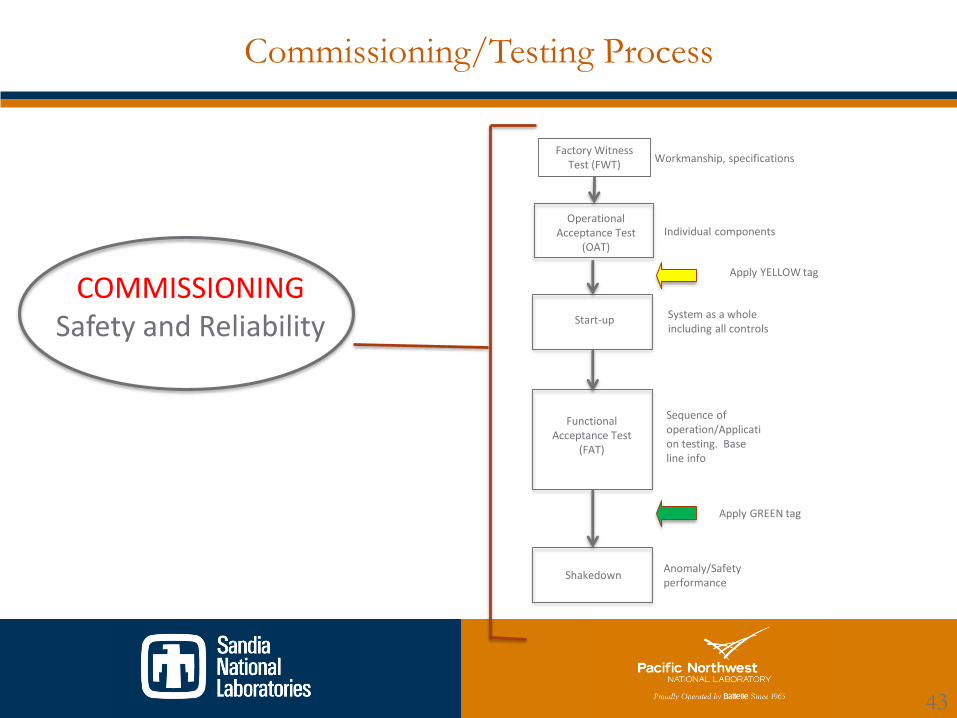
Commissioning/Testing Process
COMMISSIONINGSafety and Reliability
Operational Acceptance Test
(OAT)
Apply YELLOW tag
Start-up
Functional Acceptance Test
(FAT)
Apply GREEN tag
Shakedown
Factory Witness Test (FWT)
Individual components
System as a whole including all controls
Sequence of operation/Application testing. Base line info
Workmanship, specifications
Anomaly/Safety performance

44
Data Acquisition System (DAS)
• DAS monitors battery performance for operation, performance, efficiency and capacity fade
• Remote access & Time stamp of data
• Sampling rate
• 30+ day on-board memory
General Monitoring Parameters for ESS and Balance of Plant
AC Voltage(V) Current(I)
Kwh in (efficiency) Kwh out(efficiency)
Balance of plant monitoring State of Charge(SOC)
System Temperature Ambient Temperature
Frequency DC Voltage
Cell Temperature System KW
Ramp Rate System KVA
Response Time Grid Monitoring

45
Takeaways
Advances in several areas will make grid-based storage systems safer, more
reliable, and cost-effective
Technology advances
Manufacturing and scale-up
Codes and standards
Enabling applications
Current demonstration projects are leading the way
Commissioning helps ensure safe installation
Testing helps understand system operation and performance

46
Energy Storage
Demonstrations and Case Studies

47
Has Energy Storage Arrived?
Solar + Storage
January 2017 - Kauai Island Utility Cooperative
signed a solar-plus-storage PPA at $0.11/kWh.
This project at 28 MW of solar and 100 MWh
of batteries — will displace the utility's current
oil-fired baseload generation.
May 2017 - Tucson Electric Power signed a
PPA with NextEra Energy for a solar-plus-
storage system at "an all-in cost significantly
less than $0.045/kWh over 20 years.” PPA for
the solar portion of the project at below
$0.03/kWh. 100 MW PV and a 30 MW/120
MWh energy storage system, both developed
by an affiliate of NextEra Energy.
Source: Kauai Island Utility Cooperative
Source: UtilityDrive

48
Recent Deployments – Aliso Canyon
Things can happen quickly
SDG&E 30 MW/120 MWh Li-ion battery energy
storage system in Escondido, Calif.
SoCalGas relies on Aliso Canyon to provide
gas for core customers—homes and small
businesses—as well as non-core customers,
including hospitals, local governments, oil
refineries, and 17 natural gas-fired power
plants with a combined generating capacity
of nearly 10,000 megawatts.
As part of a multi-part response to the crisis,
the California Public Utilities Commission in
May 2016 fast-tracked approval of 104.5 MW
of battery-based energy storage systems
within the service areas of Southern
California Edison (SCE) and San Diego Gas
& Electric (SDG&E).
49
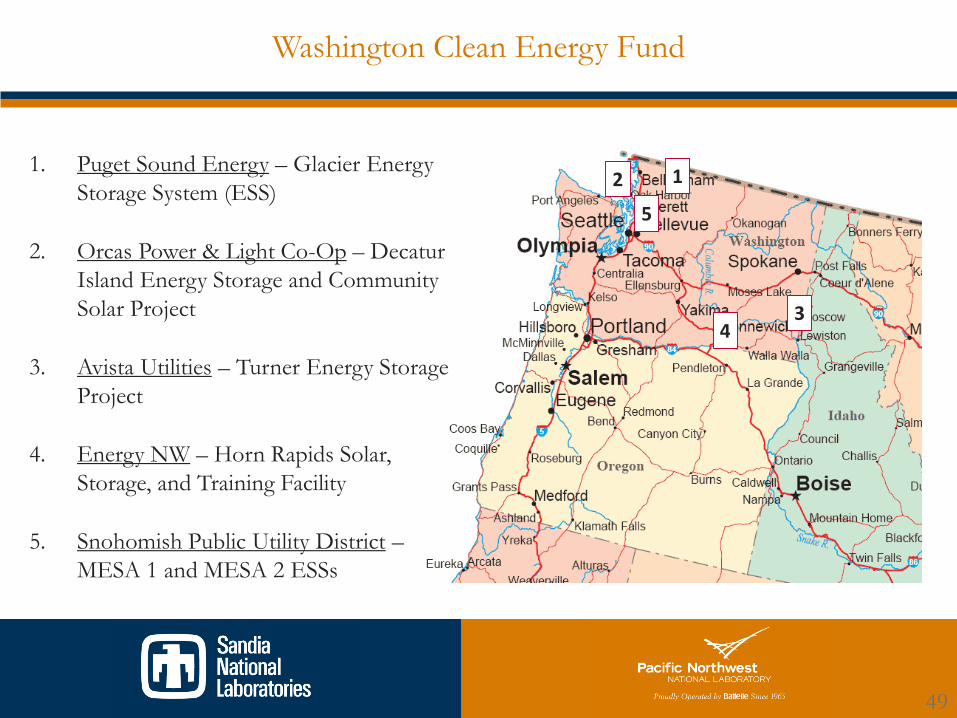
Washington Clean Energy Fund
1. Puget Sound Energy – Glacier Energy
Storage System (ESS)
2. Orcas Power & Light Co-Op – Decatur
Island Energy Storage and Community
Solar Project
3. Avista Utilities – Turner Energy Storage
Project
4. Energy NW – Horn Rapids Solar,
Storage, and Training Facility
5. Snohomish Public Utility District –
MESA 1 and MESA 2 ESSs
12
34
5

50
Washington Clean Energy Fund Projects
Category Use Case PSE OPALCO Avista Energy
NW
SnoPUD
Bulk Energy
Service
Capacity or Resource
Adequacy✓ ✓ ✓
Arbitrage ✓ ✓ ✓
Ancillary
Services
Regulation ✓ ✓
Frequency Response ✓
Transmission
Services
Transmission Deferral ✓
Transmission Charge
Reduction✓ ✓ ✓
Distribution
Services
Conservation Voltage
Reduction✓ ✓ ✓
Utility Bill
Management
Load Shaping Services ✓ ✓
Demand Response ✓ ✓
Demand Charge Reduction ✓ ✓
Customer
Services
Outage Mitigation✓ ✓ ✓

51
Battery Storage Evaluation Tool (BSET)
BSET is used to run a one-year
simulation of storage operations
The formulation considers the
different operation modes of the
storage system and its operational
characteristics
Increasing discharging power for
one energy service decreases the
battery’s capability for other services
Data files are linked through a
simple interface
The primary outputs of the model
are the value of each service and the
optimal number of hours the
storage system would be engaged in
the provision of each serviceThere are losses associated with charging/discharging operations,
which are modeled and considered in the optimal scheduling
formulation in order to capture the maximum obtainable value
to the grid or profit

52
Service Optimization

53
Puget Sound Energy – Glacier Energy Storage System
Issue:
Frequent transmission-line outages in Glacier, WA due to
vegetation.
Solution:
Locate 2 MW – 4.4 MWh lithium-ion battery near
Glacier substation to provide (temporary) backup
power to distribution circuit
$3.8 million grid modernization grant awarded to PSE as
part of Washington Clean Energy Fund (CEF) I
Benefits Explored:
1. Flexibility services
• Energy arbitrage
• Regulation up/down
2. Primary frequency response
3. Capacity
4. Outage Mitigation
With DOE support, PNNL modeled battery operations to determine the long-term financial benefits and costs to Glacier, WA
54
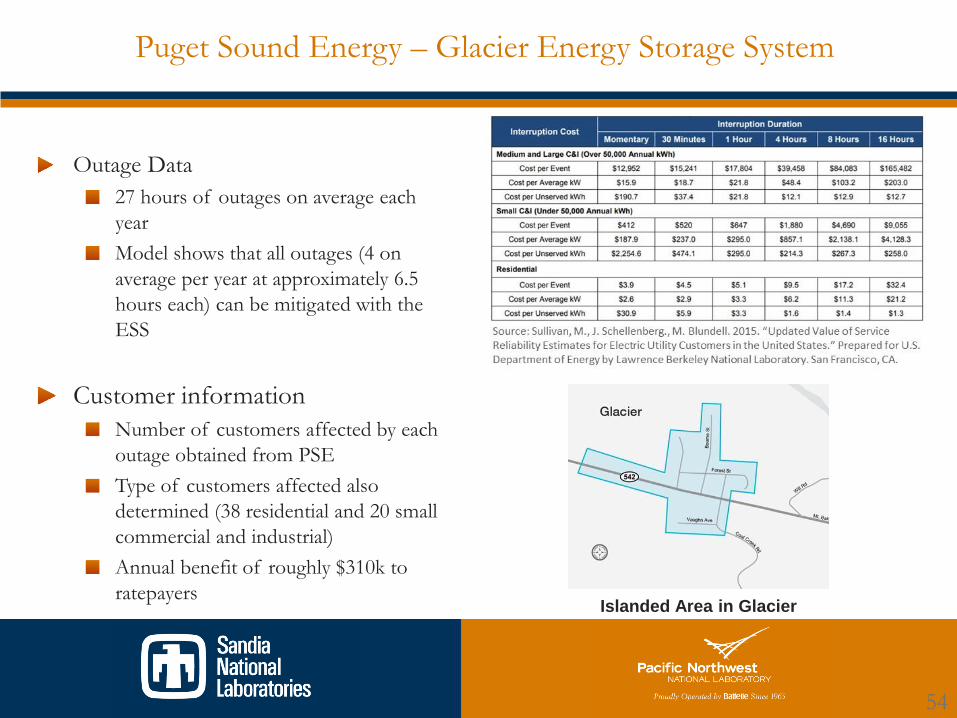
Puget Sound Energy – Glacier Energy Storage System
Outage Data
27 hours of outages on average each
year
Model shows that all outages (4 on
average per year at approximately 6.5
hours each) can be mitigated with the
ESS
Customer information
Number of customers affected by each
outage obtained from PSE
Type of customers affected also
determined (38 residential and 20 small
commercial and industrial)
Annual benefit of roughly $310k to
ratepayersIslanded Area in Glacier

55
Results: Glacier ESS Costs and Benefits (Utility Perspective)
Utility Perspective:
Outage mitigation not included as
a benefit
$3.8 million CEF grant included in
cost recovery
Results:
Total 10-year benefit value of ESS
operations at $2.9 million in present
value (PV) terms, while revenue
requirements are $6.7 million
Benefit-cost ratio (BCR) of 0.44
Benefits are relatively evenly spread
amongst use cases
Highest benefit derived from regulation
services with $902k in 10-year PV benefits
ElementBenefits Revenue
Requirements
Arbitrage $ 550,816
Regulation $ 902,976
Spin & Non-Spin $ -
Primary Frequency Response $ 803,649
Resource Adequacy $ 695,292
Outage Mitigation $ -
Revenue Requirements $ 6,748,775
$ 2,952,733
0
2000000
4000000
6000000
8000000
Benefits Revenue Requirements
Arbitrage Regulation
Spin & Non-Spin Primary Frequency Response
Resource Adequacy Outage Mitigation
Revenue Requirements

56
Results: Glacier ESS Costs and Benefits (Including Outage Mitigation)
Including Outage Mitigation as a benefit increases total 10-year present value by nearly $3 million
Benefit-Cost Ratio nearly doubles to 0.85 with this benefit included
0
1000000
2000000
3000000
4000000
5000000
6000000
7000000
8000000
Benefits Revenue Requirements
Arbitrage Regulation Spin & Non-Spin
Primary Frequency Response Resource Adequacy Outage Mitigation
Revenue Requirements

57
Orcas Power & Light: Energy Storage & Community Solar
Submarine Transmission Cables
Mainland Washington
$1 million grid modernization grant awarded to
Orcas Power & Light Co-Op (OPALCO) as part
of Washington CEF II
0.5 MW / 2 MWh UniEnergy Technology (UET)
Vanadium Redox Flow Battery Used for Modeling
Purposes
504 kW LG Community Solar Array from Puget
Sound Solar Used for Modeling Purposes
Potential PV and energy storage benefits:
Demand charge reduction
Load shaping charge reduction
Transmission charge reduction
Transmission submarine cable replacement deferral
Conservation voltage reduction
Outage mitigation
Transmission Cable Map from Fidalgo Substation in Anacortes to Decatur and Lopez Islands

58
Orcas Power & Light – Results
Sensitivity Analyses:
Outage mitigation not
included in base case
due to utility perspective
analysis. Adding in the
additional use case
increases benefits by
$0.4 million and
provides a BCR of 1.25
Total 20-year value of PV and ESS operations at $3.3 million in PV terms, while PV costs are $2.9 million
for a benefit-cost ratio (BCR) of 1.13
Benefits largely driven by transmission deferral benefit at $2.0 million in PV terms
Cable replacement deferral estimated to be 3.65 years on a 40-year cable
$-
$500,000
$1,000,000
$1,500,000
$2,000,000
$2,500,000
$3,000,000
$3,500,000
Benefits Costs
Load Shaping Charge Reduction Demand Charge Reduction
Transmission Charge Reduction Volt-VAR/CVR
Transmission Deferral Energy Losses
Energy Storage System Rate Impacts Lost Revenue
Gen Set Cost Avoidance Outage Mitigation
PV Energy Production
Key Lesson: The
submarine transmission
cable deferral benefit
represents a unique but
high-value use case.

59
Avista: Turner Energy Storage Project
Issue:
Power sensitive customer at end of two feeders; ride through capability needed during
outages.
Solution:
Locate 1MW – 3.2 MWh battery
near SEL campus
Benefits:
1. Capacity-resource adequacy
2. Energy arbitrage
3. Regulation up/down
4. Conservation voltage reduction
5. Outage management of critical
loads, including addressing voltage sags
UET Battery System in Pullman, WA

60
Avista – Results
Benefits for the base case ($1.2 million), which takes the utility perspective, fall far short of the revenue
requirements for the Turner ESS; benefit-cost ratio is 0.2
Reliability benefits to SEL generate enormous benefits ($9.5 million), expanding the overall benefit-cost
ratio to 1.79
Benefits vs. Revenue Requirements – Utility Perspective Benefits vs. Revenue Requirements – Inclusive of Customer
Reliability Benefits
61
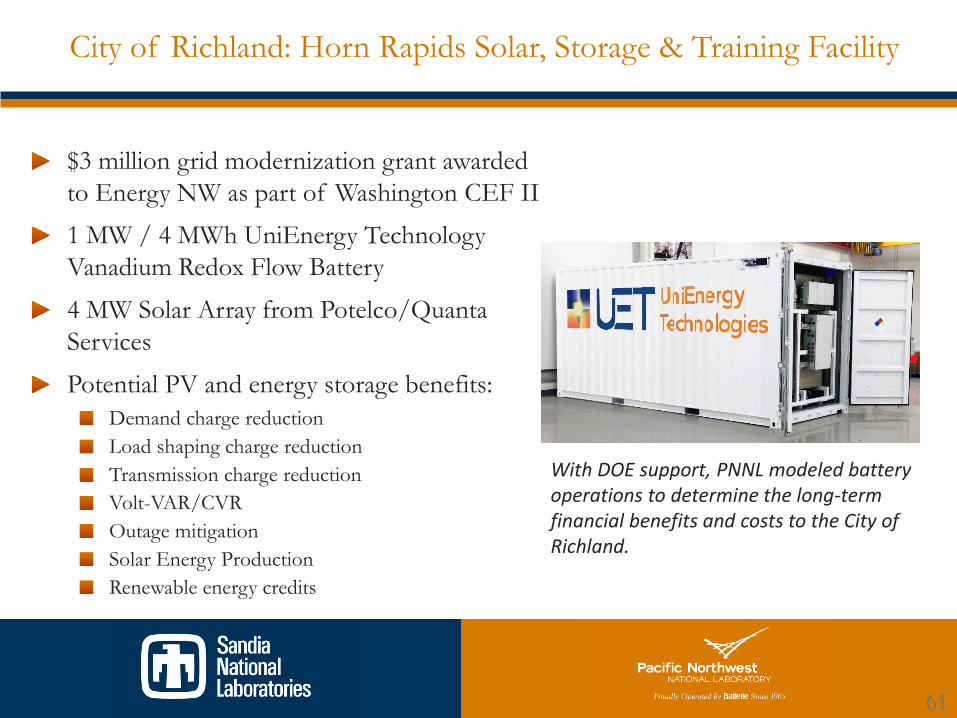
City of Richland: Horn Rapids Solar, Storage & Training Facility
$3 million grid modernization grant awarded
to Energy NW as part of Washington CEF II
1 MW / 4 MWh UniEnergy Technology
Vanadium Redox Flow Battery
4 MW Solar Array from Potelco/Quanta
Services
Potential PV and energy storage benefits:
Demand charge reduction
Load shaping charge reduction
Transmission charge reduction
Volt-VAR/CVR
Outage mitigation
Solar Energy Production
Renewable energy credits
With DOE support, PNNL modeled battery operations to determine the long-term financial benefits and costs to the City of Richland.

62
City of Richland: Results
Total 20-year value of PV and ESS
operations at $13.56 million in
present value terms, while costs are
$12.87 million for a BCR of 1.05.
Based on expected value calculations
Benefits largely driven by demand
charge reduction at $3.4 million in
present value terms and solar energy
production at $2.95 million.
Total system costs
Energy storage estimated at $5.1
million in PV terms
Solar PV costs at $7.8 million
$0
$2,000,000
$4,000,000
$6,000,000
$8,000,000
$10,000,000
$12,000,000
$14,000,000
$16,000,000
Benefits Costs
Avoided Power Cost PV-Related Transmission Benefit
RECs Remarketing Revenue
Demand Charge Reduction Transmission Charge Reduction
Conservation Voltage Reduction BPA Demand Response
Energy Storage System Photovoltaics

63
Snohomish Public Utilities District: MESA 1 and MESA 2
Issue:
Broader effort aimed at transforming how utilities manage grid operations through
advancement of the Modular Energy Storage Architecture (MESA)
Solution:
Locate 2MW – 1 MWh li-ion and 2 MW – 8.0 MWh vanadium flow battery systems at two
substations in Everett, WA to improve the reliability and operating costs of BPA’s
transmission grid
Benefits:
1. Energy arbitrage
2. Minimize load balancing payments to BPA
3. Demand response
4. Capacity
5. Load shaping
6. Transmission congestion reductionMESA 1 - 2 MW / 1 MWh Li-Ion Battery
System in Everett, WA.

64
Non-Linear Battery Model Summary
Model allows estimation of SOC during operation taking
into account
Operating mode
Power
SOC
Temperature
Model has been validated with data
Allows calculation of one way efficiency from rate of
change of SOC
Actual battery performance can be anticipated, thus
providing a high degree of flexibility to the BESS
owner/operator
Self-learning model applicable to energy type of storage
system
Model will be fine-tuned as more data are gathered.

65
Non-Linear Battery Model Enhances Arbitrage Value for SnoPUD
SnoPUD MESA 2UET 2 MW/8 MWh V/V Flow
Annual benefits in energy arbitrage
Key Lesson: Improving operational knowledge
enhances profit potential by finding sweet spots in which
to operate the system to provide services with smaller
profit margins and by minimizing charging losses.
50% more arbitrage revenue possible for
SnoPUD when optimized using self-learning
non-linear battery model
Battery characterization based on data
collected from Avista-operated UET battery
deployed in Pullman, WA.

66
Next Step: Battery State of Health Model
Goal: Develop a reliable and accurate model to predict battery degradation under various
conditions and to integrate it as a module in BSET
Top-down model
Quantifying the effects of energy throughput, charge-discharge power, and operating temperature
Approach being further refined by adding depth of discharge, number of cycles, SOC operation
range, and time at various voltages.
Bottom-up model to estimate battery degradation
The model includes the effect of cycling and calendar aging, taking into account the effect of
temperature and voltage
The model to date accurately predicted degradation after 18 months of testing
Both these approaches will be modified to predict battery degradation across multiple
chemistries – various chemistries within Li-ion and flow batteries.
67
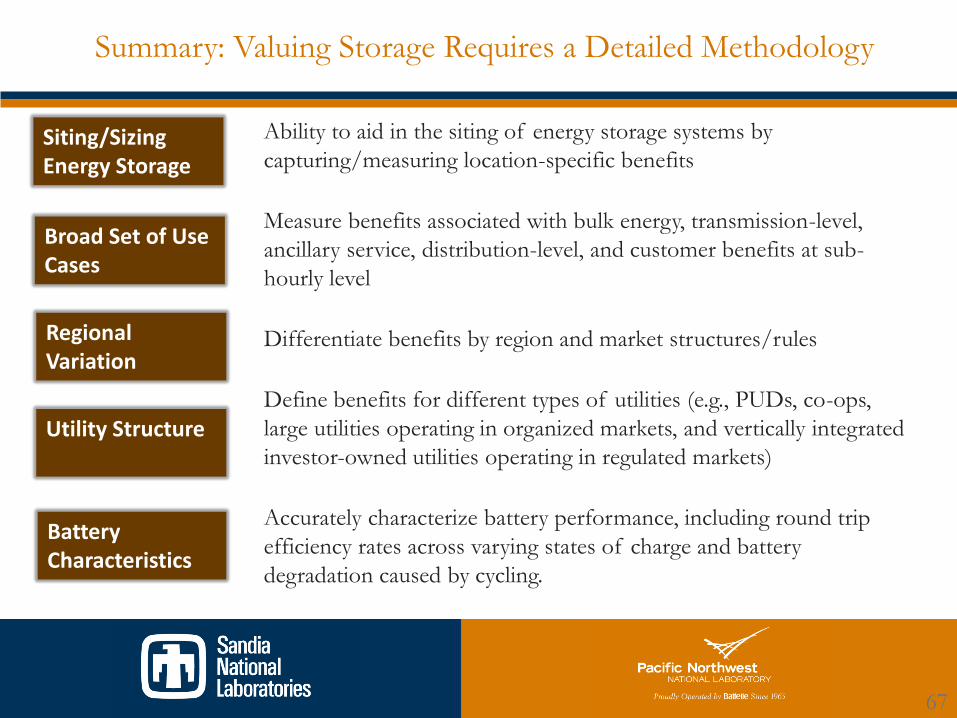
Summary: Valuing Storage Requires a Detailed Methodology
Siting/Sizing Energy Storage
Broad Set of Use Cases
Regional Variation
Utility Structure
Battery Characteristics
Ability to aid in the siting of energy storage systems by
capturing/measuring location-specific benefits
Measure benefits associated with bulk energy, transmission-level,
ancillary service, distribution-level, and customer benefits at sub-
hourly level
Differentiate benefits by region and market structures/rules
Define benefits for different types of utilities (e.g., PUDs, co-ops,
large utilities operating in organized markets, and vertically integrated
investor-owned utilities operating in regulated markets)
Accurately characterize battery performance, including round trip
efficiency rates across varying states of charge and battery
degradation caused by cycling.

68
Energy Storage
Valuation, Applications, and Resilience

69
Energy Storage Applications
Energy storage application time scale
“Energy” applications – slower times scale, large amounts of energy
“Power” applications – faster time scale, real-time control of the electric grid

70
Energy Storage Services (Value Streams)
Source: DOE/EPRI Electricity Storage Handbook in Collaboration with NRECA, 2013J. Eyer and G. Corey, “Energy Storage for the Electricity Grid:Benefits and Market Potential Assessment Guide”http://www.sandia.gov/ess/publications/SAND2010-0815.pdf

71
Why is Storage Valuation Difficult?
Location/Jurisdiction
Market area, e.g., California ISO
Vertically integrated utility, e.g., PNM
Transmission and distribution deferral is very location specific
Many applications require a combination of technical and financial analysis
Dynamic simulations (requires an accurate system model)
Production cost modeling (requires an accurate system model)
Difficult to break out current cost of services, especially for vertically integrated utilities
Identifying alternatives can be difficult
Many storage technologies are not “off-the-shelf ” proven technology (e.g., O&M costs, warranty)
Storage is expensive

72
Storage Valuation Principles
Co-optimization: the system may not fulfill multiple services simultaneously,
and choosing one action may prevent the system from responding effectively to
another opportunity (e.g. discharging for arbitrage may prevent the system from
mitigating an outage)
Performance-informed: asset conditions and performance vary by technology
and design, and we are still learning how precisely systems respond to control
communications and how intensively state of charge (SOC) affects efficiency
Discrete values: benefits must not overlap to avoid double-counting, with a
value developed from an avoided cost, revenue, or societal benefit
Timeframe for analysis: analysis time horizon should be equal to the lifetime
and life-cycle cost of the proposed set of assets
Location: values should reflect local conditions and value streams should be
location-, market-, region-, and utility-specific

73
Energy Storage Value Streams – an example
Renewable firming
For vertically integrated utilities – increased regulating and spinning reserves.
In market areas, adding ramping products.
CA “duck” curve
Solar variability

74
Takeaways
Barriers to energy storage
Cost
Electricity markets/utilities do not properly allocate payments/costs for services
provided
Voltage support
Inertia
Renewable integration
Reliability
The future
Greater penetration of renewables – storage becomes essential
Higher energy prices – storage starts looking better
Lower technology costs – storage starts looking better
Efficient market design – helps pay for storage costs
75
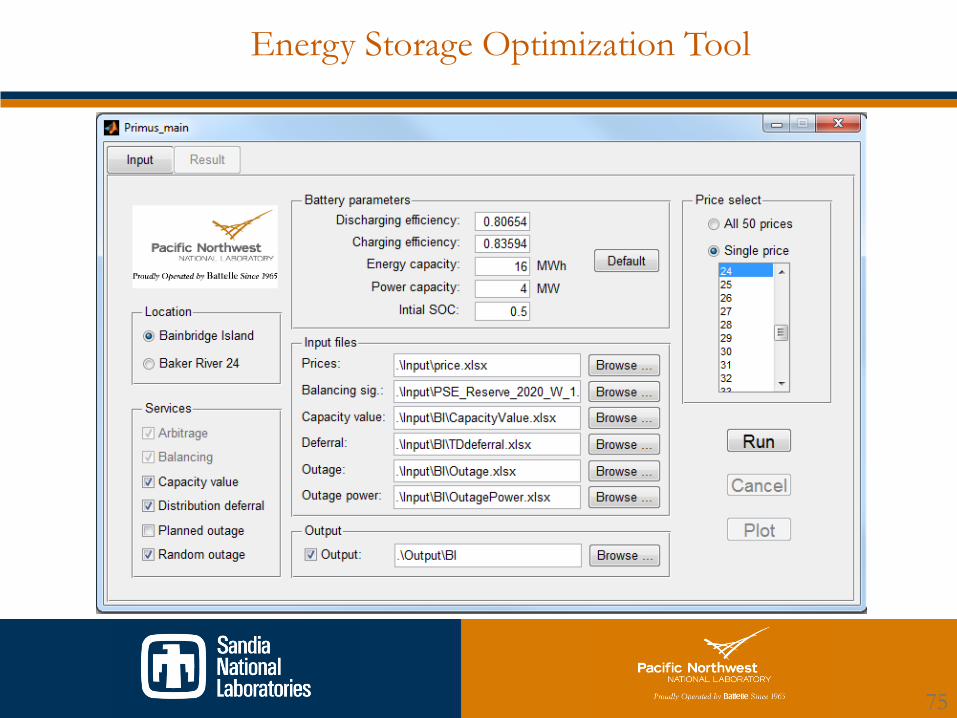
Energy Storage Optimization Tool

76
Example: Hourly value at Bainbridge Island
77
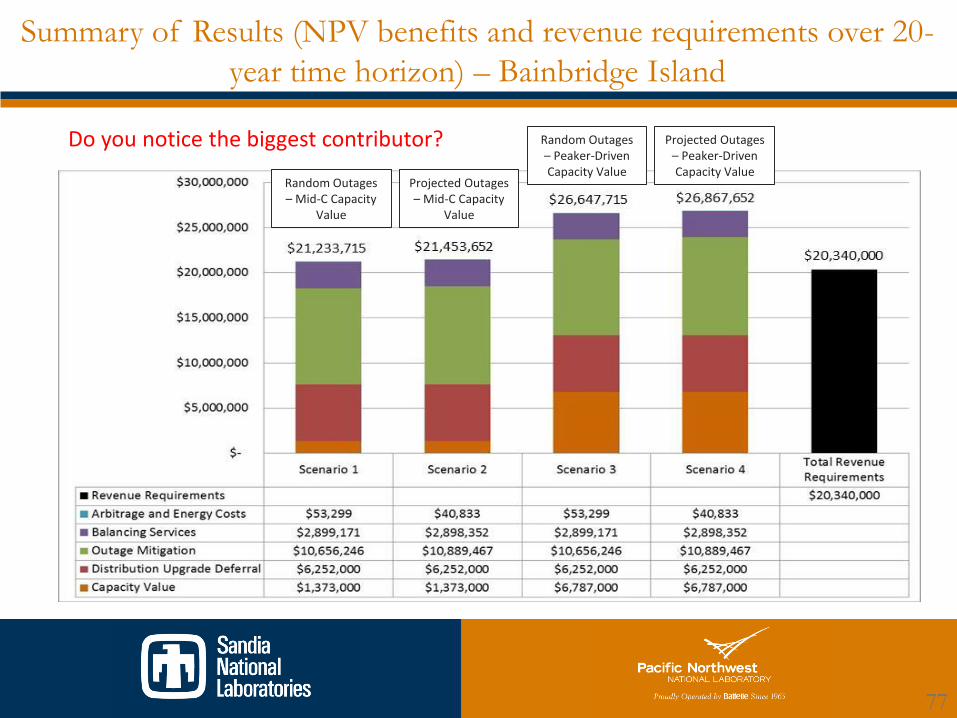
Summary of Results (NPV benefits and revenue requirements over 20-
year time horizon) – Bainbridge Island
Random Outages – Mid-C Capacity
Value
Projected Outages – Mid-C Capacity
Value
Projected Outages – Peaker-Driven Capacity Value
Random Outages – Peaker-Driven Capacity Value
Do you notice the biggest contributor?

78
Estimating the Value of Energy Storage – CAISO Example
Analyzed ~2200 LMP nodes in CAISO
Day ahead market arbitrage
Day ahead and real time market arbitrage
Key takeaways
Revenue opportunity is highly location dependent
Significantly more potential revenue if the real time market is included
Storage model1 MW, 4 MWh80% efficiency

79
Results for DA market arbitrage and frequency regulation1
1R. H. Byrne, T. A. Nguyen and R. J. Concepcion, “Opportunities for energy storage in CAISO," accepted for publication inthe 2018 IEEE Power and Energy Society (PES) General Meeting, August 5-9, 2018.
Estimating the Value of Energy Storage – CAISO Example

80
Sterling Municipal Light Department (SMLD)
Sterling Potential value streams:
Energy arbitrage
Reduction in monthly network load (based on monthly peak hour)
Reduction in capacity payments (based on annual peak hour)
Grid resilience
Frequency Regulation
Grid Resilience was the primary goal – other applications help pay for
the system
Several potential value streams (1MW, 1MWh 2017-18 data)
For more information, please refer to:
R. H. Byrne, S. Hamilton, D. R. Borneo, T. Olinsky-Paul, and I. Gyuk, “The value proposition for energy storage at the
Sterling Municipal Light Department,” proceedings of the 2017 IEEE Power and Energy Society General
Meeting, Chicago, IL, July 16-20, 2017, pp. 1-5. DOI: 10.1109/PESGM.2017.8274631
Description Total Percent
Arbitrage $40,738 16.0%
RNS payment $98,707 38.7%
FCM obligation* $115,572 45.3%
Total $255,017 100%

81
Optimization Results – Typical Week SMLD
• Last week of July 2015• Annual and monthly peaks• Spend the majority of the time
at 50% SOC performing frequency regulation
• Charge up to 100% SOC in hour prior to FCM peak
• Discharge for two consecutive hours (FCM and RNS peak)
• Return to 50% SOC and continue performing frequency regulation
• Note minimal arbitrage (qc, qd)• Assumes an energy neutral
(with losses) regulation signal
2 MW, 4 MWh system

82
RNS monthly peak hour
FCM annual peak hour
Discharge for FCM and RNS hours
Get back to ~50% SOC
REG all the time, except RNS, FCM100% SOC
Optimization Results – Typical Day SMLD

83
QuEST – Open Source Energy Storage Valuation Tool
Sandia released the internal Python-based software tools that have been employed in-house since ~2012
Based on Sandia’s Pyomo optimization framework in Python
High level object oriented language for formulating optimization problems
2016 R&D 100 award winner
Open source software package with technical support from Sandia
Initial capabilitiesRevenue optimization in ISO market areas
Arbitrage and frequency regulation
Planned capabilities for subsequent releasesMicrogrid design and operation
Storage plus solar and wind
Technology selection guideTotal cost of ownership calculations using updated data from the Energy Storage Handbook
Available on GitHub:
https://github.com/rconcep/snl-quest

84
Takeaways
Energy storage is capable of providing a number of grid benefits
Energy storage operation is an optimization problem
Stacking benefits can increase potential revenue …
At the expense of:Potentially accelerated degradation of the energy storage system
Potentially increased complexity of the forecasting and control algorithms
Modeling the degradation as a function of charge/discharge
profile is still an active research area

85
Resilience Includes Reliability

86
Resilience Metrics Should Reflect Consequence
SAIDI and SAIFI are averages. Looking at the distribution is the first step. The second step is understanding that
customers have complex, time-dependent value of avoided outage.

87
Community Resilience and Energy Resilience
The electrical grid is the “keystone” infrastructure
Urban planners focus on community performance when developing resilience
plans
Measure Classification Common Examples
Societal MeasuresNumber of People Without Necessary
Services
Lives at Risk
Net Population Change
Economic MeasuresGross Municipal Product / Net Economic
Losses
Change in Capital Wealth
Business Interruption Costs

88
Considerations for Storage Technology
With storage and advanced inverter functionality, we can consider 100%
renewable, urban microgrids utilizing storage to form community
resilience nodes
Even small amounts of storage can greatly decrease necessary capacity of
fossil generation on resilience nodes
All EV’s are not created equal
Fleet and battery-leasing ownership models
EV+automation
High capacity necessary for resilience benefit

89
Considerations for Regulators
Very hard to annually measure resilience performance without
tying attributes to performance (e.g. through extensive study of
historic performance)
“Who pays” – not binary. All ratepayers receive some benefit from
localized resilience investments, but the local customers benefit
most.
Willingness to pay for resilience – more complex than just one
survey
For more information on the Urban and Community Resilience initiative at Sandia,
contact Bobby Jeffers, [email protected], or visit www.sandia.gov/cities/.

90
Legislative and Regulatory Models for Storage

91
Equitable Regulatory Environment Program Summary
Document federal, state and local policies affecting storage deployment
Review IRP and similar regional, state and community analytic processes affecting
storage development and deployment
Explore alternative policies that may affect technology attributes and deployment
Maintain publicly available information on storage technology and attributes
affecting its deployment
Disseminate comprehensive information on storage technology status,
experience, and realizable contributions to grid resilience, emergency response,
renewable deployment, and asset utilization
Provide best practices for installation and use of energy storage to regulators,
policy makers and industry

92
Documenting Policies: State Storage Policy Database
In recent years, several states have begun to identify and address barriers to
energy storage. PNNL is finalizing an interactive database of state-level energy
storage policies:

93
Procurement Targets
Generally adopted where a state identifies specific issues that energy storage is
expected to address, and current practices that may prevent storage from
adoption in the normal course of business. Currently adopted in seven states:
California: AB 2514 by 2020; 500 MW (distribution-connected) by 2020
Oregon: HB 2193by 2020
Massachusetts: 200 MW by 2020; 1,000 MWh by 2025
New Jersey: 600 MW by 2021; 2,000 MW by 2030
New York: AB 6571
Nevada: SB 204
Colorado: HB 18-270

94
Regulatory Adaptation
Several states have adapted regulations intended to reduce the barriers they
create against energy storage and other flexible, scalable technologies:
California: CPUC adopts 11 rules covering energy storage in planning
Washington: WUTC issues policy statement guiding storage modeling in IRPs
Hawaii: HPUC changes to interconnection requirements encourage storage;
streamlined proceedings for review of flexible resource investments
New Mexico: NMPRC amends IRP rule to require storage analysis
Virginia: Legislature requires distributed energy integration report
Target legislation in OR, MA, NJ also requires PUC to develop processes for
evaluating, siting storage

95
Demonstration Programs
Demonstration programs are state-directed initiatives in which the state
authorizes, and often assists in funding, energy storage projects intended to
assist utilities in gaining operational understanding of energy storage:
Massachusetts: ACES program provides $20 million to 26 projects
New York: REV initiative includes an open call for demonstration project
proposals; four projects developed
Washington: CEF provides $14.3 million for four demonstration projects
Virginia: Legislation authorizes storage demonstration projects of up to 30 MW
Utah: Legislation authorizes energy storage demonstration project

96
Financial Incentives
Six states offer state-funded programs that provide incentives, either as direct
payments or tax rebates, to customers who install energy storage:
California: Self-Generation Incentive Program set aside $378M for customer-sited
energy storage projects from 2017-2021
New York: The New York State Energy Research and Development Authority
provides multiple grant programs to support energy storage developments
Nevada: Legislation expands solar incentive program to include energy storage
Arizona: Regulators authorize $2M incentive program to assist large commercial
customers in deploying behind-the-meter storage for peak management
Vermont: Legislation makes storage eligible for Clean Energy Development Fund
Virginia: Solar development authority expanded to include energy storage

97
Consumer Protection
Two states have adopted legislation that guarantees certain protections to
customers who install energy storage:
Nevada: Legislation establishes a right for customers to install energy storage in a
timely manner, subject to reasonable standards
Colorado: Legislation establishes a right for customers to install energy storage
and directs the Colorado PUC to develop interconnection rules

98
Reviewing Policies: IRP Report
PNNL has a forthcoming report that examines how 21 U.S. utilities are treating
energy storage in integrated resource planning.
An integrated resource plan (IRP) is the process by which a utility identifies its
long-term system needs and the optimal strategy for meeting them.
Why focus on IRPs? An IRP has broad impacts:
It shapes the procurement process;
It establishes avoided costs used for energy efficiency programs and PURPA contracts;
and
For regulated utilities, it serves as the foundation of a prudence determination.
99
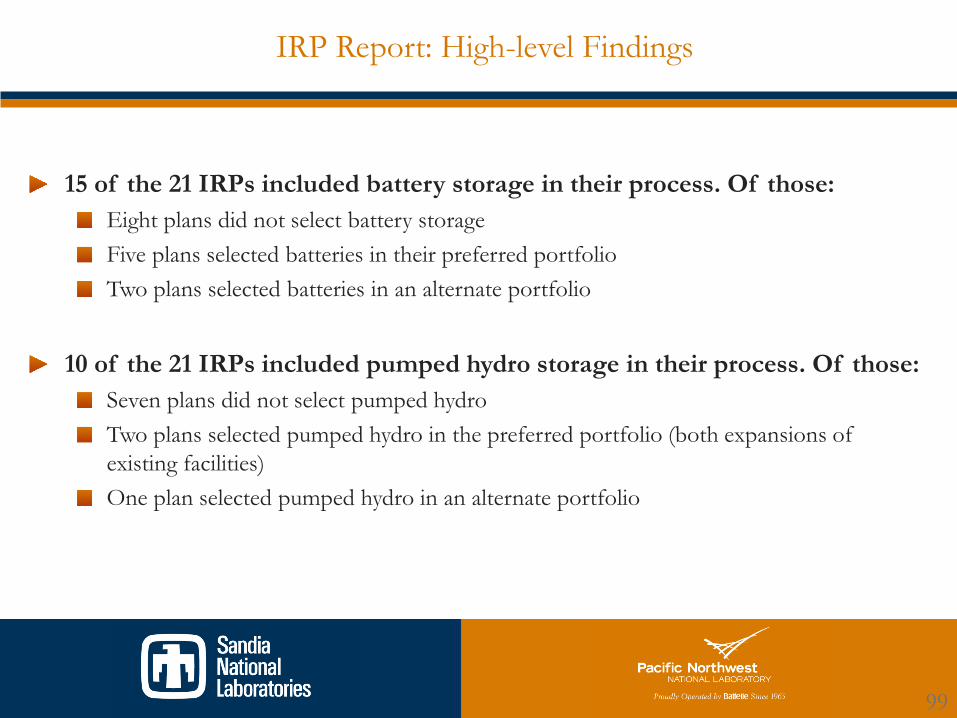
IRP Report: High-level Findings
15 of the 21 IRPs included battery storage in their process. Of those:
Eight plans did not select battery storage
Five plans selected batteries in their preferred portfolio
Two plans selected batteries in an alternate portfolio
10 of the 21 IRPs included pumped hydro storage in their process. Of those:
Seven plans did not select pumped hydro
Two plans selected pumped hydro in the preferred portfolio (both expansions of
existing facilities)
One plan selected pumped hydro in an alternate portfolio

100
IRP Report: Utilities Relatively Uncertain About Battery Costs
Cost assumptions for technologically mature resources such as combustion
turbines and pumped storage tended to cover a smaller range than
assumptions for less mature resources, such as lithium-ion and flow batteries:
$0
$1,000
$2,000
$3,000
$4,000
$5,000
CombustionTurbine
PumpedStorage
Li-Ion Flow
Resource Cost Assumptions, 2017 $ per kW

101
IRP Report: Services Modeled
As utilities account for more services provided by energy storage, the likelihood of storage being selected in the preferred portfolio increases:
Percentage of Utilities Including Battery Storage in the
Preferred Portfolio, by Number of Services Modeled
0%
20%
40%
60%
0
5
10
15
0-2 Services 3-4 Services 6-8 Services Perc
en
tag
e o
f U
tiliti
es
Inclu
din
g B
att
ery
S
tora
ge i
n t
he
Pre
ferr
ed
Po
rtfo
lio
(l
ine)
Nu
mb
er
of
Uti
liti
es
(b
ars
)
Number of Storage Services Included in the Model

102
Resources
DOE Energy Storage Website
(www.sandia.gov/ess/)
DOE Global Energy Storage
Database
(www.energystorageexchange.org)
Energy Storage Association
(www.energystorage.org)
2016 DOE/EPRI Electricity
Storage Handbook in
Collaboration with NRECA
PNNL Energy Storage
(energystorage.pnnl.gov)
103
Acknowledgements
This work was supported by
US DOE Office of Electricity
We thank Dr. Imre Gyuk, Manager of the DOE Energy Storage Program.
Many thanks to the Grid Energy Storage teams at Sandia, PNNL, and
numerous collaborative partners at universities and the industry.