Grenada Co-operative Bank Limited€¦ · Grenada Co-operative Bank Limited A CELEBRATION OF YOUR...
84
Grenada Co-operative Bank Limited A CELEBRATION OF YOUR DREAMS COMING TRUE 2017 ANNUAL REPORT 1 9 3 2 - 2 0 1 7 • O U R D I A M O N D A N N I V E R S A R Y
Transcript of Grenada Co-operative Bank Limited€¦ · Grenada Co-operative Bank Limited A CELEBRATION OF YOUR...

Grenada Co-operative Bank Limited
A CELEBRATION OF YOUR DREAMS COMING TRUE
2017ANNUAL REPORT
193
2 - 2
017 • O
UR D I A M O N D A
N
NIV
ER
SA
RY


GE
NE
RA
L IN
FOR
MA
TIO
NB
US
INE
SS
RE
VIE
W &
AN
ALY
SIS
CO
RP
OR
AT
E G
OV
ER
NA
NC
EFI
NA
NC
IAL
STA
TE
ME
NT
S
Annual Report 2017 1
Table ofContents
Corporate Information
Notice of Annual Meeting
Chairman’s Review
Managing Director’s Discussions & Analysis
ManagementTeam
Selected Financial Statistics
2008 - 2017
Our Mission
Board of Directors Executive Team
Corporate Social Responsibility
Human Resource Report
Audited Financial Report
02
22
21
26
07
14
06
18
24
05
13
04

2 Annual Report 2017
DIRECTORS:AMBROSE PHILLIP, B.Sc., M.Sc.
LESLIE RAMDHANNY, B.Sc., Acc. Dir.
RICHARD W. DUNCAN, B.Sc., M.A., FCGA, AICB, Acc. Dir.
ALFRED LOGIE, Lic., Acc. Dir.
DARRYL BRATHWAITE, Acc. Dir.
DERICK STEELE, Acc. Dir.
GORDON V. STEELE, O.B.E.
LISA TAYLOR, B.A. (Hons.), LL.B (Hons.), Acc. Dir.
RICHARD MC INTYRE, Acc. Dir.
CORPORATE SECRETARY:RICHARD W. DUNCAN, B.Sc., M.A., FCGA, AICB, Acc. Dir.
AUDITORS:MESSRS. BDO EASTERN CARIBBEANKINGSTOWN PARKKINGSTOWNST. VINCENT
SOLICITORS:MESSRS. LEWIS & RENWICKVERITAS LEGALCIBONEY CHAMBERSLAW OFFICE OF ALBAN M. JOHN
LOCATIONS:Head Office#8 Church StreetSt. George’s, Grenada, W.I.Tel: (473) 440-2111/3549Fax: (473) 440-6600Swift Address: GROAGDGDEmail: [email protected]: www.grenadaco-opbank.comfb.com/Grenada.Cooperative.Bank.Limited
St. George’s#14 Church StreetSt. George’s, Grenada, W.I.Tel: (473) 440-2111/3549Fax: (473) 435-9621
GrenvilleVictoria StreetGrenville, St. AndrewTel: (473) 442-7748/7708Fax: (473) 442-8400
SauteursMain StreetSauteurs, St. PatrickTel: (473) 442-9247/9248Fax: (473) 442-9888
Spiceland MallMorne Rouge St. GeorgeTel: (473) 439-0778Fax: (473) 439-0776
CambioMaurice Bishop International AirportTel: (473) 440-2111 Ext. 6357
CarriacouMain StreetHillsboroughTel: (473) 443-6385/8424Fax: (473) 443-8184
CORPORATE INFORMATION
ChairmanDeputy ChairmanManaging DirectorDirectorDirectorDirectorDirectorDirectorDirector
GE
NE
RA
L IN
FOR
MA
TIO
NB
US
INE
SS
RE
VIE
W &
AN
ALY
SIS
CO
RP
OR
AT
E G
OV
ER
NA
NC
EFI
NA
NC
IAL
STA
TE
ME
NT
S
Annual Report 2017 3
CORRESPONDENT BANKING RELATIONSHIPCAD Currency Transfers:
BANK: Bank of MontrealBANK’S ADDRESS: The International Branch,Toronto, CanadaSWIFT ADDRESS: BOFMCAT2ACCOUNT NO.: 1019198TRANSIT #:31442 001
BANK: Crown Agents BankBANK’S ADDRESS: St. Nicholas House, St. Nicholas Road, Sutton, Surrey SM1 1EL, UKSWIFT ADDRESS: CRASGB2LSORT CODE: 608368CAD ACCOUNT NO.: 33025901IBAN: GB97CRAS60836833025901
ECD Currency Transfers:BANK: St. Kitts-Nevis-Anguilla National BankBANK’S ADDRESS: P.O. Box 343,Basseterre, St. Kitts, W.I.SWIFT ADDRESS: KNANKNSKACCOUNT NO.: 24673
GBP/ EUR Currency Transfers:BANK: Lloyds TSBBANK’S ADDRESS: UK International Services,London, UKSWIFT ADDRESS: LOYDGB2LSORT CODE: 30-96-34ACCOUNT NO.: GBP 01017544
EUR 86161549
BANK: Crown Agents BankBANK’S ADDRESS: St. Nicholas House, St. Nicholas Road, Sutton, Surrey SM1 1EL, UKSWIFT ADDRESS: CRASGB2LSORT CODE: 608368ACCOUNT NO.: GBP 33025001IBAN: GB50CRAS60836833025001EUR:
ACCOUNT NO.: EUR 33025401IBAN: GB17CRAS60836833025401
USD Currency Transfers:BANK: Bank of AmericaBANK’S ADDRESS: Miami, FLSWIFT ADDRESS: BOFAUS3MACCOUNT NO.:1901964767ABA #:026009593
BANK: Crown Agents BankBANK’S ADDRESS: St. Nicholas House, St. Nicholas Road, Sutton, Surrey SM1 1EL, UKSWIFT ADDRESS: CRASGB2LSORT CODE: 608368ACCOUNT NO.: USD 33025101IBAN: GB66CRAS60836833025101
TTD Currency Transfers: BANK: Royal Bank of Trinidad & TobagoBANK’S ADDRESS: P.O. Box 287,3B Chancery Lane, Port of Spain,Trinidad & TobagoSWIFT ADDRESS: RBTTTTPXACCOUNT NO.: 8811022477
BBD Currency Transfers:BANK: Republic Bank (Barbados) LimitedBANK’S ADDRESS: No.1 Broad Street,Bridgetown, Barbados SWIFT ADDRESS: BNBABBBBACCOUNT NO.:0229297
ASSOCIATIONSCaribbean Association of BanksGrenada Bankers Association

4 Annual Report 2017
To be the leading Grenadian Provider of High Quality Financial and Related Services to Individuals
and Organizations in Local and International Markets, Maximizing
Benefits for all Stakeholders.
Our Mission

GE
NE
RA
L IN
FOR
MA
TIO
NB
US
INE
SS
RE
VIE
W &
AN
ALY
SIS
CO
RP
OR
AT
E G
OV
ER
NA
NC
EFI
NA
NC
IAL
STA
TE
ME
NT
S
Annual Report 2017 5
Notice of AnnualMeeting
Notice is hereby given that the Eighty-fifth Annual Meeting of the Bank will be held at the National Stadium’s South Conference Room, Queens Park, River Road, St. George’s on January 11, 2018 at 4:45 p.m.
AGENDA
1. To receive the audited financial statements for the year ended September 30, 2017, together with the Chairman’s Review and Managing Director’s Report thereon.
2. To announce a dividend for the year ended September 30, 2017.
3. To elect Directors.
4. To appoint Auditors for the ensuing year.
5. To discuss any other business that may be given consideration at an Annual Meeting.
By order of the Board of Directors
------------------------------------Richard W. DuncanCorporate SecretaryNovember 23, 2017

6 Annual Report 2017
The Board ofDirectors
DERICK STEELE,Acc. Dir.
GORDON V. STEELE,O.B.E.
RICHARD W. DUNCAN, B.Sc., M.A., FCGA, AICB, Acc. Dir.
MANAGING DIRECTOR/CORPORATE SECRETARY
ALFRED LOGIE, Lic., Acc. Dir.
LISA TAYLOR, B.A. (Hons.), LL.B (Hons.), Acc. Dir.
DARRYL BRATHWAITE, Acc. Dir.
AMBROSE PHILLIP, B.Sc., M.Sc.
CHAIRMAN
LESLIE RAMDHANNY, B.Sc., Acc. Dir.
DEPUTY CHAIRMAN
RICHARD MC INTYRE, Acc. Dir.

GE
NE
RA
L IN
FOR
MA
TIO
NB
US
INE
SS
RE
VIE
W &
AN
ALY
SIS
CO
RP
OR
AT
E G
OV
ER
NA
NC
EFI
NA
NC
IAL
STA
TE
ME
NT
S
Annual Report 2017 7
THE ECONOMIC ENVIRONMENT
According to The Conference Board’s Global Economic Outlook for September 2017, the Global economy is estimated to grow at 3.0% for 2017, representing a 0.4 percentage point increase over the actual growth of 2016. This strengthening has been boosted by increased trade of consumer goods and investments. Increased projections for the Global economy are being made heading into 2018.
The US economy is estimated to grow at 2.3%, representing an increase of 0.7 percentage points over 2016 (1.6%). A growth rate of 2.6% is being projected for 2018.
Here at home, from all indications, the Structural Adjustment Program has been a success. This is evidenced by the significant and admirable progress made in the level of buoyancy of government revenues, which bodes well for reducing the high public debt and pursuing growth strategies.
Preliminary data from the ECCB indicate that Grenada’s economy is expected to grow at a rate of 2.9% in 2017; below the ECCU’s average of 3.2%. The performance of the domestic economy was spurred primarily by growth in the following sectors: Education, Real Estate, Communications & Transport, Wholesale and Retail Trade and Construction.
Grenada’s growth for 2018 is projected to be 2.6%. The main drivers of this performance are anticipated to be similar to those of 2017.
Chairman’s Review
Annual Report 2017 7
AMBROSE PHILLIP, B.Sc., M.Sc.Chairman
8 Annual Report 2017
THE BANKING & FINANCIAL SERVICES ENVIRONMENT
As the world languidly returns from the worst hit economic and financial crisis, we expect the effects of the crisis to remain for sometime, i.e. a sluggish economy, characterized by low growth, high unemployment and reduced spending. The banking sector continues to experience year-on-year contraction of its loans and advances portfolio and high liquidity levels, as the demand for credit remains low due to subdued consumer and investor confidence. These developments have coincided with enhanced regulatory oversight and compliance requirements which have driven up costs for banks. Consequently, banks have been restructuring their operations and business models in order to adapt to the changing environment.
The financial landscape is also expected to become even more competitive as commercial banks, credit unions and non-bank financial institutions compete for business from our slowly recovering economy.
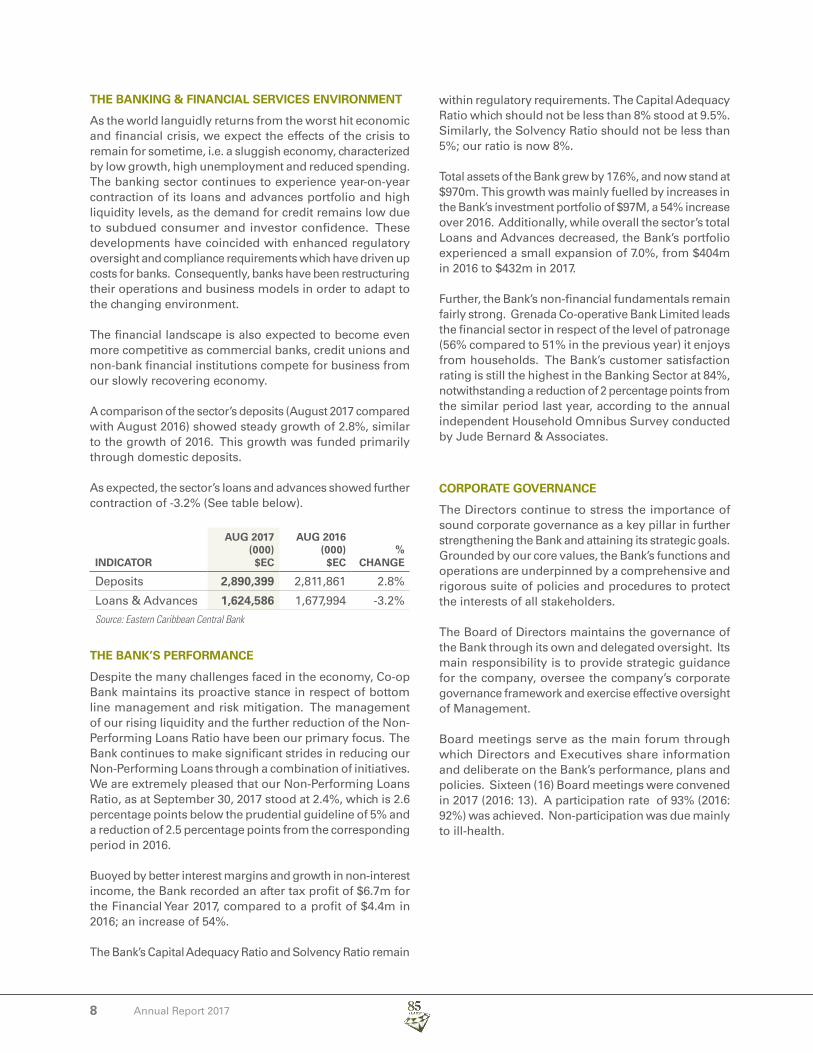
A comparison of the sector’s deposits (August 2017 compared with August 2016) showed steady growth of 2.8%, similar to the growth of 2016. This growth was funded primarily through domestic deposits.
As expected, the sector’s loans and advances showed further contraction of -3.2% (See table below).
INDICATOR
AUG 2017(000) $EC
AUG 2016(000) $EC
%CHANGE
Deposits 2,890,399 2,811,861 2.8%
Loans & Advances 1,624,586 1,677,994 -3.2%
Source: Eastern Caribbean Central Bank
THE BANK’S PERFORMANCE
Despite the many challenges faced in the economy, Co-op Bank maintains its proactive stance in respect of bottom line management and risk mitigation. The management of our rising liquidity and the further reduction of the Non-Performing Loans Ratio have been our primary focus. The Bank continues to make significant strides in reducing our Non-Performing Loans through a combination of initiatives. We are extremely pleased that our Non-Performing Loans Ratio, as at September 30, 2017 stood at 2.4%, which is 2.6 percentage points below the prudential guideline of 5% and a reduction of 2.5 percentage points from the corresponding period in 2016.
Buoyed by better interest margins and growth in non-interest income, the Bank recorded an after tax profit of $6.7m for the Financial Year 2017, compared to a profit of $4.4m in 2016; an increase of 54%.
The Bank’s Capital Adequacy Ratio and Solvency Ratio remain
within regulatory requirements. The Capital Adequacy Ratio which should not be less than 8% stood at 9.5%. Similarly, the Solvency Ratio should not be less than 5%; our ratio is now 8%.
Total assets of the Bank grew by 17.6%, and now stand at $970m. This growth was mainly fuelled by increases in the Bank’s investment portfolio of $97M, a 54% increase over 2016. Additionally, while overall the sector’s total Loans and Advances decreased, the Bank’s portfolio experienced a small expansion of 7.0%, from $404m in 2016 to $432m in 2017.
Further, the Bank’s non-financial fundamentals remain fairly strong. Grenada Co-operative Bank Limited leads the financial sector in respect of the level of patronage (56% compared to 51% in the previous year) it enjoys from households. The Bank’s customer satisfaction rating is still the highest in the Banking Sector at 84%, notwithstanding a reduction of 2 percentage points from the similar period last year, according to the annual independent Household Omnibus Survey conducted by Jude Bernard & Associates.
CORPORATE GOVERNANCE
The Directors continue to stress the importance of sound corporate governance as a key pillar in further strengthening the Bank and attaining its strategic goals. Grounded by our core values, the Bank’s functions and operations are underpinned by a comprehensive and rigorous suite of policies and procedures to protect the interests of all stakeholders.
The Board of Directors maintains the governance of the Bank through its own and delegated oversight. Its main responsibility is to provide strategic guidance for the company, oversee the company’s corporate governance framework and exercise effective oversight of Management.
Board meetings serve as the main forum through which Directors and Executives share information and deliberate on the Bank’s performance, plans and policies. Sixteen (16) Board meetings were convened in 2017 (2016: 13). A participation rate of 93% (2016: 92%) was achieved. Non-participation was due mainly to ill-health.

GE
NE
RA
L IN
FOR
MA
TIO
NB
US
INE
SS
RE
VIE
W &
AN
ALY
SIS
CO
RP
OR
AT
E G
OV
ER
NA
NC
EFI
NA
NC
IAL
STA
TE
ME
NT
S
Annual Report 2017 9
BOARD MEETING ATTENDANCE FOR FINANCIAL YEAR2017 AND 2016
DIRECTORS
% ATTENDANCE
2017 2016
Ambrose Phillip 100 92
Leslie Ramdhanny 93 100
Richard W. Duncan 93 92
Derick Steele 87 85
Gordon V. Steele 93 100
Richard Mc Intyre 100 92
Lisa Taylor 80 92
Darryl Brathwaite 100 100
Alfred Logie 93 77
BOARD COMMITTEES
In order to ensure effectiveness and efficiency in the conduct of its oversight role, the Board now has five (5) sub-committees. Given the growth and risk profile of the Bank’s investment portfolio the Board determined that governance over this aspect of the Bank’s business be enhanced. As a result an Investment Committee was established during the financial year.
1. Audit & Risk Management Committee
Members:
• Lisa Taylor, Chairperson
• Alfred Logie
• Darryl Brathwaite
Role and Responsibilities:
The Audit & Risk Management Committee reviews and maintains oversight of:
• The work of the external and internal auditors
• The financial reporting process
• The effectiveness of the internal controls system
• The risk management policies
• The system for monitoring compliance with laws and regulations
Meetings and Engagements:
The Audit & Risk Management Committee met eight (8) times during the year 2016-2017 with a participation rate of 95%. During the Period, the Committee approved the annual audit plan and reviewed the External Auditor’s Report and the effectiveness of the Bank’s internal controls system via reports prepared by the Chief Audit Executive.
2. Budget Committee
Members:
• Ambrose Phillip, Chairman
• Derick Steele
• Gordon V. Steele
• Richard W. Duncan, Managing Director
Role and Responsibilities:
• The Budget Committee maintains oversight of, and provides strategic guidance on, the company’s fiscal affairs as it relates to matters of Budget, Revenue, Expenditure, Asset Acquisition and Liability Exposures. This is accomplished through the review and recommendation of:
• The corporate balanced scorecard
• Three-year rolling budget forecast
• Annual operating and capital budget
• Financial policies and policy changes
Meetings and Engagements:
The Budget Committee met three (3) times during the financial year with a participation rate of 94% among Committee members. The Committee monitored the implementation of the Bank’s strategy through quarterly balanced scorecard reports and financial reviews; and approved the Bank’s strategic plan 2018-2020 and its 2018 annual operating and capital budget.
3. Credit Committee
Members:
• Leslie Ramdhanny, Chairman
• Gordon V. Steele,
• Richard Mc Intyre
Role and Responsibilities:
The Credit Committee maintains oversight responsibility for approving and or reviewing:
• The Credit Risk Strategy
• The credit risk control environment
• The credit risk policies
• Credit applications within delegated limits and authority
Meetings and Engagements:
The Credit Committee met eleven (11) times during the year to monitor the Bank’s implementation of its credit strategy and to adjudicate on credit facilities.
10 Annual Report 2017
4. Investment Committee
Given the Bank’s strategy to grow its investment portfolio, the Investment Committee was established in July 2017 to ensure sound risk management and effective governance over the Bank’s investment function.
Members:
• Ambrose Phillip, Chairman
• Leslie Ramdhanny, Deputy Chairman
• Richard W. Duncan, Managing Director
• Gordon V. Steele
• Richard Mc Intyre
Responsibilities:
The Investment Committee reviews and maintains oversight of:
• The Bank’s investment strategies;
• Investment risks and frameworks for the management of these risks.
• Policy and policy changes with respect to investments; and ensure that the portfolios are managed in accordance with the Bank’s policies, applicable laws and regulations.
• The sanction of new investments in accordance with the limits specified by the Board.
5. Human Resource & Compensation Committee
Members:
• Ambrose Phillip, Chairperson
• Gordon V. Steele
• Leslie Ramdhanny
Responsibilities:
The Human Resource & Compensation Committee provides strategic guidance to the company’s affairs as it relates to matters of Human Resources and Compensation. This is accomplished through the review and oversight of:
• The Human Resources Strategy
• The Human Resource policies and procedures
• The performance of the Managing Director
• The remuneration and compensation package to staff, in particular Executives and Directors.
Meetings and Engagements:
The Human Resource & Compensation Committee met three (3) times during the year with a participation
rate of 100% among Directors. The Committee met to approve the Job Accountability of the Managing Director; and monitor and evaluate his performance in accordance with the Bank’s Performance Management System. The Committee also received updates on the progress of the Succession Planning Programme. In addition, the Committee also made recommendations to the full Board regarding enhancements in the compensation package for Directors along with a review of the required skills and competencies for the Board.
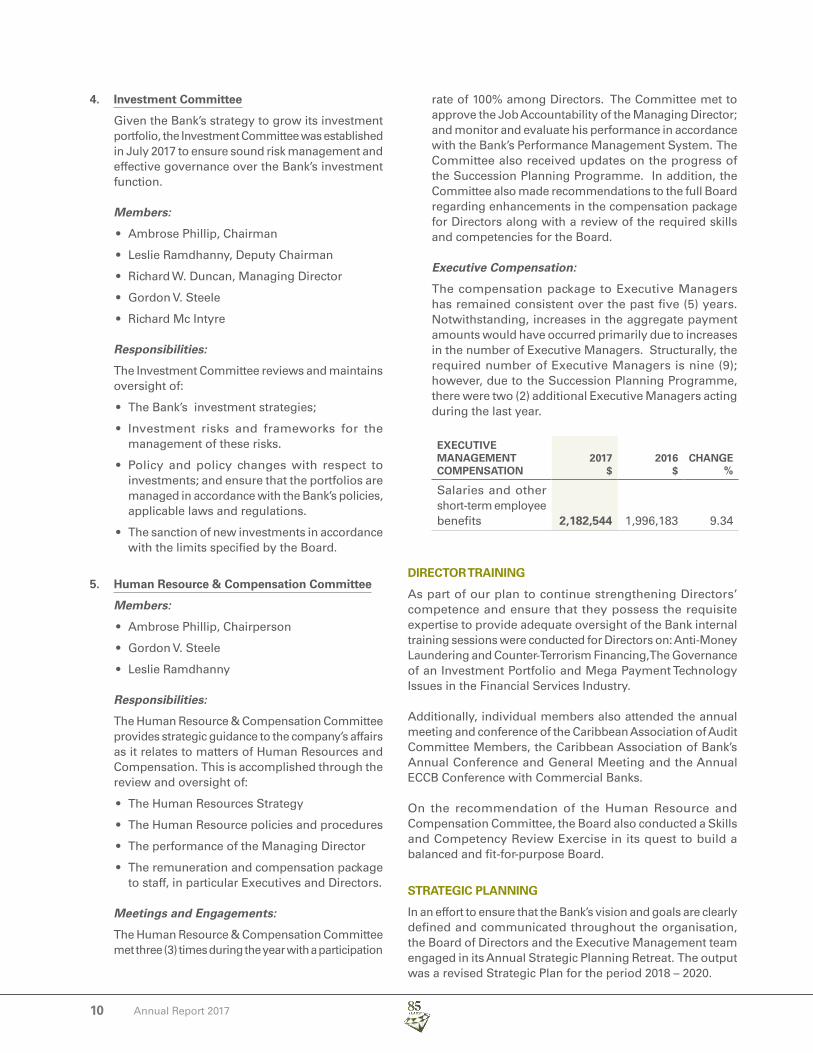
Executive Compensation:
The compensation package to Executive Managers has remained consistent over the past five (5) years. Notwithstanding, increases in the aggregate payment amounts would have occurred primarily due to increases in the number of Executive Managers. Structurally, the required number of Executive Managers is nine (9); however, due to the Succession Planning Programme, there were two (2) additional Executive Managers acting during the last year.
EXECUTIVE MANAGEMENT COMPENSATION
2017$
2016$
CHANGE%
Salaries and other short-term employee benefits 2,182,544 1,996,183 9.34
DIRECTOR TRAINING
As part of our plan to continue strengthening Directors’ competence and ensure that they possess the requisite expertise to provide adequate oversight of the Bank internal training sessions were conducted for Directors on: Anti-Money Laundering and Counter-Terrorism Financing, The Governance of an Investment Portfolio and Mega Payment Technology Issues in the Financial Services Industry.
Additionally, individual members also attended the annual meeting and conference of the Caribbean Association of Audit Committee Members, the Caribbean Association of Bank’s Annual Conference and General Meeting and the Annual ECCB Conference with Commercial Banks.
On the recommendation of the Human Resource and Compensation Committee, the Board also conducted a Skills and Competency Review Exercise in its quest to build a balanced and fit-for-purpose Board.
STRATEGIC PLANNING
In an effort to ensure that the Bank’s vision and goals are clearly defined and communicated throughout the organisation, the Board of Directors and the Executive Management team engaged in its Annual Strategic Planning Retreat. The output was a revised Strategic Plan for the period 2018 – 2020.

GE
NE
RA
L IN
FOR
MA
TIO
NB
US
INE
SS
RE
VIE
W &
AN
ALY
SIS
CO
RP
OR
AT
E G
OV
ER
NA
NC
EFI
NA
NC
IAL
STA
TE
ME
NT
S
Annual Report 2017 11
ANNUAL BOARD SELF-EVALUATION
The Annual Board Self-Evaluation uses a questionnaire to elicit responses that allow Directors to examine the performance of the Board on the following broad dimensions:
a) How well has the Board done its job
b) How well the Board conducts itself
c) Relationship with the Managing Director
d) Performance of Individual Board Members
A comparative analysis of 2017 and 2016 results revealed the following:
DIMENSION2017
RESULTS2016
RESULTS COMMENTS
A – Board Performance 85% 83%Consistently, the Board has performed above average over the two year period
B – Board Conduct 77% 78%The Conduct of the Board met expectations notwithstanding the slight reduction in the performance of 1 percentage point.
C – Relationship with Managing Director 83% 78%
The Board’s relationship with the Managing Director remains high with an above average rating attaining an improvement of 5 percentage points in 2017 over 2016.
D – Individual Performance 87% 83%Directors rated their individual performance at an above average level over the period, with an increase of 4 percentage points.
DIRECTORS’ INTERESTS
The table below shows the shareholdings of Directors as at September 30 2017 with comparisons to the previous year.
DIRECTOR TITLENO. OF
SHARES 2017NO. OF
SHARES 2016 CHANGE
Ambrose Phillip Chairman 5,000 5,000 -
Leslie Ramdhanny Deputy Chairman 15,000 15,000 -
Richard W. Duncan Managing Director 21,300 21,300 -
Derick Steele Director 278,088 278,088 -
Gordon V. Steele Director 173,620 166,620 7,000
Richard Mc Intyre Director 9,000 9,000 -
Lisa Taylor Director 2,000 2,000 -
Darryl Brathwaite Director 3,857 3,857 -
Alfred Logie Director 2,000 2,000 -
CHANGES TO THE BOARD
There were no changes to the composition of the Board of Directors at the Annual Meeting or subsequently.
Director Leslie Ramdhanny and I were entrusted by our fellow Directors with the roles of Chairman and Deputy Chairman, respectively, in February 2017, following the Annual Meeting of Shareholders on January 12 2017.

12 Annual Report 2017 13Annual Report 2017
DIVIDEND POLICY
The Bank’s conservative dividend policy ensures that it can pay and sustain a consistent level of dividends notwithstanding the significant challenges posed by the Financial Services Sector, and the economy.
In congruence with this policy, the Board of Directors has declared a dividend of $0.15 per share for the 2017 financial year.
The annexed statement of changes in equity shows that:
The Net profit for the year amounts to
Retained earnings at the beginning of the year
6,732,801
7,656,161
Transferred to Statutory Reserves
Transferred to General Reserves
Transferred to Regulatory Loss reserves
Dividend paid for the year ended September 2016
14,388,962
(1,346,560)
(168,320)
(2,161,816)
(836,000)
Retained Earnings as at September 30, 2017 9,876,266
FUTURE PROSPECTS
As we forge ahead in anticipation of several more challenging years, the Bank remains both cautious and resolute in facing the oncoming headwinds in a still weak but slowly strengthening economy. The Bank holds a positive outlook of Grenada’s continued recovery and growth potential, as well as its own capacity to profitably grow all avenues of business.
Our key areas of focus will be as follows:
• Delivering a superior customer experience
• Quality loan portfolio growth
• Liquidity management
• Delinquency management
RETIRING DIRECTORS
The Directors retiring are Messrs Leslie Ramdhanny, Gordon V. Steele and Alfred Logie who, being fit and proper and eligible, offer themselves for re-election.
APPOINTMENT OF AUDITORS
The retiring Auditors, Messrs BDO Chartered Accountants, offer themselves for re-appointment.
ACKNOWLEDGEMENTS
First, I wish to convey my sincerest appreciation and gratitude to my colleague Directors for the trust placed in me as Chairman of our only local indigenous Bank. They have consistently demonstrated their commitment to the effective oversight of the Bank and have been essential in responding to the challenges presented by the economic environment and ensuring the Bank’s sustained progress.
Secondly, I wish to record my appreciation to the former Chairman, Derick Steele and former Deputy Chairman, Gordon V. Steele, OBE for their stewardship during their term in office.
Thirdly, I would like to thank the Management and Staff for their continued commitment to the mission of the Bank. The excellent overall performance of the Bank would not have been possible without your dedication to duty.
Finally, to all our valued customers and shareholders, I express my heartfelt appreciation for your continued patronage and support for Co-op Bank.
..........................................Ambrose Phillip B.Sc., M.Sc.CHAIRMAN
November 23, 2017

GE
NE
RA
L IN
FOR
MA
TIO
NB
US
INE
SS
RE
VIE
W &
AN
ALY
SIS
CO
RP
OR
AT
E G
OV
ER
NA
NC
EFI
NA
NC
IAL
STA
TE
ME
NT
S
12 Annual Report 2017 13Annual Report 2017
DEON MOSES,B.Sc., MBA., FICB
CHIEF OPERATING OFFICER
RICHARD W. DUNCAN, B.Sc., M.A., FCGA, AICB, Acc. Dir.
MANAGING DIRECTOR
AARON LOGIE, FCCA, MBA
EXECUTIVE MANAGER, FINANCE (On Rotation)
JULIA G. LAWRENCE, B.S., MBA-IBF
CHIEF AUDIT EXECUTIVE
JENNIFER ROBERTSON,AICB, CIRM, CRU, PgCert. Dip.
EXECUTIVE MANAGER, RISK (Ag.)
FLOYD DOWDEN,AICB, AML/CA, MBA-IB
EXECUTIVE MANAGER, OPERATIONS & ADMINISTRATION
NADIA FRANCIS-SANDY,B.Sc., M.Sc., PhD
EXECUTIVE MANAGER, CORPORATE & COMMERCIAL BANKING
WILLVORN GRAINGER,CRU, Dip., M.A.
EXECUTIVE MANAGER, RETAIL BANKING
RICHARD MEDFORD,B.Sc
EXECUTIVE MANAGER, OPERATIONS & ADMINISTRATION (Ag.)
ALLANA JOSEPH,B.Sc., CGA, CPA, AICB
AML/CAEXECUTIVE MANAGER, FINANCE (Ag.)
NICOLA PHILIP-WALCOTT,B.Sc., CCP, MBA
EXECUTIVE MANAGER, HUMAN RESOURCES
Executive Team

14 Annual Report 2017 15Annual Report 2017
Managing Director’sDiscussion & Analysis
OVERVIEW
The Banking sector continued to experience challenges in 2017, attributed to a highly competitive market for loans and advances, excess liquidity and changing compliance mandates. Notwithstanding, the growth in the economy and the implementation of appropriate risk management strategies have helped the Bank to buttress the impact.
One of the most significant achievements for the Bank in 2017 is the marked reduction of the Non-Performing Loan (NPL) ratio from 4.87% at the end of the 2016 financial year to 2.36% as at September 30, 2017; well below the prudential guideline of 5%.
The steady improvement in after tax profit since 2014, has accelerated in 2017 with an after tax profit of $6.7m, an increase of 54% over 2016. This performance was driven by an increase in Other Operating Income, Interest Income from investments and continued reduction in Interest Expense.
Such a performance demonstrates the Bank’s commitment and ability to manage and adjust to the risks within the local and global environment.
INCOME
Total Operating Income, which comprises of Net Interest Income and Other Operating Income, increased by $6.6m or 17% to $45.9m in 2017, as compared to $39.3m recorded in 2016. The main contributor to this outcome is as a result of a $6.0m or 33% increase in Other Operating Income.
In 2017, Interest Expense declined by $0.6m despite the $121.2m or 16% increase in deposits from customers. This decrease was due to the application of strategies to manage the Bank’s interest expense. The Bank also realized a significant increase of $1.9m or 29% in Investment Income in line with the increase and composition of the investment portfolio.
RICHARD W. DUNCAN, B.Sc, M.A., FCGA, AICB, Acc. Dir.Managing Director

GE
NE
RA
L IN
FOR
MA
TIO
NB
US
INE
SS
RE
VIE
W &
AN
ALY
SIS
CO
RP
OR
AT
E G
OV
ER
NA
NC
EFI
NA
NC
IAL
STA
TE
ME
NT
S
14 Annual Report 2017 15Annual Report 2017
OPERATING EXPENSE
Operating Expenses increased by 13% or $3.5m in 2017. The main driver of this increase was staff costs, professional fees and other operating expenses, each growing by 7%, 217% and 29%, respectively.
ASSETS AND LIABILITIES
The Bank’s total assets grew by $145.0m or 18% over 2016. The main areas of growth were financial investments, other assets and property, plant and equipment.
Expansion of deposits from customers of $121.2m or 16% headlined the growth in liabilities; followed by trade and other payables which grew by $2.5m or 33%.
CUSTOMERS’ LOANS AND ADVANCES
Despite the highly competitive credit environment, the Bank was able to grow its loan portfolio to $432.0m or 7% over 2016, with all loan types contributing to the said performance. This growth has been spurred by a rebounding economy and measured consumer confidence. The Bank will continue its focus on sustaining loan portfolio growth within the ambit of our credit risk management strategies and appetite.
LOANS BY TYPE
All loan types showed growth during the 2017 financial year. The total loan portfolio at the end of 2017 comprised of 47% mortgage loans and 45% commercial loans.
The largest increases were seen in demand loans (21%), followed by commercial loans (13%) and overdrafts (11%).
$1
-$1-$2-$3-$4
-$5
$0
$2$3$4$5$6$7
Net Income: 2013 - 2017
2013 2014 2015 2016 2017
IN MILLIONS
$380
$390
$400
$410
$420
$430
$440
2015 2016 201720142013
Loans and Advances: 2013 - 2017
IN MILLIONS
$460
$440
$420
$400
$380
$360
$340
$320
Other AdvancesDemand LoansMortgages
Loans By Type: 2013 - 2017
2013 2014 2015 2016 2017
IN MILLIONS
$0
$200
$400
$600
$800
$1,000
Assets Employed : 2013 to 2017
2013 2014 2015 2016 2017
IN MILLIONS

16 Annual Report 2017 17Annual Report 2017
LOANS BY ECONOMIC SECTOR
An analysis of the loan portfolio by economic sector reveals changes in the composition over 2016. Increases were recorded in most sectors, with the largest increases being attributed to Transportation & Storage (157%), Entertainment & Catering (31%) and Distributive Trades (21%).
On the contrary, the largest decline by sector was observed in Public Administration, Utilities, and Agriculture, declining by 100%, 37% and 10%, respectively.
NON-PERFORMING LOANS
Our commitment to ensuring quality loans within the portfolio continues to bear fruit evidenced by the sustained improvement in the Non-Performing Loan (NPL) ratio. The NPL ratio improved by 2.51 percentage points, moving from 4.87% in 2016 to 2.36% in 2017. The Bank, remains steadfast in its quest to remain compliant with the ECCB prudential benchmark of 5% by applying tactical methods to minimize the migration of loans into non-performing status.
FINANCIAL INVESTMENTS
The Bank’s investment portfolio increased by $97.0m over the 2016 financial year, due largely to the growth in short-term investment instruments. The investment portfolio is structured to assist with liquidity management while realising favourable returns.
CUSTOMERS’ DEPOSITS
Deposits from customers, the Bank’s largest liability, constituted 99% of the Bank’s total liabilities, and increased by $121.2m or 16% to $888.0m in 2017, as compared to $767.0m in 2016.
2013 2014 2015 2016 2017
4%
8%
12%
16%
0%
NPL Ratios: 2013 - 2017
2013 2014 2015 2016 2017
$50
$100
$150
$200
$300
$250
$0
Investments: 2013 - 2017
IN MILLIONS
IN MILLIONS
Customer Deposit: 2013 - 2017
0
200
400
600
800
1000
2013 2014 2015 2016 2017
FixedDeposits
TreasureChest
SavingsDeposits
PersonalChequing
CurrentAccounts
Deposit by type : 2013 to 2017
$0
$100
$50
$150
$200
$250
$300
$350
2013 2014 2015 2016 2017
IN MILLIONS

GE
NE
RA
L IN
FOR
MA
TIO
NB
US
INE
SS
RE
VIE
W &
AN
ALY
SIS
CO
RP
OR
AT
E G
OV
ER
NA
NC
EFI
NA
NC
IAL
STA
TE
ME
NT
S
16 Annual Report 2017 17Annual Report 2017
Our new Branch Business Model will also be consolidated allowing for more efficient service delivery and enhanced customer experience through customer segmentation and portfolio allocation.
APPRECIATION
I wish to record my gratitude and appreciation to our customers, shareholders and other key stakeholders for their unrelenting support and confidence in Grenada Co-operative Bank Limited. Their contribution and loyalty are critical to the continued growth and success of the Bank.
I also thank our Board, Management Team and Staff for their commitment to the Bank’s mission and vision and look forward to their continued dedication in 2018.
..........................................Richard DuncanMANAGING DIRECTORNovember 23, 2017
DEPOSITS BY TYPE
The continued growth of deposits in 2017 amplified the excess liquidity in the banking system. Increases were realized across the portfolio, except for fixed deposits, which stood at $204.0m (27% of deposits) in 2016, decreasing to $192.0m in 2017 (22% of deposits). Savings deposits, totaled $344.0m in 2016 increased to $378.0m in 2017; representing a growth of 12% and remains the largest component of the deposit portfolio. Demand deposit accounts recorded the largest growth over 2016 of 44%; which represented an increase of $97.0m taking the total of demand deposit accounts to $318.0m at the end of 2017.
LIQUIDITY
The table hereunder compares the Bank’s liquidity ratios as at September 2017 against the ECCB prudential requirements. A further reduction in the Loans to Deposits ratio was realized in 2017, compared to the 53% achieved in 2016.
Benchmark GCBL
Minimum reserves >6% 10%
Loans to deposits 75% - 85% 49%
Net Liquid Asset ratio >20% 45%
The low Loans to Deposit ratio is the product of a highly liquid market impacted by two (2) factors: (i) a rapidly growing deposit portfolio and (ii) the deposit portfolio growth exceeding the rate of growth of the loan portfolio. The Bank remains committed to managing this decline, through strategies geared at the efficient allocation of excess liquidity and the growth of the loan portfolio in a competitive but weak market for credit.
FUTURE DEVELOPMENTS
In continuous pursuit of our Customer Centric Strategy, our Spiceland Mall Retail Banking Unit shall be relocating to a more spacious and accommodating location at the new extension of Spiceland Mall. This has become necessary in order to meet the needs of our growing customer base in the south of the Island.
Additionally, in the first quarter of the new financial year, the Bank shall be extending its suite of products and services with the launch of its Brokerage and Investment Services.

18 Annual Report 2017 19Annual Report 2017
SPORTS
For the second consecutive year Co-op Bank was the sole sponsor of the Carriacou T20 Cricket Tournament, which ended in February. The 2017 tournament was keenly
Corporate Social Responsibility
This year we are proud to be celebrating eighty-five (85) years of sterling service and commitment to the Grenadian community through…
EDUCATION
The Bank’s Super Starter Education Investment Plan continues to offer beneficiaries the opportunity to win scholarships annually. Fourteen (14) scholarships were awarded to students enrolled in the Plan: seven (7) in the Silver category, to cover primary school expenses; and seven (7) in the Gold category, to cover secondary school expenses. Star Points were also awarded to students of the Plan - $3 for each ‘A’ or Grade 1 received, which is added to the Plan. The Bank encourages all customers enrolled in the Plan to remain committed and enjoy the benefits of the programme.
Over the years, Grenada Co-operative Bank Limited (Co-op Bank) has shown its ability to anticipate and respond to the changing environment and needs of its customers.
Mr. Floyd Dowden, Executive Manager, Operations & Administration (On Rotation) and Mrs. Tracey Joseph, Customer Care Supervisor, with Silver and Gold Super Starter Education Investment Plan Scholarship winners
Brunswick Red Devils, 2017 Champions, Carriacou T20 Cricket

GE
NE
RA
L IN
FOR
MA
TIO
NB
US
INE
SS
RE
VIE
W &
AN
ALY
SIS
CO
RP
OR
AT
E G
OV
ER
NA
NC
EFI
NA
NC
IAL
STA
TE
ME
NT
S
18 Annual Report 2017 19Annual Report 2017
contested with friendly competitive rivalry among teams and community members. Ten (10) teams participated in the Tournament, which ran for six (6) weekends with Brunswick Red Devils emerging as the 2017 champions.
Co-op Bank Primary Schools’ Games remain a staple event in the Bank’s community outreach programme. The Bank, as the major sponsor of the games, has under its umbrella the St. Patrick, St. Andrew, St. Mark, St. David, St. John and Carriacou & Petite Martinique parish games, as well as the National Games. This significant contribution towards the development of sports and the future athletic professionals within our community is a source of great pride to the Bank.
The Bank was also proud to support the return of the Whitsuntide Games as a Gold Sponsor, after the Games prolonged absence from the sporting scene. The Games attracted over 200 athletes and coaches from Grenada and the region.
CULTURE AND THE PERFORMING ARTS
As an advocate for the development of culture and the performing arts, the Bank was the Presenting Sponsor of “Pure Spice” - the final event of the Pure Grenada Music Festival. Pure Spice, a family oriented affair featuring local musical talents, was the perfect end to a successful Festival.
PROMOTION OF HEALTHY LIFESTYLES
The Bank continues to promote its Healthier Lifestyles Programme with its 9th Annual Pump it Up! Family Fun Walk. The event took place during April 2017, in both Grenada and Carriacou. This year the Bank welcomed on board Jonas Browne & Hubbard (G’da) Limited, Guardian Group (OECS) Limited and FLOW, as Alliance Partners in the quest to raise funds over the next five (5) years toward the re-establishment of the Carlton Home, a rehabilitation centre for substance abusers.
Presentation to Chief Medical Officer - Pump it Up Grenada
Pure Spice, Pure Grenada Music Festival
Presentation to Grenada Athletics Association for Whitsuntide Games
Co-op Bank Primary Schools’ Games - Mr. Roland Fletcher and athlete
Presentation - Pump it Up Carriacou

20 Annual Report 2017 21Annual Report 2017
SUPPORT OF DIASPORA INITIATIVES
As Bank of the Diaspora, Co-op Bank participated in the Grenada Heritage Day celebrations in London during the month of August. Patrons appreciated the Bank’s presence and valued the information provided on the products and services available to them while overseas.
SUPPORT TO HURRICANE RAVAGED COLLEAGUES
Co-op Bank’s role as a good corporate citizen is not limited to our homeland but also extends to our brothers and sisters throughout the region. Consequently, the Bank leaped at the opportunity to assist the victims of Hurricanes Irma and Maria by donating substantially to relief efforts in Dominica and throughout the region. Members of staff also made contributions towards the relief efforts.
STRENGTHENING CONFIDENCE OF OUR CUSTOMERS
Ranking number one (1) in customer patronage among financial institutions in Grenada, the Bank remained the Bank of choice among customers as reported in the annual Omnibus survey.
Co-op Bank continues to focus on customer centricity by providing high quality service. Consequently, members of staff are continually recognised based on customer feedback on a monthly, quarterly and annual basis. The annual winner for 2017 was Ms. Michal Alexander.
The 2017 audit of of our Customer Service Charter revealed that 65% of our customers were satisfied with our service. The Bank remains committed to the standards promised in our Customer Service Charter.
Booth at Heritage Day, London

GE
NE
RA
L IN
FOR
MA
TIO
NB
US
INE
SS
RE
VIE
W &
AN
ALY
SIS
CO
RP
OR
AT
E G
OV
ER
NA
NC
EFI
NA
NC
IAL
STA
TE
ME
NT
S
20 Annual Report 2017 21Annual Report 2017
SUSAN REDHEAD,AB
MANAGER, RECOVERIES & COLLECTIONS
PETER ANTOINE,B.Sc., AICB,
SENIOR PROGRAMME & RESEARCH OFFICER
WILFRED GARY SAYERS,BBA, MBA
OFFICER ON ROTATION
SHANE REGIS,AICB, B.Sc.
MANAGER, SALES & SERVICES, GRENVILLE
ROGER DUNCAN,FICB
MANAGER, SALES & SERVICES,ST. GEORGE’S
RACHAEL PHILLIP-BETHEL,
MANAGER, SALES & SERVICES, CARRIACOU
GARVIN BAPTISTE,B.Sc.
SENIOR IT OFFICER
MARQUEZ MC SWEEN,
MANAGER, SALES & SERVICES,SPICELAND MALL
KERI-ANN ST. LOUIS-TELESFORD,B.A.S., M.Sc
HUMAN RESOURCE OFFICER
KEISHA GREENIDGE,B.Sc., M.Sc.
SENIOR MANAGER, CREDIT RISK (Ag)
ROLAND FLETCHER, AICB, MBA
MANAGER, SALES & SERVICES, SAUTEURS
SAMICA ROBERTS,B.Sc.
MARKETING OFFICER (Ag)
Management Team

22 Annual Report 2017 23Annual Report 2017
Members of staff were treated to two (2) major social events during the year: the Annual Banquet and Staff Awards Ceremony and Family Fun Day.
The Annual Banquet and Awards Ceremony was held on December 17, 2016 under the theme “A Black, White and Red Christmas Affair”. This elegant event featured the recognition of staff members across the Bank for their stellar contributions and performance during the year. Mr. Deon Moses was awarded the Managing Director’s Special Award for his “Sterling contribution to the stability
of Grenada Co-operative Bank through his outstanding leadership and effective embedding of the ‘One Day Model’ and ‘Centralized Disbursement Function’ in the Bank”.
On June 4, 2017, the Bank held its annual Family Fun Day in the form of a sports day at Progress Park, St. Andrew. The day was filled with fun rivalry, excitement and team-spirit. The staff was grouped into four (4) teams: Purple Blasters; Supa Dupaz; The Royals and Smashers. Team members participated in a series of obstacle races, tug-of-war and a march past. Winning participants received medals and trophies to commemorate their successes. The team capturing the overall winning trophy was The Royals.
TRAINING AND DEVELOPMENT
During the year, the following training and development initiatives were undertaken:
1. In-house Training
2. Resident External Training
3. Academic/Professional Qualifications
IN-HOUSE TRAINING
The Bank focused primarily on improving the soft skills of the supervisory and middle management staff over an intensive four (4) days of training. Topics covered included Role of Supervisors, Disciplinary and Grievance Handling, Performance Management, Communication Skills, Team Member Engagement, Service versus Servitude and Workplace Ethics.
Frontline staff, especially those most recently employed, were exposed to counterfeit detection training. Additionally, the Bank’s robust compliance regime ensured that the Board of Directors and staff received the mandatory Anti
Human ResourceReport
Winning Team from Family Fun Day
Mr. Deon Moses, recipient of the Managing Director’s Special Award.

GE
NE
RA
L IN
FOR
MA
TIO
NB
US
INE
SS
RE
VIE
W &
AN
ALY
SIS
CO
RP
OR
AT
E G
OV
ER
NA
NC
EFI
NA
NC
IAL
STA
TE
ME
NT
S
22 Annual Report 2017 23Annual Report 2017
Money Laundering and Counter Terrorism Financing (AMLCTF) training and examination. Special sessions were also arranged with the Financial Intelligence Unit for our corporate customers to heighten their awareness of AMLCTF issues.
A range of other in-house training were undertaken to enhance staff competencies in their functional areas.
RESIDENT EXTERNAL TRAINING
Four (4) members of staff attended training at the Graduate School of Banking (GSB) in Wisconsin, USA. Mrs. Carlene Phillip-Frank, Mrs. Anna Antoine-James and Mr. Brendon Mc Gillivary commenced the three (3) year Graduate Diploma in Banking; and Mrs. Nicola Phillip-Walcott underwent the Human Resource Management training.
Eastern Caribbean Home Mortgage Bank/ Real Estate Institute of Canada / Certified Residential Underwriters: (ECHMB/REIC/CRU):
Mr. Brendon Mc Gillivary received his REIC/CRU membership, adding to our complement of credit staff that are Certified Residential Underwriters.
MS. KARLENE DELFISHMR. JAVID HOSTEN MS. JUDITH DE COTEAU
MRS. ALLANA JOSEPH MS SAMANTHA RAMJOHN
ACADEMIC/PROFESSIONAL QUALIFICATIONS
The following employees attained qualifications in various fields of study, thus enhancing the overall capacity of the Bank:
a) ECSM Certification: Mrs. Allana Joseph and Ms. Samantha Ramjohn successfully attained the Eastern Caribbean Securities Market (ECSM) certification.
b) Payment Card Industry Professional qualification was attained by Mr. Javid Hosten.
c) FIBA/AML/Compliance: Ms. Karlene Delfish successfully attained the Anti-Money Laundering (AML) Certified Associate qualification.
d) Institute of Chartered Secretaries & Administrators (ICSA): Ms. Judith De Coteau successfully attained the ICSA Professional Administrator designation.
CONFERENCES /SEMINARS/WORKSHOPS/ WEBINARS
Every opportunity for exposure to meaningful avenues for development were explored. The Bank participated in seminars, workshop and courses organized by various entities locally, regionally and internationally thereby bolstering learning, growth and the overall development of employees, management and Board of Directors.
GE
NE
RA
L IN
FOR
MA
TIO
NB
US
INE
SS
RE
VIE
W &
AN
ALY
SIS
CO
RP
OR
AT
E G
OV
ER
NA
NC
EFI
NA
NC
IAL
STA
TE
ME
NT
S
Annual Report 2017 23

24 Annual Report 2017 25Annual Report 2017
Selected Financial Statistics2008 - 2017
$500
$400
$300
$200
$100
$0
LOANS & ADVANCES
LOANS & ADVANCES
DEPOSITS
PROFITS & DIVIDENDS
(Customers deposits inclusive of interest payable)
2008 20122010 2014 20162009 20132011 2015 2017
2008 2009 2010 2011 2012 2013 2014 2015 2016 2017
Loans & Advances
% Change
$300,935,401
7.2%
$352,707,364
17.2%
$371,381,947
5.3%
$410,634,725
10.6%
$434,656,704
5.8%
$437,944,376
0.8%
$420,375,729
-4.0%
$413,420,588
-1.7%
$404,328,044
-2.2%
$431,852,790
6.8%
2008 2009 2010 2011 2012 2013 2014 2015 2016 2017
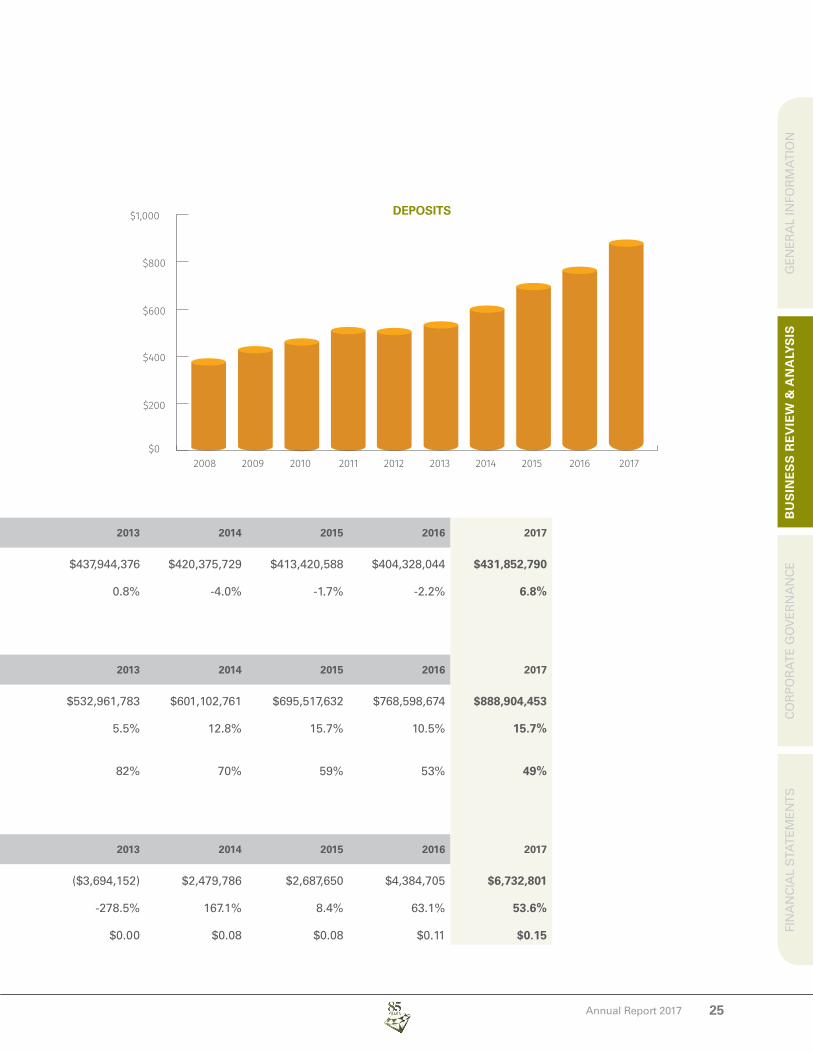
Deposits
% Change
Loans & Advances to Deposit Ratio
$377,118,178
17.4%
80%
$429,020,547
13.8%
82%
$460,845,080
7.4%
81%
$509,118,529
10.5%
81%
$505,134,323
-0.8%
86%
$532,961,783
5.5%
82%
$601,102,761
12.8%
70%
$695,517,632
15.7%
59%
$768,598,674
10.5%
53%
$888,904,453
15.7%
49%
2008 2009 2010 2011 2012 2013 2014 2015 2016 2017
Net After Tax Profits
% Change
Dividend Per Share
$4,551,543
-10.2%
$0.25
$2,940,142
-35.4%
$0.29
$762,274
-74.1%
$0.25
($10,778,874)
-1514.0%
$0.00
$2,069,870
119.2%
$0.07
($3,694,152)
-278.5%
$0.00
$2,479,786
167.1%
$0.08
$2,687,650
8.4%
$0.08
$4,384,705
63.1%
$0.11
$6,732,801
53.6%
$0.15
Source: Audited Financial Statements
GE
NE
RA
L IN
FOR
MA
TIO
NB
US
INE
SS
RE
VIE
W &
AN
ALY
SIS
CO
RP
OR
AT
E G
OV
ER
NA
NC
EFI
NA
NC
IAL
STA
TE
ME
NT
S
24 Annual Report 2017 25Annual Report 2017
Selected Financial Statistics2008 - 2017
DEPOSITS
2008 2009 2010 2011 2012 2013 2014 2015 2016 2017
Loans & Advances
% Change
$300,935,401
7.2%
$352,707,364
17.2%
$371,381,947
5.3%
$410,634,725
10.6%
$434,656,704
5.8%
$437,944,376
0.8%
$420,375,729
-4.0%
$413,420,588
-1.7%
$404,328,044
-2.2%
$431,852,790
6.8%
2008 2009 2010 2011 2012 2013 2014 2015 2016 2017
Deposits
% Change
Loans & Advances to Deposit Ratio
$377,118,178
17.4%
80%
$429,020,547
13.8%
82%
$460,845,080
7.4%
81%
$509,118,529
10.5%
81%
$505,134,323
-0.8%
86%
$532,961,783
5.5%
82%
$601,102,761
12.8%
70%
$695,517,632
15.7%
59%
$768,598,674
10.5%
53%
$888,904,453
15.7%
49%
2008 2009 2010 2011 2012 2013 2014 2015 2016 2017
Net After Tax Profits
% Change
Dividend Per Share
$4,551,543
-10.2%
$0.25
$2,940,142
-35.4%
$0.29
$762,274
-74.1%
$0.25
($10,778,874)
-1514.0%
$0.00
$2,069,870
119.2%
$0.07
($3,694,152)
-278.5%
$0.00
$2,479,786
167.1%
$0.08
$2,687,650
8.4%
$0.08
$4,384,705
63.1%
$0.11
$6,732,801
53.6%
$0.15
Source: Audited Financial Statements
2008 20122010 2014 20162009 20132011 2015 2017$0
$200
$400
$600
$800
$1,000

26 Annual Report 2017
Audited Financial ReportFOR THE YEAR ENDED SEPTEMBER 30, 2017
26 Annual Report 2017

GE
NE
RA
L IN
FOR
MA
TIO
NB
US
INE
SS
RE
VIE
W &
AN
ALY
SIS
CO
RP
OR
AT
E G
OV
ER
NA
NC
EFI
NA
NC
IAL
STA
TE
ME
NT
S
Annual Report 2017 27
Table ofContents
Statement of Comprehensive
Income
Statement of Cash Flows
Statement of Changes In Equity
353433
Notes to TheFinancial
Statement
36
Independent Auditor’s Report
Statement ofFinancial Position
28 32
Annual Report 2017 27
GE
NE
RA
L IN
FOR
MA
TIO
NB
US
INE
SS
RE
VIE
W &
AN
ALY
SIS
CO
RP
OR
AT
E G
OV
ER
NA
NC
EFI
NA
NC
IAL
STA
TE
ME
NT
S

28 Annual Report 2017
REPORT ON THE AUDIT OF THE FINANCIAL STATEMENTS
OpinionWe have audited the financial statements of Grenada Co-operative Bank Limited (“the Bank”), set out on pages 32 to 75, which comprise the statement of financial position as at September 30, 2017, the statement of comprehensive income, statement of changes in equity and statement of cash flows for the year then ended, and notes to the financial statements including a summary of significant accounting policies.
In our opinion, the accompanying financial statements present fairly in all material respects the financial position of the Bank as at September 30, 2017, and of its financial performance and its cash flows for the year then ended in accordance with International Financial Reporting Standards (IFRS).
Basis for OpinionWe conducted our audit in accordance with International Standards on Auditing (ISAs). Our responsibilities under those standards are further described in the Auditors’ Responsibilities for the Audit of the Financial Statements section of our report. We are independent of the Bank in accordance with the International Ethics Standards Board for Accountants Code of Ethics for Professional Accountants (IESBA Code), and we have fulfilled our other ethical responsibilities in accordance with the IESBA Code. We believe that the audit evidence we have obtained is sufficient and appropriate to provide a basis for our opinion.
Key Audit MattersKey audit matters are those matters that, in our professional judgment, were of most significance in our audit of the financial statements of the current year. These matters were addressed in the context of our audit of the financial statements as a whole, and in forming our opinion thereon, and we do not provide a separate opinion on these matters.
INDEPENDENT AUDITOR’S REPORTTO THE SHAREHOLDERS OF GRENADA CO-OPERATIVE BANK LIMITED
Tel: 784-456-2669Tel: 784-456-1644Fax: 784-456-1576www.bdoecc.com
The Financial Services CentreP.O. Box 561Kingstown Park St. Vincent and the Grenadines
BDO Eastern Caribbean, a network of firms registered in Anguilla, Antigua and Barbuda, St. Lucia and St. Vincent and the Grenadines, is a member of BDO International Limited, a UK company Limited by guarantee, and forms part of the international BDO network of independent member firms.

GE
NE
RA
L IN
FOR
MA
TIO
NB
US
INE
SS
RE
VIE
W &
AN
ALY
SIS
CO
RP
OR
AT
E G
OV
ER
NA
NC
EFI
NA
NC
IAL
STA
TE
ME
NT
S
Annual Report 2017 29
Key Audit Matters... (cont’d
INDEPENDENT AUDITOR’S REPORTTO THE SHAREHOLDERS OF GRENADA CO-OPERATIVE BANK LIMITED
...(continued)
Key Audit Matters How our audit addressed the key audit matter
Allowance for impairment on loans and advances to customers
Areas of focus
Refer to Notes 4, 9 and 11 to the financial statements.
The allowance for impairment losses on loans and advances to customers is considered to be a significant matter as it requires the application of judgement and use of subjective assumptions by management. The identification of impairment and the determination of the recoverable amounts are an inherently uncertain process involving various assumptions and factors including the financial condition of the counterparty and the timing and amount of expected future cash flows.
The Bank records both collective and specific allowances for losses on loans and advances to customers. In accordance with IAS 39 Financial Instruments: Recognition and Measurement, impairment provisions are recognized for financial reporting purposes only for losses that have been incurred at the reporting date based on objective evidence of impairment. The recoverable amount of impairment loans are assessed on an individual basis and is primarily based on the realization of the underlying collateral security. An assessment is made on the market value of the collateral and the time and cost to collect in determining the expected cash flows.
Management is continuously assessing the assumptions used in determining the allowance for loan losses process, and estimates are changed to account for current market and economic conditions, including the state of the real estate market. During the current year, management reassessed and amended the loan loss provisioning policy based on their historical experience in foreclosing and realizing the underlying collateral security and based on the current economic environment.
We assessed and tested the design and operating effectiveness of controls over:
» Management’s process for making lending decisions inclusive of the approval, disbursement and monitoring of the loan portfolio.
» Data used to determine the provisions for loan impairment, including transactional data captured at loan origination, internal credit quality assessments, storage of data and computations.
In addition, we assessed the adequacy of the provision for loan losses by testing the key assumptions used in the Bank’s specific and collective loan loss allowance calculations, including the identification of impairment and forecast of future cash flows, valuation of underlying collateral and estimates of recovery on default.
» We reviewed the accounting for the allowance for loan impairment policy and assessed the reasonableness of the change in estimates based on the Bank’s historical experience of the realization of security, actual collection of cash flows and the current market conditions. We assessed the model and inputs and assumptions for the inherent risk provisions.
In addition, we assessed the adequacy of the disclosures in the financial statements.

30 Annual Report 2017
Key Audit Matters How our audit addressed the key audit matter
Fair Value of Investments
Refer to Notes 4 and 9 to the financial statements.
The Bank invests in various investment securities, some of these securities are trading in active markets assets and are classified as Level 1 while others are trading on market for which there are no published prices available but have variable inputs that can be measured and have been classified as Level 2 within the IFRS fair value hierarchy.
Valuation techniques for these investments can be subjective in nature and involve various assumptions regarding pricing factors. Associated risk management disclosure is complex and dependent on high quality data. A specific area of audit focus includes the valuation of fair value Level 2 assets and Level 3 assets where valuation techniques are applied in which unobservable inputs are used.
For Level 2 assets, these techniques include the use of recent arm’s length transactions, reference to other instruments that are substantially the same and discounted cash flow analyses making maximum use of market inputs, such as the market risk free yield curve.
Included in the Level 3 category are financial assets that are not quoted as there are no active markets to determine a price.
We reviewed the reasonableness of the methods and assumptions used in determining the fair value of investment securities. We considered whether themethodology remains appropriate given current market conditions. We independently assessed the fair value of investments by performing independent valuations on the investment portfolio as well as recalculating the unrealized gain (loss) recognized. Weverified that the required IFRS disclosures have been included in the financial statements at year end. We also reviewed management’s assessments of whether there are any indicators of impairment including those securities that are not actively traded.
Other information included in the Bank’s 2017 Annual ReportManagement is responsible for the information included in the Bank’s 2017 Annual Report, other than the financial statements and our auditor’s report thereon. The Bank’s 2017 Annual Report is expected to be made available to us after the date of this auditor’s report.
Our opinion on the financial statements does not cover the other information and we will not express any form of assurance conclusion thereon.
In connection with our audit of the financial statements, our responsibility is to read the other information identified above when it becomes available and, in doing so, consider whether the other information is materially inconsistent with the financial statements or our knowledge obtained in the audit or otherwise appears to be materially misstated.
Responsibilities of Management and those charged with governance for the Financial StatementsManagement is responsible for the preparation and fair presentation of the respective financial statements in accordance with IFRS, and for such internal controls as management determines is necessary to enable the preparation of financial statements that are free from material misstatement, whether due to fraud or error.
In preparing the financial statements, management is responsible for assessing the Bank’s ability to continue as a going concern, disclosing, as applicable, matters related to going concern and using the going concern basis of accounting unless management either intends to liquidate the Bank or to cease operations, or has no realistic alternative but to do so.
Those charged with governance are responsible for overseeing the Bank’s financial reporting process.
INDEPENDENT AUDITOR’S REPORTTO THE SHAREHOLDERS OF GRENADA CO-OPERATIVE BANK LIMITED
...(continued)
Key Audit Matters...(cont’d)

GE
NE
RA
L IN
FOR
MA
TIO
NB
US
INE
SS
RE
VIE
W &
AN
ALY
SIS
CO
RP
OR
AT
E G
OV
ER
NA
NC
EFI
NA
NC
IAL
STA
TE
ME
NT
S
Annual Report 2017 31
Auditor’s Responsibilities for the Audit of the Financial StatementsOur objectives are to obtain reasonable assurance about whether the financial statements as a whole are free from material misstatement, whether due to fraud or error, and to issue an auditor’s report that includes our opinion. Reasonable assurance is a high level of assurance, but is not a guarantee that an audit conducted in accordance with ISAs will always detect a material misstatement when it exists.
Misstatements can arise from fraud or error and are considered material if, individually or in the aggregate, they could reasonably be expected to influence the economic decisions of users taken on the basis of these financial statements. As part of an audit in accordance with ISAs, we exercise professional judgment and maintain professional skepticism throughout the audit. We also:
» Identify and assess the risks of material misstatement of the financial statements, whether due to fraud or error, design and perform audit procedures responsive to those risks, and obtain audit evidence that is sufficient and appropriate to provide a basis for our opinion. The risk of not detecting a material misstatement resulting from fraud is higher than for one resulting from error, as fraud may involve collusion, forgery, intentional omissions, misrepresentations, or the override of internal control.
» Obtain an understanding of internal control relevant to the audit in order to design audit procedures that are appropriate in the circumstances, but not for the purpose of expressing an opinion on the effectiveness of the bank’s internal control.
» Evaluate the appropriateness of accounting policies used and the reasonableness of accounting estimates and related disclosures made by management.
» Conclude on the appropriateness of management’s use of the going concern basis of accounting and, based on the audit evidence obtained, whether a material uncertainty exists related to events or conditions that may cast significant doubt on the bank’s ability to continue as a going concern. If we conclude that a material uncertainty exists, we are required to draw attention in our auditors’ report to the related disclosures in the financial statements or, if such disclosures are inadequate, to modify our opinion. Our conclusions are based on the audit evidence obtained up to the date of our auditors’ report. However, future events or conditions may cause the Bank to cease to continue as a going concern.
» Evaluate the overall presentation, structure and content of the financial statements, including the disclosures, and whether the financial statements represent the underlying transactions and events in a manner that achieves fair presentation.
We communicate with those charged with governance regarding, among other matters,the planned scope and timing of the audit and significant audit findings, including any significant deficiencies in internal control that we identify during our audit.
We also provide those charged with governance with a statement that we have compiled with relevant ethical requirements regarding independence, and communicate with them all relationships and other matters that may be reasonably be thought to bear on our independence, and where applicable, related safeguards.
From the matters communicated with those charged with governance, we determine those matters that were of most significance in the audit of the financial statements of the current year and are therefore the key audit matters. We describe these matters in our auditor’s report.
The engagement partner on the audit resulting in this independent auditor’s report is Reuben M. John.
BDO Eastern CaribbeanKingstown, St. Vincent and the GrenadinesDecember 1, 2017
INDEPENDENT AUDITOR’S REPORTTO THE SHAREHOLDERS OF GRENADA CO-OPERATIVE BANK LIMITED
...(continued)

32 Annual Report 2017
NOTES2017
$2016
$
ASSETS
Cash and cash equivalents
Loans and advances to customers
Investment securities
Other assets and prepayments
Property and equipment
Deferred tax asset
10
11
12
13
14
15
179,615,472
433,431,833
275,417,966
29,197,028
52,075,571
132,318
180,483,293
405,129,648
179,035,852
19,032,412
41,031,738
335,502
Total Assets 969,870,188 825,048,445
LIABILITIES AND SHAREHOLDERS’ EQUITY
Liabilities
Deposits from customers
Trade and other payables
Income tax payable
16
17
888,904,453
10,083,621
2,169,633
768,598,674
7,563,556
231,137
Total Liabilities 901,157,707 776,393,367
Shareholders’ Equity
Stated Capital
Statutory Reserve
Accumulated Other Comprehensive Income
Other Earning Reserves
Retained Earnings
18
19
20
21
24,871,739
11,443,417
19,517,462
3,003,597
9,876,266
24,871,739
10,096,857
5,356,860
673,461
7,656,161
Total Shareholders’ Equity 68,712,481 48,655,078
Total Liabilities and Shareholders’ Equity 969,870,188 825,048,445
The notes on pages 36 to 75 are an integral part of these financial statements.
APPROVED ON BEHALF OF THE BOARD:-
_______________________________ _______________________________ _______________________________
STATEMENT OF FINANCIAL POSITIONAS AT SEPTEMBER 30, 2017
Ambrose Phillip Richard W. Duncan Leslie RamdhannyDirector Secretary Director

GE
NE
RA
L IN
FOR
MA
TIO
NB
US
INE
SS
RE
VIE
W &
AN
ALY
SIS
CO
RP
OR
AT
E G
OV
ER
NA
NC
EFI
NA
NC
IAL
STA
TE
ME
NT
S
Annual Report 2017 33
STATEMENT OF COMPREHENSIVE INCOMEFOR THE YEAR ENDED SEPTEMBER 30, 2017
NOTES2017
$2016
$
Interest Income
Interest Expense
22
23
30,979,746
(8,886,848)
30,912,704
(9,494,609)
Net Interest Income
Other Operating Income 24
22,092,898
23,824,861
21,418,095
17,852,993
45,917,759 39,271,088
Impairment Charge
Operating Expense 25
5,135,265
31,123,092
6,316,994
27,602,031
36,258,357 33,919,025
Operating Profit before Income Tax
Income Tax Expense 26
9,659,402
(2,926,601)
5,352,063
(967,358)
Net Profit for the Year 6,732,801 4,384,705
Items that are or may be reclassified subsequently to profit and loss
Net movement in fair value reserve (available for sale financial assets)
Items that will not be reclassified to profit or loss
Movement in revaluation reserve
3,888,643
10,271,959
1,035,254
-Total Comprehensive Income 14,160,602 1,035,254
Total Comprehensive income attributable to:
Owners of company 20,893,403 5,419,959
Basic and diluted earnings per share 27 0.89 0.58
The notes on pages 36 to 75 are an integral part of these financial statements.

34 Annual Report 2017
NO
TE
S
STA
TE
D
CA
PIT
AL $
STA
TU
TOR
Y
RE
SE
RV
E $
AC
CU
MU
LAT
ED
O
TH
ER
C
OM
PREH
ENS
IVE
INC
OM
E $
OT
HE
R
RE
SE
RV
ES $
RE
TAIN
ED
E
AR
NIN
GS $
TOTA
L $
Bal
ance
s as
at
Sep
tem
ber
30,
201
5
Net
Pro
fit f
or
the
year
Incr
ease
in S
tatu
tory
Res
erve
Oth
er C
om
pre
hen
sive
Inco
me
for
year
Tran
sfer
to G
ener
al R
eser
ve
Dec
reas
e in
Reg
ula
tory
Lo
ss R
eser
ve
Div
iden
ds
pai
d
19 20 21 21
24,8
71,7
39
- - - - - -
9,21
9,91
6 -
876,
941 - - - -
4,32
1,60
6 - -
1,03
5,25
4 - - -
1,04
6,82
9 - - -
109,
470
(482
,838
) -
4,38
3,02
9
4,38
4,70
5
(876
,941
) -
(109
,470
)
482,
838
(608
,000
)
43,8
43,1
19
4,38
4,70
5 -
1,03
5,25
4 - -
(608
,000
)
Bal
ance
s as
at
Sep
tem
ber
30,
201
624
,871
,739
10,0
96,8
55,
356,
860
673,
461
7,65
6,16
148
,655
,078
Net
Pro
fit f
or
the
year
Incr
ease
in S
tatu
tory
Res
erve
Oth
er C
om
pre
hen
sive
Inco
me
for
year
Rev
alu
atio
n R
eser
ve
Tran
sfer
to G
ener
al R
eser
ve
Incr
ease
in R
egu
lato
ry L
oss
Res
erve
Div
iden
ds
pai
d
19 20 20 21 21
- - - - - - -
-
1,34
6,56
0 - - - - -
- -
3,88
8,64
3
10,2
71,9
59
- - -
- - - -
168,
320
2,16
1,81
6 -
6,73
2,80
1
(1,3
46,5
60) - -
(168
,320
)
(2,1
61,8
16)
(836
,000
)
6,73
2,80
1 -
3,88
8,64
3
10,2
71,9
59
- -
(836
,000
)
Bal
ance
s as
at
Sep
tem
ber
30,
201
724
,871
,739
11,4
43,4
1719
,517
,462
3,00
3,59
79,
876,
266
68,7
12,4
81
Th
e n
ote
s o
n p
ages
36
to 7
5 ar
e an
inte
gra
l par
t o
f th
ese
fin
anci
al s
tate
men
ts.
STATEMENT OF CHANGES IN EQUITYFOR THE YEAR ENDED SEPTEMBER 30, 2017

GE
NE
RA
L IN
FOR
MA
TIO
NB
US
INE
SS
RE
VIE
W &
AN
ALY
SIS
CO
RP
OR
AT
E G
OV
ER
NA
NC
EFI
NA
NC
IAL
STA
TE
ME
NT
S
Annual Report 2017 35
STATEMENT OF CASH FLOWSFOR THE YEAR ENDED SEPTEMBER 30, 2017
NOTES2017
$2016
$
Cash flows from Operating Activities
Net Profit for the year
Adjustments for:
Depreciation
Net interest income
Net impairment loss on loans and advances and investments
Gain on disposal of property and equipment
Dividend income
Income tax
14,25
6,732,801
2,568,710
(22,092,898)
5,135,265
-
(915,543)
2,926,601
4,384,705
2,509,233
(21,418,095)
6,316,994
(34,999)
(1,117,442)
967,358
Change in other assets and prepayments
Change in loans and advances to customers
Change in deposits from customers
Change in trade and other payables
(5,645,064)
(10,164,614)
(31,154,020)
121,229,178
2,520,065
(8,392,246)
(122,814)
1,124,855
74,044,523
137,776
Cash generated from operations
Interest received
Interest paid
Income taxes paid
76,785,545
30,023,453
(9,810,247)
(784,923)
66,792,094
30,529,838
(10,458,090)
(721,087)
Net cash from operating activities 96,213,828 86,142,755
Cash flows from investing activities
Acquisition of investment securities
Dividends received
Proceeds from sale of property and equipment
Acquisition of property and equipment 14
(93,820,608)
915,543
-
(3,340,584)
(113,922,909)
1,117,442
35,000
(2,789,556)
Net cash used in investing activities (96,245,649) (115,560,023)
Cash flows from financing activity
Dividends paid (836,000) (608,000)
Net cash used in financing activity (836,000) (608,000)
Net decrease in cash and cash equivalents
Cash and cash equivalents - beginning of year
(867,821)
180,483,293
(30,025,268)
210,508,561
Cash and cash equivalents - end of year 179,615,472 180,483,293
The notes on pages 36 to 75 are an integral part of these financial statements.
36
NOTES TO THE FINANCIAL STATEMENTFOR THE YEAR ENDED SEPTEMBER 30, 2017
(...CONTINUED)
Annual Report 2017
NOTES TO THE FINANCIAL STATEMENTFOR THE YEAR ENDED SEPTEMBER 30, 2017
1. INCORPORATIONGrenada Co-operative Bank Limited (the Bank) was incorporated on July 26, 1932, and continued as company 18 of 1926 under the Companies Act 1994 of Grenada. The Bank holds a license from the Eastern Caribbean Central Bank to engage in commercial banking activities. The Bank’s registered office and principal place of business is situated on Church Street, St. George’s. The Bank is primarily involved in the offering of retail and corporate banking services and operates five Retail Banking Units.
On September 28, 2015, the Bank obtained a Broker-Dealer license from the Eastern Caribbean Securities Regulatory Commission. The Bank will launch its Brokerage and Investment Services to the public on November 22, 2017.
The Bank was listed on the Eastern Caribbean Securities Exchange on July 26, 2017.
2. STATEMENT OF COMPLIANCEThese financial statements have been prepared in accordance with International Financial Reporting Standards (IFRS) as issued by the International Accounting Standards Board (IASB) as at September 30, 2017.
The financial statements were authorised for issue by the Board of Directors on November 23, 2017.
3. BASIS OF PREPARATIONThese financial statements have been prepared on an historical cost basis; except for the following items (refer to individual accounting policies for details):
» Financial instruments – available for sale
» Revalued property and equipment
» Contingent consideration
4. ESTIMATES CRITICAL TO REPORTED AMOUNTS, AND JUDGEMENTS IN APPLYING ACCOUNTING POLICIESThe preparation of financial statements in conformity with IFRS requires the use of certain critical accounting estimates. It also requires management to exercise its judgment in the process of applying the Bank’s accounting policies. The areas involving a higher degree of judgement or complexity or areas where assumptions and estimates are significant to the financial statements are disclosed in Note 9.
5. SUMMARY OF SIGNIFICANT ACCOUNTING POLICIESa. Cash and cash equivalentsCash balances include highly liquid investments with insignificant interest rate risk and original maturities of ninety (90) days or less at the date of purchase. Investments with maturities between ninety (90) and one year at the date of purchase are considered to be short-term investment securities. Short-term investment securities consist primarily of investment grade commercial paper, bankers’ acceptances, and certificates of deposit.
Annual Report 2017 37
NOTES TO THE FINANCIAL STATEMENTFOR THE YEAR ENDED SEPTEMBER 30, 2017
(...CONTINUED)
GE
NE
RA
L IN
FOR
MA
TIO
NB
US
INE
SS
RE
VIE
W &
AN
ALY
SIS
CO
RP
OR
AT
E G
OV
ER
NA
NC
EFI
NA
NC
IAL
STA
TE
ME
NT
S
b. Property and equipmentLand and buildings are stated at the most recent valuation less subsequent depreciation for buildings. Valuations are performed by independent professional valuers. Any accumulated depreciation at the date of the revaluation is eliminated against the gross carrying amount of the asset, and the net amount is restated to the revalued amount of the asset. All other property and equipment is stated at historic cost less depreciation. Historical cost includes expenditures that are directly attributable to the acquisition of the items.
Increases in the carrying amount arising on revaluation of land and buildings are credited to revaluation surplus in equity. Decreases that offset previous increases of the same asset are charged against the surplus directly in equity; all other decreases are charged to the statement of income.
Land is not depreciated. Leasehold improvements are amortised over the term of the lease. Depreciation of other assets is calculated using a straight-line method, at rates which are expected to write-off the cost or valuation of the assets over their estimated useful lives at the following annual rates:
Furniture and equipment 10%
Motor vehicles 20%
Computer equipment 16.67%
Freehold buildings 2.5%
Gains or losses on disposal of property and equipment are determined by reference to their carrying amount and are taken into account in determining the profit or loss. When revalued assets are sold, the amounts included in revaluation surplus are transferred to retained earnings.
Repairs and maintenance are charged to the statement of income when the expenditure is incurred. The cost of improvements is capitalized where such improvements would extend the remaining useful life of the buildings.
c. Foreign currency translationThese financial statements are presented in Eastern Caribbean Dollars which is the currency of the primary economic environment in which the entity operates, which is the Bank’s functional currency and its presentation currency. All amounts are rounded to the nearest dollar except where otherwise stated.
These financial statements are expressed in Eastern Caribbean dollars, the Bank’s functional currency. Monetary items denominated in a foreign currency are translated with the closing rates as at the reporting date. Non-monetary items measured at historical cost denominated in a foreign currency are translated with the exchange rate as at the date of initial recognition. Foreign exchange gains or losses resulting fromthe settlement of such transactions and from the translation at reporting date exchange rates of monetary assets and liabilities denominated in foreign currencies are recognised in the statement of income.
Changes in the fair value of monetary securities denominated in foreign currencies classified as available for sale are analysed between translation differences resulting from changes in the amortised cost of the security and other changes in the carrying amount of the security.
Translation differences on non-monetary items, such as equities held at fair value are recognised through the statement of income, and are reported as part of the fair value gain or loss. Translation differences on non-monetary items, such as equities classified as available-for-sale financial assets, are included in the fair value in other comprehensive income and ultimately accounted for in accumulated other comprehensive income.
5. SUMMARY OF SIGNIFICANT ACCOUNTING POLICIES...(cont’d)

38
NOTES TO THE FINANCIAL STATEMENTFOR THE YEAR ENDED SEPTEMBER 30, 2017
(...CONTINUED)
Annual Report 2017
d. Impairment of non-financial assetsAssets that have an indefinite useful life are not subject to amortisation and are tested annually for impairment. Assets that are subject to amortisation are reviewed for impairment whenever events or changes in circumstances indicate that the carrying amount may not be recoverable. An impairment loss is recognised for the amount by which the asset’s carrying amount exceeds its recoverable amount. The recoverable amount is the higher of an asset’s fair value less costs to sell and value in use. The fair value less costs to sell is the amount obtainable from the sale of the asset in an arm’s length transaction. In assessing value in use, the estimated future cash flows are discounted to their present value using pre-tax discount rate that reflects current market assessments of the time value of money and risks specific to the asset. For an asset that does not generate cash flows largely independent of those from other assets, the recoverable amount is determined for the cash generating unit to which the asset belongs. For the purposes of assessing impairment, assets are grouped at the lowest levels for which there are separately identifiable cash flows (cash-generating units). Non-financial assets other than goodwill that suffered an impairment are reviewed for possible reversal of the impairment at each reporting date.
e. Financial assetsThe Bank classifies its financial assets in the following categories: loans and receivables, financial assets at fair value through profit or loss and available-for-sale financial assets. Management determines the classification of its investments at initial recognition.
(i) Loans and receivablesLoans and receivables are non-derivative financial assets with fixed or determinable payments that are not quoted in an active market, other than: (a) those that the entity intends to sell immediately or in the short-term, which classified as held for trading, and those that the entity upon initial recognition designates at fair value through profit or loss; (b) those that the entity upon initial recognition designates as available-for-sale; or (c) those for which the holder may not recover substantially all of its initial investment, other than because of credit deterioration.
Loans and receivables are carried at amortised cost using the effective interest method. Interest on loans and receivables are included in the statement of income and is reported as “interest income”. In the case of impairment, the impairment loss is reported as a deduction from the carrying value of loan and receivables and recognised in the statement of income.
(ii) Available-for-sale financial assetsAvailable-for-sale investments are those intended to be held for an indefinite period of time, which may be sold in response to needs for liquidity or changes in interest rates, exchange rates or equity prices.
Regular-way purchases and sales of financial assets available-for-sale are recognised on trade date – the date on which the Bank commits to purchase or sell the asset.
Available-for-sale financial assets are initially recognised at fair value plus transaction costs and subsequently carried at fair value.
Gains or losses arising from changes in the fair value of available-for-sale financial assets are recognised through other comprehensive income, until the financial asset is derecognised or impaired. At the time of derecognition, the cumulative gain or loss previously recognised in equity is transferred directly to the statement of income.
Interest calculated using the effective interest method and foreign currency gains or losses on monetary assets classified as available-for-sale are recognised in the statement of profit or loss. Dividends on available-for-sale equity instruments are recognised in the statement of profit or loss when the entity’s right to receive payment is established.
5. SUMMARY OF SIGNIFICANT ACCOUNTING POLICIES...(cont’d)

Annual Report 2017 39
NOTES TO THE FINANCIAL STATEMENTFOR THE YEAR ENDED SEPTEMBER 30, 2017
(...CONTINUED)
GE
NE
RA
L IN
FOR
MA
TIO
NB
US
INE
SS
RE
VIE
W &
AN
ALY
SIS
CO
RP
OR
AT
E G
OV
ER
NA
NC
EFI
NA
NC
IAL
STA
TE
ME
NT
S
The fair value of quoted investments in active markets are based on current bid prices. If there is no active market for a financial asset, the Bank establishes fair value using valuation techniques. These include the use of recent arm’s length transactions, discounted cash flow analysis, option pricing models and other valuation techniques commonly used by market participants.
(iii) Financial Assets at Fair Value through Profit or LossThis category has two sub-categories: financial assets held for trading, and those designated at fair value through profit or loss at inception.
A financial asset is classified as held for trading if it is acquired or incurred principally for the purpose of selling or repurchasing in the near term or if it is part of a portfolio of identified financial instruments that are managed together and for which there is evidence of a recent actual pattern of short-term profit-taking.
Financial assets and financial liabilities are designated at fair value through profit or loss when:
» Doing so significantly reduces measurement inconsistencies that would arise if the related derivatives were treated as held for trading and the underlying financial instruments were carried at amortised cost, such as loans and advances to customers or banks, and debt securities in issue;
» Certain investments, such as equity investments, that are managed and evaluated on a fair value basis in accordance with a documented risk management or investment strategy and reported to key management personnel on that basis, are designated at fair value through profit or loss; and
Financial instruments, such as debt securities held, containing one or more embedded derivatives that significantly modify the cash flows, are designated at fair value through profit or loss.
Financial assets at fair value through profit or loss are measured at fair value and changes there in, including any interest or dividend income, are recognised in profit or loss.
(iv) RecognitionAll purchases and sales of investment securities are recognised at trade date, which is the date that the asset is delivered to or by the Bank.
(v) De-recognitionFinancial assets are de-recognised when the contractual rights to receive the cash flows from these assets have ceased to exist or the assets have been transferred and substantially all the risks and rewards of ownership of the assets are also transferred (that is, if substantially all the risks and rewards have not been transferred, the Bank tests control to ensure that continuing involvement on the basis of any retained powers of control does not prevent de-recognition).
f. Impairment of financial assets
(i) Assets carried at amortised costThe Bank assesses at each reporting date whether there is objective evidence that a financial asset or group of financial assets is impaired. A financial asset or a group of financial assets is impaired and impairment losses are incurred only if there is objective evidence of impairment as a result of one or more events that occurred after the initial recognition of the asset (a ‘loss event’) and that loss event (or events) has an impact on the estimated future cash flows of the financial asset or group of financial assets that can be reliably estimated.
5. SUMMARY OF SIGNIFICANT ACCOUNTING POLICIES...(cont’d)e. Financial assets...(cont’d)
(ii) Available-for-sale financial assets...cont’d

40
NOTES TO THE FINANCIAL STATEMENTFOR THE YEAR ENDED SEPTEMBER 30, 2017
(...CONTINUED)
Annual Report 2017
The criteria that the Bank uses to determine that there is objective evidence of an impairment loss include:
» Delinquency in contractual payments of principal or interest;
» Cash flow difficulties experienced by the borrower (for example: equity ratio, net income percentage of sales);
» Breach of loan covenants or conditions;
» Initiation of bankruptcy proceedings;
» Deterioration of the borrower’s competitive position;
» Deterioration in the value of collateral; and
» Downgrading below investment grade level.
The estimated period between a loss occurring and its identification is determined by management for each identified portfolio. In general, the periods used vary between three (3) months and twelve (12) months; in exceptional cases, longer periods are warranted.
The Bank first assesses whether objective evidence of impairment exists individually for financial assets that are individually significant, and individually or collectively for financial assets that are not individually significant. If the Bank determines that no objective evidence of impairment exists for an individually assessed financial asset, whether significant or not, it includes the asset in a group of financial assets with similar credit risk characteristics and collectively assesses them for impairment. Assets that are individually assessed for impairment and for which an impairment loss is or continues to be recognised are not included in a collective assessment of impairment.
The amount of the loss is measured as the difference between the asset’s carrying amount and the present value of estimated future cash flows (excluding future credit losses that have not been incurred) discounted at the financial asset’s original effective interest rate. The carrying amount of the asset is reduced through the use of an allowance account and the amount of the loss is recognised in the statement of profit or loss. If a loan has a variable interest rate, the discount rate for measuring any impairment loss is the current effective interest rate determined under the contract. As a practical expedient, the Bank may measure impairment on the basis of an instrument’s fair value using an observable market price.
The calculation of the present value of the estimated future cash flows of a collateralised financial asset reflects the cash flows that may result from foreclosure less costs for obtaining and selling the collateral, whether or not foreclosure is probable.
For the purposes of a collective evaluation of impairment, financial assets are grouped on the basis of similar credit risk characteristics (i.e. on the basis of the Bank’s grading process that considers asset type, industry, geographical location, collateral type, past-due status and other relevant factors). Those characteristics are relevant to the estimation of future cash flows for groups of such assets by being indicative of the debtors’ ability to pay all amounts due according to the contractual terms of the assets being evaluated.
Future cash flows in a group of financial assets that are collectively evaluated for impairment are estimated on the basis of the contractual cash flows of the assets in the Bank and historical loss experience is adjusted on the basis of current observable data to reflect the effects of current conditions that did not affect the period on which the historical loss experience is based and to remove the effects of conditions in the historical period that do not currently exist.
5. SUMMARY OF SIGNIFICANT ACCOUNTING POLICIES...(cont’d)f. Impairment of financial assets...(cont’d)
(i) Assets carried at amortised cost (cont’d)
Annual Report 2017 41
NOTES TO THE FINANCIAL STATEMENTFOR THE YEAR ENDED SEPTEMBER 30, 2017
(...CONTINUED)
GE
NE
RA
L IN
FOR
MA
TIO
NB
US
INE
SS
RE
VIE
W &
AN
ALY
SIS
CO
RP
OR
AT
E G
OV
ER
NA
NC
EFI
NA
NC
IAL
STA
TE
ME
NT
S
5. SUMMARY OF SIGNIFICANT ACCOUNTING POLICIES...(cont’d)f. Impairment of financial assets...(cont’d)
(i) Assets carried at amortised cost (cont’d)
Estimates of changes in future cash flows for groups of assets should reflect and be directionally consistent with changes in related observable data from period to period (for example, changes in unemployment rates, property prices, payment status, or other factors indicative of changes in the probability of losses to the Bank and their magnitude). The methodology and assumptions used for estimating future cash flows are reviewed regularly by the Bank to reduce any differences between loss estimates and actual loss experience.
When a loan is uncollectible, it is written off against the related provision for loan impairment. Such loans are written off after all the necessary procedures have been completed and the amount of the loss has been determined.
If, in a subsequent period, the amount of the impairment loss decreases and the decrease can be related objectively to an event occurring after the impairment was recognised (such as an improvement in the debtor’s credit rating), the previously recognised impairment loss is reversed by adjusting the allowance account. The amount of the reversal is recognised in the statement of profit or loss in impairment charge for credit losses.
(ii) Assets classified as available-for-saleThe Bank assesses at each reporting date whether there is objective evidence that a financial asset or group of financial assets is impaired. In the case of equity investments classified as available for sale, a significant or prolonged decline in the fair value of the security below its cost is considered in determining whether the assets are impaired. If any such evidence exists for available-for-sale financial assets, the cumulative loss (measured as the difference between the acquisition cost and the current fair value, less any impairment loss on that financial asset previously recognised in profit or loss) is removed from equity and recognised in the statement of profit or loss. Impairment losses recognised in the statement of profit or loss on equity instruments are not reversed through the statement of profit or loss. If, in a subsequent period, the fair value of a debt instrument classified as available-for- sale increases and the increase can be objectively related to an event occurring after the impairment loss was recognised in profit or loss, the impairment loss is reversed through the statement of profit or loss.
(iii) Renegotiated loans Loans that are either subject to collective impairment assessment or individually significant and whose terms have been renegotiated are no longer considered to be past due but are treated as new loans. In subsequent years, the asset is considered to be past due on the basis of the renegotiated terms and conditions.
If an impairment instrument has been renegotiated, interest continues to be accrued on the reduced carrying amount of the asset and is recorded as part of “interest income”. If the fair value of the instrument increases in a subsequent year, the impairment loss is reversed through the statement of income.
g. Financial liabilitiesFinancial liabilities are measured at amortised cost. Financial liabilities are derecognised when extinguished.
Financial liabilities measured at amortised cost are substantially deposits from customers.

42
NOTES TO THE FINANCIAL STATEMENTFOR THE YEAR ENDED SEPTEMBER 30, 2017
(...CONTINUED)
Annual Report 2017
h. Loans and advances to customer, and allowance for loan lossesLoans are stated net of unearned interest and allowance for loan losses.The allowance for losses is based on an annual appraisal of loans. Specific and general allowance for loan losses is based on the year-end appraisal of loans. The specific element relates to identified loans whereas the general element relates to latent bad and doubtful loans which are present in any loan portfolio but have not been specifically identified. Loans are written down to estimated realisable value when the normal banking relationship with the customer has ceased; interest on the loan up to that time is credited to operations and allowance is made where appropriate.
i. Revenue recognition
(i) Interest income and expenseInterest income and expense are recognised in the statement of profit or loss for all interest-bearing instruments on accrual basis during the effective interest yield method based on the actual purchase price or estimated recoverable amount. Interest income includes coupons earned on fixed income investments and trading securities and accrued discount and premium on treasury bills and other discounted instruments.
(ii) Fees and commission incomeFees and commissions are generally recognised on an accrual basis when the service has been provided. Loan syndication fees are recognised as revenue when the syndication has been completed and the Bank retained no part of the loan package for itself or has retained a part at the same effective interest rate as the other participants. Commission and fees arising from negotiating, or participating in the negotiation of, a transaction for a third party – such as the arrangement of the acquisition of shares or other securities or the purchase or sale of businesses – are recognised on completion of the underlying transaction.
(iii) DividendsDividends are recognised in the statement of income when the Bank’s right to receive payment is established.
(iv) Other incomePortfolio and other management advisory and service fees are recognised based on the applicable service contracts, usually on a time-apportioned basis. Asset management fees related to investment funds are recognised rateably over the period in which the service is provided.
The same principle is applied for wealth management, financial planning and custody services that are continuously provided over an extended period of time. Performance linked fees or fee components are recognised when the performance criteria are fulfilled.
j. Employee benefits
(i) Pension obligationThe Bank operates a defined contribution pension scheme. Under this plan, the Bank pays fixed contributions into a separate entity. The Bank has no legal or constructive obligations to pay further contributions if the fund does not hold sufficient assets to pay all employees the benefits relating to employee service in the current and prior periods.
Contributions are recognised as employee benefit expense when they are due. Prepaid contributions are recognised as an asset to the extent that a cash refund or a reduction in the future payments is available.
5. SUMMARY OF SIGNIFICANT ACCOUNTING POLICIES...(cont’d)

Annual Report 2017 43
NOTES TO THE FINANCIAL STATEMENTFOR THE YEAR ENDED SEPTEMBER 30, 2017
(...CONTINUED)
GE
NE
RA
L IN
FOR
MA
TIO
NB
US
INE
SS
RE
VIE
W &
AN
ALY
SIS
CO
RP
OR
AT
E G
OV
ER
NA
NC
EFI
NA
NC
IAL
STA
TE
ME
NT
S
(ii) Termination benefitsTermination benefits are payable when employment is terminated before the normal retirement date, or whenever an employee accepts voluntary redundancy in exchange for these benefits. The Bank recognises termination benefits when it is demonstrably committed to either: terminating the employment of current employees according to a detailed formal plan without possibility of withdrawal; or providing termination benefits as a result of an offer made to encourage voluntary redundancy. Benefits falling due more than twelve (12) months after reporting date are discounted to present value.
k. Deferred taxDeferred income tax is provided in full, using the liability method, on temporary differences arising between the tax bases of assets and liabilities and their carrying amounts in the financial statements. Deferred income tax is determined using tax rates (and laws) that have been enacted or substantially enacted by the reporting date and are expected to apply when the related deferred income tax asset is realised or the deferred income tax liability is settled.
The principal temporary differences arise from depreciation of property and equipment, provisions for pensions and other post-retirement benefits and tax losses carried forward; and, in relation to acquisitions, on the difference between the fair values of the net assets acquired and their tax base. The rates enacted or substantively enacted at the reporting date are used to determine deferred income tax. However, the deferred income tax is not accounted for if it arises from initial recognition of an asset or liability in a transaction other than a business combination that at the time of the transaction affects neither accounting nor taxable profit or loss.
Deferred tax assets are recognised where it is probable that future taxable profit will be available against which the temporary differences can be utilised.
The tax effects of income tax losses available for carry-forward are recognised as an asset when it is probable that future taxable profits will be available against which these losses can be utilised.
l. Stated capital
(i) Share issue costIncremental cost directly attributable to the issue of new shares or options or to the acquisition of a business are shown in equity as a deduction, from the proceeds.
(ii) Dividends on ordinary sharesDividends on ordinary shares are recognized in equity in the period in which they are declared by the Directors.
Dividends for the year that are declared after reporting date are disclosed within the subsequent events note.
m. Guarantees and letters of creditGuarantees and letters of credit comprise undertakings by the Bank to pay bills of exchange drawn on customers. The Bank expects most guarantees and letters of credit to be settled simultaneously with reimbursement from the customers. Such financial guarantees are given to banks, financial institutions and other bodies on behalf of customers.
The fair value of a financial guarantee at the time of signature is zero because all guarantees are agreed on arm’s length terms and the value of the premium agreed corresponds to the value of the guarantee obligation. No receivable for the future premiums is recognized. Any increase in the liability relating to guarantees is reported in the statement of income within other operating expenses.
5. SUMMARY OF SIGNIFICANT ACCOUNTING POLICIES...(cont’d)j. Employee benefits...(cont’d)

44
NOTES TO THE FINANCIAL STATEMENTFOR THE YEAR ENDED SEPTEMBER 30, 2017
(...CONTINUED)
Annual Report 2017
n. Leases The leases entered into by the Bank are primarily operating lease. The total payments made under operating leases are charged to the profit or loss on a straight-line basis over the period of the lease.
When an operating lease is terminated before the lease period is expired, any payment required to be made to the lessor by way of penalty is recognized as an expense in the period in which the termination takes place.
6. NEW, REVISED AND AMENDED STANDARDS AND INTERPRETATIONS THAT BECAME EFFECTIVE DURING THE YEAR.a. Certain new, revised and amended standards and interpretations came into effect during the current
financial year. The Bank has assessed them and has adopted those which are relevant to its financial statements, viz:
(i) IAS 1, Presentation of Financial Statements, effective for accounting periods beginning on or after January 1, 2016, has been amended to clarify or state the following:
» specific single disclosures that are not material do not have to be presented even if they are minimum requirements of a standard;
» the order of notes to the financial statements is not prescribed;
» line items on the statement of financial position and the statement of profit or loss and other comprehensive income (OCI) should be disaggregated if this provides helpful information to users. Line items can be aggregated if they are not material;
» specific criteria are now provided for presenting subtotals on the statement of financial position and in the statement of profit or loss and OCI, with additional reconciliation requirements for the statement of profit or loss and OCI; and
» the presentation in the statement of OCI of items of OCI arising from joint ventures and associates accounted for using the equity method follows the IAS 1 approach of splitting items that may, or that will never, be reclassified to profit or loss.
(ii) Amendments to IAS 16 and IAS 38, Clarification of Acceptable Methods of Depreciation and Amortisation, are effective for accounting periods beginning on or after January 1, 2016.
» The amendment to IAS 16, Property, Plant and Equipment explicitly states that revenue-based methods of depreciation cannot be used. This is because such methods reflect factors other than the consumption of economic benefits embodied in the assets.
» The amendment to IAS 38, Intangible Assets introduces a rebuttable presumption that the use of revenue-based amortisation methods is inappropriate for intangible assets.
(iii) Amendments to IAS 27, Equity Method in Separate Financial Statements, effective for accounting periods beginning on or after January 1, 2016 allow the use of the equity method in separate financial statements, and apply to the accounting for subsidiaries, associates, and joint ventures.
b. Improvements to IFRS 2012-2015 cycle, contain amendments to certain standards and interpretations and are effective for accounting periods beginning on or after January 1, 2016. The main amendments applicable to the Bank are as follows:
5. SUMMARY OF SIGNIFICANT ACCOUNTING POLICIES...(cont’d)

Annual Report 2017 45
NOTES TO THE FINANCIAL STATEMENTFOR THE YEAR ENDED SEPTEMBER 30, 2017
(...CONTINUED)
GE
NE
RA
L IN
FOR
MA
TIO
NB
US
INE
SS
RE
VIE
W &
AN
ALY
SIS
CO
RP
OR
AT
E G
OV
ER
NA
NC
EFI
NA
NC
IAL
STA
TE
ME
NT
S
(i) IFRS 7, Financial Instruments: Disclosures, has been amended to clarify when servicing arrangements are in the scope of its disclosure requirements on continuing involvement in transferred assets in cases when they are derecognized in their entirety. A servicer is deemed to have continuing involvement if it has an interest in the future performance of the transferred asset -e.g. if the servicing fee is dependent on the amount or timing of the cash flows collected from the transferred financial asset; however, the collection and remittance of cash flows from the transferred asset to the transferee is not, in itself, sufficient to be considered ‘continuing involvement.
IFRS 7 has also been amended to clarify that the additional disclosures required by Disclosures: Offsetting Financial Assets and Financial Liabilities (Amendment to IFRS 7) are not specifically required for inclusion in condensed interim financial statements for all interim periods; however, they are required if the general requirements of IAS 34, Interim Financial Reporting, require their inclusion.
The adoption of these amendments where applicable did not result in any change to the presentation and disclosures in the financial statements.
7. NEW, REVISED AND AMENDED STANDARDS AND INTERPRETATIONS NOT YET EFFECTIVEA number of new standards and amendments to standards are effective for annual periods beginning after 1 January 2016 and earlier application is permitted; however, the Bank has not early adopted the following new or amended standards in preparing these financial statements.
(i) Amendments to IAS 7 Disclosure Initiative, effective for accounting periods beginning on or after 1 January 2017.
The amendments require disclosures that enable users of financial statements to evaluate changes in liabilities arising from financing activities, including both changes arising from cash flow and non-cash changes.
To satisfy the new disclosure requirements, the Bank intends to present a reconciliation between the opening and closing balances for liabilities with changes arising from financing activities.
(ii) Amendments to IAS 12 Income Taxes
In January 2016, through issuing amendments to IAS 12, the IASB clarified the accounting treatment of deferred tax assets of debt instruments measured at fair value for accounting, but measured at cost for tax purposes. The amendment is effective from 1 January 2017. The Bank is currently evaluating the impact, but does not anticipate that adopting the amendments would have a material impact on its financial statements.
(iii) IFRS 15, Revenue from Contracts with Customers, effective for accounting periods beginning on or after January 1, 2018, replaces IAS 11, Construction Contracts, IAS 18, Revenue, IFRIC 13, Customer Loyalty Programmes, IFRIC 15, Agreements for the Construction of Real Estate, IFRIC 18, Transfer of Assets from Customers, and SIC-31, Revenue – Barter Transactions Involving Advertising Services. It does not apply to insurance contracts, financial instruments or lease contracts, which fall in the scope of other IFRSs. It also does not apply if two companies in the same line of business exchange non-monetary assets to facilitate sales to other parties.
6. NEW, REVISED AND AMENDED STANDARDS AND INTERPRETATIONS THAT BECAME EFFECTIVE DURING THE YEAR...(cont’d)
46
NOTES TO THE FINANCIAL STATEMENTFOR THE YEAR ENDED SEPTEMBER 30, 2017
(...CONTINUED)
Annual Report 2017
The Bank will apply a five-step model to determine when to recognise revenue, and at what amount. The model specifies that revenue should be recognised when (or as) an entity transfers control of goods or services to a customer at the amount to which the entity expects to be entitled. Depending on whether certain criteria are met, revenue is recognised at a point in time, when control of goods or services is transferred to the customer; or over time, in a manner that best reflects the entity’s performance.
There will be new qualitative and quantitative disclosure requirements to describe the nature, amount, timing, and uncertainty of revenue and cash flows arising from contracts with customers.
The Bank is assessing the impact that this standard will have on its 2019 financial statements.
(iv) IFRS 9, Financial Instruments, which is effective for annual reporting periods beginning on or after January 1, 2018, replaces the existing guidance in IAS 39 Financial Instruments: Recognition and Measurement. IFRS 9 includes revised guidance on the classification and measurement of financial assets and liabilities, including a new expected credit loss model for calculating impairment of financial assets and the new general hedge accounting requirements. It also carries forward the guidance on recognition and derecognition of financial instruments from IAS 39. Although the permissible measurement bases for financial assets – amortised cost, fair value through other comprehensive income (FVOCI) and fair value though profit or loss (FVTPL) - are similar to IAS 39, the criteria for classification into the appropriate measurement category are significantly different. IFRS 9 replaces the ‘incurred loss’ model in IAS 39 with an ‘expected credit loss’ model, which means that a loss event will no longer need to occur before an impairment allowance is recognized.
The Bank is in the advance stages in preparing for the implementation of IFRS 9.
(v) IFRS 16, Leases, which is effective for annual reporting periods beginning on or after January 1, 2019, eliminates the current dual accounting model for lessees, which distinguishes between on-balance sheet finance leases and off-balance sheet operating leases. Instead, there is a single, on-balance sheet accounting model that is similar to current finance lease accounting. Companies will be required to bring all major leases onbalance sheet, recognising new assets and liabilities. The on-balance sheet liability will attract interest; the total lease expense will be higher in the early years of a lease even if a lease has fixed regular cash rentals. Optional lessee exemption will apply to short- term leases and for low-value items with value of US$5,000 or less.
Lessor accounting remains similar to current practice as the lessor will continue to classify leases as finance and operating leases. Finance lease accounting will be based on IAS 17 lease accounting, with recognition of net investment in lease comprising lease receivable and residual asset. Operating lease accounting will be based on IAS 17 operating lease accounting.
Early adoption is permitted if IFRS 15, Revenue from Contracts with Customers, is also adopted.
The Bank is assessing the impact that this standard will have on its 2020 financial statements.
8. FINANCIAL RISK MANAGEMENTThe Bank’s activities expose it to a variety of financial risks and those activities involve the analysis, evaluation, acceptance and management of some degree of risk or combination of risks. Taking risk is core to the financial business, and the operational risks are an inevitable consequence of being in business. The Bank’s aim is therefore to achieve an appropriate balance between risk and return and minimise potential adverse effects on the Bank’s financial performance.
7. NEW, REVISED AND AMENDED STANDARDS AND INTERPRETATIONS NOT YET EFFECTIVE ...(cont’d)
Annual Report 2017 47
NOTES TO THE FINANCIAL STATEMENTFOR THE YEAR ENDED SEPTEMBER 30, 2017
(...CONTINUED)
GE
NE
RA
L IN
FOR
MA
TIO
NB
US
INE
SS
RE
VIE
W &
AN
ALY
SIS
CO
RP
OR
AT
E G
OV
ER
NA
NC
EFI
NA
NC
IAL
STA
TE
ME
NT
S
The Bank’s management policies are designed to identify and analyse these risks, to set appropriate risk limits and controls, and to monitor the risks and adherence to limits by means of reliable and up-to-date information systems. The Bank regularly reviews its risk management policies and systems to reflect changes in markets, products and emerging best practice.
Risk management is carried out by the Management Committee under policies approved by the Board of Directors. The Bank’s Management Committee identifies, evaluates and hedges financial risks in close co-operation with the Bank’s operating units. The Board provides written principles for overall risk management, as well as written policies covering specific areas, such as foreign exchange risk, interest rate risk, credit risk, and non-derivative financial instruments. In addition, the Internal Audit Department is responsible for the independent review of risk management and the control environment.
The most important types of risk are credit risk, liquidity risk, market risk and other operational risk. Market risk includes currency risk, interest rate and other price risk.
8.1 CREDIT RISKCredit risk is the risk of suffering financial loss, should any of the Bank’s customers, clients or market counterparties fail to fulfill their contractual obligations to the Bank. Credit risk arises mainly from commercial and consumer loans and advances, credit cards, and loan commitments arising from such lending activities, but can also arise from credit enhancement provided, such as credit financial guarantees, letters of credit, endorsements and acceptances.
The Bank is also exposed to other credit risks arising from balances with central bank, deposits with other banks and non-bank financial institutions, investments in debt securities and other exposures arising from its trading activities (‘trading exposures’), including non-equity trading portfolio assets.
Loans and advancesThe Bank takes on exposure to credit risk which, is the risk that a counterparty will be unable to pay amounts in full when due. Impairment provisions are provided for losses that have been incurred at the reporting date. Significant changes in the economy, or in the health of a particular industry segment that represents a concentration in the Bank’s portfolio, could result in losses that are different from those provided for at the reporting date. Management therefore carefully manages its exposure to credit risk.
Debt securities and other billsFor debt securities and treasury bills, external rating such as Standard & Poor’s or Caricris or their equivalents are used by the Asset Liability Committee for managing of the credit risk exposures. The investments in those securities and bills are viewed as a way to gain a better credit quality mapping and maintain a readily available source to meet the funding requirements at the same time.
Cash and cash equivalentsCredit risk from balances with banks and financial institutions is managed by the Bank in accordance with the Bank’s policy. Counterparty credit limits are reviewed by the Bank’s Risk Department on an annual basis, and may be updated throughout the year subject to approval of the Bank’s Investment Committee and where necessary The Board of Directors. The limits are set to minimise the concentration of risks and therefore mitigate financial loss through potential counterparty’s failure to make payments.
8.1.1 RISK LIMIT CONTROL AND MITIGATION POLICIES The Bank manages limits and controls concentrations of credit risk whenever they are identified, in particular to individual counterparties and groups, and to industries.
8. FINANCIAL RISK MANAGEMENT...(cont’d)

48
NOTES TO THE FINANCIAL STATEMENTFOR THE YEAR ENDED SEPTEMBER 30, 2017
(...CONTINUED)
Annual Report 2017
Exposure to credit risk is managed through regular analysis of the ability of borrowers and potential borrowers to meet interest and capital repayment obligations. Exposure to credit risk is also managed in part by obtaining collateral and corporate and personal guarantees, except for personal lending where no such facilities can be obtained.
The Bank structures the levels of credit risk it undertakes by placing limits on the amount of risk accepted in relation to one borrower, or groups of borrowers, and industry segments.
CollateralThe Bank employs a range of policies and practices to mitigate credit risk. The most traditional of these is the taking of security for funds advanced, which is common practice. The Bank implements guidelines on the acceptability of specific classes of collateral or credit risk mitigation. The principal collateral types for loans and advances are:
(i) Mortgages over Real properties;
(ii) Charges over business assets such as premises, inventory and accounts receivable; and
(iii) Charges over financial instruments such as debt securities and equities.
The Bank’s credit risk management policies include requirements relating to collateral valuation and management, including verification requirements and legal certainty. Valuations are updated periodically depending upon the nature of the collateral. Management monitors the market value of collateral and requests additional collateral in accordance with the underlying agreement during its periodic review of loan accounts in arrears. Policies are in place to monitor the existence of undesirable concentration in the collateral supporting the Bank’s credit exposure.
Longer-term finance and lending to corporate entities are secured; individual credit facilities are generally secured. In addition, in order to minimize the credit loss, the Bank will seek additional credit collateral from the counterparty as soon as impairment indicators are noticed for the relevant individual loans and advances.
Collateral held as security for financial assets other than loans and advances is determined by the nature of the instrument. Debt securities, treasury and other eligible bills are generally unsecured.
Credit-related commitmentsThe primary purpose of these instruments is to ensure that funds are available to a customer as required. Guarantees and standby letters of credit carry the same credit risk as loans. Documentary and commercial letters of credit – which are written undertakings by the Bank on behalf of a customer authorising a third party to draw drafts on the Bank up to a stipulated amount under specific terms and conditions – are authorisations by the underlying shipments of goods to which they relate and therefore carry less risk than a direct loan.
Commitments to extend credit represent unused portions of authorizations to extend credit in the form of loans, guarantees or letters of credit. With respect to credit risk on commitments to extend credit, the Bank is potentially exposed to loss in an amount equal to the total unused commitments. However, the likely amount of loss is less than the total unused commitments, as most commitments to extend credit are contingent upon customers maintaining specific credit standards. The Bank monitors the term to maturity of credit commitments because longer-term commitments generally have a greater degree of credit risk than shorter-term commitments.
8.1.2 IMPAIRMENT AND PROVISIONING POLICIESThe Bank’s internal rating system focuses on expected credit losses, that is, taking into account the risk of future events giving rise to losses. In contrast, impairment allowance is recognised for financial reporting purposes only for losses that have been incurred at the reporting date based on objective evidence of impairment.
8. FINANCIAL RISK MANAGEMENT...(cont’d)8.1.1 RISK LIMIT CONTROL AND MITIGATION POLICIES...(cont’d)
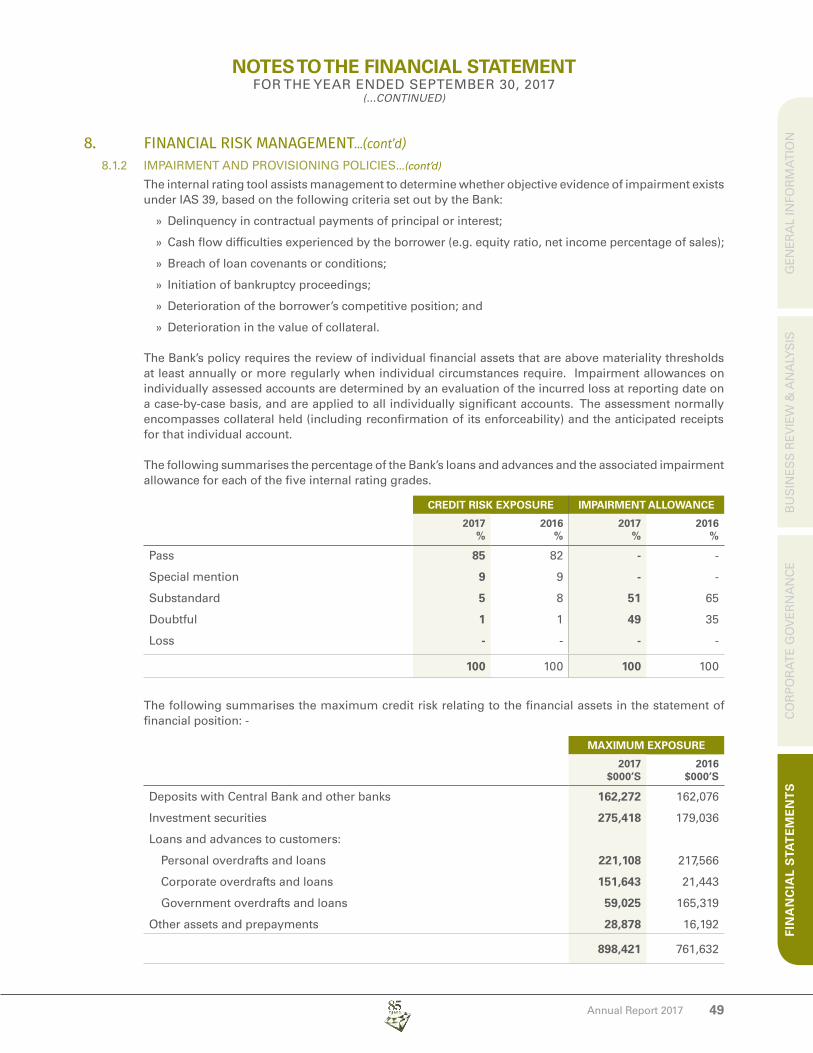
Annual Report 2017 49
NOTES TO THE FINANCIAL STATEMENTFOR THE YEAR ENDED SEPTEMBER 30, 2017
(...CONTINUED)
GE
NE
RA
L IN
FOR
MA
TIO
NB
US
INE
SS
RE
VIE
W &
AN
ALY
SIS
CO
RP
OR
AT
E G
OV
ER
NA
NC
EFI
NA
NC
IAL
STA
TE
ME
NT
S
The internal rating tool assists management to determine whether objective evidence of impairment exists under IAS 39, based on the following criteria set out by the Bank:
» Delinquency in contractual payments of principal or interest;
» Cash flow difficulties experienced by the borrower (e.g. equity ratio, net income percentage of sales);
» Breach of loan covenants or conditions;
» Initiation of bankruptcy proceedings;
» Deterioration of the borrower’s competitive position; and
» Deterioration in the value of collateral.
The Bank’s policy requires the review of individual financial assets that are above materiality thresholds at least annually or more regularly when individual circumstances require. Impairment allowances on individually assessed accounts are determined by an evaluation of the incurred loss at reporting date on a case-by-case basis, and are applied to all individually significant accounts. The assessment normally encompasses collateral held (including reconfirmation of its enforceability) and the anticipated receipts for that individual account.
The following summarises the percentage of the Bank’s loans and advances and the associated impairment allowance for each of the five internal rating grades.
CREDIT RISK EXPOSURE IMPAIRMENT ALLOWANCE
2017%
2016%
2017%
2016%
Pass
Special mention
Substandard
Doubtful
Loss
85
9
5
1
-
82
9
8
1
-
-
-
51
49
-
-
-
65
35
-
100 100 100 100
The following summarises the maximum credit risk relating to the financial assets in the statement of financial position: -
MAXIMUM EXPOSURE
2017$000’S
2016$000’S
Deposits with Central Bank and other banks
Investment securities
Loans and advances to customers:
Personal overdrafts and loans
Corporate overdrafts and loans
Government overdrafts and loans
Other assets and prepayments
162,272
275,418
221,108
151,643
59,025
28,878
162,076
179,036
217,566
21,443
165,319
16,192
898,421 761,632
8. FINANCIAL RISK MANAGEMENT...(cont’d)8.1.2 IMPAIRMENT AND PROVISIONING POLICIES...(cont’d)
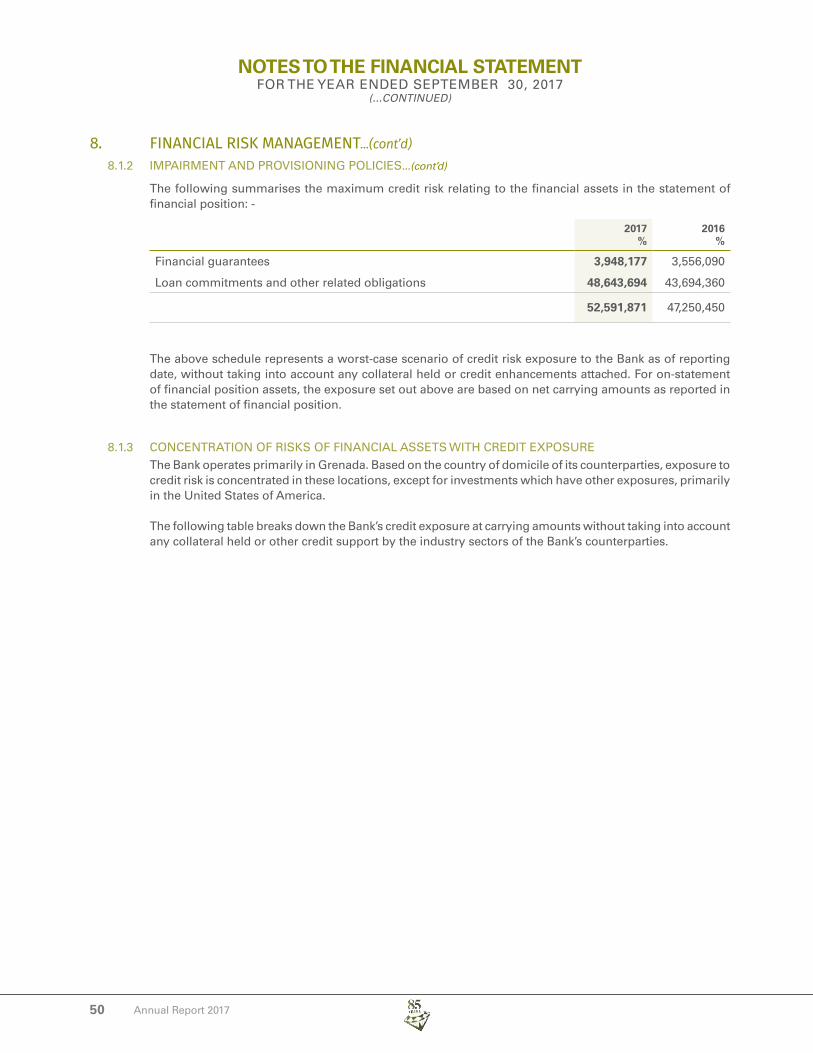
50
NOTES TO THE FINANCIAL STATEMENTFOR THE YEAR ENDED SEPTEMBER 30, 2017
(...CONTINUED)
Annual Report 2017
The following summarises the maximum credit risk relating to the financial assets in the statement of financial position: -
2017%
2016%
Financial guarantees
Loan commitments and other related obligations
3,948,177
48,643,694
3,556,090
43,694,360
52,591,871 47,250,450
The above schedule represents a worst-case scenario of credit risk exposure to the Bank as of reporting date, without taking into account any collateral held or credit enhancements attached. For on-statement of financial position assets, the exposure set out above are based on net carrying amounts as reported in the statement of financial position.
8.1.3 CONCENTRATION OF RISKS OF FINANCIAL ASSETS WITH CREDIT EXPOSUREThe Bank operates primarily in Grenada. Based on the country of domicile of its counterparties, exposure to credit risk is concentrated in these locations, except for investments which have other exposures, primarily in the United States of America.
The following table breaks down the Bank’s credit exposure at carrying amounts without taking into account any collateral held or other credit support by the industry sectors of the Bank’s counterparties.
8. FINANCIAL RISK MANAGEMENT...(cont’d)8.1.2 IMPAIRMENT AND PROVISIONING POLICIES...(cont’d)

Annual Report 2017 51
NOTES TO THE FINANCIAL STATEMENTFOR THE YEAR ENDED SEPTEMBER 30, 2017
(...CONTINUED)
GE
NE
RA
L IN
FOR
MA
TIO
NB
US
INE
SS
RE
VIE
W &
AN
ALY
SIS
CO
RP
OR
AT
E G
OV
ER
NA
NC
EFI
NA
NC
IAL
STA
TE
ME
NT
S
FIN
AN
CIA
LIN
ST
ITU
TIO
NS
$’00
0
MA
NU
FAC
-T
UR
ING
$’00
0TO
UR
ISM
$’00
0
GO
VE
RN
-M
EN
T$’
000
PRO
FES
SIO
NA
LA
ND
OT
HE
RS
ER
VIC
ES
$’00
0P
ER
SO
NA
L$’
000
OT
HE
RIN
DU
STR
IES
*$’
000
TOTA
L$’
000
At
Sep
tem
ber
30,
201
7
Dep
osi
ts w
ith C
entr
al B
ank
and
oth
er b
anks
Inve
stm
ent s
ecu
ritie
s
Loan
s an
d a
dva
nce
s to
cu
sto
mer
s:
Ove
rdra
fts
Term
loan
s an
d m
ort
gag
es
Oth
er a
sset
s an
d p
rep
aym
ents
162,
272
55,5
71 155
113
28,7
35
- -
1,16
1
18,5
91
-
- -
2,63
5
41,4
26
-
-
37,3
87
- - -
- -
2,89
7
27,6
12
-
- -
4,20
1
246,
087 -
-
182,
460
8,11
8
78,8
57 143
162,
272
275,
418
19,1
67
412,
686
28,8
78
246,
846
19,7
5244
,061
37,3
8730
,509
250,
288
269,
578
898,
421
Loan
co
mm
itmen
ts, l
ette
rs o
f cre
dit
gu
aran
tees
an
d o
ther
cre
dit
ob
ligat
ion
s55
863
282
125
,000
1,89
56,
400
17,2
8652
,592
At
Sep
tem
ber
30,
201
7
Dep
osi
ts w
ith C
entr
al B
ank
and
oth
er b
anks
Inve
stm
ent s
ecu
ritie
s
Loan
s an
d a
dva
nce
s to
cu
sto
mer
s:
Ove
rdra
fts
Term
loan
s an
d m
ort
gag
es
Oth
er a
sset
s an
d p
rep
aym
ents
162,
076
66,2
05 99 123
15,9
43
- -
2,52
1
18,6
48
-
- -
2,72
5
37,7
02
-
-
40,1
79
- - -
- -
1,90
1
29,9
55
-
- -
4,02
5
233,
148 -
-
72,6
52
5,93
9
67,5
42 249
162,
076
179,
036
17,2
10
387,
118
16,1
92
244,
446
21,1
6940
,427
40,1
7931
,856
237,
173
146,
382
761,
632
Fina
ncia
l gua
rant
ees
/ loa
n co
mm
itmen
ts a
nd
oth
er r
elat
ed o
blig
atio
ns
571
454
143
25,0
001,
468
4,44
915
,165
47,2
50
*Oth
er in
dust
ries
incl
ude
sect
ors
such
as
agric
ultu
re, c
onst
ruct
ion
and
land
dev
elop
men
t, tra
nspo
rtatio
n an
d st
orag
e, e
tc.
8.
FINA
NCIA
L RI
SK M
ANAG
EMEN
T...(cont’d)
8.1.
3 C
ON
CE
NT
RA
TIO
N O
F R
ISK
S O
F FI
NA
NC
IAL
AS
SE
TS
WIT
H C
RE
DIT
EX
PO
SU
RE
...(c
ont’d
)
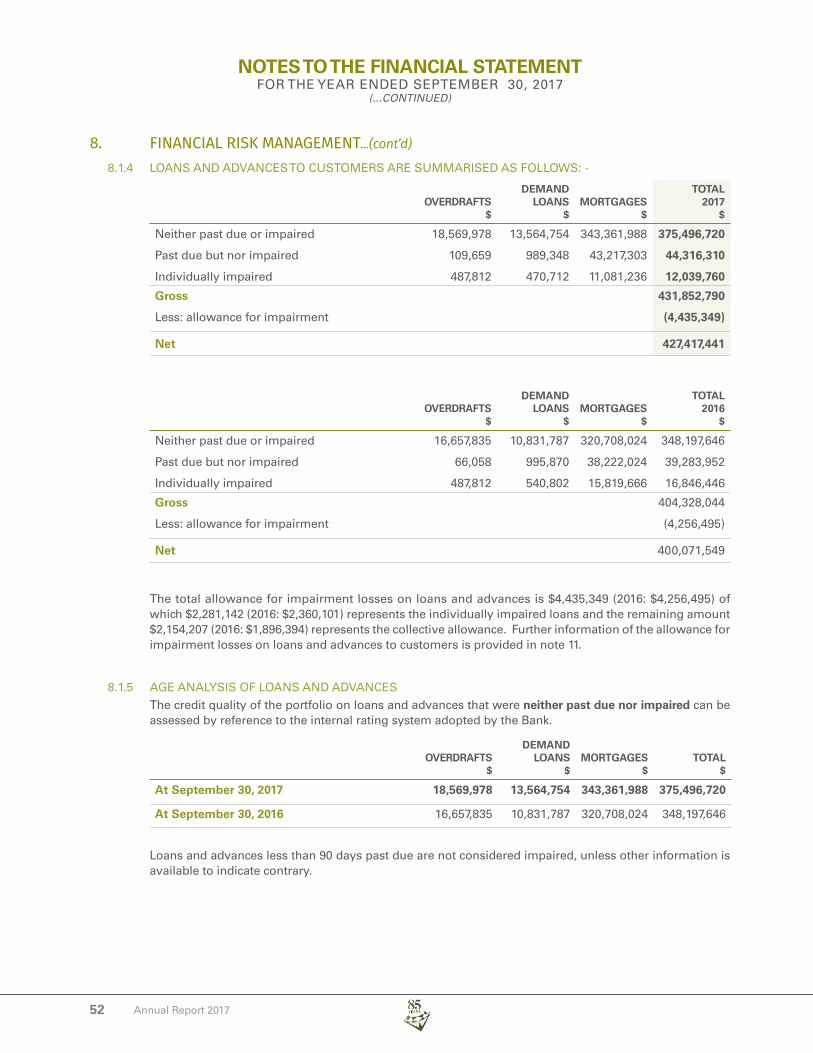
52
NOTES TO THE FINANCIAL STATEMENTFOR THE YEAR ENDED SEPTEMBER 30, 2017
(...CONTINUED)
Annual Report 2017
8.1.4 LOANS AND ADVANCES TO CUSTOMERS ARE SUMMARISED AS FOLLOWS: -
OVERDRAFTS$
DEMAND LOANS
$MORTGAGES
$
TOTAL2017
$
Neither past due or impaired
Past due but nor impaired
Individually impaired
18,569,978
109,659
487,812
13,564,754
989,348
470,712
343,361,988
43,217,303
11,081,236
375,496,720
44,316,310
12,039,760
Gross
Less: allowance for impairment
431,852,790
(4,435,349)
Net 427,417,441
OVERDRAFTS$
DEMAND LOANS
$MORTGAGES
$
TOTAL2016
$
Neither past due or impaired
Past due but nor impaired
Individually impaired
16,657,835
66,058
487,812
10,831,787
995,870
540,802
320,708,024
38,222,024
15,819,666
348,197,646
39,283,952
16,846,446
Gross
Less: allowance for impairment
404,328,044
(4,256,495)
Net 400,071,549
The total allowance for impairment losses on loans and advances is $4,435,349 (2016: $4,256,495) of which $2,281,142 (2016: $2,360,101) represents the individually impaired loans and the remaining amount $2,154,207 (2016: $1,896,394) represents the collective allowance. Further information of the allowance for impairment losses on loans and advances to customers is provided in note 11.
8.1.5 AGE ANALYSIS OF LOANS AND ADVANCESThe credit quality of the portfolio on loans and advances that were neither past due nor impaired can be assessed by reference to the internal rating system adopted by the Bank.
OVERDRAFTS$
DEMAND LOANS
$MORTGAGES
$TOTAL
$
At September 30, 2017 18,569,978 13,564,754 343,361,988 375,496,720
At September 30, 2016 16,657,835 10,831,787 320,708,024 348,197,646
Loans and advances less than 90 days past due are not considered impaired, unless other information is available to indicate contrary.
8. FINANCIAL RISK MANAGEMENT...(cont’d)

Annual Report 2017 53
NOTES TO THE FINANCIAL STATEMENTFOR THE YEAR ENDED SEPTEMBER 30, 2017
(...CONTINUED)
GE
NE
RA
L IN
FOR
MA
TIO
NB
US
INE
SS
RE
VIE
W &
AN
ALY
SIS
CO
RP
OR
AT
E G
OV
ER
NA
NC
EFI
NA
NC
IAL
STA
TE
ME
NT
S
The gross amount of loans and advances by class to customers that were past due but not impaired were as follows: -
OVERDRAFTS$
DEMAND LOANS
$MORTGAGES
$TOTAL
$
At September 30, 2017
Past due up to 30 days
Past due 31 - 60 days
Past due 61 - 90 days
109,659
-
-
947,987
24,935
16,426
35,687,097
6,150,419
1,379,787
36,744,743
6,175,354
1,396,213
109,659 989,348 43,217,303 44,316,310
At September 30, 2016
Past due uo to 30 days
Past due 31 - 60 days
Past due 61 - 90 days
60,191
5,867
-
764,918
215,260
15,692
26,161,701
10,199,192
1,861,131
26,986,810
10,420,319
1,876,823
66,058 995,870 38,222,024 39,283,952
The breakdown of the gross amount of individually impaired loans and advances by classes are as follows: -
At September 30, 2017 487,812 470,712 11,081,236 12,039,760
At September 30, 2016 485,978 540,802 15,819,666 16,846,446
8.2 MARKET RISKThe Bank takes on exposure to market risks, which is the risk that the fair value of future cash flows of a financial instrument will fluctuate because of changes in market prices. Market risks arise from open positions in interest rate, currency and equity products, all of which are exposed to general and specific market movements and changes in the level of volatility of market rate or prices such as interest rates, credit spreads, foreign exchange rates and equity prices. The Bank separates exposures to market risk into either trading or non-trading portfolios.
Non-trading portfolios primarily arise from the interest rate management of the Bank’s retail banking assets and liabilities. Non-trading portfolios also consist of exchange and equity risks arising from the Bank’s available-for-sale investments (Note 12).
8.2.1 CURRENCY RISKThe Bank takes on exposure to the effects of fluctuations in the prevailing foreign currency exchange rates on its financial position and cash flows. The Board sets limits on the level of exposure by currency and in total for both overnight and intra-day positions, which are monitored daily. The Bank’s exposure to currency risk is minimal since most of its assets and liabilities in foreign currencies are held in United States dollars. The exchange rate of the Eastern Caribbean dollar (EC$) to the United States dollar (US$) has been formally pegged at EC$2.70 = US$1.00 since 1976.
The following table summarises the Bank’s exposure to foreign currency exchange rate risk at September 30.
8. FINANCIAL RISK MANAGEMENT...(cont’d)8.1.5 AGE ANALYSIS OF LOANS AND ADVANCES...(cont’d)
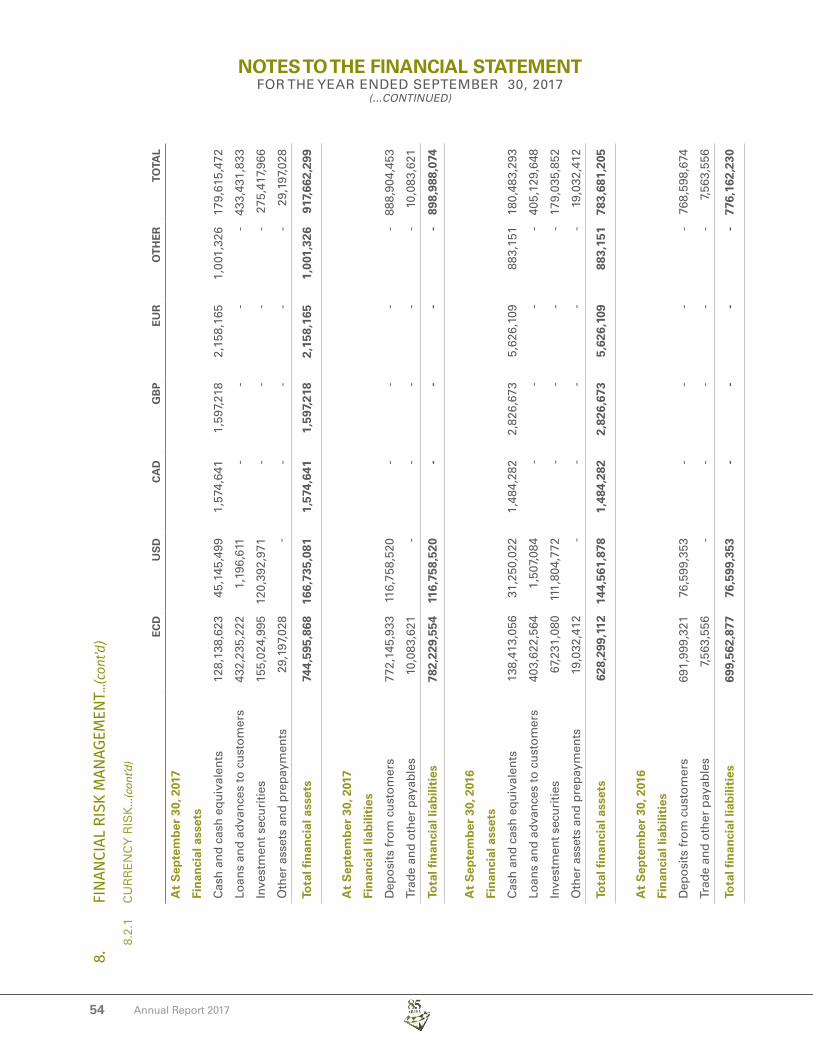
54
NOTES TO THE FINANCIAL STATEMENTFOR THE YEAR ENDED SEPTEMBER 30, 2017
(...CONTINUED)
Annual Report 2017
EC
DU
SD
CA
DG
BP
EU
RO
TH
ER
TOTA
L
At
Sep
tem
ber
30,
201
7
Fin
anci
al a
sset
s
Cas
h a
nd
cas
h e
qu
ival
ents
Loan
s an
d a
dva
nce
s to
cu
sto
mer
s
Inve
stm
ent s
ecu
ritie
s
Oth
er a
sset
s an
d p
rep
aym
ents
128,
138,
623
432,
235,
222
155,
024,
995
29,1
97,0
28
45,1
45,4
99
1,19
6,61
1
120,
392,
971 -
1,57
4,64
1 - - -
1,59
7,21
8 - - -
2,15
8,16
5 - - -
1,00
1,32
6 - - -
179,
615,
472
433,
431,
833
275,
417,
966
29,1
97,0
28
Tota
l fin
anci
al a
sset
s74
4,59
5,86
816
6,73
5,08
11,
574,
641
1,59
7,21
82,
158,
165
1,00
1,32
6 91
7,66
2,29
9
At
Sep
tem
ber
30,
201
7
Fin
anci
al li
abili
ties
Dep
osi
ts fr
om
cu
sto
mer
s
Trad
e an
d o
ther
pay
able
s
772,
145,
933
10,0
83,6
21
116,
758,
520 -
- -
- -
- -
- -
888,
904,
453
10,0
83,6
21
Tota
l fin
anci
al li
abili
ties
782,
229,
554
116,
758,
520
--
--
898,
988,
074
At
Sep
tem
ber
30,
201
6
Fin
anci
al a
sset
s
Cas
h a
nd
cas
h e
qu
ival
ents
Loan
s an
d a
dva
nce
s to
cu
sto
mer
s
Inve
stm
ent s
ecu
ritie
s
Oth
er a
sset
s an
d p
rep
aym
ents
138,
413,
056
403,
622,
564
67,2
31,0
80
19,0
32,4
12
31,2
50,0
22
1,50
7,08
4
111,
804,
772 -
1,48
4,28
2 - - -
2,82
6,67
3 - - -
5,62
6,10
9 - - -
883,
151 - - -
180,
483,
293
405,
129,
648
179,
035,
852
19,0
32,4
12
Tota
l fin
anci
al a
sset
s62
8,29
9,11
214
4,56
1,87
81,
484,
282
2,82
6,67
3 5,
626,
109
883,
151
783,
681,
205
At
Sep
tem
ber
30,
201
6
Fin
anci
al li
abili
ties
Dep
osi
ts fr
om
cu
sto
mer
s
Trad
e an
d o
ther
pay
able
s
691,
999,
321
7,56
3,55
6
76,5
99,3
53
-
- -
- -
- -
- -
768,
598,
674
7,56
3,55
6
Tota
l fin
anci
al li
abili
ties
699,
562,
877
76,5
99,3
53-
--
-77
6,16
2,23
0
8.
FINA
NCIA
L RI
SK M
ANAG
EMEN
T...(cont’d)
8.2.
1 C
UR
RE
NC
Y R
ISK
...(c
ont’d
)

Annual Report 2017 55
NOTES TO THE FINANCIAL STATEMENTFOR THE YEAR ENDED SEPTEMBER 30, 2017
(...CONTINUED)
GE
NE
RA
L IN
FOR
MA
TIO
NB
US
INE
SS
RE
VIE
W &
AN
ALY
SIS
CO
RP
OR
AT
E G
OV
ER
NA
NC
EFI
NA
NC
IAL
STA
TE
ME
NT
S
8.2.2 INTEREST RATE RISKCash flow interest rate risk is that the future cash flows of a financial instrument will fluctuate because of changes in market interest rates. Fair value interest rate risk is the risk that the value of a financial instrument will fluctuate because of changes in market interest rates. The Bank takes an exposure to the effects of fluctuations in the prevailing levels of market interest rates on both its fair value and cash flow risks. Interest margins may increase as a result of such changes but may reduce or create losses in the event that unexpected movements arise. The Board sets limits on the level of mismatch of interest rate repricing that may be undertaken, which is monitored daily.
The table below summarise the Bank’s exposure to interest rate risks.
UP TO ONE YEAR
$’000
BETWEEN 1 – 5 YEARS
$’000
OVER5 YEARS
$’000
NON-INTEREST BEARING
$’000TOTAL
$’000
At September 30, 2017
Assets
Cash and cash equivalents
Loans and advances to customers
Investment securities
Other assets and prepayments
77,009
53,187
125,081
-
-
65,793
12,700
-
-
312,873
135,302
-
102,606
-
2,335
29,197
179,615
431,853
275,418
29,197
Total assets 255,277 78,493 448,175 134,138 916,083
Liabilities
Deposits from customers
Trade and other payables
608,093
-
7,013
-
-
-
272,796
10,083
887,902
10,083
Total liabilities 608,093 7,013 - 282,879 897,985
Net interest re-pricing gap (352,816) 71,480 448,175 (148,741) 18,098
At September 30, 2016
Assets
Cash and cash equivalents
Loans and advances to customers
Investment securities
Other assets and prepayments
77,708
64,620
102,805
-
-
48,900
12,412
-
-
290,808
-
-
102,775
-
63,819
19,032
180,483
404,328
179,036
19,032
Total assets 245,133 61,312 290,808 185,626 782,879
Liabilities
Deposits from customers
Trade and other payables
527,835
-
2,650
-
-
-
236,192
7,564
766,677
7,564
Total liabilities 527,835 2,650 - 243,756 774,241
Net interest re-pricing gap (282,702) 58,662 290,808 (58,130) 8,638
8. FINANCIAL RISK MANAGEMENT...(cont’d)

56
NOTES TO THE FINANCIAL STATEMENTFOR THE YEAR ENDED SEPTEMBER 30, 2017
(...CONTINUED)
Annual Report 2017
Cash flow interest rate risk arises from loans and advances to customers at variable rates. At September 30, 2017 if variable interest rates had been 0.5% higher/lower with all other variables held constant, post-tax profit for the year would have been $42,870 (2016: $333,835) higher/lower, mainly as a result of higher/lower interest income on variable rate loans.
8.3 LIQUIDITY RISKLiquidity risk is the risk that the Bank is unable to meet its payment obligations associated with its financial liabilities when they fall due and to replace funds when they are withdrawn. The consequence may be the failure to meet obligations to repay deposits and fulfil commitments to lend.
The Bank is exposed to daily cash calls on its available cash resources from overnight deposits, current accounts, maturing deposits, loan draw-downs, and guarantees. The Bank does not maintain cash resources to meet all of these needs, as experience shows that a minimum level of reinvestment of maturing funds can be predicted with a high level of certainty. The Board sets limits on the minimum proportion of maturing funds available to meet such calls and on the minimum level of interbank and other borrowing facilities that should be in place to cover withdrawals at unexpected levels of demand.
8.3.1 LIQUIDITY RISK MANAGEMENTThe liquidity management process ensures that the Bank is able to honour all its commitments when they fall due. Liquidity risk is managed by the Bank’s Risk & Capital Committee, which formulates strategies for maintaining adequate exposure from deposit concentrations and also building core deposits.
The contractual maturities of assets and liabilities and the ability to replace, at an acceptable cost, interest-bearing liabilities as they mature, are important factors in assessing the liquidity of the Bank and its exposure to changes in interest rates and exchange rates.
Liquidity requirements to support calls under guarantees and standby letters of credit are considerably less than the amount of the commitment because the Bank does not generally except the third party to draw funds under the agreement. The total outstanding contractual amount of commitments to extend credit does not necessarily represent future cash requirements, since many of these commitments will expire or terminate without being funded.
The table below presents the cash flows payable by the Bank under non-derivative financial liabilities and assets held for managing liquidity risks by remaining contractual maturities at the statement of financial position date. The amounts disclosed in the table are the contractual undiscounted cash flows.
8. FINANCIAL RISK MANAGEMENT...(cont’d)8.2.2 INTEREST RATE RISK...(cont’d)

Annual Report 2017 57
NOTES TO THE FINANCIAL STATEMENTFOR THE YEAR ENDED SEPTEMBER 30, 2017
(...CONTINUED)
GE
NE
RA
L IN
FOR
MA
TIO
NB
US
INE
SS
RE
VIE
W &
AN
ALY
SIS
CO
RP
OR
AT
E G
OV
ER
NA
NC
EFI
NA
NC
IAL
STA
TE
ME
NT
S
UP TO ONEYEAR$’000
BETWEEN 1 – 5 YEARS
$’000
OVER5 YEARS
$’000TOTAL
$’000
At September 30, 2017
Financial liabilities
Deposits from customers
Trade and other payables
881,891
10,083
7,013
-
-
-
888,904
10,083
Total financial liabilities 891,974 7,013 898,987
Assets held for managing liquidity
Cash and cash equivalents
Investment securities
Loans and advances to customers
179,615
275,418
53,187
-
-
65,793
-
-
312,873
179,615
275,418
431,853
Total financial assets held for managing liquidity 508,220 65,793 312,873 886,886
Net liquidity gap (383,754) 58,780 312,873 (12,101)
At September 30, 2016
Financial liabilities
Customers’ deposits
Trade and other payables
764,026
7,564
2,651
-
-
-
766,677
7,564
Total financial liabilities 771,590 2,651 774,241
Assets held for managing liquidity
Cash and balances held with Central Bank and other banks
Financial investments
180,483
162,750
-
12,253
-
2,437
180,483
177,440
Loans and advances to customers 64,620 48,900 290,808 404,328
Total financial assets held for managing liquidity 407,853 61,153 293,245 762,251
Net liquidity gap (363,737) 58,502 293,245 (11,990)
Off-statement of financial position items
a. Financial guaranteesFinancial guarantees (Note 28) are also included below based on the earliest contractual maturity date.
b. Loan commitments and other related obligationsThe dates of the contractual amounts of the Bank’s off-statement of financial position financial instruments that commit it to extend credit to customers and other facilities (Note 28), are summarised in the table below.
8. FINANCIAL RISK MANAGEMENT...(cont’d)8.3.1 LIQUIDITY RISK MANAGEMENT...(cont’d)

58
NOTES TO THE FINANCIAL STATEMENTFOR THE YEAR ENDED SEPTEMBER 30, 2017
(...CONTINUED)
Annual Report 2017
2017$
2016$
Financial guarantees
Loan commitments and other related obligations
3,948,177
48,643,694
3,556,090
43,694,360
Total 52,591,871 47,250,450
8.4 FAIR VALUE OF FINANCIAL ASSETS AND LIABILITIESFair value amounts represent estimates of the consideration that would currently be agreed upon between knowledgeable, willing parties, who are under no compulsion to act and is best evidenced by a quoted market price. If no quoted market prices exist, the fair values represented are estimates derived using present value or other valuation techniques indicative of net realizable value.
The fair values of cash resources, other assets and liabilities, cheques and other items in transit and due to other banks are assumed to approximate their carrying values due to their short-term nature. Debt securities are carried at amortised cost in the absence of market value and are considered to reflect fair value. Equity investments are that unquoted and are carried at cost less impairment which is management’s estimate of fair value. The fair value of off-statement of financial position commitments are also assumed to approximate the amounts disclosed in Note 28 due to their short-term nature.
The following methods and assumptions have been used to estimate the fair value of each class of financial assets and liabilities for which it is practical to estimate a value.
a. Deposits from customersThe estimated fair value of deposits with no stated maturity, which includes non-interest- bearing deposits, is the amount repayable on demand. Deposits payable on a fixed date at rates which reflect market conditions and are assumed to have fair values which approximate carrying value.
b. Investment securitiesInvestment securities include interest bearing debt and equity securities. Debt securities are carried at amortised cost in the absence of market value and are considered to reflect fair value. Assets classified for sale are measured at fair value based on market prices or broker/dealer price quotations. Where this information is not available, fair value is estimated using quoted market prices for securities with similar credit maturity and yield characteristics.
c. Loans and advances to customersLoans and advances to customers are net of allowance for impairment. The estimated fair values of loans and advances represent the discounted amount of estimated future cashflows expected to be received. Expected cashflows are discounted at current market rates to determine fair value.
The following table summarises the carrying amounts and fair values of those financial assets and liabilities not presented on the Bank’s statement of financial position at their fair value.
8. FINANCIAL RISK MANAGEMENT...(cont’d)8.3.1 LIQUIDITY RISK MANAGEMENT...(cont’d)

Annual Report 2017 59
NOTES TO THE FINANCIAL STATEMENTFOR THE YEAR ENDED SEPTEMBER 30, 2017
(...CONTINUED)
GE
NE
RA
L IN
FOR
MA
TIO
NB
US
INE
SS
RE
VIE
W &
AN
ALY
SIS
CO
RP
OR
AT
E G
OV
ER
NA
NC
EFI
NA
NC
IAL
STA
TE
ME
NT
S
CARRYING VALUE FAIR VALUE
2017$
2016$
2017$
2016$
Financial assets
Cash and cash equivalents
Loans and advances to customers
Investment securities:
- Unquoted debt securities
- Unquoted equity securities
Other assets and prepayments
179,615,472
433,431,833
59,629,717
1,318,933
29,197,028
180,483,293
405,129,648
63,737,127
1,312,938
19,032,412
179,615,472
433,431,833
59,629,717
1,318,933
29,197,028
180,483,293
405,129,648
63,737,127
1,312,938
19,032,412
Total financial assets 703,192,983 669,695,418 703,192,983 669,695,418
Financial liabilities
Deposits from customers
Trade and other payables
888,904,453
10,083,621
768,598,674
7,563,556
888,904,453
10,083,621
768,598,674
7,563,556
Total financial liabilities 898,988,074 776,162,230 898,988,074 776,162,230
Off-statement of financial position instruments
Loan commitments, letters of credit, guarantees and other credit obligations - - 52,591,871 47,250,450
8.5 FINANCIAL INSTRUMENTS MEASURED AT FAIR VALUE - FAIR VALUE HIERARCHY
LEVEL 1$’000
LEVEL 2$’000
LEVEL 3$’000
LEVEL 4$’000
September 30, 2017
Assets measured at fair value:
Financial assets available-for-sale
- debt securities
- equity securities
120,393
1,016
92,305
-
- 212,698
1,016
Total 121,409 92,305 - 213,714
September 30, 2016
Assets measured at fair value:
Financial assets available-for-sale
- debt securities
- equity securities
111,411
979
-
-
-
-
111,411
979
Total 112,390 - - 112,390
8. FINANCIAL RISK MANAGEMENT...(cont’d)8.4 FAIR VALUE OF FINANCIAL ASSETS AND LIABILITIES...(cont’d)
60
NOTES TO THE FINANCIAL STATEMENTFOR THE YEAR ENDED SEPTEMBER 30, 2017
(...CONTINUED)
Annual Report 2017
IFRS 7 specifies a hierarchy of valuation techniques based on whether the inputs to those valuation techniques are observable or unobservable. Observable inputs reflect market data obtained from independent sources; unobservable inputs reflect the Bank’s market assumptions. These two types of inputs have created the following fair value hierarchy:
» Level 1 – Quoted prices (unadjusted) in active markets for identical assets or liabilities. This level includes listed equity securities and debt instruments on exchanges such as Eastern Caribbean and New York.
» Level 2 – Inputs other than quoted prices included within Level 1 that are observable for the asset or liability, either directly (that is, as prices) or indirectly (that is, derived from prices).
» Level 3 – inputs for the asset or liability that are not based on observable market data (unobservable inputs). This level includes equity investments and debt instruments with significant unobservable components.
8.6 CAPITAL MANAGEMENTThe Bank’s objectives when managing capital, which is a broader concept than the ‘equity’ on the face of statement of financial position, are:
» To comply with the capital requirements set by the Eastern Caribbean Central Bank;
» To safeguard the Bank’s ability to continue as a going concern so that it can continue to provide returns for shareholders and benefits for other stakeholders; and
» To maintain a strong capital base to support the development of its business.
Capital adequacy and the use of regulatory capital are monitored daily by the Bank’s management, employing techniques based on the guidelines developed by the Eastern Caribbean Central Bank (‘the ECCB’) for supervisory purposes. The required information is filed with the Authority on a quarterly basis.
The ECCB requires each bank or banking group to: (a) hold the minimum level of regulatory capital of $20,000,000 and (b) maintain a ratio of total regulatory capital to the risk-weighted asset (the “Capital Adequacy Ratio’) at or above the minimum indicated in the prudential guidelines of 8%.
The Bank’s regulatory capital as managed by management is divided into two tiers:
» Tier 1 capital: share capital, retained earnings and reserves created by appropriations of retained earnings.
» Tier 2 capital: qualifying subordinated loan capital, collective impairment allowances and unrealised gains arising on the fair valuation of equity instruments held as available-for-sale and fixed assets revaluation reserves.
The risk-weighted assets are measured by means of a hierarchy of five (5) risk weights classified according to the nature of – and reflecting an estimate of credit, market and other risks associated with – each asset and counterparty, taking into account any eligible collateral or guarantees. A similar treatment is adopted for off-statement of financial position exposure, with some adjustments to reflect the more contingent nature of the potential losses.
The table below summarises the composition of regulatory capital and the ratios of the Bank for as of reporting date. During the reporting periods, the Bank complied with all of the ECCB capital requirements.
8. FINANCIAL RISK MANAGEMENT...(cont’d)8.5 FINANCIAL INSTRUMENTS MEASURED AT FAIR VALUE - FAIR VALUE HIERARCHY...(cont’d)

Annual Report 2017 61
NOTES TO THE FINANCIAL STATEMENTFOR THE YEAR ENDED SEPTEMBER 30, 2017
(...CONTINUED)
GE
NE
RA
L IN
FOR
MA
TIO
NB
US
INE
SS
RE
VIE
W &
AN
ALY
SIS
CO
RP
OR
AT
E G
OV
ER
NA
NC
EFI
NA
NC
IAL
STA
TE
ME
NT
S
8. FINANCIAL RISK MANAGEMENT...(cont’d)8.6 CAPITAL MANAGEMENT...(cont’d)
2017$
2016$
Tier 1 capital:
Paid up ordinary share capital
Statutory reserves
General reserves
Retained earnings
24,871,739
11,443,417
841,781
9,876,266
24,871,739
10,096,857
673,461
7,656,161
Total qualifying tier 1 capital 47,033,203 43,298,218
Tier 2 capital:
Fixed assets revaluation reserves 1
General provisions
Other asset revaluation reserves
Regulatory loss reserves
9,406,641
3,481,344
5,419,968
2,161,816
3,825,535
2,815,690
1,531,325
-
Total qualifying tier 2 capital 20,469,769 8,172,550
Total qualifying capital 67,502,972 51,470,768
Risk weighted assets:
On statement of financial position
Off statement of financial position
657,087,948
52,591,871
578,677,000
47,250,45
Total risk – weighted assets 709,679,819 625,927,450
Capital adequacy ratio 9.5% 8.2%
The capital adequacy ratio is calculated as total qualifying capital divided by total risk-weighted assets.
8.7 OPERATIONAL RISKOperational risk is the risk of direct or indirect loss in both financial and non-financial terms arising from a wide variety of causes associated with the Bank’s processes, personnel, technology and infrastructure. It may also arise from external factors other than credit, market and liquidity risks such as those arising from legal and regulatory requirements and generally accepted standards of corporate behaviour. Operational risks arise from all of the Bank’s operations and are faced by all departments.
Managing operational risk in the Bank is seen as an integral part of day-to-day operations and management, which includes explicit consideration of both the opportunities and the risks of all business activities. The Bank’s objective is to manage operational risk so as to balance an avoidance of financial losses and damage to the Bank’s reputation with overall cost effectiveness and to avoid control procedures that restrict initiative and creativity.
1 Amounts noted for fixed assets revaluation reserve should not exceed 20% of total qualifying tier1 capital.
62
NOTES TO THE FINANCIAL STATEMENTFOR THE YEAR ENDED SEPTEMBER 30, 2017
(...CONTINUED)
Annual Report 2017
The primary responsibility for the development and implementation of controls to address operational risk is assigned to the management team of each department. This responsibility is supported by bank-wide corporate policies which describe the standard of conduct required of staff and specific internal control systems designed around the particular characteristics of various Bank activities.
Compliance with corporate policies and departmental control systems are managed by:
» Requirements for appropriate segregation of duties, including the independent authorisation of transactions;
» Requirements for the reconciliation and monitoring of transactions;
» Compliance with regulatory and other legal requirements;
» Documentation of controls and procedures;
» Requirements for the periodic assessment of operational risks faced, and the adequacy of the controls and procedures to assess the risks identified;
» Development and periodic testing of contingency plans;
» Training and professional development;
» Ethical and business standards;
» Risk mitigation, including insurance where it is effective;
» A structured induction program for new employees.
Compliance with the Bank’s standards is supported by a programme of periodic reviews undertaken by the Internal Audit Department. The results of the internal audit reviews are discussed with the management of the department to which they relate and summaries are submitted to the Board Audit Committee and Executive Committee of the Bank.
9. CRITICAL ACCOUNTING ESTIMATES AND JUDGEMENTSThe Bank makes estimates and assumptions that affect the reported amounts of assets and liabilities within the next financial year. Estimates and judgements are continually evaluated and are based on historical experience and other factors, including expectations of future events that are believed to be reasonable under the circumstances.
a. Going concernThe Bank’s management is satisfied that it has the resources to continue in business for the foreseeable future. The Bank’s management is not aware of any material uncertainties that may cast significant doubt upon its ability to continue as a going concern.
b. Impairment of assets carried at fair valueThe Bank determines that available-for-sale and held for trading equity investments are impaired when there has been a significant or prolonged decline in the fair value below its cost. This determination of what is significant or prolonged requires judgement. In making this judgement, the Bank evaluates among other factors, the normal volatility in share price. In addition, impairment may be appropriate when there is evidence of deterioration in the financial health of the investee, industry and sector performance, changes in technology and operational and financing cash flows.
8. FINANCIAL RISK MANAGEMENT...(cont’d)8.7 OPERATIONAL RISK...(cont’d)
Annual Report 2017 63
NOTES TO THE FINANCIAL STATEMENTFOR THE YEAR ENDED SEPTEMBER 30, 2017
(...CONTINUED)
GE
NE
RA
L IN
FOR
MA
TIO
NB
US
INE
SS
RE
VIE
W &
AN
ALY
SIS
CO
RP
OR
AT
E G
OV
ER
NA
NC
EFI
NA
NC
IAL
STA
TE
ME
NT
S
c. Impairment losses on loans and advancesThe Bank reviews its loan portfolio to assess impairment on an annual basis. In determining whether an impairment loss should be recorded in the statement of profit or loss, the Bank makes judgement as to whether there is any observable data indicating that there is a measurable decrease in the estimated future cash flows from a portfolio of loans before the decrease can be identified with an individual loan in that portfolio. Management uses estimates based on historical loss experience for assets with credit risk characteristics and objective evidence of impairment similar to those in the portfolio when scheduling its future cash flows. Guidelines issued by the Eastern Caribbean Central Bank on methodology and assumptions used for estimating both the amount and timing of future cash flows are reviewed regularly to reduce any differences between loss estimates and actual loss experience.
d. Impairment of available-for-sale equity investmentsThe Bank determines that available-for-sale equity investments are impaired when there has been a significant or prolonged decline in the fair value below its cost. This determination of what is significant or prolonged requires judgement. In making this judgement, the Bank evaluates, among other factors, when there is evidence of deterioration in the financial health of the investee industry and sector performance, changes in technology and operational and financing cash flows. There were no declines in fair value below cost considered significant or prolonged as at reporting date.
e. Income taxesEstimates are required in determining the provision for income taxes. There are many transactions and calculations for which the ultimate tax determination is uncertain during the ordinary course of business. The Bank recognises liabilities for anticipated tax audit issues based on estimates of whether additional taxes will be due. Where the final tax outcome of these matters is different from the amount that were initially recorded, such difference will impact the income tax and deferred tax provisions in the period in which such determination is made.
f. Revaluation of land and buildingsThe Bank utilises professional valuators to determine the fair value of its properties.Valuations are determined through the application of a variety of different valuation methods which are all sensitive to the underlying assumptions chosen.
10. CASH AND CASH EQUIVALENTS2017
$2016
$
Cash on hand
Amount due from banks
17,342,935
77,009,270
18,406,939
77,707,869
Deposit with ECCB - Reserve
Due from ECCB
ECCB ACH collateral
Deposits pledged with other institutions
94,352,205
19,810,428
52,912,953
11,000,000
1,539,886
96,114,808
19,810,428
55,991,874
7,000,000
1,566,183
179,615,472 180,483,293
9. CRITICAL ACCOUNTING ESTIMATES AND JUDGEMENTS...(cont’d)

64
NOTES TO THE FINANCIAL STATEMENTFOR THE YEAR ENDED SEPTEMBER 30, 2017
(...CONTINUED)
Annual Report 2017
Reserve depositStatutory reserve deposits with the ECCB represent the Bank’s regulatory requirement to maintain a minimum percentage of 6% of deposit liabilities as cash in vault and or deposits with the ECCB in accordance with Article 33 of the ECCB Agreement of 1983. The reserve deposit is a mix of both interest bearing and non-interest bearing. As at balance sheet date, the required reserve was $53,005k (2016: $46,098K).
Amount for reserve held as follows:
2017$
2016$
Reserve deposit
Cash in vault
ECCB clearing account
19,810
14,216
18,979
19,810
15,297
10,991
53,005 46,098
Deposits pledged with other institutionsDeposits pledged with other institutions are non-interest bearing and represent cash placed as security to facilitate the Bank’s card services, and are excluded from cash resources to arrive at cash and cash equivalents.
11. LOANS AND ADVANCES TO CUSTOMERSMortgages
Demand loans
Overdrafts
397,660,527
15,024,814
19,167,449
374,749,715
12,368,458
17,209,871
Less: allowance for impairment (Note 11.2)
431,852,790
(4,435,349)
404,328,044
4,256,495)
Interest receivable
427,417,441
6,014,392
400,071,549
5,058,099
433,431,833 405,129,648
Due within one year
Due after one year
53,187
378,666
64,620
339,708
431,853 404,328
The effective interest yield during the year on loans and advances was 7.39% (2016: 7.53%).
At the reporting date, loans and advances considered impaired, net of specific provision for impairment, amount to $10,208,185 (2016: $14,4869,346).
10. CASH AND CASH EQUIVALENTS...(cont’d)

Annual Report 2017 65
NOTES TO THE FINANCIAL STATEMENTFOR THE YEAR ENDED SEPTEMBER 30, 2017
(...CONTINUED)
GE
NE
RA
L IN
FOR
MA
TIO
NB
US
INE
SS
RE
VIE
W &
AN
ALY
SIS
CO
RP
OR
AT
E G
OV
ER
NA
NC
EFI
NA
NC
IAL
STA
TE
ME
NT
S
11. LOANS AND ADVANCES TO CUSTOMERS...(cont’d)11.1 SECTORAL ANALYSIS
2017$000’S
2017%
2016$000’S
2016%
Agriculture
Fisheries
Manufacturing
Utilities (electricity, water, telephone & media)
Construction and land development
Distributive trades
Tourism
Entertainment and catering
Transportation and storage
Financial institutions
Professional and other services
Public administration
Personal
847
1,165
19,752
7,886
19,134
32,759
44,061
3,402
21,753
268
30,509
-
250,317
0.20
0.27
4.57
1.83
4.43
7.59
10.20
0.79
5.04
0.06
7.06
-
57.96
937
1,051
21,169
12,460
20,941
27,015
40,427
2,603
8,474
222
31,856
9
237,164
0.23
0.26
5.24
3.08
5.18
6.68
10.00
0.64
2.10
0.05
7.88
-
58.66
431,853 100.00 404,328 100
Less: allowance for impaired loans and advances (Note 8.2)
Add: interest receivable, net
(4,435)
6,014
(4,256)
5,058
433,432 405,130
11.2 LOANS AND ADVANCES IMPAIRMENT ANALYSISMovement in allowance for loan losses is as follows: -
2017$
2016$
Balance beginning of year
Bad debts written off
Increase in allowance
4,256,495
(3,629,274)
3,808,128
5,907,190
(7,967,689)
6,316,994
Balance end of year 4,435,349 4,256,495

66
NOTES TO THE FINANCIAL STATEMENTFOR THE YEAR ENDED SEPTEMBER 30, 2017
(...CONTINUED)
Annual Report 2017
The following is a sectoral analysis of the composition of the allowance for loan losses:
2017$
2017%
2016$
2016%
Agriculture
Manufacturing
Construction and land development
Distributive trades
Tourism
Entertainment
Transportation
Personal
General provisioning
68,206
160,478
533
340,663
377,561
128,387
248,600
956,715
2,154,206
1.54
3.62
0.02
7.68
8.51
2.89
5.60
21.57
48.57
8,907
306,682
21,287
409,097
838,755
31,272
400,314
343,787
1,896,394
0.21
7.21
0.05
9.61
19.71
0.73
9.40
8.08
44.55
4,435,349 100.00 4,256,495 100.00
12. INVESTMENT SECURITIESThe Bank holds the following financial instruments: -
LOANS ANDRECEIVABLES
$
AVAILABLE FOR-SALE
$TOTAL
$
At September 30, 2017
Securities at amortised cost:
Unquoted equity securities, at cost
59,629,717
-
-
1,318,933
59,629,717
1,318,933
59,629,717 1,318,933 60,948,650
Securities at fair value:
- quoted debt securities
- quoted equity securities
- other securities
-
-
92,304,573
62,068,212
38,937,068
20,403,591
62,068,212
38,937,068
112,708,164
92,304,573 121,408,871 213,713,444
Interest receivable 377,306 378,566 755,872
Total Investment securities 152,311,596 123,106,370 275,417,966
11. LOANS AND ADVANCES TO CUSTOMERS...(cont’d)11.2 LOANS AND ADVANCES IMPAIRMENT ANALYSIS...(cont’d)
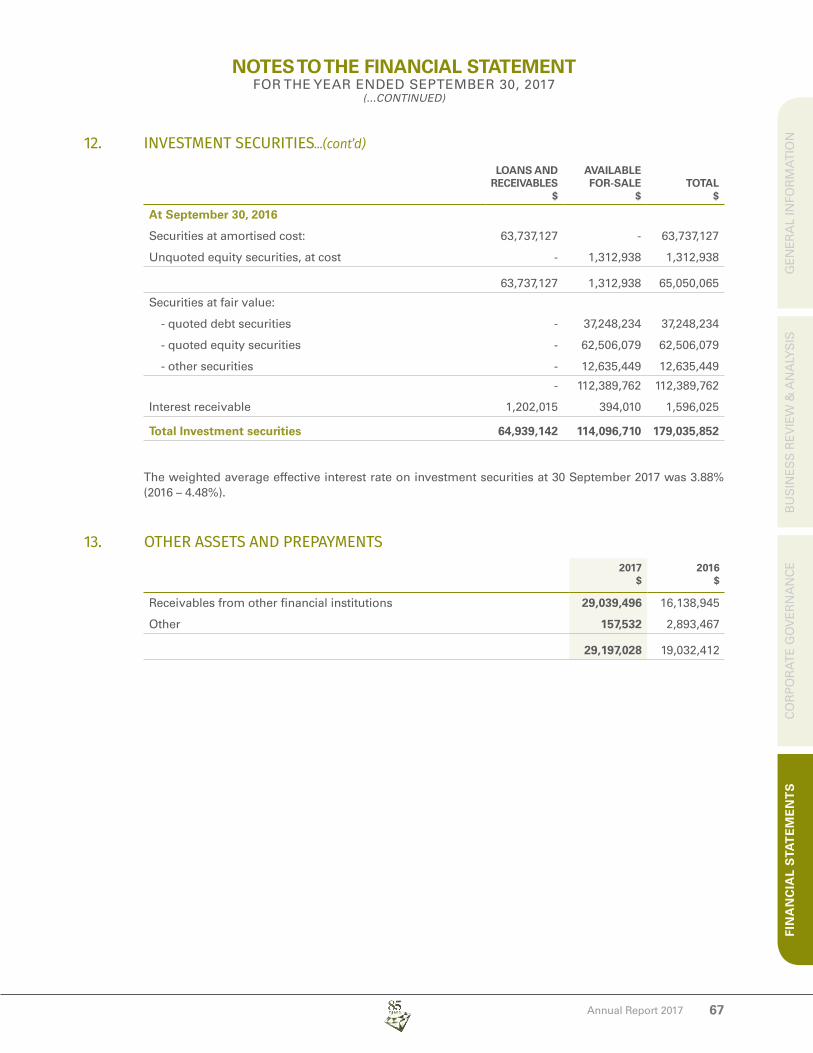
Annual Report 2017 67
NOTES TO THE FINANCIAL STATEMENTFOR THE YEAR ENDED SEPTEMBER 30, 2017
(...CONTINUED)
GE
NE
RA
L IN
FOR
MA
TIO
NB
US
INE
SS
RE
VIE
W &
AN
ALY
SIS
CO
RP
OR
AT
E G
OV
ER
NA
NC
EFI
NA
NC
IAL
STA
TE
ME
NT
S
LOANS ANDRECEIVABLES
$
AVAILABLE FOR-SALE
$TOTAL
$
At September 30, 2016
Securities at amortised cost:
Unquoted equity securities, at cost
63,737,127
-
-
1,312,938
63,737,127
1,312,938
63,737,127 1,312,938 65,050,065
Securities at fair value:
- quoted debt securities
- quoted equity securities
- other securities
-
-
-
37,248,234
62,506,079
12,635,449
37,248,234
62,506,079
12,635,449
Interest receivable
-
1,202,015
112,389,762
394,010
112,389,762
1,596,025
Total Investment securities 64,939,142 114,096,710 179,035,852
The weighted average effective interest rate on investment securities at 30 September 2017 was 3.88% (2016 – 4.48%).
13. OTHER ASSETS AND PREPAYMENTS2017
$2016
$
Receivables from other financial institutions
Other
29,039,496
157,532
16,138,945
2,893,467
29,197,028 19,032,412
12. INVESTMENT SECURITIES...(cont’d)

68
NOTES TO THE FINANCIAL STATEMENTFOR THE YEAR ENDED SEPTEMBER 30, 2017
(...CONTINUED)
Annual Report 2017
14.
PROP
ERTY
AND
EQU
IPM
ENT
FRE
EH
OLD
LA
ND
& B
UIL
DIN
GS $
LEA
SE
HO
LDIM
PR
OV
EM
EN
TS $
FUR
NIT
UR
E &
EQ
UIP
ME
NT $
CO
MP
UT
ER
EQ
UIP
ME
NT $
MO
TOR
VE
HIC
LES $
WO
RK
IN-P
RO
GR
ESS $
TOTA
L $
Co
st o
r va
luat
ion
Bal
ance
at
Oct
ob
er 1
, 201
5
Ad
diti
on
s
Dis
po
sal
39,9
66,9
74
1,39
2,53
6 -
1,91
0,14
5 - -
7,66
2,81
0
475,
156 -
9,82
6,35
4
484,
319 -
419,
511
278,
657
(150
,600
)
-
158,
888 -
59,7
85,7
94
2,78
9,55
6
(150
,600
)
Bal
ance
at
Sep
tem
ber
30,
201
641
,359
,510
1,
910,
145
8,13
7,96
6 10
,310
,673
54
7,56
8 15
8,88
8 62
,424
,750
Bal
ance
at
Oct
ob
er 1
, 201
6
Ad
diti
on
s
Rev
alu
atio
n
41,3
59,5
10
-
2,81
8,77
4
1,91
0,14
5 - -
8,13
7,96
6
674,
441 -
10,3
10,6
73
759,
404 -
547,
568
139,
595 -
158,
888
1,76
7,14
4 -
62,4
24,7
50
3,34
0,58
4
2,81
8,77
4
Bal
ance
at
Sep
tem
ber
30,
201
744
,178
,284
1,
910,
145
8,81
2,40
7 11
,070
,077
68
7,16
3 1,
926,
032
68,5
84,1
08
Acc
um
ula
ted
dep
reci
atio
n
Bal
ance
at O
cto
ber
1, 2
015
Ch
arg
e fo
r th
e ye
ar
Dis
po
sal
5,83
1,21
8
926,
838 -
963,
677
95,5
07 -
4,26
9,29
0
657,
813 -
7,63
1,86
7
748,
744 -
338,
326
80,3
31
(150
,599
)
- - -
19,0
34,3
78
2,50
9,23
3
(150
,599
)
Bal
ance
at
Sep
tem
ber
30,
201
66,
758,
056
1,05
9,18
4 4,
927,
103
8,38
0,61
1 26
8,05
8 -
21,3
93,0
12
Bal
ance
at
Oct
ob
er 1
, 201
6
Wri
te b
ack
on
rev
alu
atio
n
Ch
arg
e fo
r th
e ye
ar
6,75
8,05
6
(7,4
53,1
85)
943,
135
1,05
9,18
4 -
95,5
07
4,92
7,10
3 -
689,
864
8,38
0,61
1 -
758,
942
268,
058 -
81,2
62
- - -
21,3
93,0
12
(7,4
53,1
85)
2,56
8,71
0
Bal
ance
at
Sep
tem
ber
30,
201
724
8,00
6 1,
154,
691
5,61
6,96
7 9,
139,
553
349,
320
-16
,508
,537
Car
ryin
g a
mo
un
ts
Bal
ance
at S
epte
mb
er 3
0, 2
015
34,1
35,7
56
946,
468
3,39
3,52
0 2,
194,
487
81,1
85
-40
,751
,416
Bal
ance
at S
epte
mb
er 3
0, 2
016
34,6
01,4
5485
0,96
13,
210,
863
1,93
0,06
227
9,51
015
8,88
841
,031
,738
Bal
ance
at
Sep
tem
ber
30,
201
743
,930
,278
755,
454
3,19
5,44
01,
930,
524
337,
843
1,92
6,03
252
,075
,571
The
Ban
k’s
prop
ertie
s w
ere
reva
lued
on
an o
pen
mar
ket b
asis
on
May
4, 2
017
by B
arry
’s E
ngin
eeri
ng C
ompa
ny L
imite
d, a
n in
depe
nden
t val
uato
r.

Annual Report 2017 69
NOTES TO THE FINANCIAL STATEMENTFOR THE YEAR ENDED SEPTEMBER 30, 2017
(...CONTINUED)
GE
NE
RA
L IN
FOR
MA
TIO
NB
US
INE
SS
RE
VIE
W &
AN
ALY
SIS
CO
RP
OR
AT
E G
OV
ER
NA
NC
EFI
NA
NC
IAL
STA
TE
ME
NT
S
15. DEFERRED TAX ASSETDeferred income taxes are calculated in full on temporary differences, under the liability method using the statutory tax rate of 30% (2016: 30%), which is expected to be in force in the upcoming financial year.
As of reporting date, deferred tax asset comprises of temporary differences attributable to:
2017$
2016$
Unutilised tax losses
Taxed provisions
Temporary differences on capital assets
-
646,262
(513,944)
143,986
568,918
(377,402)
132,318 335,502
This balance includes the following:
Deferred tax asset to be recovered after more than 12 months 132,318 335,502
The gross movement on the deferred income tax asset is as follows:
Balance at beginning of year
Income statement release (Note 26)
335,502
(203,184)
668,119
(332,617)
Balance at end of year 132,318 335,502
16. DEPOSITS TO CUSTOMERS Savings
Fixed deposit
Treasure chest
Chequing accounts
Current accounts
343,933,549
192,362,711
33,984,495
44,830,277
272,795,617
307,324,630
204,174,871
34,507,753
40,080,059
180,590,158
Interest payable
887,906,649
997,804
766,677,471
1,921,203
888,904,453 768,598,674
The weighted average effective interest rate of deposits from customers at September 30, 2017 was 1.07% (2016: 1.30%).
17. TRADE AND OTHER PAYABLESCaribbean Financial Services Corporation payable
Outstanding funds transferred
Other
1,017,451
7,130,563
1,935,607
-
5,958,911
1,604,645
10,083,621 7,563,556
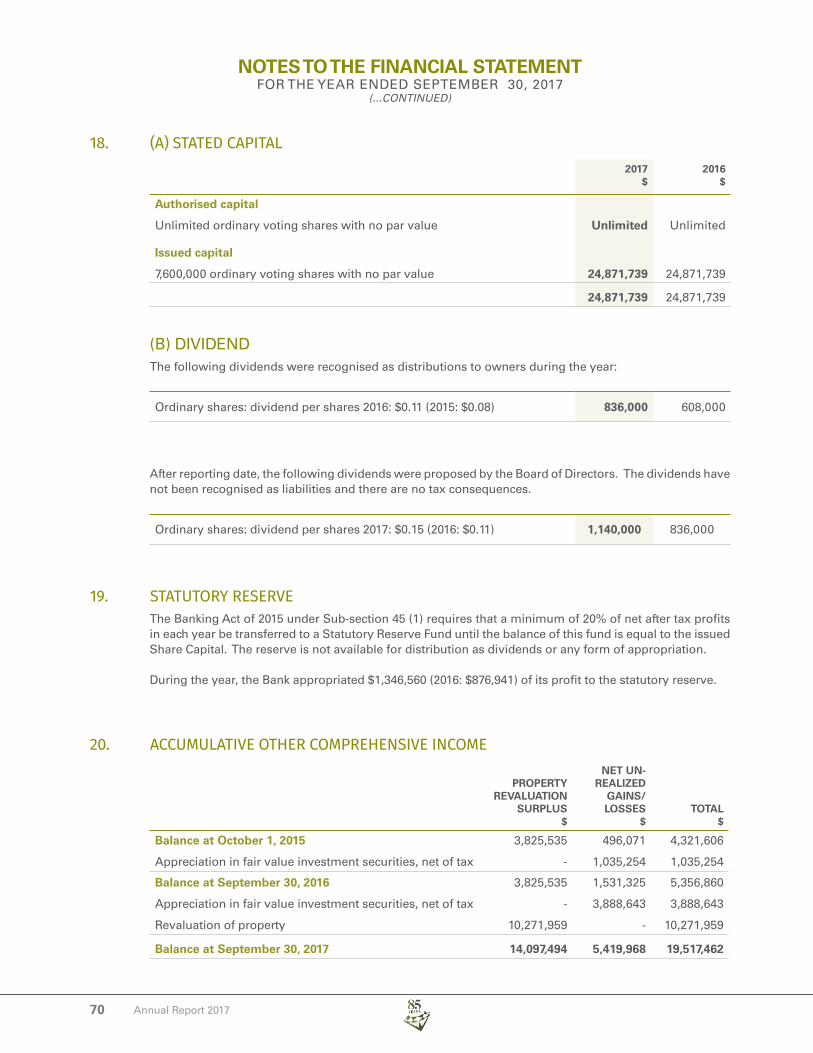
70
NOTES TO THE FINANCIAL STATEMENTFOR THE YEAR ENDED SEPTEMBER 30, 2017
(...CONTINUED)
Annual Report 2017
18. (A) STATED CAPITAL2017
$2016
$
Authorised capital
Unlimited ordinary voting shares with no par value
Issued capital
7,600,000 ordinary voting shares with no par value
Unlimited
24,871,739
Unlimited
24,871,739
24,871,739 24,871,739
(B) DIVIDENDThe following dividends were recognised as distributions to owners during the year:
Ordinary shares: dividend per shares 2016: $0.11 (2015: $0.08) 836,000 608,000
After reporting date, the following dividends were proposed by the Board of Directors. The dividends have not been recognised as liabilities and there are no tax consequences.
Ordinary shares: dividend per shares 2017: $0.15 (2016: $0.11) 1,140,000 836,000
19. STATUTORY RESERVEThe Banking Act of 2015 under Sub-section 45 (1) requires that a minimum of 20% of net after tax profits in each year be transferred to a Statutory Reserve Fund until the balance of this fund is equal to the issued Share Capital. The reserve is not available for distribution as dividends or any form of appropriation.
During the year, the Bank appropriated $1,346,560 (2016: $876,941) of its profit to the statutory reserve.
20. ACCUMULATIVE OTHER COMPREHENSIVE INCOME
PROPERTYREVALUATION
SURPLUS$
NET UN-REALIZED
GAINS/LOSSES
$TOTAL
$
Balance at October 1, 2015
Appreciation in fair value investment securities, net of tax
3,825,535
-
496,071
1,035,254
4,321,606
1,035,254
Balance at September 30, 2016
Appreciation in fair value investment securities, net of tax
Revaluation of property
3,825,535
-
10,271,959
1,531,325
3,888,643
-
5,356,860
3,888,643
10,271,959
Balance at September 30, 2017 14,097,494 5,419,968 19,517,462
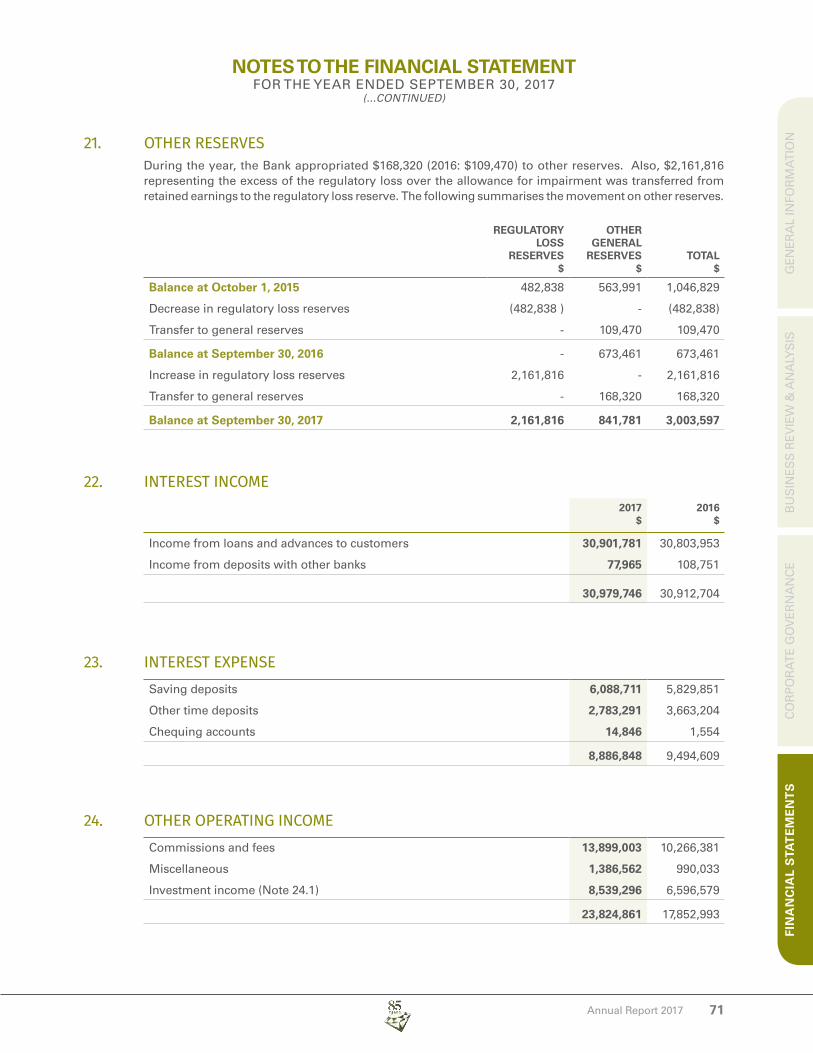
Annual Report 2017 71
NOTES TO THE FINANCIAL STATEMENTFOR THE YEAR ENDED SEPTEMBER 30, 2017
(...CONTINUED)
GE
NE
RA
L IN
FOR
MA
TIO
NB
US
INE
SS
RE
VIE
W &
AN
ALY
SIS
CO
RP
OR
AT
E G
OV
ER
NA
NC
EFI
NA
NC
IAL
STA
TE
ME
NT
S
21. OTHER RESERVESDuring the year, the Bank appropriated $168,320 (2016: $109,470) to other reserves. Also, $2,161,816 representing the excess of the regulatory loss over the allowance for impairment was transferred from retained earnings to the regulatory loss reserve. The following summarises the movement on other reserves.
REGULATORYLOSS
RESERVES$
OTHERGENERAL
RESERVES$
TOTAL$
Balance at October 1, 2015
Decrease in regulatory loss reserves
Transfer to general reserves
482,838
(482,838 )
-
563,991
-
109,470
1,046,829
(482,838)
109,470
Balance at September 30, 2016
Increase in regulatory loss reserves
Transfer to general reserves
-
2,161,816
-
673,461
-
168,320
673,461
2,161,816
168,320
Balance at September 30, 2017 2,161,816 841,781 3,003,597
22. INTEREST INCOME2017
$2016
$
Income from loans and advances to customers
Income from deposits with other banks
30,901,781
77,965
30,803,953
108,751
30,979,746 30,912,704
23. INTEREST EXPENSESaving deposits
Other time deposits
Chequing accounts
6,088,711
2,783,291
14,846
5,829,851
3,663,204
1,554
8,886,848 9,494,609
24. OTHER OPERATING INCOMECommissions and fees
Miscellaneous
Investment income (Note 24.1)
13,899,003
1,386,562
8,539,296
10,266,381
990,033
6,596,579
23,824,861 17,852,993

72
NOTES TO THE FINANCIAL STATEMENTFOR THE YEAR ENDED SEPTEMBER 30, 2017
(...CONTINUED)
Annual Report 2017
24.1 INVESTMENT INCOME
2017$
2016$
Interest income
Dividend income
Gains realised on sale of securities
Other
4,755,287
915,543
2,773,408
95,058
4,971,264
1,117,442
507,873
-
8,539,296 6,596,579
25. OPERATING EXPENSESThe following summarises operating expenses by nature:
Staff Costs
Wages, salaries and NIS
Other staff costs
12,306,699
1,329,504
11,772,795
959,775
Other operating expenses
Depreciation
Operating lease rentals
Advertising and promotion
Directors’ fee
Professional fees
Utilities
Repair and maintenance
13,636,203
8,541,416
2,568,710
551,736
1,627,953
232,823
1,186,487
1,300,461
1,477,303
12,732,570
6,614,977
2,509,233
481,818
1,874,681
124,886
374,210
1,289,123
1,600,533
31,123,092 27,602,031
As of reporting date, the Bank’s staff complement included 162 (2016: 160) full time employees.
26. INCOME TAX EXPENSECurrent tax
Deferred tax (Note 14)
2,723,417
203,184
634,741
332,617
2,926,601 967,358
24. OTHER OPERATING INCOME...(cont’d)

Annual Report 2017 73
NOTES TO THE FINANCIAL STATEMENTFOR THE YEAR ENDED SEPTEMBER 30, 2017
(...CONTINUED)
GE
NE
RA
L IN
FOR
MA
TIO
NB
US
INE
SS
RE
VIE
W &
AN
ALY
SIS
CO
RP
OR
AT
E G
OV
ER
NA
NC
EFI
NA
NC
IAL
STA
TE
ME
NT
S
Deferred tax release for the year comprises: -
2017$
2016$
Temporary differences on capital assets
Taxed provisions
Tax losses utilised
136,542
66,642
-
185,404
(487,528)
634,742
203,184 332,617
The income tax charge differs from the amount computed by applying the tax statutes income tax rate, 30% (2016: 30%), to earnings before tax. The differences in the effective rate of tax are accounted as follows: -
2017$
2017%
2016$
2016%
Profit before tax 9,659,402 100.00 5,352,063 100.00
Tax calculated at the statutory rate
Income not subject to taxation
Expenses not deductible for tax purposes
Depreciation on items not eligible for capital allowances
Understatement in prior year’s deferred tax
Tax losses expired in current year
2,897,821
(626,520)
199,721
311,593
-
143,986
30.00
(6.49)
2.07
3.23
-
1.49
1,605,619
(946,307)
290,941
306,703
(289,598)
-
30.00
(17.68)
5.44
5.73
(5.42)
-
Tax charge 2,926,601 30.30 967,358 18.07
Tax lossesTax losses which are available for off-set against future taxable income for income tax purposes are as follows:
INCOME YEAR
BROUGHT FORWARD
$EXPIRED
$
CARRIED FORWARD
$ EXPIRY YEAR
2013 479,953 (479,953) - 2016
27. EARNINGS PER SHAREBasic earnings per share are calculated by dividing the profit attributable to equity shareholders of the Bank by the weighted average number of ordinary shares in issue during the year.
2017$
2016$
Profit attributable to ordinary shareholders
Weighted average number of ordinary shares in issue
6,732,801
7,600,000
4,384,705
7,600,000
0.89 0.58
26. INCOME TAX EXPENSE...(cont’d)
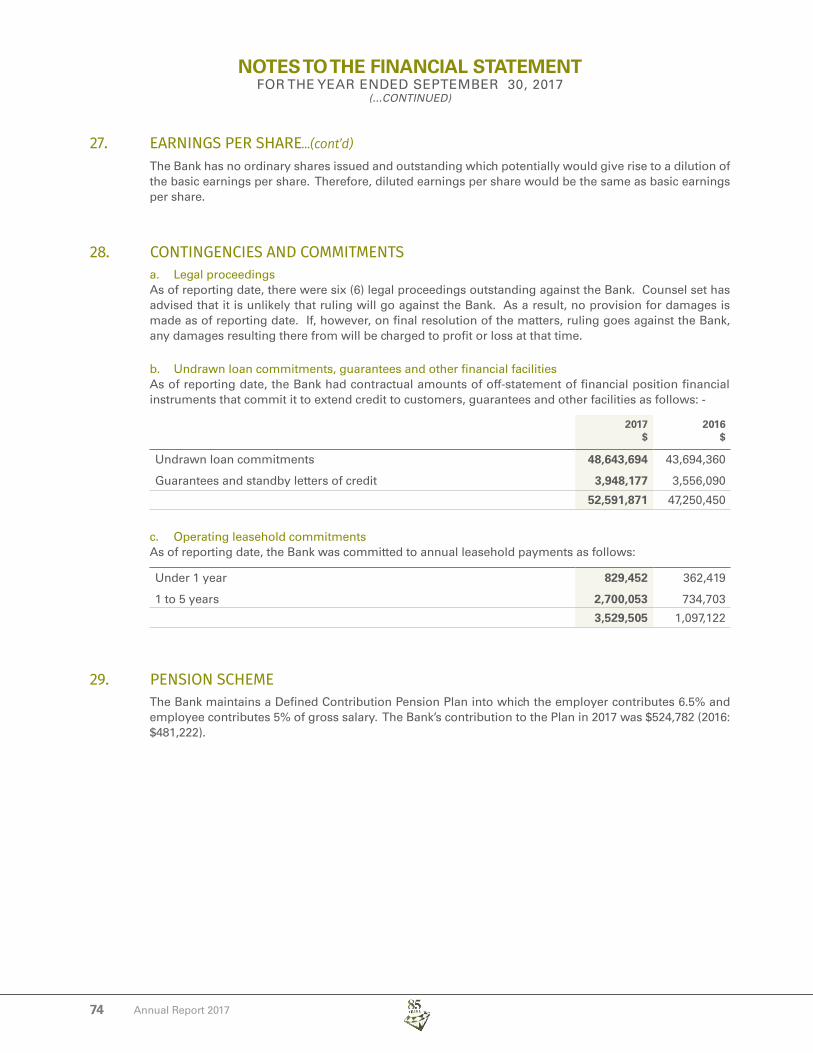
74
NOTES TO THE FINANCIAL STATEMENTFOR THE YEAR ENDED SEPTEMBER 30, 2017
(...CONTINUED)
Annual Report 2017
The Bank has no ordinary shares issued and outstanding which potentially would give rise to a dilution of the basic earnings per share. Therefore, diluted earnings per share would be the same as basic earnings per share.
28. CONTINGENCIES AND COMMITMENTSa. Legal proceedingsAs of reporting date, there were six (6) legal proceedings outstanding against the Bank. Counsel set has advised that it is unlikely that ruling will go against the Bank. As a result, no provision for damages is made as of reporting date. If, however, on final resolution of the matters, ruling goes against the Bank, any damages resulting there from will be charged to profit or loss at that time.
b. Undrawn loan commitments, guarantees and other financial facilitiesAs of reporting date, the Bank had contractual amounts of off-statement of financial position financial instruments that commit it to extend credit to customers, guarantees and other facilities as follows: -
2017$
2016$
Undrawn loan commitments
Guarantees and standby letters of credit
48,643,694
3,948,177
43,694,360
3,556,090
52,591,871 47,250,450
c. Operating leasehold commitmentsAs of reporting date, the Bank was committed to annual leasehold payments as follows:
Under 1 year
1 to 5 years
829,452
2,700,053
362,419
734,703
3,529,505 1,097,122
29. PENSION SCHEMEThe Bank maintains a Defined Contribution Pension Plan into which the employer contributes 6.5% and employee contributes 5% of gross salary. The Bank’s contribution to the Plan in 2017 was $524,782 (2016: $481,222).
27. EARNINGS PER SHARE...(cont’d)

Annual Report 2017 75
NOTES TO THE FINANCIAL STATEMENTFOR THE YEAR ENDED SEPTEMBER 30, 2017
(...CONTINUED)
GE
NE
RA
L IN
FOR
MA
TIO
NB
US
INE
SS
RE
VIE
W &
AN
ALY
SIS
CO
RP
OR
AT
E G
OV
ER
NA
NC
EFI
NA
NC
IAL
STA
TE
ME
NT
S
30. RELATED PARTY TRANSACTIONSA number of banking transactions are entered into with related parties in the normal course of business. These include loans and deposits. These transactions were carried out on commercial terms and at market rates.
The following summarises transactions, in the ordinary course of business, with related parties:
2017$
2016$
Loans and advances
Directors and key management personnel (and their families) 6,160,650 6,616,804
Deposits and other liabilities
Directors and key management personnel (and their families) 8,618,762 7,727,773
Interest income
Directors and key management personnel (and their families) 243,295 240,438
Interest expenses
Directors and key management personnel (and their families) 140,325 318,313
No provisions have been recognised in respect to loans given to related parties.
Key management compensation
Salaries and other short-term employee benefits
Directors’ fees and expenses
2,182,544
232,823
1,996,183
124,886
31. SUBSEQUENT EVENTOn November 23, 2017, the Board proposed a dividend of $0.15 per share to shareholders of record as of September 30, 2017.
32. COMPARATIVE FIGURESCertain of the comparative amounts have been reclassified in the statement of cash flow to conform with the current year’s presentation

76 Annual Report 2017
GRENADA CO-OPERATIVE BANK LIMITEDOFFICES
HEAD OFFICE:No. 8 Church StreetSt. George’sP.O. Box 135Tel: (473) 440-2111/3549Fax: (473) [email protected]
Managing Director
Chief Operating Officer
Executive Manager, Finance (On Rotation)
Chief Audit Executive
Executive Manager, Operations & Administration
Executive Manager, Retail Banking
Executive Manager, Corporate & Commercial Banking
Executive Manager, Risk (Ag.)
Executive Manager, Operations & Administration (Ag.)
Executive Manager, Finance (Ag.)
Executive Manager, Human Resources
Senior Programme & Research Officer
Manager, Recoveries & Collections
Human Resource Officer
Officer On Rotation
Senior IT Officer
Senior Manager, Credit Risk (Ag.)
Marketing Officer (Ag.)
R.W. DUNCAN, B.Sc., MA., FCGA, AICB
D. MOSES, B.Sc, MSc
A. LOGIE, FCCA, MBA
J.G. LAWRENCE, B.S., MBA-IBF
F. DOWDEN, AICB, AML-CA, MBA-IB
W. GRAINGER, CRU, Dip. MA.
N. SANDY, B.Sc, MBA, PhD
J. ROBERTSON, AICB, Dip. CIRM, CRU, PgCert.
R. MEDFORD, B.Sc
A. JOSEPH, B.Sc, CGA, CPA, AICB, AML/CA
N. PHILIP-WALCOTT, B.Sc., CCP, MBA
P. ANTOINE, B.Sc, AICB
S. REDHEAD, AB
K. ST.LOUIS-TELESFORD, BAS, M.Sc
G. SAYERS, BBA, MBA
G. BAPTISTE, B.Sc
K. GREENIDGE, B.Sc., M.Sc
S. ROBERTS, B.Sc
SPICELAND MALL:Morne RougeSt. George’sTel: (473) 439-0778Fax: (473) 439-0776
Manager, Sales & Services M. MC SWEEN
ST. GEORGE’S:No. 8 Church StreetSt. George’sTel: (473) 440-2111Fax: (473) 435-9621
Manager, Sales & Services R. D. DUNCAN, FICB
GRENVILLE:Victoria StreetGrenville, St. Andrew’sTel: (473) 442-7748/7708 Fax: (473) 442-8400
Manager, Sales & Services S. REGIS, AICB, B.Sc.
SAUTEURS:Main StreetSauteurs, St. Patrick’sTel: (473) 442-9247/9248Fax: (473) 442-9888
Manager, Sales & Services R. FLETCHER, AICB, MBA
CARRIACOU:Main StreetHillsboroughTel: (473) 443-8424
Manager, Sales & Services R. BETHEL

Annual Report 2017 77
FORM OF PROXY
The Company SecretaryGrenada Co-operative Bank Ltd.No. 8 Church StreetSt. George’sGrenada
I/We ________________________________________________ the undersigned, being a shareholder of Grenada
Co-operative Bank Ltd., hereby appoint the Chairman, Ambrose Phillip of St. George, Grenada, or failing him,
___________________________________________________ of ___________________________________________
as my/our proxy to attend and act for me/us and on my/our behalf at the Annual Meeting of the shareholders
of the said company to be held on the 11th day of January, 2018 at 4:45pm at the National Stadium’s South
Conference Room, Queens Park, River Road, St. George’s; and at any adjournment or adjournments thereof in
the same manner, to the same extent and with the same powers as if the undersigned were present at the said
meeting or such adjournment or adjournments thereof.
Dated this ________________________ day of _______________________ 20______
Signature(s) of Shareholder(s) _____________________________________
Signature(s) of Shareholder(s) ______________________________________
Name(s) in Block Letters ______________________________________
NOTES:
1. Votes at meetings of shareholders may be given either personally or by proxy, or in case of a shareholder who is a body corporate or association, by an individual authorized by a resolution of the directors or governing body of that body corporate or association to represent it at meetings of shareholders of the company.
2. A person appointed by proxy need not be a shareholder.
3. To be valid, a proxy form duly completed must be deposited with the Company Secretary at the Registered Office of the Company, No. 8 Church Street, St. George’s, at least 48 hours before the time appointed for the meeting or adjourned meeting.

78 Annual Report 2017
NOTES

Annual Report 2017 79
NOTES

80 Annual Report 2017
NOTES


#8 Church Street, P.O. Box 135, St. George’s, Grenada, W.I.Tel: (473) 440-2111/3549 . Fax: (473) 440-6600
Email: [email protected]: www.grenadaco-opbank.com
Grenada Co-operative Bank Limited