Greenspan Financial Crisis Paper
63
The Crisis Alan Greenspan President Greenspan Associates LLC April 15, 2010 I wish to express my gratitude to David Romer, Justin Wolfers, Greg Mankiw, Jeremy Stein, and Bill Brainard for their most constructive comments and suggestions. The conclusions of this paper, of course, are my own.
-
Upload
richardck61 -
Category
Documents
-
view
232 -
download
0
Transcript of Greenspan Financial Crisis Paper

8/6/2019 Greenspan Financial Crisis Paper
http://slidepdf.com/reader/full/greenspan-financial-crisis-paper 1/63
8/6/2019 Greenspan Financial Crisis Paper
http://slidepdf.com/reader/full/greenspan-financial-crisis-paper 2/63
Table of Contents Page
I. Preamble 3
II. Causes of the Crisis
1. The Arbitraged Global Bond Market and the Housing Crisis 3
2. Securitization of Subprimes: the Crisis Story Unfolds 6
3. A Classic Euphoric Bubble Takes Hold 7
4. Why Did the Boom Reach Such Heights? 10
III. Financial Intermediation
1. The Purpose of Finance 13
2. Risky Financial Intermediation 15
3. The Hundred Year Flood 16
IV. Regulatory Reform
1. Principles of Reform 19
2. Upward Revisions of Economic Capital 23
3. What Regulation Can Do 27
4. Regulatory Capital History 28
5. Limits to Regulatory Capital Requirements 29
6. Too Big to Fail 31
7. Regulations Embodying a Forecast Fail with Regularity 35
V. Role of Monetary Policy
1. Monetary Policy and House Price Bubbles 38
2. Could the Breakdown Have Been Prevented? 44

8/6/2019 Greenspan Financial Crisis Paper
http://slidepdf.com/reader/full/greenspan-financial-crisis-paper 3/63
I. Preamble
The bankruptcy of Lehman Brothers in September 2008 precipitated what, in
retrospect, is likely to be judged the most virulent global financial crisis ever. To be sure,
the contraction in economic activity that followed in its wake has fallen far short of the
depression of the 1930s. But the virtual withdrawal, on so global a scale, of private short
term credit, the leading edge of financial crisis, is not readily evident in our financial
history. The collapse of private counterparty credit surveillance, fine tuned over so many
decades, along with the failure of the global regulatory system, calls for the thorough
review by governments now under way.
The central theme of this paper is that in the years leading up to the current crisis,
financial intermediation tried to function on too thin a layer of capital, owing to a
misreading of the degree of risk embedded in ever-more complex financial products and
markets.
In section II, this paper reviews the causes of the crisis. In section III, the nature
of financial intermediation is probed; in section IV, a set of reforms that I trust address
the shortcomings of the existing regulatory structure; in section V, the role of monetary
policy in the current crisis is examined; and section VI, I offer conclusions.
II. 1. The Arbitraged Global Bond Market and the Housing Crisis
It was the global proliferation of securitized, toxic U.S. subprime mortgages that

8/6/2019 Greenspan Financial Crisis Paper
http://slidepdf.com/reader/full/greenspan-financial-crisis-paper 4/63
The fall of the Berlin Wall1 exposed the economic ruin produced by the Soviet
bloc’s economic system. In response, competitive markets quietly, but rapidly, displaced
much of the discredited central planning that was so prevalent in the Soviet bloc and the
then Third World.
A large segment of the erstwhile Third World nations, especially China,
replicated the successful economic export-oriented model of the so-called Asian Tigers:
fairly well educated low-cost workforces joined with developed-world technology,
protected by an increasing rule of law, unleashed explosive economic growth.2
The IMF
estimated that in 2005 more than 800 million members of the world’s labor force were
engaged in export-oriented and therefore competitive markets, an increase of 500 million
since the fall of the Berlin Wall.3
Additional hundreds of millions of workers became
subject to domestic competitive forces, especially in the former Soviet Union. As a
consequence, between 2000 and 2007, the real GDP growth rate of the developing world
was more than double that of the developed world.
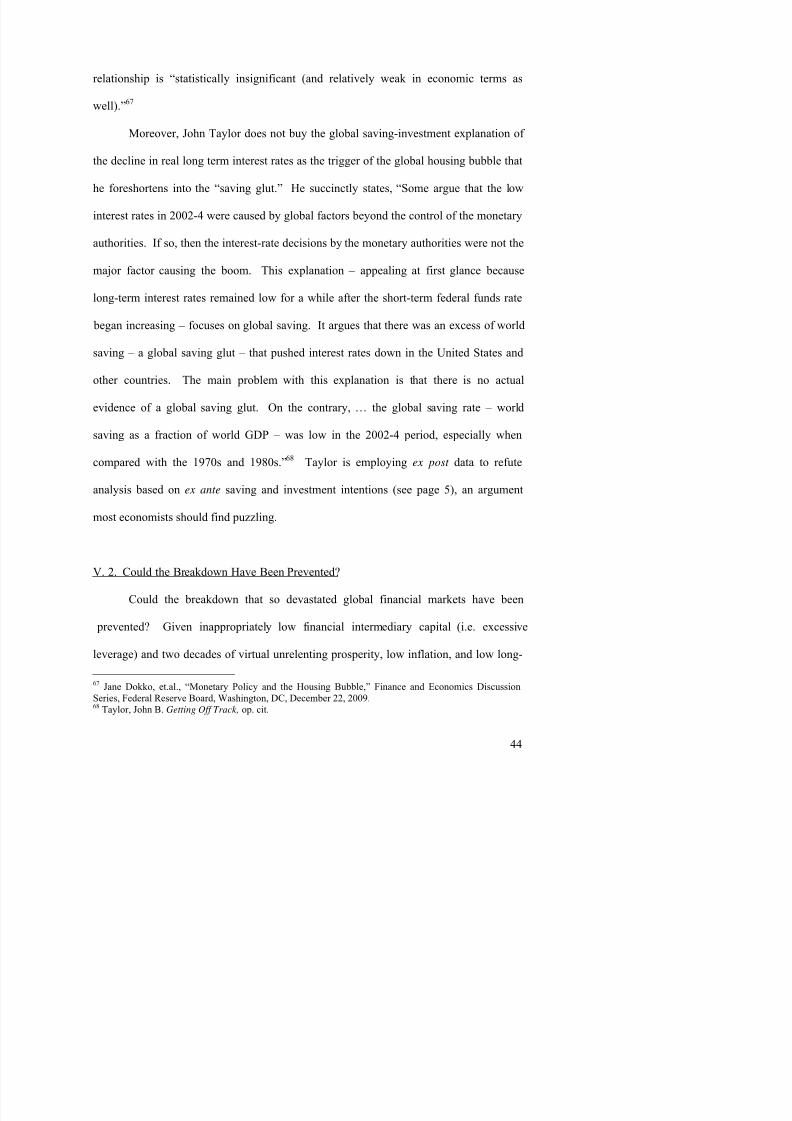
The consequence was a pronounced fall from 2000 to 2005 in both global real
long-term interest rates4 and nominal long-term rates (exhibit 1) which indicated that
global saving intentions, of necessity, had chronically exceeded global intentions to
invest. In the developing world, consumption restrained by culture and inadequate
consumer finance could not keep up with the surge of income and, as a consequence, the
8/6/2019 Greenspan Financial Crisis Paper
http://slidepdf.com/reader/full/greenspan-financial-crisis-paper 5/63
savings rate of the developing world soared from 24% of nominal GDP in 1999 to 34%
by 2007, far outstripping its investment rate.
Yet the ex post global saving – investment rate in 2007, overall, was only
modestly higher than in 1999, suggesting that the uptrend in the saving intentions of
developing economies tempered declining investment intentions in the developed world.
That weakened global investment was the major determinant in the decline of global real
long-term interest rates was also the conclusion of the March 2007 Bank of Canada
study.5
Of course, whether it was a glut of excess intended saving or a shortfall of
investment intentions, the conclusion is the same: lower real long-term interest rates.
Inflation and long-term rates in all developed economies and major developing
economies by 2006 had converged to single digits, I believe for the first time ever. The
path of the convergence is evident in the unweighted variance of interest rates on ten-year
sovereign debt of 15 countries that declined markedly from 2000 to 2005 (exhibit 2).6
Equity and real-estate capitalization rates were inevitably arbitraged lower by the fall in
global long-term real interest rates. Asset prices, particularly house prices, accordingly
moved dramatically higher.
The Economist's surveys document the remarkable convergence of nearly 20
individual nations' house price rises during the past decade.7 Japan, Germany, and
Switzerland (for differing reasons) were the only important exceptions. U.S. price gains,
at their peak, were no more than the global peak average.8 In short, geo-political events
8/6/2019 Greenspan Financial Crisis Paper
http://slidepdf.com/reader/full/greenspan-financial-crisis-paper 6/63
ultimately led to a fall in long-term mortgage interest rates that in turn led, with a lag, to
the boom in house prices globally.
II. 2 Securitization of Subprimes: the Crisis Story Unfolds
Subprime mortgages in the United States for years had been a small appendage to
the broader U.S. home mortgage market, comprising only 7% of total originations as
recently as 2002. Most such loans were fixed-rate mortgages, and only a modest amount
had been securitized. With the price of homes having risen at a quickening pace since
1997 (exhibit 3), such subprime lending was seen as increasingly profitable to investors.
Belatedly drawn to this market, financial firms, starting in late 2003, began to
accelerate the pooling and packaging of subprime home mortgages into securities (exhibit
4). The firms clearly had found receptive buyers. Both domestic and foreign investors,
largely European,9
were drawn to the above average yield on these securities and a
foreclosure rate on the underlying mortgages that had been in decline for two years.
Another factor contributing to the surge in demand was the heavy purchases of
subprime securities by Fannie Mae and Freddie Mac, the major U.S. Government
Sponsored Enterprises (GSE). Pressed by the Department of Housing and Urban
Development10 and the Congress to expand “affordable housing commitments,” they
chose to meet them by investing heavily in subprime securities. The firms accounted for
an estimated 45% of all subprime mortgage securities (almost all adjustable rate), newly
8/6/2019 Greenspan Financial Crisis Paper
http://slidepdf.com/reader/full/greenspan-financial-crisis-paper 7/63
purchased, and retained on investors’ balance sheets during 2003 and 2004 (exhibit 5).11
That was an estimated five times their share of newly purchased and retained in 2002,
implying that a significant proportion of the increased demand for subprime mortgage
backed securities during the years 2003-2004 was effectively politically mandated, and
hence driven by highly inelastic demand.
By the first quarter of 2007, virtually all subprime originations were being
securitized, (compared with only half in 2000,)12 and subprime mortgage securities
outstanding totaled more than $800 billion, seven times the level at the end of 2001.
The securitizers, profitably packaging this new source of paper into mortgage
pools and armed with what turned out, in retrospect, to be grossly inflated credit ratings,
were able to sell seemingly unlimited amounts of subprime mortgage securities into what
appeared to be a vast and receptive global market. As loan underwriting standards
rapidly deteriorated,13
subprime mortgage originations swelled by 2005 and 2006 to a
bubbly 20% of all U.S. home mortgage originations, almost triple their share in 2002.
II. 3. A Classic Euphoric Bubble Takes Hold
As a measure of how far the appetite for risk-taking beyond the securitized
mortgage market had gone, long sacrosanct debt covenants14 were eased as a classic
11 FHFA Annual Report to Congress 2008, (Revised) Historical Data Tables 5b Part 2 and 14b Part 2.(Originally published May 18 2009 updated to include a significant reclassification effective September 3

8/6/2019 Greenspan Financial Crisis Paper
http://slidepdf.com/reader/full/greenspan-financial-crisis-paper 8/63
euphoric global bubble took hold. By 2007, yield spreads in the overall debt markets had
narrowed to a point where there was little room for further underpricing of risk. Our
broadest measure of credit risk, the spread of yields on CCC, or lower, bonds (against 10-
year U.S. Treasury bonds) fell to a probable record low in the spring of 2007, though
only marginally so (exhibit 6). Almost all market participants of my acquaintance were
aware of the growing risks, but also cognizant that risk had often remained underpriced
for years. I raised the spectre of “irrational exuberance” in 199615 only to watch the dot-
com boom, after a one-day stumble, continue to inflate for four more years, unrestrained
by a cumulative increase of 350 basis points in the federal funds rate from 1994 to 2000.
Similarly in 2002, I expressed my concerns before the Federal Open Market Committee
that “. . . our extraordinary housing boom . . . financed by very large increases in
mortgage debt – cannot continue indefinitely.” It lasted until 2006.16
Clearly with such experiences in mind, financial firms were fearful that should
they retrench too soon, they would almost surely lose market share, perhaps irretrievably.
Their fears were formalized by Citigroup’s Charles Prince’s now famous remark in 2007,
just prior to the onset of the crisis, that “When the music stops, in terms of liquidity,
things will be complicated. But as long as the music is playing, you’ve got to get up and
dance. We’re still dancing.”17
The financial firms risked being able to anticipate the onset of crisis in time to
retrench. They were mistaken. They believed the then seemingly insatiable demand for

8/6/2019 Greenspan Financial Crisis Paper
http://slidepdf.com/reader/full/greenspan-financial-crisis-paper 9/63
their array of exotic financial products would enable them to sell large parts of their
portfolios without loss. They failed to recognize that the conversion of balance sheet
liquidity to effective demand is largely a function of the degree of risk aversion.18
That
process manifests itself in periods of euphoria (risk aversion falling below its long term,
trendless, average) and fear (risk aversion rising above its average). A lessening in the
intensity of risk aversion creates increasingly narrow bid-asked spreads, in volume, the
conventional definition of market, as distinct from balance sheet, liquidity.
In this context I define a bubble as a protracted period of falling risk aversion that
translates into falling capitalization rates that decline measurably below their long term
trendless averages.19 Falling capitalization rates propel one or more asset prices to
unsustainable levels. All bubbles burst when risk aversion reaches its irreducible
minimum, i.e. credit spreads approaching zero, though analysts’ ability to time the onset
of deflation has proved illusive.
18 Note that I am defining risk aversion more broadly than the narrow economic definition in terms of utility over different outcomes. Risk aversion, as I use the term, encompasses all factors that governindividuals’ willingness to engage in risky actions. Most notably, it encompasses not only their preferencestoward risk, but their perceptions of risk.
Risk aversion is the primary human trait that governs the pricing of income earning assets. When people become uncertain or fearful, they disengage from perceived risk. When their uncertainty declines,they take on new commitments. Risk aversion can thus range from zero to full.
The extremes of zero and full risk aversion, of course, are outside all human experience. Zero risk aversion – that is, no aversion at all to engaging in risky actions – implies an individual not caring about – or not being able to discriminate among – objective states of risk to life and limb. Such individuals cannot(or do not choose to) recognize life-threatening events.
To achieve the food, shelter, and the other necessary contributors to living requires action, that is,the taking of risks, by either an individual or by others on the individual’s behalf. Eschewing all objectiverisk is not consistent with life Thus full risk aversion like zero risk aversion is a hypothetical state that
8/6/2019 Greenspan Financial Crisis Paper
http://slidepdf.com/reader/full/greenspan-financial-crisis-paper 10/63
Some bubbles burst without severe economic consequences, the dotcom boom
and the rapid run-up of stock prices in the spring of 1987, for example. Others burst with
severe deflationary consequences. That class of bubbles, as Reinhart and Rogoff data
demonstrate,20 appears to be a function of the degree of debt leverage in the financial
sector, particularly when the maturity of debt is less than the maturity of the assets it
funds.
Had the share of financial assets funded by equity been significantly higher in
September 2008, it seems unlikely that the deflation of asset prices would have fostered a
default contagion much, if any, beyond that of the dotcom boom. It is instructive in this
regard that no (well capitalized) hedge fund has defaulted on debt throughout the current
crisis, despite very large losses that often forced fund liquidation.
II. 4. Why Did the Boom Reach Such Heights?
Why did the 2007 bubble reach century-rare euphoria? The answer, I believe, lies
with the dot-com bubble that burst with very little footprint on global GDP, and in the
U.S., the mildest recession in the post-World War II period. And indeed the previous
U.S. recession (1990-1991) was the second most shallow. Coupled with the fact that the
1987 stock market crash left no visible impact on GDP, it led the Federal Reserve and
many a sophisticated investor to believe that future contractions would also prove no
worse than a typical post-war recession.

8/6/2019 Greenspan Financial Crisis Paper
http://slidepdf.com/reader/full/greenspan-financial-crisis-paper 11/63
have declined since . . . September 2006.. . . [T]he overall U.S. economy is holding up
well . . . [and] the signs elsewhere are very encouraging.”21
Basel regulations did induce
a modest increase in capital requirements leading up to the crisis. But the debates in
Basel over the pending global capital accord, which emerged as Basel II, were largely
between stable bank-capital requirements and less bank capital. Leverage accordingly
ballooned.
It is in such circumstances that we depend on our highly sophisticated global
system of financial risk management to contain market breakdowns. How could it have
failed on so broad a scale? The paradigm that spawned Nobel Prize winners in
economics22 was so thoroughly embraced by academia, central banks, and regulators that
by 2006 it became the core of global regulatory standards (Basel II). Many quantitative
firms whose number crunching sought to expose profitable market trading principles
were successful so long as risk aversion moved incrementally (which it did much of the
time). But crunching data that covered only the last 2 or 3 decades prior to the current
crisis did not yield a model that could anticipate a crisis.
Mathematical models that calibrate risk, however, are surely superior guides to
risk management than the “rule of thumb” judgments of a half century ago. To this day it
is hard to find fault with the conceptual framework of our models as far as they go.
Fisher Black and Myron Scholes’ elegant option pricing proof is no less valid today than
a decade ago. The risk management paradigm nonetheless, harbored a fatal flaw.

8/6/2019 Greenspan Financial Crisis Paper
http://slidepdf.com/reader/full/greenspan-financial-crisis-paper 12/63
negative tail of the distribution of risk outcomes that was about to be revealed as the post-
Lehman crisis played out. For decades, with little, to no, data, most analysts, in my
experience, had conjectured a far more limited tail risk, arguably the major source of the
critical risk management system failures.
Only modestly less of a problem was the vast, and in some cases, the virtual
indecipherable complexity of a broad spectrum of financial products and markets that
developed with the advent of sophisticated mathematical techniques to evaluate risk.23 In
despair, an inordinately large part of investment management subcontracted to the “safe
harbor” risk designations of the credit rating agencies. No further judgment was required
of investment officers who believed they were effectively held harmless by the judgments
of government sanctioned rating organizations.
But despite their decades of experience, the analysts of the credit rating agencies
proved no more adept at anticipating the onset of crisis than the investment community at
large.
Even with the breakdown of our sophisticated risk-management models, the
financial system would have held together had the second bulwark against crisis—our
regulatory system—functioned effectively. But, under crisis pressure, it too failed.
U.S. commercial and savings banks are extensively regulated, and even though
for years our largest 10 to 15 banking institutions have had permanently assigned on-site
examiners to oversee daily operations, many of these banks still were able to take on

8/6/2019 Greenspan Financial Crisis Paper
http://slidepdf.com/reader/full/greenspan-financial-crisis-paper 13/63
Northern Rock. The venerated credit rating agencies bestowed ratings that implied Aaa
smooth-sailing for many a highly toxic derivative product. The Basel Committee on
Banking Supervision, representing regulatory authorities from the world’s major financial
systems, promulgated a set of capital rules that failed to foresee the need that arose at the
height of the crisis for much larger capital and liquidity buffers.
III. 1. The Purpose of Finance
The ultimate goal of financial structure and regulation in a market economy is to
direct a nation’s saving, plus any saving borrowed from abroad (the current account
deficit), towards investments in plant, equipment and human capital that offer the greatest
increases in a nation’s output per hour. Nonfinancial output per hour, on average, rises
when obsolescent facilities (with low output per hour) are replaced with facilities that
embody cutting-edge technologies (with high output per hour). This process improves
(average) overall standards of living for a nation as a whole. The evident success of
finance for decades prior to the onset of this crisis in directing our scarce savings into real
productive capital investments appears to explain the extent nonfinancial market
participants had been compensating producers of U.S. financial services.
The share of U.S. gross domestic income accruing to finance and insurance,
according to the Bureau of Economic Analysis, had risen fairly steadily from 2.3% in
1947 to 7.9% in 2006 (exhibit 7). Only a small part of the rise was the result of an
8/6/2019 Greenspan Financial Crisis Paper
http://slidepdf.com/reader/full/greenspan-financial-crisis-paper 14/63
the share to 7.4% in 2008 reflects write-offs of previously presumed productively
employed saving.
25
Given the historic breakdown of the last 2 years, did non-financial market
participants over the decades misread the efficiency of finance and inappropriately
compensate this small segment of our economy? The prevalence of so many financial
product failures certainly suggests so, for the decade leading up to the crisis.
Nonetheless, it is difficult to make the same judgment in the face of the fairly persistent
rise of finance’s share for the previous half century. Moreover the share of growth in
finance to the growth in nominal GDP has been largely trendless since 1990, averaging
about 10% (exhibit 7).
The proportion of nonfarm employment accounted for by finance and insurance
since 1947, has risen far less than the share of gross income originating, implying a
significant upgrading of skills and compensation attracted to finance. A recent study26
indicates a pronounced above average rise in the salaries of those employed in finance,
presumably reflecting the greater skills drawn to finance in recent years. By 2007, a
quarter of all graduates of the venerable California Institute of Technology entered
finance.27
What are we to make of this extraordinarily persistent stable uptrend? Is it wholly
accidental? (After all, there is no evidence of such a trend in the pre-war years). It is not

8/6/2019 Greenspan Financial Crisis Paper
http://slidepdf.com/reader/full/greenspan-financial-crisis-paper 15/63
that the value of assets to be managed has been persistently rising relative to GDP.28 The
answer to this question matters a great deal.
In the context of financial reform, the critical issue that must be addressed is
whether a growing share of financial services was happenstance, or evidence that a
growing share of financial services was required to intermediate an ever more complex
division of labor? Many other global financial centers exhibit similar trends29
.
I raise the issue because many recent policy recommendations would lower the
shares of financial income in GDP. Would such policies affect growth of U.S.
nonfinancial productivity and our standards of living? The more important issue given
the recent failure of risk management and regulation is whether increased financial
regulation at this time thwarts or enhances (through increased stability) economic growth.
We need a far deeper understanding of the role of financial intermediation in economic
growth to answer that question. How finance evolves in the post-crisis years should
bring clarity to many of today’s uncertainties.
III. 2. Risky Financial Intermediation
As I noted earlier, prior to the default of Lehman, the shape of the distribution of
the extreme negative tail risk was unknown. Since tail risk, in principle at least, is open-
ended,30
there will always be some risk that can not be covered by bank capital, and
hence some, even many, banks will fail. But that need not become a systemic problem,

8/6/2019 Greenspan Financial Crisis Paper
http://slidepdf.com/reader/full/greenspan-financial-crisis-paper 16/63
if, equity capital and liquidity requirements are raised substantially and a significant part
of an intermediary’s debt would be a mandated contingent capital bonds (see page 34).
Still, there will be the possibility, however remote, that the private financial intermediary
system falters, requiring sovereign credit to keep vital intermediation functioning.
Central bankers have long been aware of the potential of a breakdown in private
financial markets. Indeed in the U.S., as recently as 1991, in contemplation of the
“unthinkable,” and at the urging of the Federal Reserve Board of Governors, Section 13-3
of the Federal Reserve Act was considered, and amended, by the Congress. The section
grants virtually unlimited authority to the Board to lend in “unusual and exigent
circumstances.”
III. 3. The Hundred Year Flood
A decade ago, addressing that issue, I noted, “There is [a] . . . difficult problem of
risk management that central bankers confront every day, whether we explicitly
acknowledge it or not: How much of the underlying risk in a financial system should be
shouldered [solely] by banks and other financial institutions? “[Central banks] have
chosen implicitly, if not in a more overt fashion, to set capital and other reserve standards
for banks to guard against outcomes that exclude those once or twice in a century crises
that threaten the stability of our domestic and international financial systems.
“I do not believe any central bank explicitly makes this calculation. But we have
8/6/2019 Greenspan Financial Crisis Paper
http://slidepdf.com/reader/full/greenspan-financial-crisis-paper 17/63
their risk-management systems prove inadequate, will be handled by central banks. At the
same time, society on the whole should require that we set this bar very high. Hundred-
year floods come only once every hundred years. Financial institutions should expect to
look to the central bank only in extremely rare situations.”31
At issue is whether the current crisis is that “hundred year flood.” At best, once in
a century observations can yield results that are scarcely robust. But recent evidence
suggests that what happened in the wake of the Lehman collapse is likely the most severe
global financial crisis ever. In the Great Depression, of course, the collapse in economic
output and rise in unemployment and destitution far exceeded the current, and to most,
the prospective future state of the global economy. And of course the widespread bank
failures markedly reduced short term credit availability. But short-term financial markets
continued to function.
Financial crises are characterized by a progressive inability to float, first long
term debt and eventually short term, and overnight, debt as well. Future uncertainty and
therefore risk is always greater than near term risk, and hence risk spreads almost always
increases with the maturity of a financial instrument.32 The depth of financial crisis is
properly measured by the degree of collapse in the availability of short term credit.
The evaporation of the global supply of short term credits within hours or days of
the Lehman failure is, I believe, without historical precedent. A run on money market
mutual funds, heretofore perceived to be close to riskless, was underway within hours of

8/6/2019 Greenspan Financial Crisis Paper
http://slidepdf.com/reader/full/greenspan-financial-crisis-paper 18/63
the Lehman announcement of default.33 The Federal Reserve had to move quickly to
support the failing commercial paper market. Unsupported, trade credit withdrawal set
off a spiral of global economic collapse within days. Even the almost sacrosanct fully
collateralized repurchase agreement market encountered severe unprecedented
difficulties.
We need to dig very deep into peacetime financial history to uncover similar
episodes. The call money market, that era’s key short term financing vehicle, shut down
at the peak of the 1907 panic, “when no call money was offered at all for one day and the
[bid] rate rose from 1 to 125%.”34 Even at the height of the 1929 stock market crisis, the
call money market functioned, though rates did soar to 20%. In lesser financial crises,
availability of funds in the long-term market disappeared, but overnight and other short-
term markets continued to function.
The withdrawal of overnight money is financial stringency at its maximum.
Investors are willing to lend overnight before they feel sufficiently protected by adequate
capital to reach out for more distant, and hence riskier, maturities.
The evaporation in September 2008 of short-term credits was global and all
encompassing. But it was the same process we had previously observed, but only at a
more micro level.35
8/6/2019 Greenspan Financial Crisis Paper
http://slidepdf.com/reader/full/greenspan-financial-crisis-paper 19/63
IV. 1. Principles of Reform
Given this virtually unprecedented period of turmoil, by what standard should
reform of official supervision and regulation be judged? I know of no form of economic
organization based on a division of labor, from unfettered laissez-faire to oppressive
central planning, that has succeeded in achieving both maximum sustainable economic
growth and permanent stability. Central planning certainly failed and I strongly doubt
that stability is achievable in capitalist economies, given the always turbulent competitive
markets continuously being drawn towards, but never quite achieving, equilibrium (that
is the process leading to economic growth).
People acting without forethought can not be productive except by chance.
Identification of effective innovation is, of necessity, a rational act. Hence, inhibiting
irrational behavior when it can be identified, through regulation, as recent history has
demonstrated, could be stabilizing. But, there is an inevitable cost of regulation in terms
of economic growth and standards of living when it imposes restraints beyond containing
unproductive behavior.
Regulation by its nature imposes restraints on competitive markets. The elusive
point of balance between growth and stability has always been a point of contention,
especially when it comes to financial regulation.
Throughout the post-war years, with the exception of a limited number of bailouts
of U.S banks,36 private capital proved adequate to cover virtually all provisions for

8/6/2019 Greenspan Financial Crisis Paper
http://slidepdf.com/reader/full/greenspan-financial-crisis-paper 20/63
range that existed between the years 1946 and 2003, was adequate to support the U.S.
banking system.
Risk managers’ assumption of the size of the negative tail of the distribution of
credit and interest rate risk, as I noted earlier, was, of necessity, conjectural, and for
generations we never had to test those conjectures. Most of the shape of the distribution
of perceived risk was thoroughly documented in the pre-crisis years as “moderate”
financial crises and euphorias traced out their relevant part of the curve. But since
modern financial data compilation began, we never had a “hundred year flood” that
exposed the full intensity of the negative tail.
Risk managers, of course, knew in earlier decades that an assumption of normality
in the distribution of risk was unrealistic, but as a first approximation that greatly
facilitated calculation, it prevailed. The mathematics implied by fat tails were well
understood, but our number crunching capabilities fell far short of making the required
calculations to guide actions, except at prohibitive cost. That is no longer the case.
Clearly what we experienced in the weeks following the Lehman default is
exactly the type of market seizure that tail risk conjecture was supposed to capture, and
did not. Having experienced “Lehman,” risk managers will be far more cautious in
evaluating future risk—at least for a while.
Many investment firms are constructing probability distributions of outcomes
employing, as the negative tail, data based on the experiences of the last two years.

8/6/2019 Greenspan Financial Crisis Paper
http://slidepdf.com/reader/full/greenspan-financial-crisis-paper 21/63
distributed normally. Such evidence suggests the onset of a “hundred year flood” more
often than once in a century.
The aftermath of the Lehman crisis traced out a startlingly larger negative tail
than most anybody had earlier imagined. At least partly responsible may have been the
failure of risk managers to fully understand the impact of the emergence of shadow
banking that increased financial innovation, but as a consequence, also increased the level
of risk. The added risk had not been compensated by higher capital.
When risk premiums are low over a protracted period, for example, from 1993 to
1998 and 2003 to 2007, investor bids for all financial assets, especially the high-risk
tranches of collateralized debt obligations, create an illusion of permanent market
liquidity that turned out to be intoxicating. It led several major investment banks to
attempt to weather the financial storm with only a thin veneer of tangible capital.
The most pressing reform, in my judgment, in the aftermath of the crisis, is the
need to fix the level of regulatory risk adjusted capital, liquidity, and collateral standards
required by counterparties. Private market participants are now requiring economic
capital and balance sheet liquidity well in excess of, yet to be amended, Basel II. The
shadow banks that survived the crisis are experiencing significantly tighter market
standards, with respect to capital, liquidity, and collateral, than existed before the crisis.
Those major changes need to be reflected in the new set of regulatory requirements and
standards currently undergoing global review.

8/6/2019 Greenspan Financial Crisis Paper
http://slidepdf.com/reader/full/greenspan-financial-crisis-paper 22/63
on decades of experience, for example, erroneously designated pools of self-amortizing
home mortgages among the safest of private instruments. And a surprisingly, and
unfortunately, large proportion of investment portfolio decisions were, by law, accorded
seeming “safe harbor” status if they adhered to the credit-risk (mis-)judgments of credit
rating agencies.
International bank liquidity regulation that assures adequate cash to meet ongoing
commitments, in the event of a shutdown in external funding, should match the
tightening already evident in private risk management paradigms.37
Collateral has shown
itself particularly subject to rapid recapture. Bear Stearns had nearly $20 billion in
pledgeable liquid funds a week before it collapsed. Morgan Stanley lost more than a half
trillion dollars of pledgeable collateral during the height of the crisis. In the U.S., to
lower the risk of a “run on the broker,” the amount of customer assets (collateral) of
broker-dealers that cannot be commingled with their own, needs to be increased. That
would decrease the amount of funds that can “run.” However, such action must be
measured and coordinated with other global regulators to avoid regulatory arbitrage.38
I would eliminate the ability of some hedge funds to accept financing from funds
that combine the funds of smaller investors. Hedge funds lost money at the peak of the
crisis, but no significant freestanding hedge fund required taxpayer funds.39 Although
hedge funds are only lightly regulated, much of their leveraged funding comes from more
heavily regulated banks. As Sebastian Mallaby writes, “most hedge funds make money
8/6/2019 Greenspan Financial Crisis Paper
http://slidepdf.com/reader/full/greenspan-financial-crisis-paper 23/63
consequence, they supply much needed liquidity to financial markets when other
competitors have withdrawn. Regulations that inhibit the ability of hedge funds to supply
such services are counterproductive.
Capital, liquidity, and collateral, in my experience, address almost all of the
financial regulatory structure shortcomings exposed by the onset of crisis. In retrospect,
there has to be a level of capital that would have prevented the failure, for example, of
Bear Stearns and Lehman Brothers. (If not 10%, think 40%.) Moreover, generic capital
has the regulatory advantage of not having to forecast which particular financial products
are about to turn toxic. Certainly investors did not foresee the future of subprime
securities or the myriad other broken products. Adequate capital eliminates the need for
an unachievable specificity in regulatory fine-tuning.
Our current jerry-built regulatory structure that has evolved over the decades has
become much too complex. Policymakers failed to recognize during the debates that led
to legislation resulting in a badly needed opening up of financial competition (the
Gramm-Leach-Bliley Act), that increased competition, especially through shadow
banking, also increased negative tail risk. That necessitating significantly higher capital
requirements as well.
IV. 2. Upward Revisions of Bank Economic Capital

8/6/2019 Greenspan Financial Crisis Paper
http://slidepdf.com/reader/full/greenspan-financial-crisis-paper 24/63
a measure of bank insolvency risk, to post-crisis events.40 Its movements should also
give us some direct insight into when the banking system is perceived to have overcome
the market’s fear of widespread insolvency. And beyond that, to when markets perceive
banks will feel sufficiently secure to return to the free lending of the pre-crisis years.
Starting late in 2008 and accelerating into the first quarter of 2009, the U.S.
Treasury through its Troubled Asset Relief Program (TARP) added $250 billion to bank
equity, the equivalent of approximately two percentage points to the equity capital to
assets ratio. Its impact was important and immediate.
As the financial crisis took hold and deepened, the unweighted average spread of
5-year credit default swaps of six major U.S. banks41
rose from 17 basis points in early
2007, and to 170 basis points just prior to the Lehman default on September 15, 2008. In
response to the Lehman default, the 5-year CDS rose to more than 400 basis points on
October 10. On the day TARP was announced (October 14), the five-year CDS fell to
approximately 200 basis points, essentially by half (exhibit 8). The implication of a two
percentage point addition to the bank book equity capital to asset ratio, reversing roughly
half the crisis surge in 5 year CDS, implies an overall additional four percentage point
rise (from 10% in mid-2007 to 14%) in the equity capital cushion required by market
participants to fund the liabilities of banks. That, of course, assumes linear extrapolation,
an admittedly Herculean assumption, and, of course, the presumption that the probability
of a TARP prior to Lehman was de minimis. The abruptness of the market reaction to the

8/6/2019 Greenspan Financial Crisis Paper
http://slidepdf.com/reader/full/greenspan-financial-crisis-paper 25/63
Current book equity ratios to assets are still far from 14%. The equity to asset
ratio for commercial banks was (as reported by the FDIC) 11.1% on December 31, 2009,
compared with 10.1% in mid-2007. But unacknowledged loan losses were estimated by
the IMF last October in the hundreds of billions of dollars. Trends in relevant liquidity is
less readily measured, but is assumed to parallel changes in capital.
That banks still have more equity capital to add is also indicated by the 5-year
CDS of March 31, 2010 (and since) priced at over 100bp, still significantly elevated
relative to the 17bp level that prevailed in early 2007 when 10% capital was apparently
enough to virtually eliminate the threat of default and induce loan officers to lend freely.
There is little doubt that the TARP cash injection markedly reduced the fear of
bank default through early 2009. What is more difficult to judge, is the impact on bank
CDS of the dramatic increase in bank equity at market value relative to bank assets at
market value. That ratio rose 4.5 percentage points from the end of March 2009 to the
end of December (7.4% to 11.9%) (exhibit 9). There can be little doubt that this has
materially increased the solvency of banks, though apparently less as effectively, dollar
for dollar as the more permanent book value equity change in protecting solvency.42
Much of the repayment of TARP investments to the U.S. Treasury were doubtless
financed by new equity issuance made possible by more than $550 billion increase in
U.S. commercial bank equity at market value, and borrowings made much easier (and
cheaper) by the increased equity buffer engendered by gains in market valued bank

8/6/2019 Greenspan Financial Crisis Paper
http://slidepdf.com/reader/full/greenspan-financial-crisis-paper 26/63

8/6/2019 Greenspan Financial Crisis Paper
http://slidepdf.com/reader/full/greenspan-financial-crisis-paper 27/63
IV. 3. What Regulation Can Do
What, in my experience, supervision and examination can do as back-up to capital
requirements and counterparty surveillance is promulgate rules that are preventative and
do not require anticipating an uncertain future. Supervision:
• can audit and enforce capital and liquidity requirements.45
• can require the issuance of some debt of financial institutions that will become
equity, should equity capital become impaired (see page 34.)
• can, and has, put limits or prohibitions on certain types of concentrated bank
lending.
• can prohibit a complex affiliate and subsidiary structure whose sole purpose is tax
avoidance or regulatory arbitrage.
• can inhibit the reconsolidation of affiliates previously sold to investors, especially
structured investment vehicles (SIVs). When such assets appeared about to fail,
sponsoring companies, fearful of reputation risk (a new insight?), reabsorbed
legally detached affiliates at subsequent great loss.
• can require “living wills” that mandate a financial intermediary to indicate on an
ongoing basis how it can be liquidated expeditiously with minimum impact on
counterparties and markets.

8/6/2019 Greenspan Financial Crisis Paper
http://slidepdf.com/reader/full/greenspan-financial-crisis-paper 28/63
IV. 4. Regulatory Capital History
In the late 19th century, U.S. banks required equity capital of 30% of assets to
attract the liabilities required to fund their assets. In the pre-Civil War period, that figure
topped 50% (exhibit 10). Given the rudimentary nature of 19th century payment systems,
and geographically poorly placed distribution of reserves in a then agricultural economy,
competition for bank credit was largely local. It enabled national banks on average to
obtain net income to asset returns of well over 200 basis points in the late 1880s and
probably more than 300 basis points in the 1870s (this compares with 70 basis points a
century later.)
Increasing efficiency of financial intermediation owing to consolidation of
reserves and improving payment systems, competitively pressed spreads to narrow and
allowed capital to asset ratios to decline. In marked contrast, the annual average net
income rate of return on equity was amazingly stable, rarely falling out of a 5% to 10%
range measured annually during the century 1869 to 1966 (exhibit 11). That meant that
net income as a percentage of assets and the degree of leverage were approximately
inversely proportional during that century.
The rates of return on assets, and equity (despite the decline in leverage,46
) moved
modestly higher during the years 1966-1982 owing to a rapid expansion in non-interest
income, such as fiduciary activities, service charges and fees, net securitization income,
(and later investment banking, and brokerage). Noninterest income rose significantly

8/6/2019 Greenspan Financial Crisis Paper
http://slidepdf.com/reader/full/greenspan-financial-crisis-paper 29/63
That in part reflected the emergence in April, 1987 of court sanctioned, and
Federal Reserve regulated, “Section 20” investment banking affiliates of bank holding
companies.47
The transfer of such business is clearly visible in the acceleration of bank
gross income originating relative to that of income of investment banks starting in 2000.48
I tentatively assume the historic relative stability of the average net income to
equity ratios dating back to the post-Civil War years reflects an underlying ex ante
market determined rate of return on intermediation.
In summary the current crisis will leave in its wake a significantly higher capital
to asset ratio requirement, both economic and regulatory, that must be reached if
intermediation is to be restored to the point where banks and other financial institutions
are confident they have a sufficiently secure capital cushion to lend freely.
IV. 5. Limits to Regulatory Capital Requirements
If we accept as a benchmark the remarkable stability of net income to equity
capital (5% to 15%) that has prevailed with rare exceptions since the end of the Civil War
(exhibit 11), we can infer the highest average ratio of capital to assets a banking system
can tolerate before a significant number of banks are required to raise their margin and/or
shrink their size. I assume that a 5% annual average rate of return (the lower limit of the
range) as a proxy for the full distribution of the thousands of banks that would make up

8/6/2019 Greenspan Financial Crisis Paper
http://slidepdf.com/reader/full/greenspan-financial-crisis-paper 30/63
the average. Accordingly, for this exercise it is employed as the ex ante competitively
required average minimum return on intermediation. I assume as a first approximation
that all variables are independent. If so, the highest ratio of capital to assets the U.S.
banking system can tolerate and still supply the nonfinancial sector with adequate
financial service capacity can be inferred from the identity:
C
A
Ac×=
π π
where π is net income, C is equity capital, and A is total assets.
If 05.=
C
π
, then A
C =
A
π
×20 .
It can be shown that A
π
= (r r – r p – k)w + n – e – α, where r r is the rate of interest
received from earning assets, r p is the interest rate paid on earning assets, k is the ratio of
losses to earning assets, w is the ratio of earning assets to total assets, n is the ratio of
noninterest income to assets, e is the ratio of non-interest expense to total assets and α is
the ratio of taxes and minor other adjustments to total assets.
As can be seen from exhibit 12 all of the rise in A
π
andC
π
since 1980 owe to the
marked rise in non-interest income.
In the years immediately prior to the onset of crisis A
π
averaged 0.012 and
therefore the inferred maximum average regulatory capital, A
C , as a first approximation,
was 0.24. A rate higher than 0.24, all else equal,49
would put the average rate of return

8/6/2019 Greenspan Financial Crisis Paper
http://slidepdf.com/reader/full/greenspan-financial-crisis-paper 31/63
quarter century of the post-war period (0.0075) then A
π
= 0.0075 and A
C = 0.15,
marginally above the 12% to 14% presumed market determined capital requirements, that
would induce banks to lend freely.
The previous calculations, as I noted, assume a static model in which all variables
are independent. But clearly the required rate of return on equity cannot be independent
of the capital to asset ratio. Increased capital reduces the risk of the balance sheet and
hence will attract equity investors with lower rates of return.
This implies that the results of the recent A
π
regulatory capital can readily exceed
the static ceiling of AC = .24. Increased capital requirements will surely reduce the
marginal lending that occurred in recent decades owing to the failure to fully fund tail
risk. Much of the marginal lending was in effect being subsidized by taxpayers. That
subsidy became fully funded in 2008 by sovereign credit. Removing the subsidy through
higher capital requirements will, of course, shrink the size of financial intermediary
balance sheets. Much of this lending was evidently nonproductive and its loss is not apt
to be a problem for our complex economy’s required level of intermediation.
IV. 6. Too Big to Fail
Beyond significantly increased capital requirements is the necessity of addressing
h bl f fi i l fi b i “ bi f il” i l “

8/6/2019 Greenspan Financial Crisis Paper
http://slidepdf.com/reader/full/greenspan-financial-crisis-paper 32/63
Stern, the former President of the Federal Reserve Bank of Minneapolis, who has long
held the position that “. . . creditors will continue to underprice the risk-taking of these
financial institutions, overfund them, and fail to provide effective market discipline.
Facing prices that are too low, systemically important firms will take on too much risk.”50
These firms absorb scarce savings that needs to be invested in cutting edge technologies,
if output per hour and standards of living are to continue to rise.
After wallowing in the backwaters of economics for years, “too big to fail” has
arisen as a major visible threat to economic growth. It finally became an urgent problem
when Fannie Mae and Freddie Mac were placed into conservatorship on September 7,
2008. Prior to that date, U.S. policymakers (with fingers crossed) could point to the fact
that Fannie and Freddie, by statute, were not backed by the “full faith and credit of the
U.S. government.” Market participants however, did not believe the denial, and
consistently afforded Fannie and Freddie a special credit subsidy. On September 7, 2008,
market participants were finally vindicated.
Fannie Mae and Freddie Mac need to be split up into individual companies, none
“too big to fail”, then reconstructed into securitizers adding a valuable service to modern
finance. Their future solvency can be assured if they are prohibited from accumulating
large portfolios of assets that add no useful backing to the process of securitization or the
mortgage markets more generally. The portfolio’s sole purpose is to profit from the
subsidy market participants grant to GSEs.

8/6/2019 Greenspan Financial Crisis Paper
http://slidepdf.com/reader/full/greenspan-financial-crisis-paper 33/63
that market players are going to believe that every significant financial institution, should
the occasion arise, would be subject to being bailed out with taxpayer funds. It is going
to be very difficult for legislators to dissuade future investors that it is otherwise.
Businesses that are bailed out have competitive market and cost-of-capital
advantages, but not efficiency advantages, over firms not thought to be systemically
important. For years the Federal Reserve had been concerned about the ever larger size
of our financial institutions. Federal Reserve research had been unable to find economies
of scale in banking beyond a modest-sized institution. A decade ago, citing such
evidence,51 I noted that “megabanks being formed by growth and consolidation are
increasingly complex entities that create the potential for unusually large systemic risks
in the national and international economy should they fail.”52
Regrettably, we did little to
address the problem.
How to deal with systemically threatening institutions is among the major
regulatory problems for which there are no good solutions. Early resolution of bank
problems under the Federal Deposit Insurance Corporation Improvement Act of 1991
(FDICIA) appeared to have worked with smaller banks during periods of general
prosperity. But the notion that risks can be identified in a sufficiently timely manner to
enable the liquidation of a large failing bank with minimum loss, has proved untenable
during this crisis and I suspect in future crises as well.53
8/6/2019 Greenspan Financial Crisis Paper
http://slidepdf.com/reader/full/greenspan-financial-crisis-paper 34/63
The solution, in my judgment, that has at least a reasonable chance of reversing
the extraordinarily large “moral hazard”54 that has arisen over the past year is to require
banks and possibly all financial intermediaries to hold contingent capital bonds, that is,
debt which is automatically converted to equity when equity capital falls below a certain
threshold. Such debt will, of course, be more costly on issuance than simple debentures,
but its existence could materially reduce moral hazard by signaling, by its price action,
pending solvency problems.
However, should contingent capital bonds prove insufficient, we should allow
large institutions to fail, and if assessed by regulators as too interconnected to liquidate
quickly, be taken into a special bankruptcy facility. That would grant the regulator access
to taxpayer funds for “debtor-in-possession financing.” A new statute would create a
panel of judges, who are expert in finance. The statute would require creditors (when
equity is wholly wiped out) to be subject to statutorily defined principles of discounts
from par (“haircuts”) before the financial intermediary was restructured. The firm would
54 Moral hazard, in an economic context, arises when an institution is not debited with the full costs of itsactions and therefore will tend, in part at least, to act contrary to how it would act were it pressured solely by unfettered competition, where the externalities of potential bailout costs were fully internalized bycompetitors. The institution accordingly requires other parties to suffer some of the costs of its actions.
An interesting speculation is whether the crisis that emerged in August, 2007 from theextraordinary leverage (as much as 20 to 30 times tangible capital) taken on by the American investment
banks almost surely would not have occurred had these firms remained the partnerships they were up to aquarter century ago. The ruling (in 1970) that allowed broker-dealers to incorporate and gain permanentcapital seemed sensible at the time. Nonetheless, as partnerships, Lehman Brothers and Bear Stearns,would not have departed from their historic low leverage. Prior to incorporation, those entities fearful of the joint and several liability of general partnerships shied away from virtually any risk they could avoid.Their core underwriting of new issues rarely exposed them for more than a few days.
To be sure the senior officers of Bear Stearns and Lehman Brothers lost hundreds of millions of

8/6/2019 Greenspan Financial Crisis Paper
http://slidepdf.com/reader/full/greenspan-financial-crisis-paper 35/63
then be required to split up into separate units, none of which should be of a size that is
too big to fail.
I assume that some of the newly created firms would survive, and others fail. If,
after a fixed short period of time no viable exit from bankruptcy appears available, the
financial intermediary should be liquidated as expeditiously as feasible.
IV. 7. Regulations Embodying a Forecast Fail with Regularity
The current crisis has demonstrated that neither bank regulators, nor anyone else,
can consistently and accurately forecast whether, for example, subprime mortgages will
turn toxic, or to what degree, or whether a particular tranche of a collateralized debt
obligation will default, or even if the financial system as a whole will seize up. A large
fraction of such difficult forecasts will invariably be proved wrong. Regulators can
readily identify underpriced risk and the existence of bubbles, but most importantly they
cannot, except by chance, effectively time the onset of crisis.55
This should not come as a
surprise.
A financial crisis is defined as an abrupt and sharp decline in the price of income-
producing assets, usually induced by a dramatic spike in the discount rate on income
flows as market participants swing from euphoria to fear. Implicit in any sharp price
change is that it is unanticipated by the mass of market participants. For were it
otherwise, the price imbalances would have been arbitraged away.

8/6/2019 Greenspan Financial Crisis Paper
http://slidepdf.com/reader/full/greenspan-financial-crisis-paper 36/63
our current account deficit, starting in 2002, increased dramatically. The dollar
accordingly came under heavy selling pressure. The rise in the euro-dollar exchange rate
from, say, 1.10 in the spring of 2003 to 1.30 at the end of 2004 appears to have gradually
arbitraged away the presumed dollar trigger of the "next" crisis. The U.S. current account
deficit did not play a prominent direct role in the timing of the 2007 crisis, though
because of that it may in the next crisis.
In the years ahead, forecasters will readily identify risk that is underpriced—or at
least identify risks priced at less than their historic average. But in instance after
instance, as I noted earlier, risk has remained underpriced for years. Forecasters as a
group will almost certainly miss the onset of the next financial crisis, as they have so
often in the past and I presume any newly designated “systemic regulator” will also.
Many analysts argue that forecasting is not required. Capital and liquidity
requirements they hold can be effectively fine-tuned to match the stage of the business
cycle. Properly calibrated, they presumably could be effective in assuaging imbalances.
But cycles are not uniform. In real time, where we are in the cycle is a forecast, and
cycles vary. For example, the low of the unemployment rate at NBER cyclical peaks
since 1948 ranged between 2.6% and 7.2%. Would we have judged a turn in the business
cycle, for example, when the unemployment rate had risen to 5.8% in April 1995, up
from 5.4% in March? Yet the unemployment rate would continue to fall for five more
years.

8/6/2019 Greenspan Financial Crisis Paper
http://slidepdf.com/reader/full/greenspan-financial-crisis-paper 37/63
bubbles. Moreover, discretionary regulatory rates raise uncertainties that could curb
investment.
In the current environment of complexity, I see no ready alternative to
significantly increasing regulatory capital requirements and liquidity and beefing up
individual banks’ counterparty risk surveillance.
The Federal Reserve had been concerned for years about the ability of regulatory
supervisors and examiners to foresee emerging problems that eluded internal bank
auditing systems and independent auditors. I remarked in 2000 before the American
Bankers Association, “. . . in recent years rapidly changing technology has begun to
render obsolete much of the bank examination regime established in earlier decades.
Bank regulators are perforce being pressed to depend increasingly on greater and more
sophisticated private market discipline, the still most effective form of regulation. Indeed,
these developments reinforce the truth of a key lesson from our banking history--that
private counterparty supervision remains the first line of regulatory defense.”56
Regrettably, that first line of defense failed.
A century ago, examiners could appraise individual loans and judge their
soundness.57
But in today’s global lending environment, how does a U.S. bank examiner
judge the credit quality of, say, a loan to a Russian bank, and hence the loan portfolio of
that bank. That in turn would require vetting the Russian bank’s counterparties and those
counterparties’ counterparties all to judge the soundness of a single financial transaction.

8/6/2019 Greenspan Financial Crisis Paper
http://slidepdf.com/reader/full/greenspan-financial-crisis-paper 38/63
In short, a bank examiner cannot, and neither can a credit rating agency. How deep into
the myriad layers of examination is enough for certification?
The complexity of our financial system in operation spawns, in any given week,
many alleged pending crises that, in the event, never happen and innumerable allegations
of financial misconduct. To examine each such possibility in the level of detail necessary
to reach meaningful conclusions would require an examination force many multiples
larger than those now in place in any of our banking regulatory agencies. Arguably, at
such levels of examination, bank lending, and its necessary risk taking, would be
impeded.
The Federal Reserve and other regulators were, and are, therefore required to
guess which of the assertions of pending problems or allegations of misconduct should be
subject to full scrutiny by, of necessity, a work force with limited examination capacity.
But this dilemma means that in the aftermath of an actual crisis, we will find highly
competent examiners failing to have spotted a Madoff. Federal Reserve supervision and
evaluation is as good as it gets even considering the failures of past years. Banks still
have little choice but to rely upon counterparty surveillance as their first line of crisis
defense.58
V. 1. Monetary Policy and House Price Bubbles
The global house price bubble was a consequence of lower interest rates, but it

8/6/2019 Greenspan Financial Crisis Paper
http://slidepdf.com/reader/full/greenspan-financial-crisis-paper 39/63
house price bubble was driven by the low level of the 30 year fixed rate mortgage that
declined from its mid-2000 peak, six months prior to the FOMC easing of the federal
funds rate in January, 2001.
Between 2002 and 2005, monthly home mortgage 30 year rates led monthly U.S.
home price change (as measured by the 20 city Case-Shiller home price index) by 11
months with an R 2 (adjusted) of 0.511 and a t-statistic of -6.93; a far better indicator of
home prices than the fed-funds rate that exhibited an R 2 (adjusted) of 0.216 and a t-
statistic of -3.62 with only an eight month lead.59
Regressing both mortgage rates (with
an 11-month lead) and the federal funds rate (with an 8-month lead) on home prices
yields a highly significant t-statistic for mortgages of -5.20, but an insignificant t-statistic
for the federal funds rate of -.51.
This should not come as a surprise. After all, the prices of long-lived assets have
always been determined by discounting the flow of income (or imputed services) by
interest rates of the same maturities as the life of the asset. No one, to my knowledge,
employs overnight interest rates—such as the fed-funds rate—to determine the
capitalization rate of real estate, whether it be the cash flows of an office building or the
imputed rent of a single-family residence.
It is understandable why the fed funds rate prior to 2002 would be perceived as a
leading indicator of many statistics that in fact are driven by longer-term interest rates.
The correlation coefficient in the U.S. between the fed funds rate and the 30-year

8/6/2019 Greenspan Financial Crisis Paper
http://slidepdf.com/reader/full/greenspan-financial-crisis-paper 40/63
during those years, regressions with home prices as the dependent variable would have
seemingly worked equally as well with either long term rates or overnight rates as the
explanatory variable.
But the 30-year mortgage rate had clearly delinked from the fed funds rate in the
early part of this century. The correlation between the funds rate and the 30-year
mortgage rate fell to an insignificant .17 during the years 2002 to 2005, the period when
the bubble was most intense, and as a consequence, the funds rate exhibited little, if any,
influence on home prices.
The funds rate was lowered from 6½% in early 2001 to 1¾% in late 2001, and
then eventually to 1% in mid-2003, a rate that held for a year. The Federal Reserve
viewed the 1% rate as an act of insurance against the falling rate of inflation in 2003 that
had characteristics similar to the Japanese deflation of the 1990’s. The Fed thought the
probability of deflation small, but the consequences, should it occur, dangerous. But we
recognized that a funds rate held too low for too long might encourage product price
inflation. I thought at the time that the rate decrease nonetheless reflected an appropriate
balancing of risks. I still do.
To my knowledge, that lowering of the federal funds rate nearly a decade ago was
not considered a key factor in the housing bubble. Indeed, as late as January 2006,
Milton Friedman, historically the Federal Reserve’s severest critic, in evaluating the

8/6/2019 Greenspan Financial Crisis Paper
http://slidepdf.com/reader/full/greenspan-financial-crisis-paper 41/63
period of 1987 to 2005, wrote, “There is no other period of comparable length in which
the Federal Reserve System has performed so well. It is more than a difference of degree;
it approaches a difference of kind.”61
It thus came as somewhat of a surprise that in August 2007, Stanford University’s
John Taylor (with whom I rarely disagree) argued that Fed policy in the aftermath of the
dot-com bubble was the principle cause of the emergence of the U.S. housing bubble.62
According to Taylor, had the funds rate followed his eponymous rule, housing
starts would have been significantly lower and the U.S. economy would have avoided
“much of the housing boom” and price bubble. His conclusion, often copied and
repeated, I fear, appears to have become close to conventional wisdom.
63
As evidence Taylor notes first the “significant” inverse correlation, with a lag,
from mid-1959 to mid-2007 between the federal funds rate and housing starts and argues
that according to his rule (a useful first approximation to a central bank’s monetary policy
stance) the Federal Reserve had set an inappropriately low funds rate during the years
2002 to 2005.64 As a consequence, “housing starts jumped to a 25-year high... The surge
in housing demand led to a surge in housing price inflation. [The] jump in housing price
inflation then accelerated the demand for housing in an upward spiral.”
Taylor postulates starts as the primary driver of home prices. The evidence
suggests that it is not starts that drive prices and initiate the “upward spiral,” but the other
61Wall Street Journal January 31 2006

8/6/2019 Greenspan Financial Crisis Paper
http://slidepdf.com/reader/full/greenspan-financial-crisis-paper 42/63
way around (exhibit 13). Home price change, with a 6-month lead, has significant
explanatory power for single-family starts from 1976 to 2009 (R 2 (adjusted) of .36, t-
statistic of 15.0). American home builders, in my experience, respond to price change to
determine how many “homes for sale” they start, not the federal funds rate. And home
price change, as I noted earlier, is a function of lagged long-term mortgage rates.
Housing starts, in any event, should be extraneous to Taylor’s explanation of the
bubble. It is employed because the Taylor Rule by itself is structured to indicate a proper
federal funds rate to balance the trade-off between inflation and unemployment. There
are no asset price inputs, especially home prices, called for in the Taylor Rule. Home
prices cannot be substituted willy-nilly for the CPI or core PCE price in the Taylor
paradigm. CPI could stand as a proxy for home prices if the correlation between home
prices and CPI were very high. But, it is not. The correlation between home prices and
consumer prices, and between asset prices in general, and product prices is small to
negligible or, on occasion, negative.
The Taylor Rule clearly cannot be applied to asset prices, especially when benign
product price inflation is almost surely a necessary condition for an income-producing-
asset price bubble.65
The correct interpretation of a Taylor Rule as applied to the period 2002 to 2005
that stipulated that the federal funds rate is too low is that product price inflation (the core
implicit PCE deflator in the Federal Reserve’s case) is threatening and rate hikes to meet
8/6/2019 Greenspan Financial Crisis Paper
http://slidepdf.com/reader/full/greenspan-financial-crisis-paper 43/63
Rule inappropriate for assessing the causes of asset price increases, it also gave a false
signal for policy to stabilize the core PCE price.
The believers of Fed “easy money” policy as the root of the housing bubble
correctly note that a low fed fund rate (at only 1% between mid-2003 and mid-2004)
lowered interest rates for adjustable rate mortgages (ARMs). That in turn, they claim,
increased demand for homes financed by ARMs and hence were an important contributor
to the emergence of the bubble.
But, in retrospect, it appears that the decision to buy homes preceded the decision
of how to finance the purchase. I suspect (but cannot definitively prove) that a large
majority of home buyers financing with ARMs, were ARMs not being offered, (during
that period of euphoria) would have instead funded their purchases with 30-year fixed
rate mortgages. How else can one explain the peaking of originations of ARMs two
years prior to the peak in home prices (exhibit 14). Market demand obviously did not
need ARM financing to elevate home prices during the last two years of the expanding
bubble.
Taylor, confronted with evidence that the housing bubble is global, alludes to a
seemingly tight relationship in a number of European countries between the degree of
deviation from the Taylor rule and the size of bubbles.66
But a recent study by Federal
Reserve staff, using a broader sample of countries, notes that deviations from the Taylor
rule do not seem to be correlated with changes in house prices. They conclude that the
8/6/2019 Greenspan Financial Crisis Paper
http://slidepdf.com/reader/full/greenspan-financial-crisis-paper 44/63
relationship is “statistically insignificant (and relatively weak in economic terms as
well).”67
Moreover, John Taylor does not buy the global saving-investment explanation of
the decline in real long term interest rates as the trigger of the global housing bubble that
he foreshortens into the “saving glut.” He succinctly states, “Some argue that the low
interest rates in 2002-4 were caused by global factors beyond the control of the monetary
authorities. If so, then the interest-rate decisions by the monetary authorities were not the
major factor causing the boom. This explanation – appealing at first glance because
long-term interest rates remained low for a while after the short-term federal funds rate
began increasing – focuses on global saving. It argues that there was an excess of world
saving – a global saving glut – that pushed interest rates down in the United States and
other countries. The main problem with this explanation is that there is no actual
evidence of a global saving glut. On the contrary, … the global saving rate – world
saving as a fraction of world GDP – was low in the 2002-4 period, especially when
compared with the 1970s and 1980s.”68 Taylor is employing ex post data to refute
analysis based on ex ante saving and investment intentions (see page 5), an argument
most economists should find puzzling.
V. 2. Could the Breakdown Have Been Prevented?
Could the breakdown that so devastated global financial markets have been

8/6/2019 Greenspan Financial Crisis Paper
http://slidepdf.com/reader/full/greenspan-financial-crisis-paper 45/63
term interest rates, I very much doubt it. Those economic conditions are the necessary,
and likely the sufficient, conditions for the emergence of an income-producing asset
bubble. To be sure, central bank monetary tightening has the capacity to break the back
of any prospective cash flow that supports bubbly asset prices, but almost surely at the
cost of a severe contraction of economic output, with indeterminate consequences. The
downside of that tradeoff is open-ended.69
But why not incremental tightening? There are no examples, to my knowledge,
of a successful incremental defusing of a bubble that left prosperity in tact. Successful
incremental tightening by central banks to gradually defuse a bubble requires a short-term
feedback response.70
But, policy impacts an economy with long and variable lags of as much as one to
two years.71 How does the FOMC for example know in real time if its incremental ever-
greater tightening is impacting the economy at a pace the policy requires? How much in
advance will it have to tighten to defuse the bubble without disabling the economy? But
more relevantly, unless incremental Fed tightening significantly raises risk aversion (and
long-term interest rates) or disables the economy enough to undercut the cash flow that
supports the relevant asset prices, I see little prospect of success.
69 Tight regulations on mortgage lending, for example, down payment requirements of 30% or more, theremoval of the mortgage interest tax deduction and eliminating home mortgage non-recourse provisions

8/6/2019 Greenspan Financial Crisis Paper
http://slidepdf.com/reader/full/greenspan-financial-crisis-paper 46/63
The Federal Reserve’s one attempt at incremental tightening failed. In early 1994
we embarked on a 300 basis point tightening to confront what we perceived at the time as
growing inflationary pressures. It was a policy that could have been just as easily read by
the market as an incremental tightening to defuse the then incipient dot-com bubble
already underway.
We not only failed to defuse the nascent stock market bubble that was evident in
late 1993, but arguably enhanced it. The ability of the economy to withstand a severe
monetary tightening in 1994 inadvertently demonstrated that the emerging boom was
stronger than markets had anticipated, and, as a consequence, raised the equilibrium level
of the Dow Jones Industrial Average.72
This suggested that a tightening far greater than
the 1994 episode and the tightening in 2000 would have been required to quash the
bubble. Certainly a funds rate far higher than the 6½% that was reached in mid-2000
would have been required.
At some rate, monetary policy can crush any bubble. If not 6½%, try 20%, or
50% for that matter. Any bubble can be crushed, but the state of prosperity will be an
inevitable victim.73 In 2005 we at the Fed did harbor concerns about the possible
resolution of the housing bubble euphoria that gripped the nation. In 2005 I noted,
“…history has not dealt kindly with the aftermath of protracted periods of low risk
premiums.”74

8/6/2019 Greenspan Financial Crisis Paper
http://slidepdf.com/reader/full/greenspan-financial-crisis-paper 47/63
However we never had a sufficiently strong conviction about the risks that could
lie ahead. As I noted earlier, we had been lulled into a state of complacency by the only
modestly negative economic aftermaths of the stock market crash of 1987 and the dot-
com boom. Given history, we believed that any declines in home prices would be
gradual. Destabilizing debt problems were not perceived to arise under those conditions.
For guidance, we looked to policy in response to the unprecedented one-day
stock-bubble bust of October 19, 1987 and 2000 bear market. Contrary to prior
experience,75
large injections of Federal Reserve liquidity apparently did help stabilize
the economy.
Unless there is a societal choice to abandon dynamic markets and leverage for
some form of central planning, I fear that preventing bubbles will in the end turn out to be
infeasible. Assuaging their aftermath seems the best we can hope for. Policies, both
private and public, should focus on ameliorating the extent of deprivation and hardship
caused by deflationary crises. But if an effective way, other than substantial increases in
capital, to defuse leveraged bubbles without a major impact on economic growth is
discovered, it would be a major step forward in organizing our market economies.
VI. In Summary
In this paper, I endeavor to trace the powerful economic forces that emerged in
the aftermath of the Cold War that led to a dramatic decline and convergence of global

8/6/2019 Greenspan Financial Crisis Paper
http://slidepdf.com/reader/full/greenspan-financial-crisis-paper 48/63
bubble heavily leveraged by debt and (2) a delinking of monetary policy from long-term
rates.76
The global bubble was exacerbated by the heavy securitization of American
subprime and Alt-A mortgages that found willing buyers at home and abroad, many
encouraged by grossly inflated credit ratings. More than a decade of virtually unrivaled
global prosperity, low inflation, and low long-term interest rates reduced global risk
aversion to historically unsustainable levels.
The bubble started to unravel in the summer of 2007. But unlike the debt-lite
deflation of the earlier dotcom boom, heavy leveraging set off serial defaults, culminating
in what is likely to be viewed as the most virulent financial crisis ever. The major failure
of both private risk management and official regulation was to significantly misjudge the
size of tail risks that were exposed in the aftermath of the Lehman default. Had capital
and liquidity provisions to absorb losses been significantly higher going into the crisis,
contagious defaults surely would have been far less.
This paper argues accordingly that the primary imperative going forward has to be
increased regulatory capital, liquidity, and collateral requirements for banks and shadow
banks. I also note on pages 27-28 a number of less important reform initiatives that may
be useful.
But the notion of an effective “systemic regulator” as part of a regulatory reform
package is ill-advised. The current sad state of economic forecasting should give

8/6/2019 Greenspan Financial Crisis Paper
http://slidepdf.com/reader/full/greenspan-financial-crisis-paper 49/63
Indeed, models rarely anticipate recessions, unless again, the recession is artificially
forced into the model structure.
In closing, let me reiterate that the fundamental lesson of this crisis is that, given
the complexity of the division of labor required of modern global economies, we need
highly innovative financial systems to assure the proper functioning of those economies.
But while, fortunately, much financial innovation is successful, much is not. And it is not
possible in advance to discern the degree of future success of each innovation. Only
adequate capital and collateral can resolve this dilemma. If capital is adequate, by
definition, no debt will default and serial contagion will be thwarted. Determining the
proper level of risk-adjusted capital should be the central focus of reform going forward.
We can legislate prohibitions on the kinds of securitized assets that aggravated the
current crisis. But markets for newly originated Alt-A and adjustable-rate subprime
mortgages, synthetic collateralized debt obligations, and many previously popular
structured investment vehicles, no longer exist. And private investors have shown no
inclination to revive them. The next crisis will no doubt exhibit a plethora of innovative
new assets, some of which will have unintended toxic characteristics that no one can
forecast in advance. But if capital and collateral are adequate, losses will be restricted to
equity shareholders who seek abnormal returns, but in the process expose themselves to
abnormal losses. Taxpayers should not be at risk.
Exhibit 1
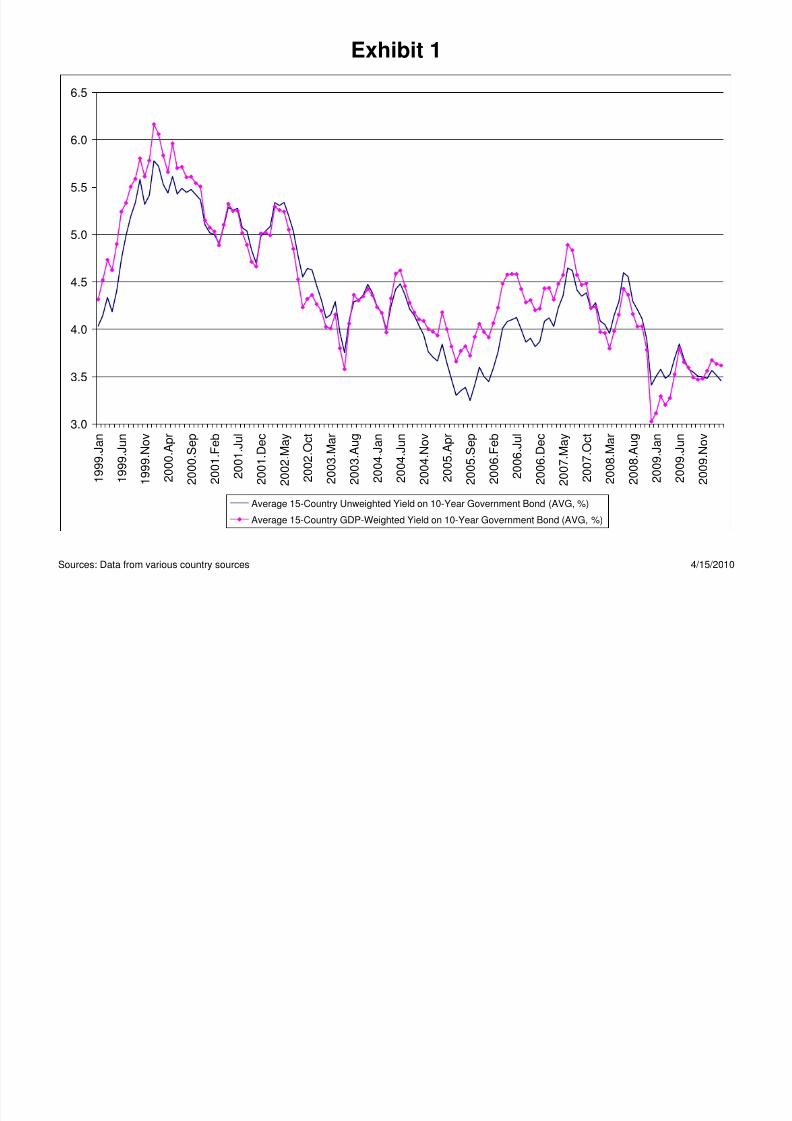
8/6/2019 Greenspan Financial Crisis Paper
http://slidepdf.com/reader/full/greenspan-financial-crisis-paper 50/63
Sources: Data from various country sources 4/15/2010
3.0
3.5
4.0
4.5
5.0
5.5
6.0
6.5
1 9 9 9 . J a n
1 9 9 9 . J u n
1 9 9 9 . N o v
2 0 0 0 . A p
r
2 0 0 0 . S e p
2 0 0 1 . F e b
2 0 0 1 . J u
l
2 0 0 1 . D e c
2 0 0 2 . M a y
2 0 0 2 . O c
t
2 0 0 3 . M a
r
2 0 0 3 . A u g
2 0 0 4 . J a n
2 0 0 4 . J u n
2 0 0 4 . N o v
2 0 0 5 . A p
r
2 0 0 5 . S e p
2 0 0 6 . F e b
2 0 0 6 . J u
l
2 0 0 6 . D e c
2 0 0 7 . M a y
2 0 0 7 . O c
t
2 0 0 8 . M a
r
2 0 0 8 . A u g
2 0 0 9 . J a n
2 0 0 9 . J u n
2 0 0 9 . N o v
Average 15-Country Unweighted Yield on 10-Year Government Bond (AVG, %)
Average 15-Country GDP-Weighted Yield on 10-Year Government Bond (AVG, %)
Exhibit 2

8/6/2019 Greenspan Financial Crisis Paper
http://slidepdf.com/reader/full/greenspan-financial-crisis-paper 51/63
Sources: Data from various country sources 4/15/2010
Unweighted Variance of Long-Term (10-Year) Interest Rate on Sovereign Debt
0.00
0.05
0.10
0.15
0.20
0.25
0.30
0.35
0.40
0.45
0.50
1 9 9 9 . J a n
1 9 9 9 . J u l
2 0 0 0 . J a n
2 0 0 0 . J u l
2 0 0 1 . J a n
2 0 0 1 . J u l
2 0 0 2 . J a n
2 0 0 2 . J u l
2 0 0 3 . J a n
2 0 0 3 . J u l
2 0 0 4 . J a n
2 0 0 4 . J u l
2 0 0 5 . J a n
2 0 0 5 . J u l
2 0 0 6 . J a n
2 0 0 6 . J u l
2 0 0 7 . J a n
2 0 0 7 . J u l
2 0 0 8 . J a n
2 0 0 8 . J u l
2 0 0 9 . J a n
2 0 0 9 . J u l
2 0 1 0 . J a n
Exhibit 3

8/6/2019 Greenspan Financial Crisis Paper
http://slidepdf.com/reader/full/greenspan-financial-crisis-paper 52/63
Sources: Loan Performance; Case-Shiller 4/15/2010
-4.0
-3.0
-2.0
-1.0
0.0
1.0
2.0
3.0
1 9 7 6 . F e b
1 9 7 7 . A p r
1 9 7 8 . J u n
1 9 7 9 . A u g
1 9 8 0 . O c
t
1 9 8 1 . D e c
1 9 8 3 . F e b
1 9 8 4 . A p r
1 9 8 5 . J u n
1 9 8 6 . A u g
1 9 8 7 . O c
t
1 9 8 8 . D e c
1 9 9 0 . F e b
1 9 9 1 . A p r
1 9 9 2 . J u n
1 9 9 3 . A u g
1 9 9 4 . O c
t
1 9 9 5 . D e c
1 9 9 7 . F e b
1 9 9 8 . A p r
1 9 9 9 . J u n
2 0 0 0 . A u g
2 0 0 1 . O c
t
2 0 0 2 . D e c
2 0 0 4 . F e b
2 0 0 5 . A p r
2 0 0 6 . J u n
2 0 0 7 . A u g
2 0 0 8 . O c
t
2 0 0 9 . D e c
Percent Change from Previous Month: Loan Performance Home Price Index: Single-Family Combined (SA) Mar-76 to Jan-10
Percent Change from Previous Month: S&P/Case-Shiller Home Price Index: Composite 20 (SA, Jan-00=100) Feb-00 to Jan-10
Exhibit 4

8/6/2019 Greenspan Financial Crisis Paper
http://slidepdf.com/reader/full/greenspan-financial-crisis-paper 53/63
Source: Inside Mortgage Finance 4/15/2010
Subprime Mortgage Security Issuance Quarterly (SA, Bil.$)
0
20
40
60
80
100
120
140
1 9 9 5 . Q
1
1 9 9 5 . Q
3
1 9 9 6 . Q
1
1 9 9 6 . Q
3
1 9 9 7 . Q
1
1 9 9 7 . Q
3
1 9 9 8 . Q
1
1 9 9 8 . Q
3
1 9 9 9 . Q
1
1 9 9 9 . Q
3
2 0 0 0 . Q
1
2 0 0 0 . Q
3
2 0 0 1 . Q
1
2 0 0 1 . Q
3
2 0 0 2 . Q
1
2 0 0 2 . Q
3
2 0 0 3 . Q
1
2 0 0 3 . Q
3
2 0 0 4 . Q
1
2 0 0 4 . Q
3
2 0 0 5 . Q
1
2 0 0 5 . Q
3
2 0 0 6 . Q
1
2 0 0 6 . Q
3
2 0 0 7 . Q
1
2 0 0 7 . Q
3
2 0 0 8 . Q
1
2 0 0 8 . Q
3
2 0 0 9 . Q
1
2 0 0 9 . Q
3
2 0 1 0 . Q
1
Exhibit 5

8/6/2019 Greenspan Financial Crisis Paper
http://slidepdf.com/reader/full/greenspan-financial-crisis-paper 54/63
A B=∆A C D=C/A*100 E=∆C F=E/B*100
Retained in Portfolio
(Bil.$)
As a percent of Total
Subprime MBS
Outstanding
Change from end of
previous year (Bil.$)
Change as a percent of
Change in Total
Subprime MBS
Outstanding
2000 88.7
2001 119.0 30.3 19.0 16.02002 186.2 67.2 24.7 13.3 5.7 8.52003 280.8 94.6 66.9 23.8 42.1 44.52004 456.5 175.7 150.6 33.0 83.8 47.72005 644.3 187.8 179.2 27.8 28.6 15.22006 800.9 156.6 169.0 21.1 -10.2 -6.52007 774.0 -26.9 133.4 17.2 -35.6 132.52008 605.4 -168.6 99.4 16.4 -34.0 20.1
Source: FHFA Annual Report to Congress, 2008 (revised), Loan Performance
Some data partially estimated by author. All Fannie Mae data for 2002 to 2008 are actual. 2001 required separating a published total thatcombined Subprime and Alt-A. Outstandings at the end of 2002 were (almost all ARMs) the guide. All Freddie Mac data for 2006-2008 areactual. Earlier data combined Subprime and Alt-A. I worked back from the split available for 2006. Other data on the split between fixed-rate
and ARMs (predominately Subprime) governed the earlier separation.
Total Subprime MBS
Oustanding (Bil.$)
Change in Total
Subprime MBS
Oustanding (Bil.$)
Fannie Mae & Freddie Mac Subprime Single-Family Private Label Mortgage
4/15/2010
Exhibit 6

8/6/2019 Greenspan Financial Crisis Paper
http://slidepdf.com/reader/full/greenspan-financial-crisis-paper 55/63
Sources: Merrill Lynch; Moody's; The Federal Reserve Board 4/15/2010
Jan.1919-Jul.1988: Monthly; Aug.1988-Mar.2010: Daily
0
5
10
15
2025
30
35
40
1 9 1 9 . J a n
1 9 3 5 . J a n
1 9 5 1 . J a n
1 9 6 7 . J a n
1 9 8 3 . J a n
1 9 8 9
. J a n . 2
6
1 9 8 9
. O c t . 2 3
1 9 9
0 . J u l . 1 8
1 9 9 1
. A p r . 1 2
1 9 9 2
. J a n . 0
7
1 9 9 2
. O c t . 0 1
1 9 9 3
. J u n . 2
8
1 9 9 4
. M a r . 2 3
1 9 9 4
. D e c . 1
6
1 9 9 5
. S e p . 1
2
1 9 9 6
. J u n . 0
6
1 9 9 7
. M a r . 0 3
1 9 9 7
. N o v . 2
6
1 9 9 8
. A u g . 2
1
1 9 9 9
. M a y . 1
8
2 0 0 0
. F e b . 1
0
2 0 0 0
. N o v . 0
6
2 0 0 1
. A u g . 0
1
2 0 0 2
. A p r . 2 6
2 0 0 3
. J a n . 2
1
2 0 0 3
. O c t . 1 6
2 0 0
4 . J u l . 1 2
2 0 0 5
. A p r . 0 6
2 0 0 5
. D e c . 3
0
2 0 0 6
. S e p . 2
6
2 0 0 7
. J u n . 2
1
2 0 0 8
. M a r . 1 7
2 0 0 8
. D e c . 1
0
2 0 0 9
. S e p . 0
40
1
2
3
45
6
7
8
Merrill Lynch High Yield: Cash Pay: Rated CCC & Lower: Yield to Maturity less 10-Year Treasury Note Yield at ConstantMaturity
Yield Spread: Moody's Seasoned BAA Corporate Bond Yield less 10-Year Treasury Note Yield at Constant Maturity *right-hand axis
Exhibit 7
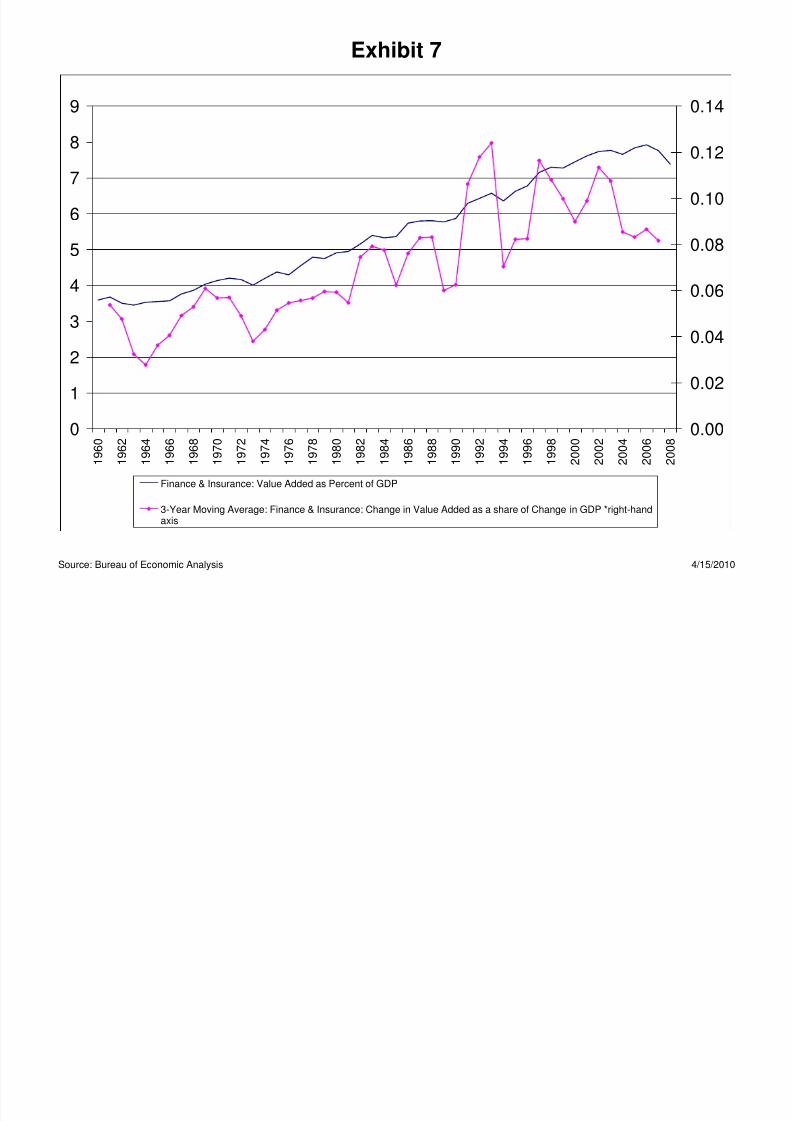
8/6/2019 Greenspan Financial Crisis Paper
http://slidepdf.com/reader/full/greenspan-financial-crisis-paper 56/63
Source: Bureau of Economic Analysis 4/15/2010
0
1
2
3
4
5
6
7
8
9
1 9 6 0
1 9 6 2
1 9 6 4
1 9 6 6
1 9 6 8
1 9 7 0
1 9 7 2
1 9 7 4
1 9 7 6
1 9 7 8
1 9 8 0
1 9 8 2
1 9 8 4
1 9 8 6
1 9 8 8
1 9 9 0
1 9 9 2
1 9 9 4
1 9 9 6
1 9 9 8
2 0 0 0
2 0 0 2
2 0 0 4
2 0 0 6
2 0 0 8
0.00
0.02
0.04
0.06
0.08
0.10
0.12
0.14
Finance & Insurance: Value Added as Percent of GDP
3-Year Moving Average: Finance & Insurance: Change in Value Added as a share of Change in GDP *right-handaxis
Exhibit 8

8/6/2019 Greenspan Financial Crisis Paper
http://slidepdf.com/reader/full/greenspan-financial-crisis-paper 57/63
Source: Bloomberg 4/15/2010
5-Year CDS: Average of Bank of America, JPMorgan, Citigroup,
Goldman Sachs, Wells Fargo, and Morgan Stanley
0
50
100
150
200
250
300
350
400
450
3 / 5 / 2 0 0 7
5 / 5 / 2 0 0 7
7 / 5 / 2 0 0 7
9 / 5 / 2 0 0 7
1 1 / 5 / 2 0 0 7
1 / 5 / 2 0 0 8
3 / 5 / 2 0 0 8
5 / 5 / 2 0 0 8
7 / 5 / 2 0 0 8
9 / 5 / 2 0 0 8
1 1 / 5 / 2 0 0 8
1 / 5 / 2 0 0 9
3 / 5 / 2 0 0 9
5 / 5 / 2 0 0 9
7 / 5 / 2 0 0 9
9 / 5 / 2 0 0 9
1 1 / 5 / 2 0 0 9
1 / 5 / 2 0 1 0
3 / 5 / 2 0 1 0
Exhibit 9

8/6/2019 Greenspan Financial Crisis Paper
http://slidepdf.com/reader/full/greenspan-financial-crisis-paper 58/63
Source: FDIC. Market values constructed from input from 24 banks on book and market value of equity supplied by Bloomberg. 4/15/2010
FDIC-Insured Commercial Banks
0.07
0.09
0.11
0.13
0.15
0.17
0.19
0.21
Q 4 . 2
0 0 4
Q 1 . 2
0 0 5
Q 2 . 2
0 0 5
Q 3 . 2
0 0 5
Q 4 . 2
0 0 5
Q 1 . 2
0 0 6
Q 2 . 2
0 0 6
Q 3 . 2
0 0 6
Q 4 . 2
0 0 6
Q 1 . 2
0 0 7
Q 2 . 2
0 0 7
Q 3 . 2
0 0 7
Q 4 . 2
0 0 7
Q 1 . 2
0 0 8
Q 2 . 2
0 0 8
Q 3 . 2
0 0 8
Q 4 . 2
0 0 8
Q 1 . 2
0 0 9
Q 2 . 2
0 0 9
Q 3 . 2
0 0 9
Q 4 . 2
0 0 9
Equity at Market Value / Assets at Market Value Equity at Book Value / Assets at Book Value
Exhibit 10

8/6/2019 Greenspan Financial Crisis Paper
http://slidepdf.com/reader/full/greenspan-financial-crisis-paper 59/63
Sources: FDIC; Census Bureau; Office of the Comptroller of the Currency; The Federal Reserve Board 4/15/2010
Ratio: Total Equity Capital to Total Assets
0.00
0.10
0.20
0.30
0.40
0.50
0.60
1 8 3 4
1 8 4 2
1 8 5 0
1 8 5 8
1 8 6 6
1 8 7 4
1 8 8 2
1 8 9 0
1 8 9 8
1 9 0 6
1 9 1 4
1 9 2 2
1 9 3 0
1 9 3 8
1 9 4 6
1 9 5 4
1 9 6 2
1 9 7 0
1 9 7 8
1 9 8 6
1 9 9 4
2 0 0 2
State Banks National Banks Commercial Banks
Exhibit 11
8/6/2019 Greenspan Financial Crisis Paper
http://slidepdf.com/reader/full/greenspan-financial-crisis-paper 60/63
Sources: FDIC; Census Bureau 4/15/2010
Net Income as a percent of Equity Capital
-10
-5
0
5
10
15
20
1 8 6 9
1 8 7 5
1 8 8 1
1 8 8 7
1 8 9 3
1 8 9 9
1 9 0 5
1 9 1 1
1 9 1 7
1 9 2 3
1 9 2 9
1 9 3 5
1 9 4 1
1 9 4 7
1 9 5 3
1 9 5 9
1 9 6 5
1 9 7 1
1 9 7 7
1 9 8 3
1 9 8 9
1 9 9 5
2 0 0 1
2 0 0 7
National Banks Commercial Banks
Exhibit 12π /A w*r w*k n=N/A e=E/A α=T/A
P i i f L d

8/6/2019 Greenspan Financial Crisis Paper
http://slidepdf.com/reader/full/greenspan-financial-crisis-paper 61/63
Ratios as Percents
Net Income divided
by Total Assets
Interest Rate Spread
* Earning Assets
Share of Total Assets
Provisions for Loan and
Lease Losses and
Allocated Transfer Riskdivided by Earning Assets
* Earning Assets Share of
Total Assets
Noninterest
Income divded by
Total Assets
Noninterest
Expense divided by
Total Assets
Taxes plus Minor
Items, Net divided by
Total Assets
Levels: = + - + - -
Avg: 1962-1966 0.766 2.580 0.079 0.566 1.965 0.335
Avg: 1978-1982 0.728 3.035 0.265 0.774 2.546 0.269
Avg: 1992-1996 1.092 3.673 0.426 1.949 3.617 0.488
Avg: 2002-2006 1.276 3.048 0.399 2.296 3.106 0.563
Change:
78-'82 less '62-'66 -0.038 0.455 0.186 0.207 0.581 -0.067
92-'96 less '78 to '82 0.363 0.638 0.161 1.176 1.071 0.219
02-'06 less '92-'06 0.184 -0.624 -0.027 0.347 -0.511 0.075
Source: FDIC 4/15/2010
Exhibit 13
40 160
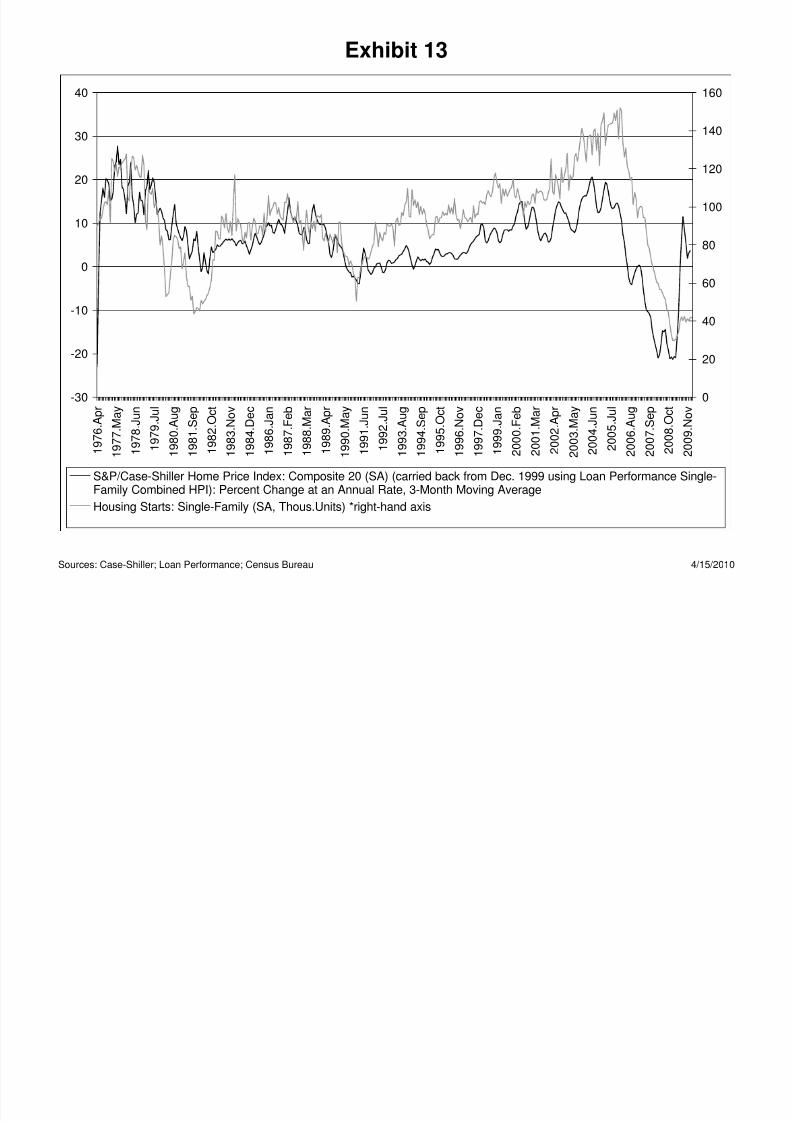
8/6/2019 Greenspan Financial Crisis Paper
http://slidepdf.com/reader/full/greenspan-financial-crisis-paper 62/63
Sources: Case-Shiller; Loan Performance; Census Bureau 4/15/2010
-30
-20
-10
0
10
20
30
40
1 9 7 6 . A p r
1 9 7
7 . M a y
1 9 7 8 . J u n
1 9
7 9 . J u l
1 9 8
0 . A u g
1 9 8
1 . S e p
1 9 8 2 . O c t
1 9 8
3 . N o v
1 9 8
4 . D e c
1 9 8 6 . J a n
1 9 8 7 . F e b
1 9 8 8 . M a r
1 9 8 9 . A p r
1 9 9
0 . M a y
1 9 9 1 . J u n
1 9
9 2 . J u l
1 9 9
3 . A u g
1 9 9
4 . S e p
1 9 9 5 . O c t
1 9 9
6 . N o v
1 9 9
7 . D e c
1 9 9 9 . J a n
2 0 0 0 . F e b
2 0 0 1 . M a r
2 0 0 2 . A p r
2 0 0
3 . M a y
2 0 0 4 . J u n
2 0
0 5 . J u l
2 0 0
6 . A u g
2 0 0
7 . S e p
2 0 0 8 . O c t
2 0 0
9 . N o v
0
20
40
60
80
100
120
140
160
S&P/Case-Shiller Home Price Index: Composite 20 (SA) (carried back from Dec. 1999 using Loan Performance Single-Family Combined HPI): Percent Change at an Annual Rate, 3-Month Moving Average
Housing Starts: Single-Family (SA, Thous.Units) *right-hand axis
Exhibit 14

8/6/2019 Greenspan Financial Crisis Paper
http://slidepdf.com/reader/full/greenspan-financial-crisis-paper 63/63
Sources: Mortgage Bankers Association; Case-Shiller 4/15/2010
0
50
100
150
200
250
300
2 0 0 0 . Q
1
2 0 0 0 . Q
2
2 0 0 0 . Q
3
2 0 0 0 . Q
4
2 0 0 1 . Q
1
2 0 0 1 . Q
2
2 0 0 1 . Q
3
2 0 0 1 . Q
4
2 0 0 2 . Q
1
2 0 0 2 . Q
2
2 0 0 2 . Q
3
2 0 0 2 . Q
4
2 0 0 3 . Q
1
2 0 0 3 . Q
2
2 0 0 3 . Q
3
2 0 0 3 . Q
4
2 0 0 4 . Q
1
2 0 0 4 . Q
2
2 0 0 4 . Q
3
2 0 0 4 . Q
4
2 0 0 5 . Q
1
2 0 0 5 . Q
2
2 0 0 5 . Q
3
2 0 0 5 . Q
4
2 0 0 6 . Q
1
2 0 0 6 . Q
2
2 0 0 6 . Q
3
2 0 0 6 . Q
4
2 0 0 7 . Q
1
2 0 0 7 . Q
2
2 0 0 7 . Q
3
2 0 0 7 . Q
4
2 0 0 8 . Q
1
2 0 0 8 . Q
2
2 0 0 8 . Q
3
2 0 0 8 . Q
4
2 0 0 9 . Q
1
2 0 0 9 . Q
2
2 0 0 9 . Q
3
2 0 0 9 . Q
4 0
50
100
150
200
250 2 0 0 0 . J a n
2 0 0 1 . J a n
2 0 0 2 . J a n
2 0 0 3 . J a n
2 0 0 4 . J a n
2 0 0 5 . J a n
2 0 0 6 . J a n
2 0 0 7 . J a n
2 0 0 8 . J a n
2 0 0 9 . J a n
2 0 1 0 . J a n
Adjustable Rate Mortgage Originations (SA, Bil.$)
S&P/Case-Shiller Home Price Index: Composite 20 (SA, Jan-00=100) *right-hand